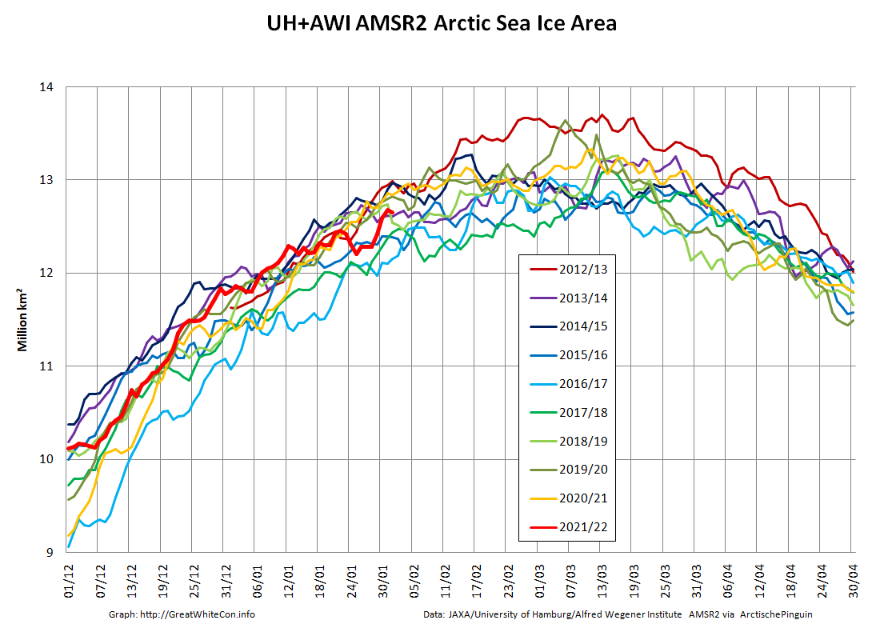
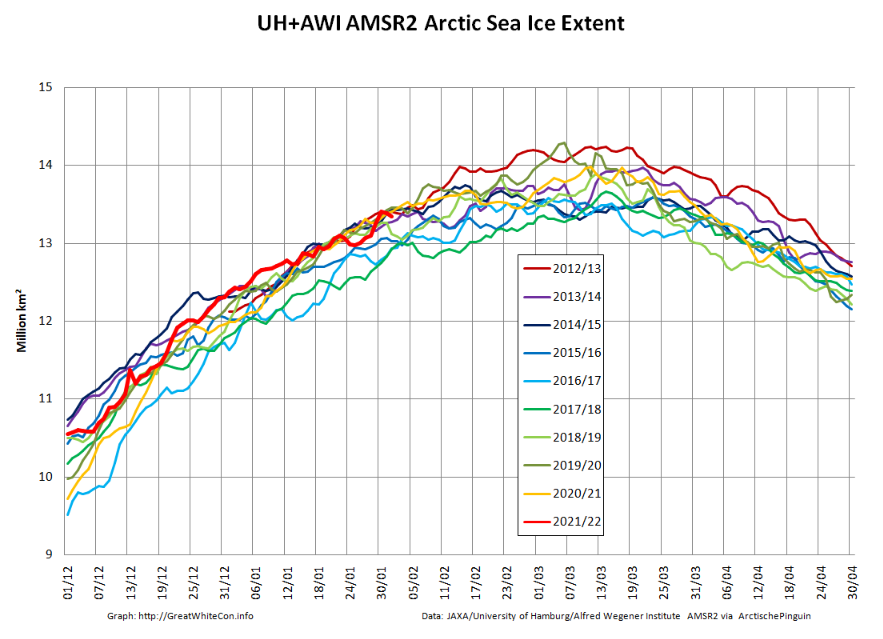
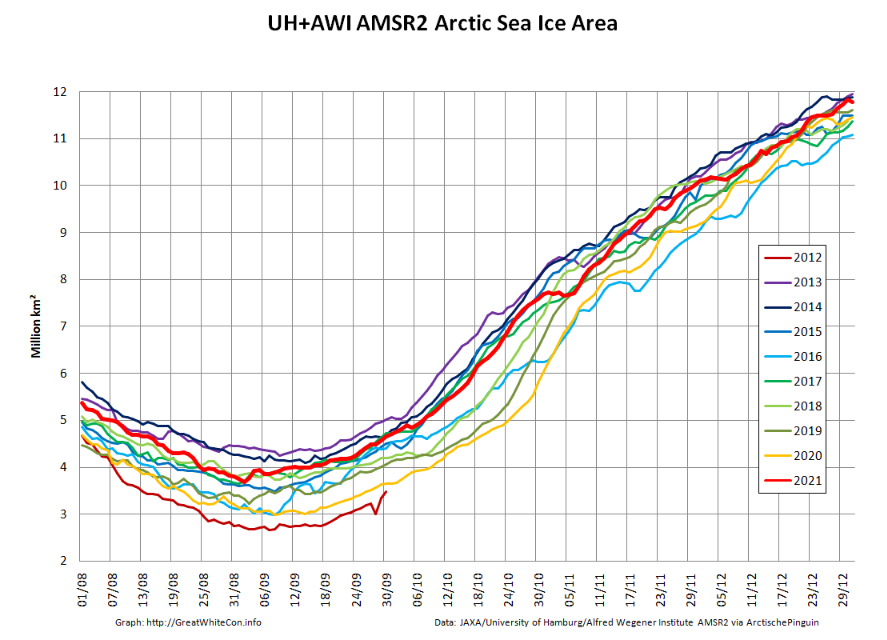
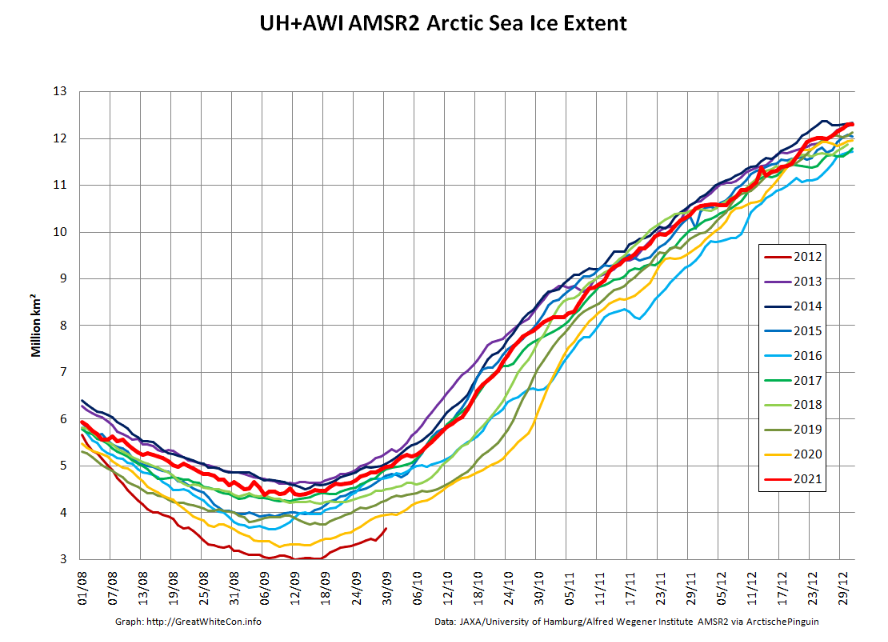
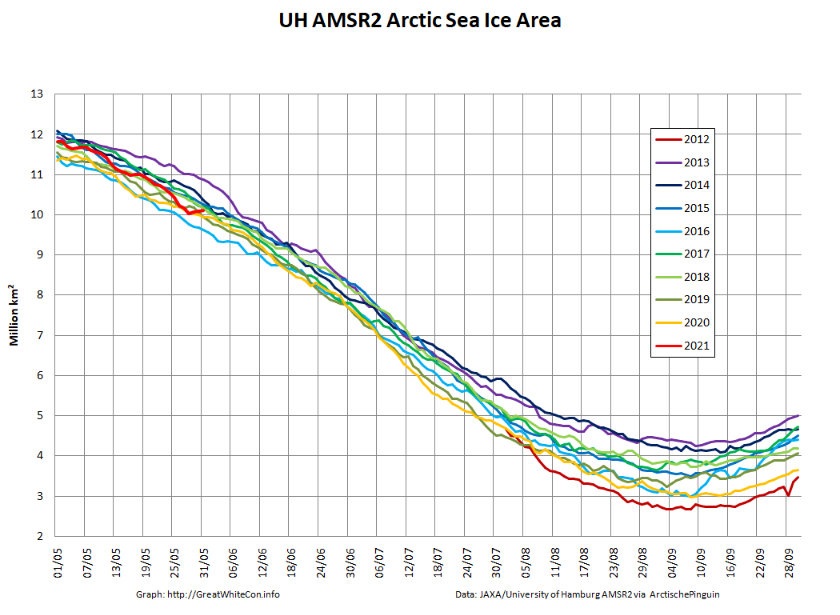
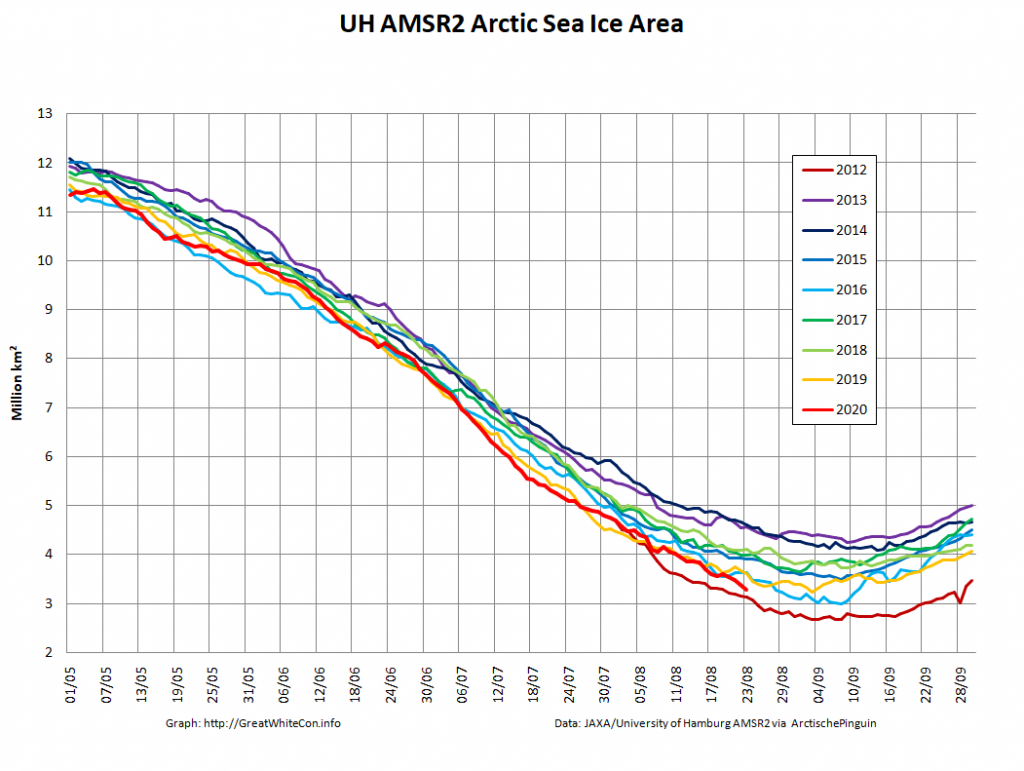
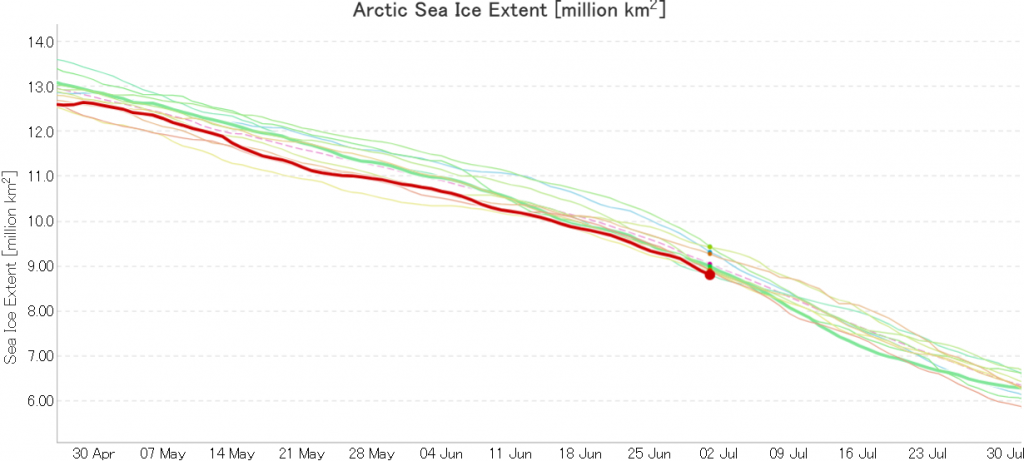
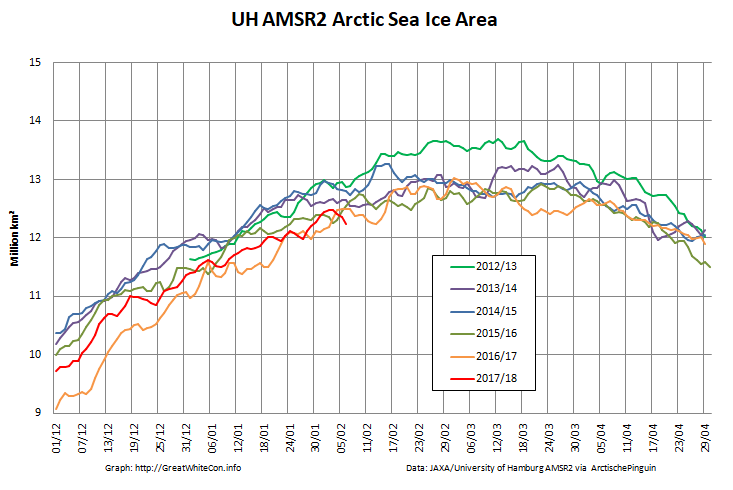
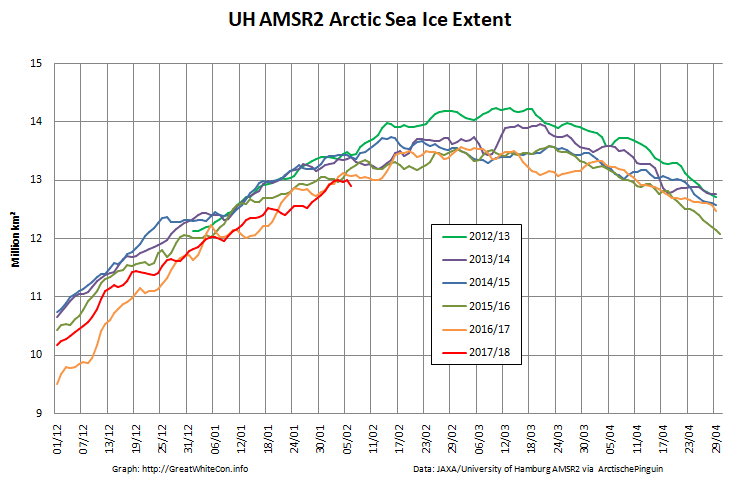
Following the “Great Arctic Winter Cyclone” towards the end of January, here are the latest high resolution AMSR2 area and extent graphs:
The sudden reduction in sea ice area due to the cyclone is very apparent, as is the subsequent refreeze of the affected area. Here’s an animation of AMSR2 concentration revealing more detail:
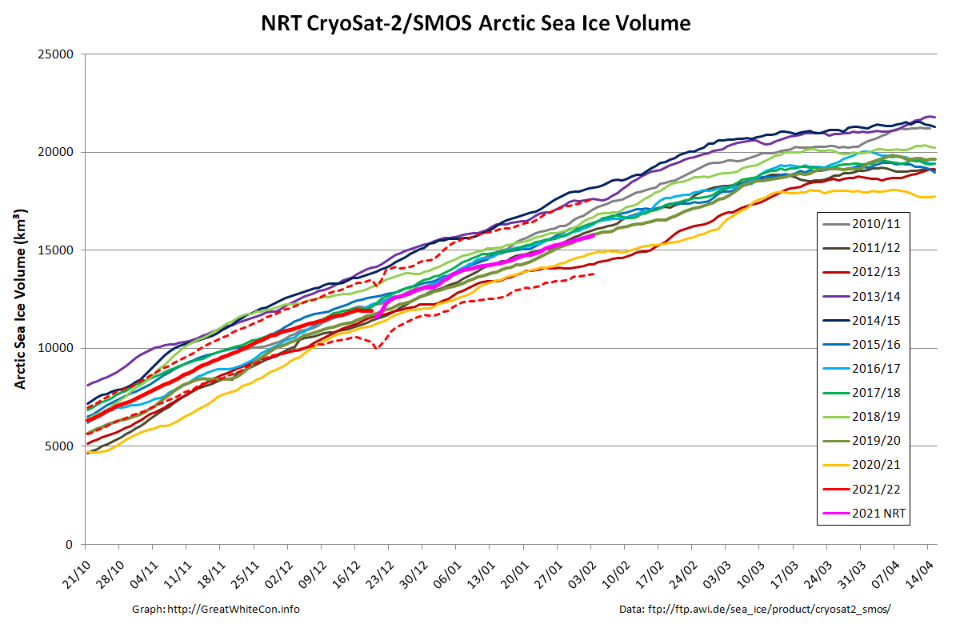
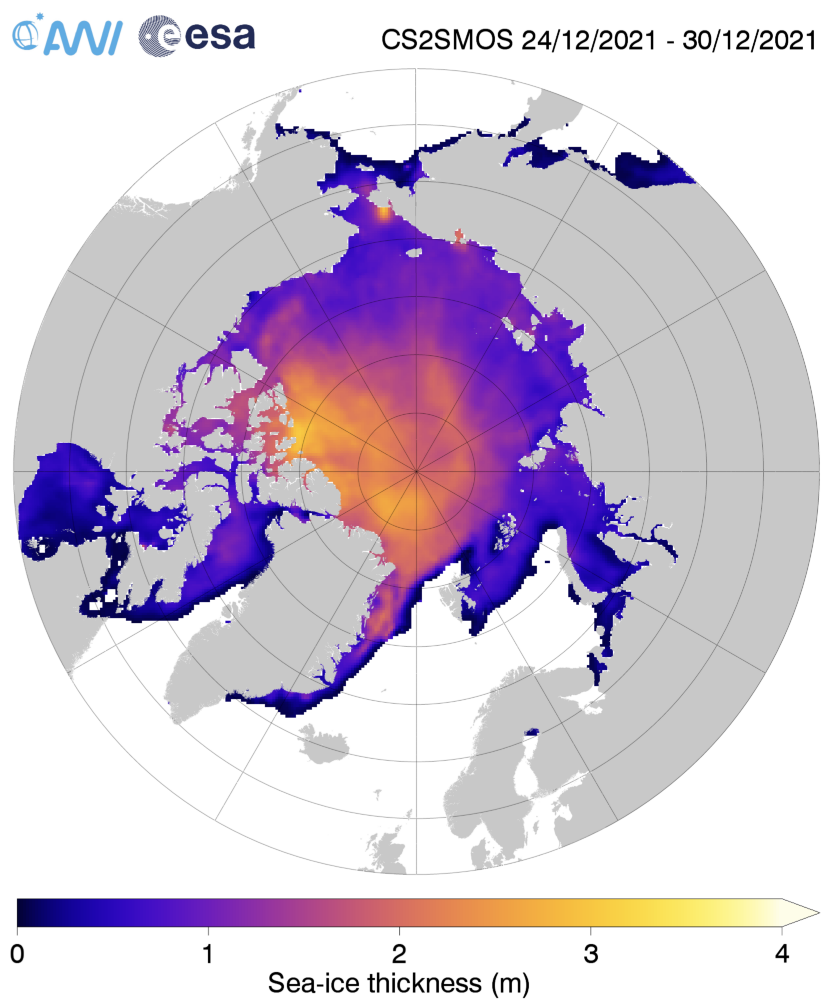
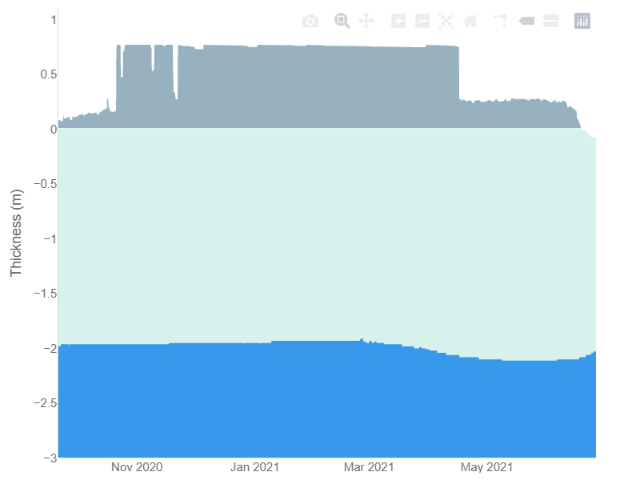
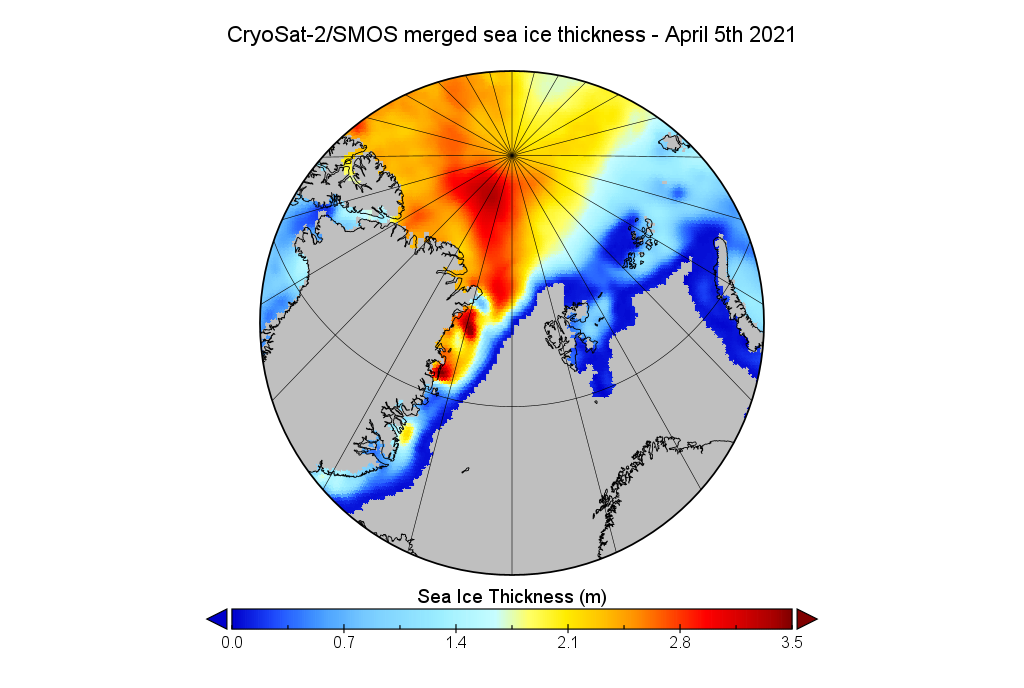
Here too is the latest AWI CryoSat-2/SMOS Arctic sea ice volume graph:
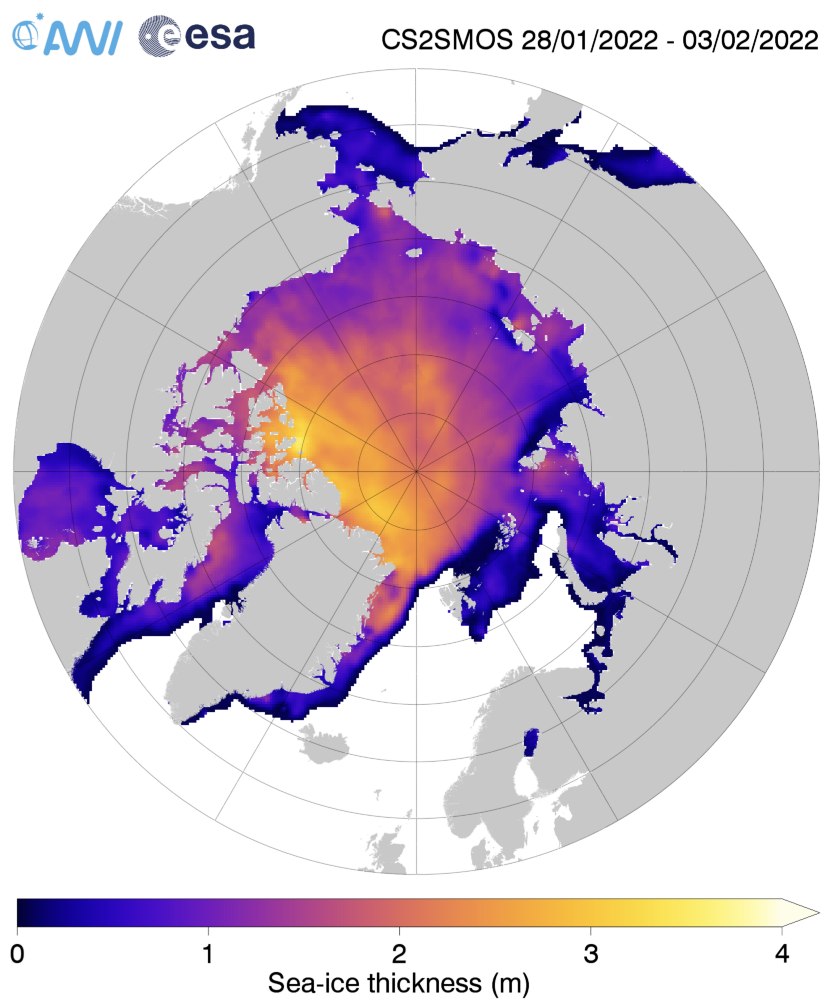
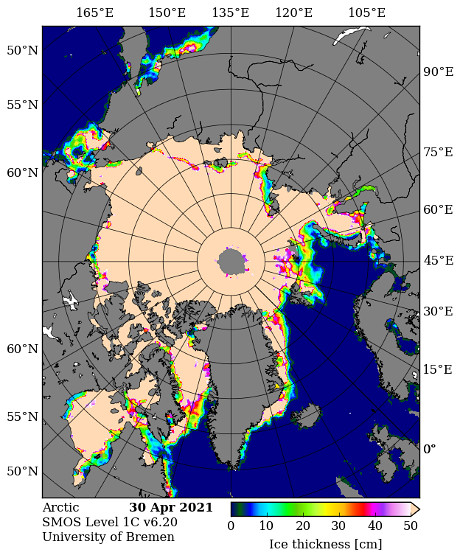
It doesn’t reveal a similar “blip” towards the end of January, suggesting that reduction in area was due to compaction rather than melt. The current AWI thickness map shows the freshly formed ice north east of Svalbard is still very thin:
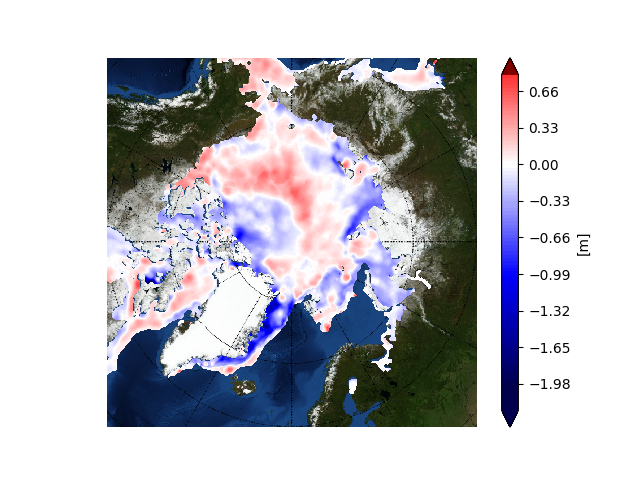
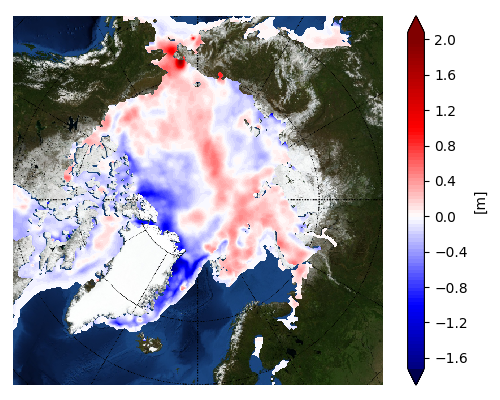
The latest thickness anomaly map from the Finnish Meteorological Institute shows that the ice which was exported from the Central Arctic via the Fram Strait is nevertheless still anomalously thin, although there is now an area of thicker ice north of Greenland:
2021 has been and gone, so first of all may I wish all our readers a very Happy New Year.
Sadly it’s not been a happy start to 2022 for the inhabitants of Boulder, Colorado, home of the National Snow and Ice Data Center. According to the Denver Post:
The Marshall fire destroyed an estimated 991 homes in Boulder County, damaged 127 more and may have killed three people, Sheriff Joe Pelle said Saturday afternoon.
Pelle added that the cause of the fire — the most damaging in Colorado history — remains under investigation, and confirmed that sheriff’s officials have served a search warrant on at least one property based on a tip.
Currently, two people are missing in Superior and another is missing in the Marshall area, Pelle said. All three are feared dead as each of their homes was lost to the fire, the sheriff said…
So far, officials say Thursday’s wildfire — exacerbated by 100-mph winds — burned more than 6,000 acres across Boulder County.
The fire destroyed 553 homes in Louisville, damaging 45, Pelle said Saturday. It also destroyed 332 homes in Superior, damaging 60 in that town, and destroyed 106 homes in unincorporated Boulder County, damaging 22…
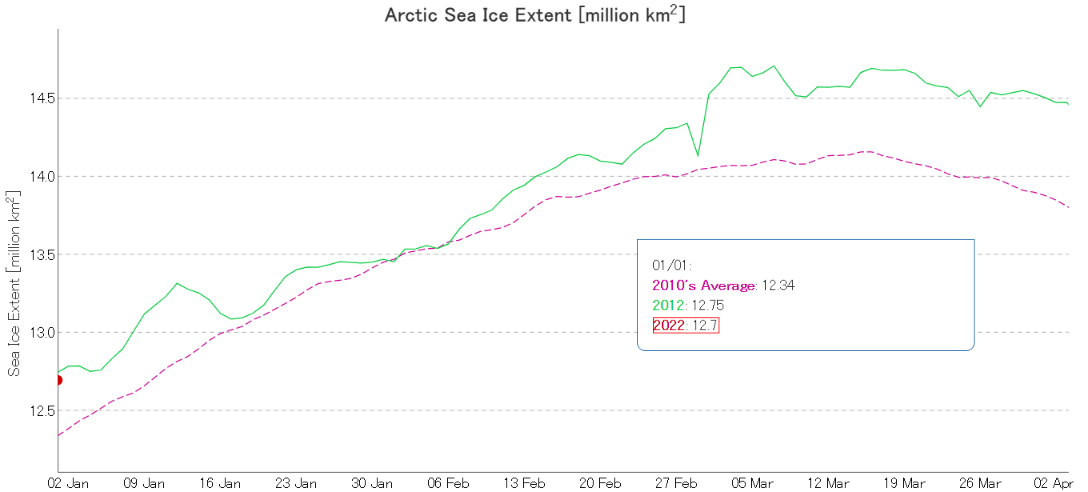
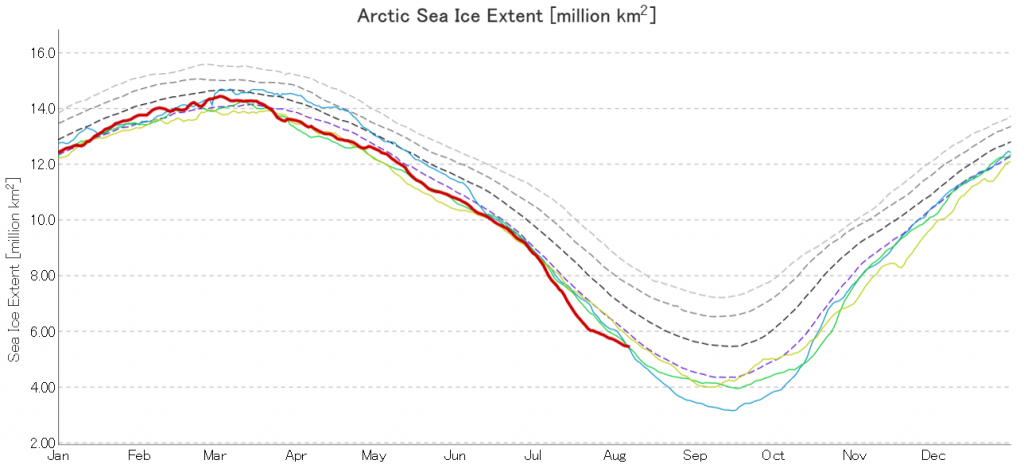
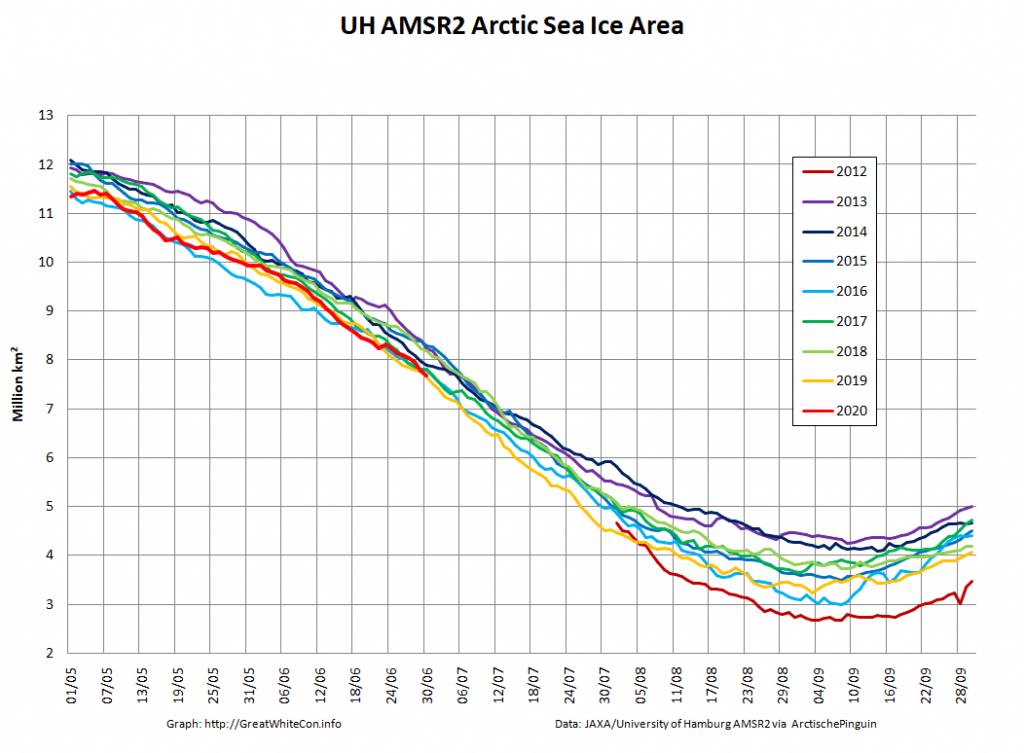
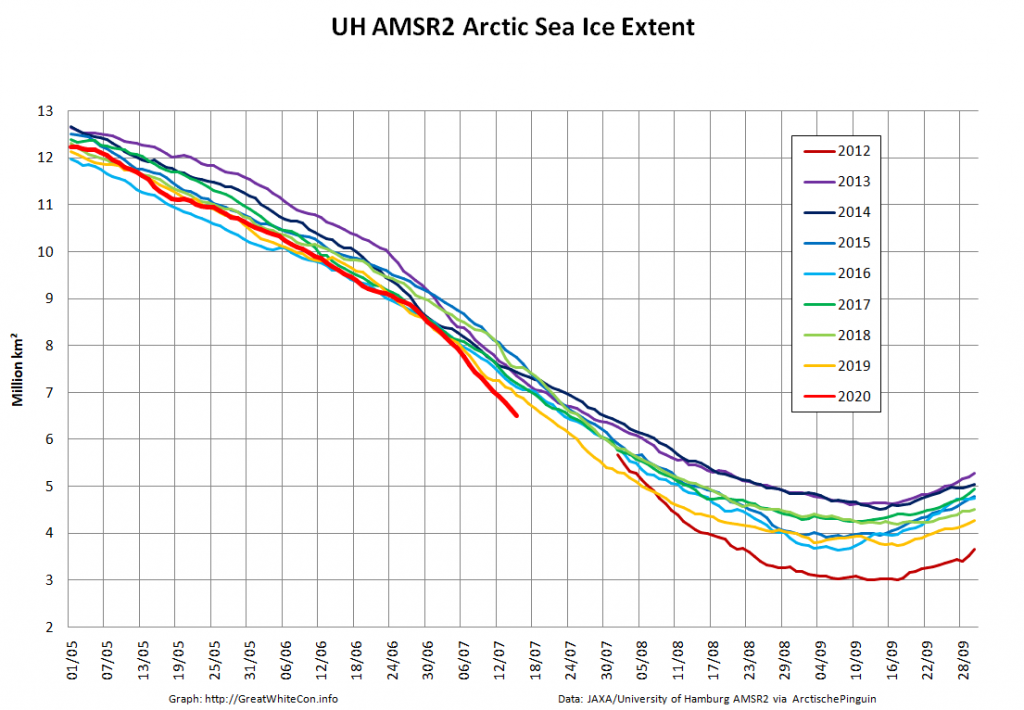
Moving north to examine snow and ice data from the Arctic, let’s start 2022 in traditional fashion with a look at high resolution AMSR2 area and extent:
Both metrics are now near the upper boundary of the last 10 years’ range. The AMSR2 instrument wasn’t launched into orbit until summer 2012, but according to both JAXA and NSIDC data extent on January 1st 2022 is almost identical to the same date in 2012. Regular readers will recall that year went on to produce the lowest annual minimum extent in the satellite era despite recording the highest annual maximum in the decade of the 2010s:
Note that sea ice volume tells a rather different story. Here’s the latest AWI CryoSat-2/SMOS volume graph:
The current near real time data is likely to be revised upwards slightly when the final reanalysis is complete, but even so volume seems likely to remain in the lower half of the recent range at the end of 2021.
Once again the ice in the so called “last ice area” north of Greenland and Ellesmere Island is thinner than usual, as is the ice in the Fram Strait and East Greenland Sea.
[Edit – January 11th]
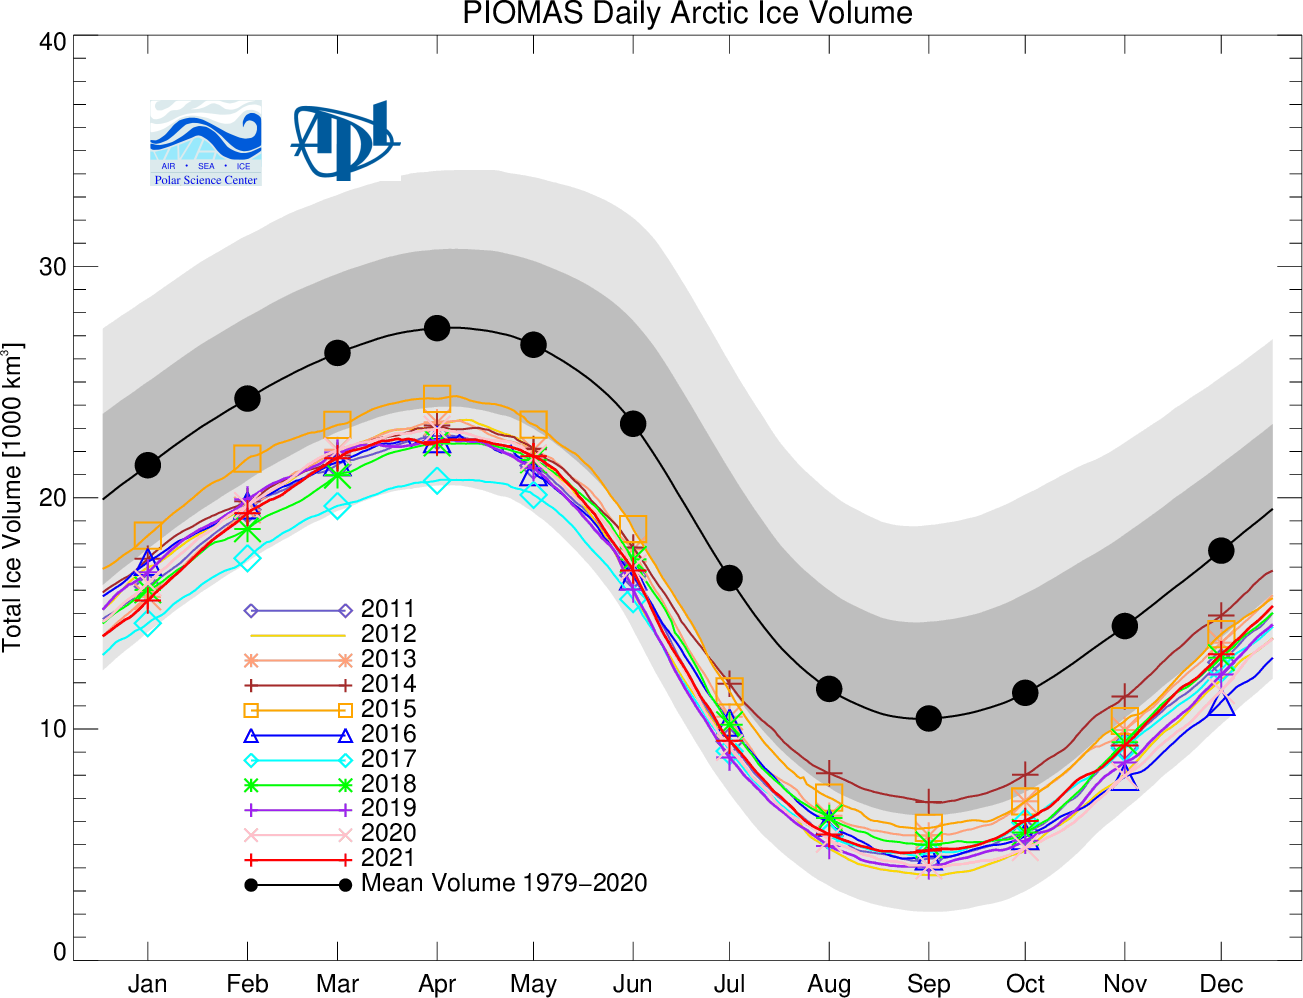
As has been pointed out below, the Polar Science Center has now released the PIOMAS volume data for December 2021:
Average Arctic sea ice volume in December 2021 was 13,300 km3. This value is the 9th lowest on record for December, about 2100 km3 above the record set in 2016. Monthly ice volume was 51% below the maximum in 1979 and 37% below the mean value for 1979-2020. Average December 2021 ice volume was 1.2 standard deviations above the 1979-2020 trend line.
November and December of 2021 saw relative rapid ice growth for recent years, bringing the mean ice thickness (above 15 cm thickness) towards the thicker end of the recent values.
The ice thickness anomaly map for December 2021 relative to 2011-2020 continues to show anomalies divided into positive and a negative halves with areas of positive anomalies increasing since the two prior months and stretching from the Beaufort, over the pole and into the Barents. Negative anomalies stretching from Fram Strait, North of Greenland and along the Canadian Archipelago. Areas North of Greenland again feature low ice thickness as in prior years.
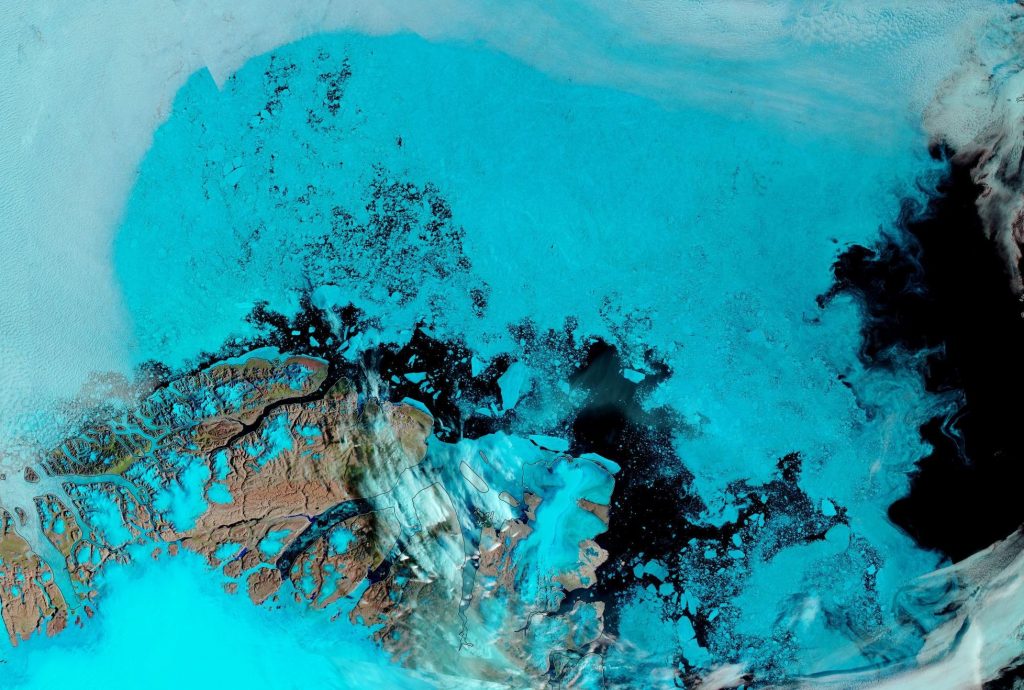
Note that as revealed by this animation from NASA Worldview the sea ice in the Lincoln Sea is currently still breaking up and being exported from the Central Arctic via the Nares Strait:
[Edit – January 25th]
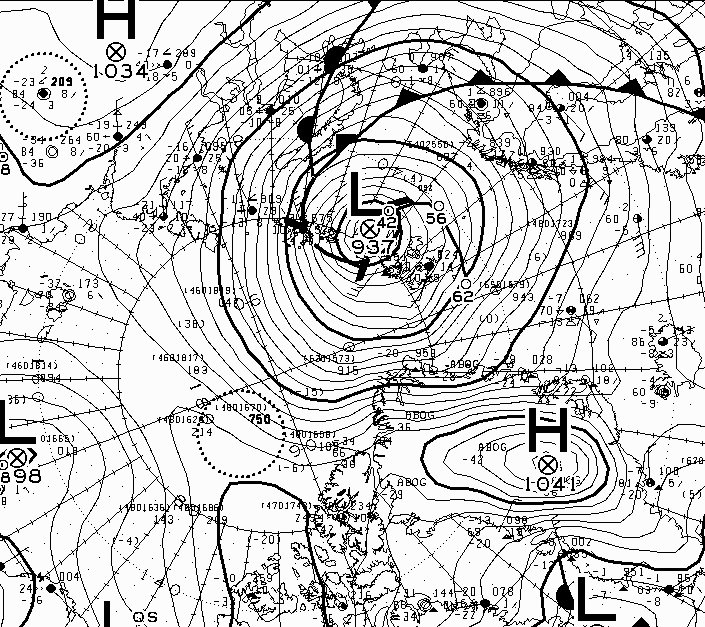
The Atlantic side of the Arctic Ocean has been taking a bit of a battering from what I shall henceforth refer to as the Great Arctic Winter Cyclone of 2022, or GAWC 2022 for short. Unless there’s an even deeper one later in the year of course!
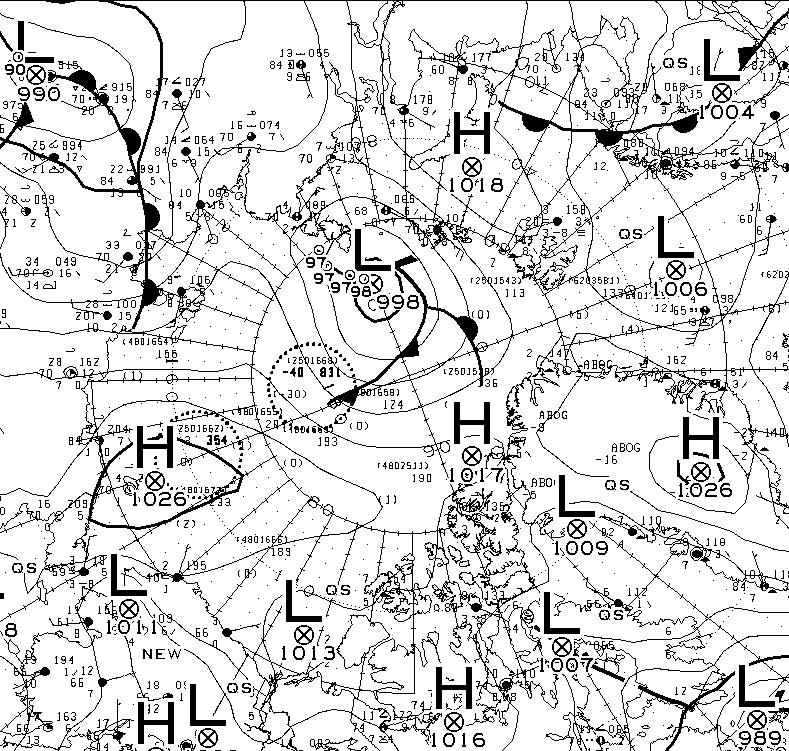
According to the Canadian Meteorological Centre the storm achieved a minimum Mean Sea Level Pressure of 937 hPa at 12 noon UTC yesterday:
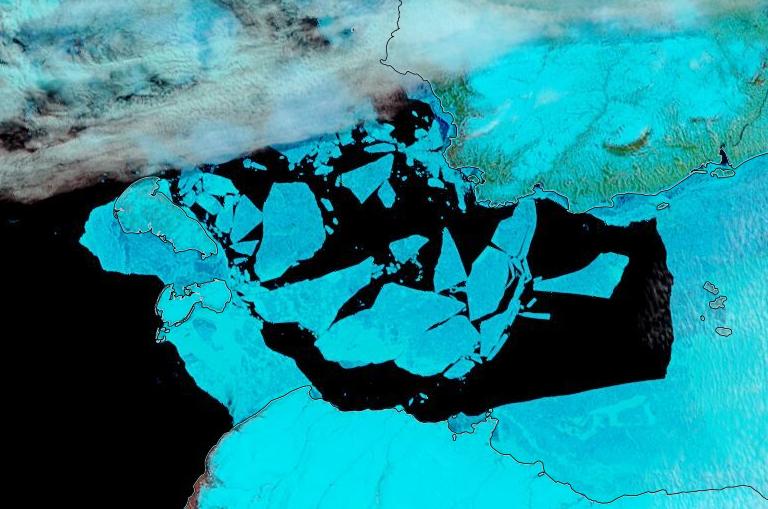
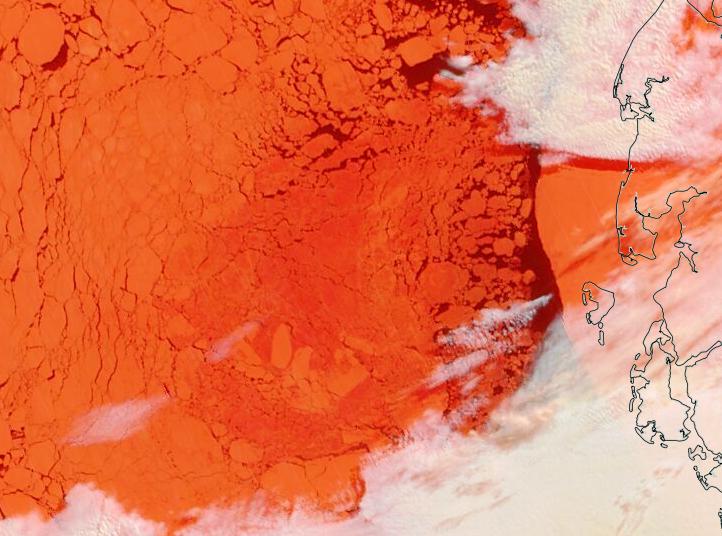
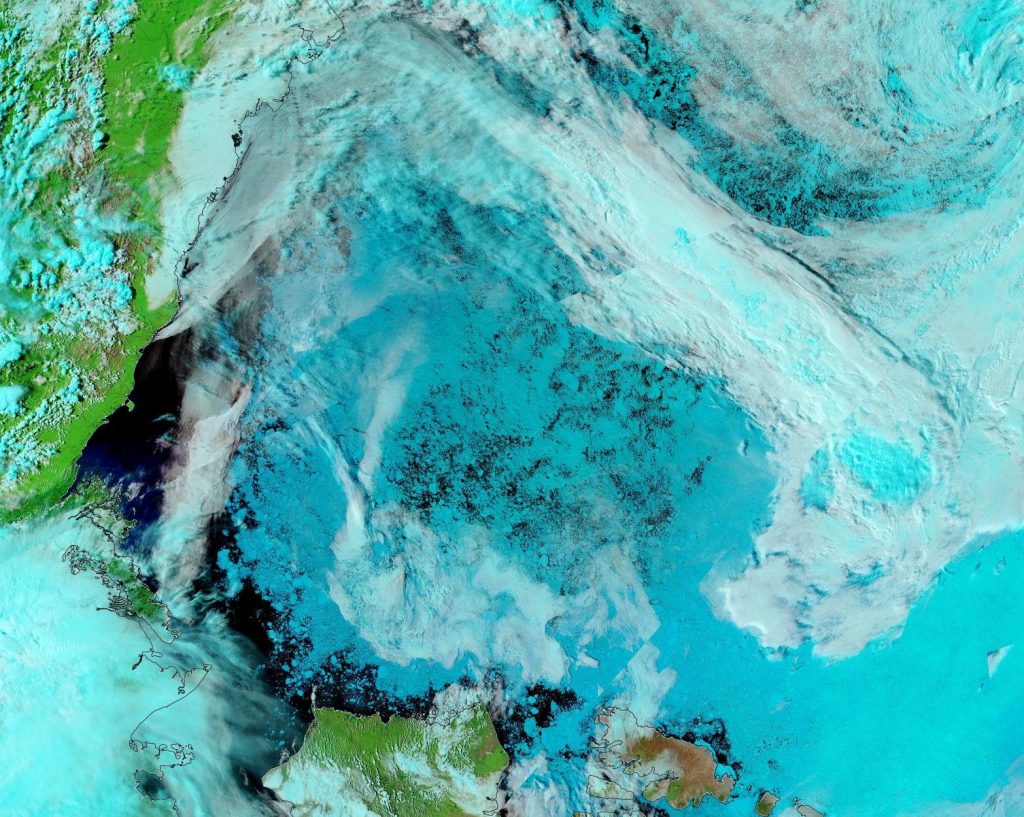
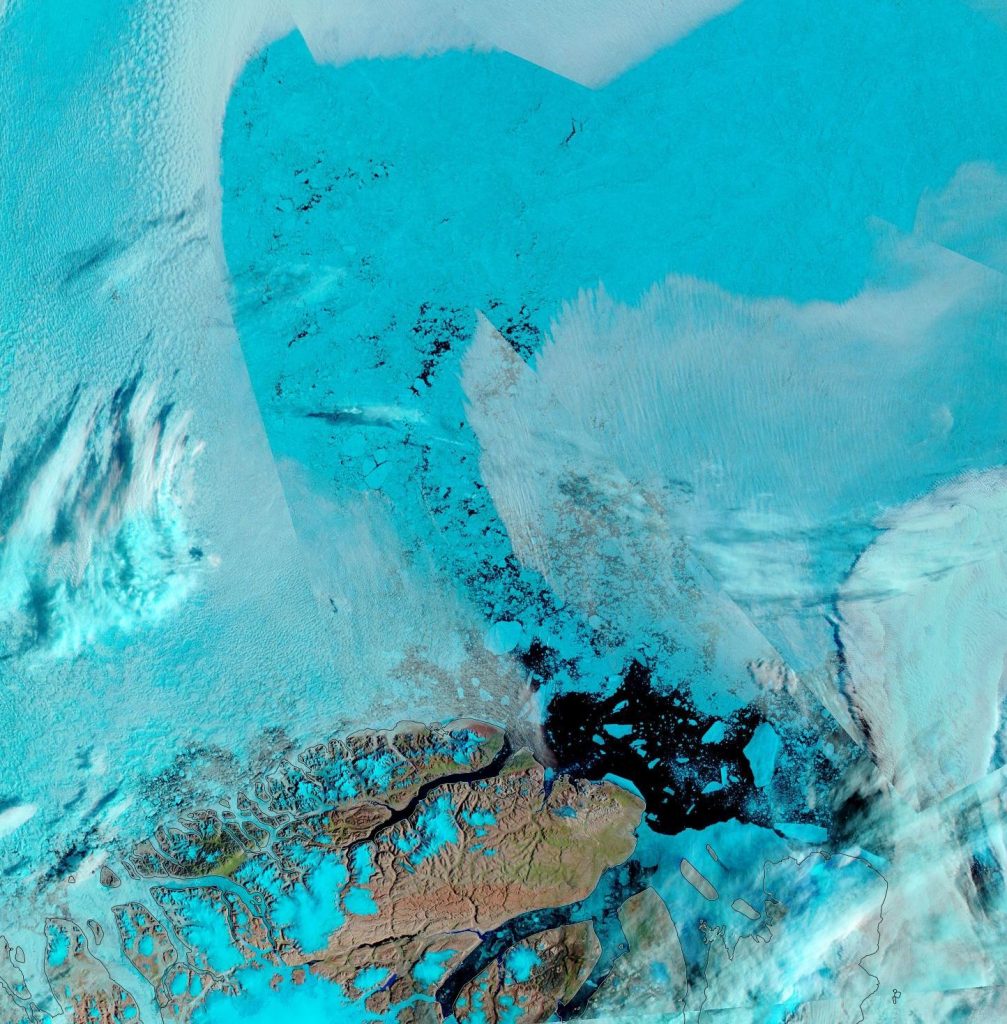
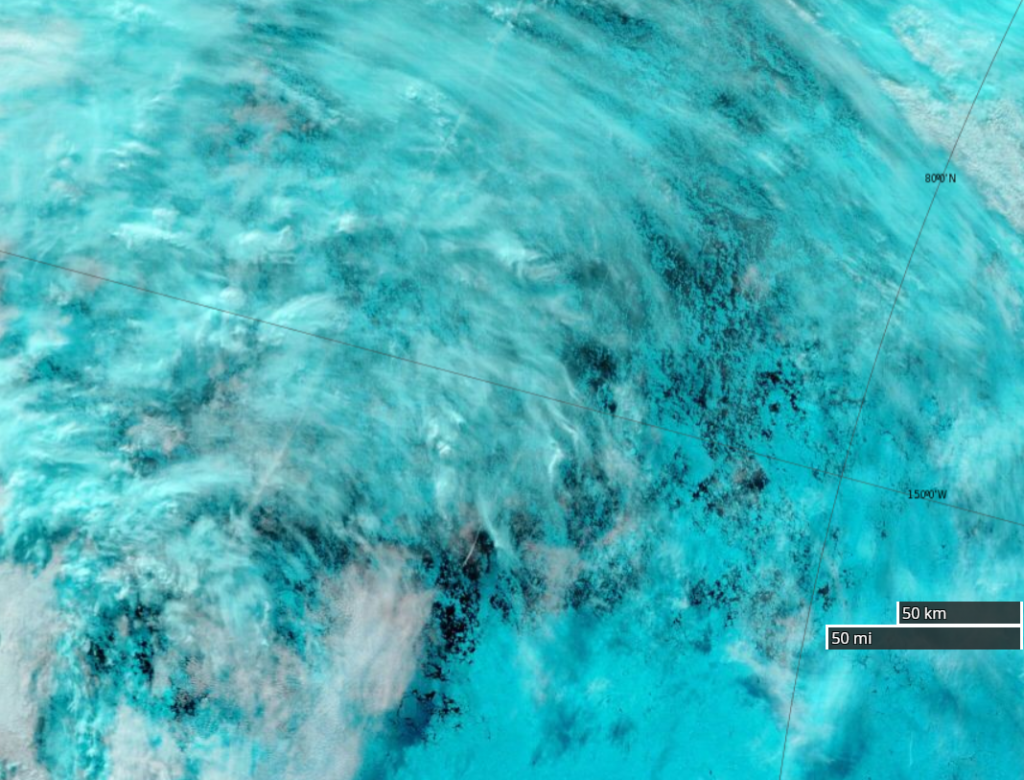
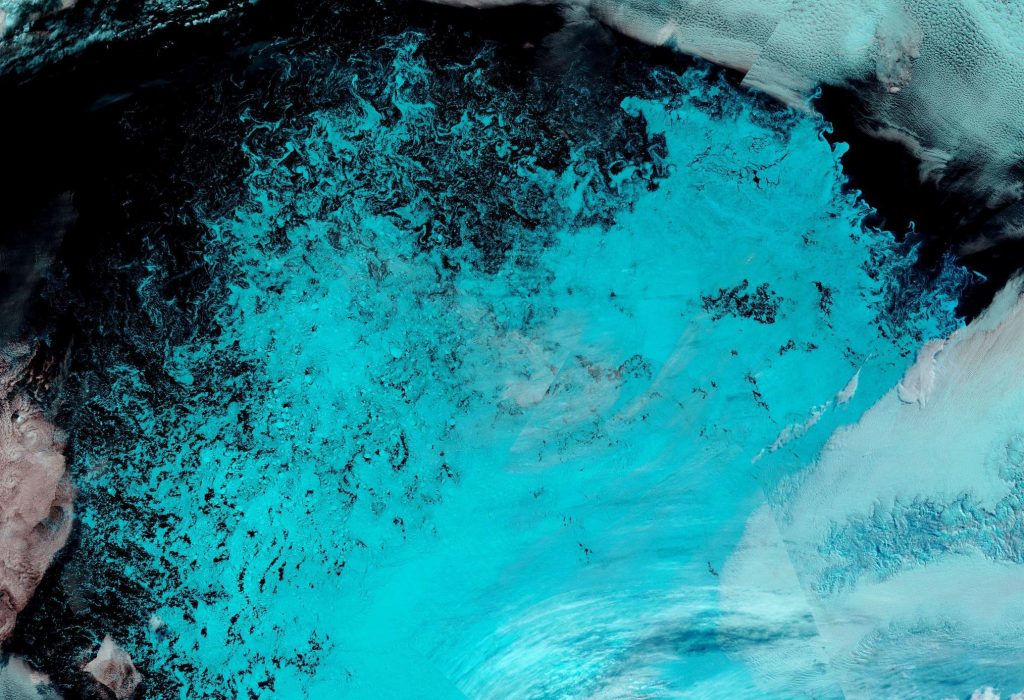
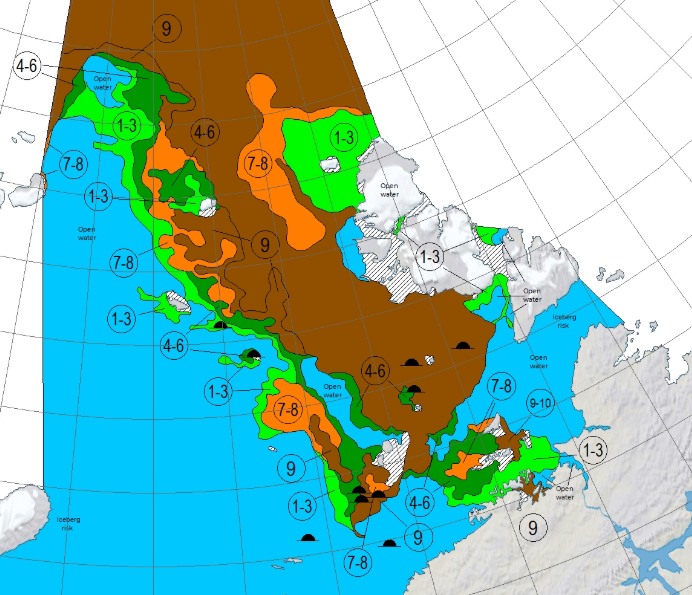
Here are the visible effects of the storm on the sea ice in the area so far, now updated to January 25th:
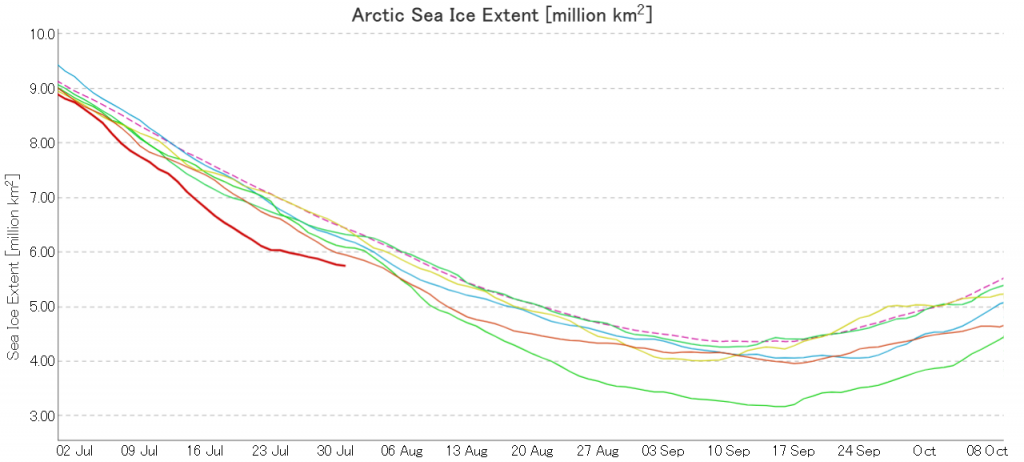
The results of the ARCUS Sea Ice Prediction Network August call have been released, and here is the outlook for the 2021 minimum September mean Arctic sea ice extent:
The median prediction for the mean sea ice extent during the month of September 2021 is 4.39 million km2. According to ARCUS:
As of 22 August 2021, the Arctic sea-ice extent was 5.58 (compared with 25 August 2020 value of 4.43) million square kilometers. Arctic sea-ice extent in 2021 remains well below the climatological median and has closely followed the 2012 values for much of the summer but has diverged to higher sea-ice extent starting in early August. The forecasts continue to support September 2021 mean sea-ice extent being well above the September 2020 value. July sea-ice retreat has been greatest in the Eurasian seas, particularly in the East Siberian Sea, making the 2021 ice edge well north of the long-term median edge in Eurasia. Sea ice retreated since the end of July along the northern coast of Alaska, although the ice edge is near its climatological position, which makes the Beaufort and Chukchi sea ice extent the largest at this time of year since 2006. A tongue of sea ice that has been present all summer continues to extend close to land in the Kara Sea, making the northeast passage likely to remain blocked for the first time in several years. Half the models which provide spatial data to the SIO predict that the tongue is likely to survive.
Now let’s take a look at a range of assorted extent measurements. Here’s the NSIDC’s 5 day average extent:
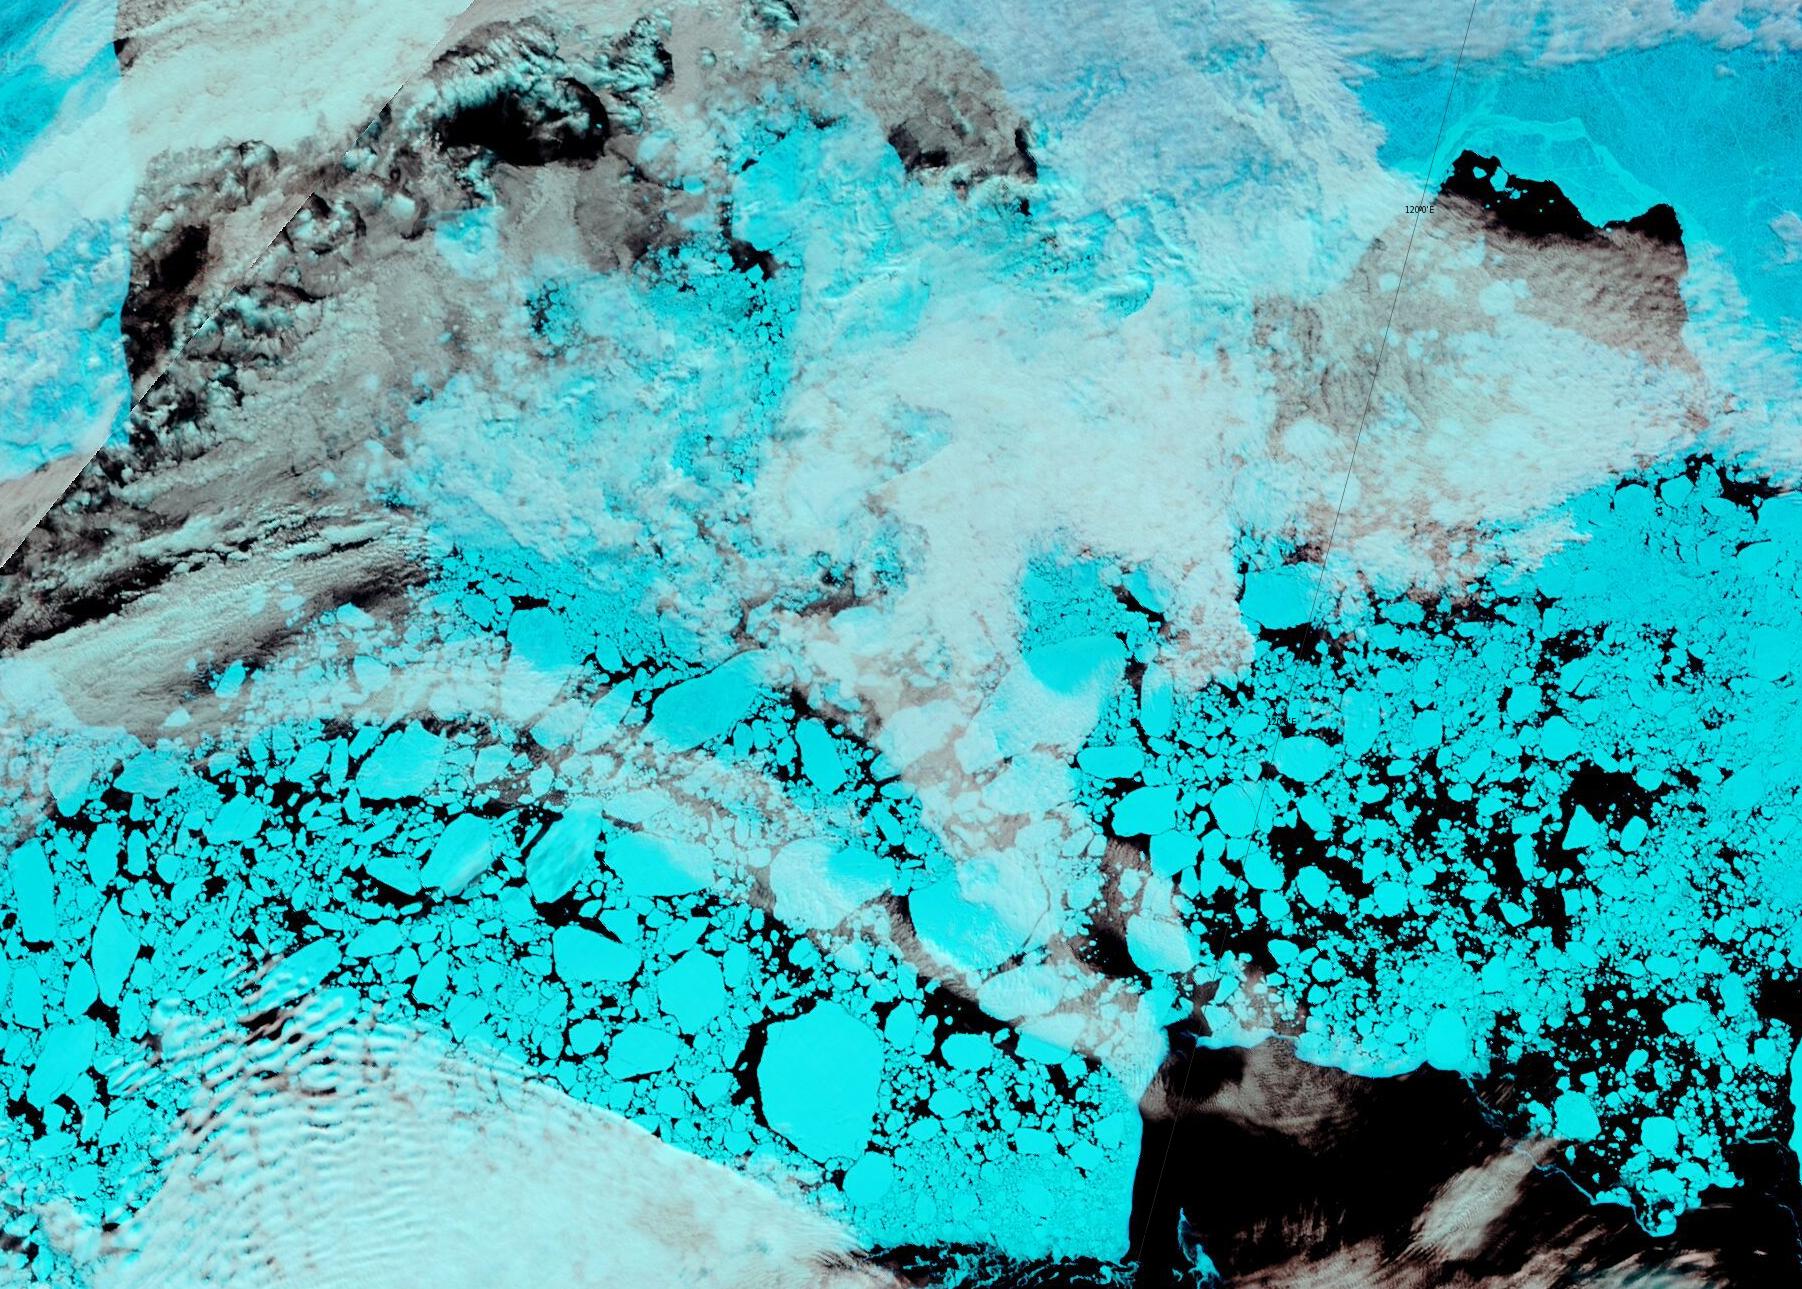
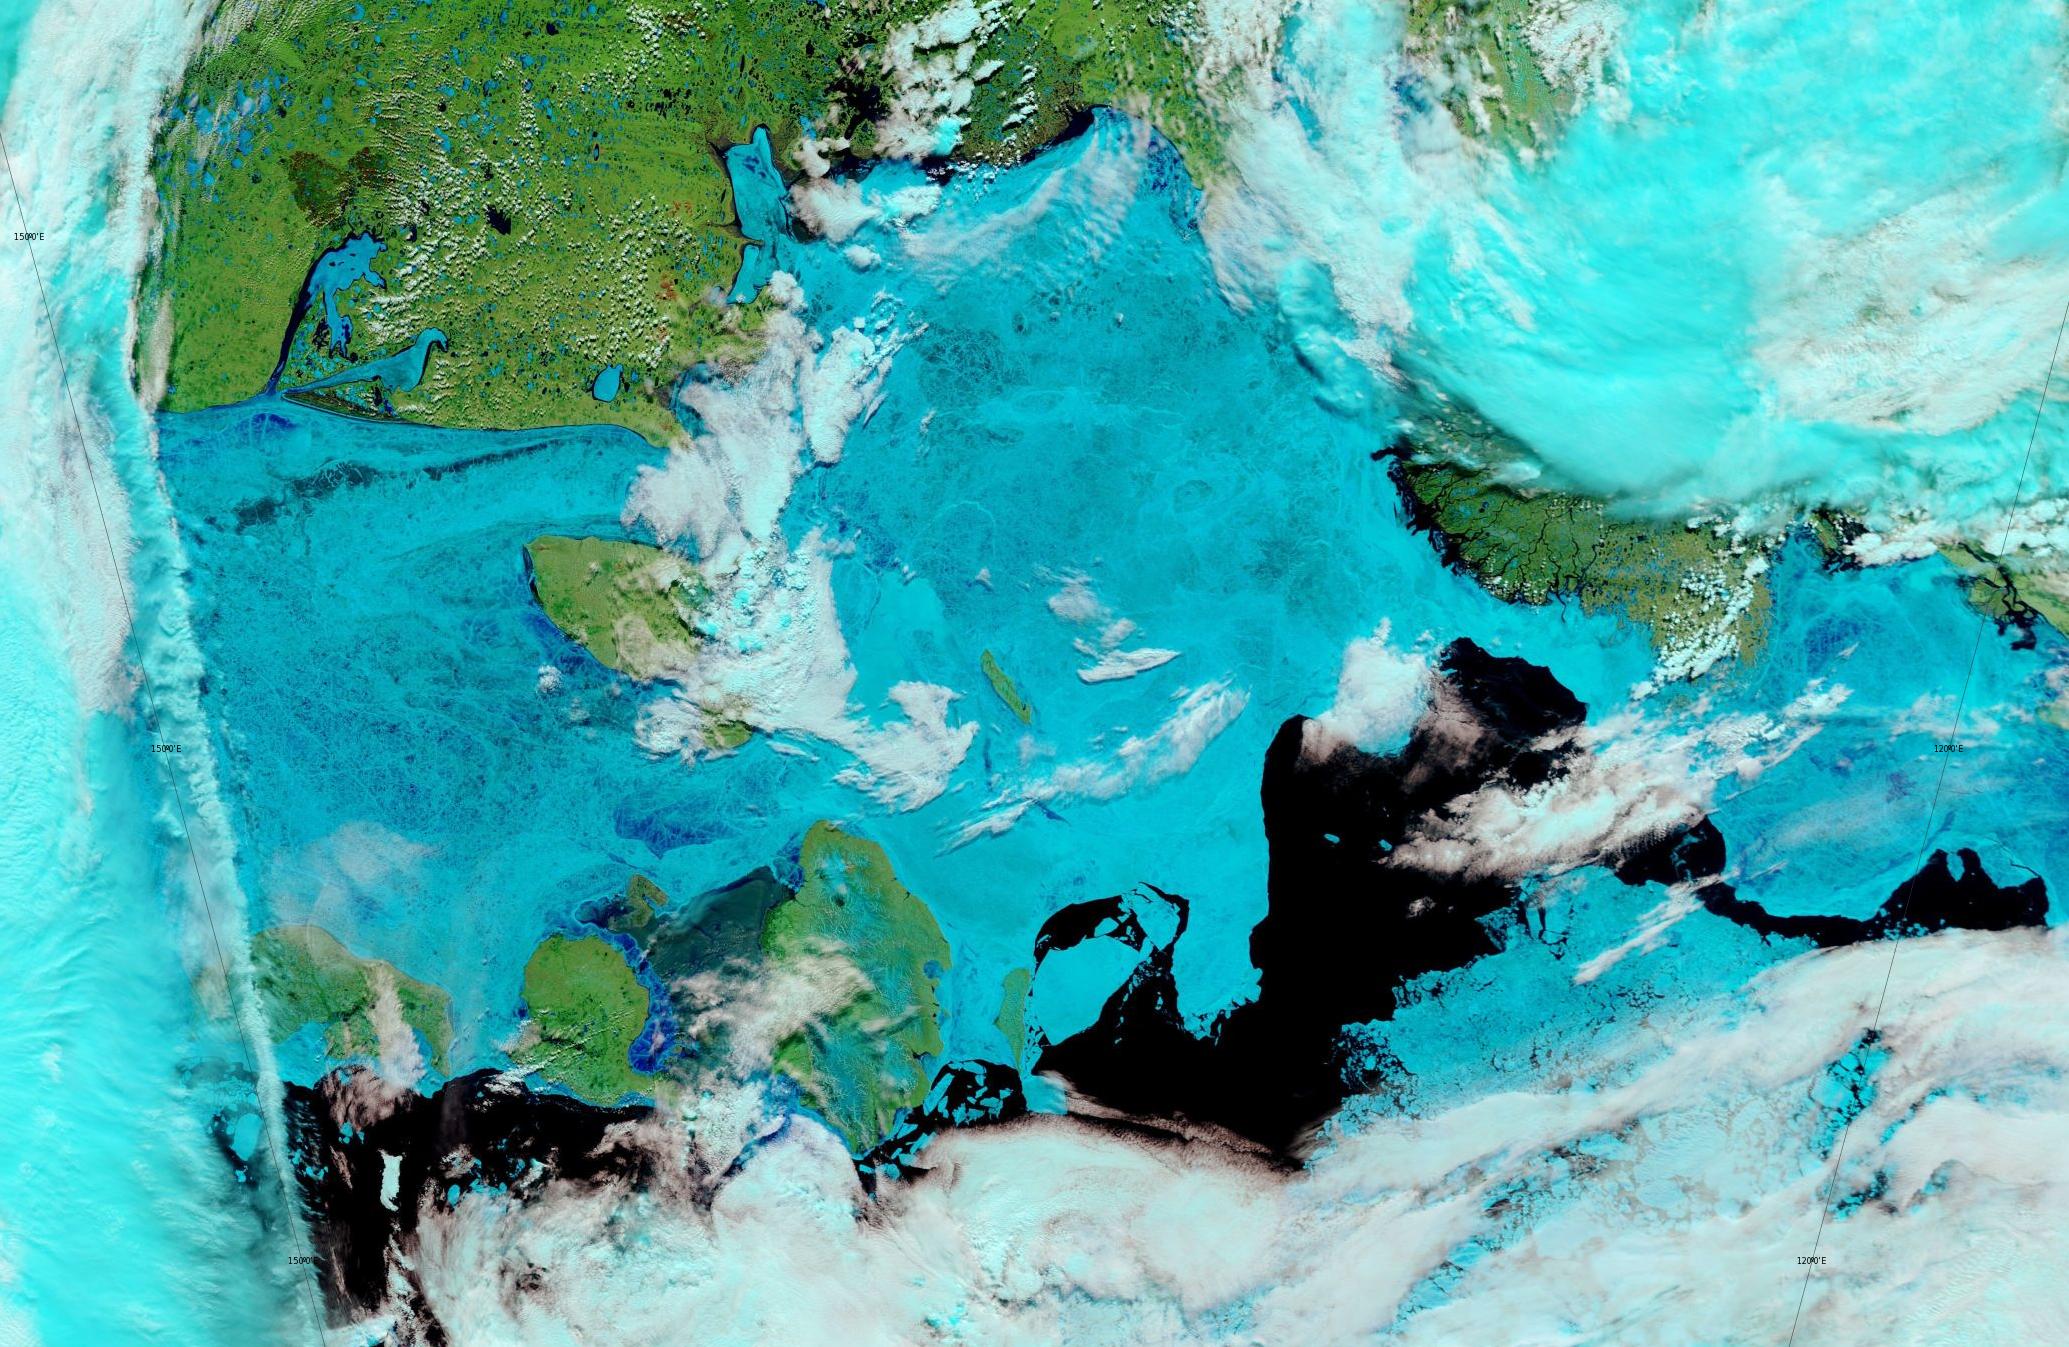
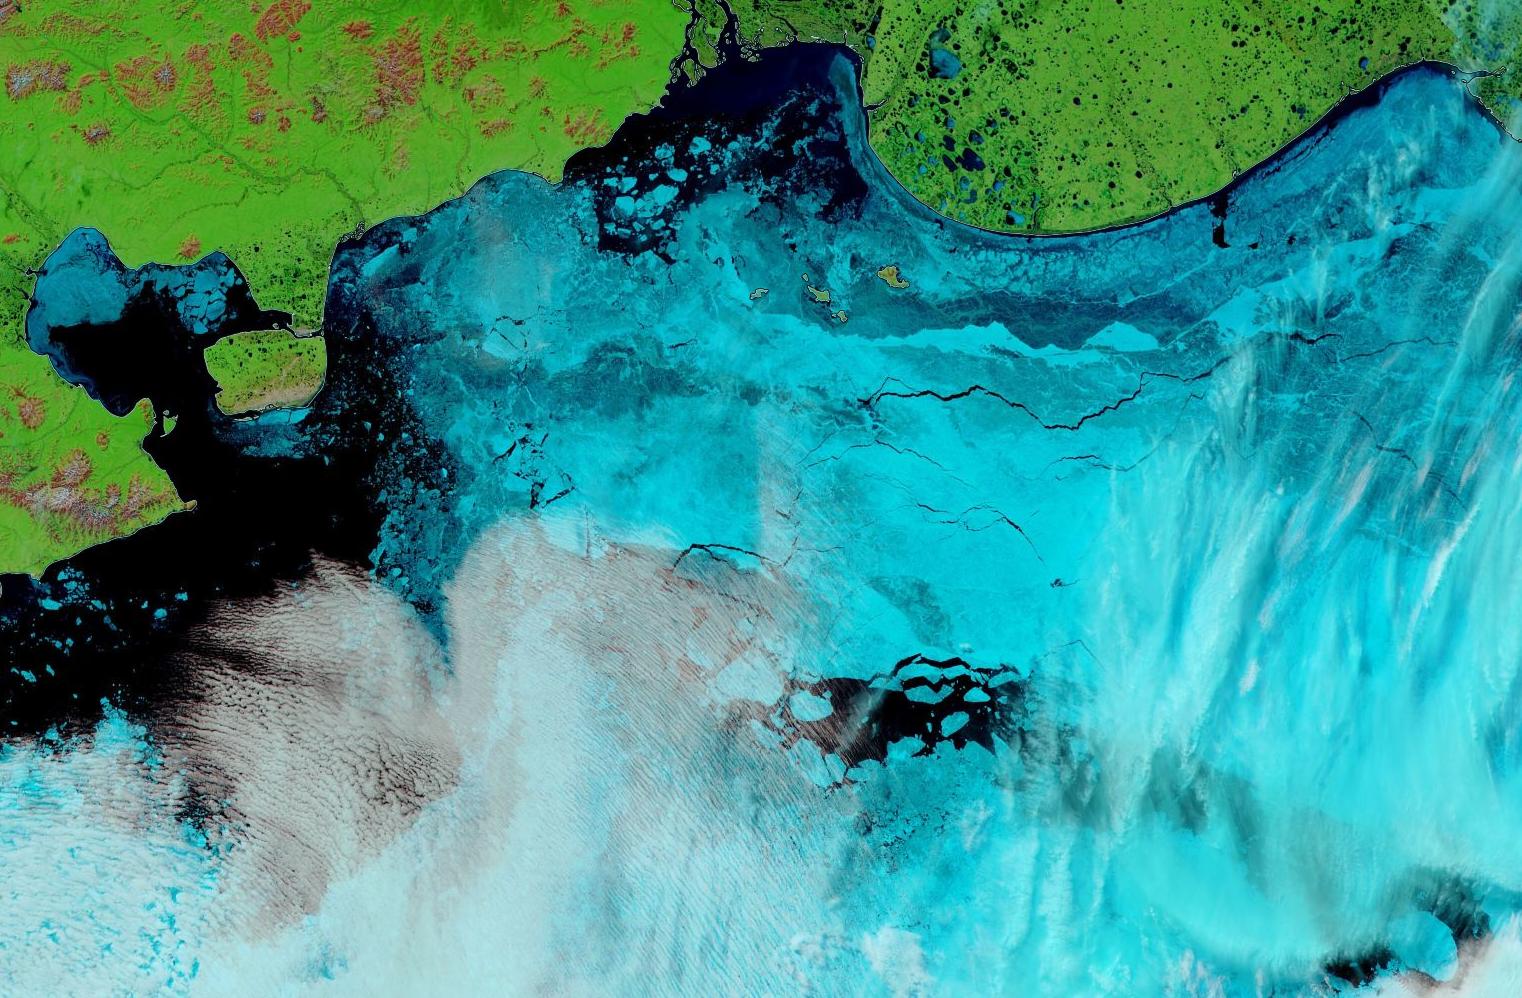
Let’s begin the month with a “true colour” image from the Terra satellite of the Laptev Sea and thereabouts:
The blueish tinge indicates the appearance of melt ponds almost everywhere over the land-fast ice currently covering the majority of the Laptev Sea.
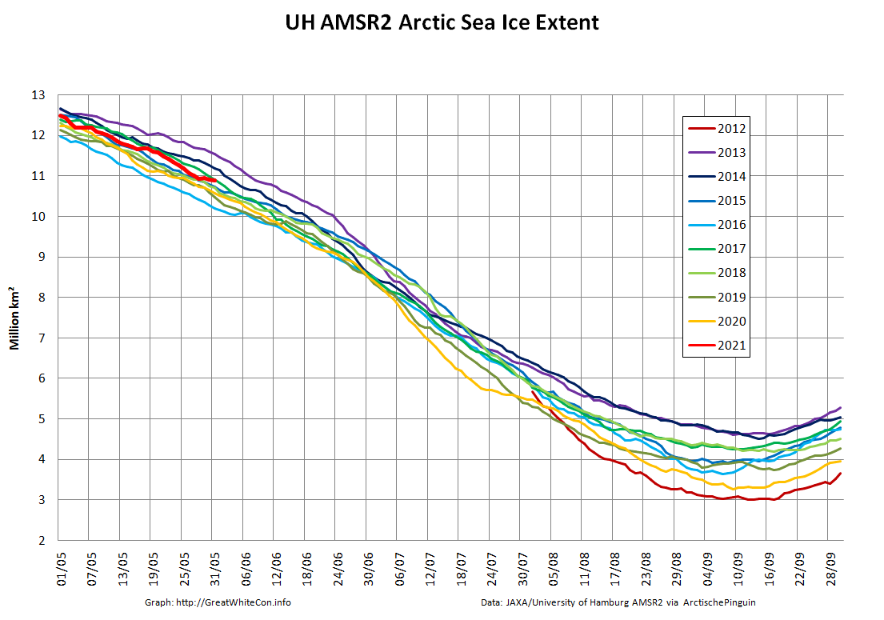
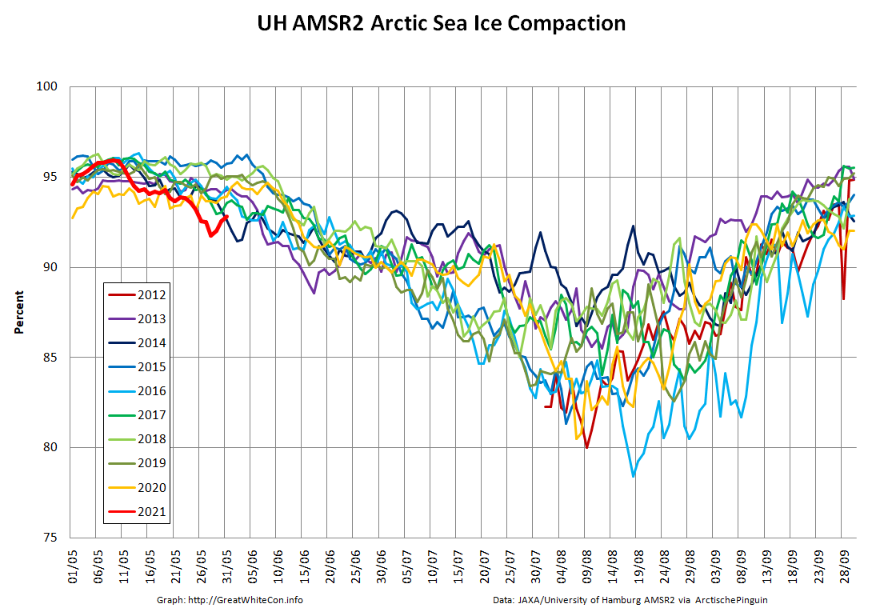
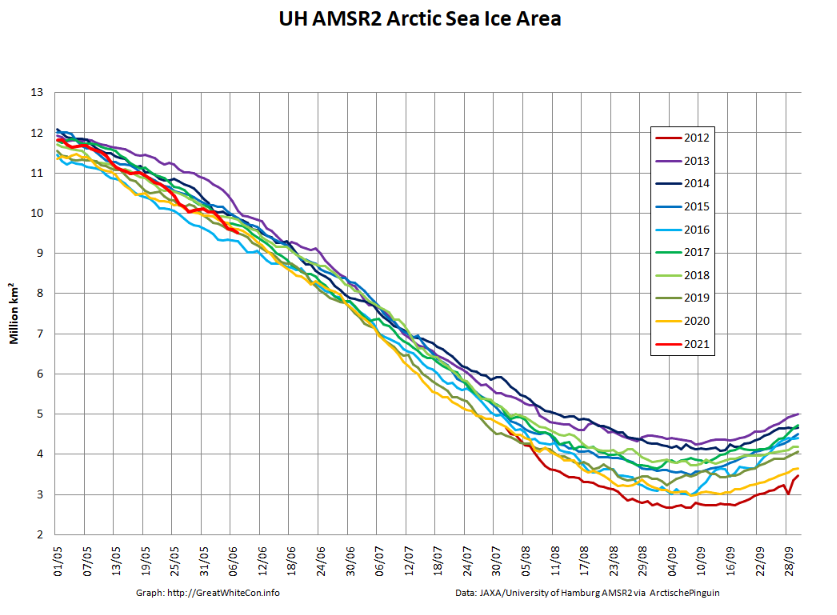
Let’s also take a look at the high resolution AMSR2 metrics for the end of May 2021:
Thanks to the recent “brief hiatus” in areal decline, Arctic wide compaction is no longer in record territory:
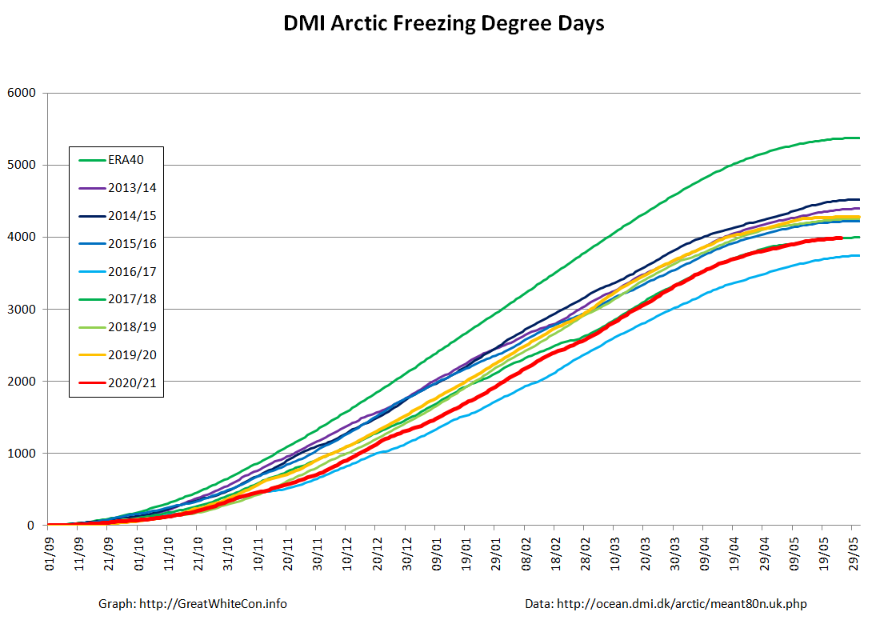
Finally, for the moment at least, here is the Danish Meteorological Institute’s high Arctic temperature data in the form of a graph of freezing degree days:
For some reason the data file still doesn’t include data to the end of May, but things won’t change much by then. Over the winter as a whole only 2016/17 was significantly warmer.
Let the 2021 Arctic sea ice summer melting season officially begin!
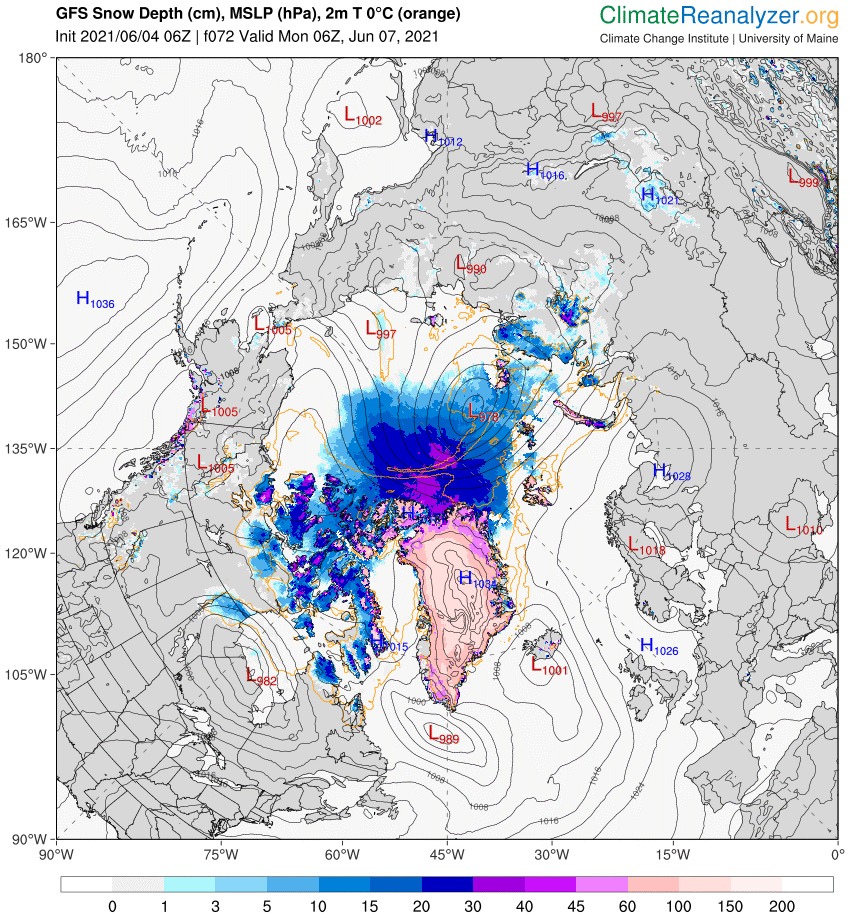
[Edit – June 4th]
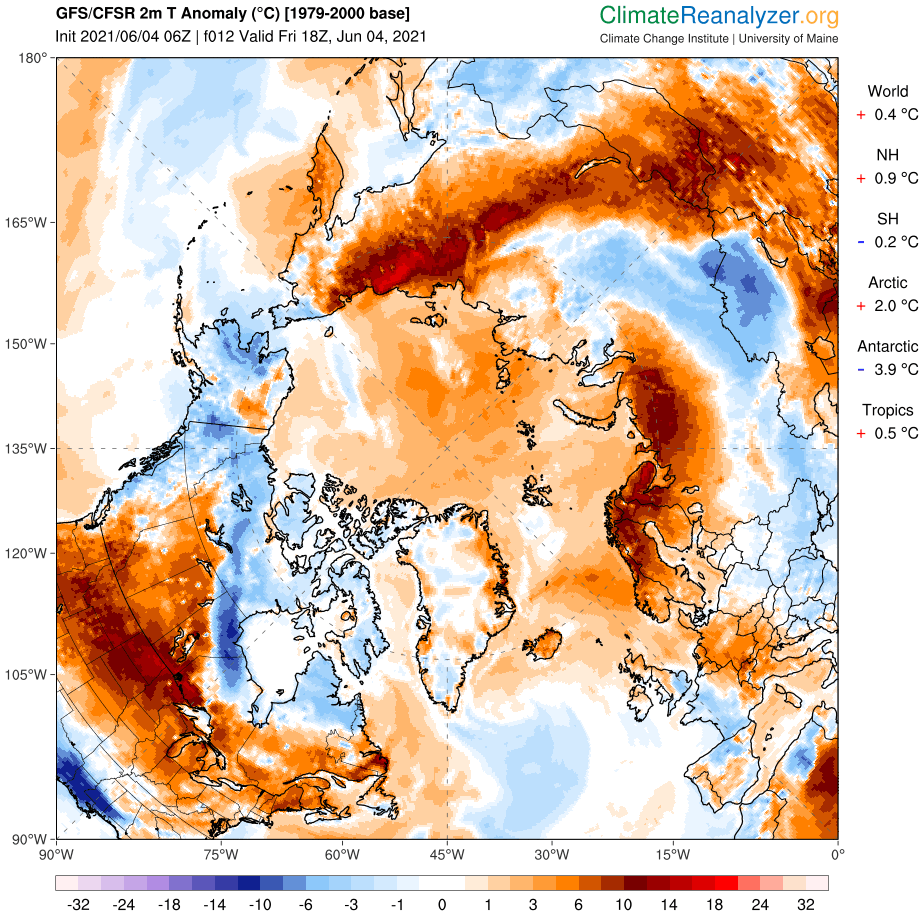
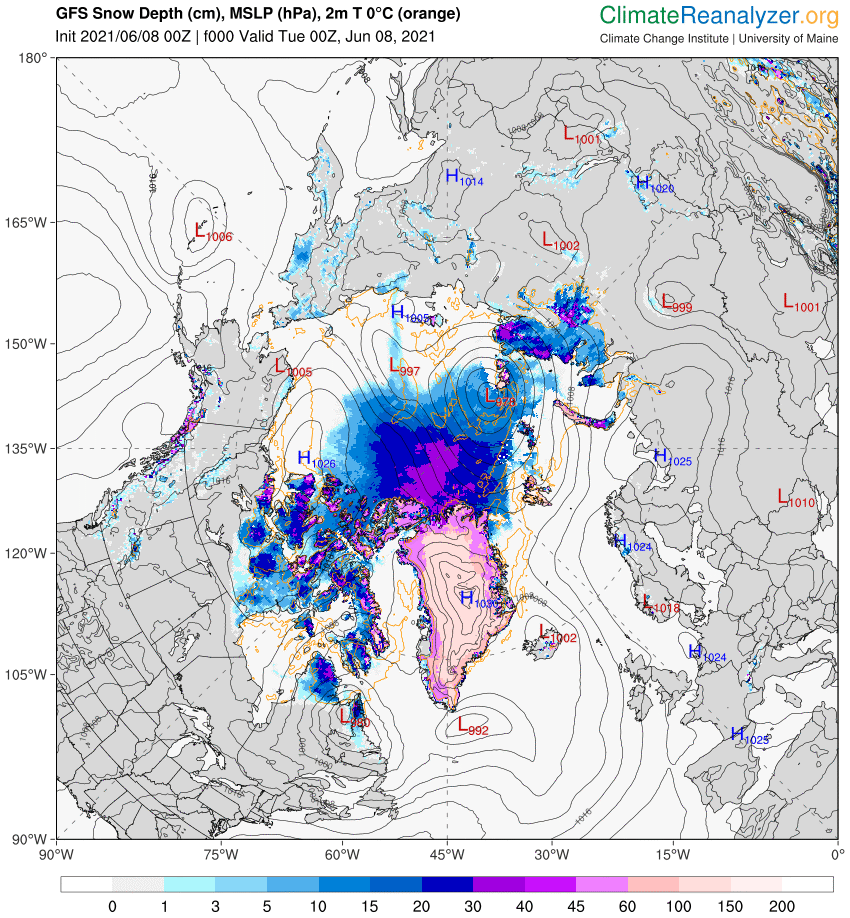
Perhaps unsurprisingly the GFS forecast from four days ago hasn’t quite worked out as predicted. The Arctic as a whole is certainly on the warm side, with a +2 C anomaly at this moment:
However the 966 hPa MSLP cyclone predicted for Monday is now forecast to be a mere 978 hPa:
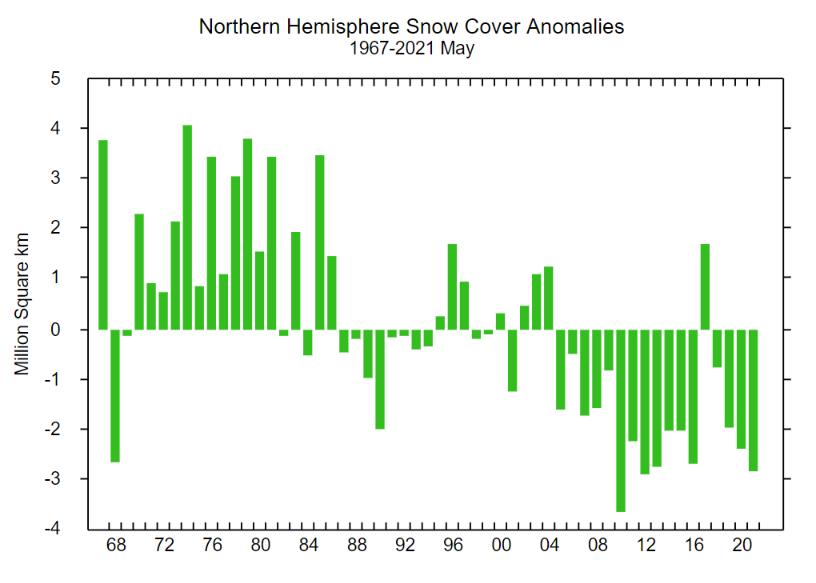
With 3 days to go there is a reasonable chance of it verifying in the “New Arctic” of 2021. As you can see from the map above a large area of the Central Arctic has now lost its snow cover. This is confirmed by the Rutgers Snow Lab northern hemisphere data for May:
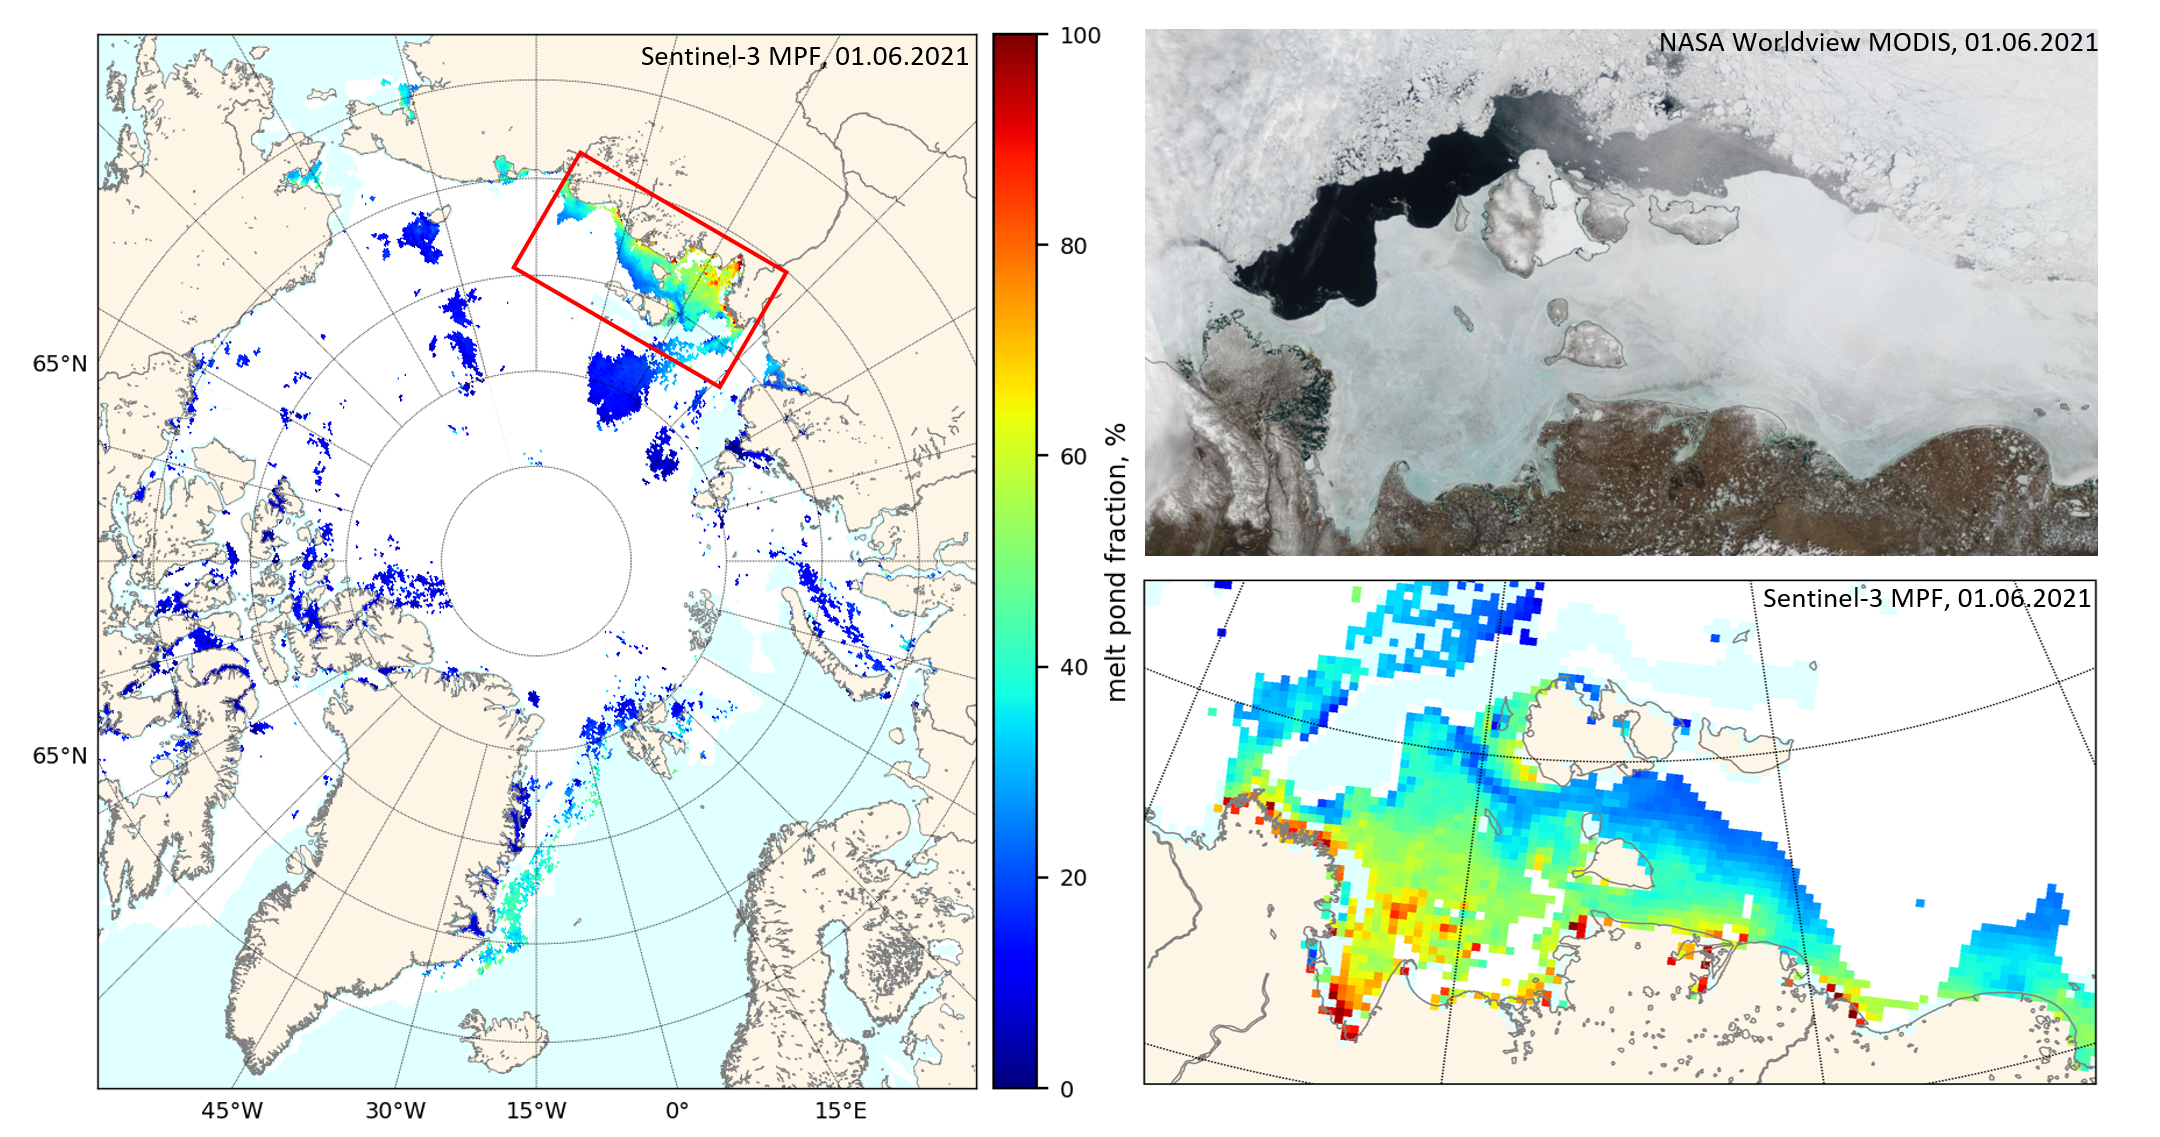
A new Sentinel 3 melt pond fraction product from the University of Bremen confirms that on the fast ice in the Laptev & East Siberian Seas snow cover has departed and melt ponds have arrived:
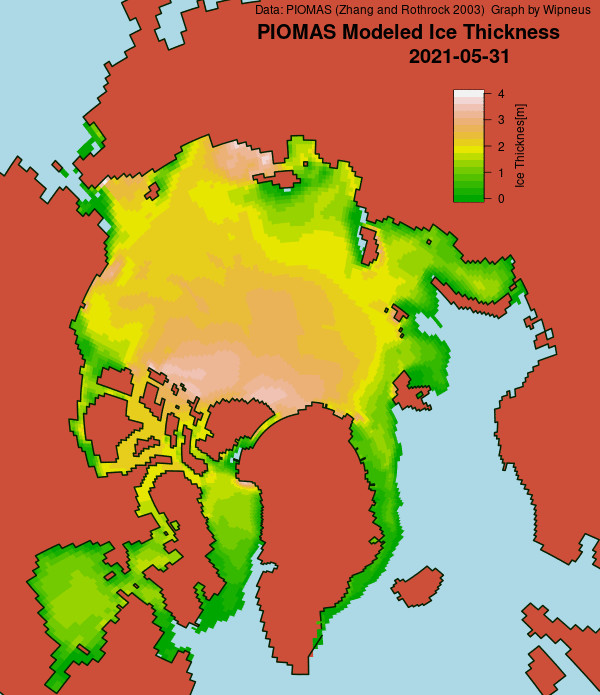
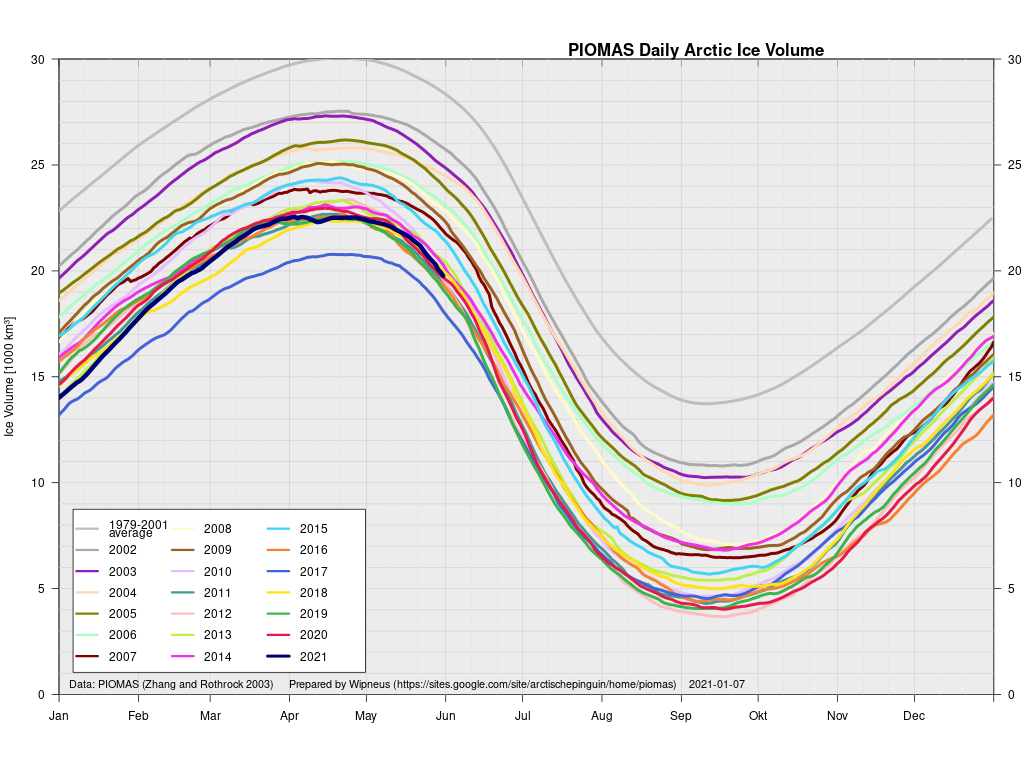
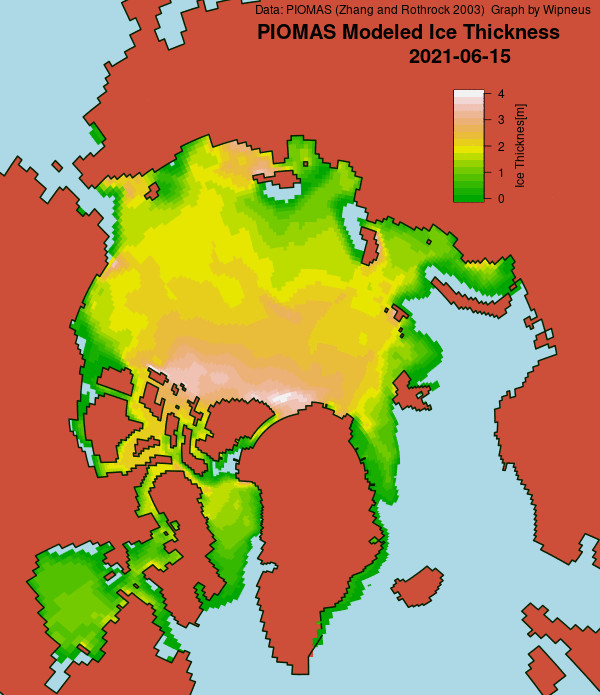
In other news Wipneus has released the latest PIOMAS gridded thickness and volume data on the Arctic Sea Ice Forum:
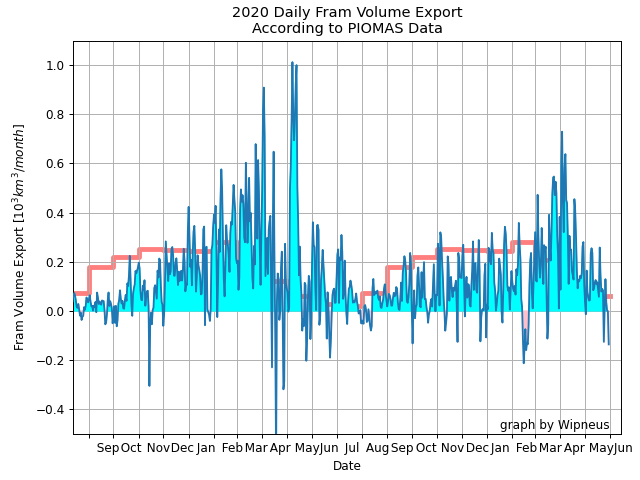
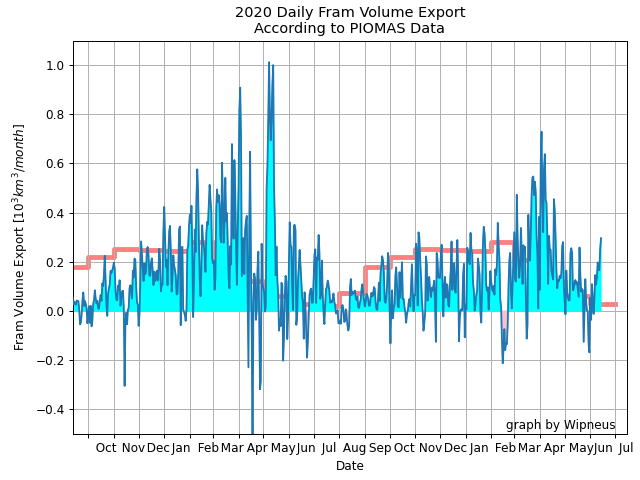
For some strange reason 2021 volume at the end of May is almost identical to 2012 and 2020! Plus of course there’s the modelled volume export from the Central Arctic via the Fram Strait:
[Edit – June 6th]
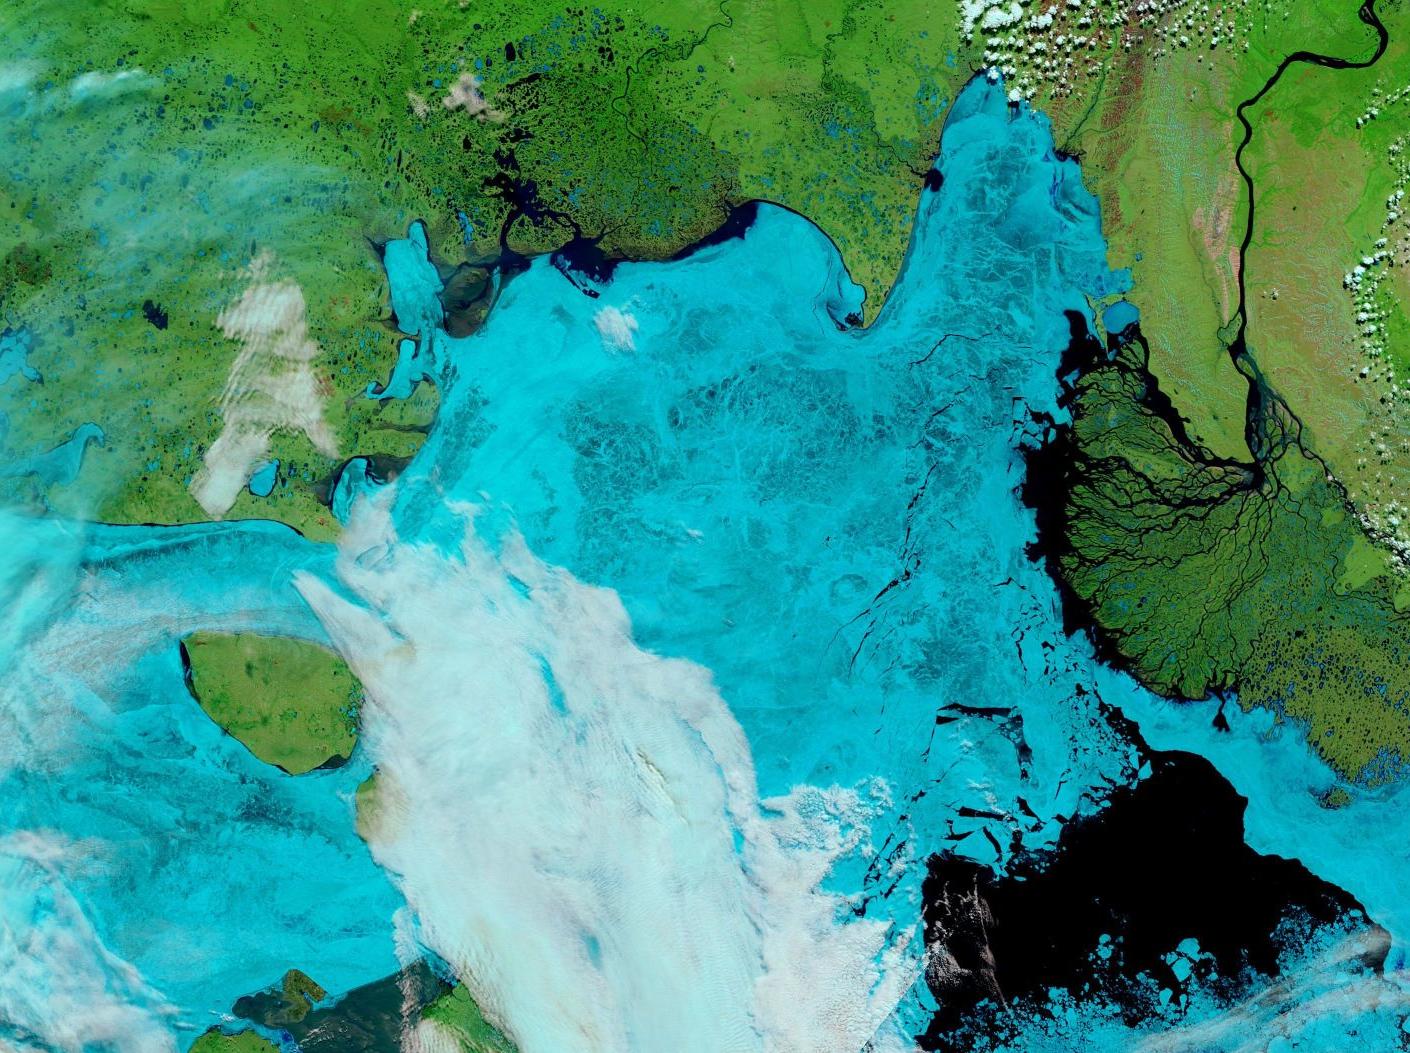
This “false colour” image reveals that there’s virtually no snow cover left on land, and this “false colour” image reveals that the land-fast ice in the East Siberian Sea is now awash with melt ponds:
[Edit – June 8th]
The forecast low pressure area appears to have bottomed out near the Severnaya Zemlya islands with a 978 hPa MSLP:
High resolution AMSR2 Arctic sea ice area is now 2nd lowest for the date after 2016:
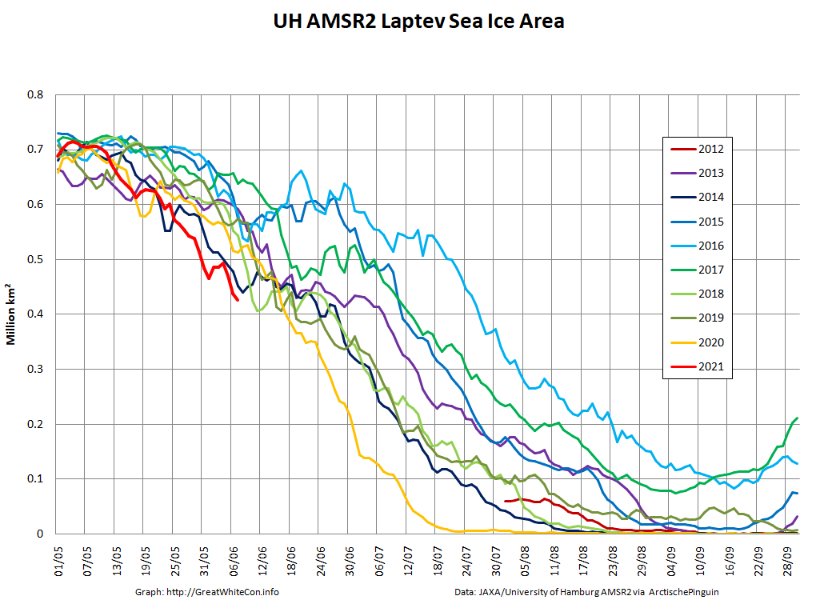
Laptev sea ice area is still lowest for the data, and looks as though it will retain that position for a while:
[Edit – June 9th]
The effect of the recent heat and wind on the remaining sea ice in the Laptev Sea is now all too apparent:
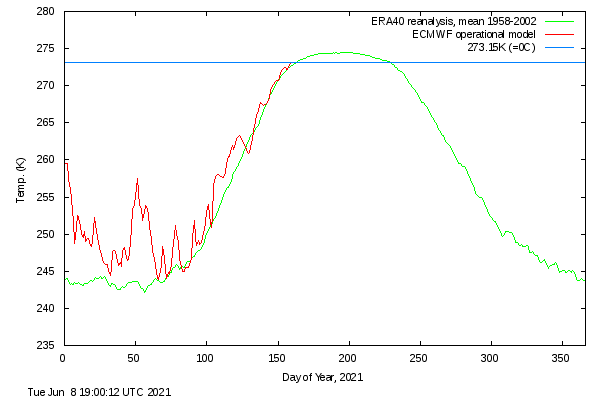
It’s also evident in the DMI >80N temperature graph, which has now reached sea ice “melting point” ahead of the climatology:
Note that the blue line is actually above the “freezing point” of salty Arctic sea water.
[Edit – June 13th]
Fairly clear skies over the Laptev Sea and the western East Siberian Sea, revealing wall to wall melt ponds and the land-fast ice starting to break up near the coast as well as on the edge of the now open ocean:
Plus yesterday’s view of the Beaufort Sea, revealing fast ice breaking up in the western entrance to the McClure Strait:
[Edit – June 18th]
A clearish view of the Laptev Sea today, revealing assorted cracks in a variety of locations:
[Edit – June 20th]
The latest mid-month PIOMAS thickness/volume numbers have been released:
[Edit – June 23rd]
The skies over the Vilkitsky Strait have been cloudy for a few days. However a fairly clear view yesterday reveals that breakup is well under way in what is usually one the last areas along the Northern Sea Route to become navigable:
[Edit – June 26th]
The land-fast ice in the East Siberian Sea has started to disintegrate en masse:
Data from ice mass balance buoy 441910, currently located at 76.1 N, 151.1 W in the Beaufort Sea, reveals the onset of both surface and bottom melt:
It’s May Day 2021, and just for a change we’re going to start the month off with a pretty picture!
Parts of the Laptev Sea are starting to look distinctly “warm” in the infra-red. Here’s a “false colour” image taken by the Terra satellite during a gap in the clouds:
We have reached the time of year when the SMOS “thin ice thickness” readings start being affected by surface melt, but let’s take a look anyway:
That area of the Laptev certainly appears to be either thin or melting.
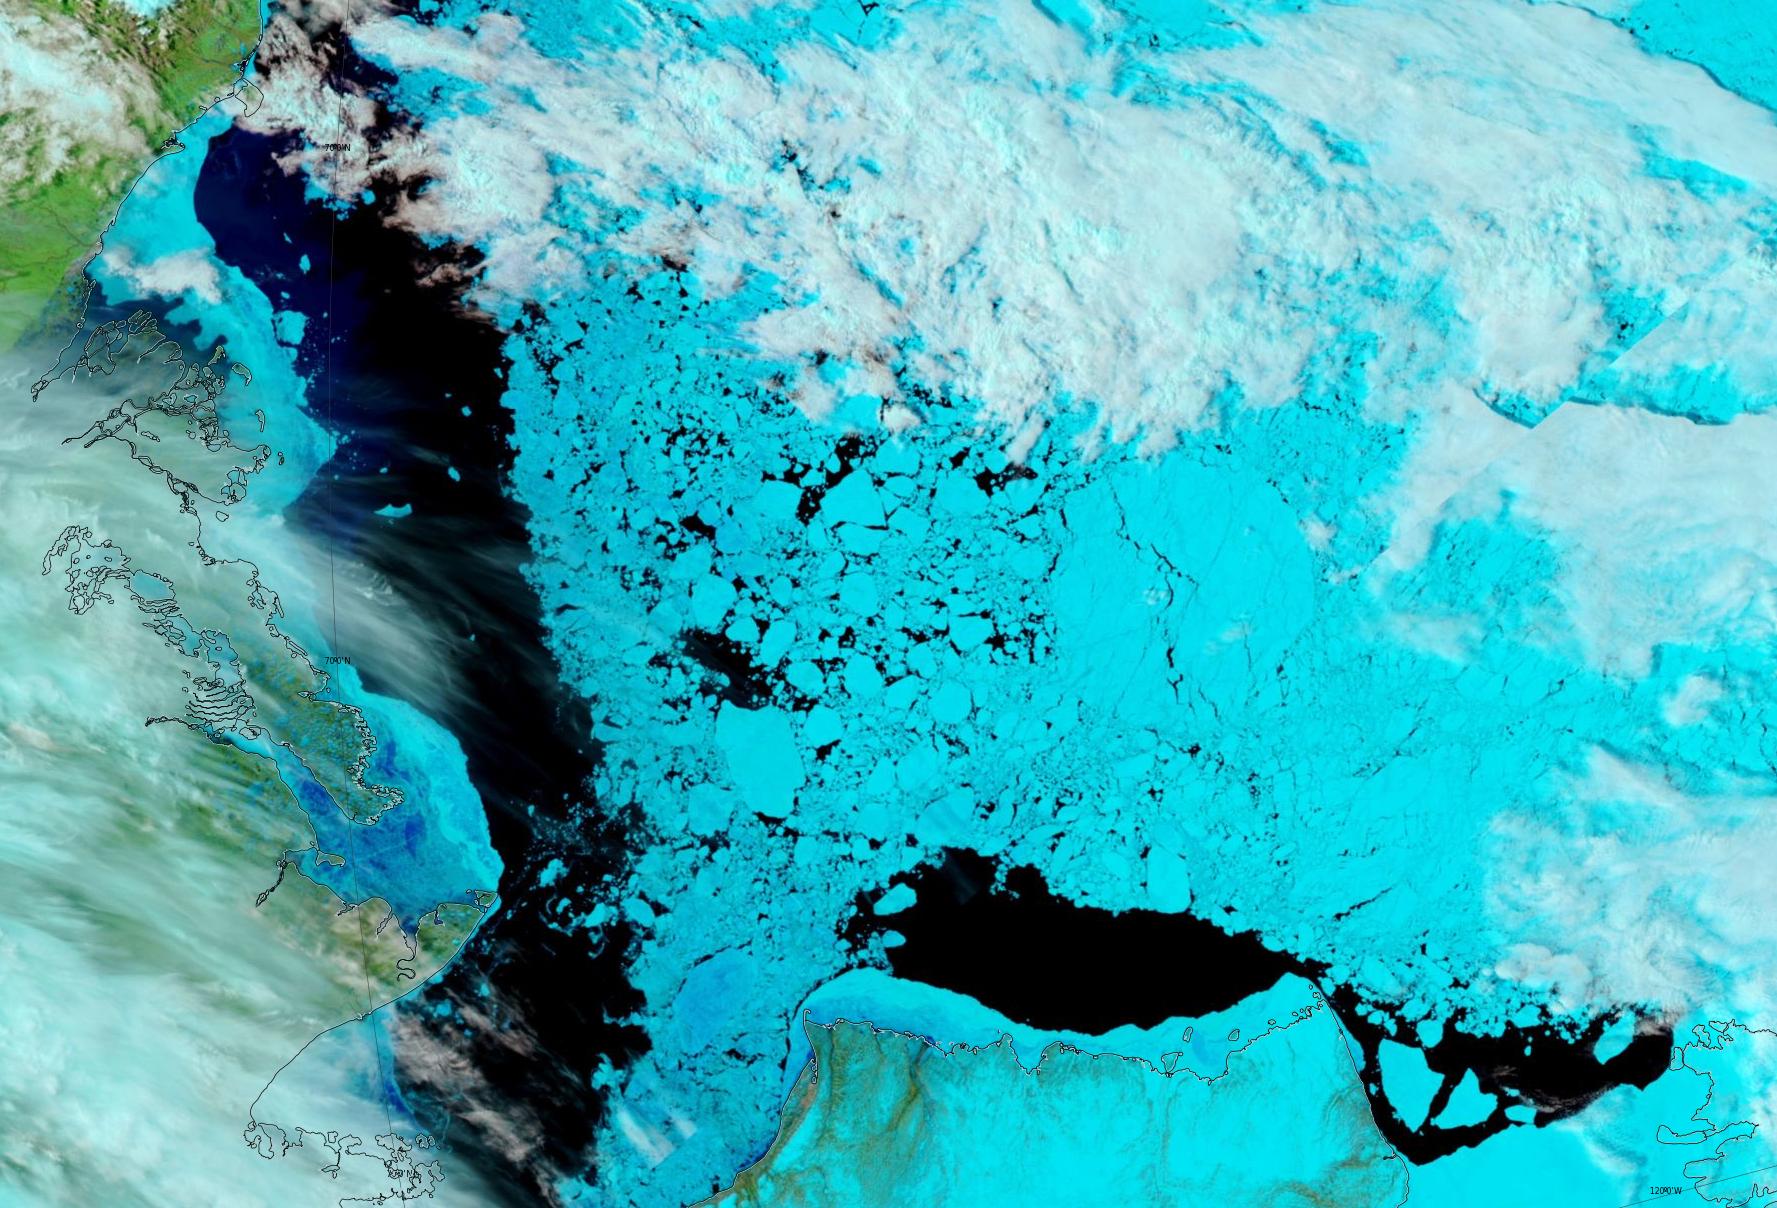
Meanwhile on the Canadian side of the Arctic the fast ice off the Mackenzie Delta is starting to get damp, even though the river itself still looks to be fairly well frozen:
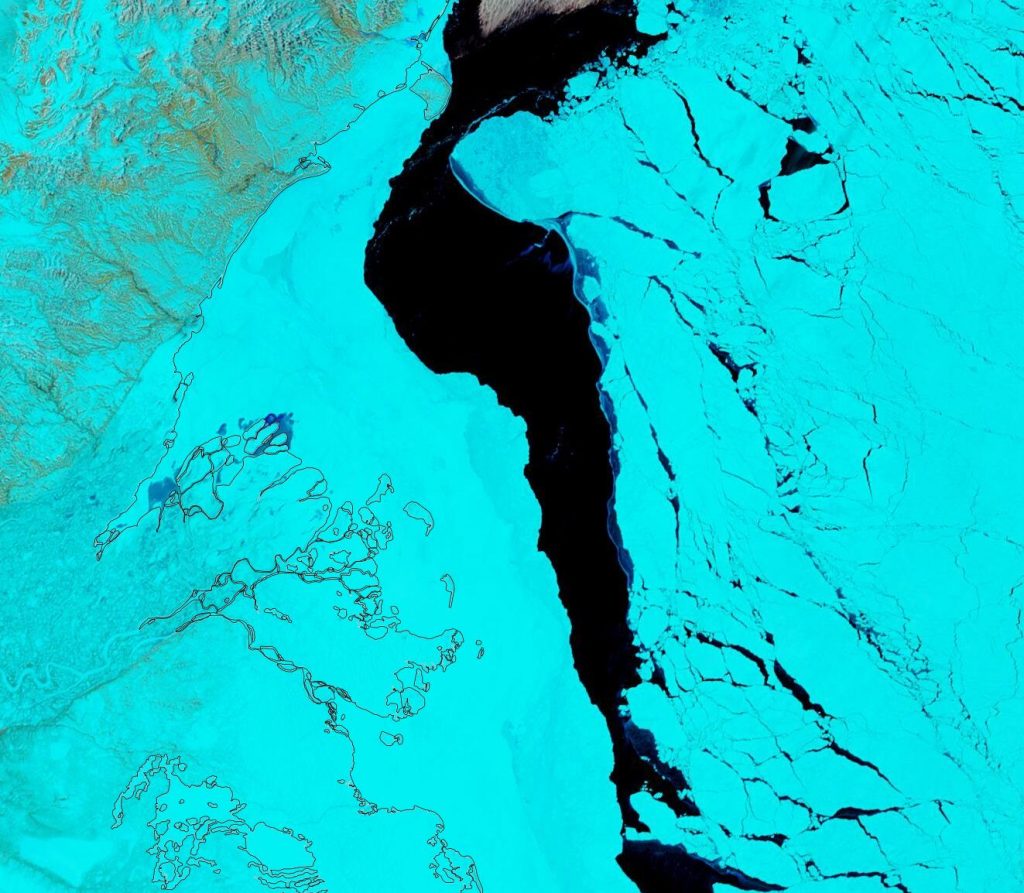
It will also be interesting to follow the progress of this large floe as it heads towards oblivion through the Fram Strait:
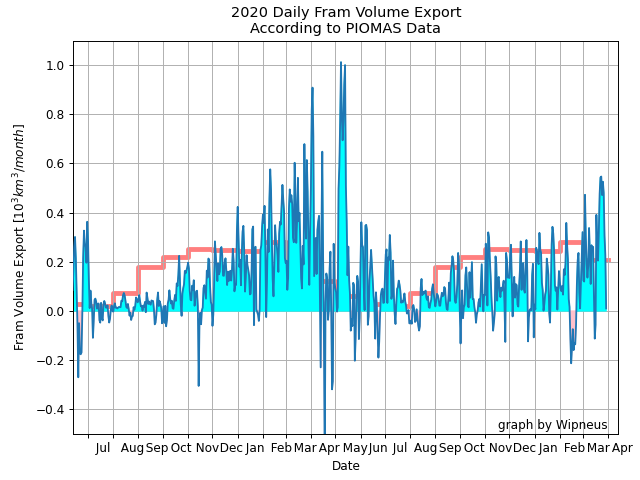
As part of his March PIOMAS gridded sea ice thickness update Wipneus also produced this graph of sea ice export from the central Arctic via the Fram Strait:
So far this winter export has been remarkably subdued, but that has now changed. A persistent dipole with high pressure over Greenland and low pressure over the Barents Sea is generating strong northerly winds in the Fram Strait, and even bringing some April snow showers to South West England:
Wondering why it's so #cold? We're still sat in Arctic air across the UK today
A change to milder #weather arrives tonight for Thursday and Friday, bringing temperatures much closer to average
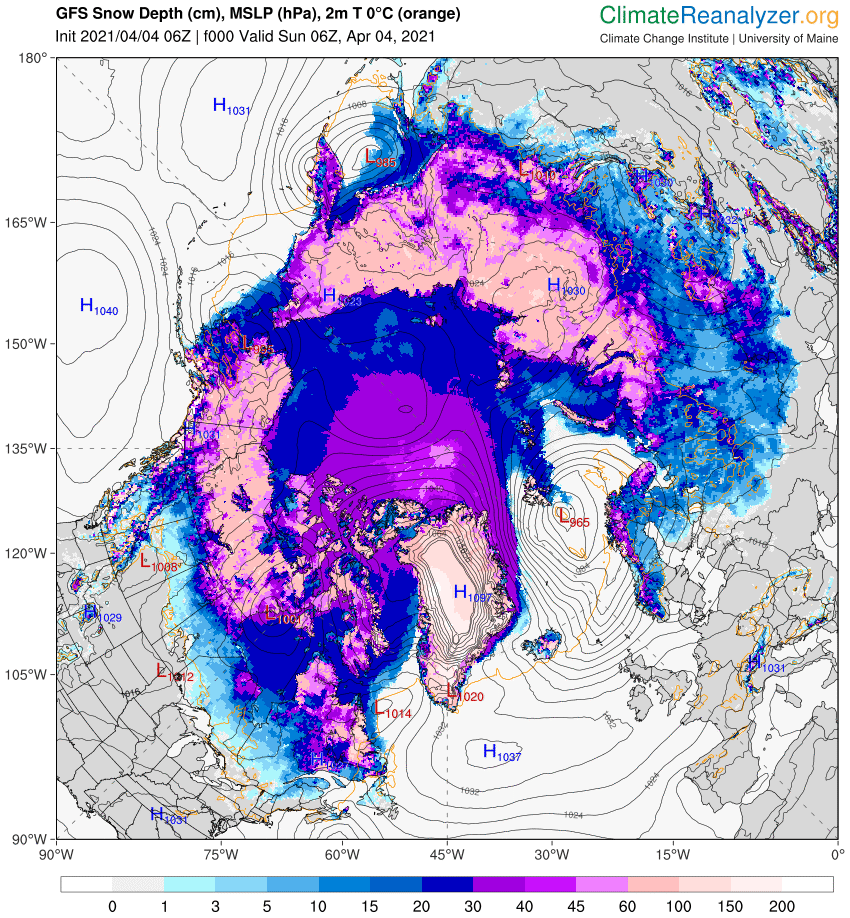
Precisely how high the pressure has been over Greenland is the subject of much debate. See for example this discussion on the Arctic Sea Ice Forum about whether a new world high pressure record has just been set. Different weather forecasting models have come to very different conclusions about the mean sea level pressure of a high pressure area situated over the Greenland ice sheet, which reaches an altitude of over 3,000 metres. Here’s GFS for example, showing 1097 hPa at 06Z on April 4th:
whereas the Canadian Meteorological Centre synopsis for the same time shows a mere 1070 hPa:
At least all the assorted models agree that the isobars are closely packed over the Fram Strait, and hence some of the thickest sea ice remaining in the Arctic is currently heading towards oblivion in the far north Atlantic Ocean:
A new month begins today, and at the moment it looks as though it’s going to be the most interesting one since August 2012. Here once again is the satellite image of the enormous cyclone that was spinning over the Beaufort/Chukchi Seas just a few days ago:
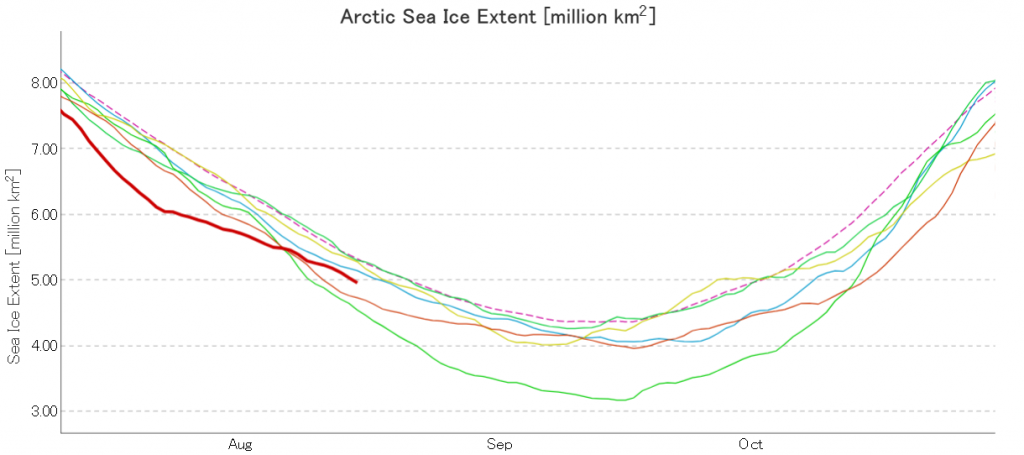
Here too is the effect of the cyclone on the trajectory of the JAXA Arctic sea ice extent graph:
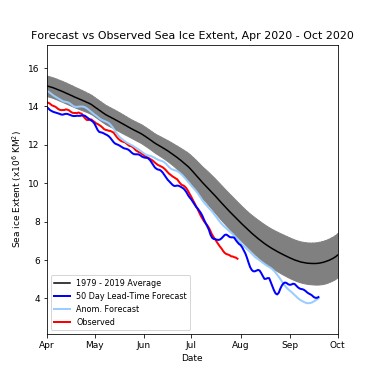
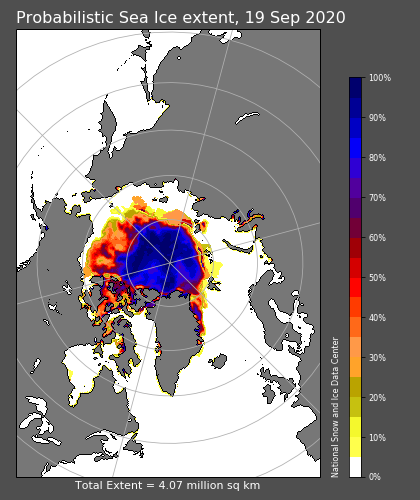
Here too is the current prognosis of the late Andrew Slater’s “Slater Probabilistic Ice Extent” 50 day forecast:
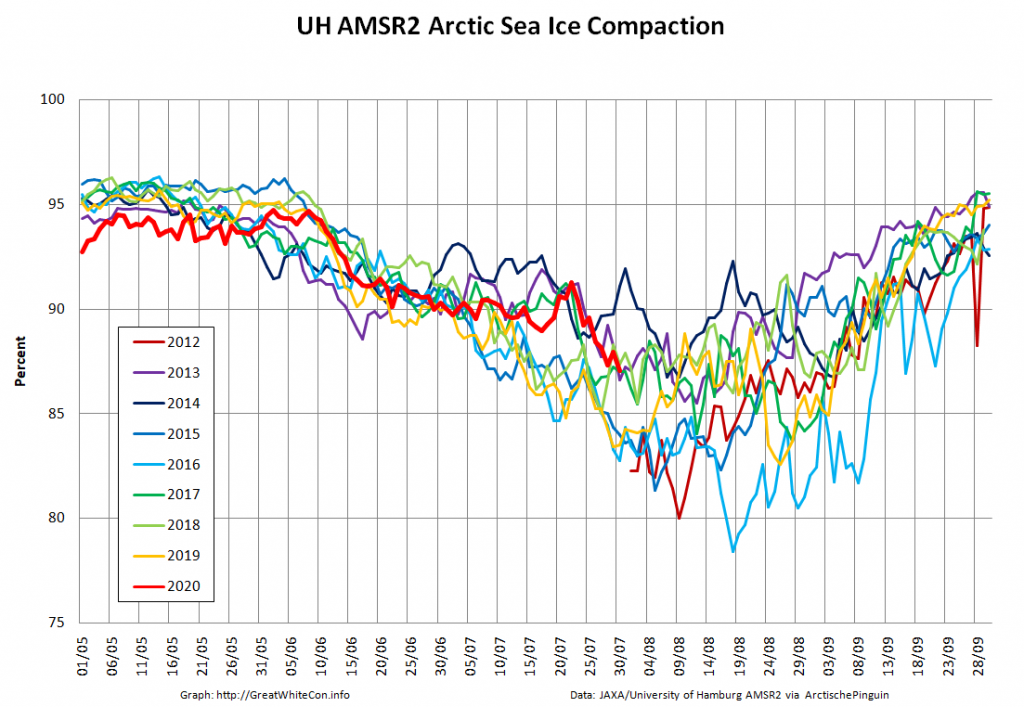
The cyclone has obviously resulted in a reduction in the rate of extent decline, but take a look at the high resolution AMSR2 “compaction” graph:
The gaps between the remaining sea ice floes have evidently increased, and hence the ice area is declining more rapidly than its extent.
[Edit – August 2nd]
Here’s an animation, based on the University of Hamburg’s AMSR2 concentration maps, which reveals the motion of the sea ice across the Beaufort and Chukchi Seas for the last two months:
Note in particular the side effects of the recent cyclone, visible at the end of the video.
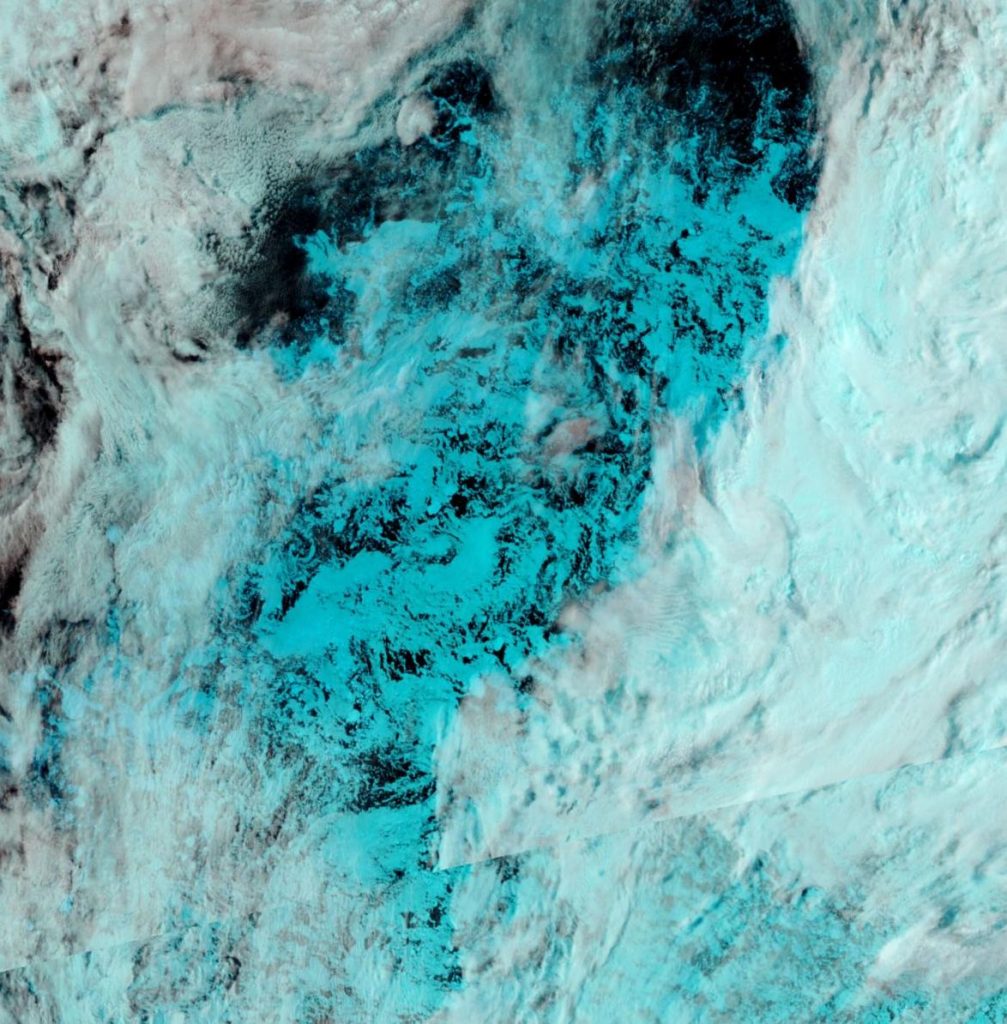
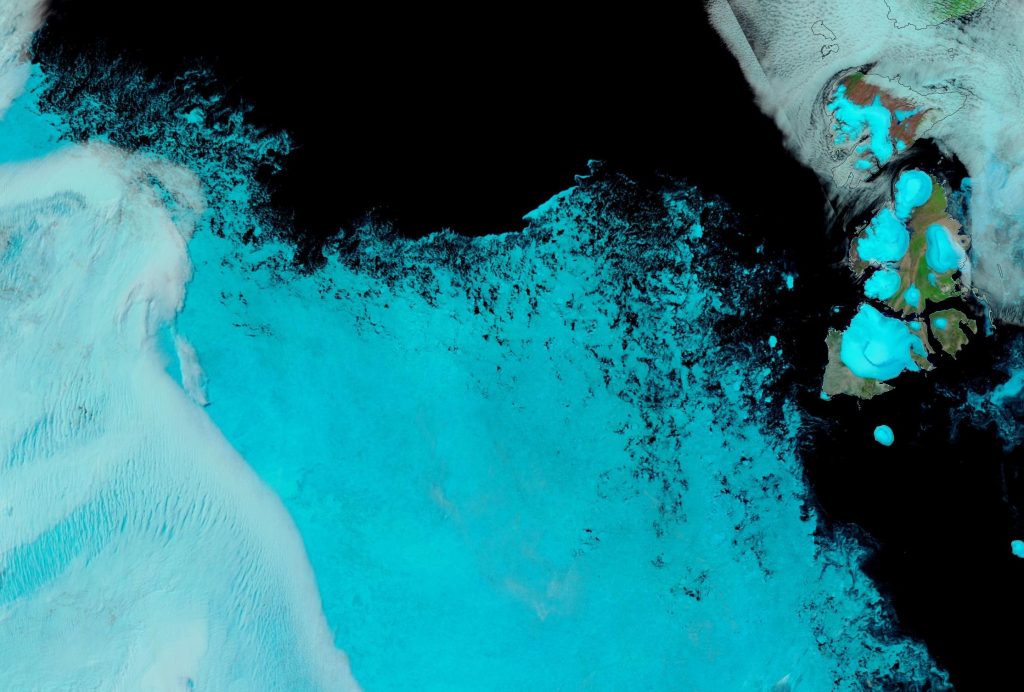
Here too is a close up of the current state of the remaining ice in the Chukchi Sea, snapped by the Suomi NPP satellite through a gap in the clouds:
Plus the current open water north of Greenland. Perhaps once Polarstern has been flushed out into the open water of the Fram Strait at the end of the MOSAiC expedition she could take another look at this almost completely unexplored area of the Arctic Ocean?
[Edit – August 6th]
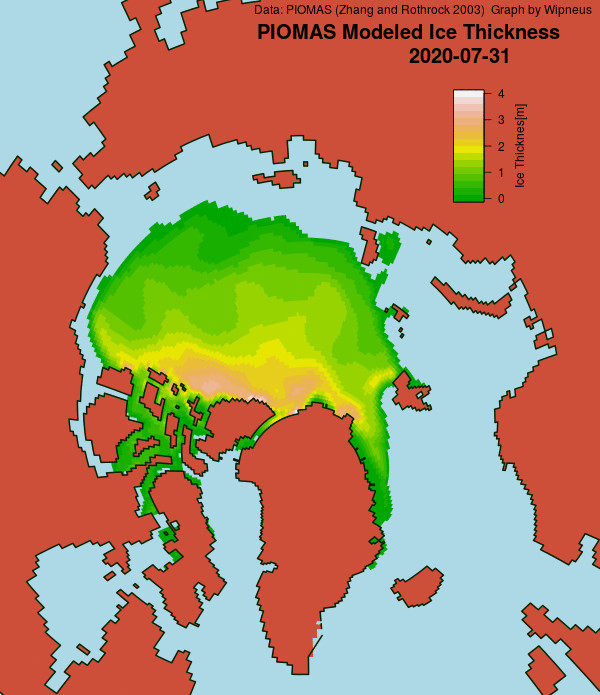
The latest gridded thickness data has been released by the PIOMAS team, and here are Wipneus’s visualisations:
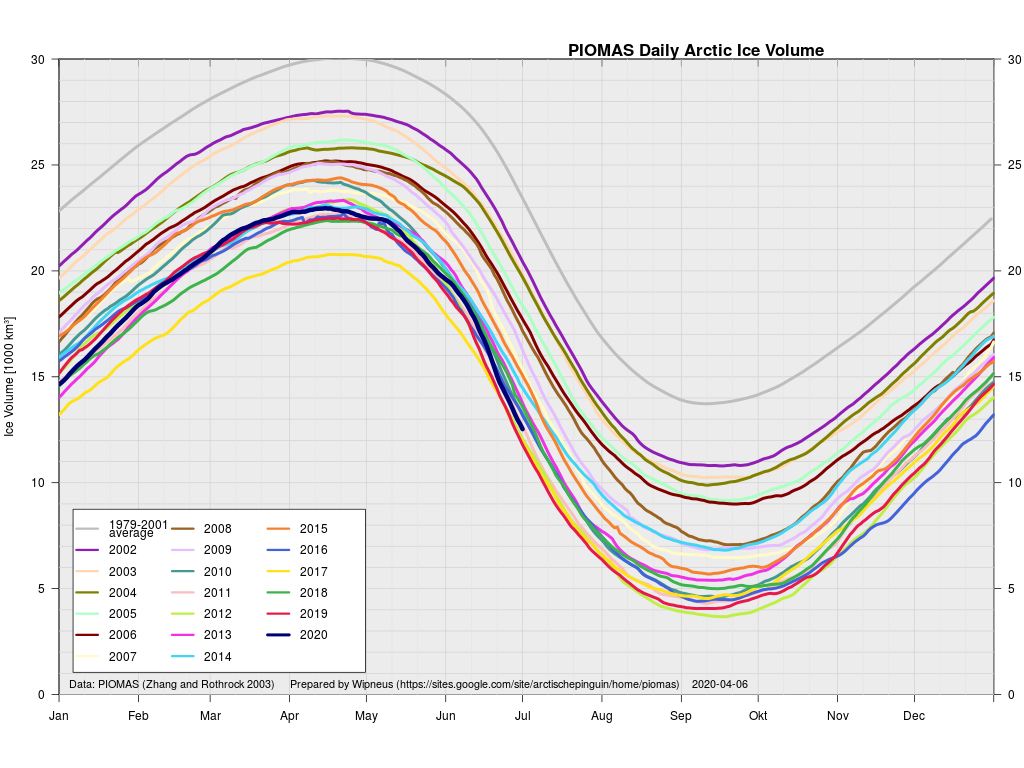
Average Arctic sea ice volume in July 2020 was 9,300 km3. This value is only 400 km3 above the record minimum value of 8,900 km3 set in 2019. This makes 2020 the fourth lowest on record for July with 2012, 2017,2019 falling just below 2020.
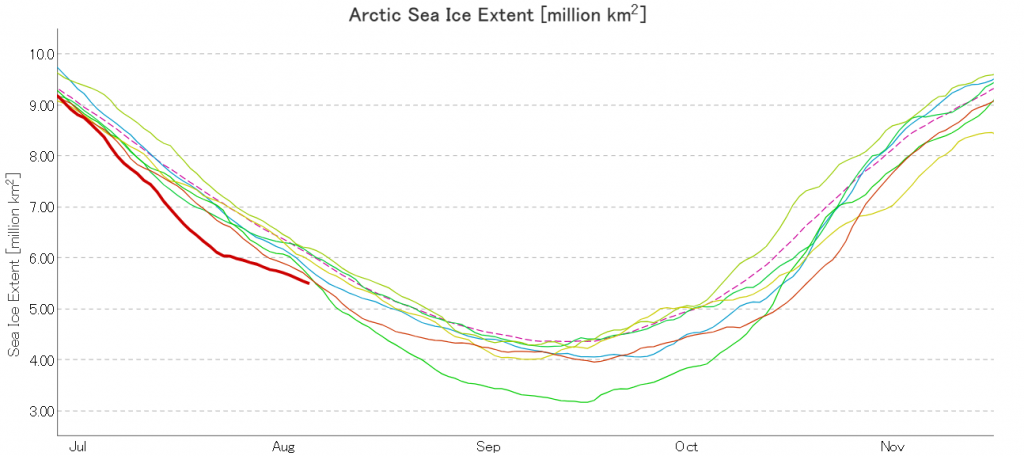
JAXA extent is still lowest for the date, but following the recent cyclone it looks as though it will not maintain that position for much longer:
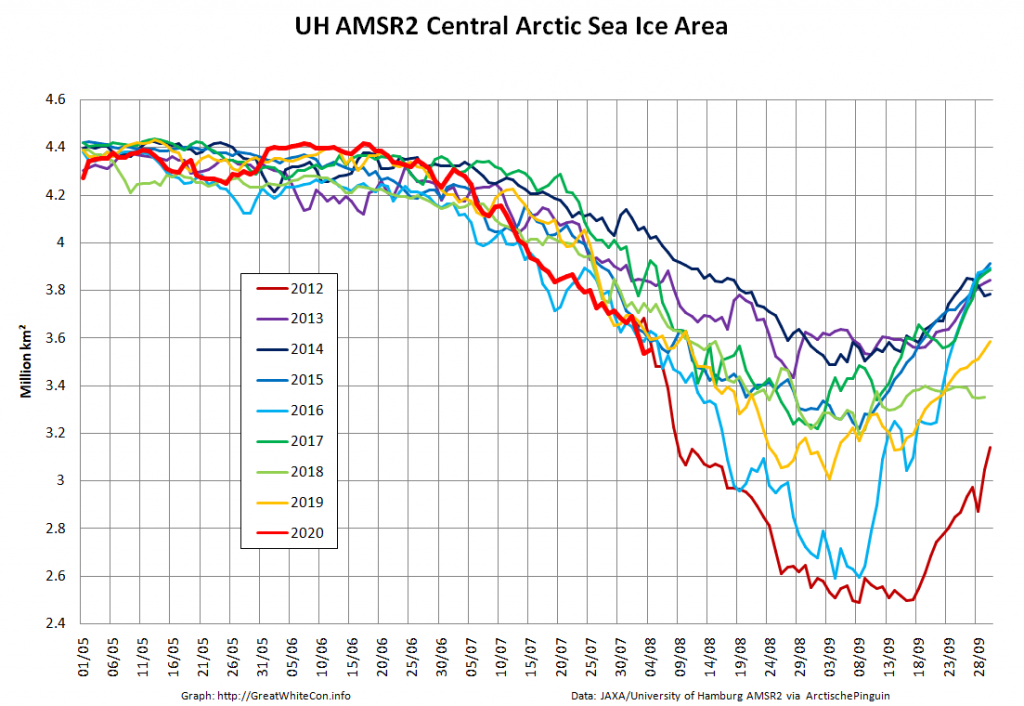
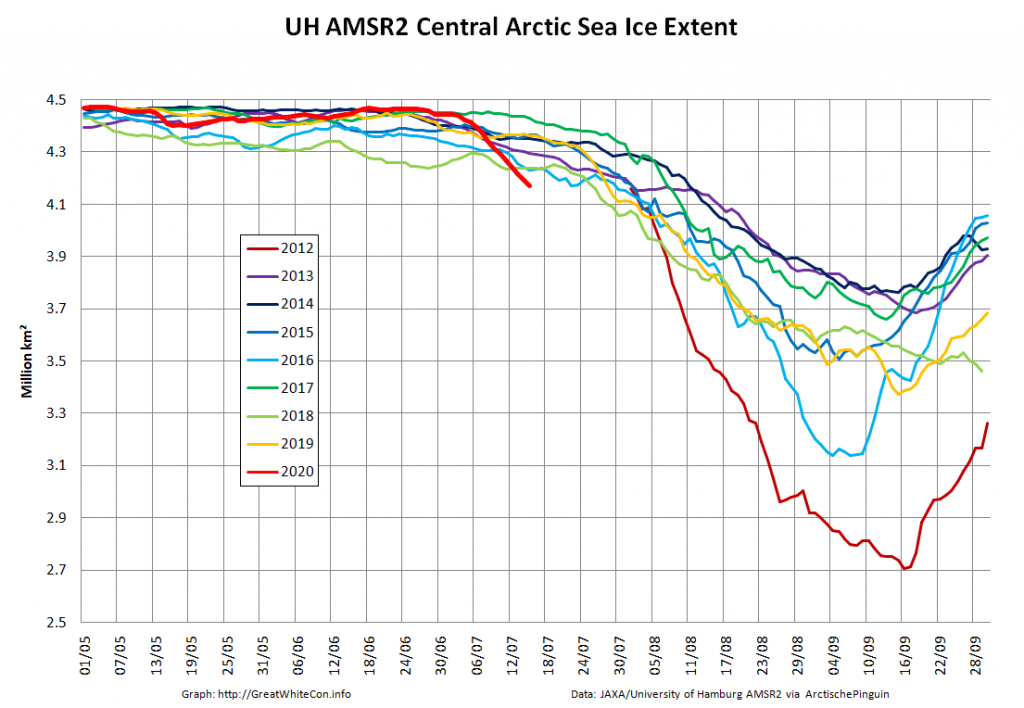
Now we’re in the month of August it’s possible to do a direct comparison with AMSR2 data for 2012. Here’s sea ice area for the Central Arctic Basin:
[Edit – August 8th]
All of a sudden JAXA extent is in 3rd place in the race to the minimum:
However let’s also take a close look at the state of the sea ice in the Beaufort and Wandel Seas shall we?
At this juncture I reckon that come mid September second place is now more likely than first. However as always, it still all depends on the weather.
[Edit – August 9th]
Surprising as it may seem, high resolution AMSR2 Central Arctic Basin sea ice area has so far managed to keep up with the precipitous drop in 2012:
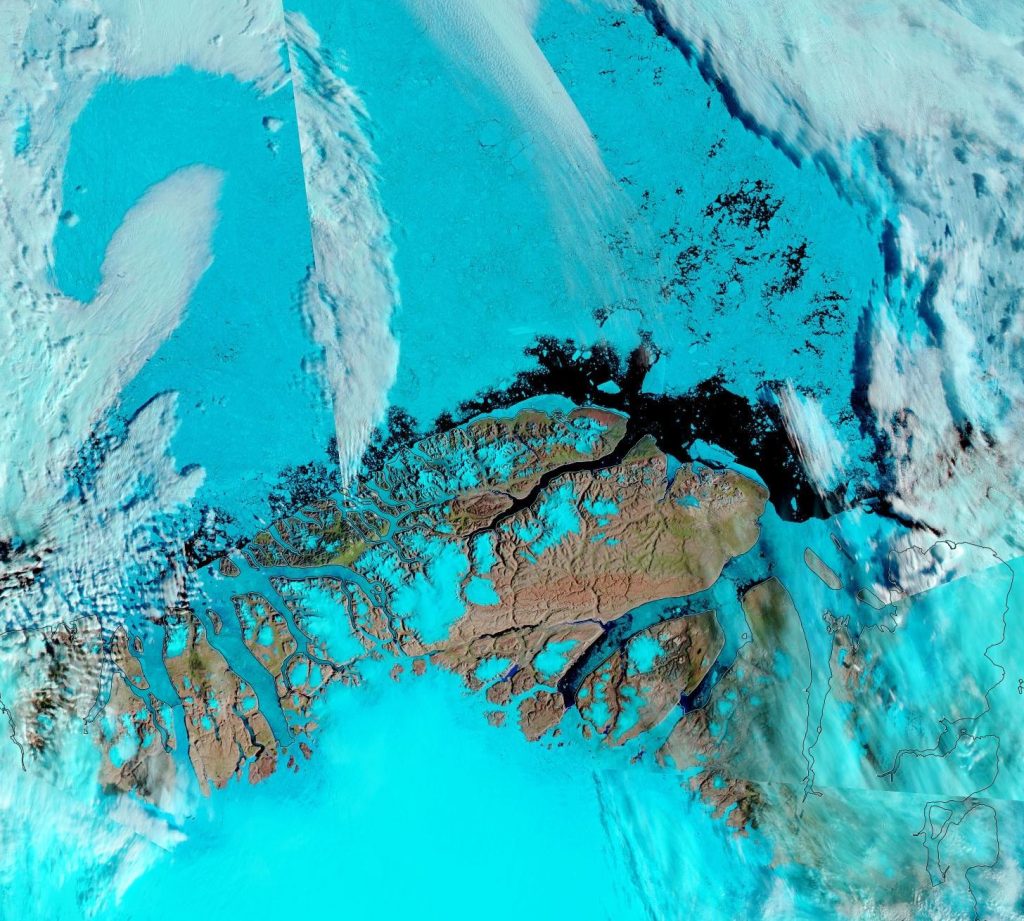
North of Greenland the clouds have cleared closer to the North Pole, to reveal this:
Fresh this morning from Terra, a rather cloudy view of the devastation near 80N, 150W:
[Edit – August 10th]
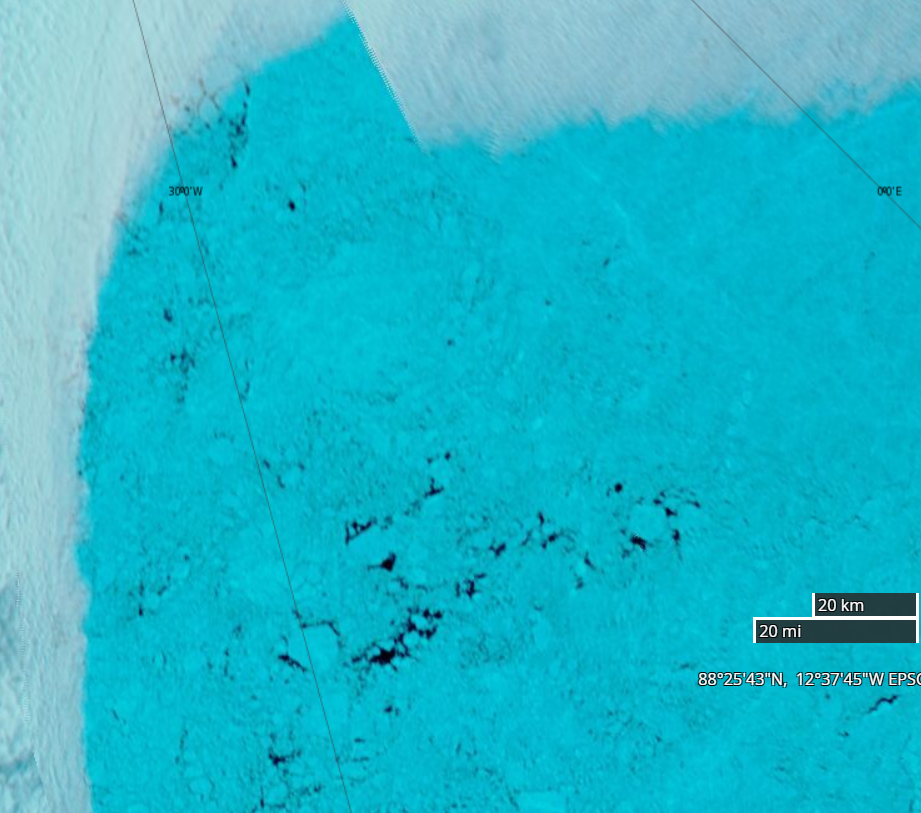
In a not entirely unexpected development one of ex Prof. Judy’s denizens is quibbling about the current condition of sea ice in the Arctic. Hence here is a close up of some “gaping holes in the sea ice cover” at 88N between Greenland and the North Pole:
[Edit – August 13th]
A nice clear view this morning of the marginal ice zone of the “Laptev Bite” and thereabouts from the Suomi satellite :
[Edit – August 16th]
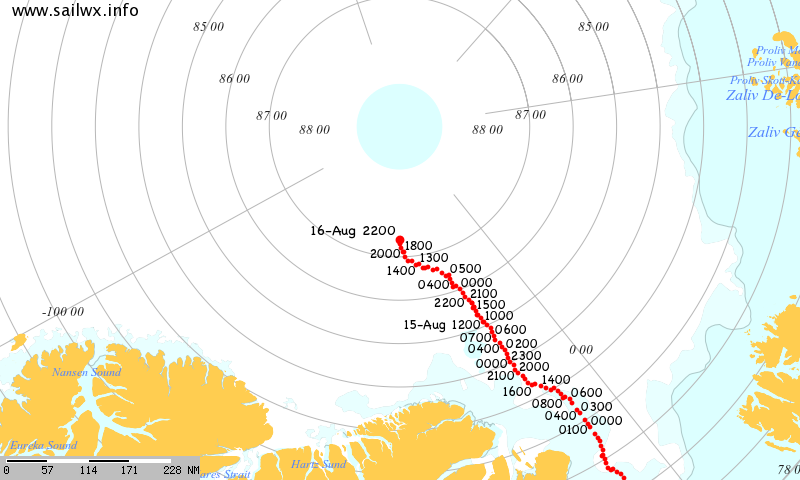
JAXA AMSR2 extent has fallen below 5 million km²:
Having been flushed out of the Central Arctic through the Fram Strait the polar research vessel Polarstern is back, seemingly intent on taking a close look at the North Pole:
[Edit – August 19th]
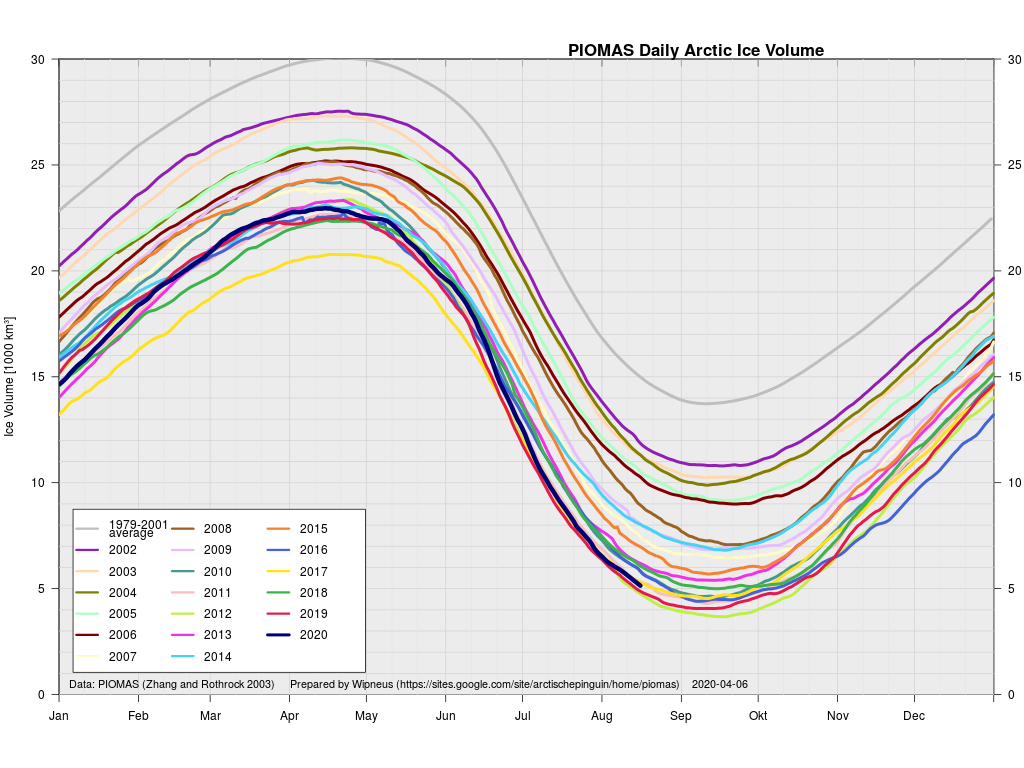
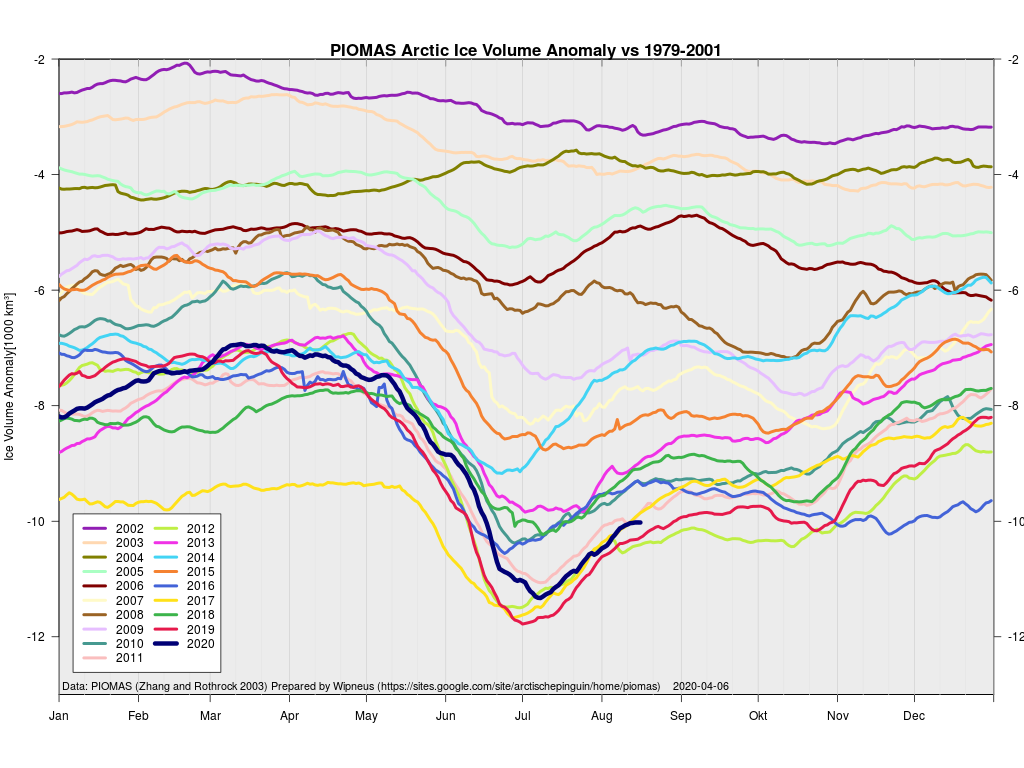
The mid month PIOMAS gridded thickness numbers have been published:
According to the Polar Science Center model Arctic sea ice volume is currently third lowest after 2012 and 2019.
[Edit – August 24th]
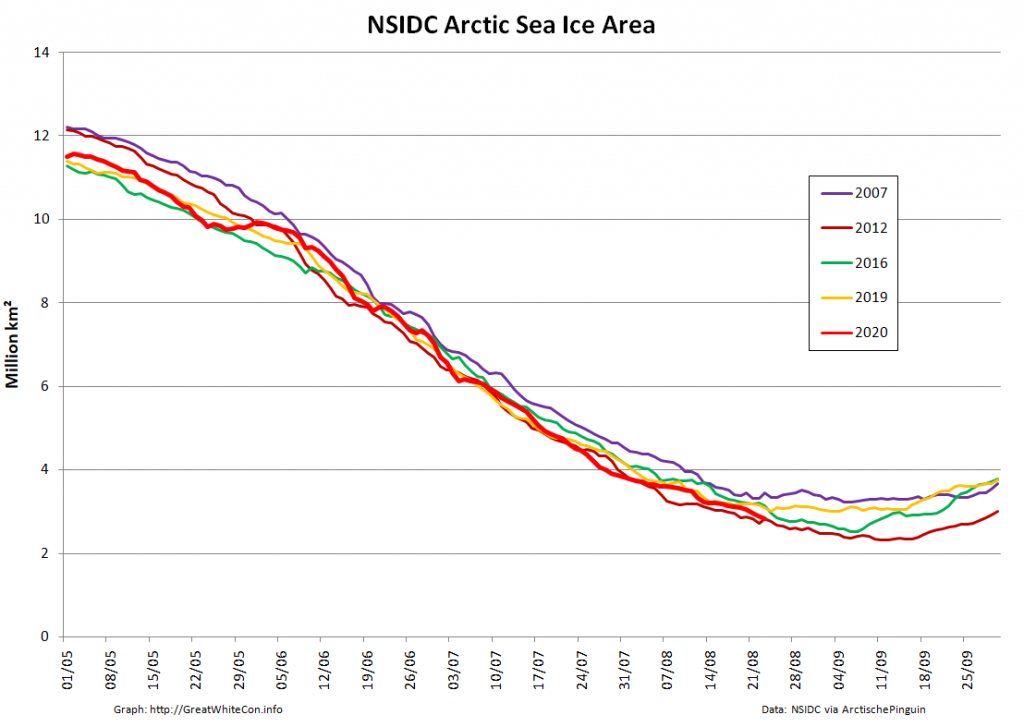
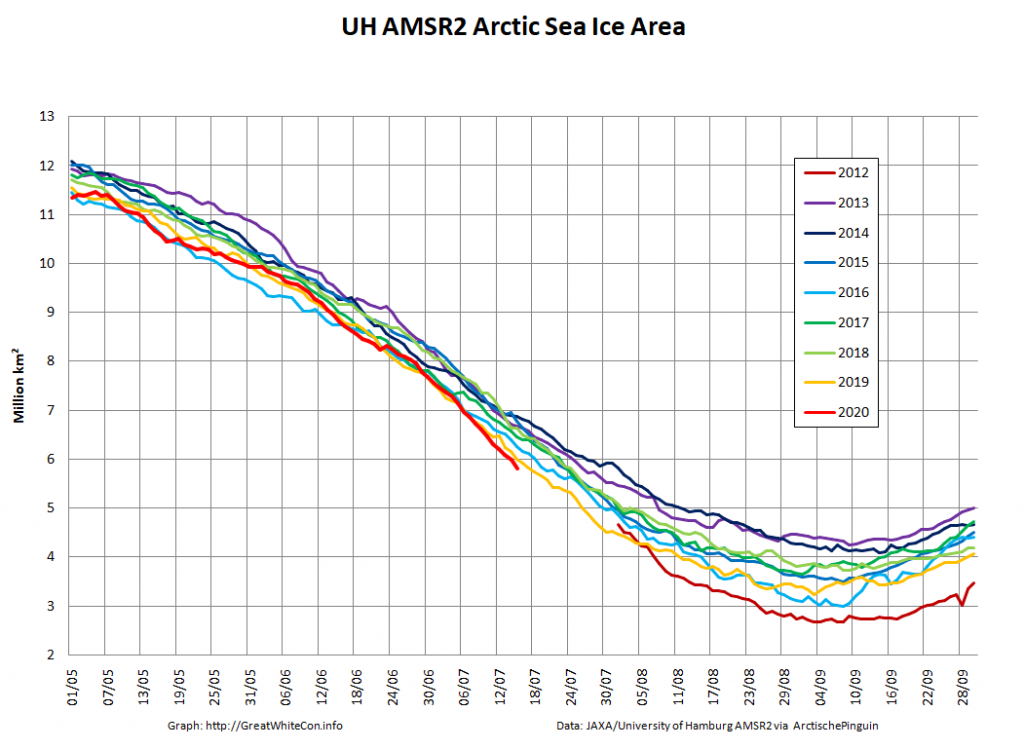
Arctic sea ice area based on NSIDC concentration data is now in a “statistical tie” with 2012 for the honour of “lowest for the date” in the satellite record:
High resolution AMSR2 area isn’t far behind:
[Edit – August 24th]
A nice clear view of the disintegrating sea ice north of the East Siberian and Chukchi Seas yesterday:
Watch this space very closely for the next few weeks!
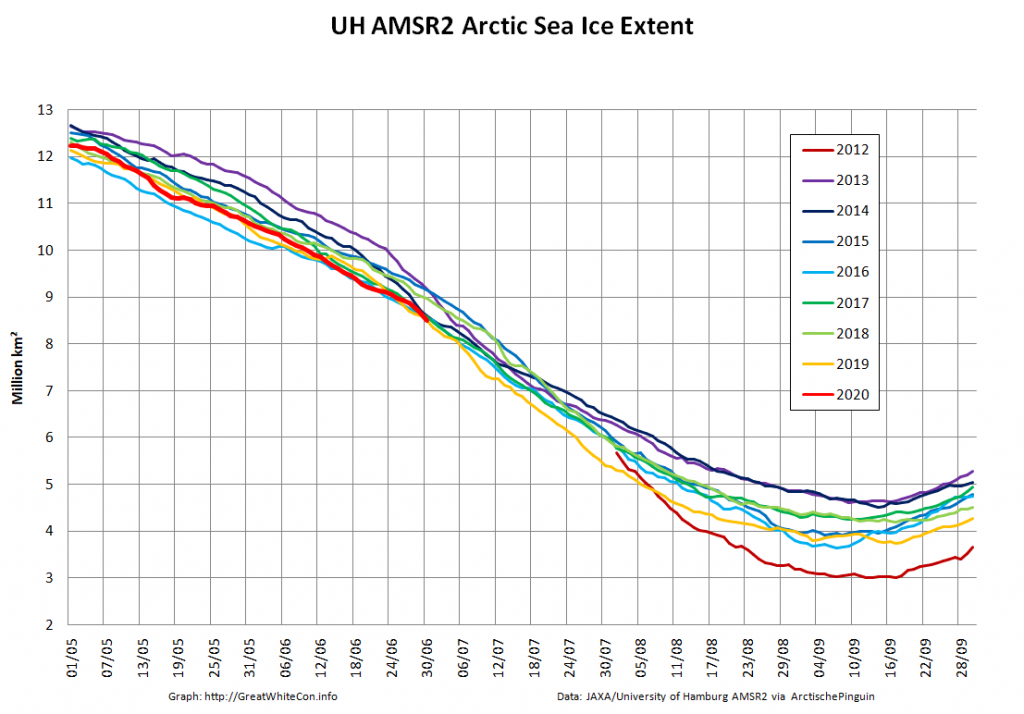
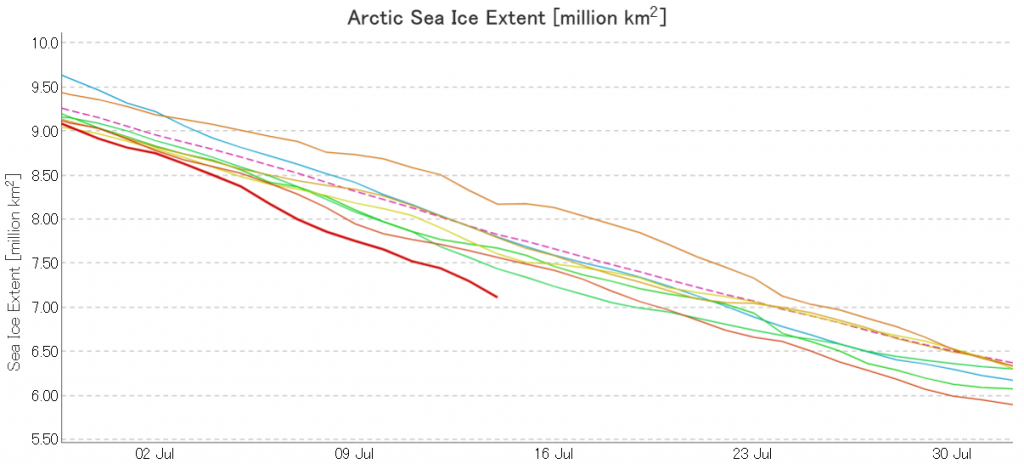
The new month starts with JAXA extent “lowest for the date in the satellite record” by a whisker:
The high resolution Arctic sea ice area and extent graphs based on the University of Hamburg’s AMSR2 concentration data are also in “statistical ties” for that honour, in records going back to 2013:
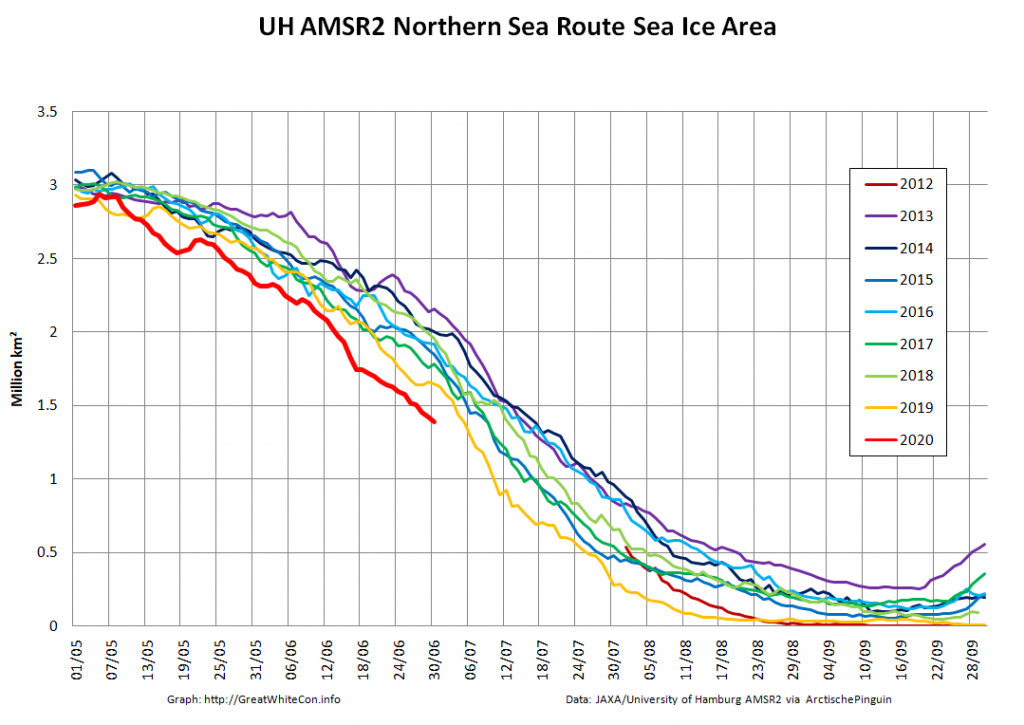
The 2020 melting season currently seems to be a game of two (geographical) halves. The sea ice on the Siberian side of the Arctic is currently at record lows:
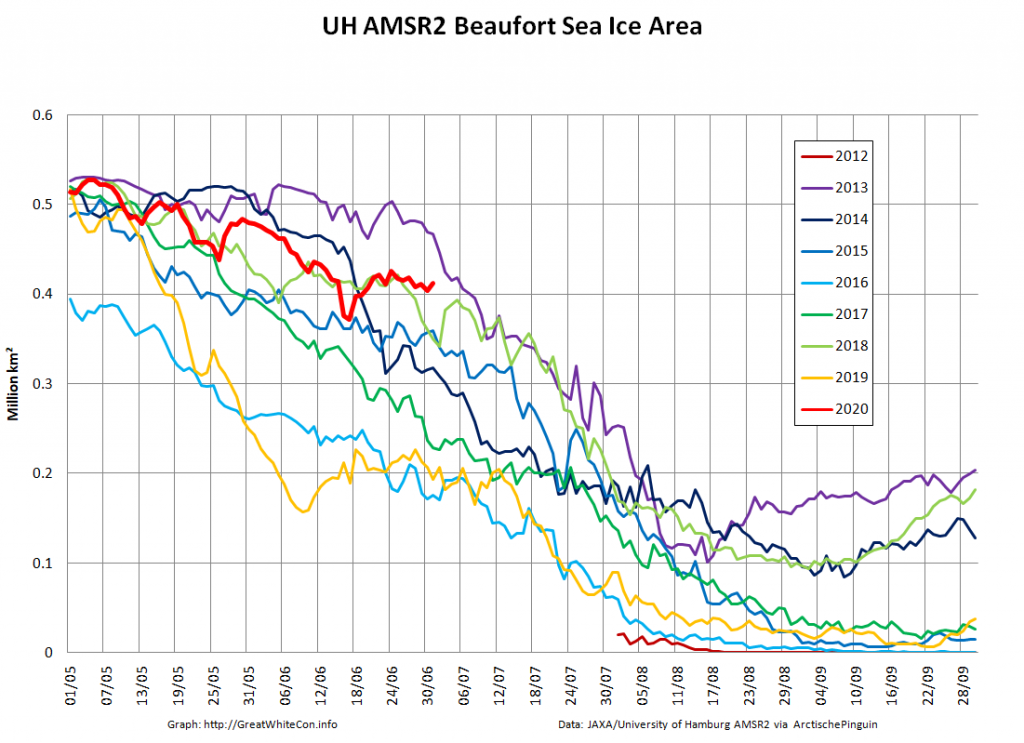
Whereas the Beaufort Sea is near a record high:
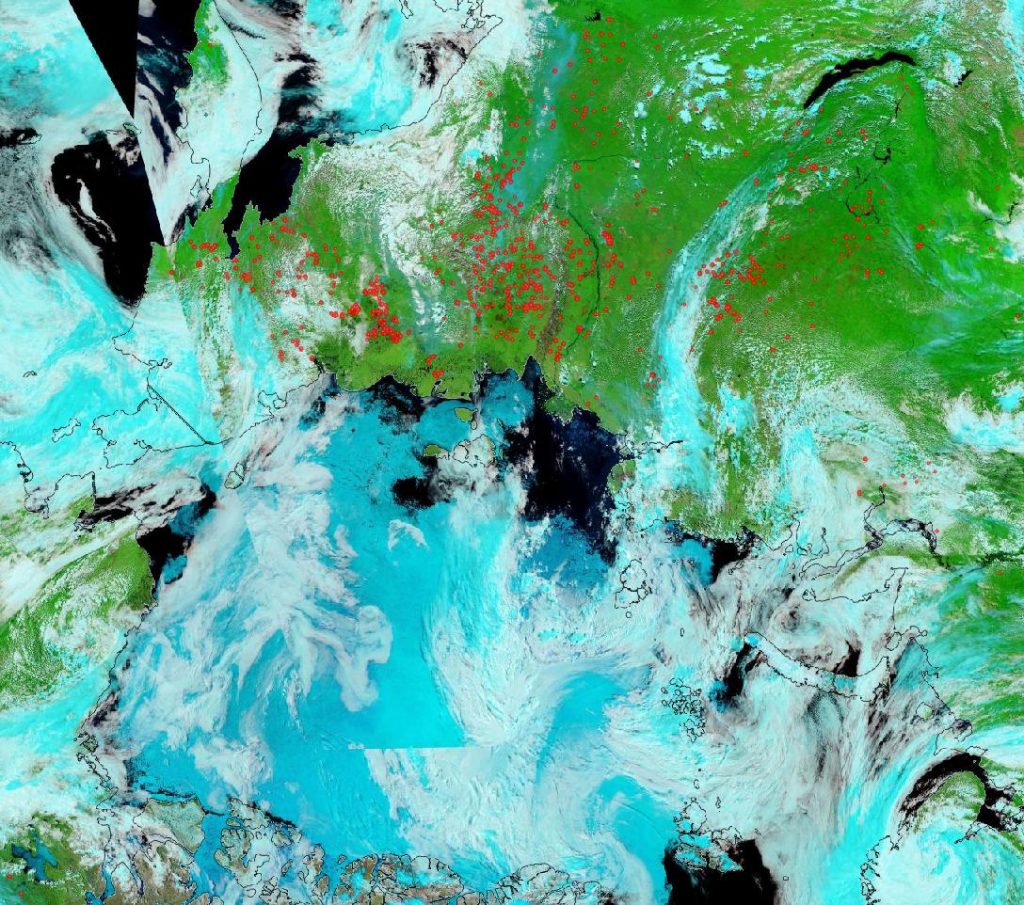
Currently the tell tale signs of surface melt are visible across most of the central Arctic, as are the large number of wildfires across Arctic Siberia:
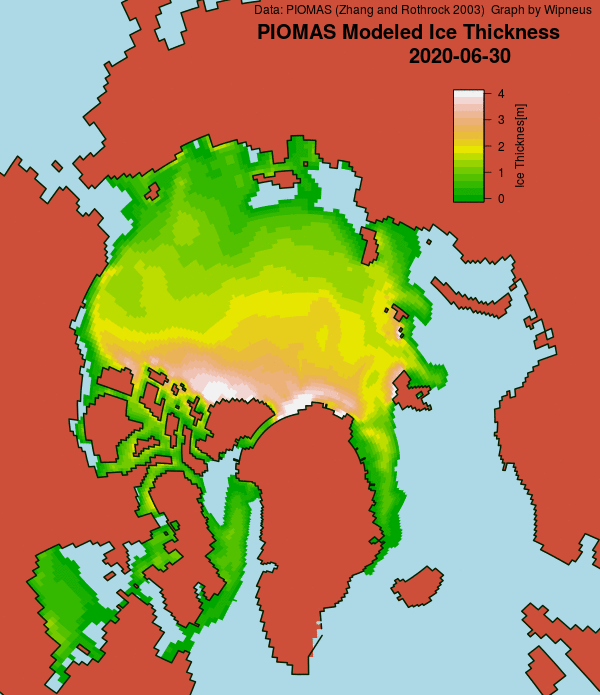
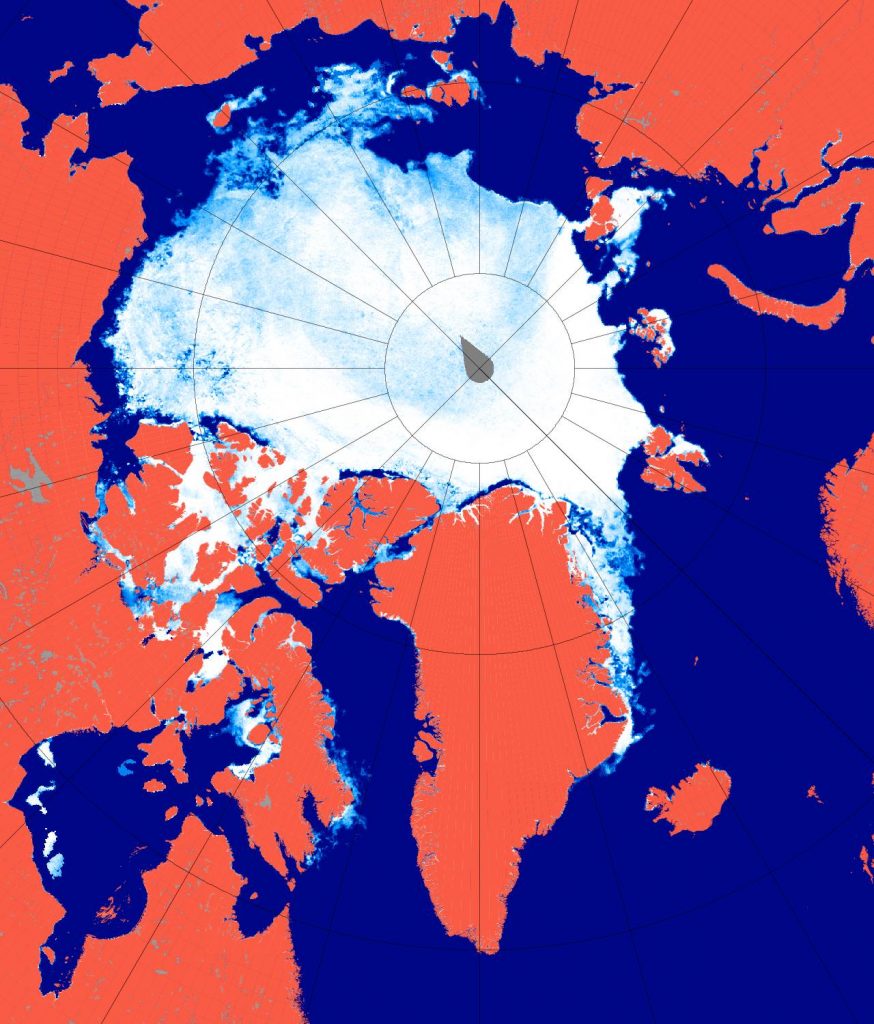
NASA Worldview “false-color” image of the Arctic on July 1st 2020, derived from the MODIS sensor on the Terra satellite
[Edit – July 4th]
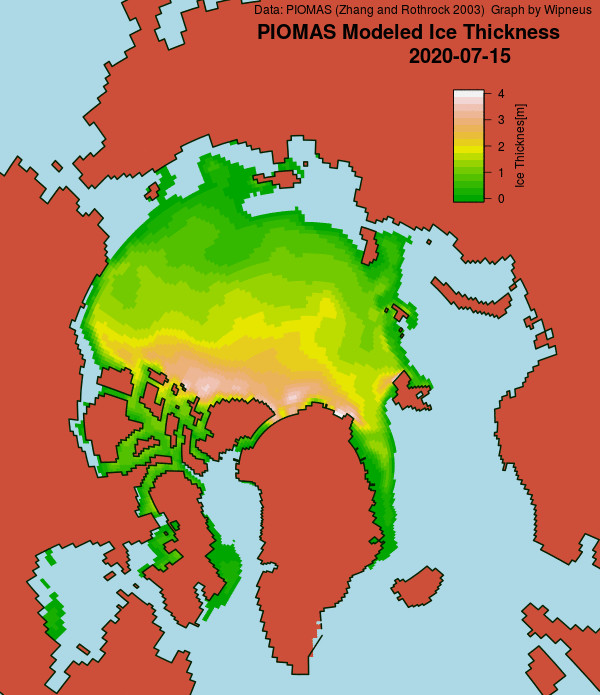
The June 30th PIOMAS gridded thickness numbers have been released, and here are the results of Wipneus’s number crunching:
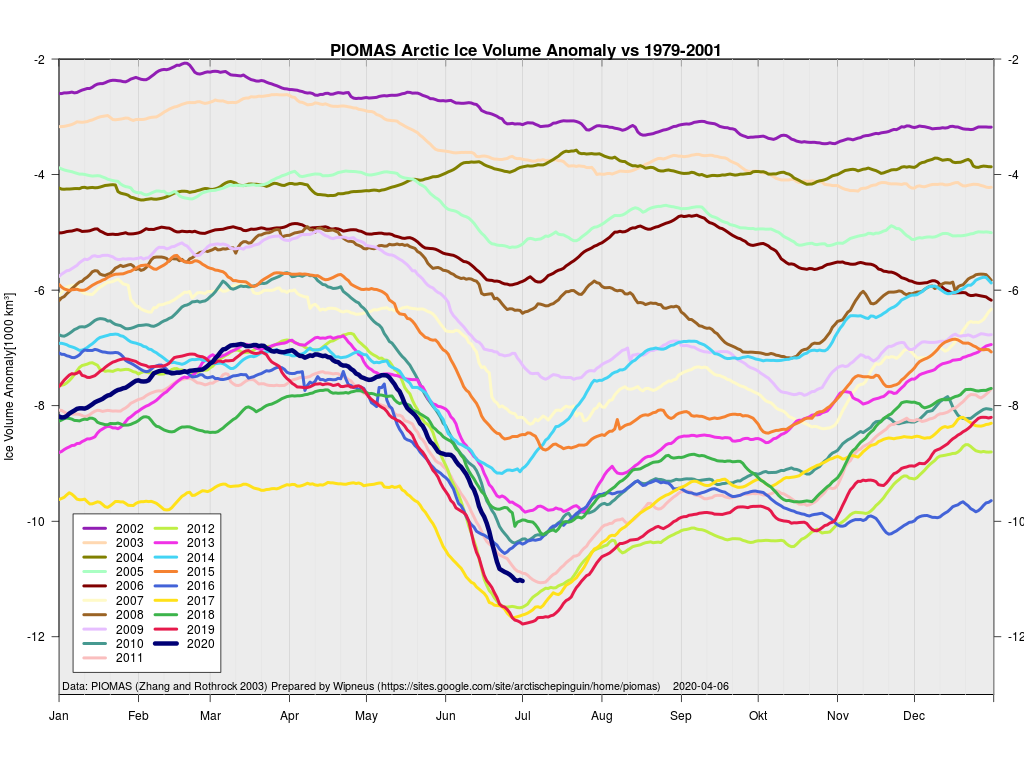
This month including a visualisation of the increasing negative anomaly:
[Edit – July 6th]
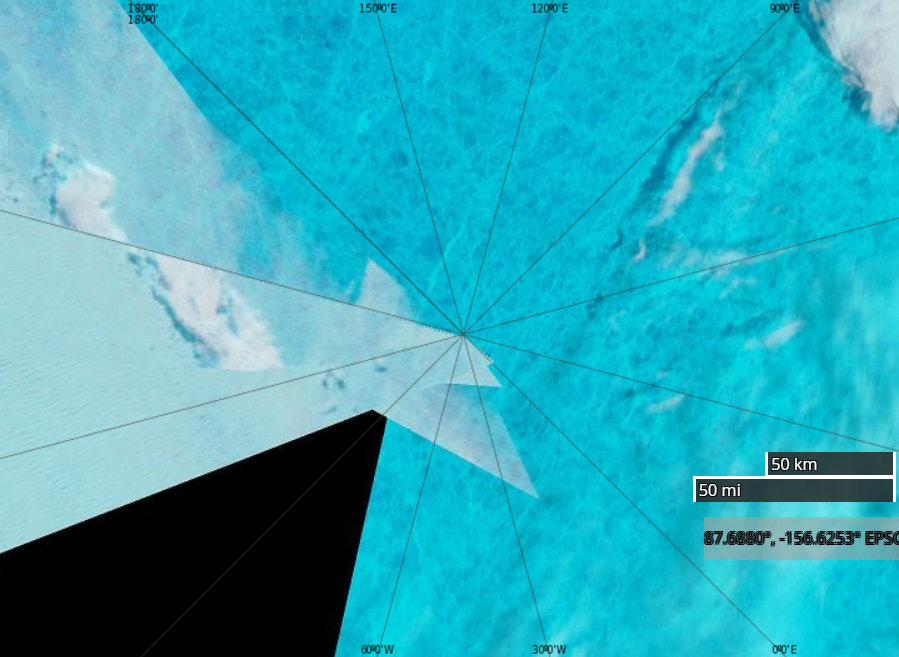
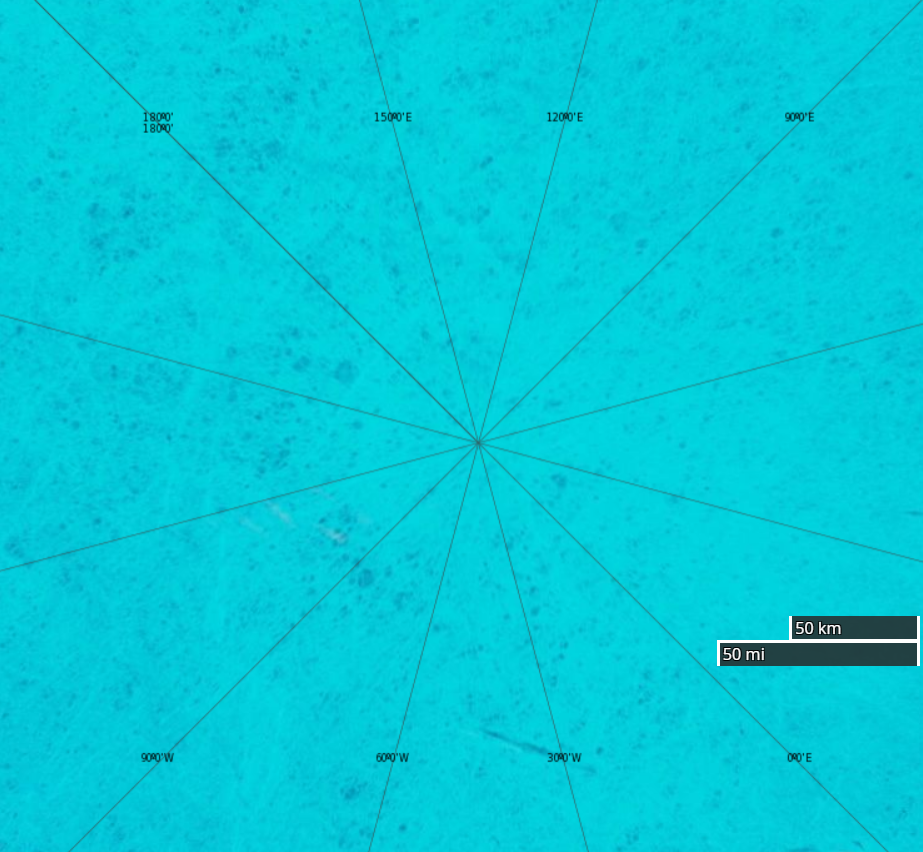
A break in the clouds over the North Pole reveals the onset of surface melt:
NASA Worldview “false-color” image of the North Pole on July 6th 2020, derived from the MODIS sensor on the Terra satellite
[Edit – July 8th]
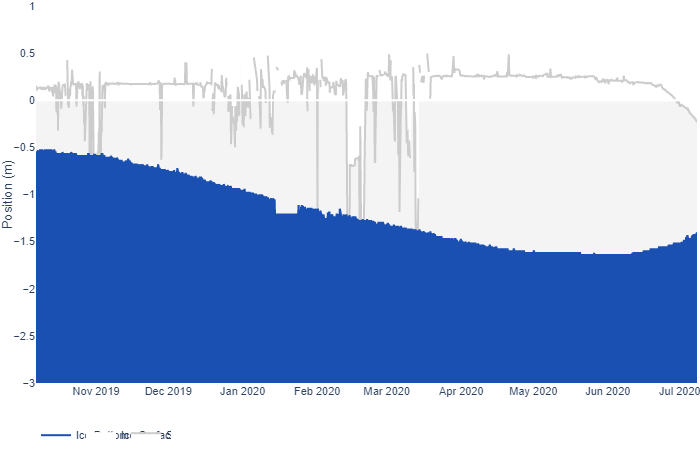
After a brief hiatus there are once again some ice mass balance buoys installed at assorted locations across the Arctic. Some have ceased to function, but one of the buoys installed as part of the MOSAiC expedition is still sending back data as it heads towards the Fram Strait. Buoy 387850 is currently located at 81.66 N, 4.19 E. Here’s its ice mass balance plot:
As you can see, both surface and bottom melt are well under way, with just over a meter of ice still remaining.
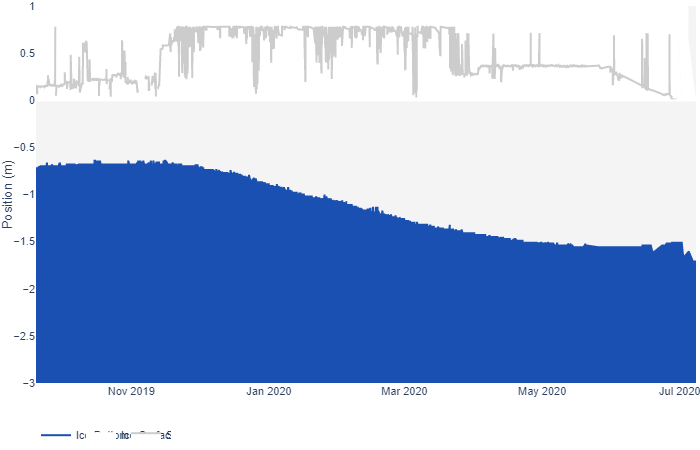
Now let’s take a look at buoy 386840, currently located at 74.30 N, 132.60 W in the Beaufort Sea:
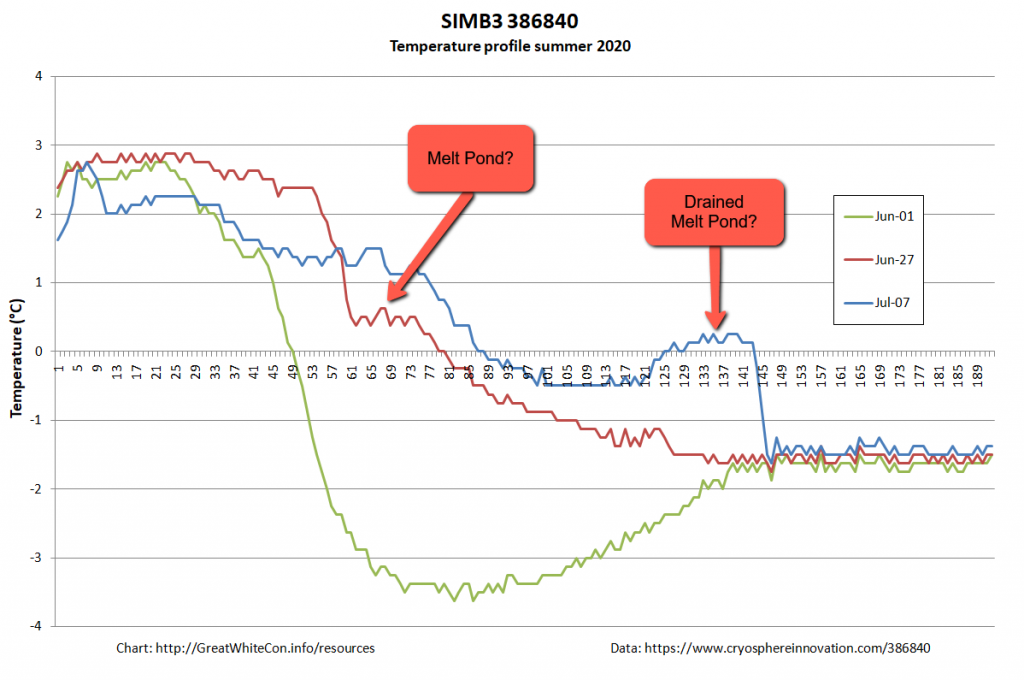
It looks as though the ice thickness has increased, but surely that can’t be right at this time of year? To try and find out I downloaded the raw data and plotted the temperature readings from the buoy’s thermistor string:
It looks to me as though the ice floe carrying the buoy is currently floating on some warm fresh water from a recently drained melt pond, which is confusing the sensor designed to measure the position of the bottom of the ice. There certainly seems to be far less than the claimed “1.653 m snow and ice thickness” still remaining to be melted!
[Edit – July 15th]
A very unusual image. Hardly a cloud in the sky over the North Pole yesterday:
NASA Worldview “false-color” image of the North Pole on July 14th 2020, derived from the MODIS sensor on the Terra satellite
The July 2020 extent “plummet” shows no signs of ending just yet. Here’s the JAXA/ViSHOP version:
[Edit – July 17th]
JAXA AMSR2 extent is now below 7 million km², and the high resolution version is lower still:
As the “Laptev Bite” and the Atlantic periphery of open water extends further towards the North Pole, Central Arctic Basin extent is now also at record lows for the date in the AMSR2 record:
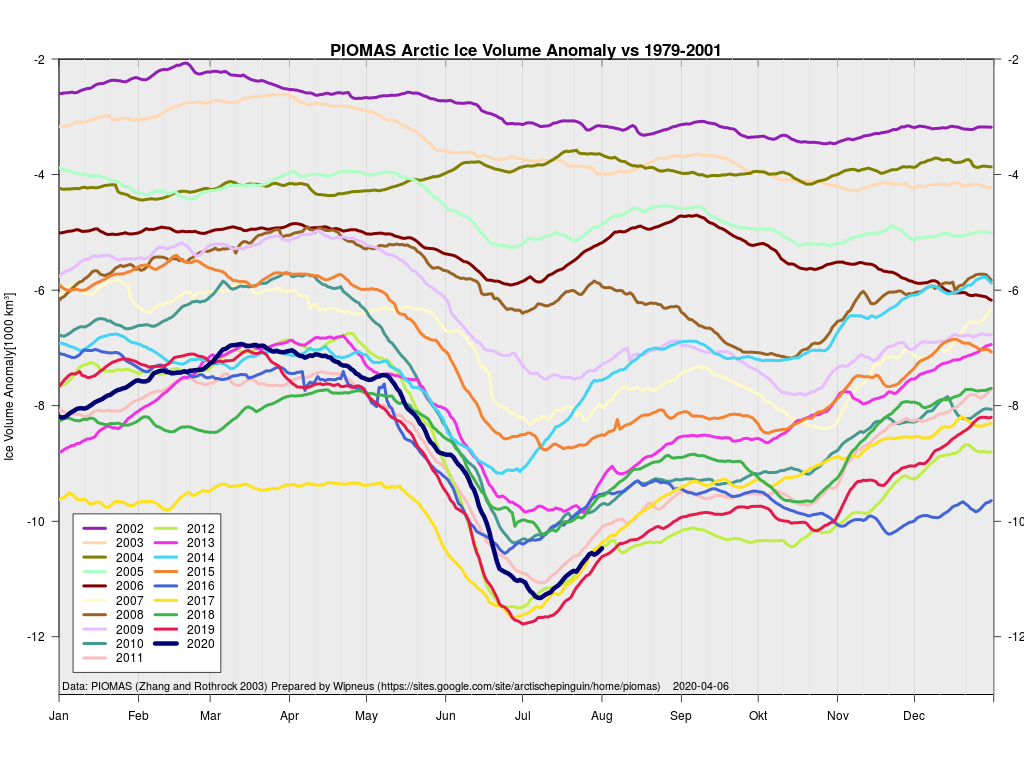
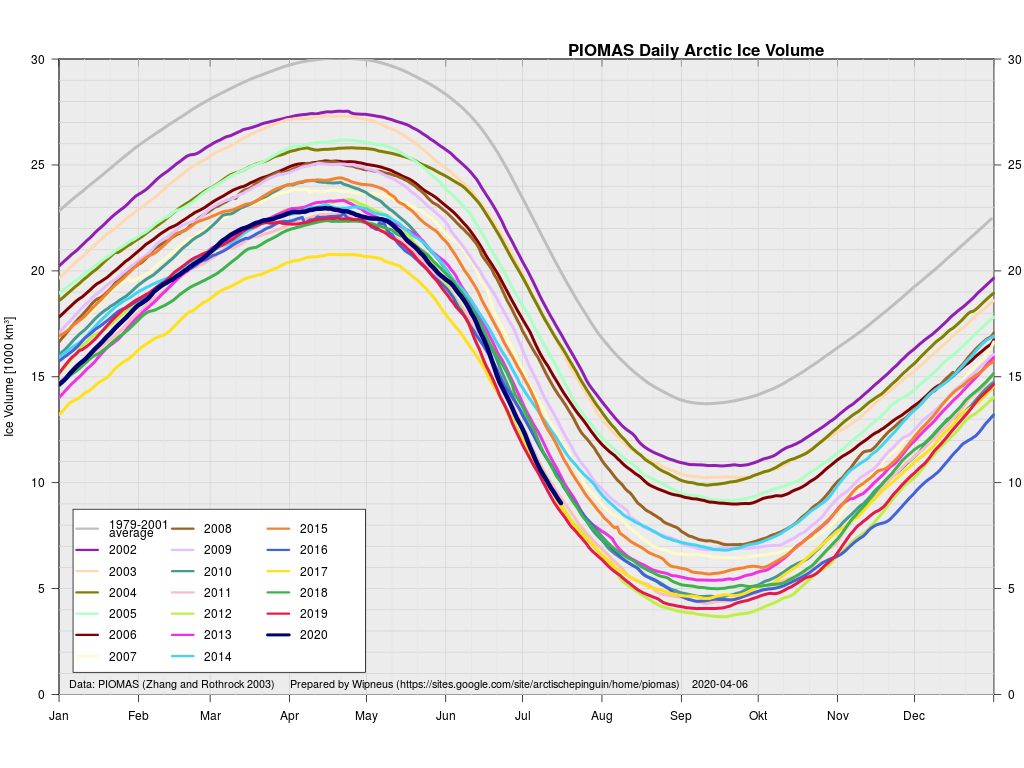
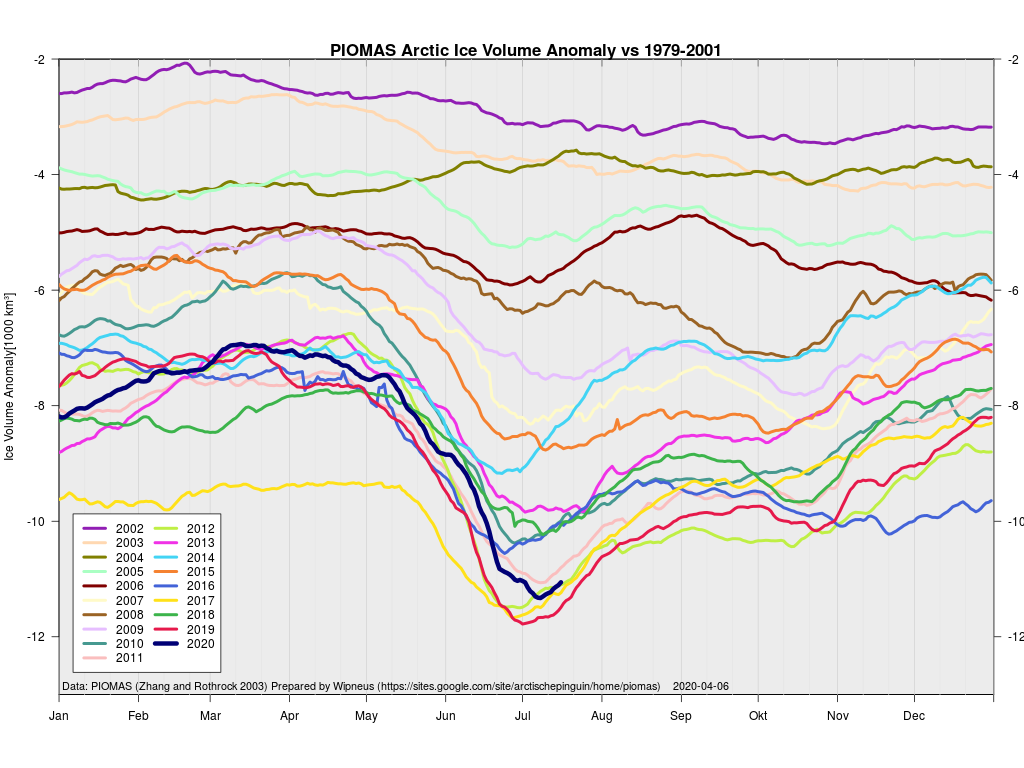
Extent is currently lowest in the satellite era by a long way, but modelled volume is only fourth lowest!
Watch this space!
[Edit – July 21th]
At long last there’s a sub 1000 hPa MSLP low pressure area slowly wending its way across the central Arctic:
It seems to have bottomed out at 997 hPa. Perhaps this will inhibit the ongoing “plummet” in extent? JAXA extent fell by 114,342 km2 yesterday.
[Edit – July 23rd]
The Northern Sea Route has opened unusually early this year:
Based on the AMSR2 concentration maps from the University of Hamburg that happened on July 13th. The final choke point, as is so often the case, was the Vilkitsky Strait. According to the charts from the Russian Arctic and Antarctic Research Institute, by the 14th there was a narrow way through occupied by no more than 3/10 concentration ice:
[Edit – July 25th]
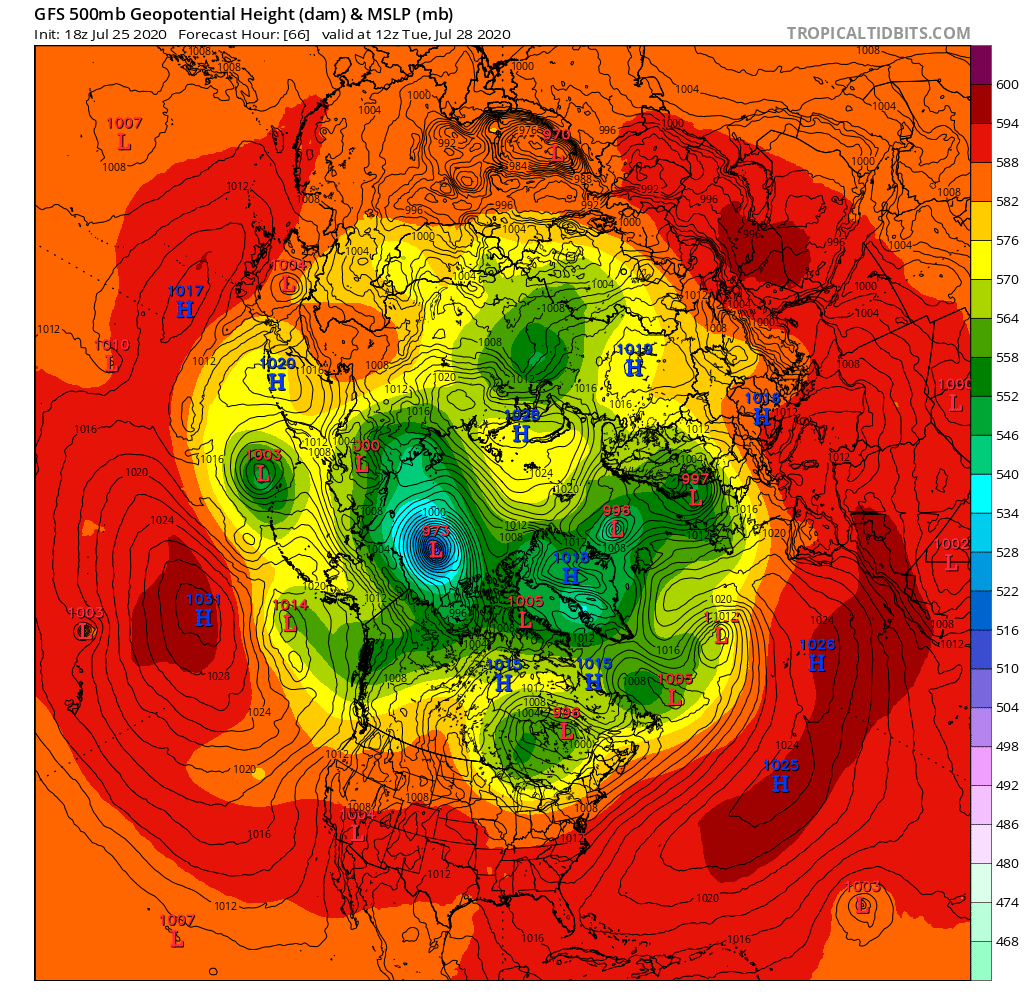
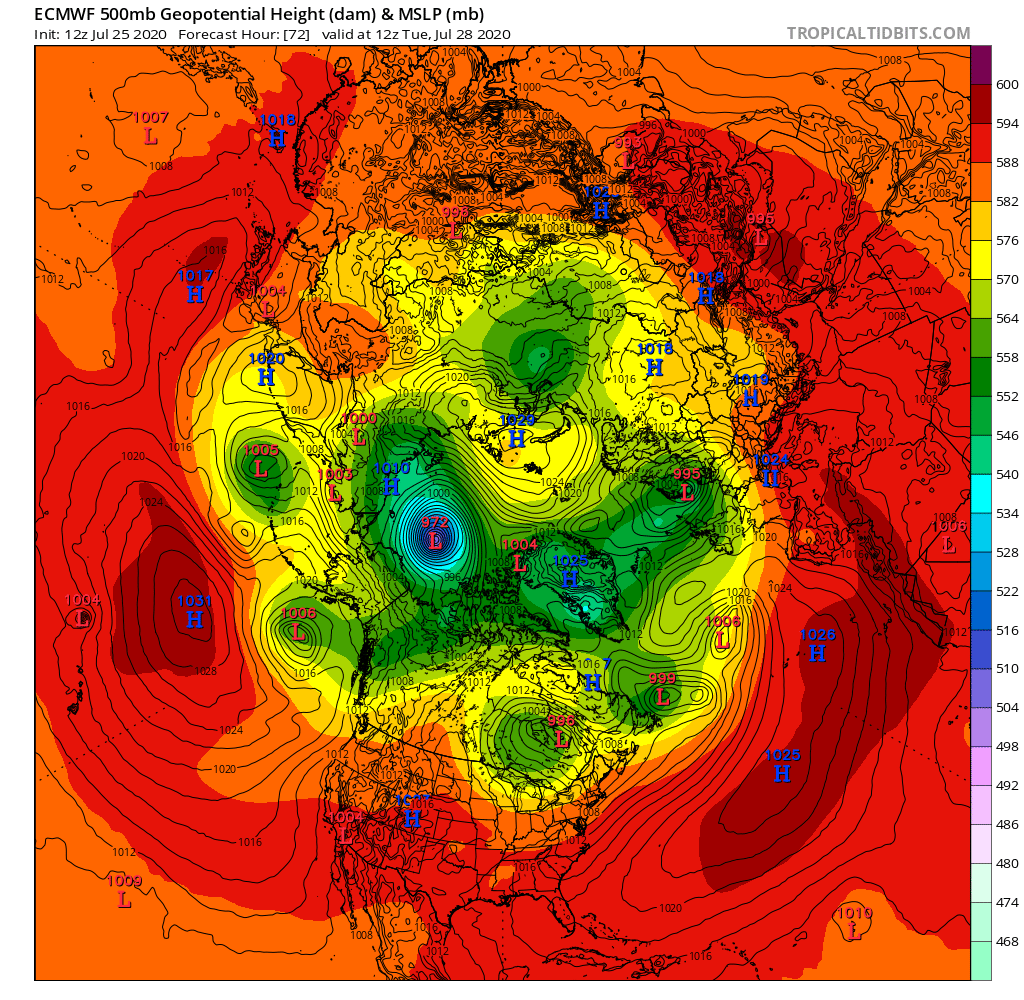
A mere three days away, and the GFS and ECMWF forecasts are in agreement, so there is a decent chance this setup will materialise in the real world:
A 972(ish) hPa MSLP cyclone sitting over the ice Beaufort Sea by 12Z on Tuesday.
[Edit – July 27th]
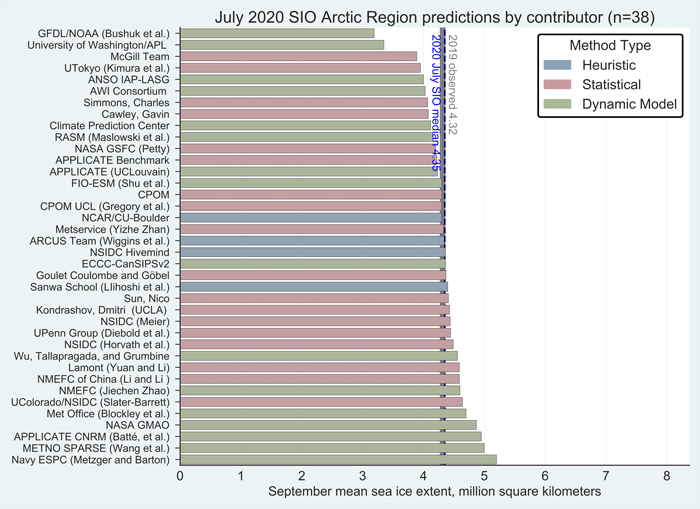
The Sea Ice Prediction Network July forecast for this year’s September minimum extent have been released. Here’s the graphical overview:
This year’s median projected value from the July forecasts of 4.3 million square kilometers is essentially identical to the median from the June forecasts. Quartiles are 4.1 and 4.6 million square kilometers. As was also the case for June, only two projections, both by dynamic models, are for a new record low, below the mark of 3.57 million square kilometers set in 2012. One dynamical model predicts the September sea-ice extent above 5.0 million square kilometers, compared to two in the June report.
Note that the numbers quoted are for the average NSIDC extent across the month of September, not the lowest daily JAXA extent, which I suggested earlier would be “below 4 million km²” this year.
Meanwhile over on Twitter this evening (UTC):
Stronger summer Arctic storms seems to be a consequence of climate change. But a deep cyclone in the central Arctic can help to accelerate sea ice melt even further.
The MSLP of the (Great?) Arctic cyclone sank below 970 hPa overnight:
After a fitful night's sleep what with one thing and another I wake to find that the (great?) #Arctic cyclone of July 2020 has sunk to a new low of 969 hPa.
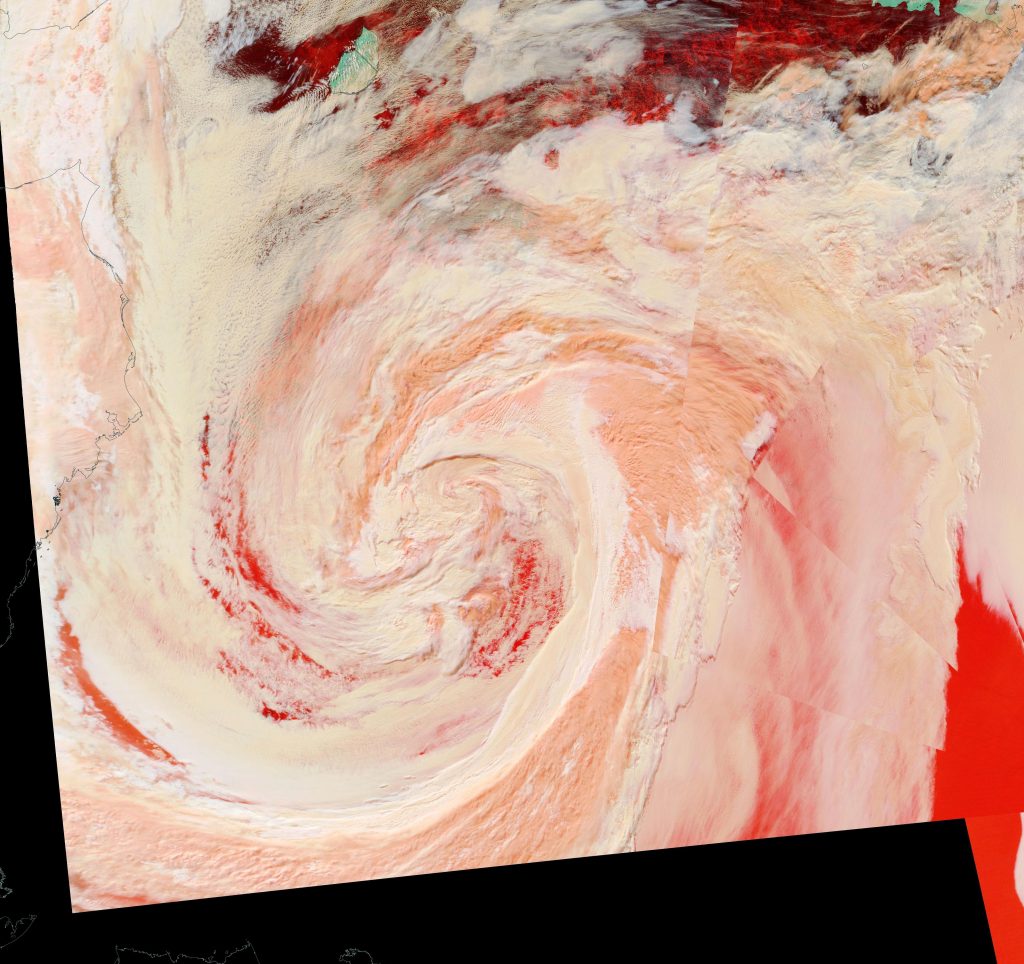
Here’s an early false colour snapshot of how (s)he looks from on high this afternoon (UTC), courtesy of the MODIS instrument on the Terra satellite:
[Edit – July 29th]
First up today we have a more complete “true colour” image of the cyclone doing its worst yesterday, including a fairly clear view in the bottom left corner of the initial damage to the sea ice covering the eastern Beaufort Sea. This one is from the Aqua satellite:
Our title for today refers back to the Great Arctic Cyclone of August 2012. There has been some speculation over on the Arctic Sea Ice Blog about whether a similar event is about to occur this year.
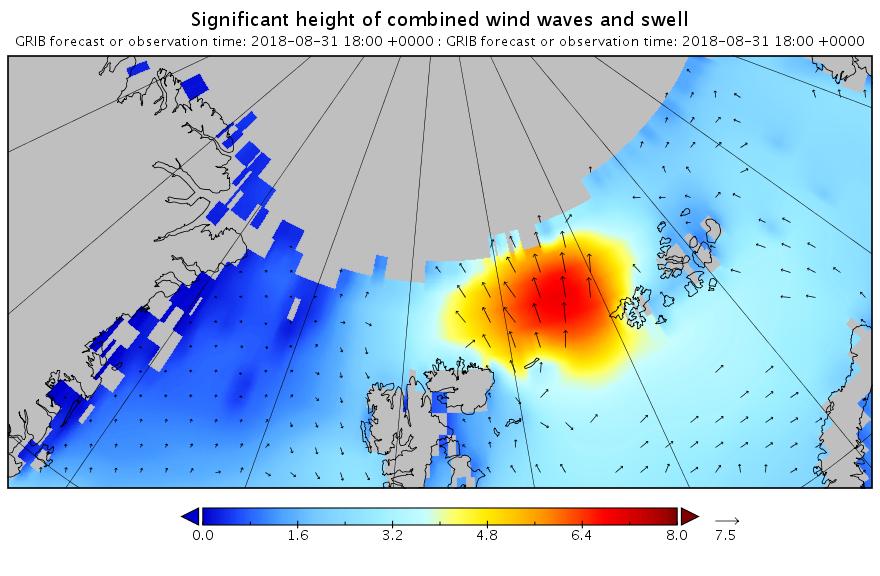
It’s later in the season of course, but as is our wont we always look at the waves first. Here is the current WaveWatch III forecast for the evening of August 31st UTC:
In summary the forecast shows some very large waves with a substantial period for inside the Arctic Circle directed straight at the ice edge. Let’s follow the forecast over the next few days carefully shall we?
[Edit – August 30th]
The latest wave forecast for tomorrow evening isn’t as extreme as 3 days ago. Note the change in the significant height scale:
Nonetheless the height and period are still very significant!
[Edit – August 31st]
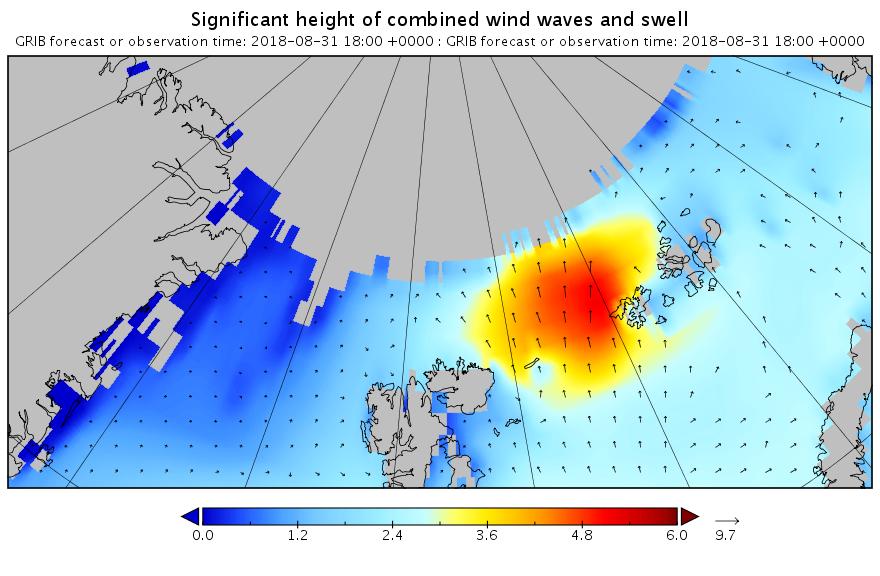
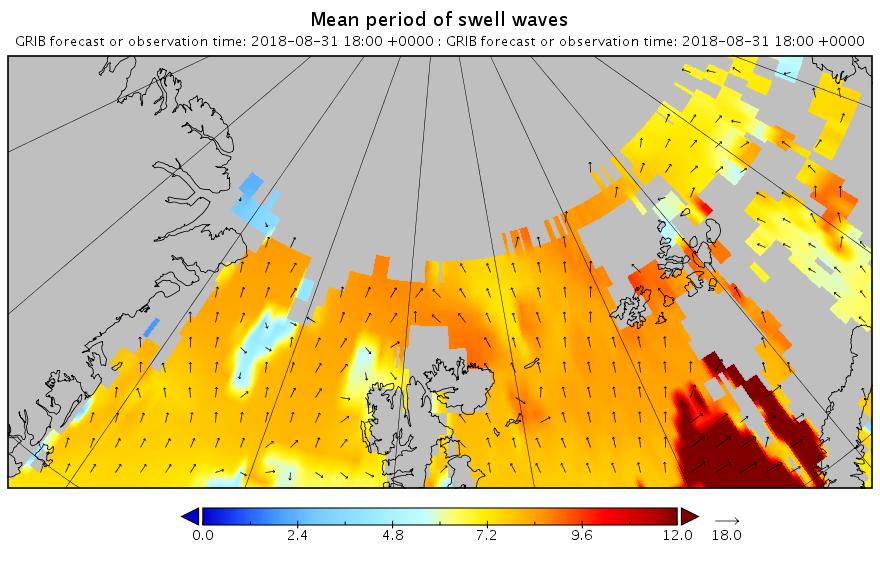
Here’s the latest forecast for 6 PM this evening (UTC):
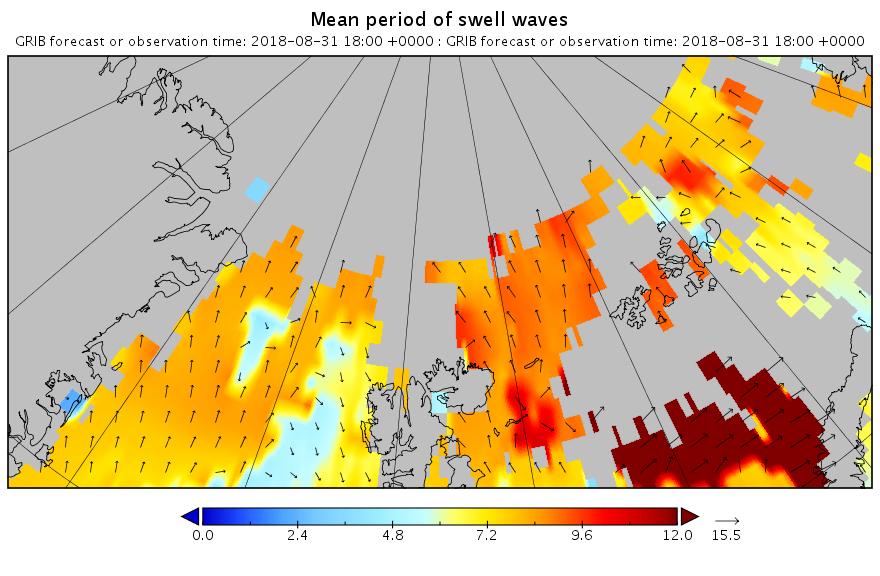
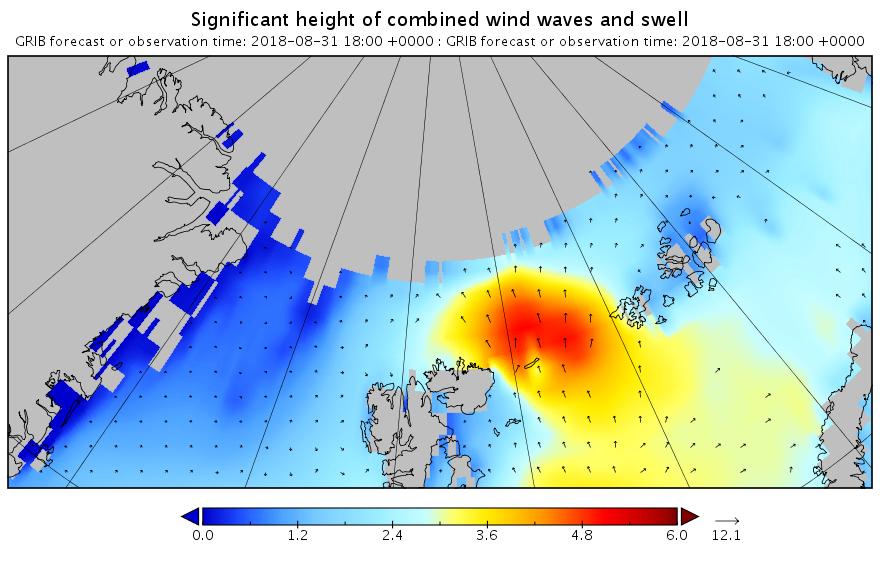
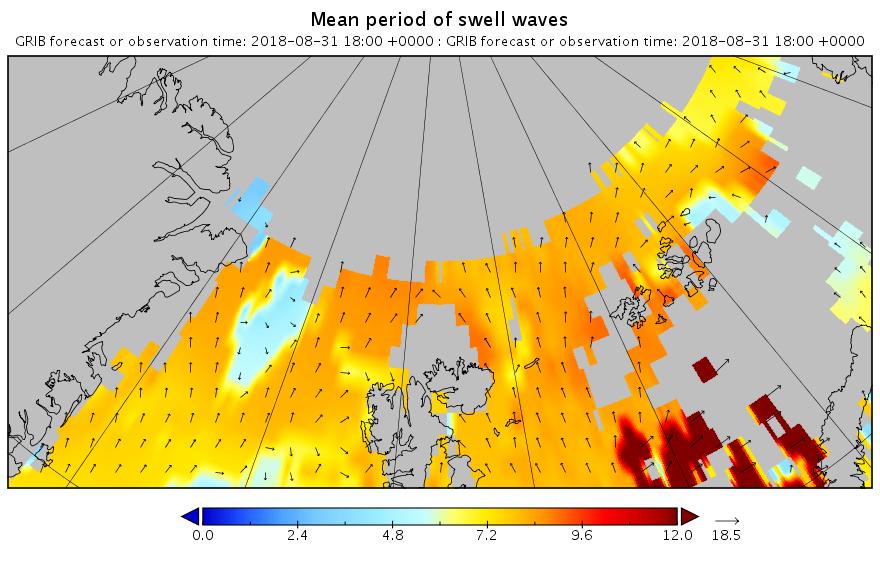
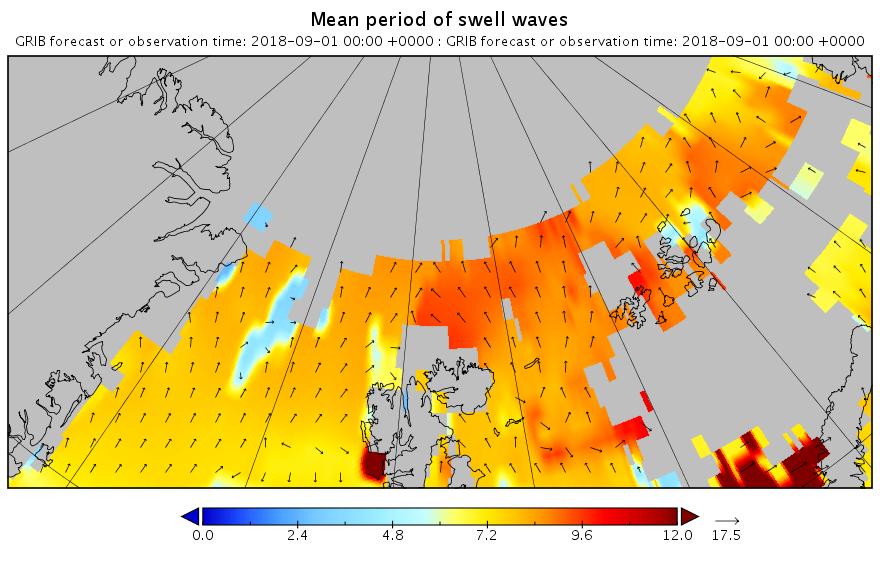
Note how the open water across almost the entire map is full of what in the Arctic counts as a long period swell. That means that the forecast for 2 days later looks like this:
Less height but with a longer period. All of which means that the sea ice north of the Atlantic Ocean isn’t about to receive a short sharp shock. It has a sustained battering lasting several days to look forward to.
[Edit – September 1st]
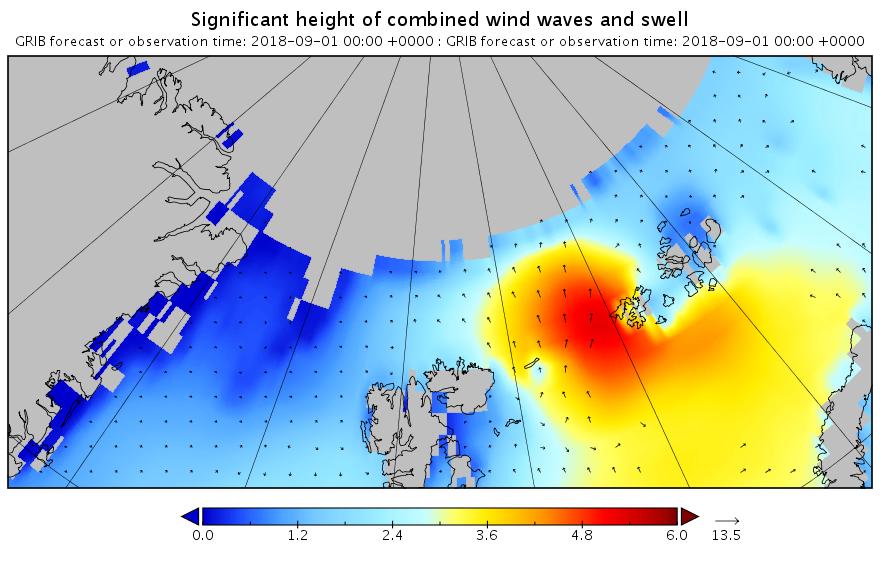
The barrage of assorted swells has begun. Here’s the “hindcast” from midnight last night UTC:
Now lets take a look at tomorrow’s forecast for the Laptev Sea. This is for 09:00 UTC:
Note once again the change of scale on the wave/swell height map. Nevertheless a 3+ meter swell heading over into the East Siberian Sea isn’t something you see every day.
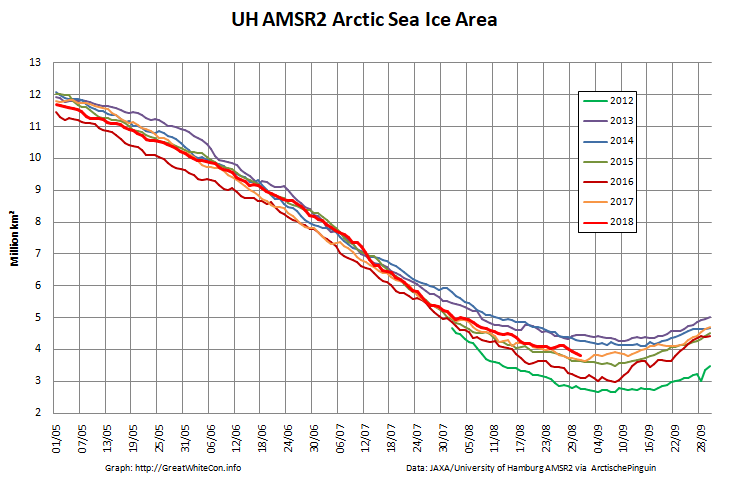
Now were into September the 2018 annual minimum extent can’t be too far away. Extent decline appears to have stalled. However “high res” AMSR2 area is currently falling fast, for the time of year at least:
[Edit – September 2nd]
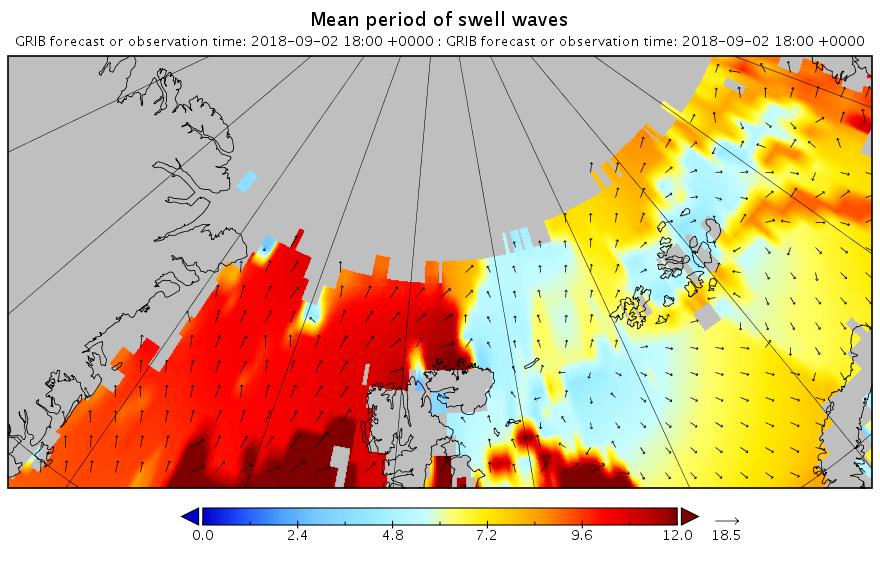
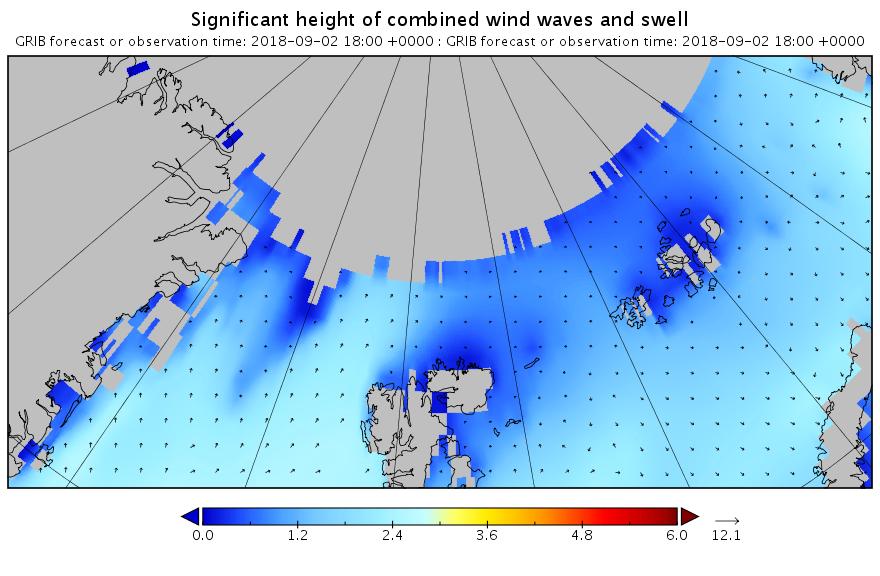
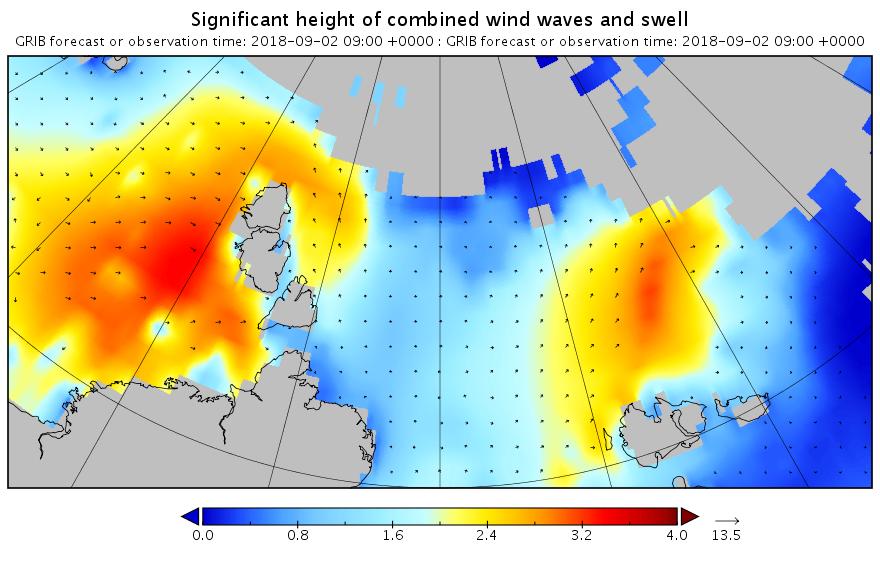
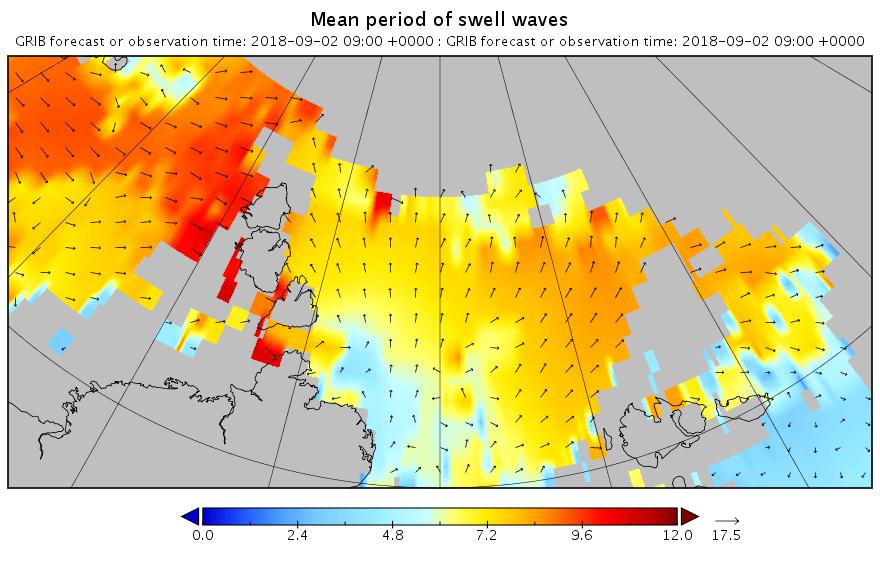
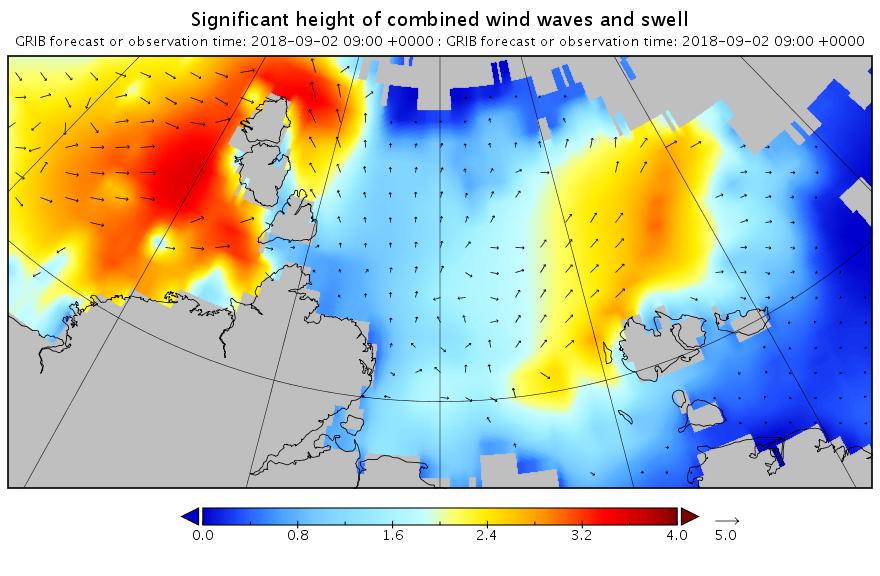
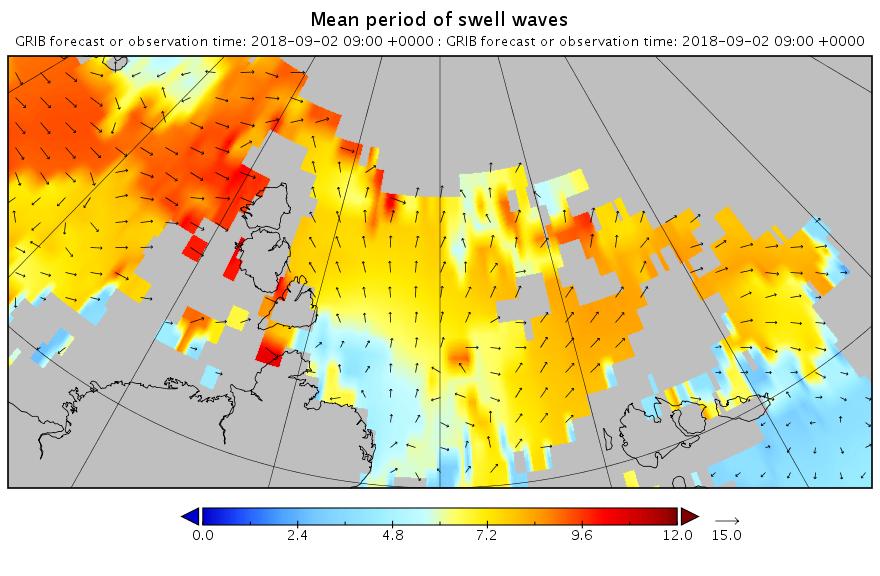
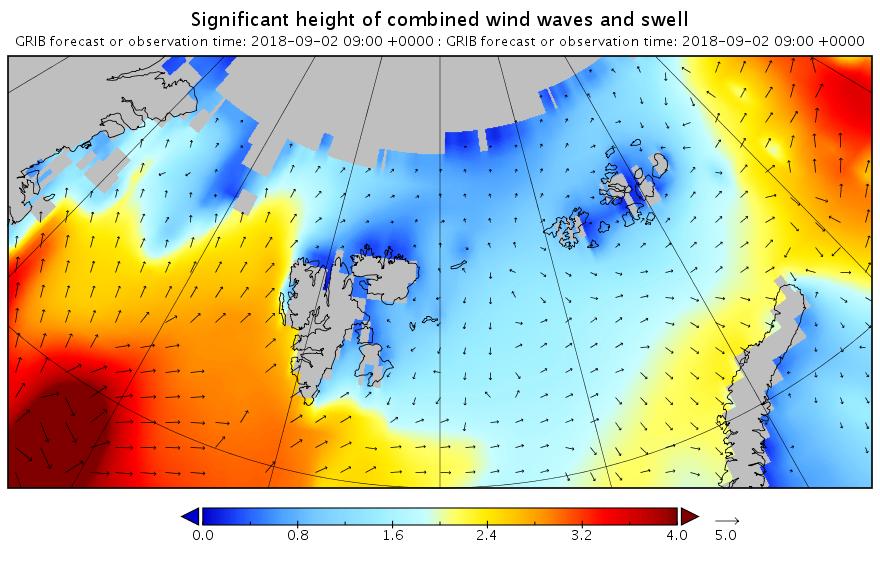
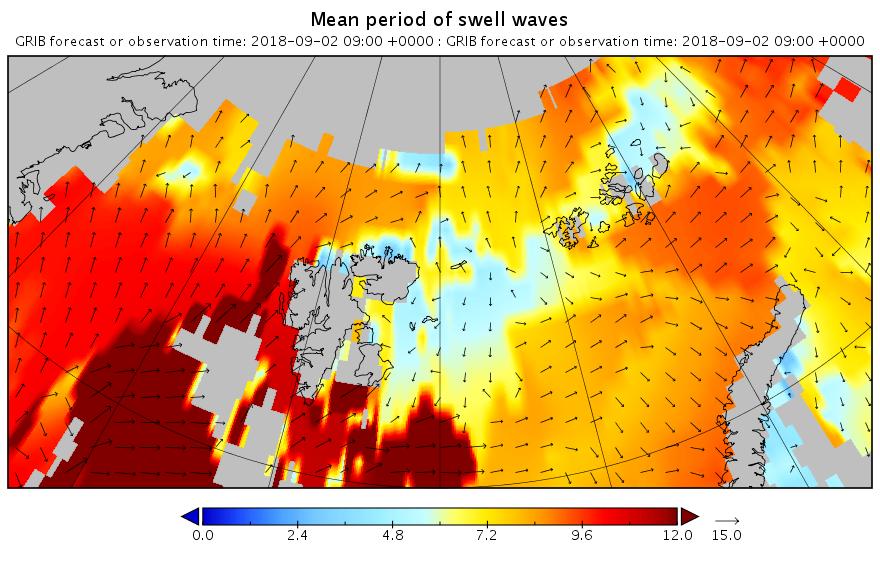
Here are the swell and period forecasts at midnight for round about now, 09:00 UTC:
All the seas between Greenland and the New Siberian Islands are awash with swells with a period of 8 second or greater. This is most unusual, to put it mildly!
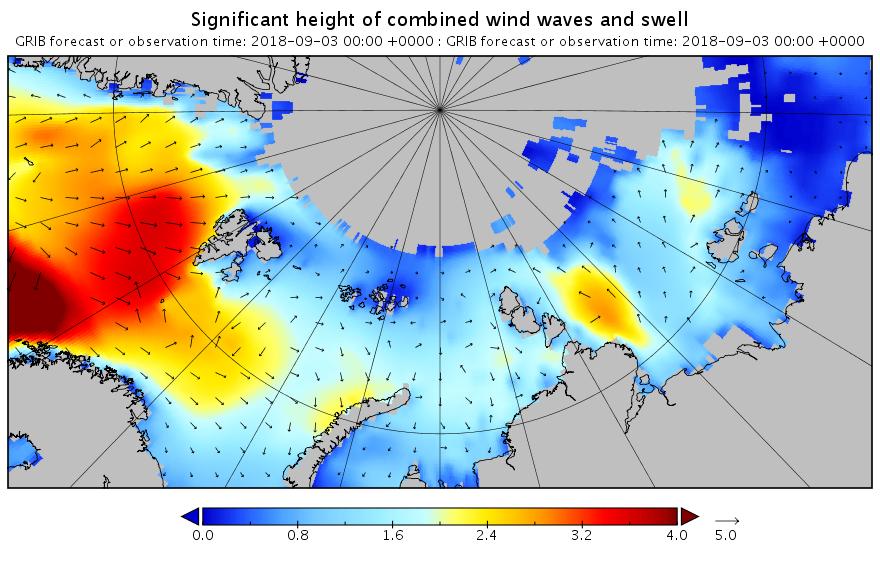
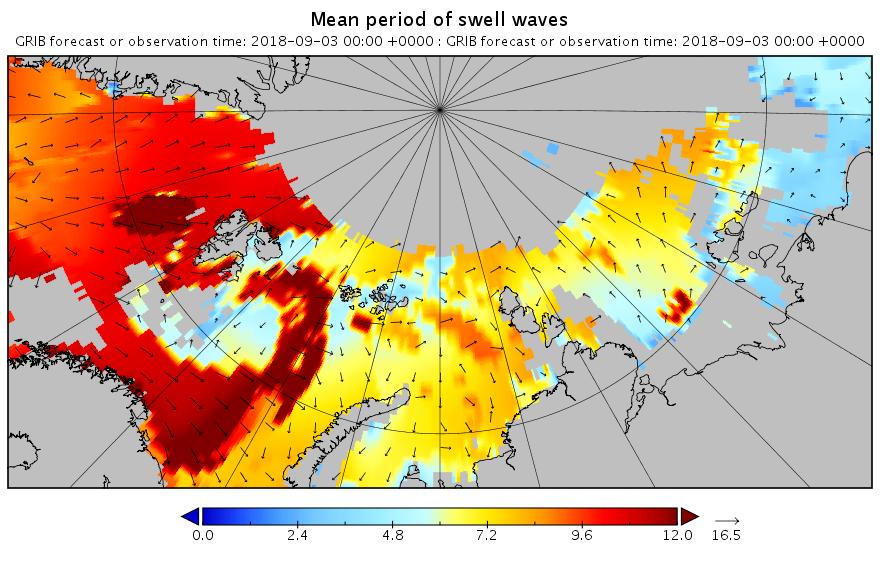
[Edit – September 3rd]
Here’s the WaveWatch III “hindcast” from midnight last night UTC for the Russian side of the Arctic Ocean:
There are still significant swells almost everywhere you look.
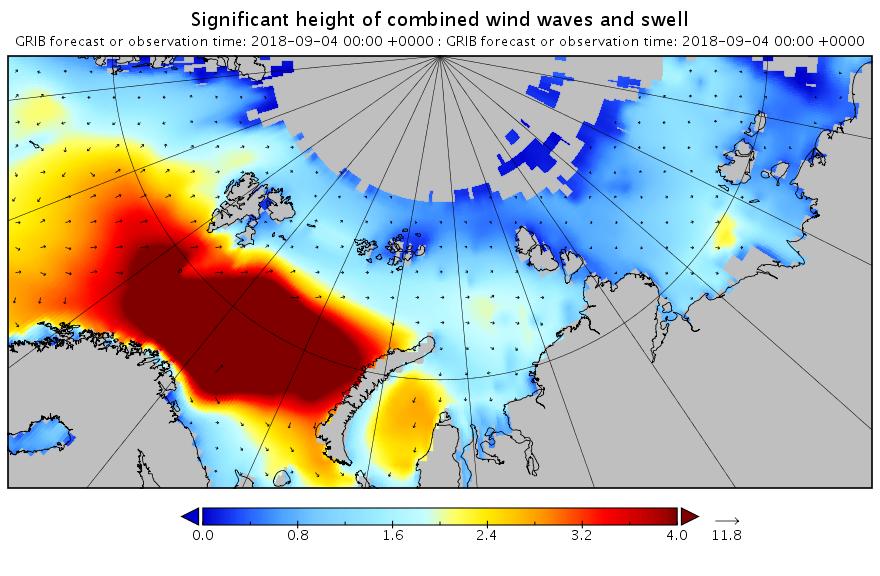
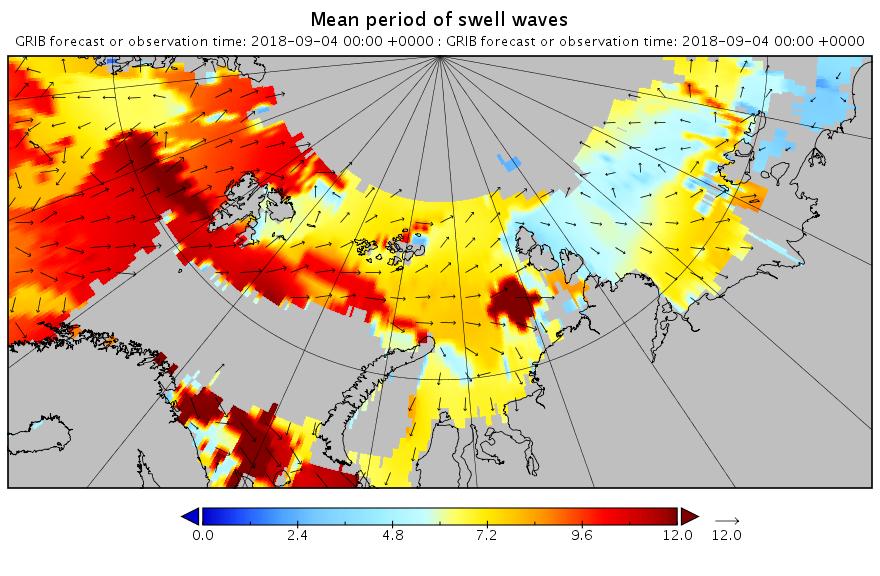
[Edit – September 4th]
Using the same scales as yesterday, here’s today’s hindcast from midnight:
There’s still plenty of action in the Arctic Ocean!
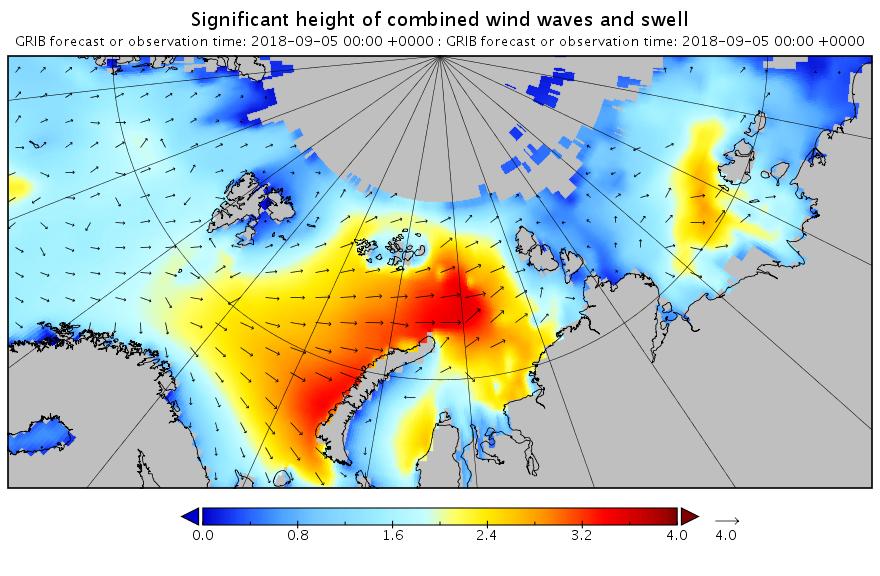
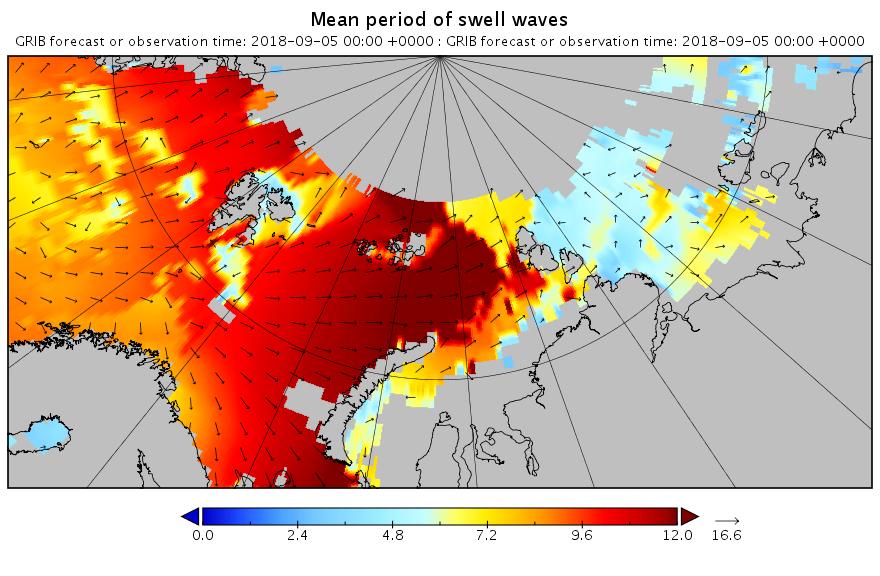
[Edit – September 5th]
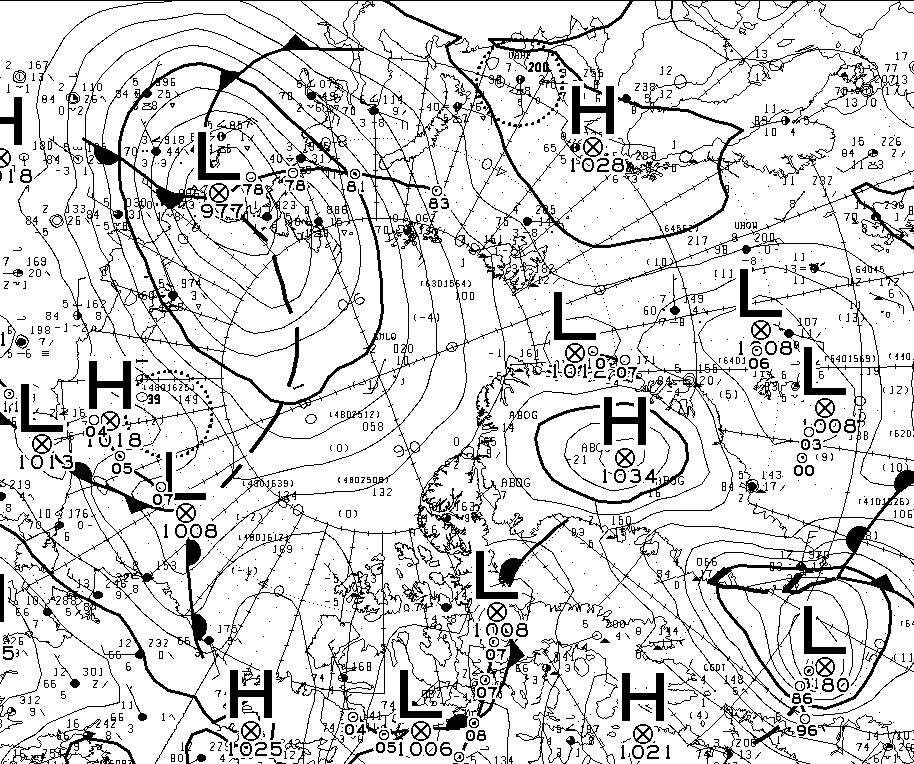
Feel free to debate whether it merits the “Great” prefix, but this is how the early September 2018 Arctic cyclone has panned out. According to this morning’s Environment Canada synopsis the cyclone is centred near the coast of the Laptev Sea and is down to a MSLP of 977 hPa:
Here’s another WaveWatch III hindcast from midnight UTC:
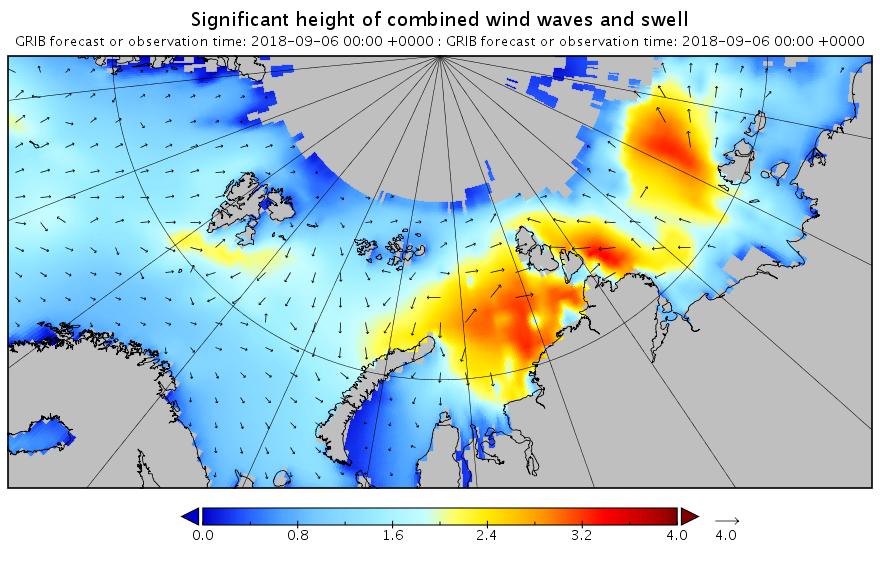
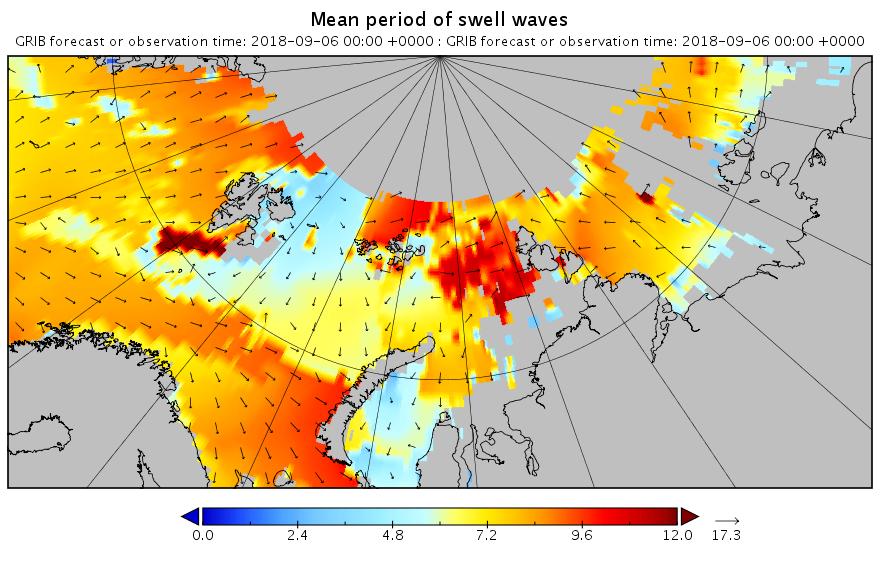
[Edit – September 6th]
Need I say more?
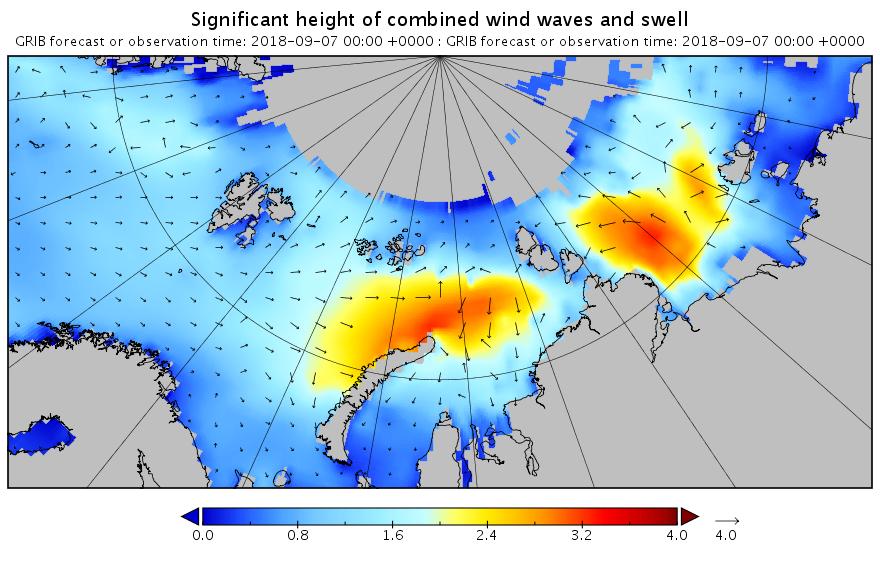
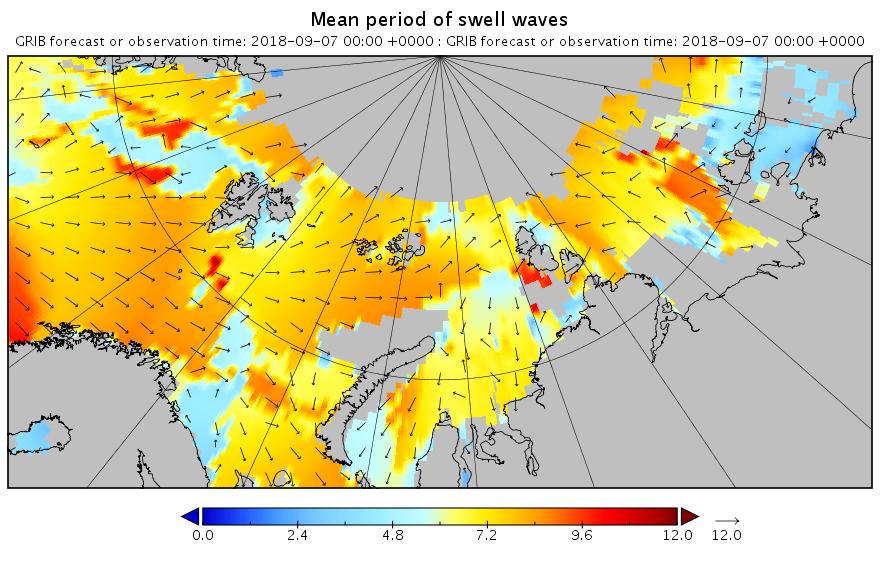
[Edit – September 7th]
The swell in the Fram Strait an Barents Sea is diminishing, but the period in the Laptev Sea is increasing now:
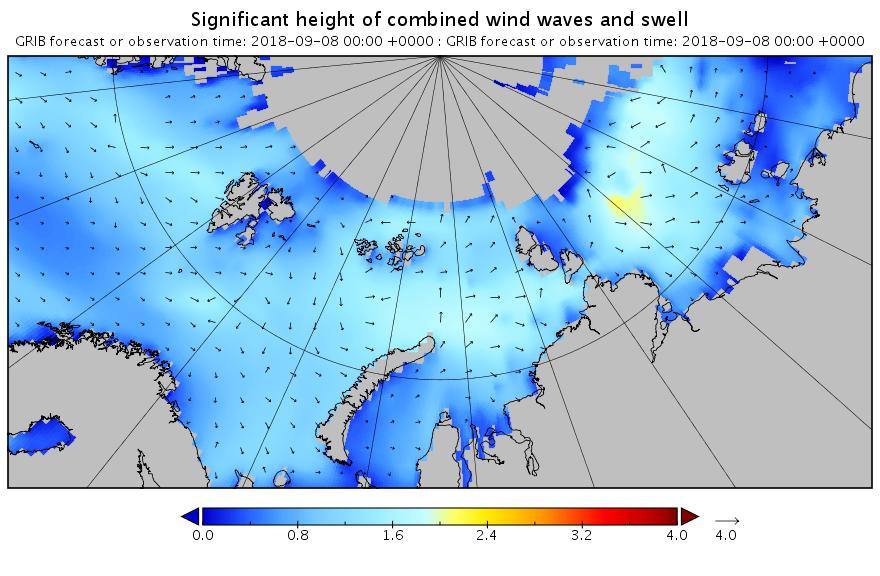
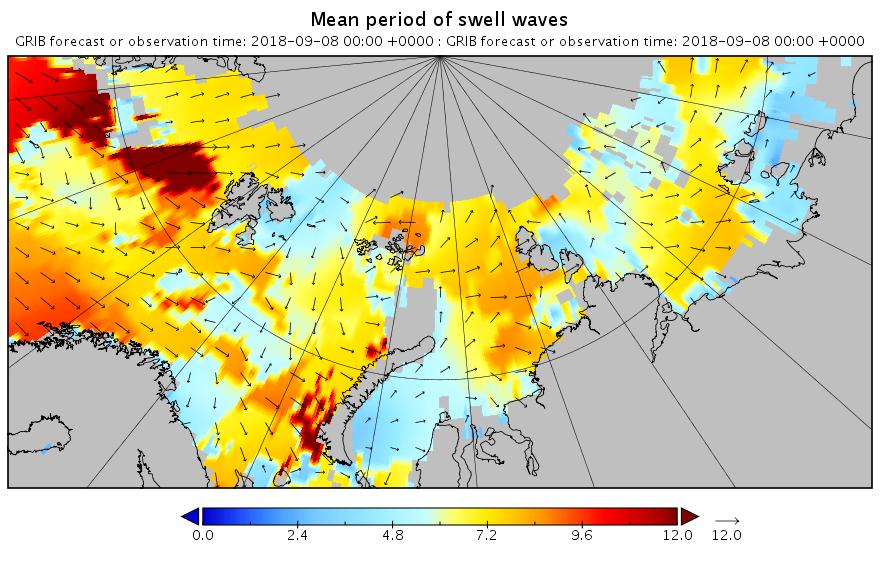
[Edit – September 8th]
All the wave activity in the Laptev Sea is diminishing. Here’s the hindcast from midnight:
Meanwhile things are warming up in the Chukchi and Beaufort Seas. Here’s the forecast for midnight tonight:
[Edit – September 9th]
Here’s the hindcast for this morning’s swell in the Beaufort Sea:
This is currently a long way into the future and hence may not verify in practice. However any pulse of swell is currently forecast for September 13th:
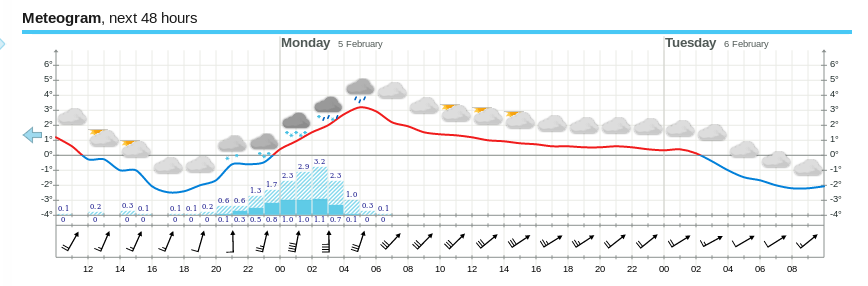
Much like last month, temperatures are above zero and rain is forecast. That’s because once again the current synoptic chart from Environment Canada shows a warm wet flow from way down south over Svalbard and on into the Central Arctic:
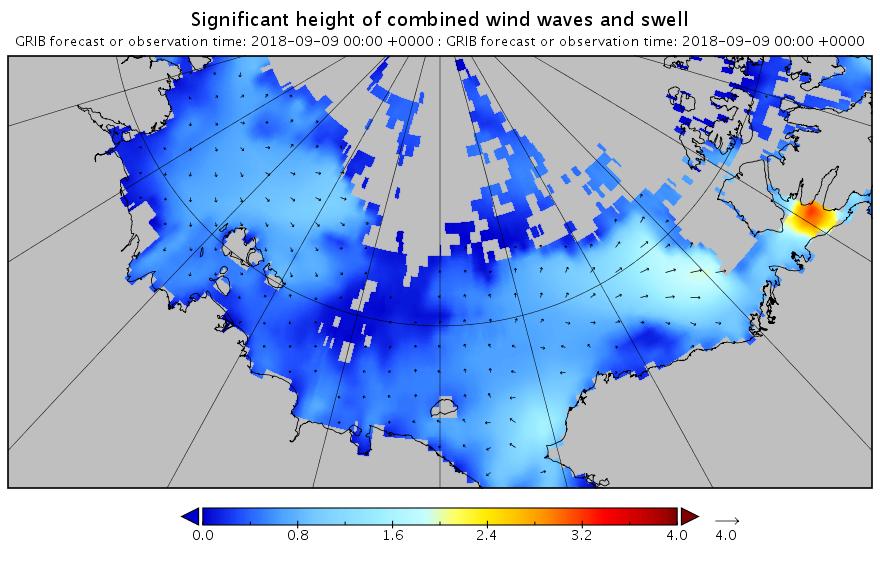
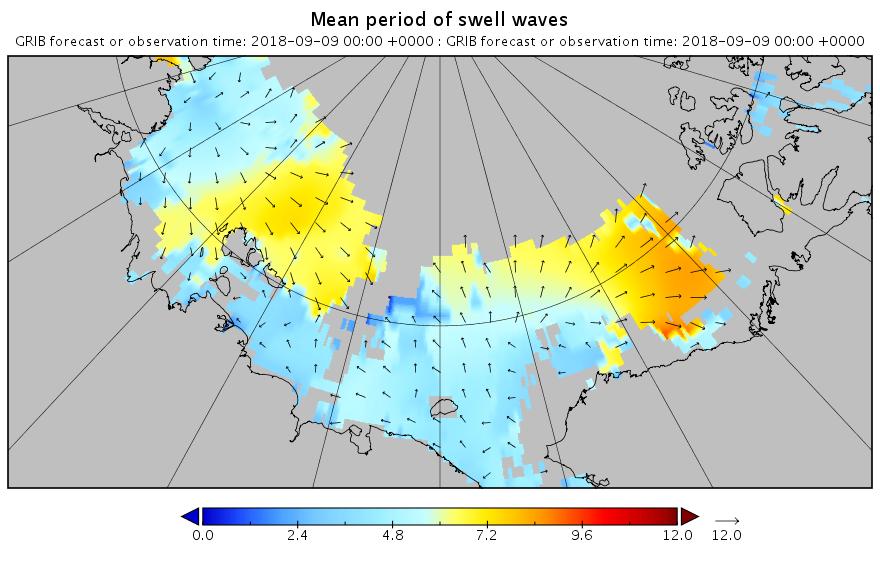
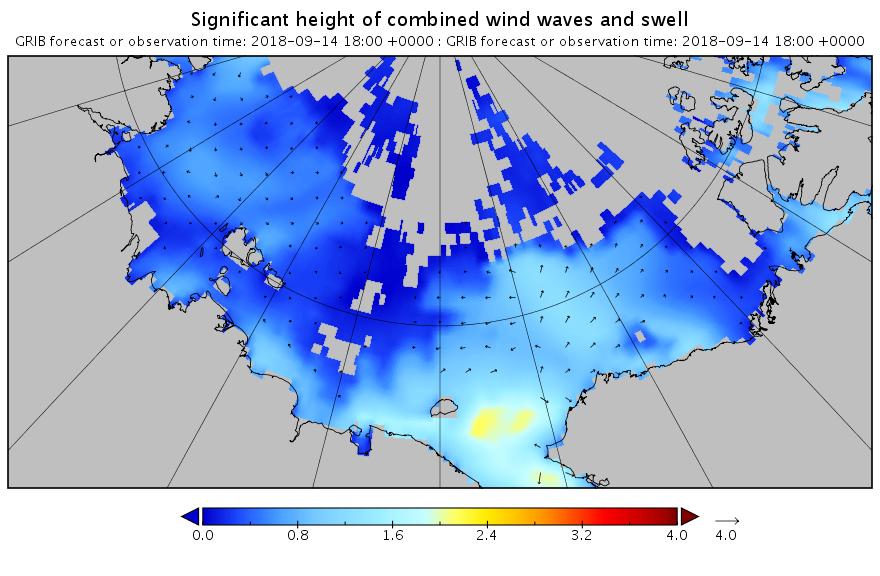
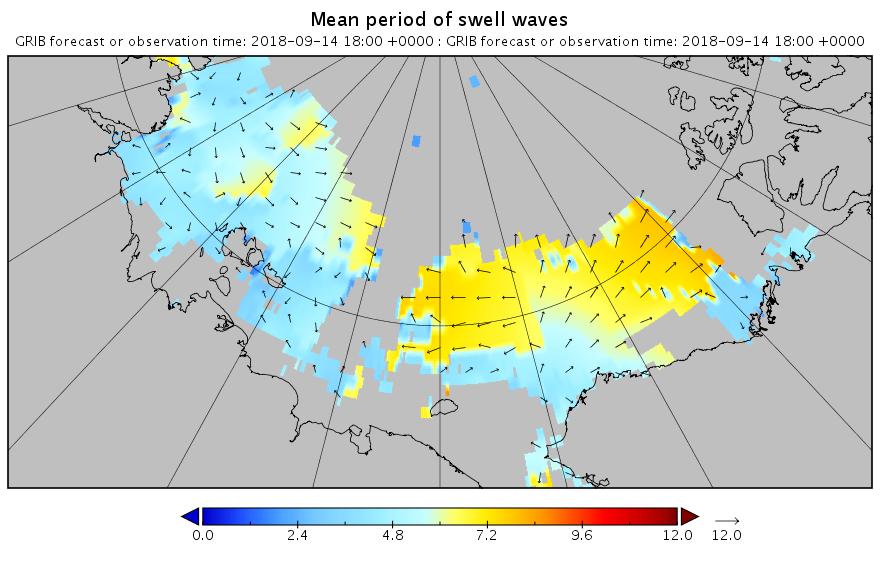
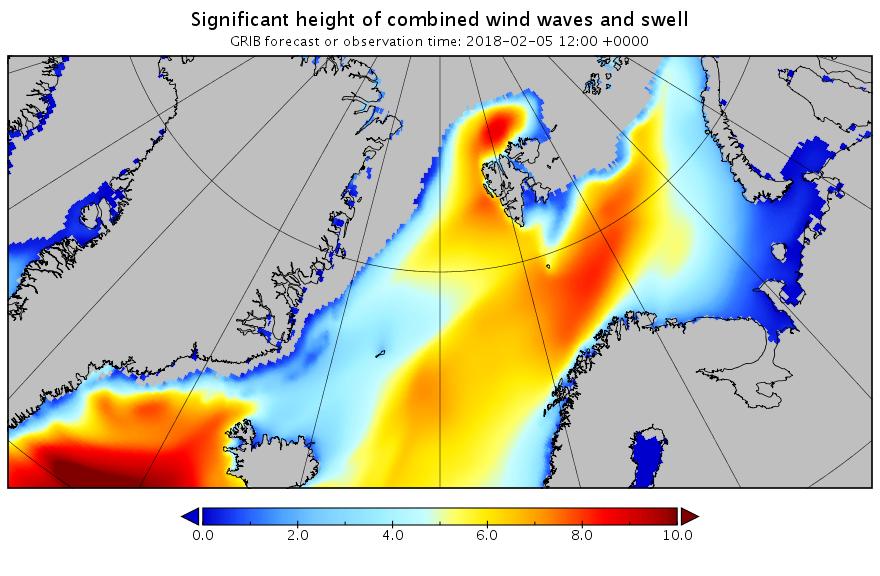
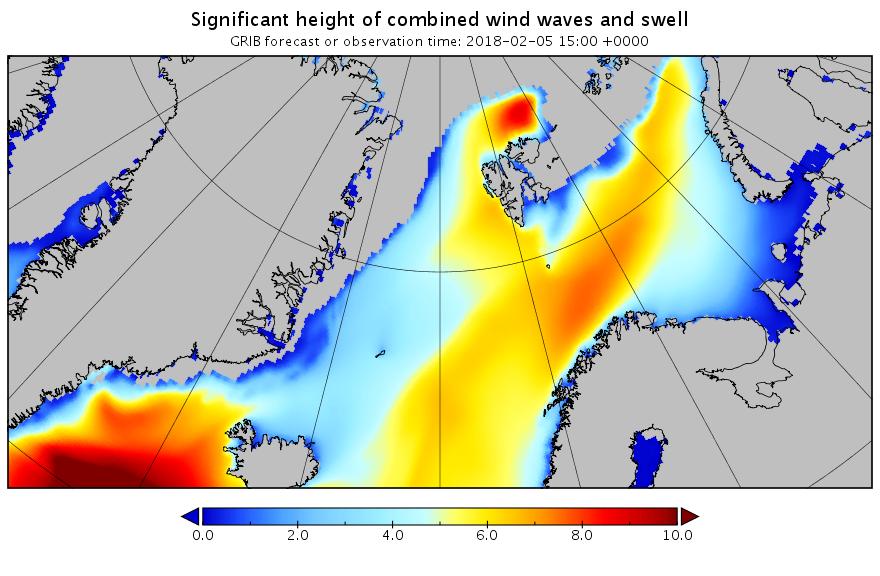
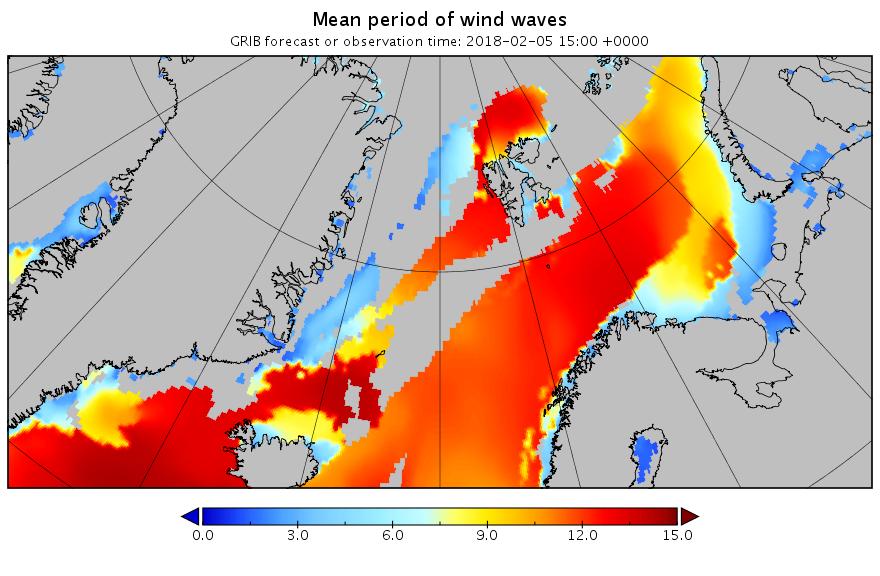
Next here’s the current combined wave and swell height forecast for the Svalbard area:
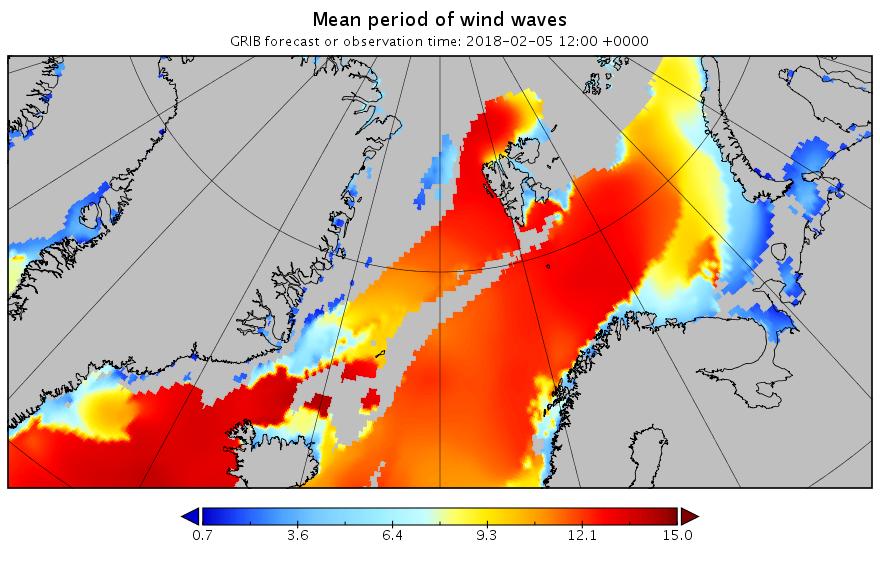
and here’s the associated wave period forecast:
It’s still showing 10 meter waves with a 15 second period north of Svalbard tomorrow lunchtime. Somewhat unusually for the Arctic these aren’t merely giant wind waves. Zooming in on the Fram Strait and breaking out the underlying primary swell reveals:
A long distance swell of that magnitude is going to cause some damage.
[Edit – February 5th]
The current ECMWF forecast for a split polar vortex, courtesy of Ice Shieldz on the Arctic Sea Ice Forum:
This is suggestive of more cyclones to come, but sticking with the current one for now, here is the MSLP chart at 00:00 UTC this morning showing the cyclone’s central pressure has dropped to 952 hPa:
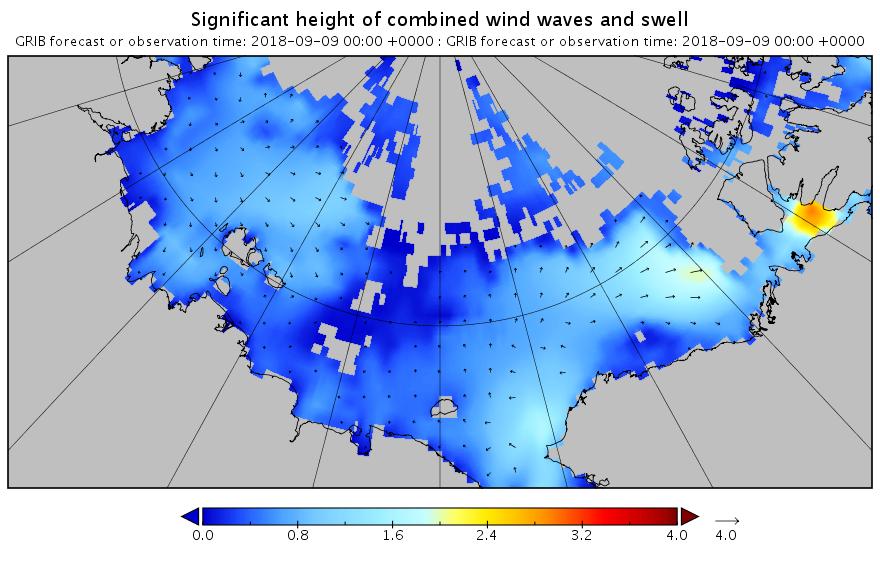
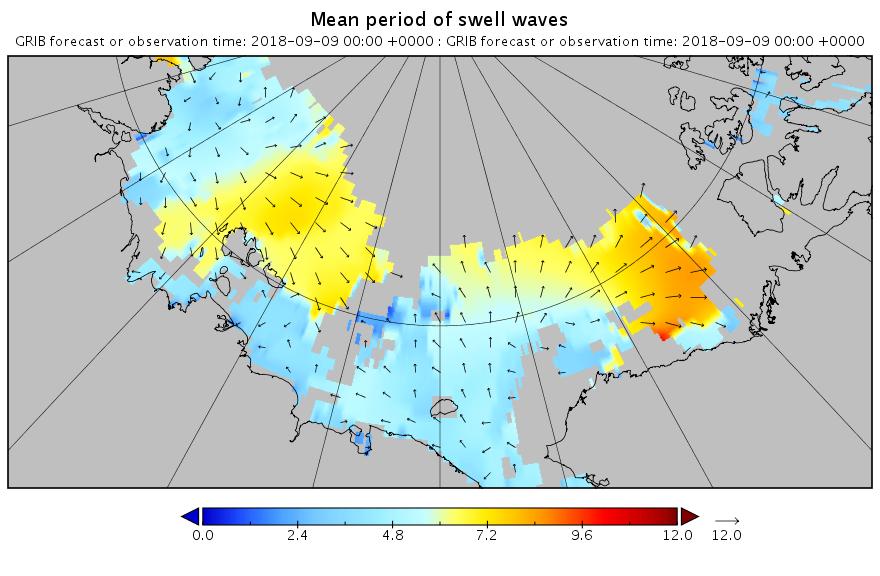
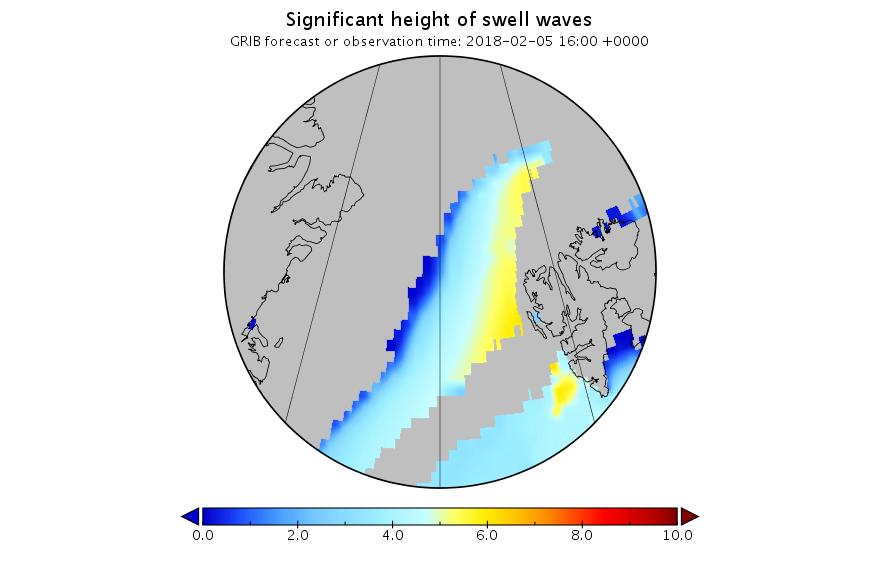
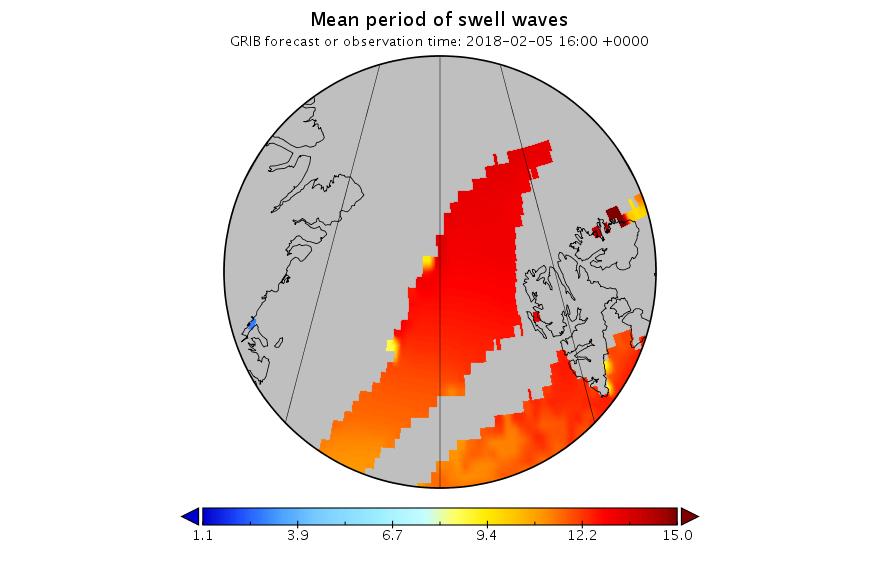
Here too is the current WaveWatch III forecast for 15:00 UTC today:
The peak of the swell north of Svalbard is now slightly later than originally forecast, but it’s still enormous!
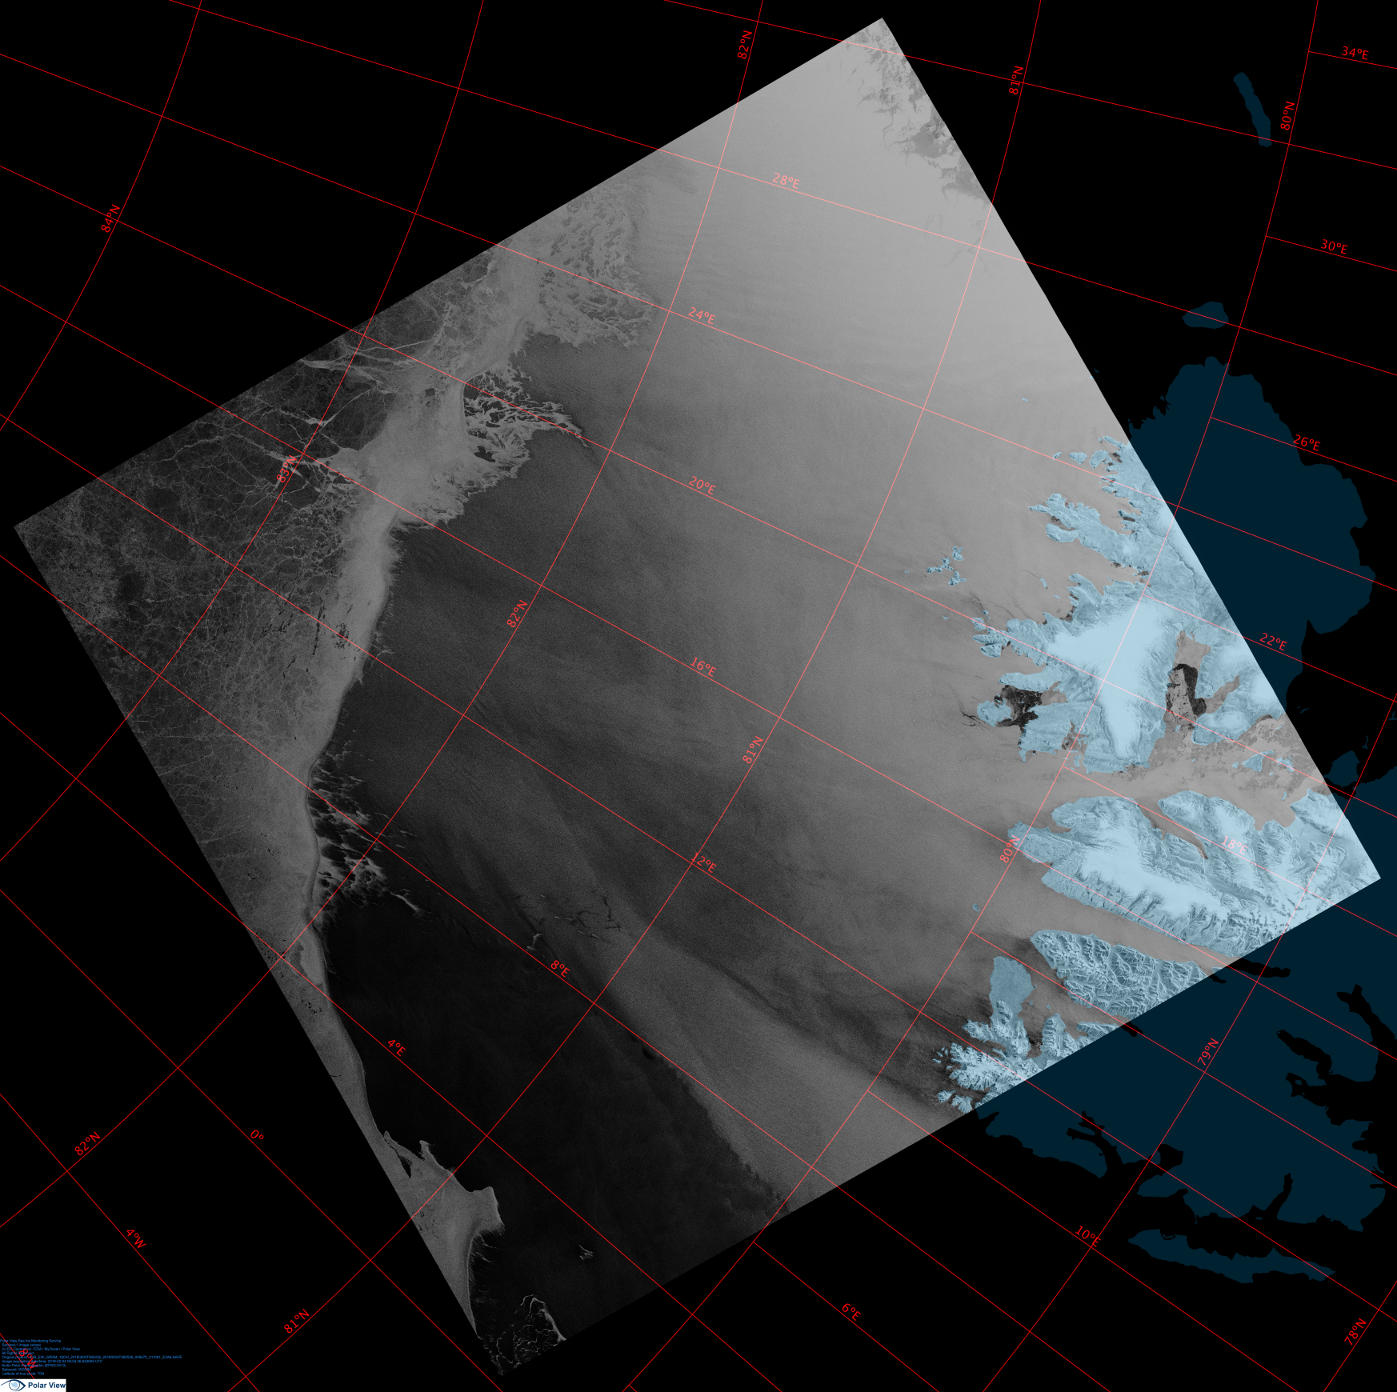
Here’s a single Sentinel 1B synthetic aperture radar image that captures the position of the ice edge north of Svalbard yesterday quite nicely:
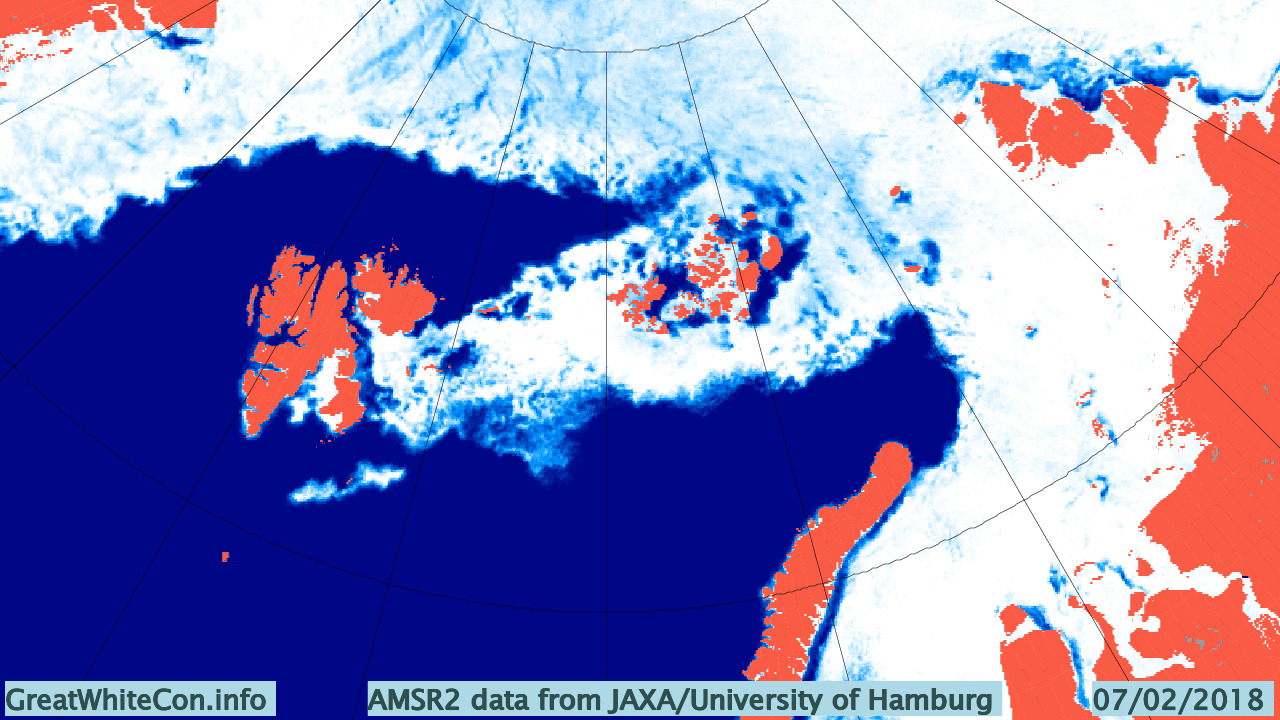
[Edit – February 7th]
A brief overview of the effect of the recent cyclone on the sea ice in the Arctic via AMSR2:
Click the image to animate it.
[Edit – February 8th]
An Arctic wide take via Thomas Lavergne on Twitter:
Your daily update on the "big low entering #SeaIce". The "spin" in motion moves East towards Severnaya Zemlya. Some opening from land there, increased flushing through Fram Strait. pic.twitter.com/q4m1CRhmtS
An interesting insight into CryoSat-2 sea ice thickness measurements from Stefan Hendricks on Twitter:
Radar altimetry tells you how far the surface waves penetrate into the #seaice cover. Unfortunetaly via a bias in #Cryosat freeboard information. 😉 pic.twitter.com/OxUTcFH94h
GFS wants to keep major #PolarVortex (PV) center over Western Canada after the split and is consistent with predicted westward shift of troughing and #cold across North America but this is not typical following significant PV disruptions. pic.twitter.com/zX7n3rnMpo
This website uses cookies to improve your experience. We'll assume you're ok with this, but you can opt-out if you wish. Cookie settingsACCEPT
Privacy & Cookies Policy
Privacy Overview
This website uses cookies to improve your experience while you navigate through the website. Out of these, the cookies that are categorized as necessary are stored on your browser as they are essential for the working of basic functionalities of the website. We also use third-party cookies that help us analyze and understand how you use this website. These cookies will be stored in your browser only with your consent. You also have the option to opt-out of these cookies. But opting out of some of these cookies may affect your browsing experience.
Necessary cookies are absolutely essential for the website to function properly. This category only includes cookies that ensures basic functionalities and security features of the website. These cookies do not store any personal information.
Any cookies that may not be particularly necessary for the website to function and is used specifically to collect user personal data via analytics, ads, other embedded contents are termed as non-necessary cookies. It is mandatory to procure user consent prior to running these cookies on your website.