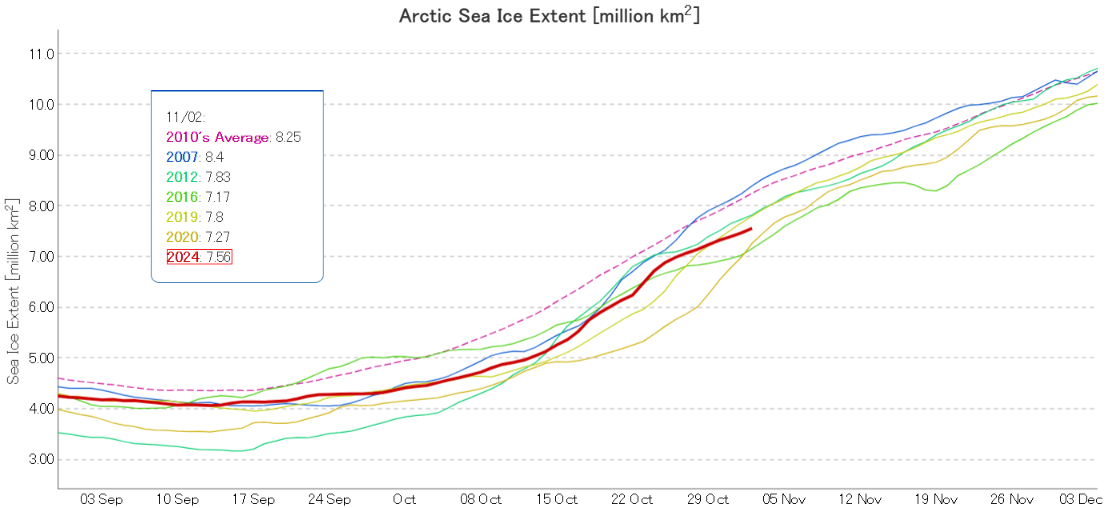
The Laptev and East Siberian Seas have now refrozen. Consequently Arctic sea ice extent is now increasing more slowly, and JAXA/ViSHOP extent is 3rd lowest for the date in the satellite era:
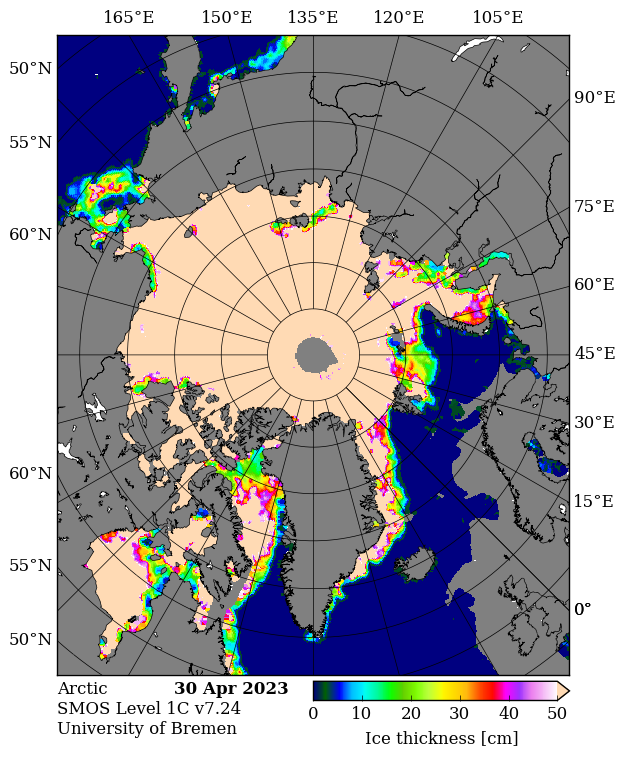
Note the change in scale from previous months, to allow for easier comparison with the “near real time” CryoSat-2/SMOS merged thickness data from the Alfred Wegener Institute:
The JAXA extent graph is currently not updating, so let’s begin this month with the latest AMSR2 sea ice concentration map from the Alfred Wegener Institute. Click the image to see a ~10 Mb animation of the last four weeks:
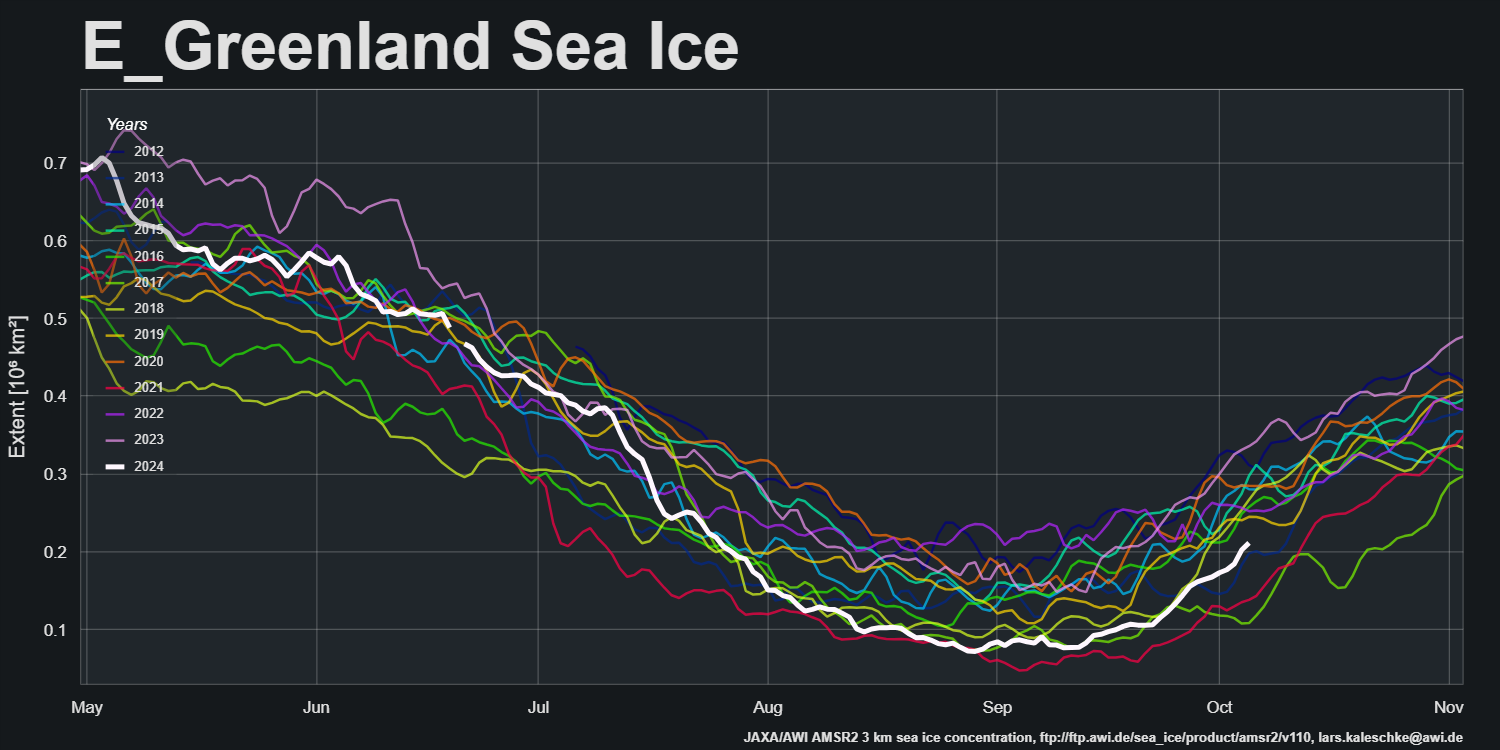
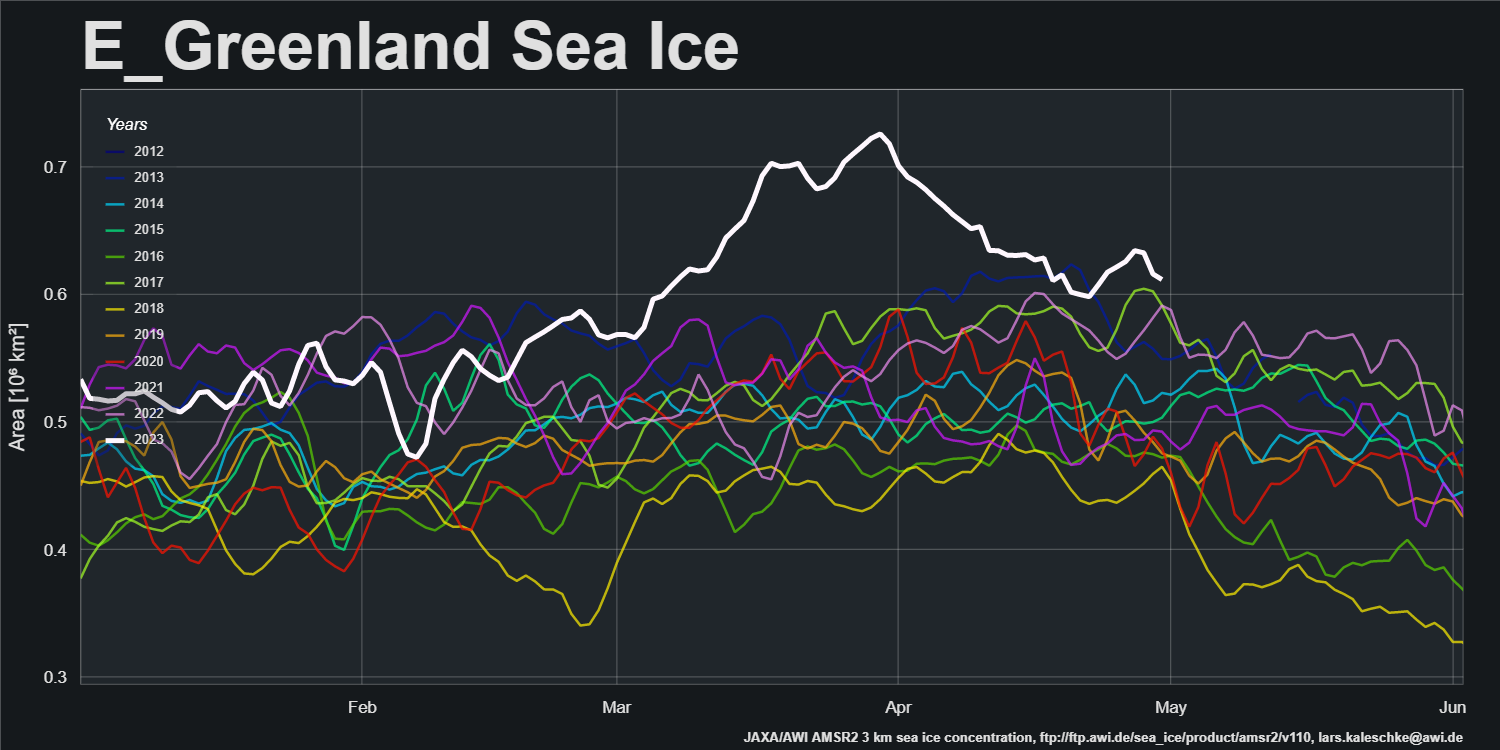
Note in particular the restart of export into the East Greenland Sea via the Fram Strait:
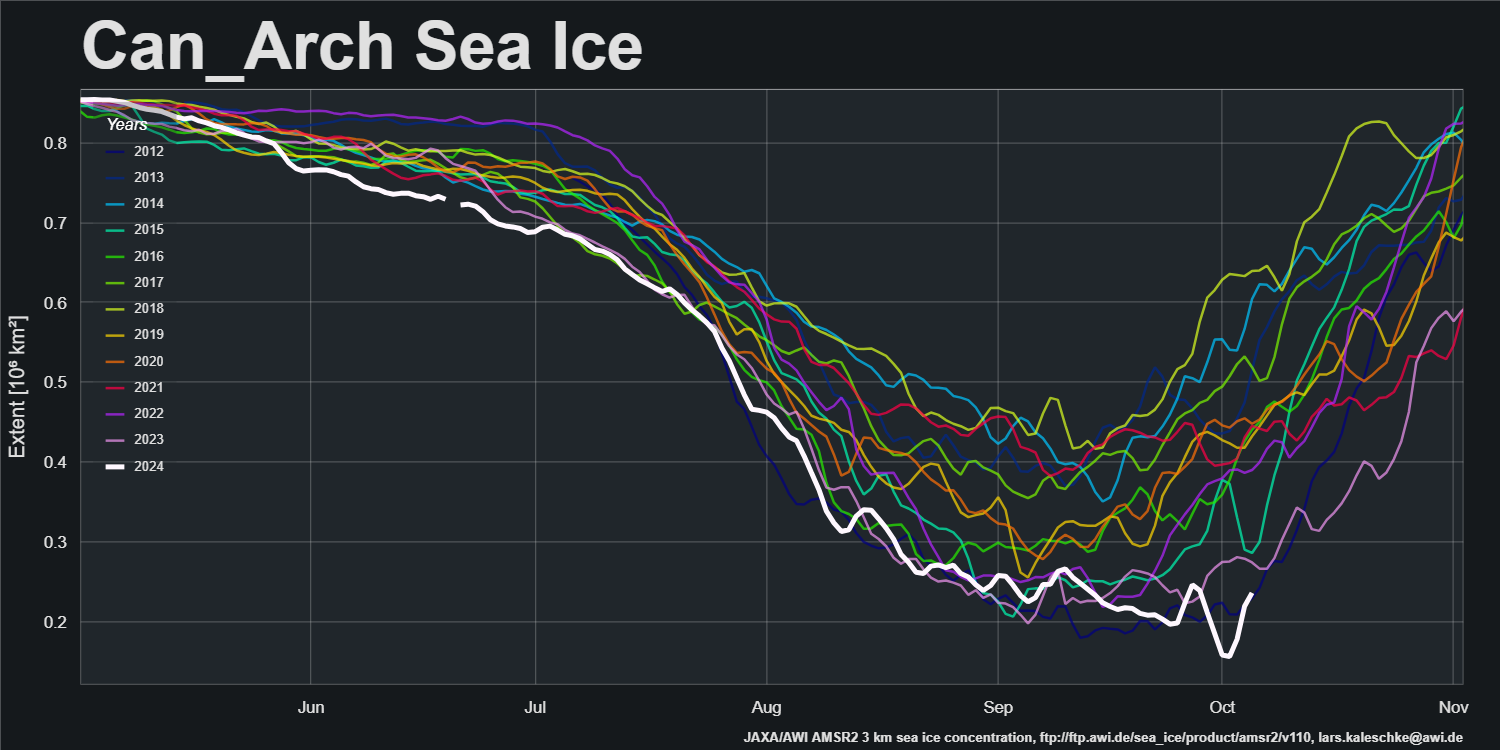
and the movement of ice within the Canadian Arctic Archipelago:
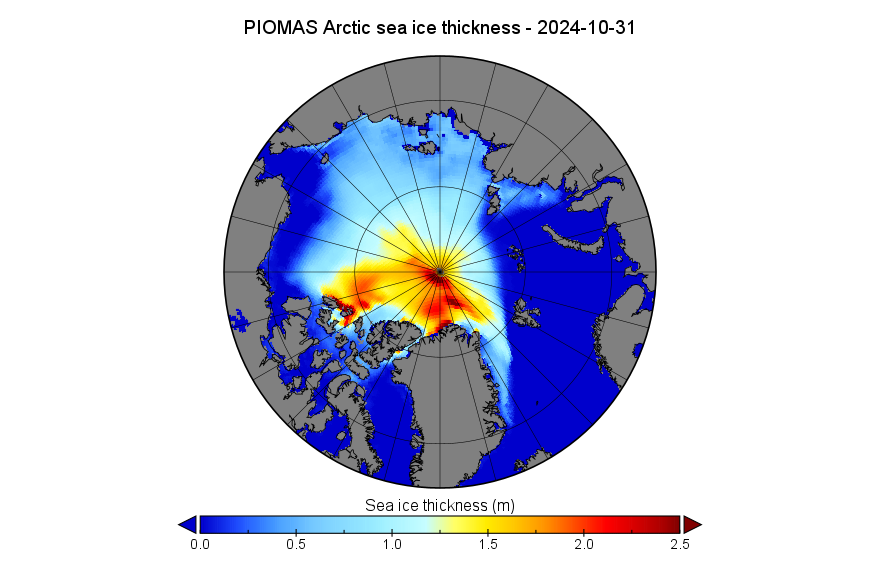
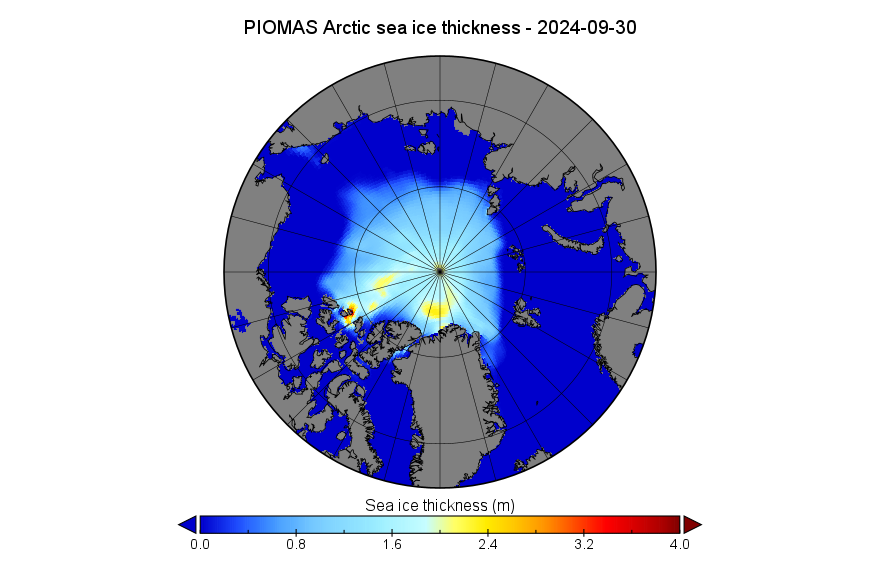
The PIOMAS gridded thickness data for September 2024 has been released:
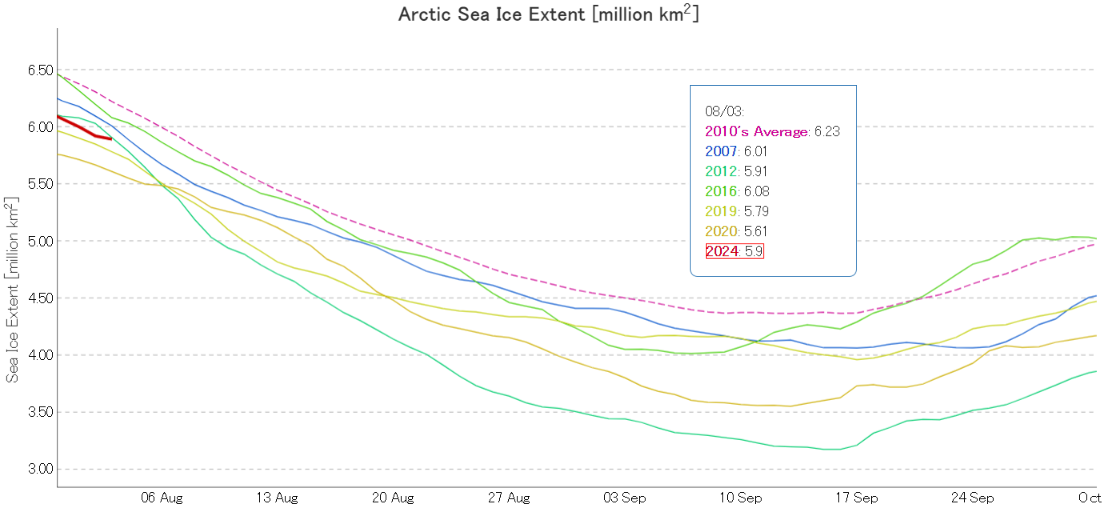
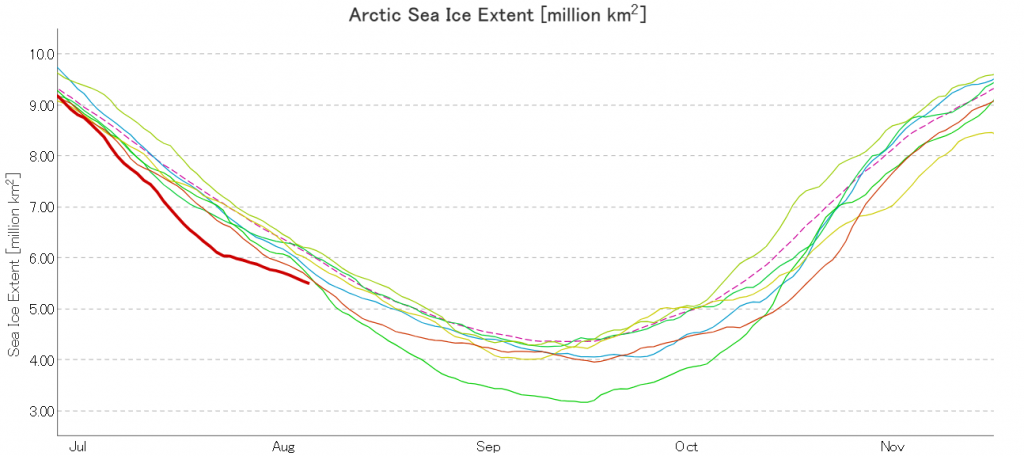
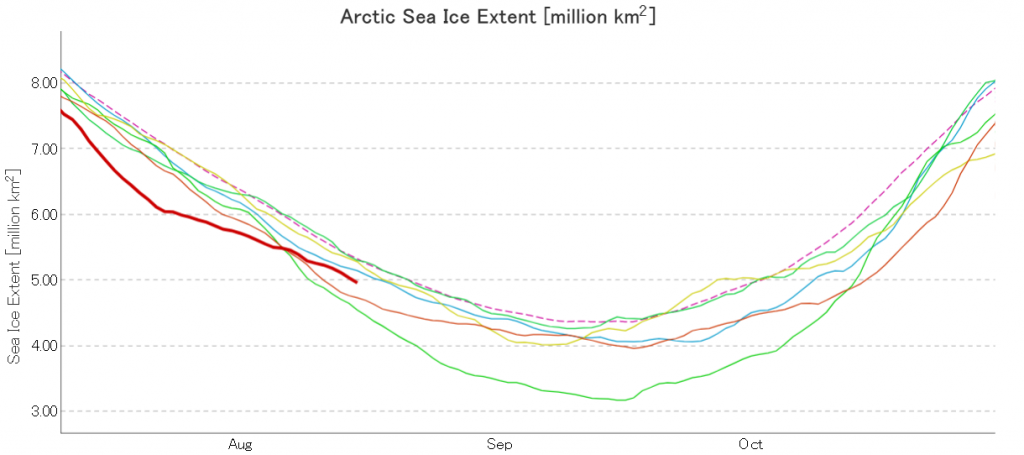
At the beginning of August JAXA/ViSHOP extent is 3rd lowest for the date in the satellite era:
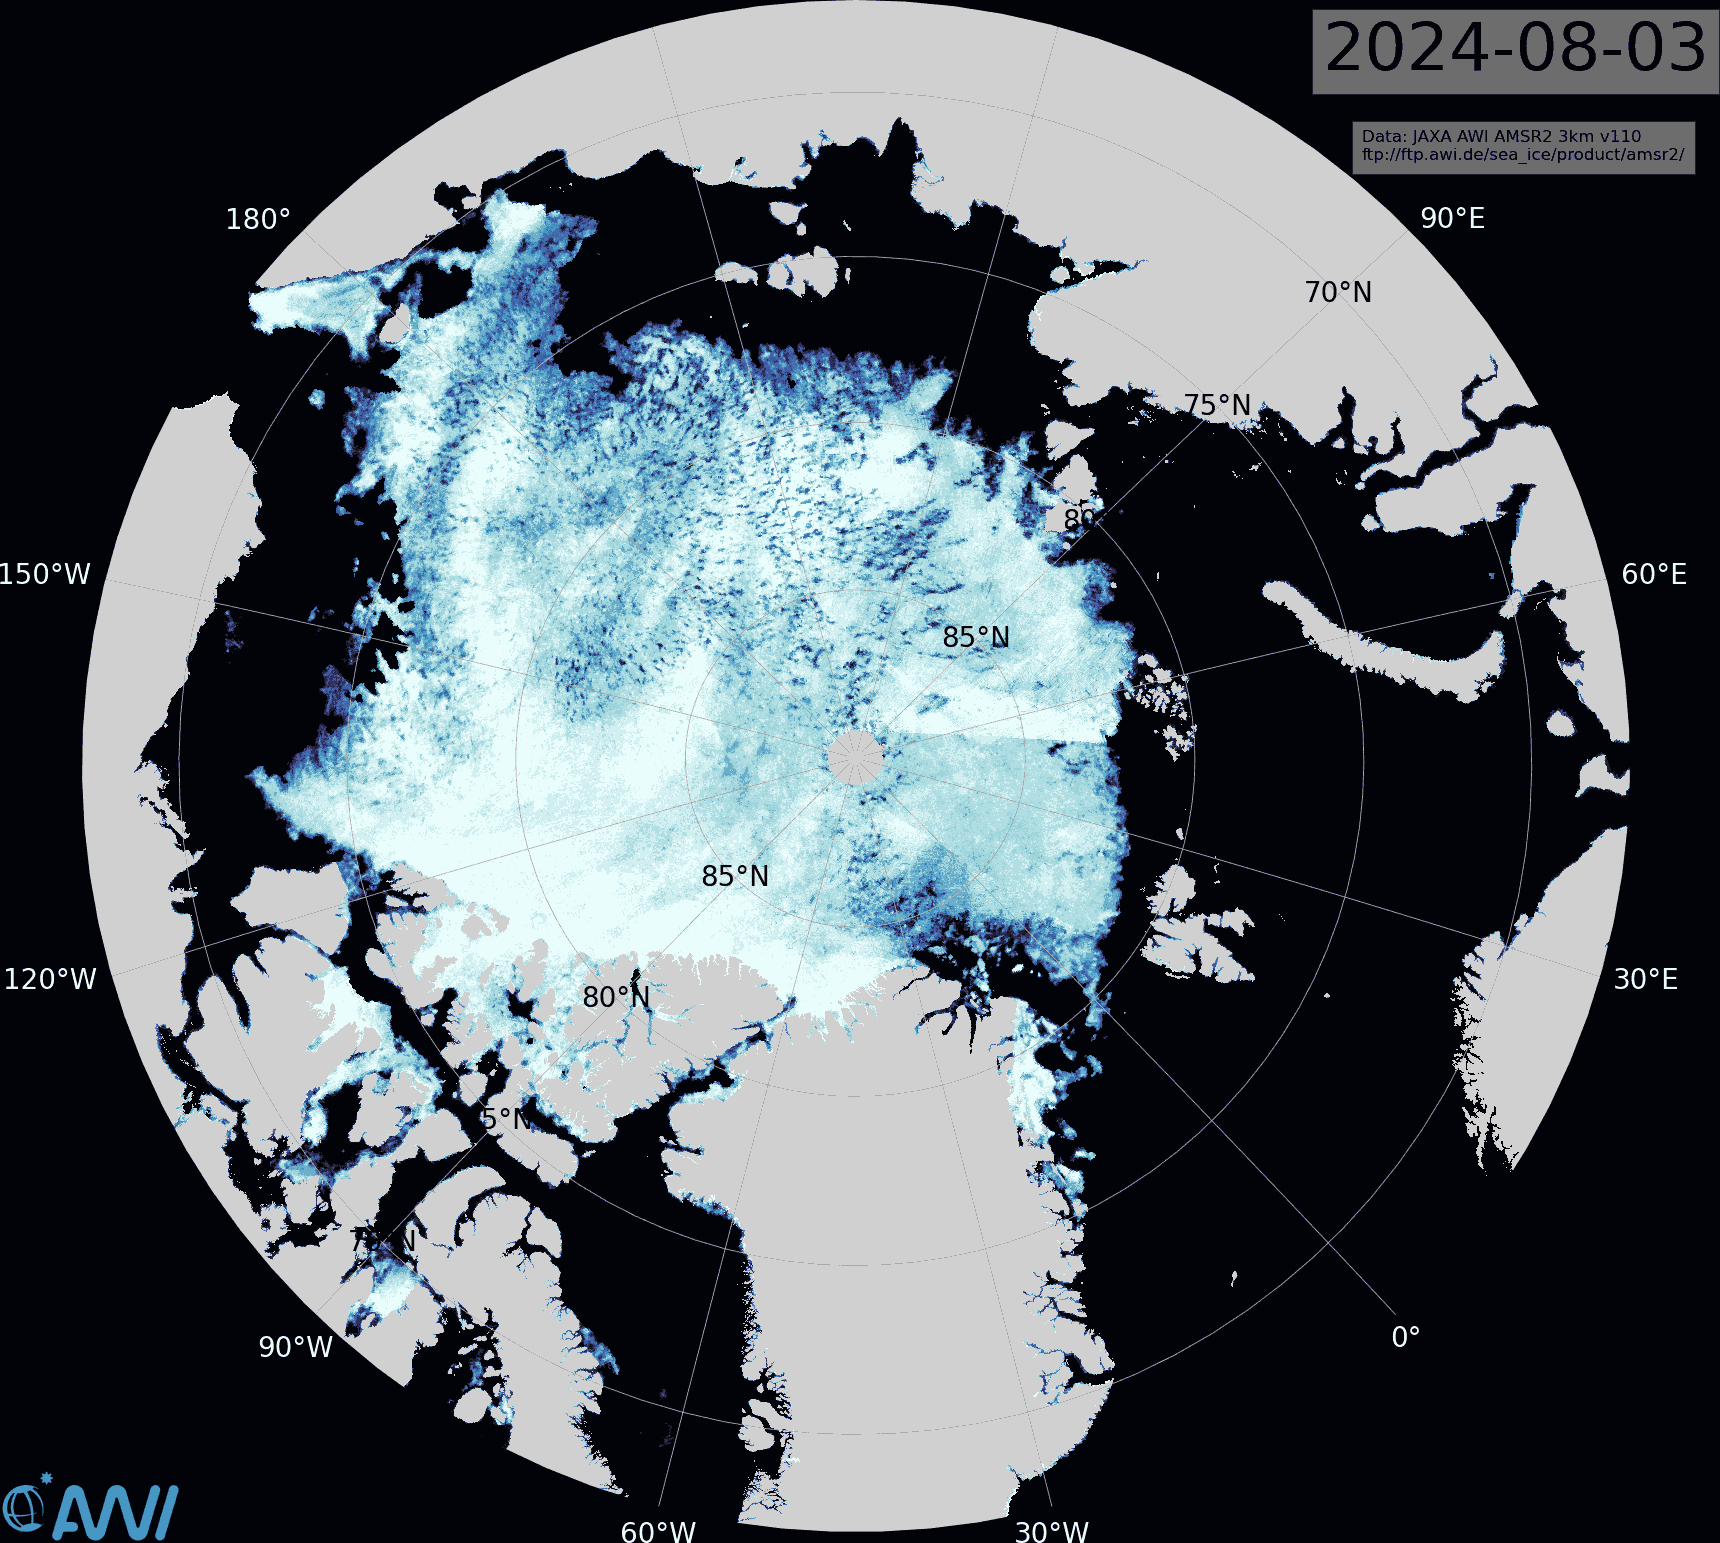
In 2012 extent had just started its unprecedented plunge towards the record September minimum, and 2024 seems certain to cross above the 2012 curve shortly. However, the latest AMSR2 sea ice concentration map from the Alfred Wegener Institute reveals areas of open water across the majority of the Central Arctic Basin:
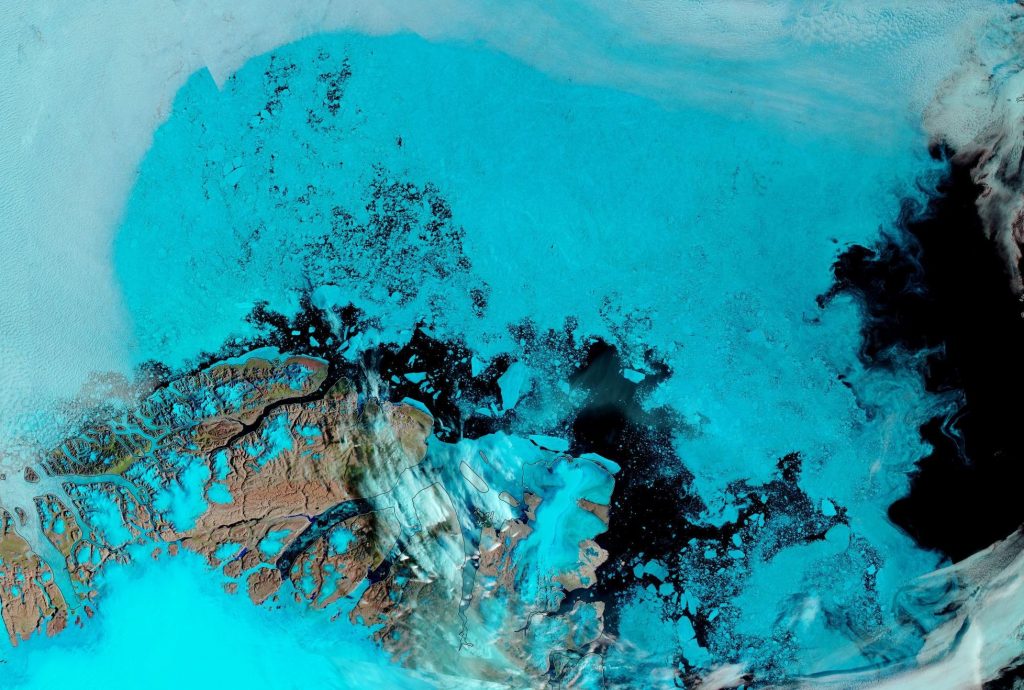
In particular the sea ice between the North Pole and northern Greenland is remarkably fragmented:
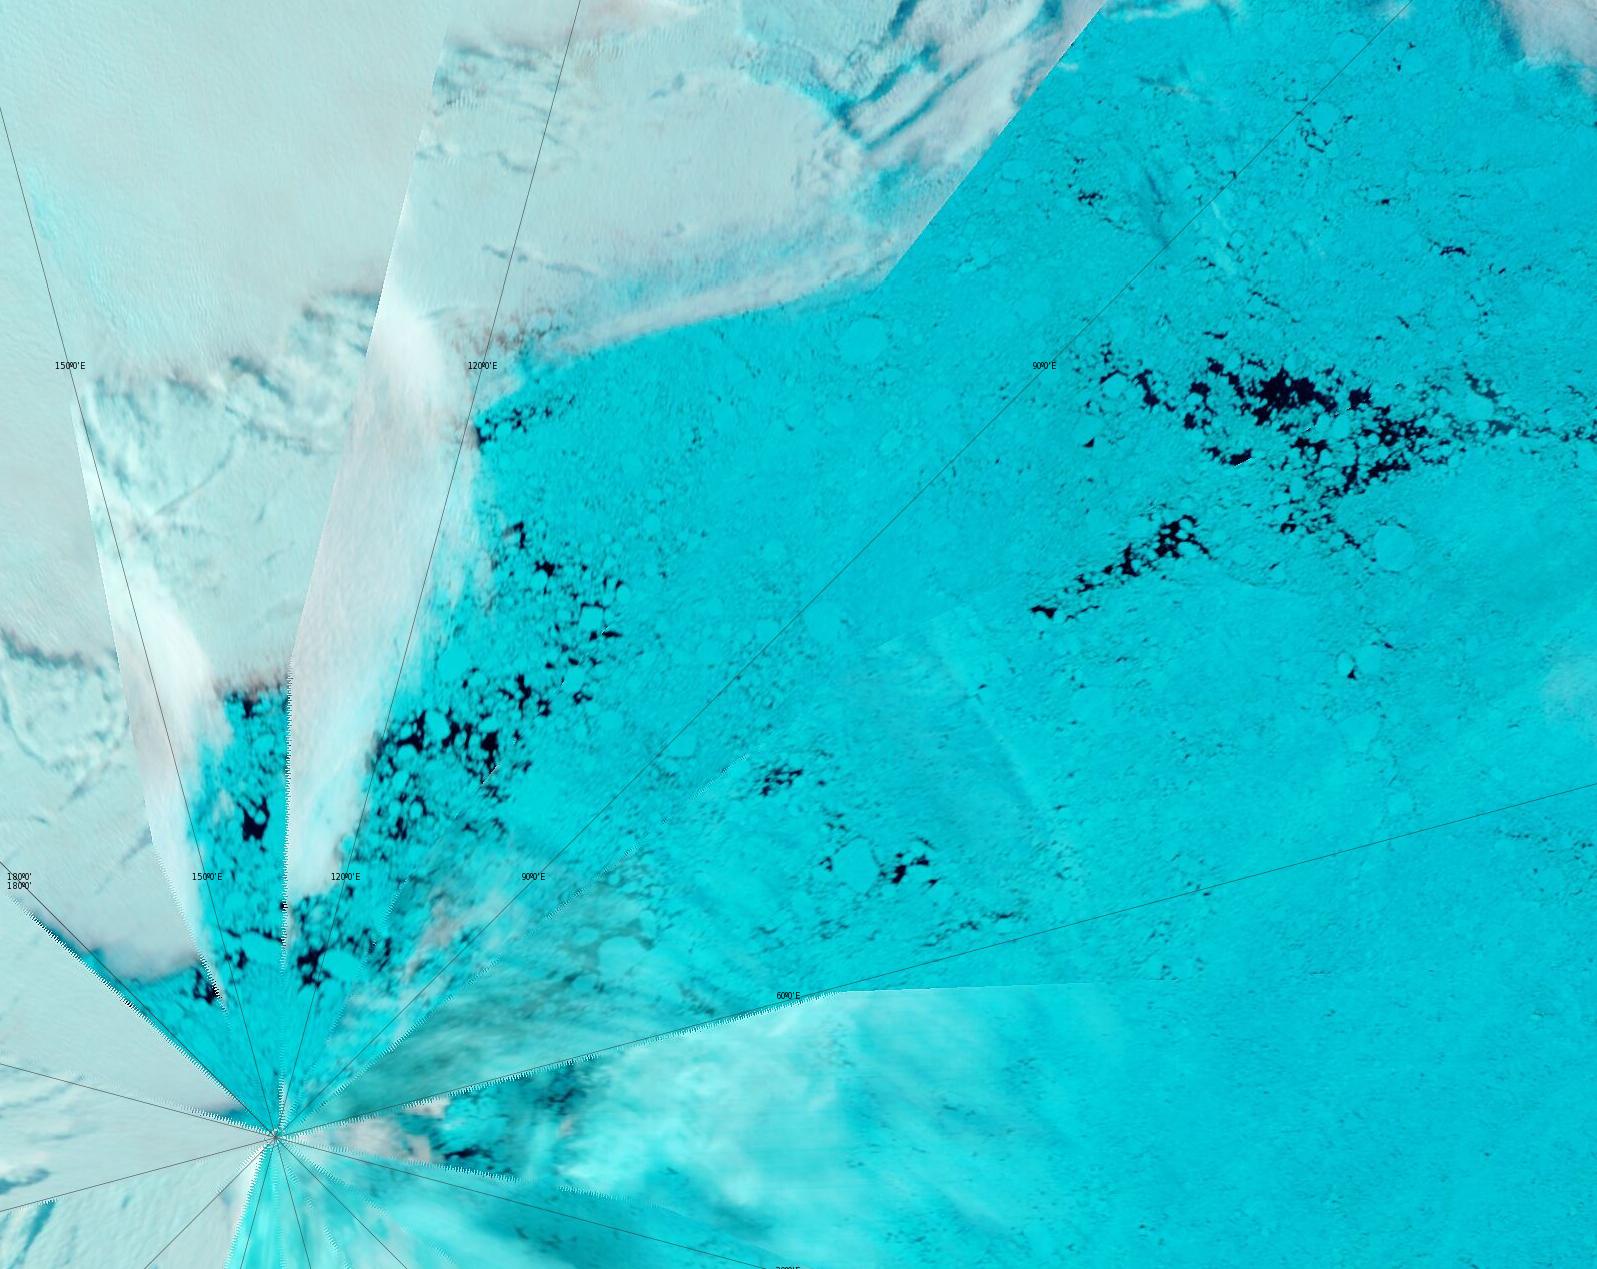
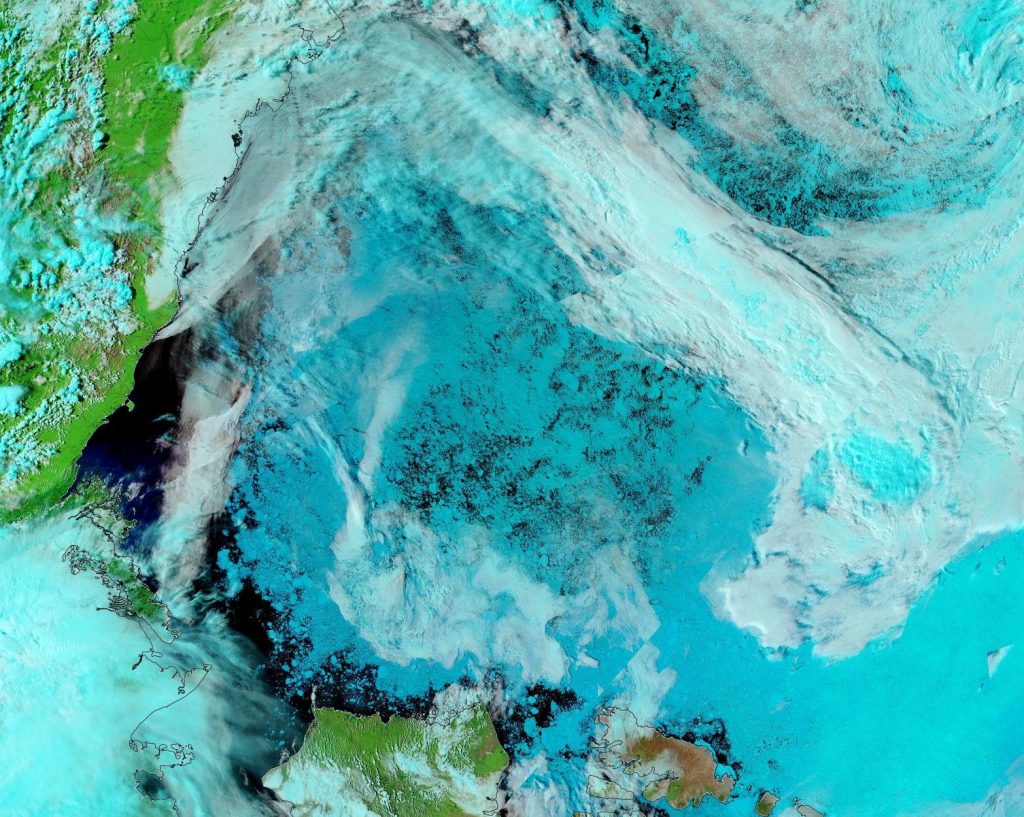
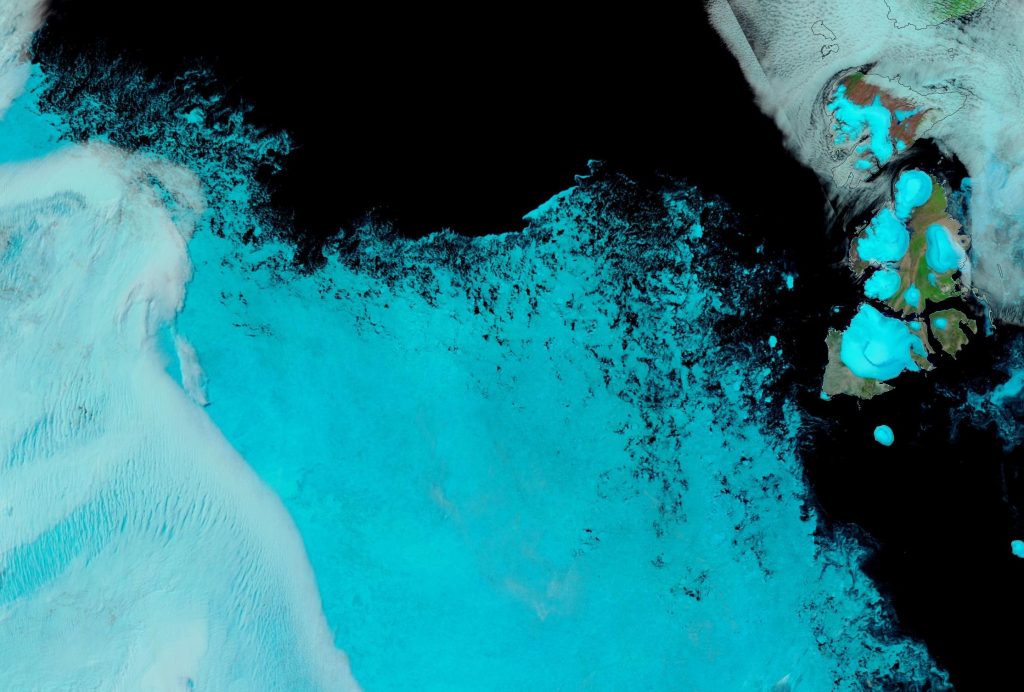
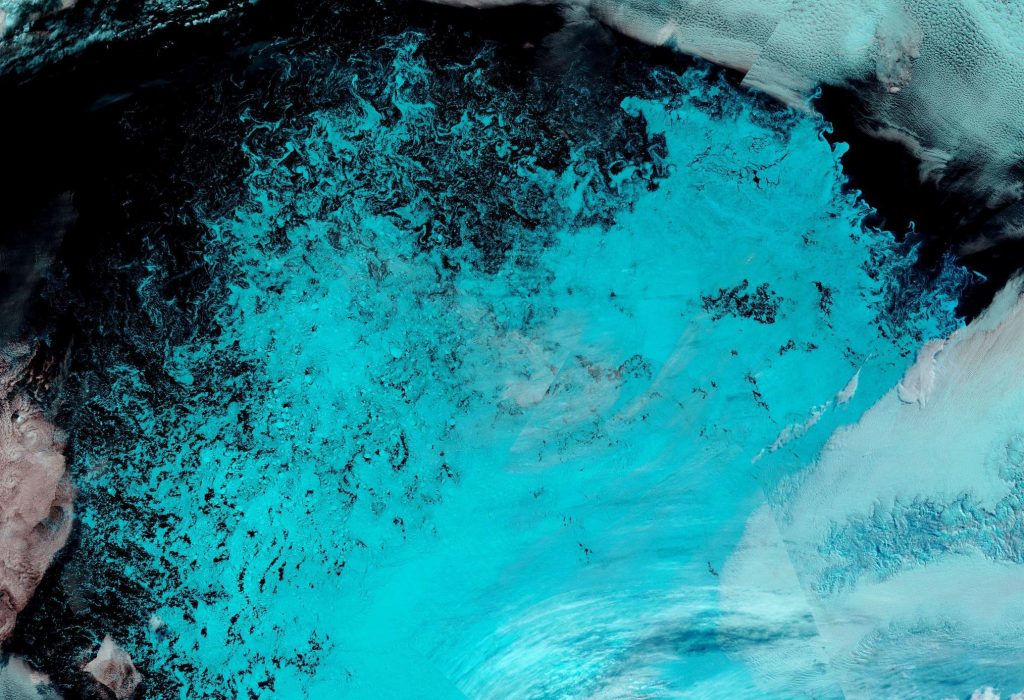
“False colour” image of the North Pole on August 3rd from the MODIS instrument on the Terra satellite
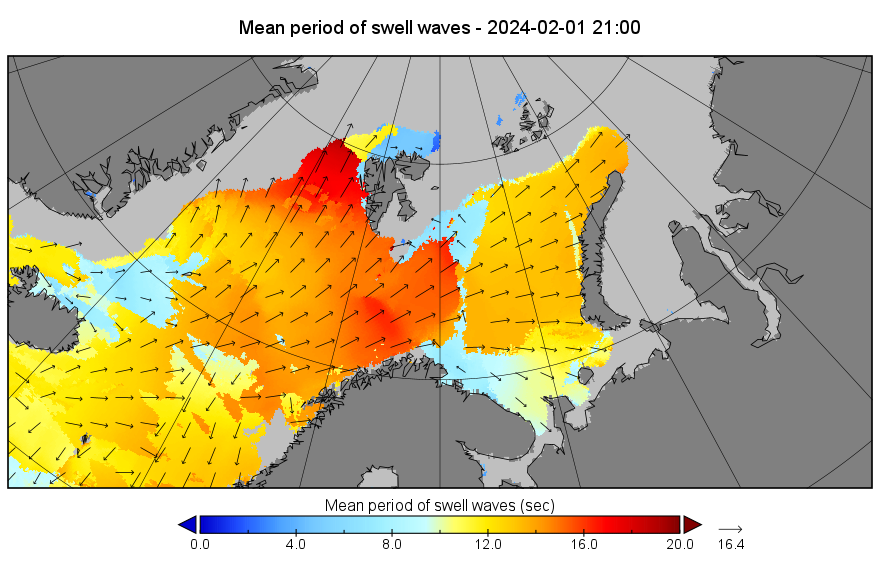
A change is perhaps even better than a rest? Let’s start February with a reminder that following close behind another recent Arctic cyclone, Storm Ingunn caused red weather warnings for high winds and avalanches in Norway two days ago:
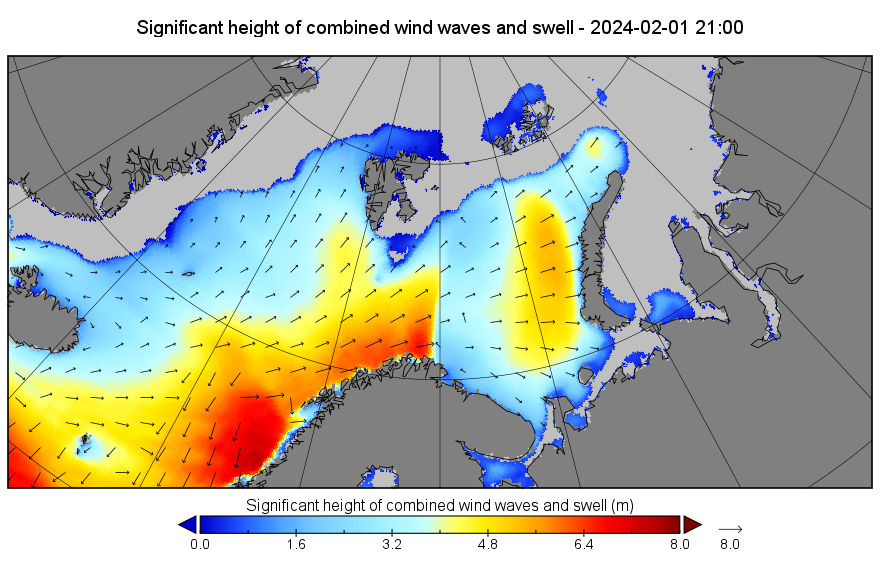
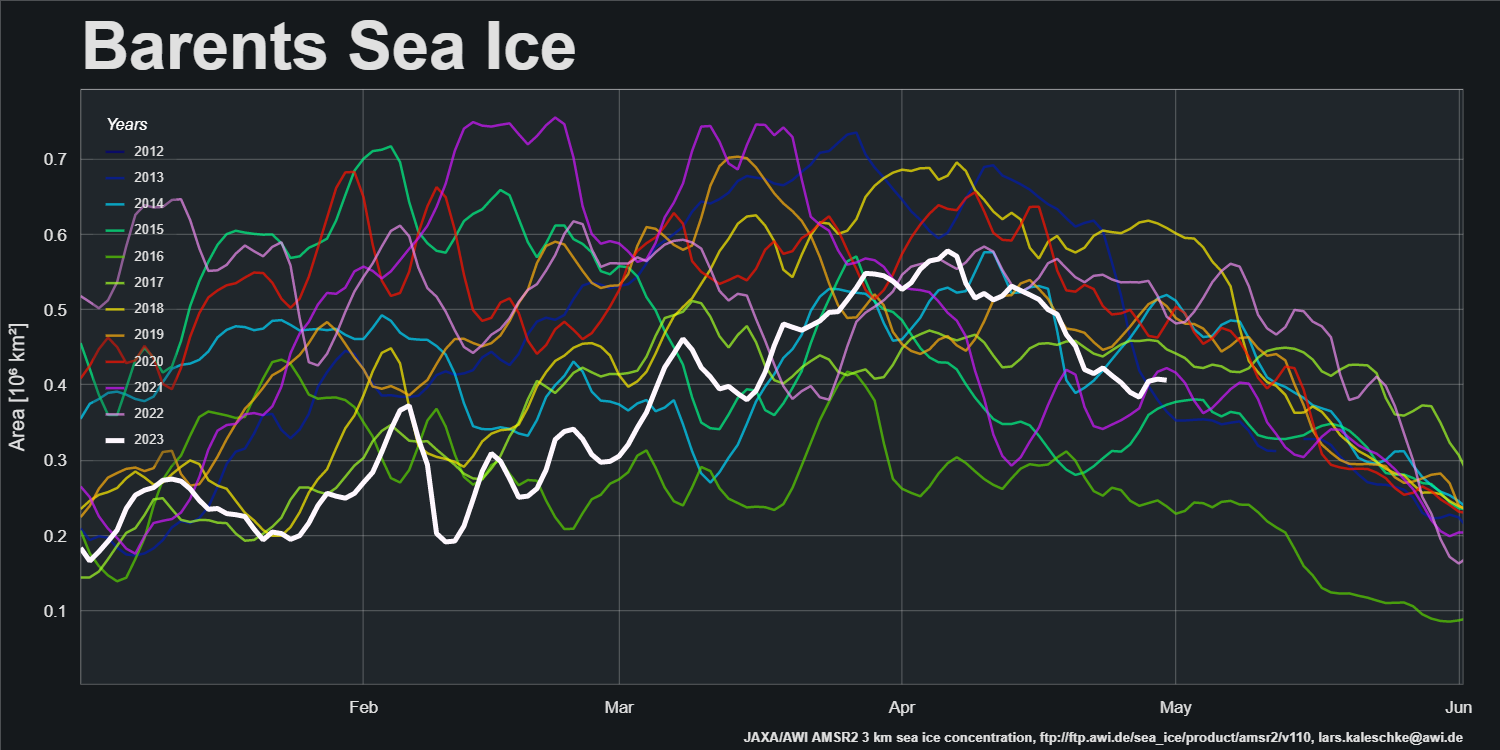
By yesterday evening another long period, storm driven swell was arriving at the sea ice edge in the Fram Strait, and to a lesser extent in the Barents Sea:
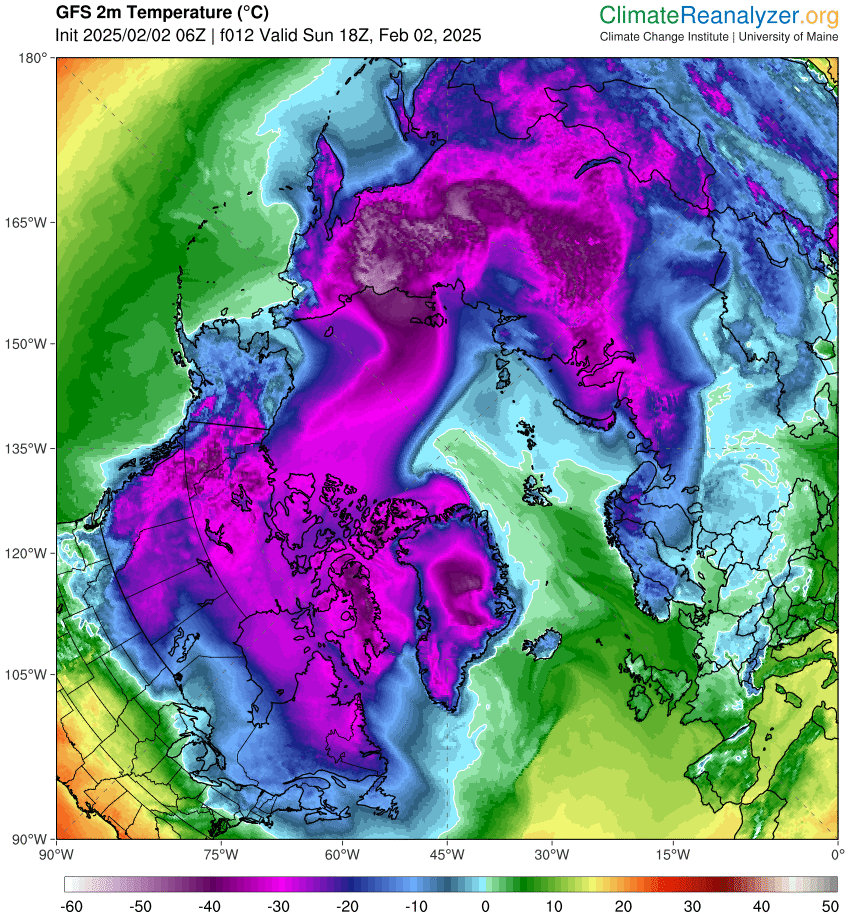
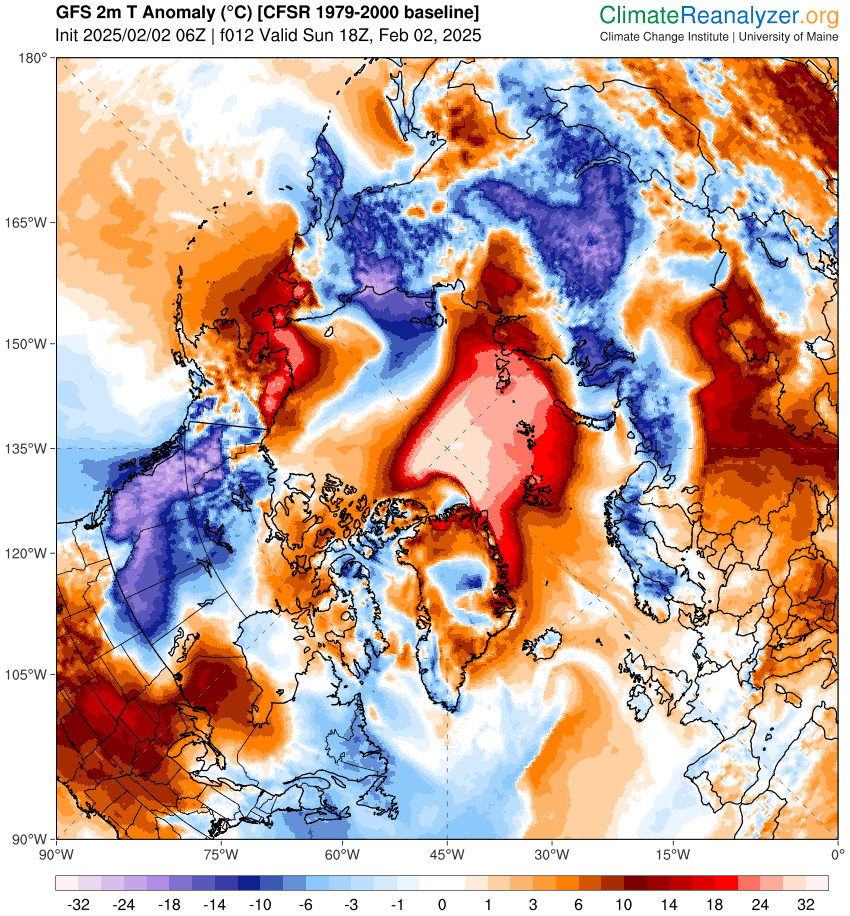
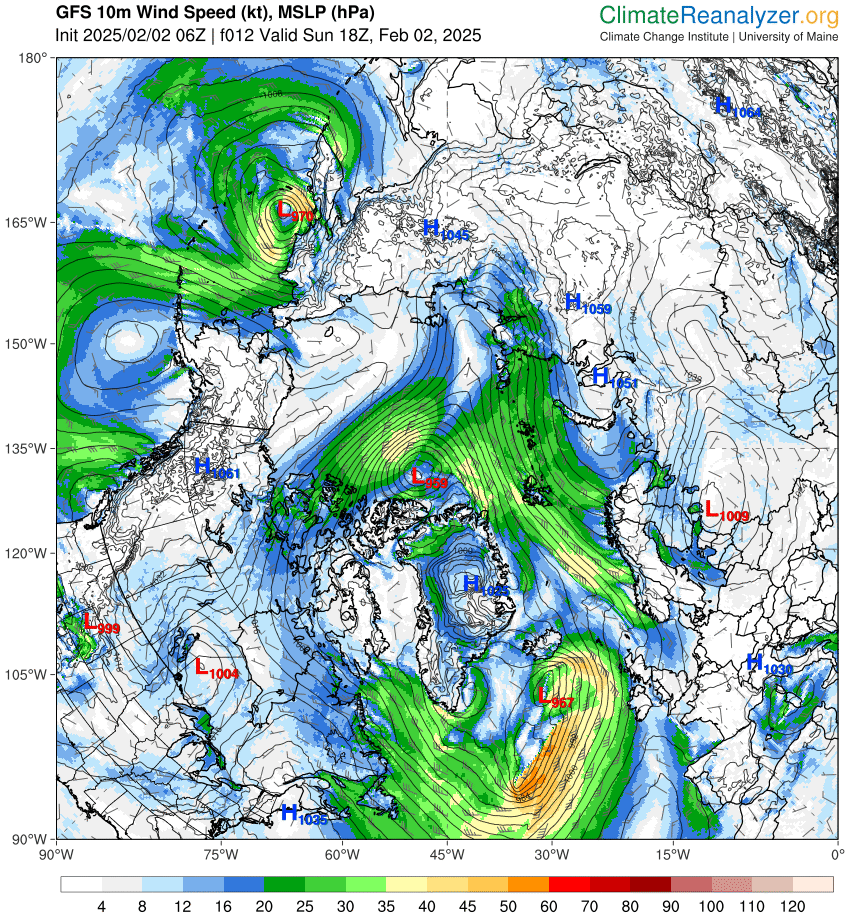
By this morning Ingunn had merged with the remnants of the prior cyclone, as revealed in Climate Reanalyzer’s visualisation of the latest GFS model run::
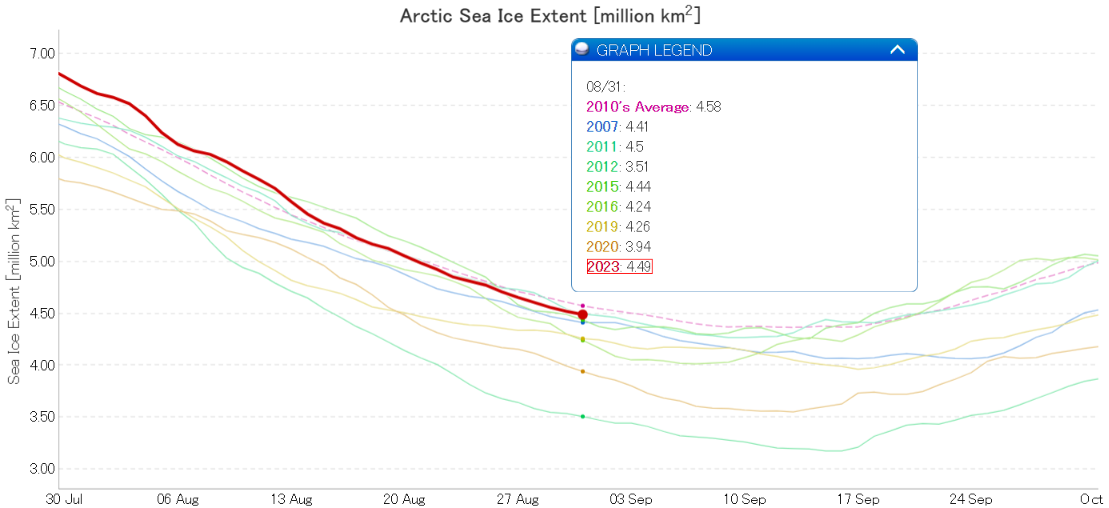
There’s lots of coverage specifically about assorted Arctic sea ice extent metrics over on the “2023 Minimum Extent” thread. However we’ll start the September open thread ball rolling with a couple of cross posted images.
At the end of August JAXA daily extent was 7th lowest for the date, at 4.49 million km² :
The median prediction of the contributors to the August call by the Sea Ice Prediction Network for the September monthly average extent is 4.6 million km² :
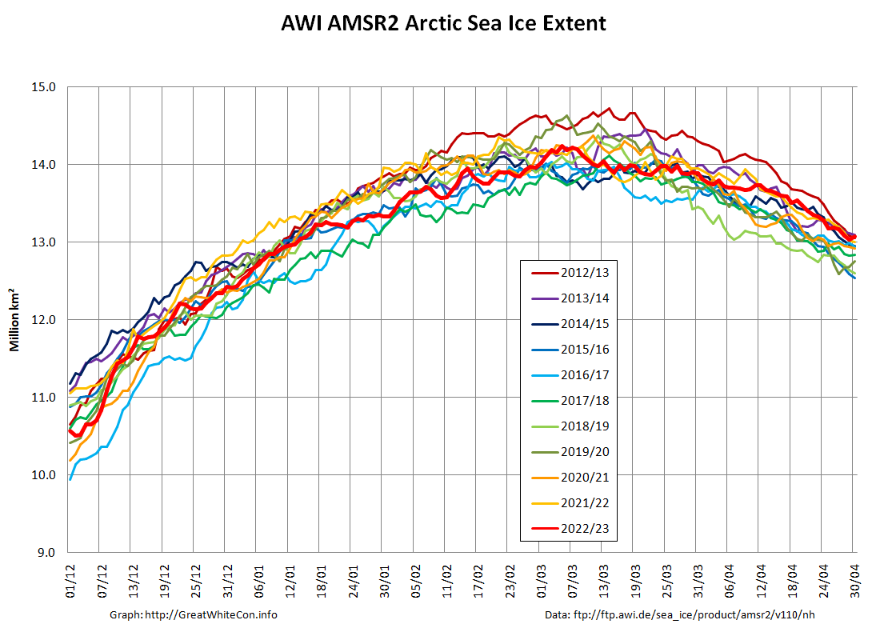
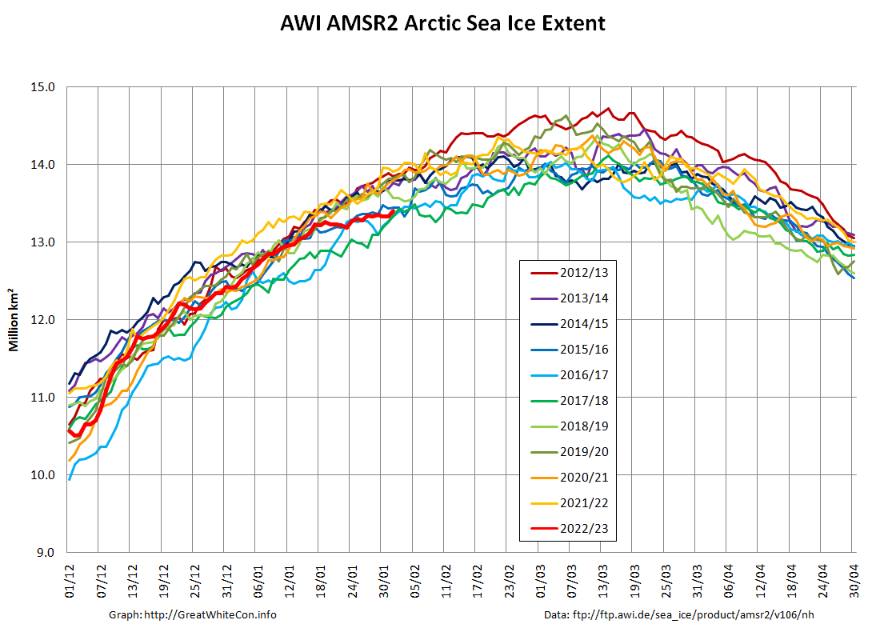
A new month has arrived, and during January several Arctic sea ice metrics have been drifting towards the bottom of their respective decadal ranges. To begin with here is AWI’s high resolution AMSR2 extent graph, which is currently very close to being lowest for the date in the AMSR2 record:
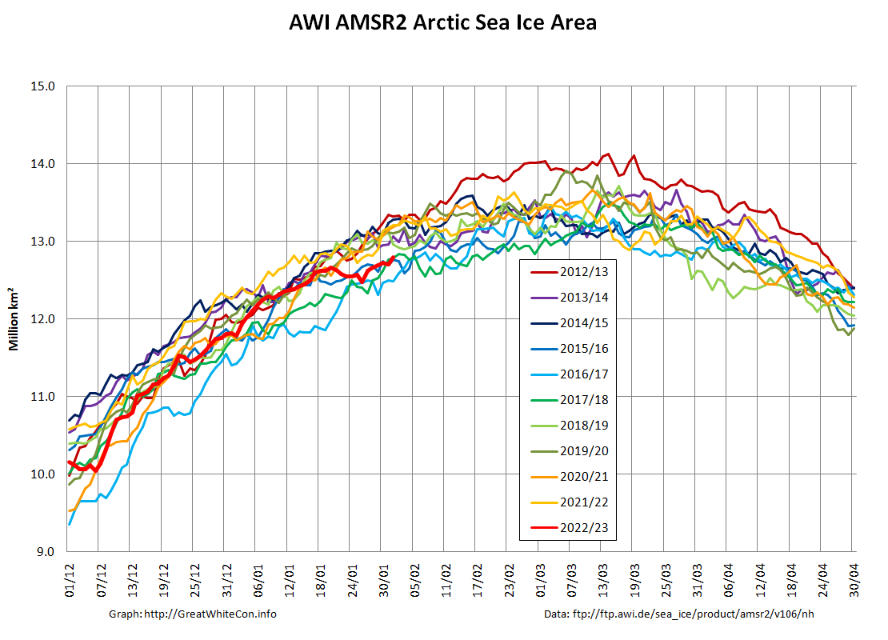
However that is less the case for area:
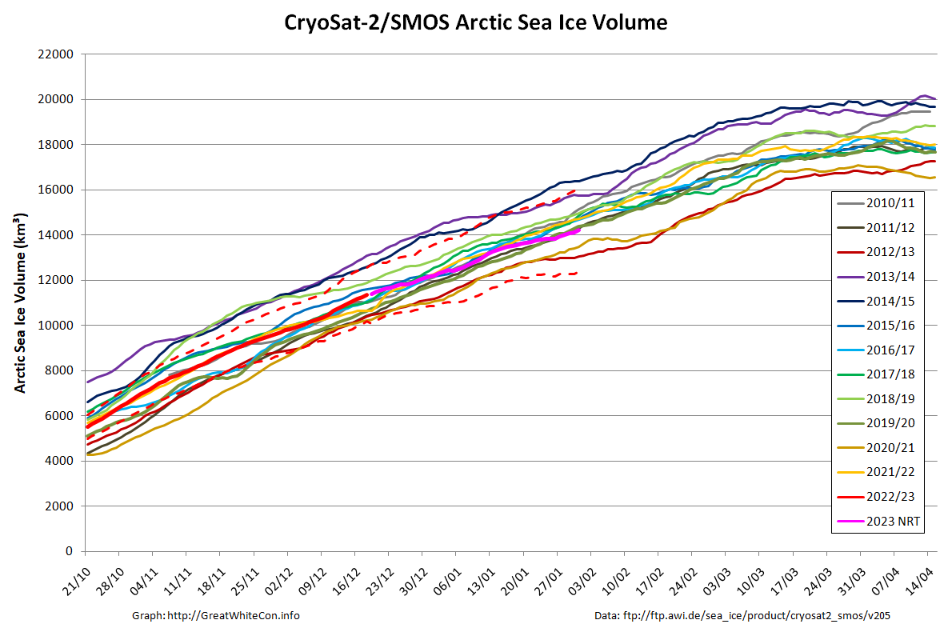
Taylor is keen to see the PIOMAS volume data for January, but whilst we wait for the latest Polar Science Center update here is the CryoSat-2/SMOS volume graph, which now includes a couple of month’s worth of reanalysed results as well as more recent near real time numbers:
Here too is the start of month CS2/SMOS thickness map:
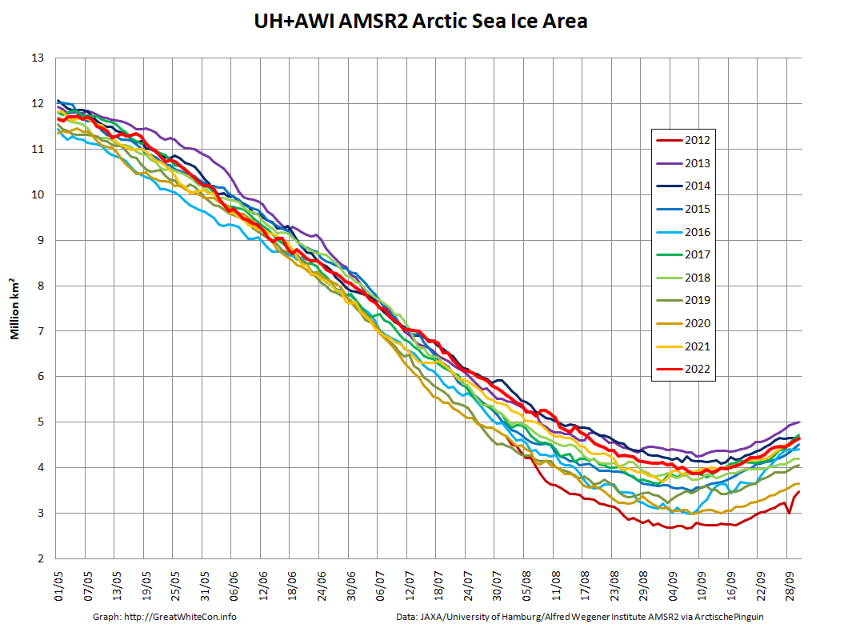
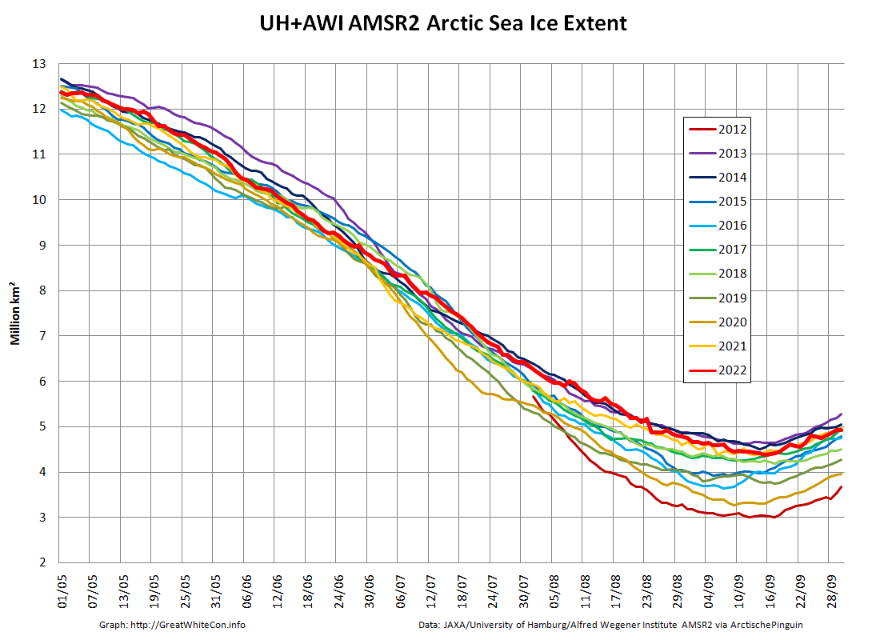
The 2022/23 freezing season has begun, so to begin with here are Arctic sea ice area and extent during its early stages:
Both metrics are currently tracking 2021 quite closely.
Here too is an AMSR2 animation of the transition from melting to freezing in the Central Arctic. Click to animate, and be warned that the file size is almost 10 Mb:
[Edit – October 4th]
Another big storm is heading for the Chukchi Sea. The GFS forecast currently shows a sub 960 hPa low developing on Thursday:
A new month begins today, and at the moment it looks as though it’s going to be the most interesting one since August 2012. Here once again is the satellite image of the enormous cyclone that was spinning over the Beaufort/Chukchi Seas just a few days ago:
Here too is the effect of the cyclone on the trajectory of the JAXA Arctic sea ice extent graph:
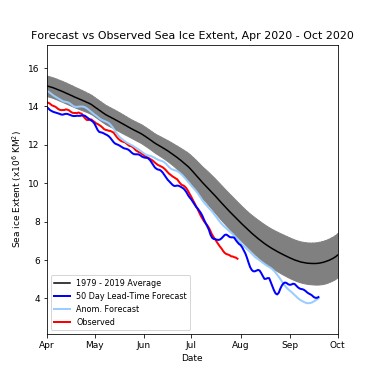
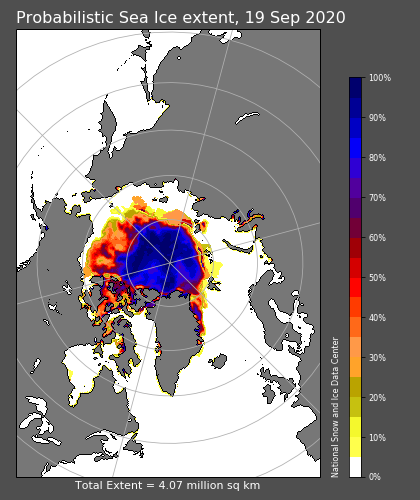
Here too is the current prognosis of the late Andrew Slater’s “Slater Probabilistic Ice Extent” 50 day forecast:
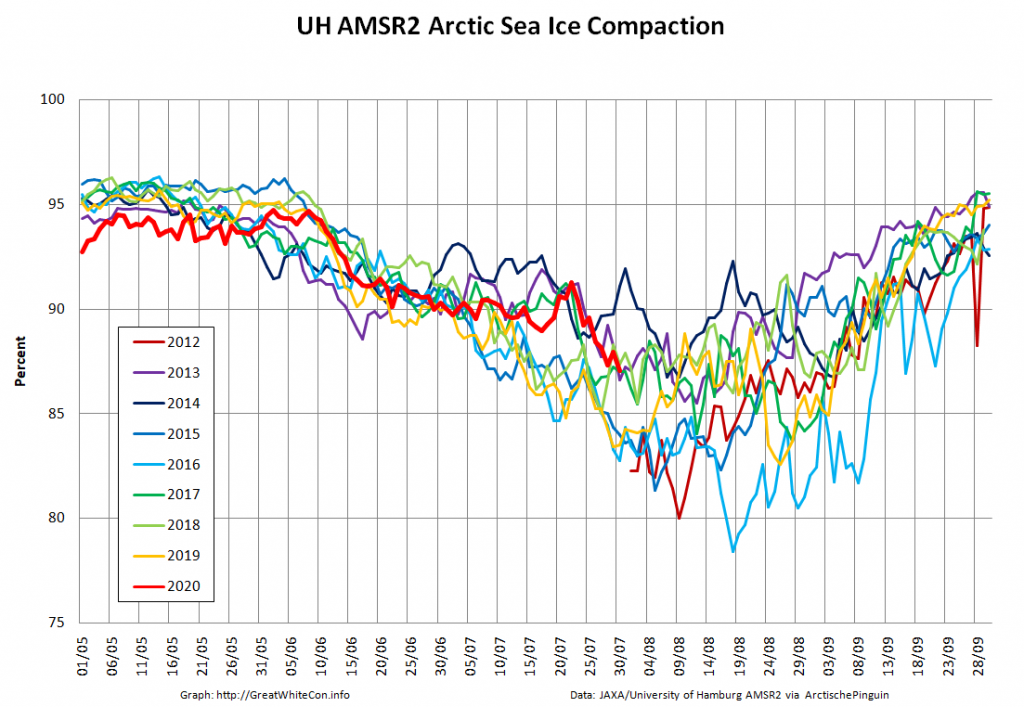
The cyclone has obviously resulted in a reduction in the rate of extent decline, but take a look at the high resolution AMSR2 “compaction” graph:
The gaps between the remaining sea ice floes have evidently increased, and hence the ice area is declining more rapidly than its extent.
[Edit – August 2nd]
Here’s an animation, based on the University of Hamburg’s AMSR2 concentration maps, which reveals the motion of the sea ice across the Beaufort and Chukchi Seas for the last two months:
Note in particular the side effects of the recent cyclone, visible at the end of the video.
Here too is a close up of the current state of the remaining ice in the Chukchi Sea, snapped by the Suomi NPP satellite through a gap in the clouds:
Plus the current open water north of Greenland. Perhaps once Polarstern has been flushed out into the open water of the Fram Strait at the end of the MOSAiC expedition she could take another look at this almost completely unexplored area of the Arctic Ocean?
[Edit – August 6th]
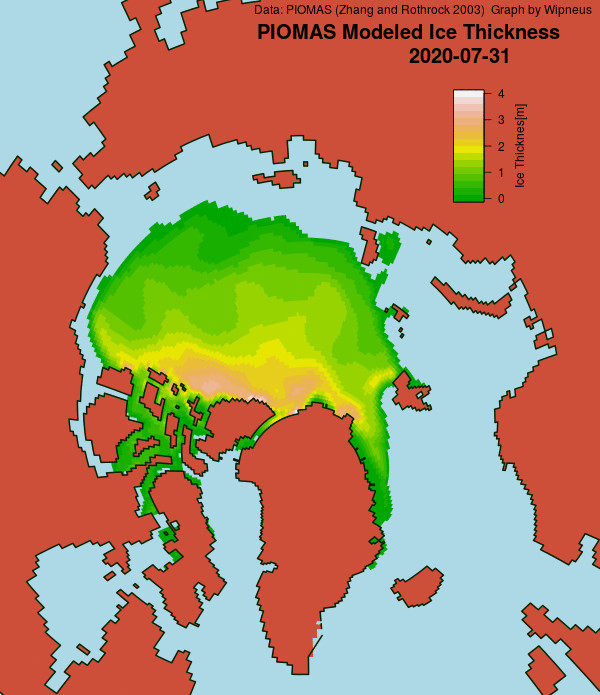
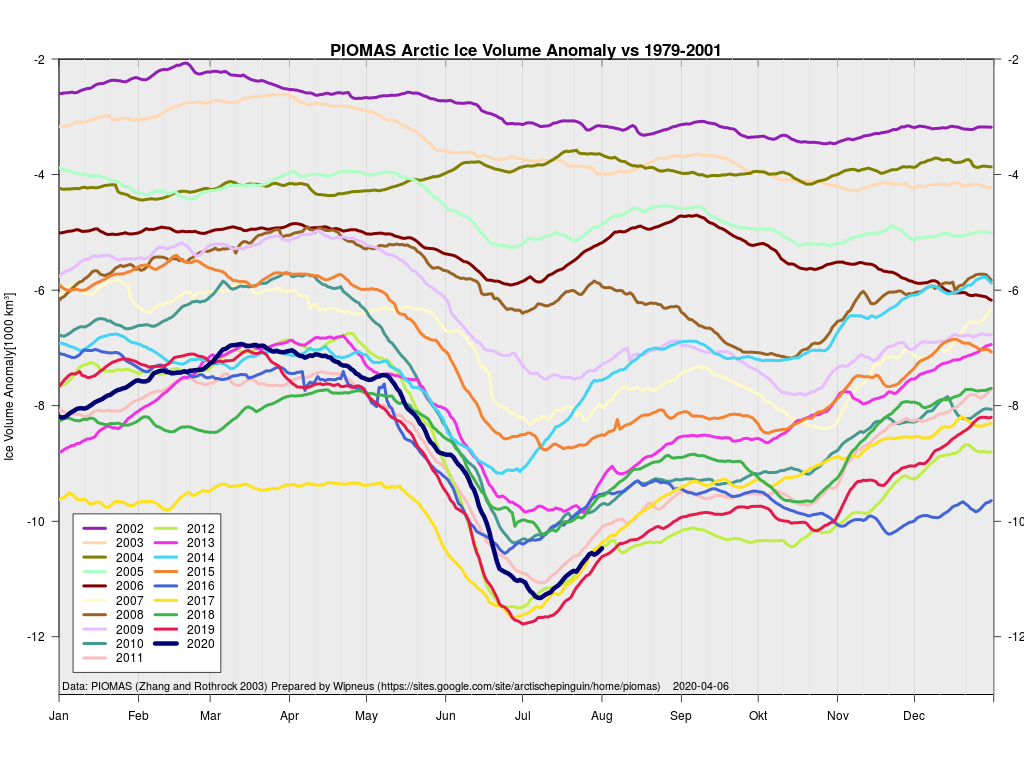
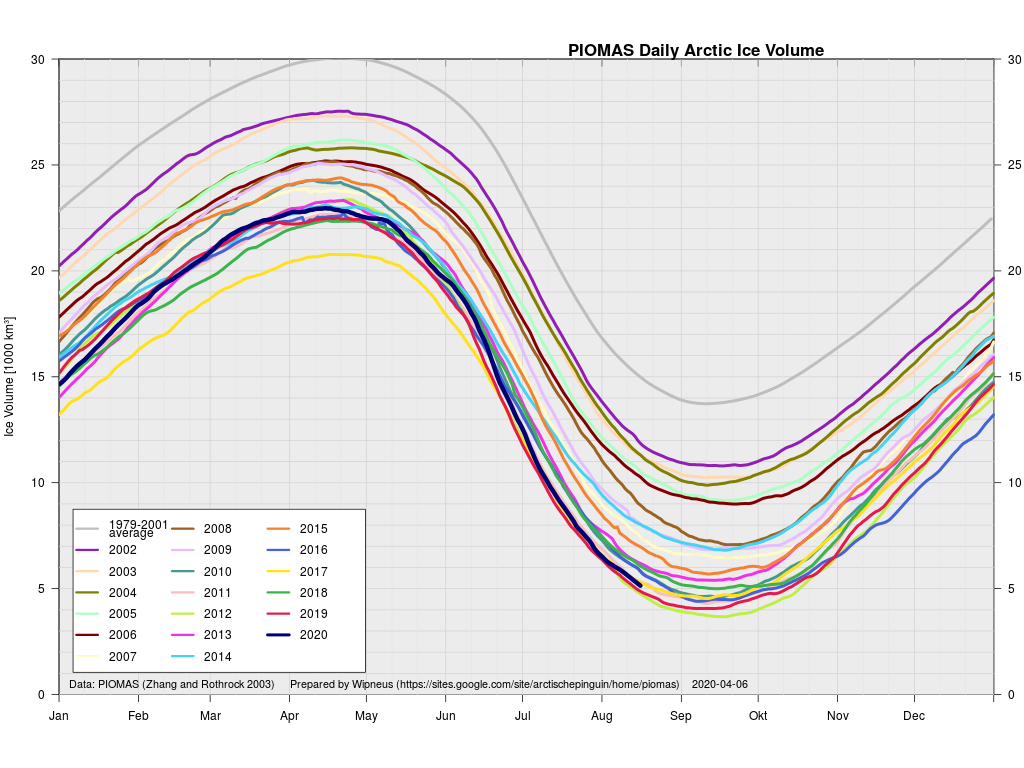
The latest gridded thickness data has been released by the PIOMAS team, and here are Wipneus’s visualisations:
Average Arctic sea ice volume in July 2020 was 9,300 km3. This value is only 400 km3 above the record minimum value of 8,900 km3 set in 2019. This makes 2020 the fourth lowest on record for July with 2012, 2017,2019 falling just below 2020.
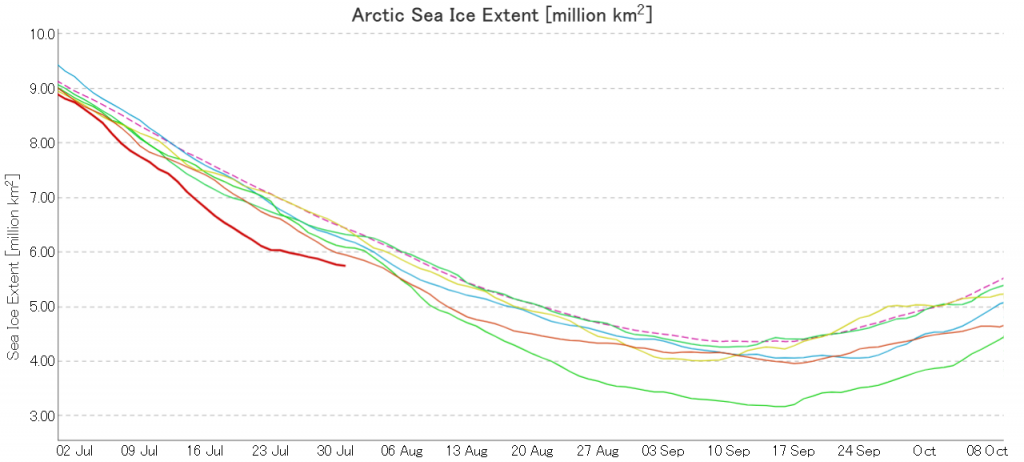
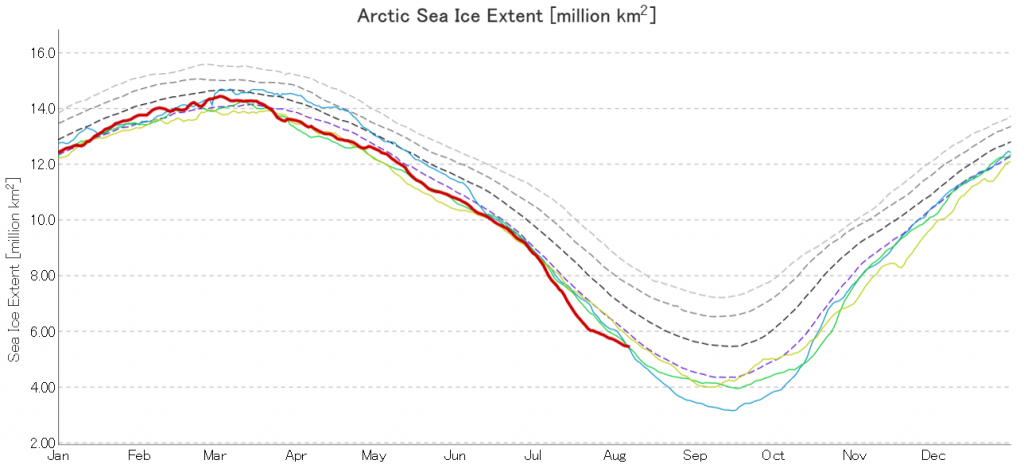
JAXA extent is still lowest for the date, but following the recent cyclone it looks as though it will not maintain that position for much longer:
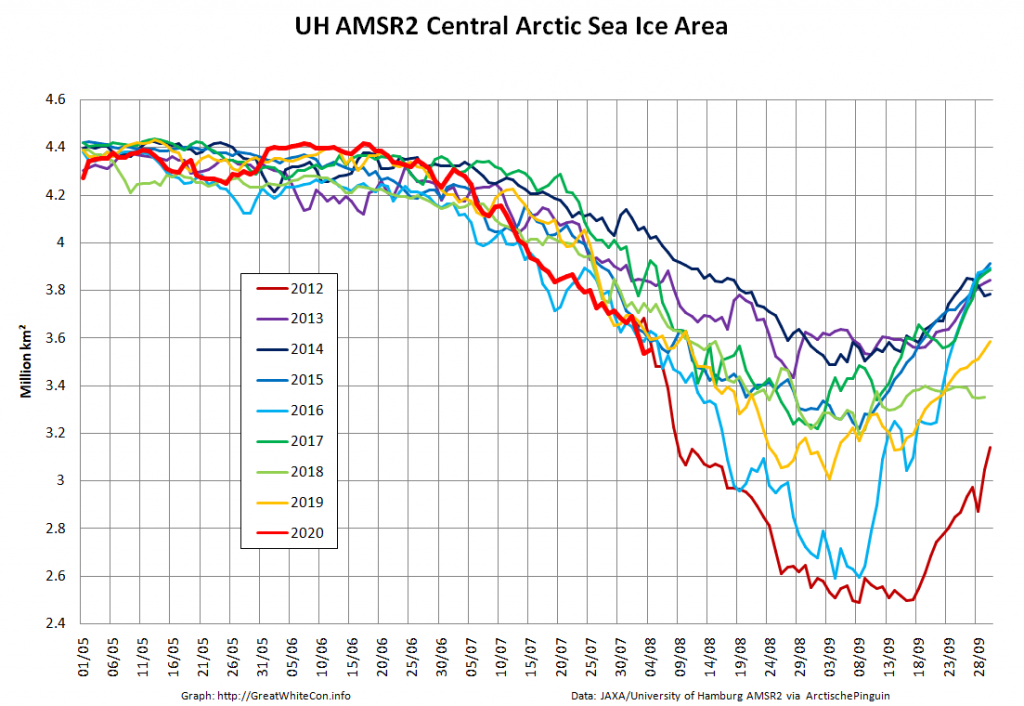
Now we’re in the month of August it’s possible to do a direct comparison with AMSR2 data for 2012. Here’s sea ice area for the Central Arctic Basin:
[Edit – August 8th]
All of a sudden JAXA extent is in 3rd place in the race to the minimum:
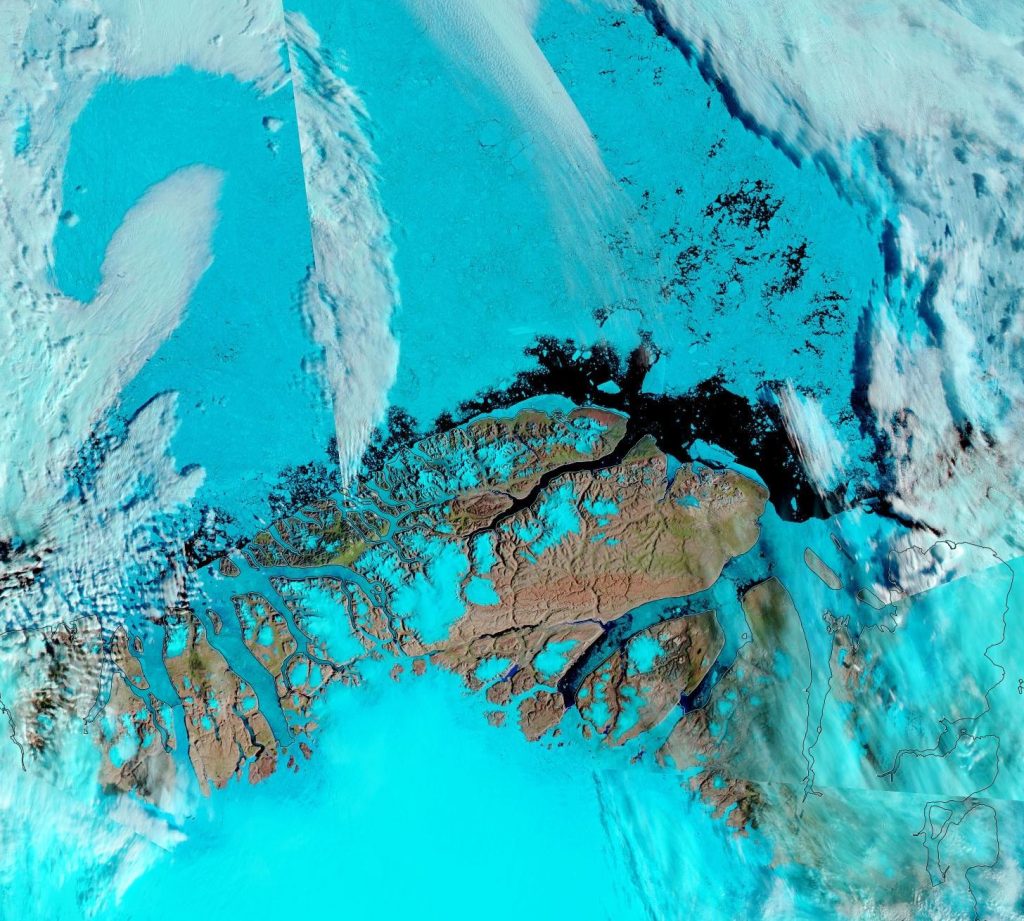
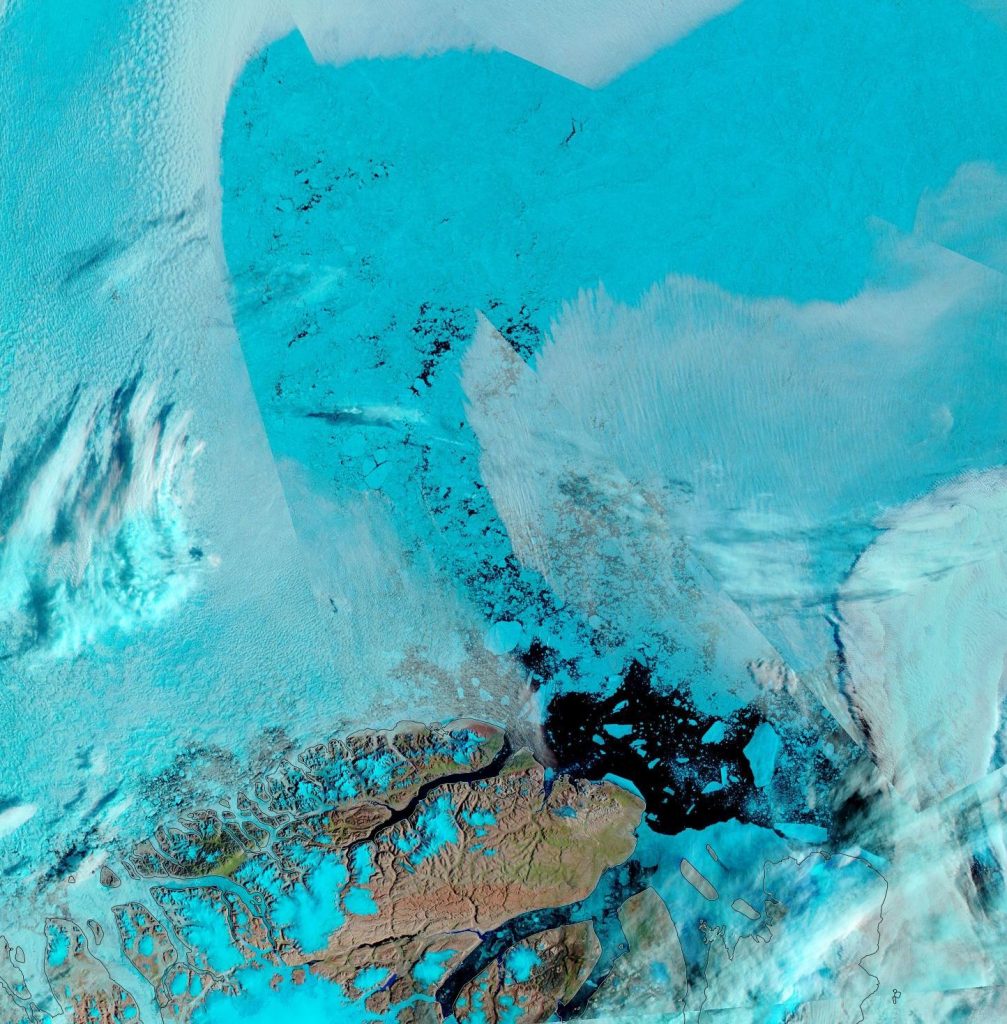
However let’s also take a close look at the state of the sea ice in the Beaufort and Wandel Seas shall we?
At this juncture I reckon that come mid September second place is now more likely than first. However as always, it still all depends on the weather.
[Edit – August 9th]
Surprising as it may seem, high resolution AMSR2 Central Arctic Basin sea ice area has so far managed to keep up with the precipitous drop in 2012:
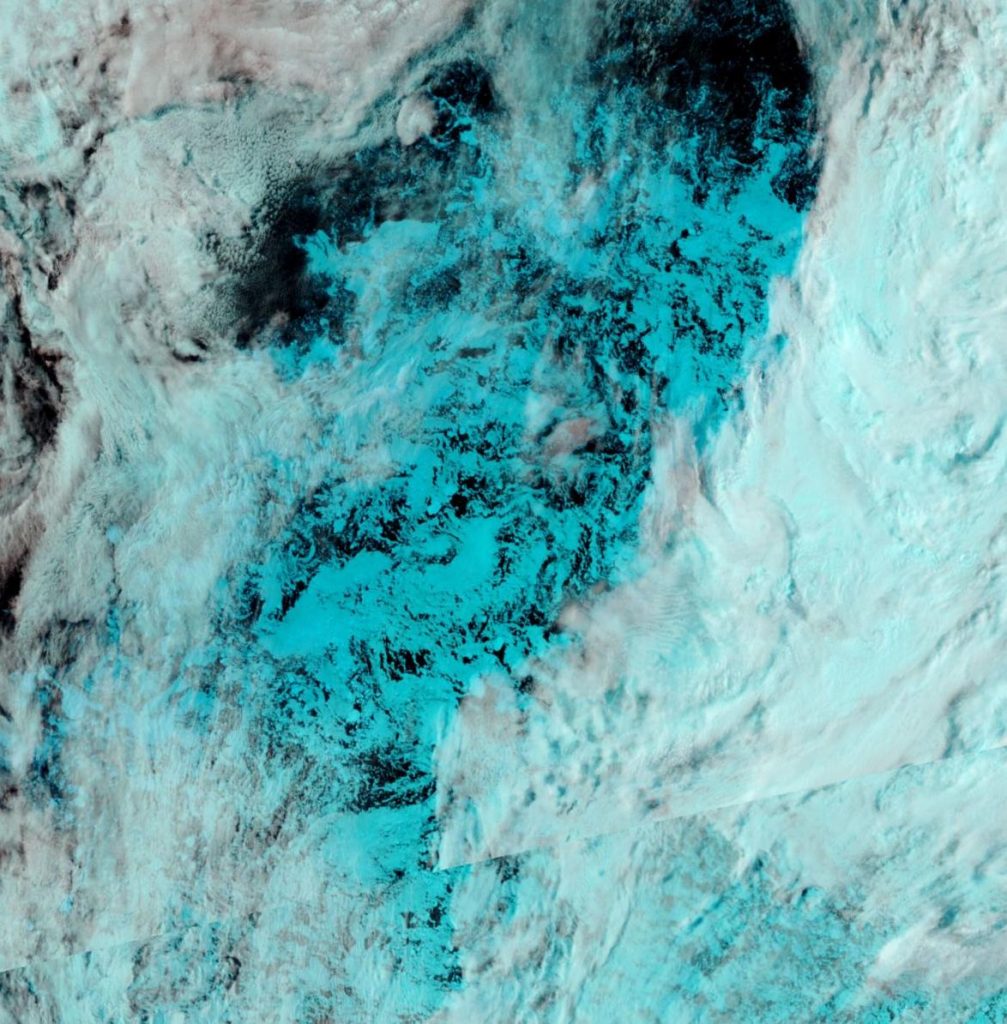
North of Greenland the clouds have cleared closer to the North Pole, to reveal this:
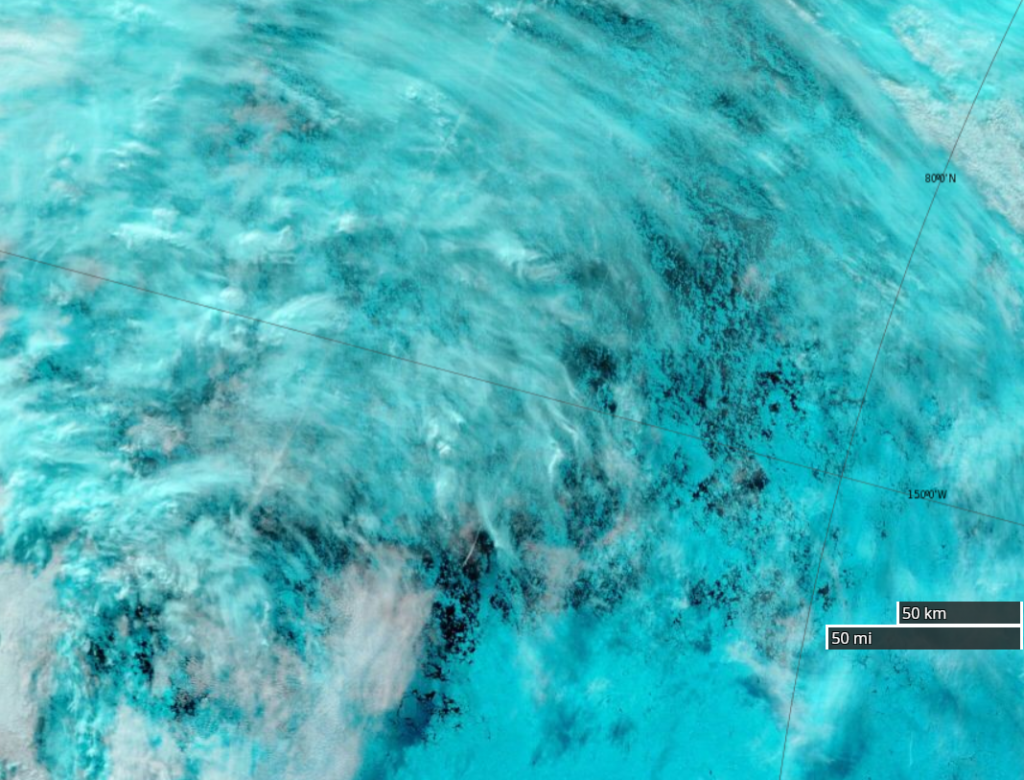
Fresh this morning from Terra, a rather cloudy view of the devastation near 80N, 150W:
[Edit – August 10th]
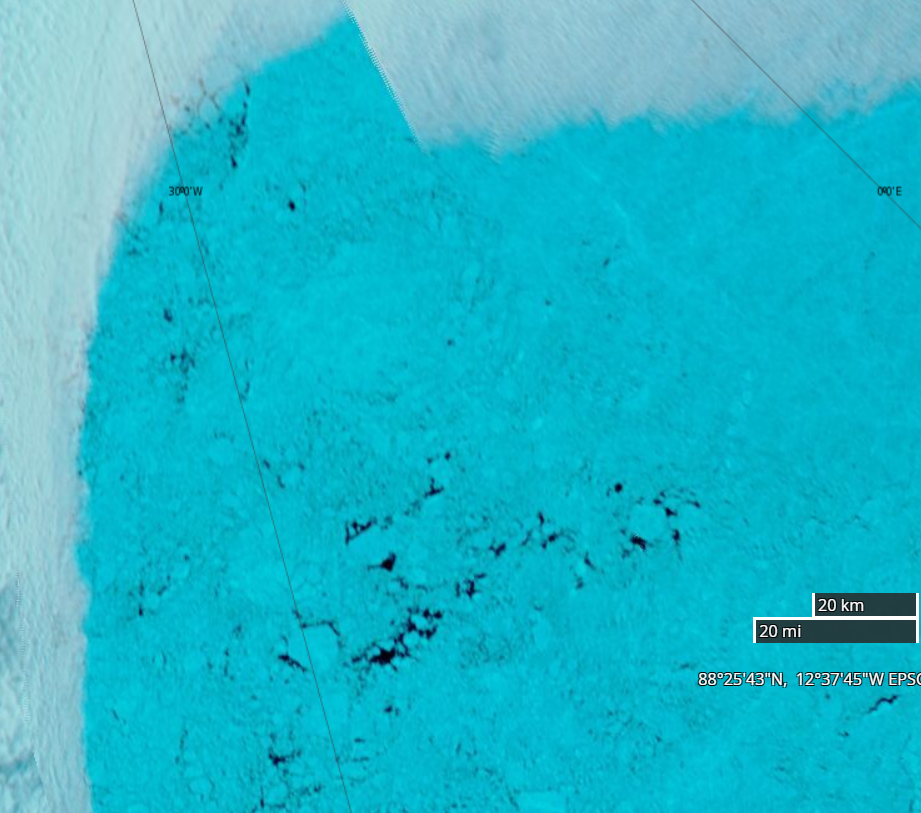
In a not entirely unexpected development one of ex Prof. Judy’s denizens is quibbling about the current condition of sea ice in the Arctic. Hence here is a close up of some “gaping holes in the sea ice cover” at 88N between Greenland and the North Pole:
[Edit – August 13th]
A nice clear view this morning of the marginal ice zone of the “Laptev Bite” and thereabouts from the Suomi satellite :
[Edit – August 16th]
JAXA AMSR2 extent has fallen below 5 million km²:
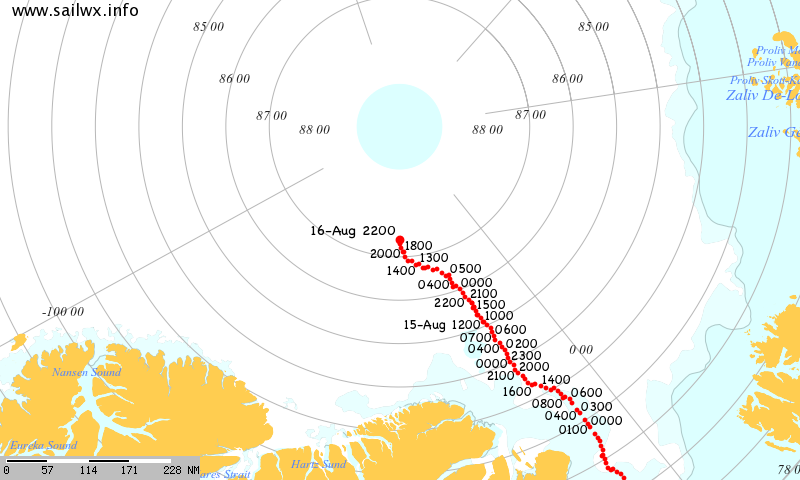
Having been flushed out of the Central Arctic through the Fram Strait the polar research vessel Polarstern is back, seemingly intent on taking a close look at the North Pole:
[Edit – August 19th]
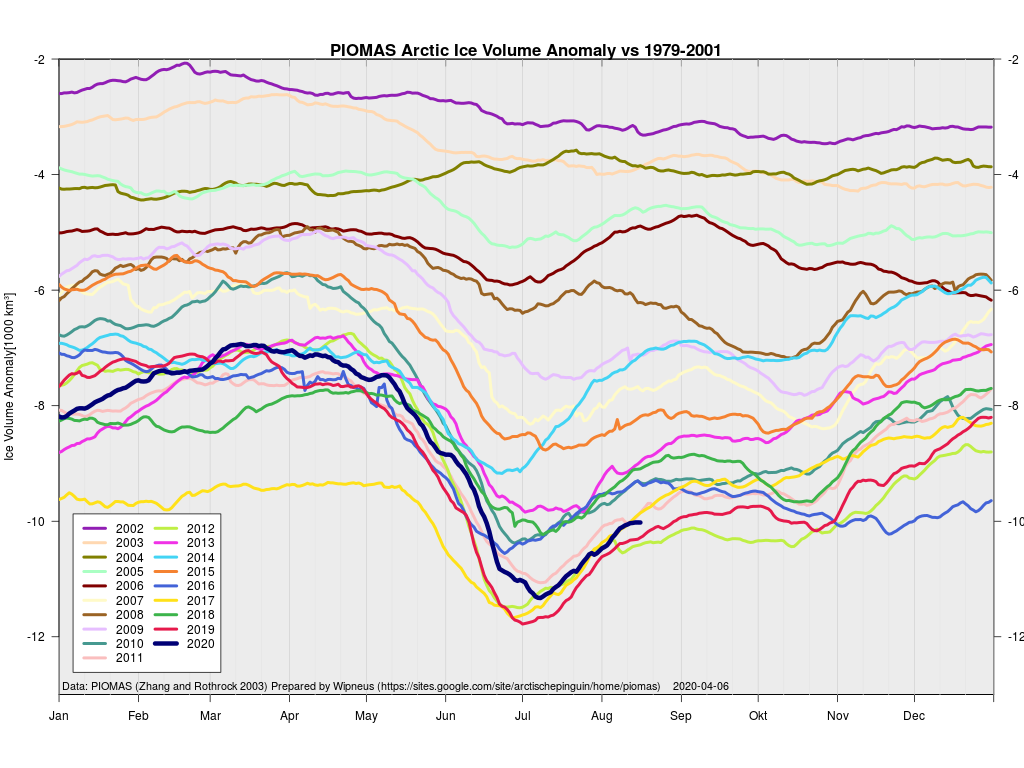
The mid month PIOMAS gridded thickness numbers have been published:
According to the Polar Science Center model Arctic sea ice volume is currently third lowest after 2012 and 2019.
[Edit – August 24th]
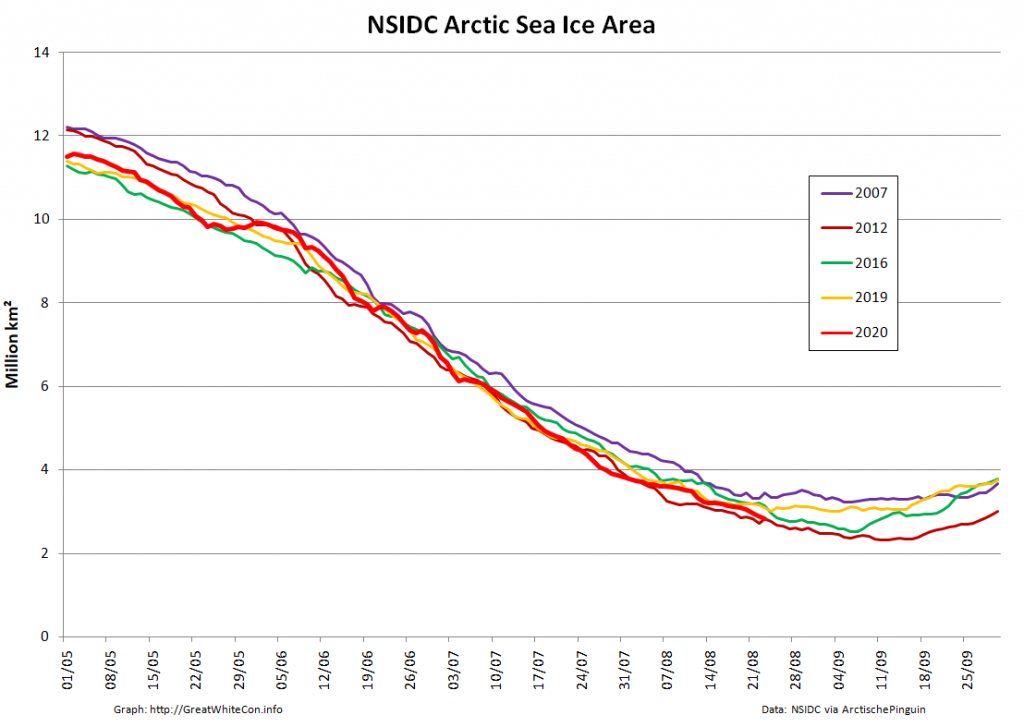
Arctic sea ice area based on NSIDC concentration data is now in a “statistical tie” with 2012 for the honour of “lowest for the date” in the satellite record:
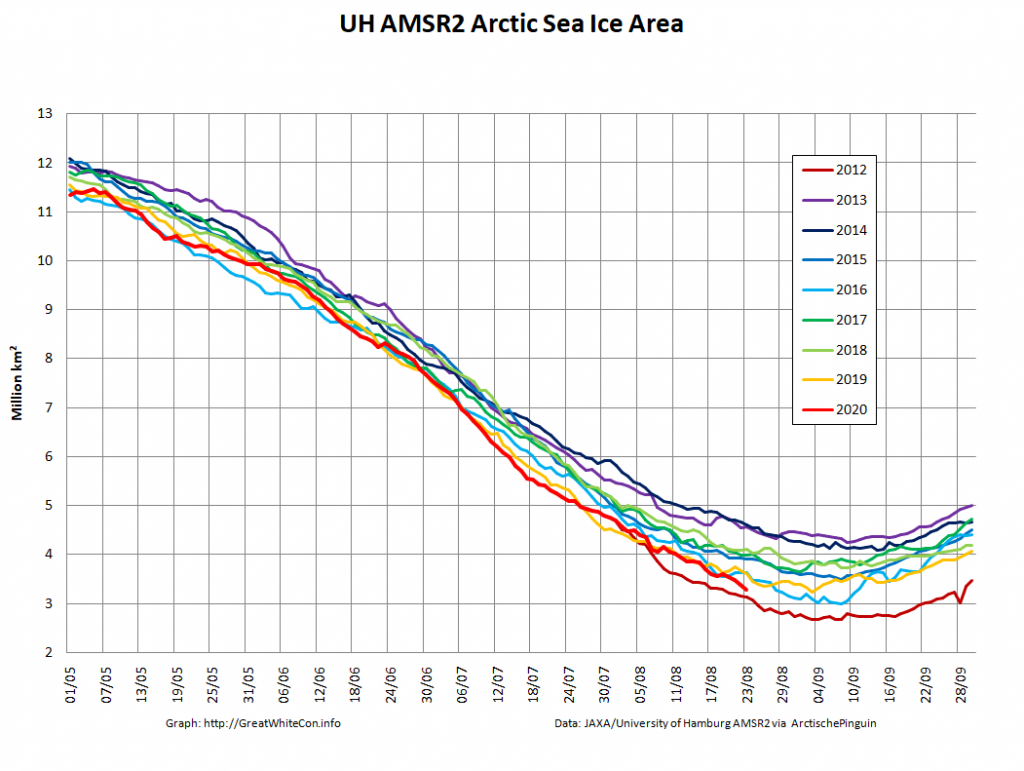
High resolution AMSR2 area isn’t far behind:
[Edit – August 24th]
A nice clear view of the disintegrating sea ice north of the East Siberian and Chukchi Seas yesterday:
Watch this space very closely for the next few weeks!
This website uses cookies to improve your experience. We'll assume you're ok with this, but you can opt-out if you wish. Cookie settingsACCEPT
Privacy & Cookies Policy
Privacy Overview
This website uses cookies to improve your experience while you navigate through the website. Out of these, the cookies that are categorized as necessary are stored on your browser as they are essential for the working of basic functionalities of the website. We also use third-party cookies that help us analyze and understand how you use this website. These cookies will be stored in your browser only with your consent. You also have the option to opt-out of these cookies. But opting out of some of these cookies may affect your browsing experience.
Necessary cookies are absolutely essential for the website to function properly. This category only includes cookies that ensures basic functionalities and security features of the website. These cookies do not store any personal information.
Any cookies that may not be particularly necessary for the website to function and is used specifically to collect user personal data via analytics, ads, other embedded contents are termed as non-necessary cookies. It is mandatory to procure user consent prior to running these cookies on your website.