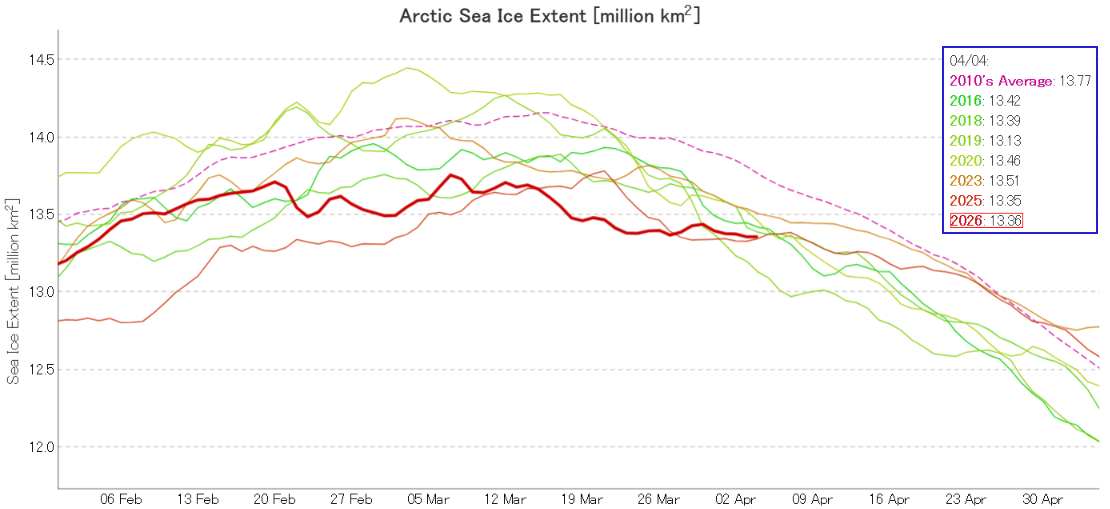
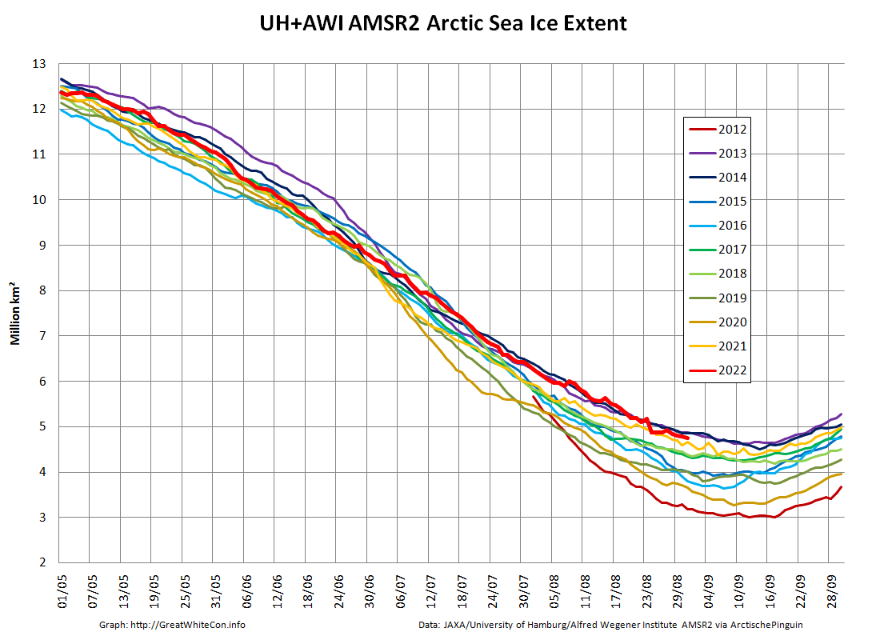
In early April JAXA Arctic sea ice extent is 3rd lowest for the date, albeit in a “statistical tie” with last year:
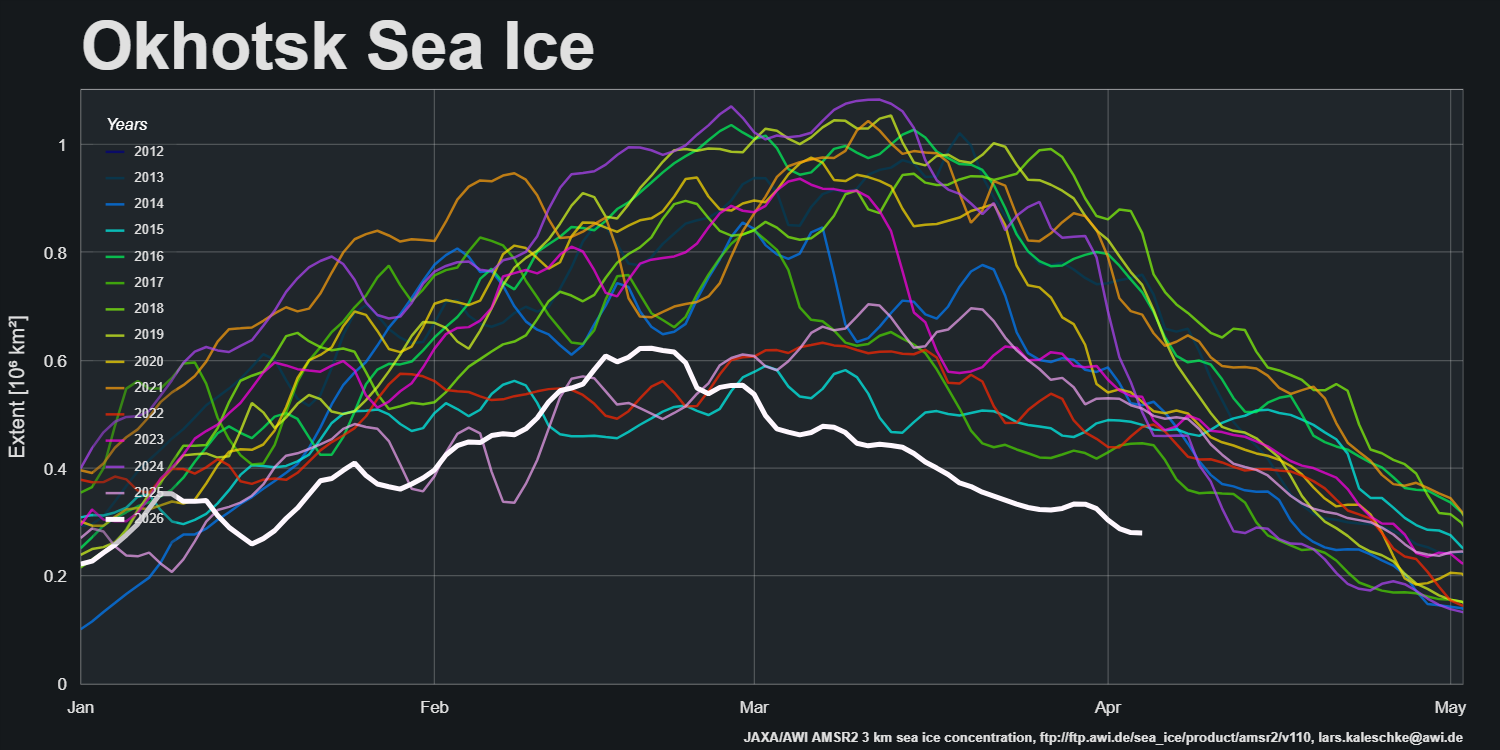
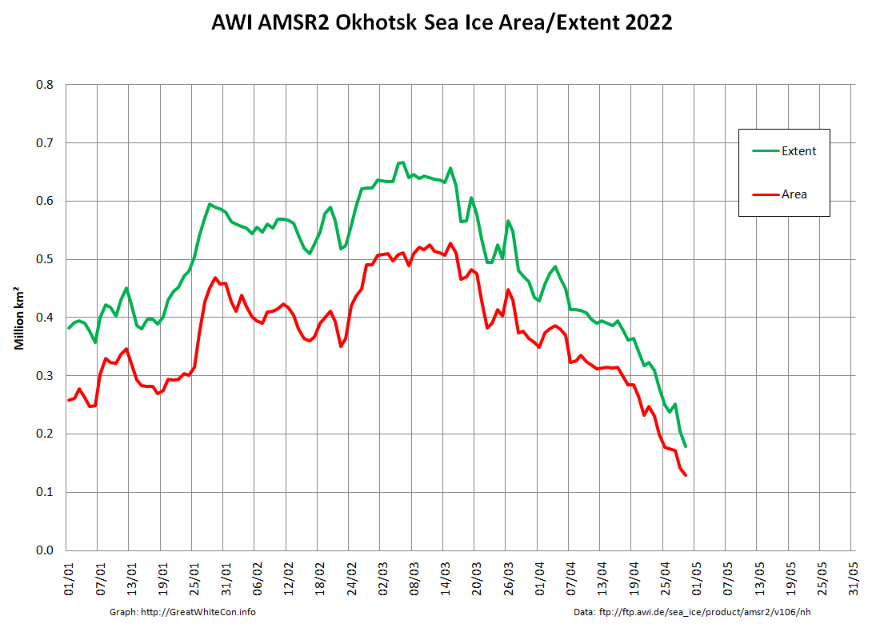
The Alfred Wegener Institute’s regional extent graphs reveal an intriguing divergence on the Pacific periphery, where sea ice extent in the Sea of Okhotsk is at an all time low for the date in the AMSR2 record:
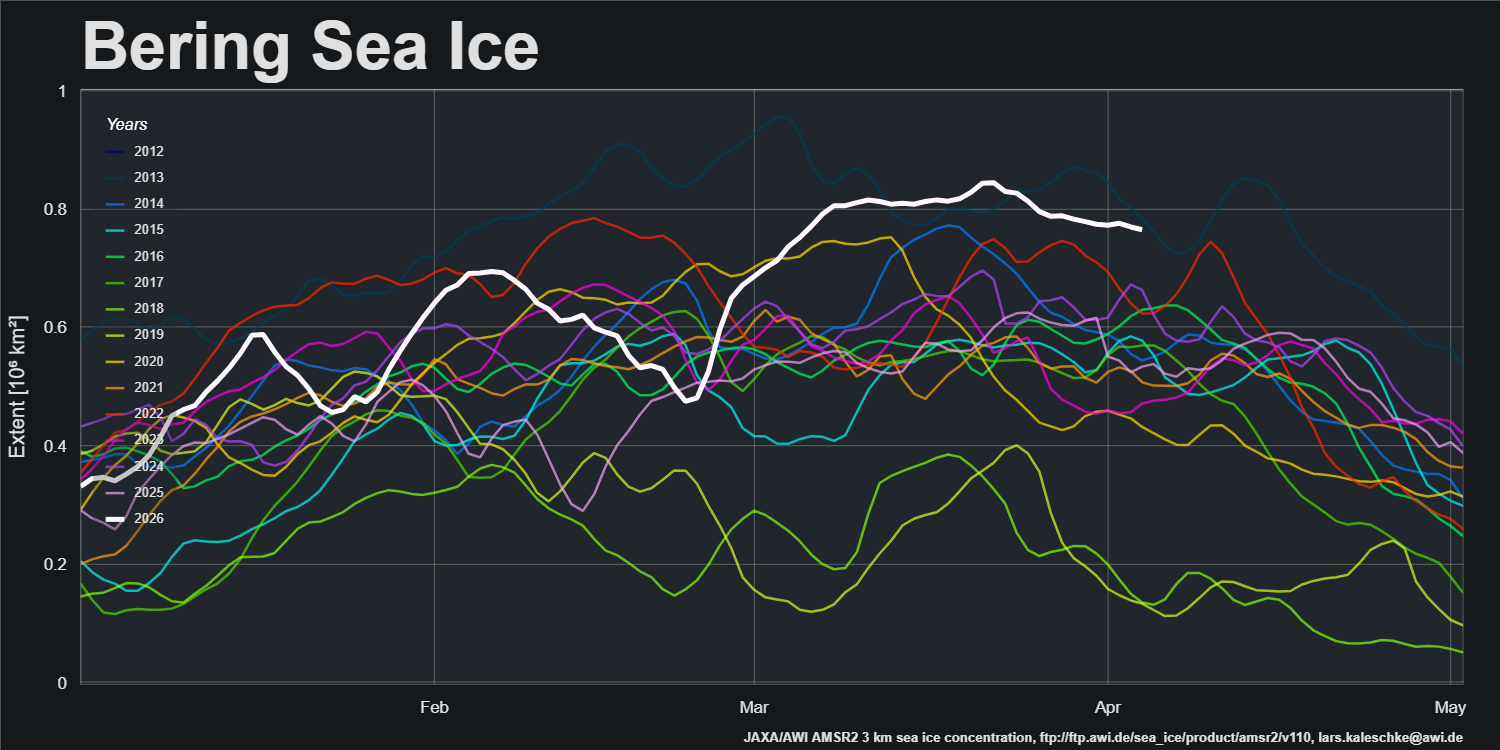
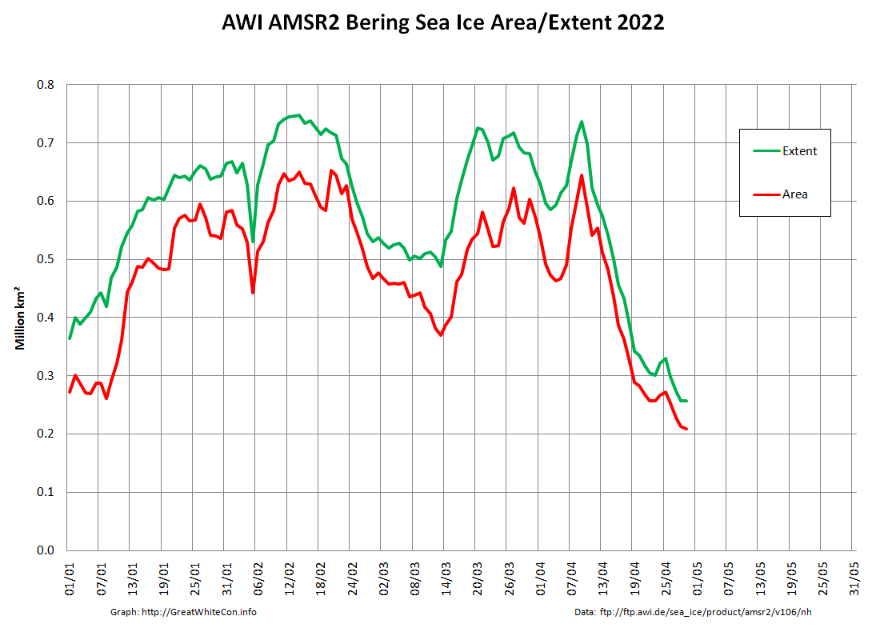
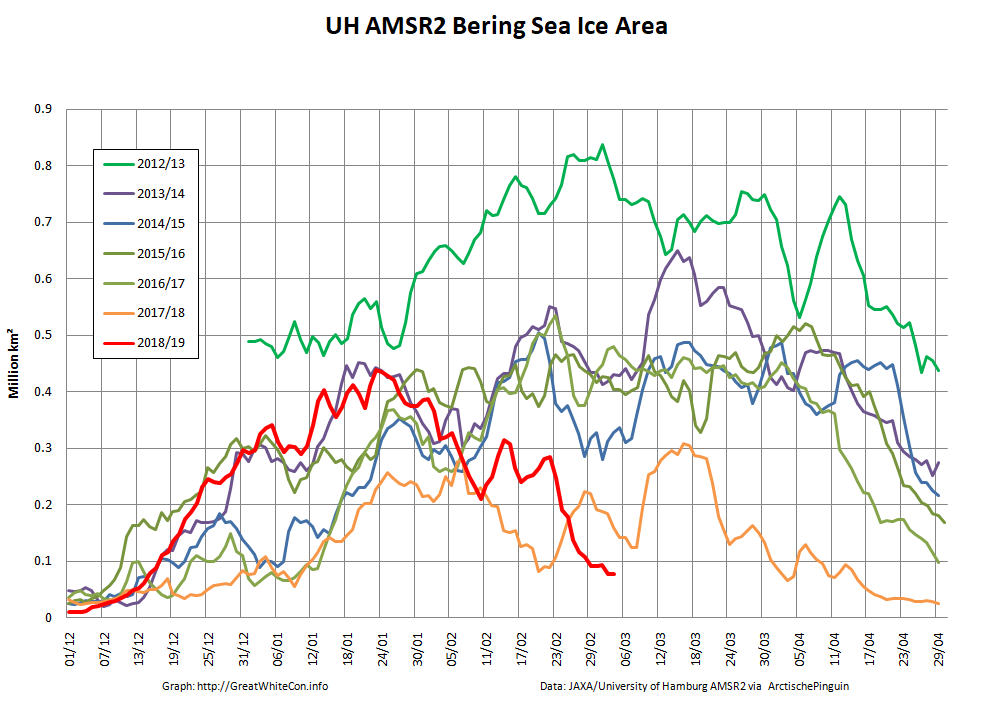
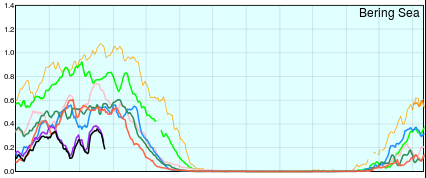
On the other hand extent in the Bering Sea is close to an all time high:
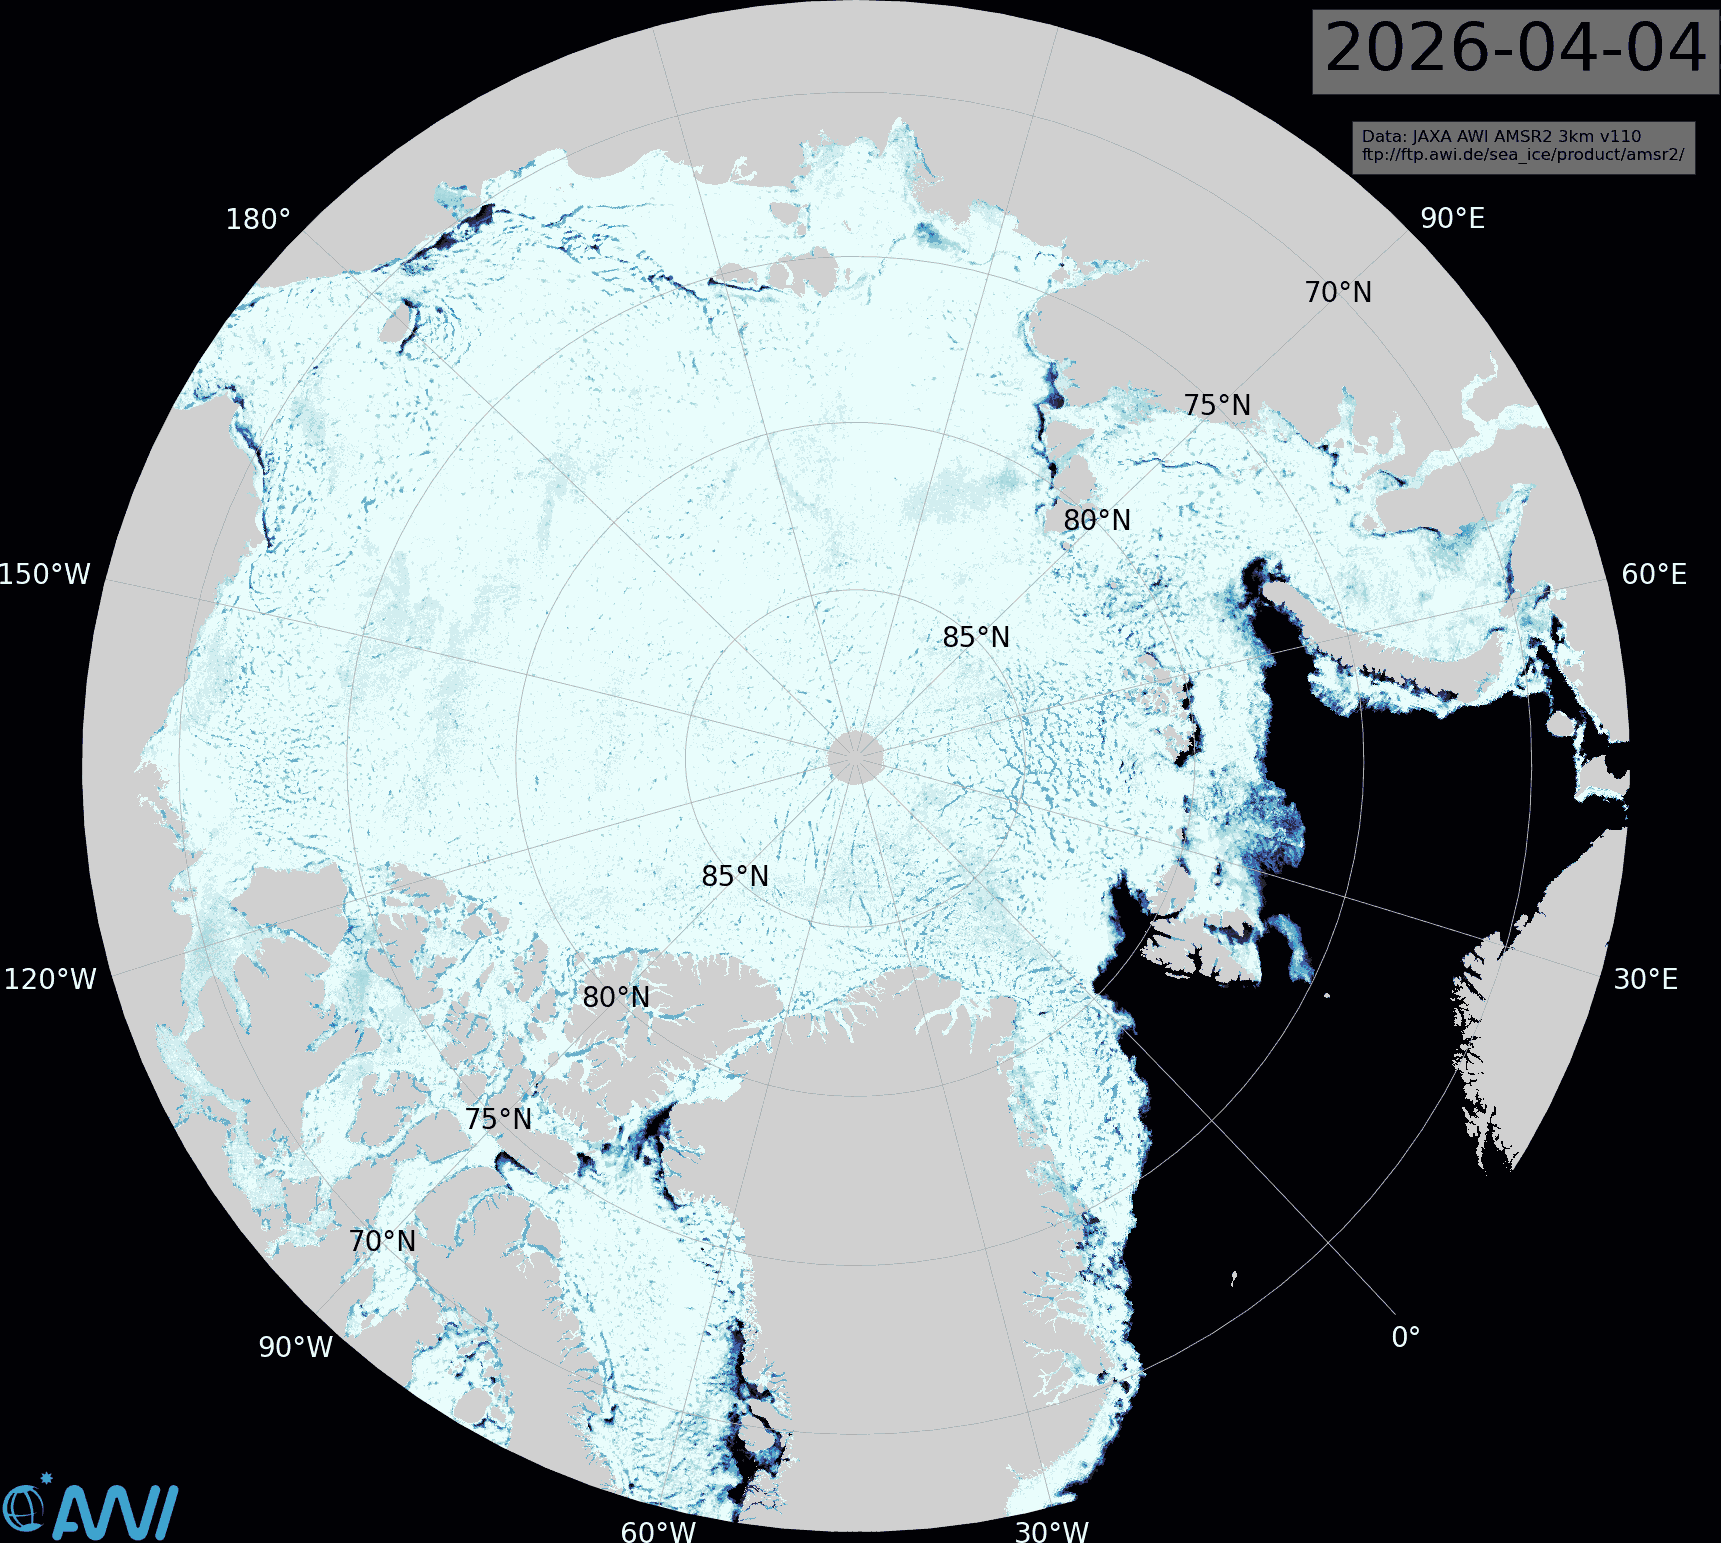
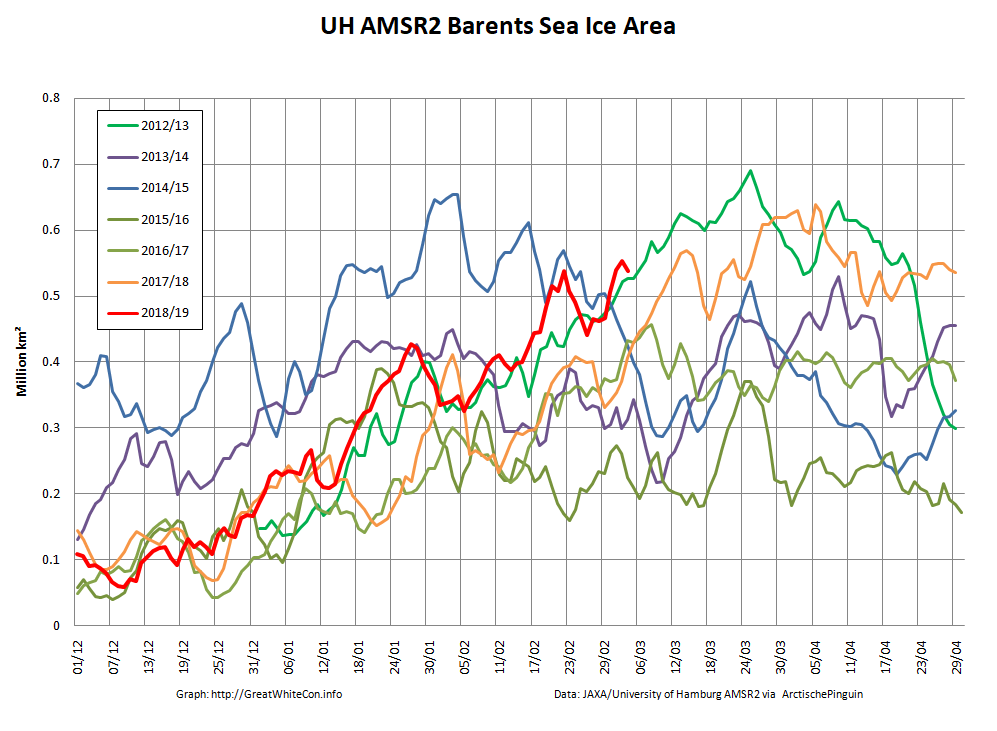
On the Atlantic periphery extent is less extreme, although there is currently open water north of Svalbard:
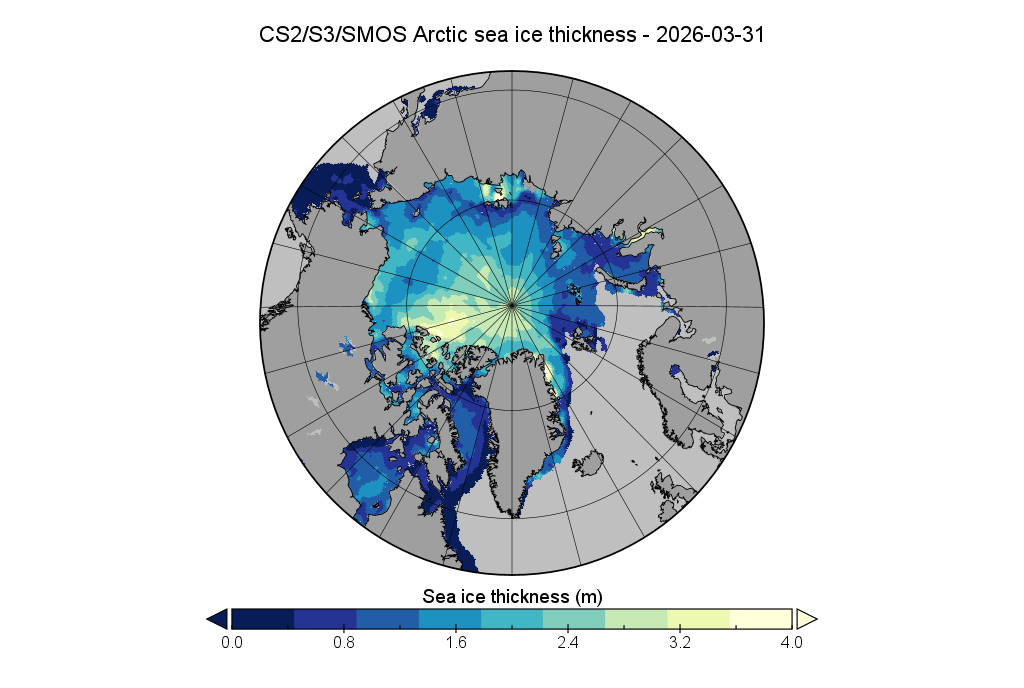
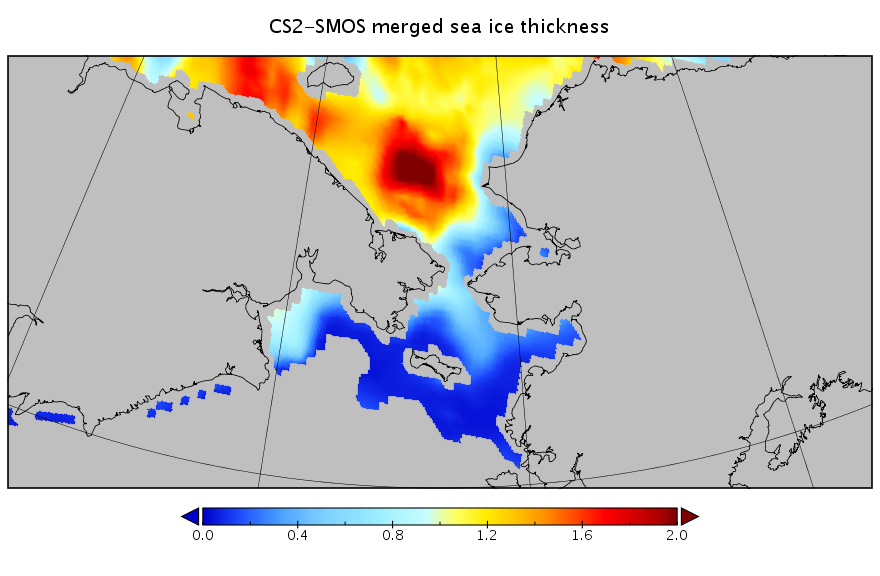
Note that thickness and hence volume is likely to be biased high on the Atlantic side of the Arctic due to continuous radio frequency interference affecting SMOS data:
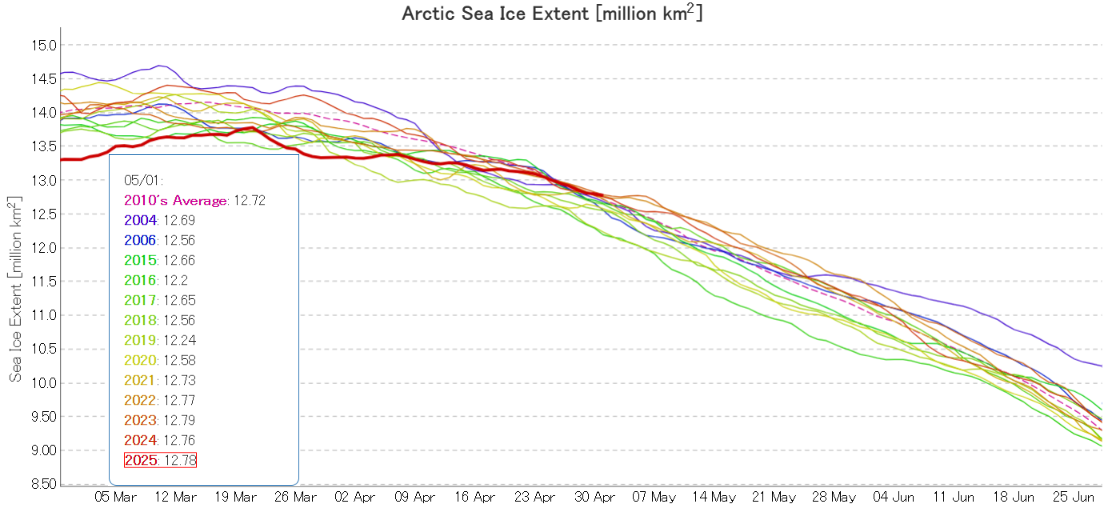
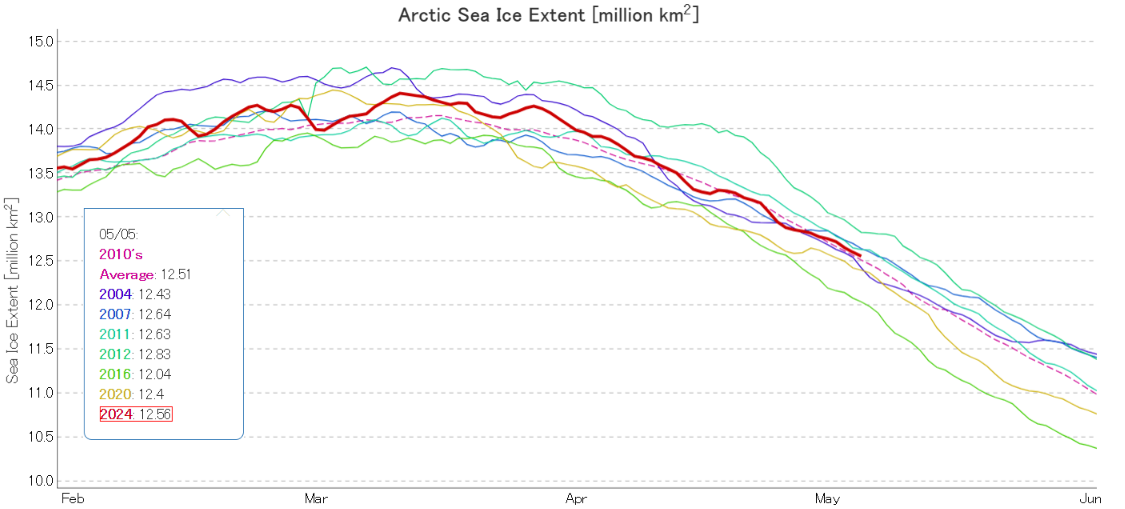
JAXA/ViSHOP extent is no longer “lowest for the date”! After “flatlining” for most of April the metric is now in the midst of a close knit group of the other years in the 2020s:
The high pressure area over the Central Arctic persisted through the second half of April, and so did the consequent drift of ice from the Pacific side of the Arctic to the Atlantic periphery:
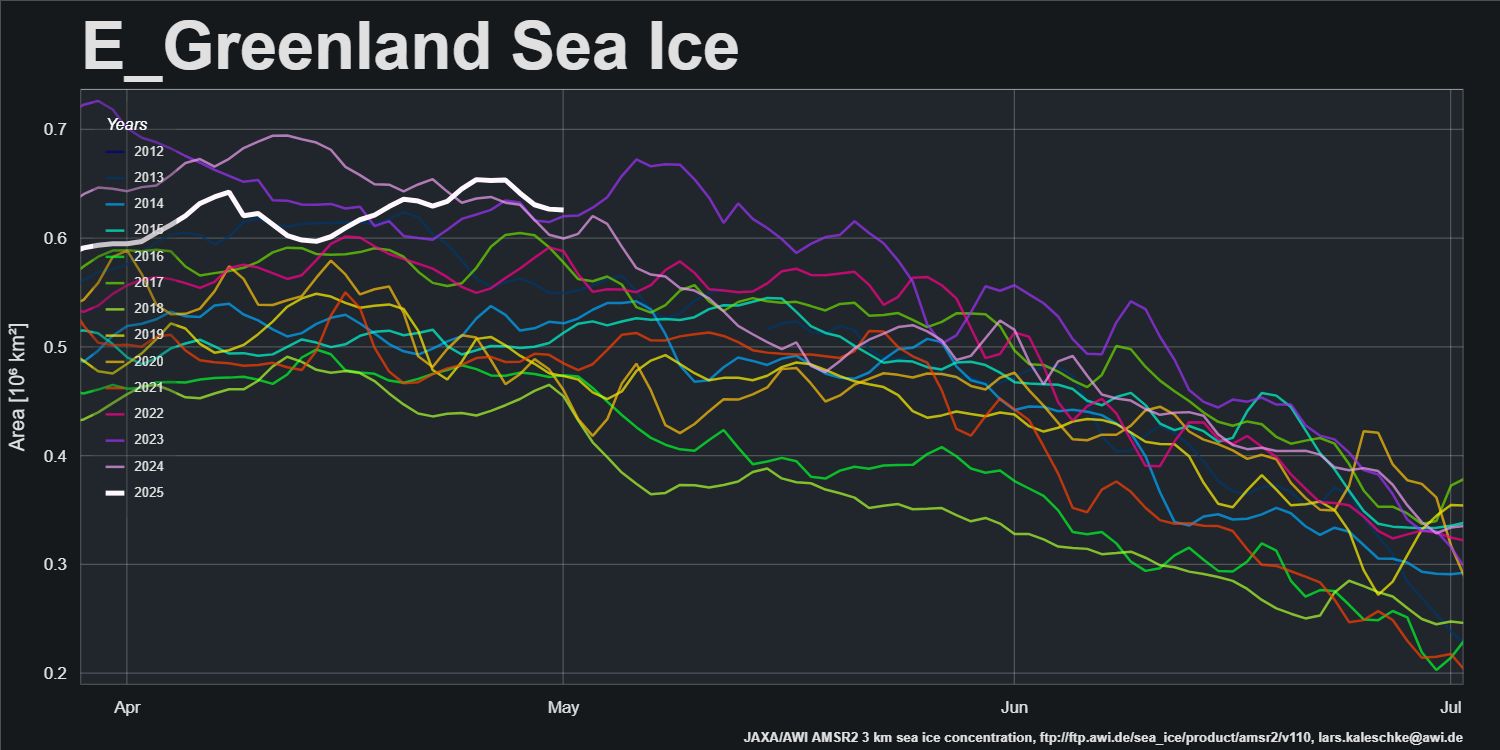
AWI’s sea ice area for the Greenland Sea is currently “highest for the date” in the AMSR2 record that started in July 2012:
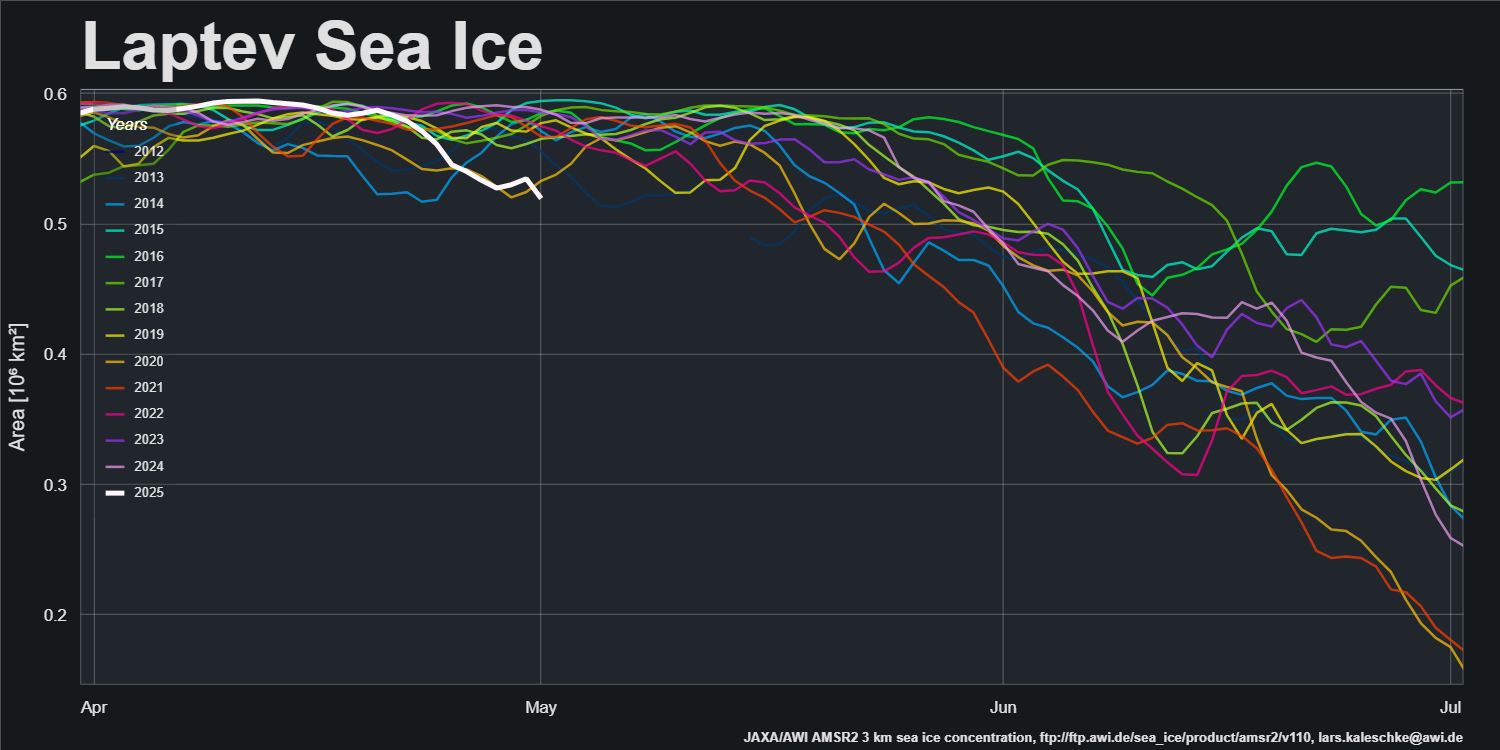
The offshore winds along the Laptev Sea coast have continued, and sea ice area is now “lowest for the date”:
The first signs of a break in the high pressure dominance are appearing. GFS currently forecasts that a low pressure area will enter the Central Arctic, bring above zero temperatures over the Kara Sea on Sunday:
Since a certain “sceptic” has recently been comparing 2024 sea ice extent to “20 years ago”, here’s the current JAXA/ViSHOP extent graph of selected years, including 2004:
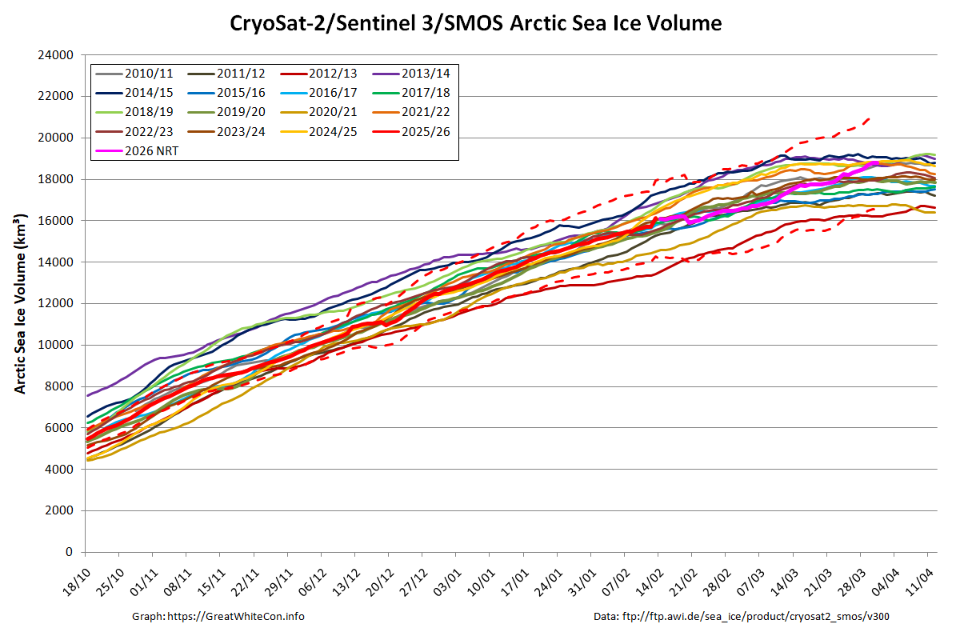
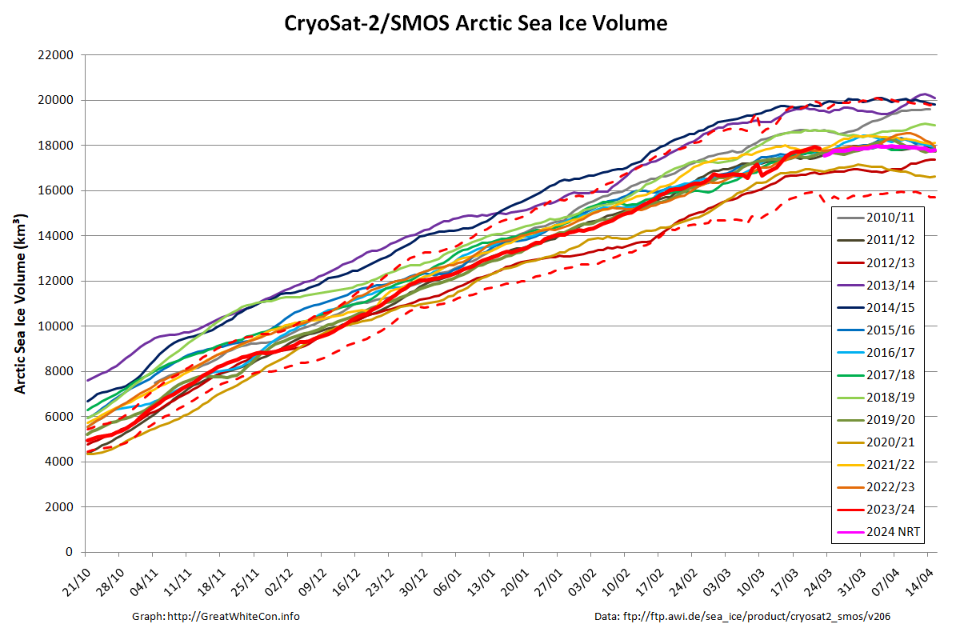
The CryoSat-2/SMOS merged Arctic sea ice volume graph finishes on April 15th, but older data is being reanalysed and here is the latest version:
The gap in the near real time data due to the problem with the SMOS satellite during the first half of March has been filled in, but the result doesn’t look very convincing to say the least!
The PIOMAS gridded thickness data for April 2024 is now available. Here’s the end of month volume graph:
A change is perhaps even better than a rest? Let’s start February with a reminder that following close behind another recent Arctic cyclone, Storm Ingunn caused red weather warnings for high winds and avalanches in Norway two days ago:
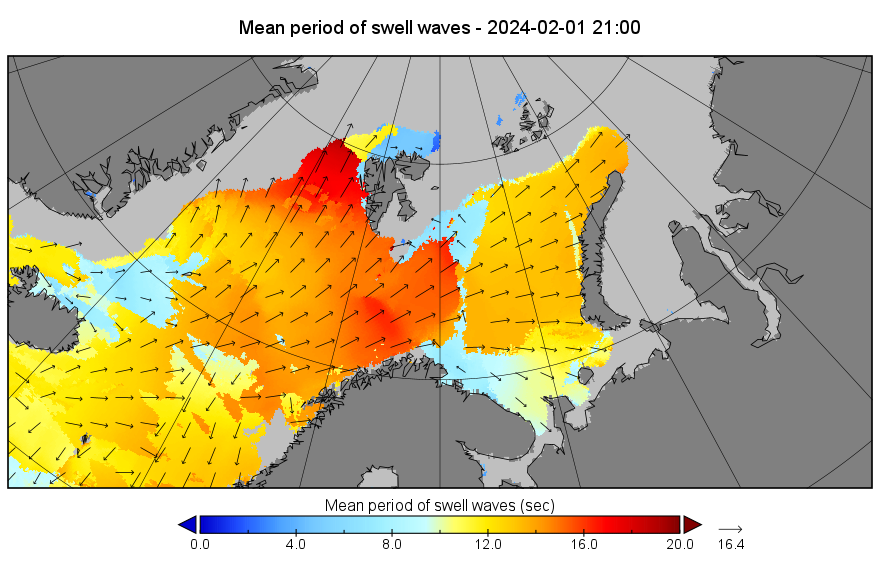
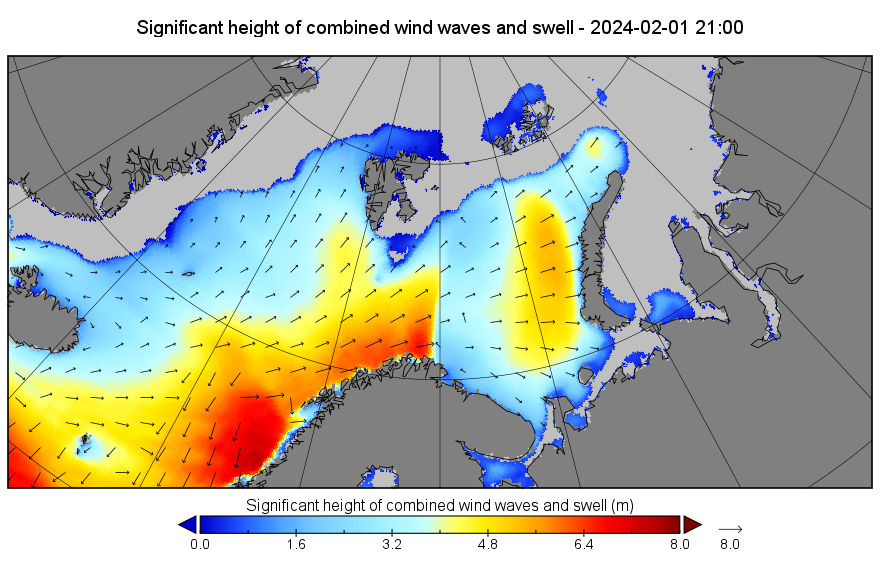
By yesterday evening another long period, storm driven swell was arriving at the sea ice edge in the Fram Strait, and to a lesser extent in the Barents Sea:
By this morning Ingunn had merged with the remnants of the prior cyclone, as revealed in Climate Reanalyzer’s visualisation of the latest GFS model run::
As in previous years there is already a thread devoted to this year’s minimum extent. By way of a summary here are the end of August numbers for our favourite “high resolution” AMSR2 area and extent metrics:
Extent is currently near the top of the range of the last 10 years.
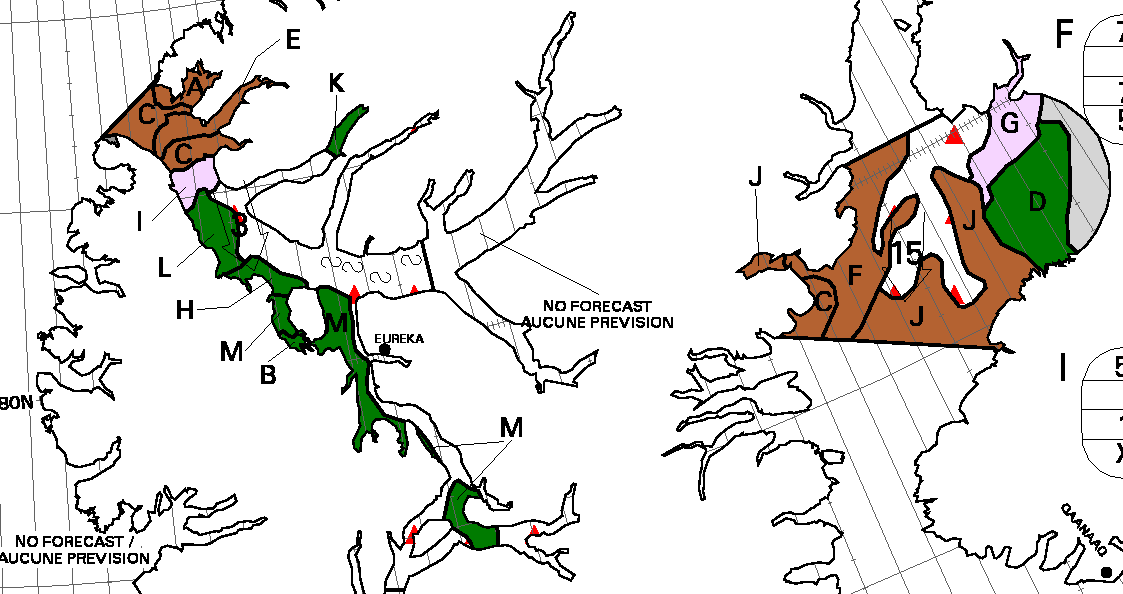
We have now reached the stage of the “melting season” when “refreezing” has started in the Central Arctic but melting at the periphery is outpacing it. However the Canadian Ice Service stage of development charts now show the arrival of new ice in the high latitudes of the Canadian Arctic Archipelago:
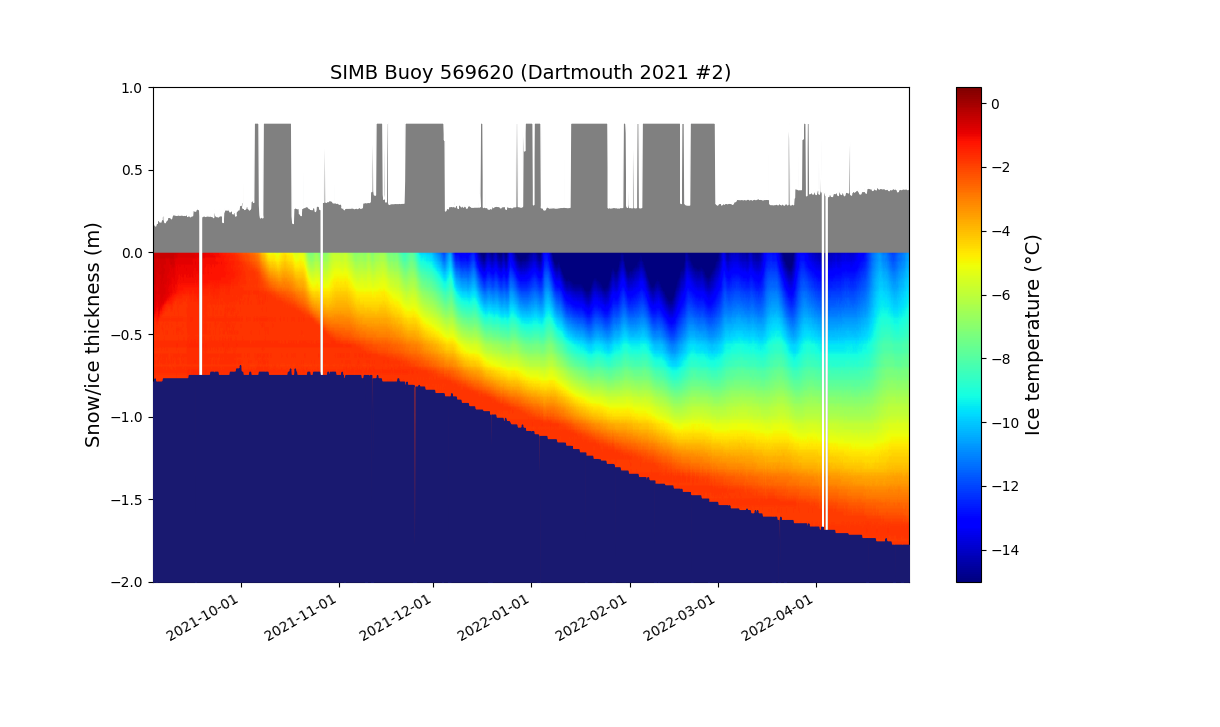
By way of a change we’ll start the month of May with a closer look at one of the ice mass balance buoys deployed in the Beaufort Sea last Autumn. IMB buoy 569620 was deployed at 78.5 N, 147.0 W on September 3rd 2021, and since then it has drifted to 81.0 N, 147.7 W. Here is the buoy’s record of atmospheric conditions above the ice floe it’s embedded in since then:
Here too is the buoy’s record of the temperature of the ice floe itself, as well as the thickness of the ice and the snow layer covering it:
There’s a few things to note at first glance. The ice floe continued to decrease in thickness into November. It’s thickness then started to increase, but is currently still less than 2 meters. Also the snow depth has gradually been increasing, and (apart from some data glitches!) is now ~38 cm. Finally, for the moment at least, the ice surface temperature has been slowly warming since mid February and is now ~-11 °C.
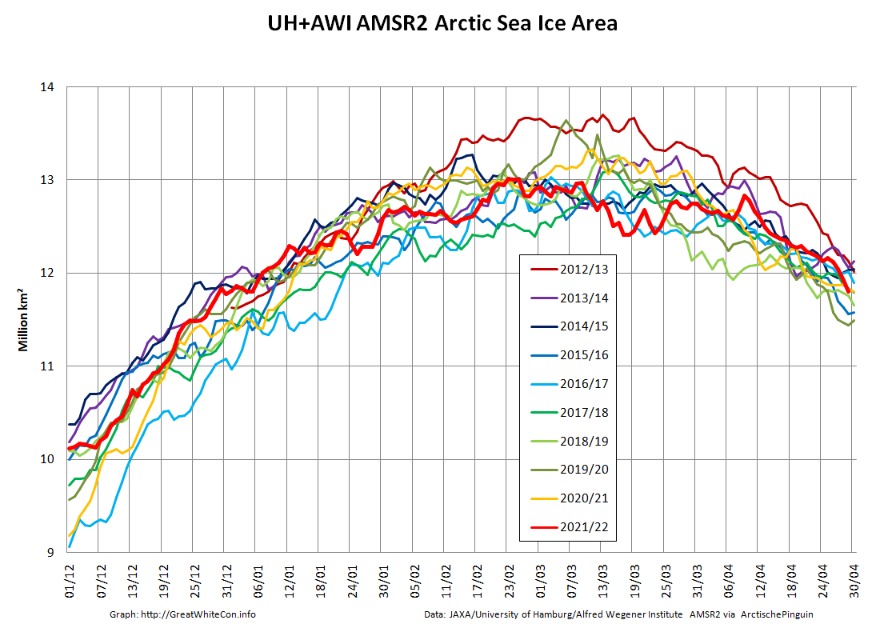
Returning to more familiar territory, high resolution AMSR2 Arctic sea ice area has taken a bit of a tumble recently:
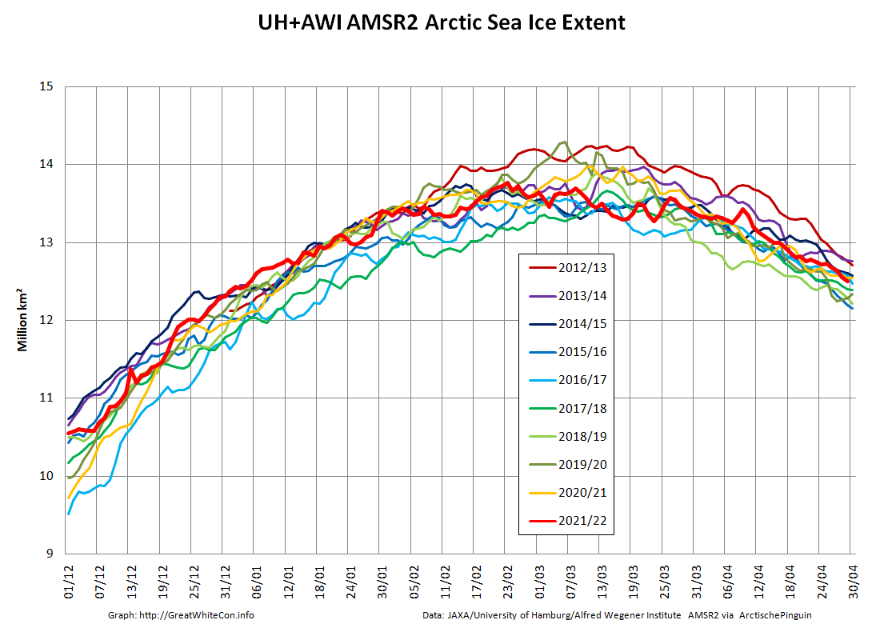
followed less steeply by extent:
Not unexpectedly, the Pacific periphery is currently leading the decline:
[Edit – May 4th]
The Rutgers Snow Lab has updated its northern hemisphere snow cover bar chart for April 2022:
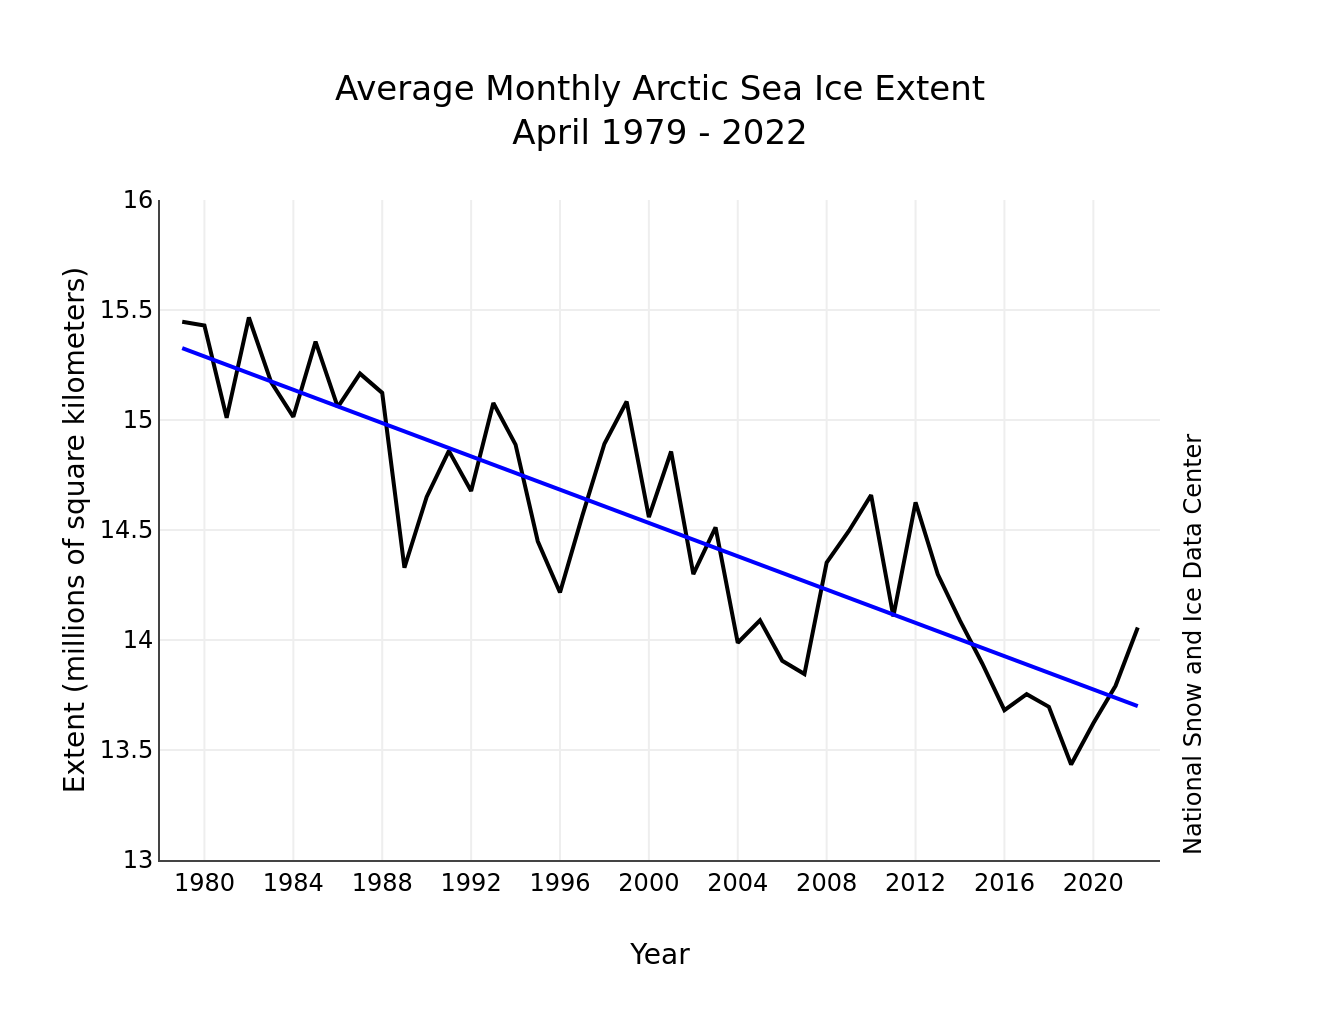
The May edition of the NSIDC’s Arctic Sea Ice News has also just been published. It summarises April 2022 as follows:
Average Arctic sea ice extent for April 2022 was 14.06 million square kilometers (5.43 million square miles). This was 630,000 square kilometers (243,000 square miles) below the 1981 to 2010 average and ranked eleventh lowest in the 44-year satellite record.
Extent declined slowly through the beginning of the month, with only 87,000 square kilometers (33,600 square miles) of ice loss between April 1 and April 10. The decline then proceeded at an average pace for this time of year through the reminder of the month.
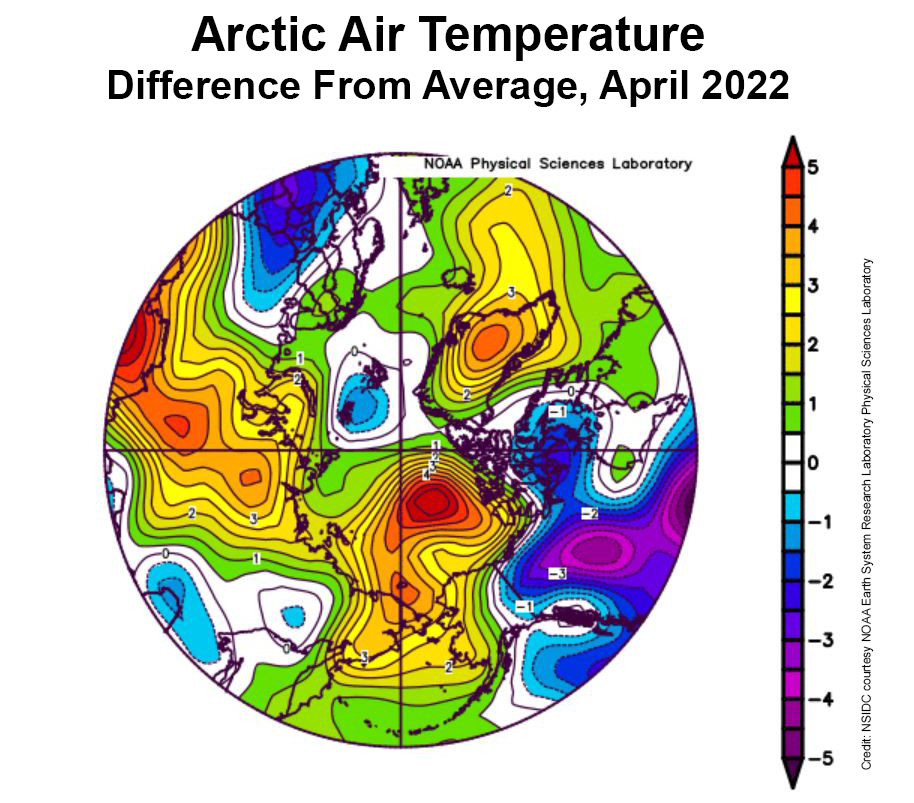
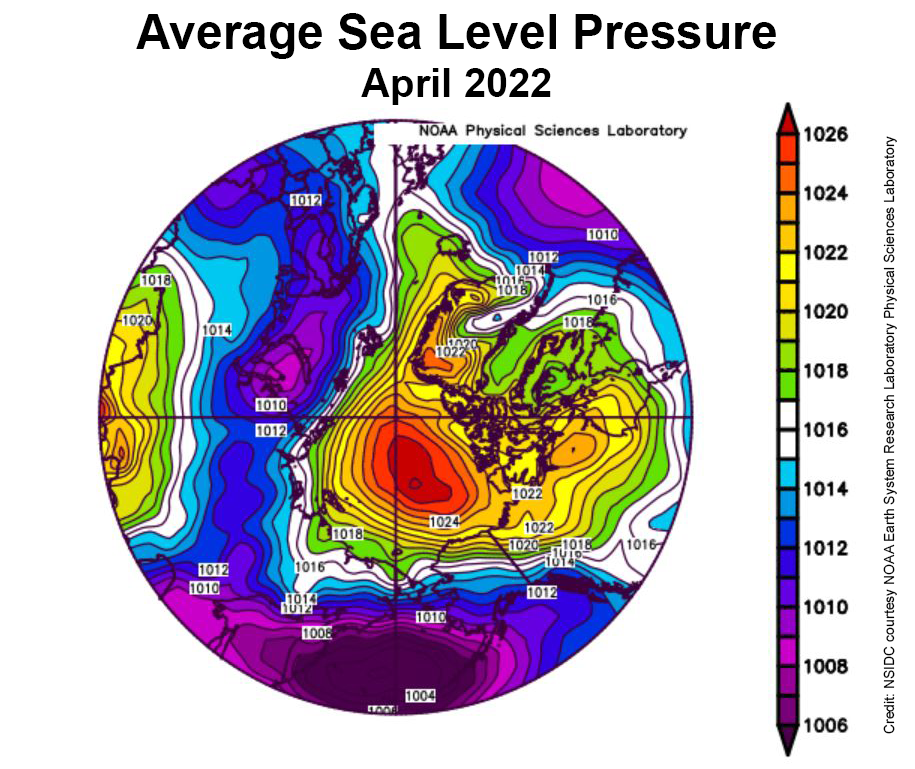
During April, temperatures at the 925 mb level (about 2,500 feet above the surface) over the Arctic Ocean were above average. Most areas were 2 to 3 degrees Celsius (4 to 5 degrees Fahrenheit) above average, but in the Beaufort Sea, April temperatures were up to 5 to 6 degrees Celsius (9 to 11 degrees Fahrenheit) above average:
This was accompanied by a strong Beaufort High pressure cell through the month:
The NSIDC’s update also refers to the Chukchi Sea polynya we’ve been keeping an eye on here:
Strong offshore winds over the northwest coast of Alaska led to openings in the ice cover, called polynyas. The first pulse of winds began on March 21. At that time, surface air temperatures were still well below freezing, and the water in the coastal polynya quickly refroze. By April 9, the offshore push of the ice ceased and the polynya iced over completely.
However, starting on April 12, a second round of offshore wind pushed the ice away from the coast, initiating another polynya. Refreezing began anew in the open water areas, but the ice growth was noticeably slower, reflecting the higher surface air temperatures by the end of the month
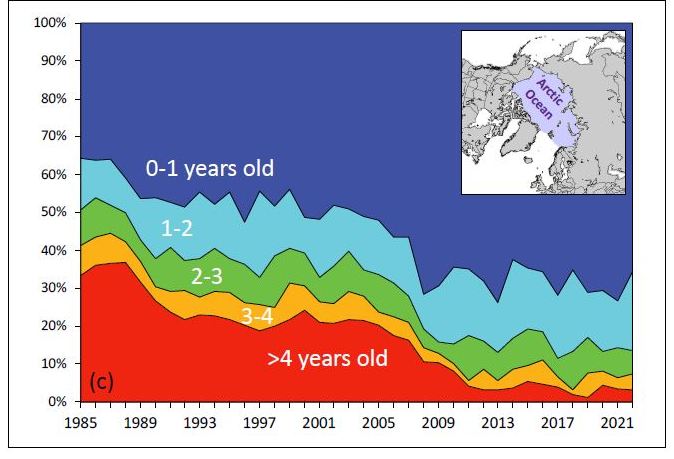
The NSIDC also updated their graph of sea ice age, on this occasion for the week of March 12th to 18th over the years:
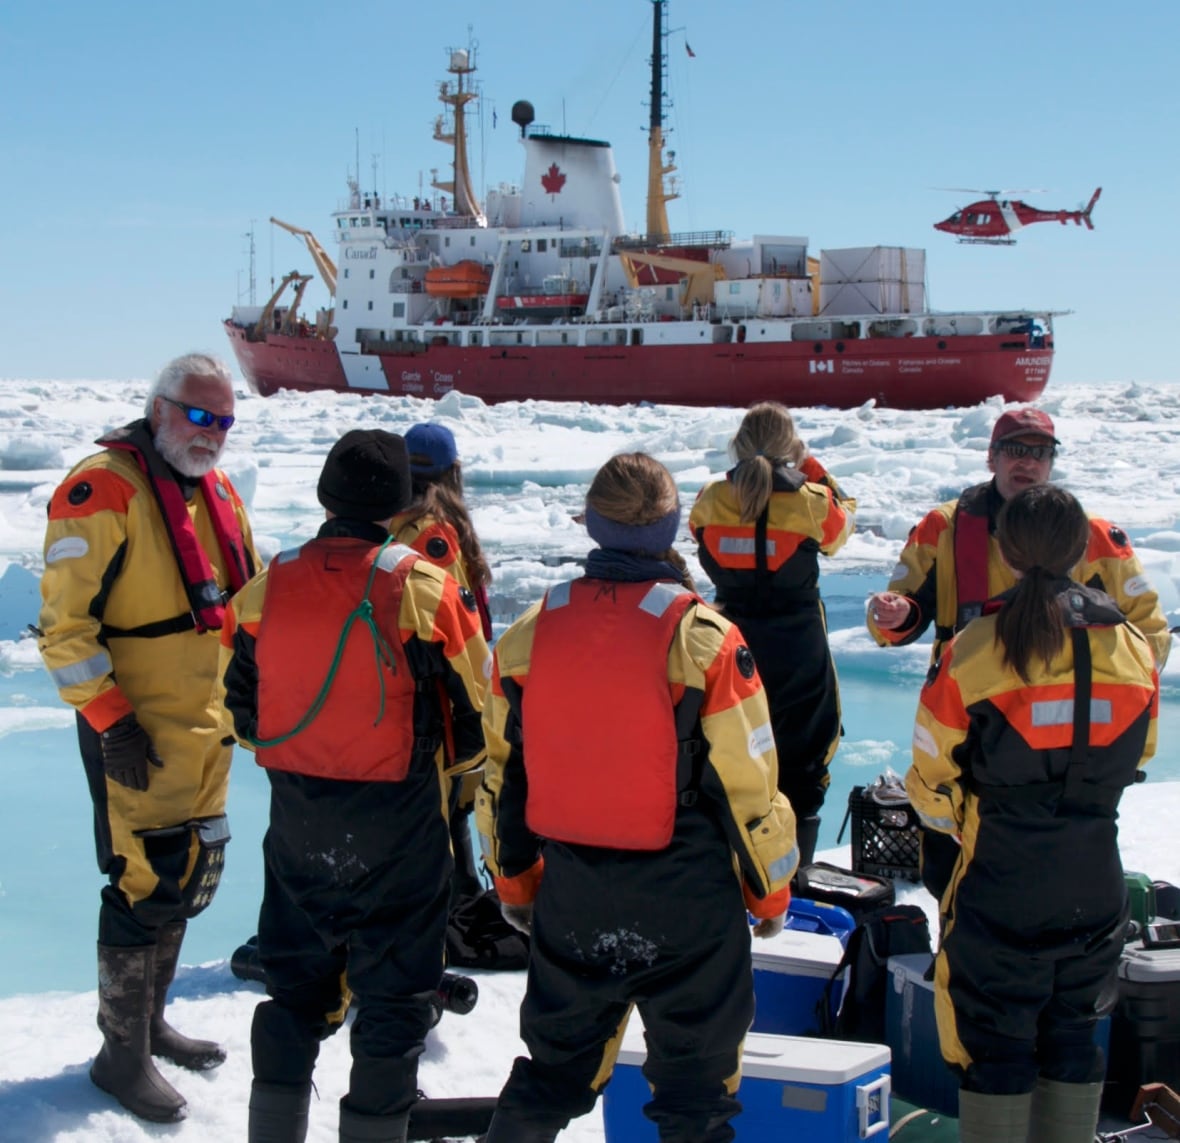
Arctic sea ice news concludes with brief news of the recent death of Canadian Arctic scientist David Barber. CBC News’s obituary for David provides more details:
Family and friends are mourning the loss of the visionary Arctic researcher and University of Manitoba professor David Barber.
Barber, who was a distinguished professor, the founding director of the Centre for Earth Observation Science and associate dean of research in the faculty of environment, earth and resource, passed away on Friday after suffering complications from cardiac arrest.
Barber, 61, is survived by his wife Lucette, three children and two grandchildren.
David Barber (left) pictured with his team on an Arctic expedition. Photo: Julien Barber[Edit – May 9th]
The waters of the Mackenzie River are starting to spread over the fast ice off the delta:
“False colour” image of the Beaufort Sea on May 7th from the MODIS instrument on the Terra satellite[Edit – May 11th]
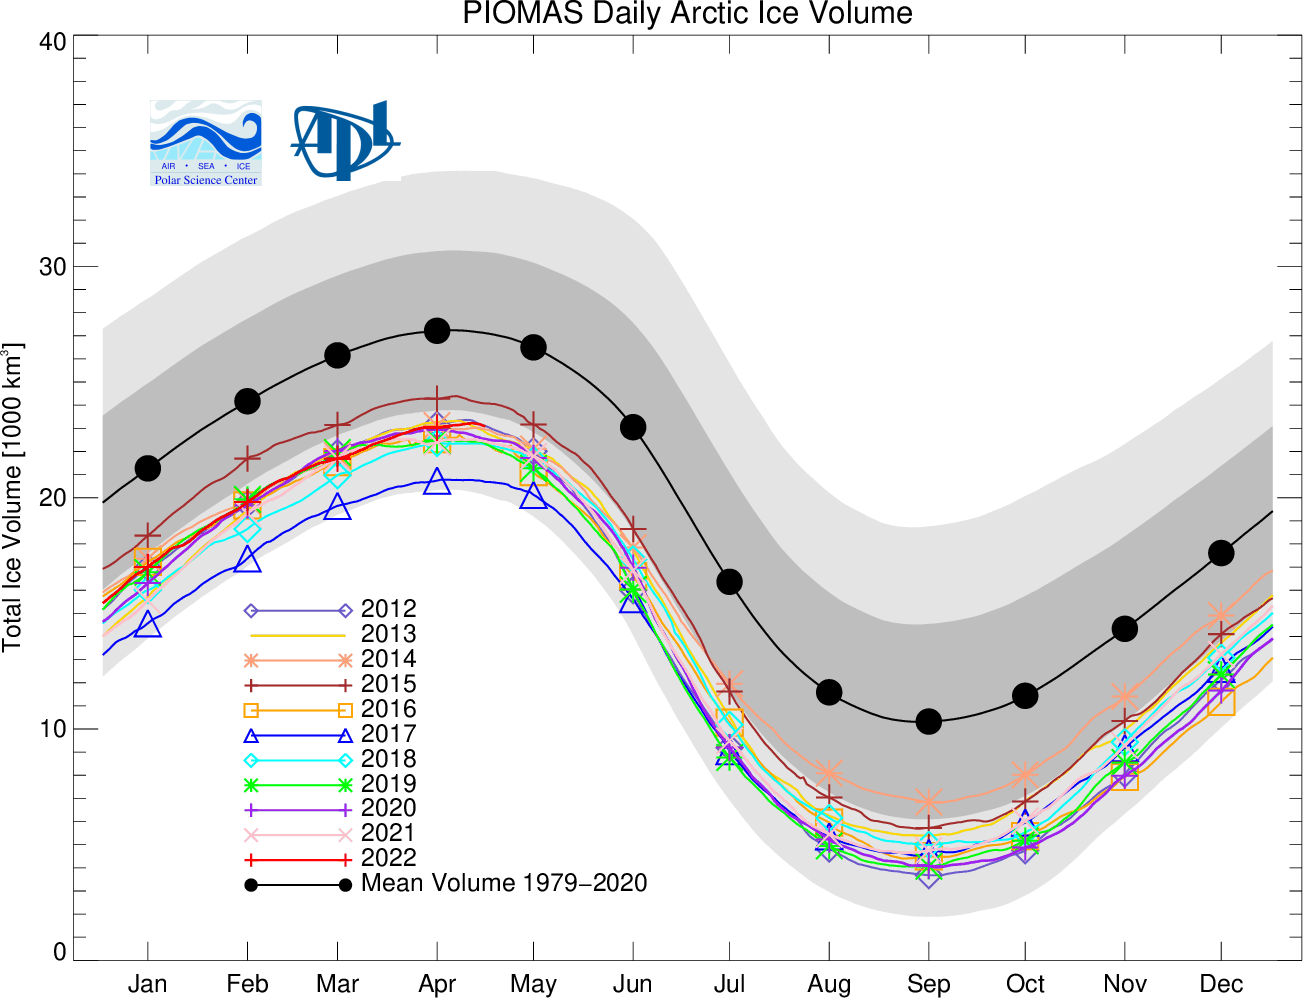
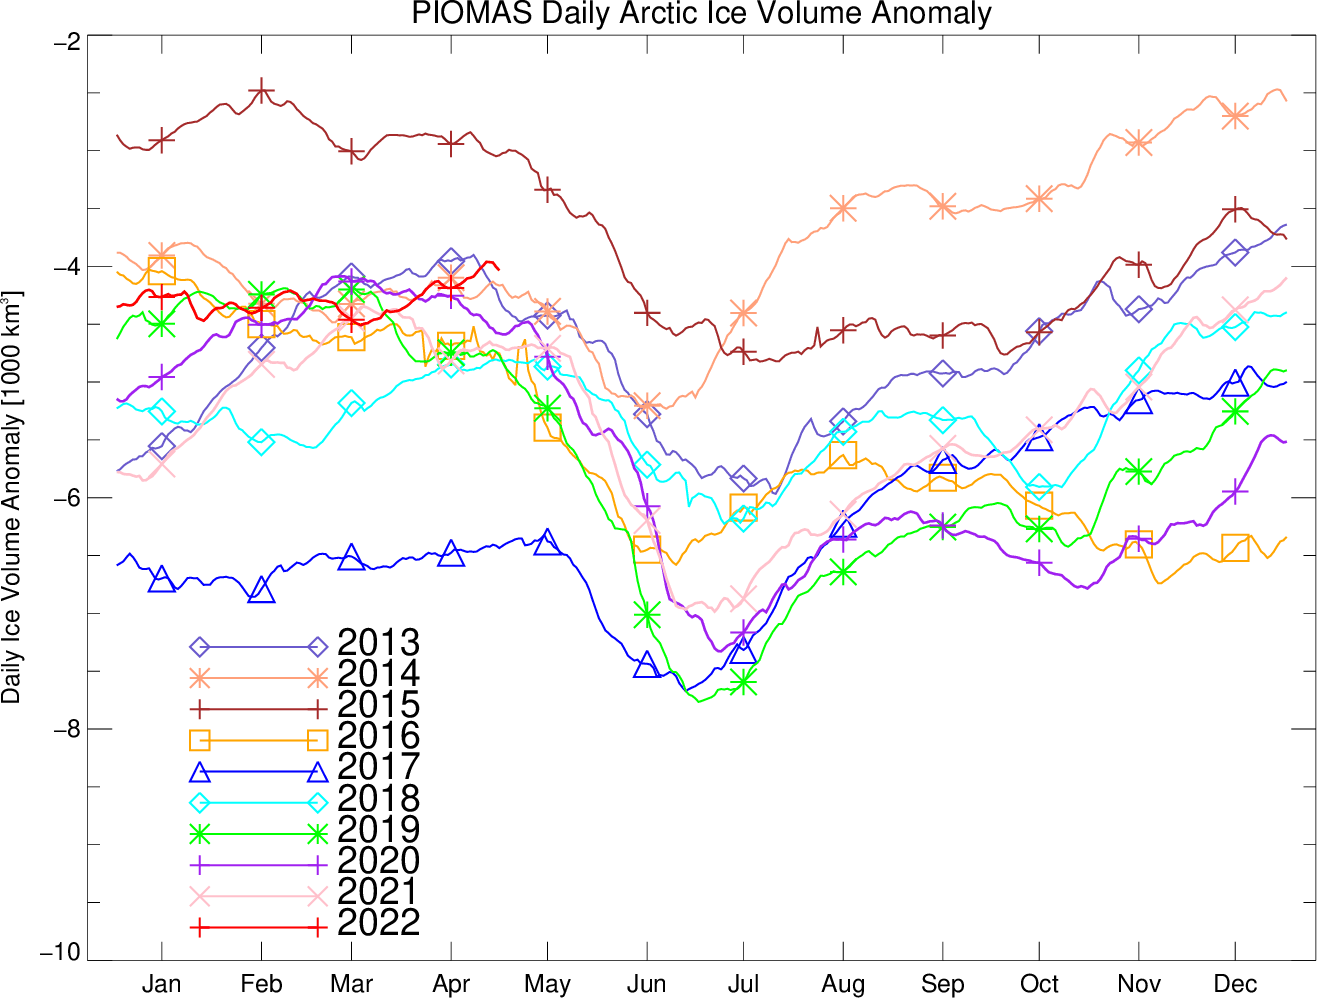
The Polar Science Center at the University of Washington has released the PIOMAS volume data for April 2022:
Average Arctic sea ice volume in April 2022 was 23,000 km3. This value is the 9th lowest on record for April, about 2,300 km3 above the record set in 2017. Monthly ice volume was 30% below the maximum in 1979 and 15% below the mean value for 1979-2021. Average April 2022 ice volume was 1.45 standard deviations above the 1979-2021 trend line.
The daily volume numbers reveal the PIOMAS maximum volume for 2022 to be 23,225 km3 on April 26th.
The PSC report continues:
Ice growth anomalies for April 2022 continued to be at the upper end of the most recent decade with a mean ice thickness (above 15 cm thickness) at the middle of recent values.
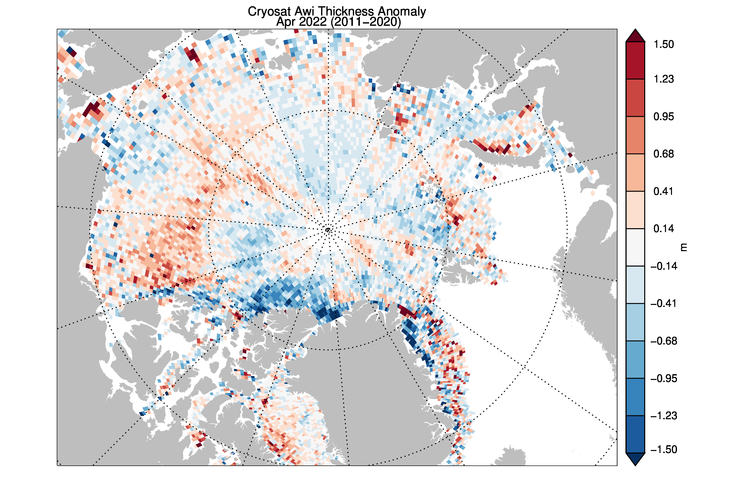
The ice thickness anomaly map for April 2022 relative to 2011-2020 divides the Arctic in two halves with positive anomalies in the “Western Arctic” but negative anomalies in “Eastern Arctic”. A narrow band of negative anomalies remains along the coast of North Greenland but a positive anomaly exists north of Baffin Island.
Note that the “positive anomaly north of Baffin Island” referred to is not apparent in the CryoSat 2 ice thickness anomaly map, although there is agreement about the thicker ice in the eastern Beaufort Sea:
[Edit – May 23rd]
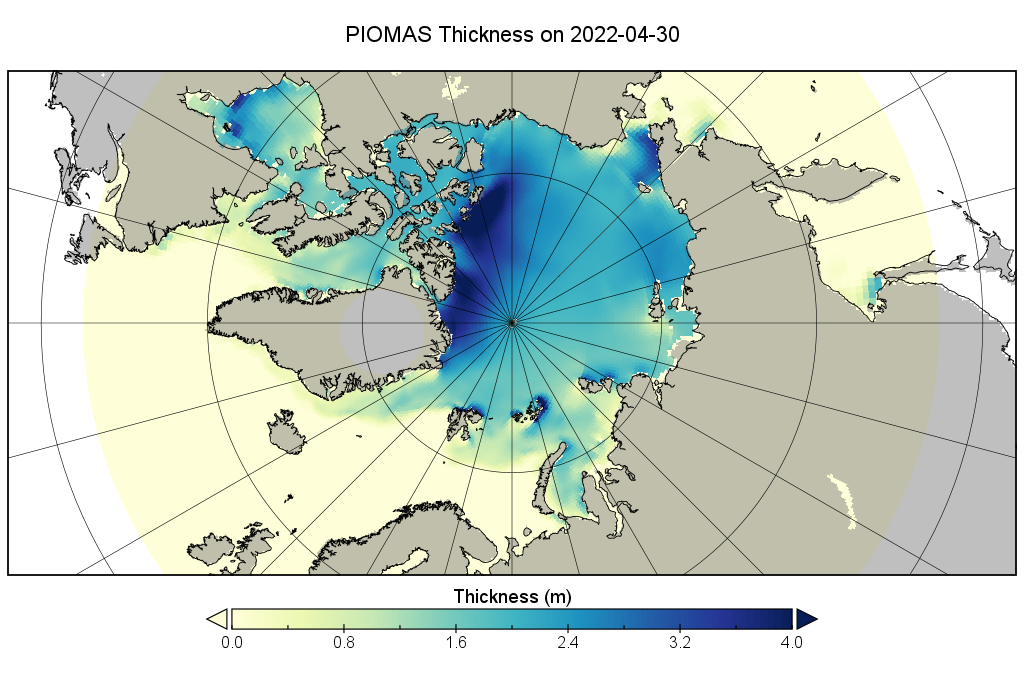
CryoSat-2 thickness maps stopped for the Summer in mid April. I’ve been hoping for mid May data from the PIOMAS team, but in vain so far. In its continuing absence here is a “work in progress” PIOMAS thickness map for the end of April:
The sea ice in Chaunskaya Bay and along the adjacent coast of the East Siberian Sea is starting to look distinctly damp:
“False colour” image of the East Siberian Sea on May 23rd from the MODIS instrument on the Terra satellite
That’s not too surprising when you also look at recent temperatures in Pevek, which have been approaching all time highs for the date:
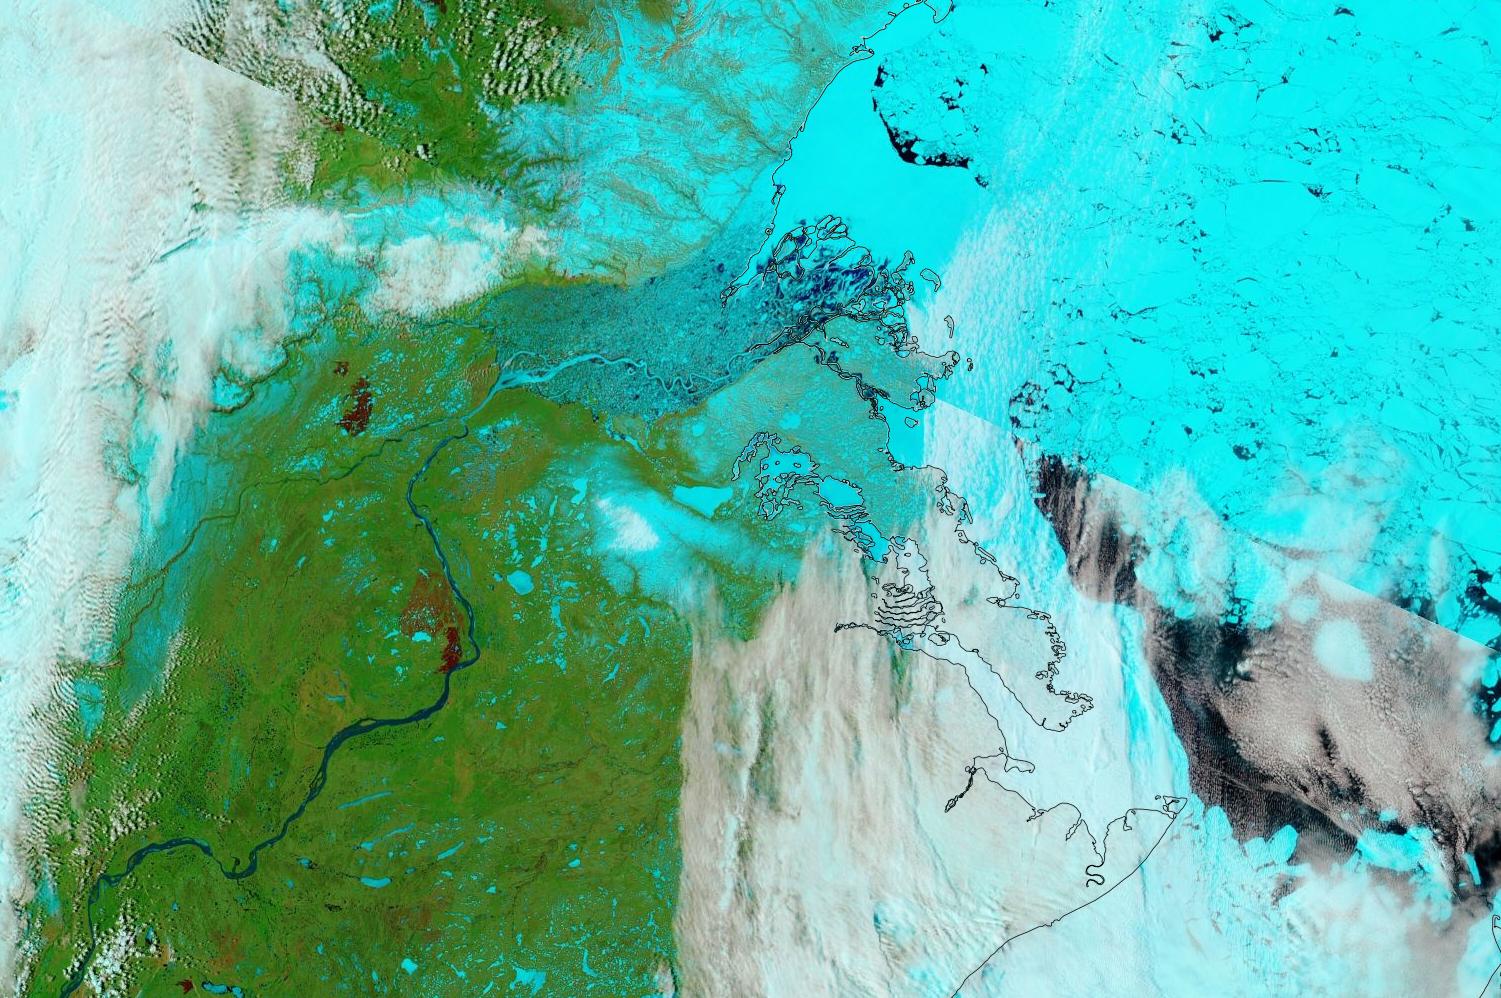
P.S. The Mackenzie River has reappeared from under the clouds and is now largely liquid:
“False colour” image of the Mackenzie River and Beaufort Sea on May 23rd from the MODIS instrument on the Terra satellite[Edit – May 27th]
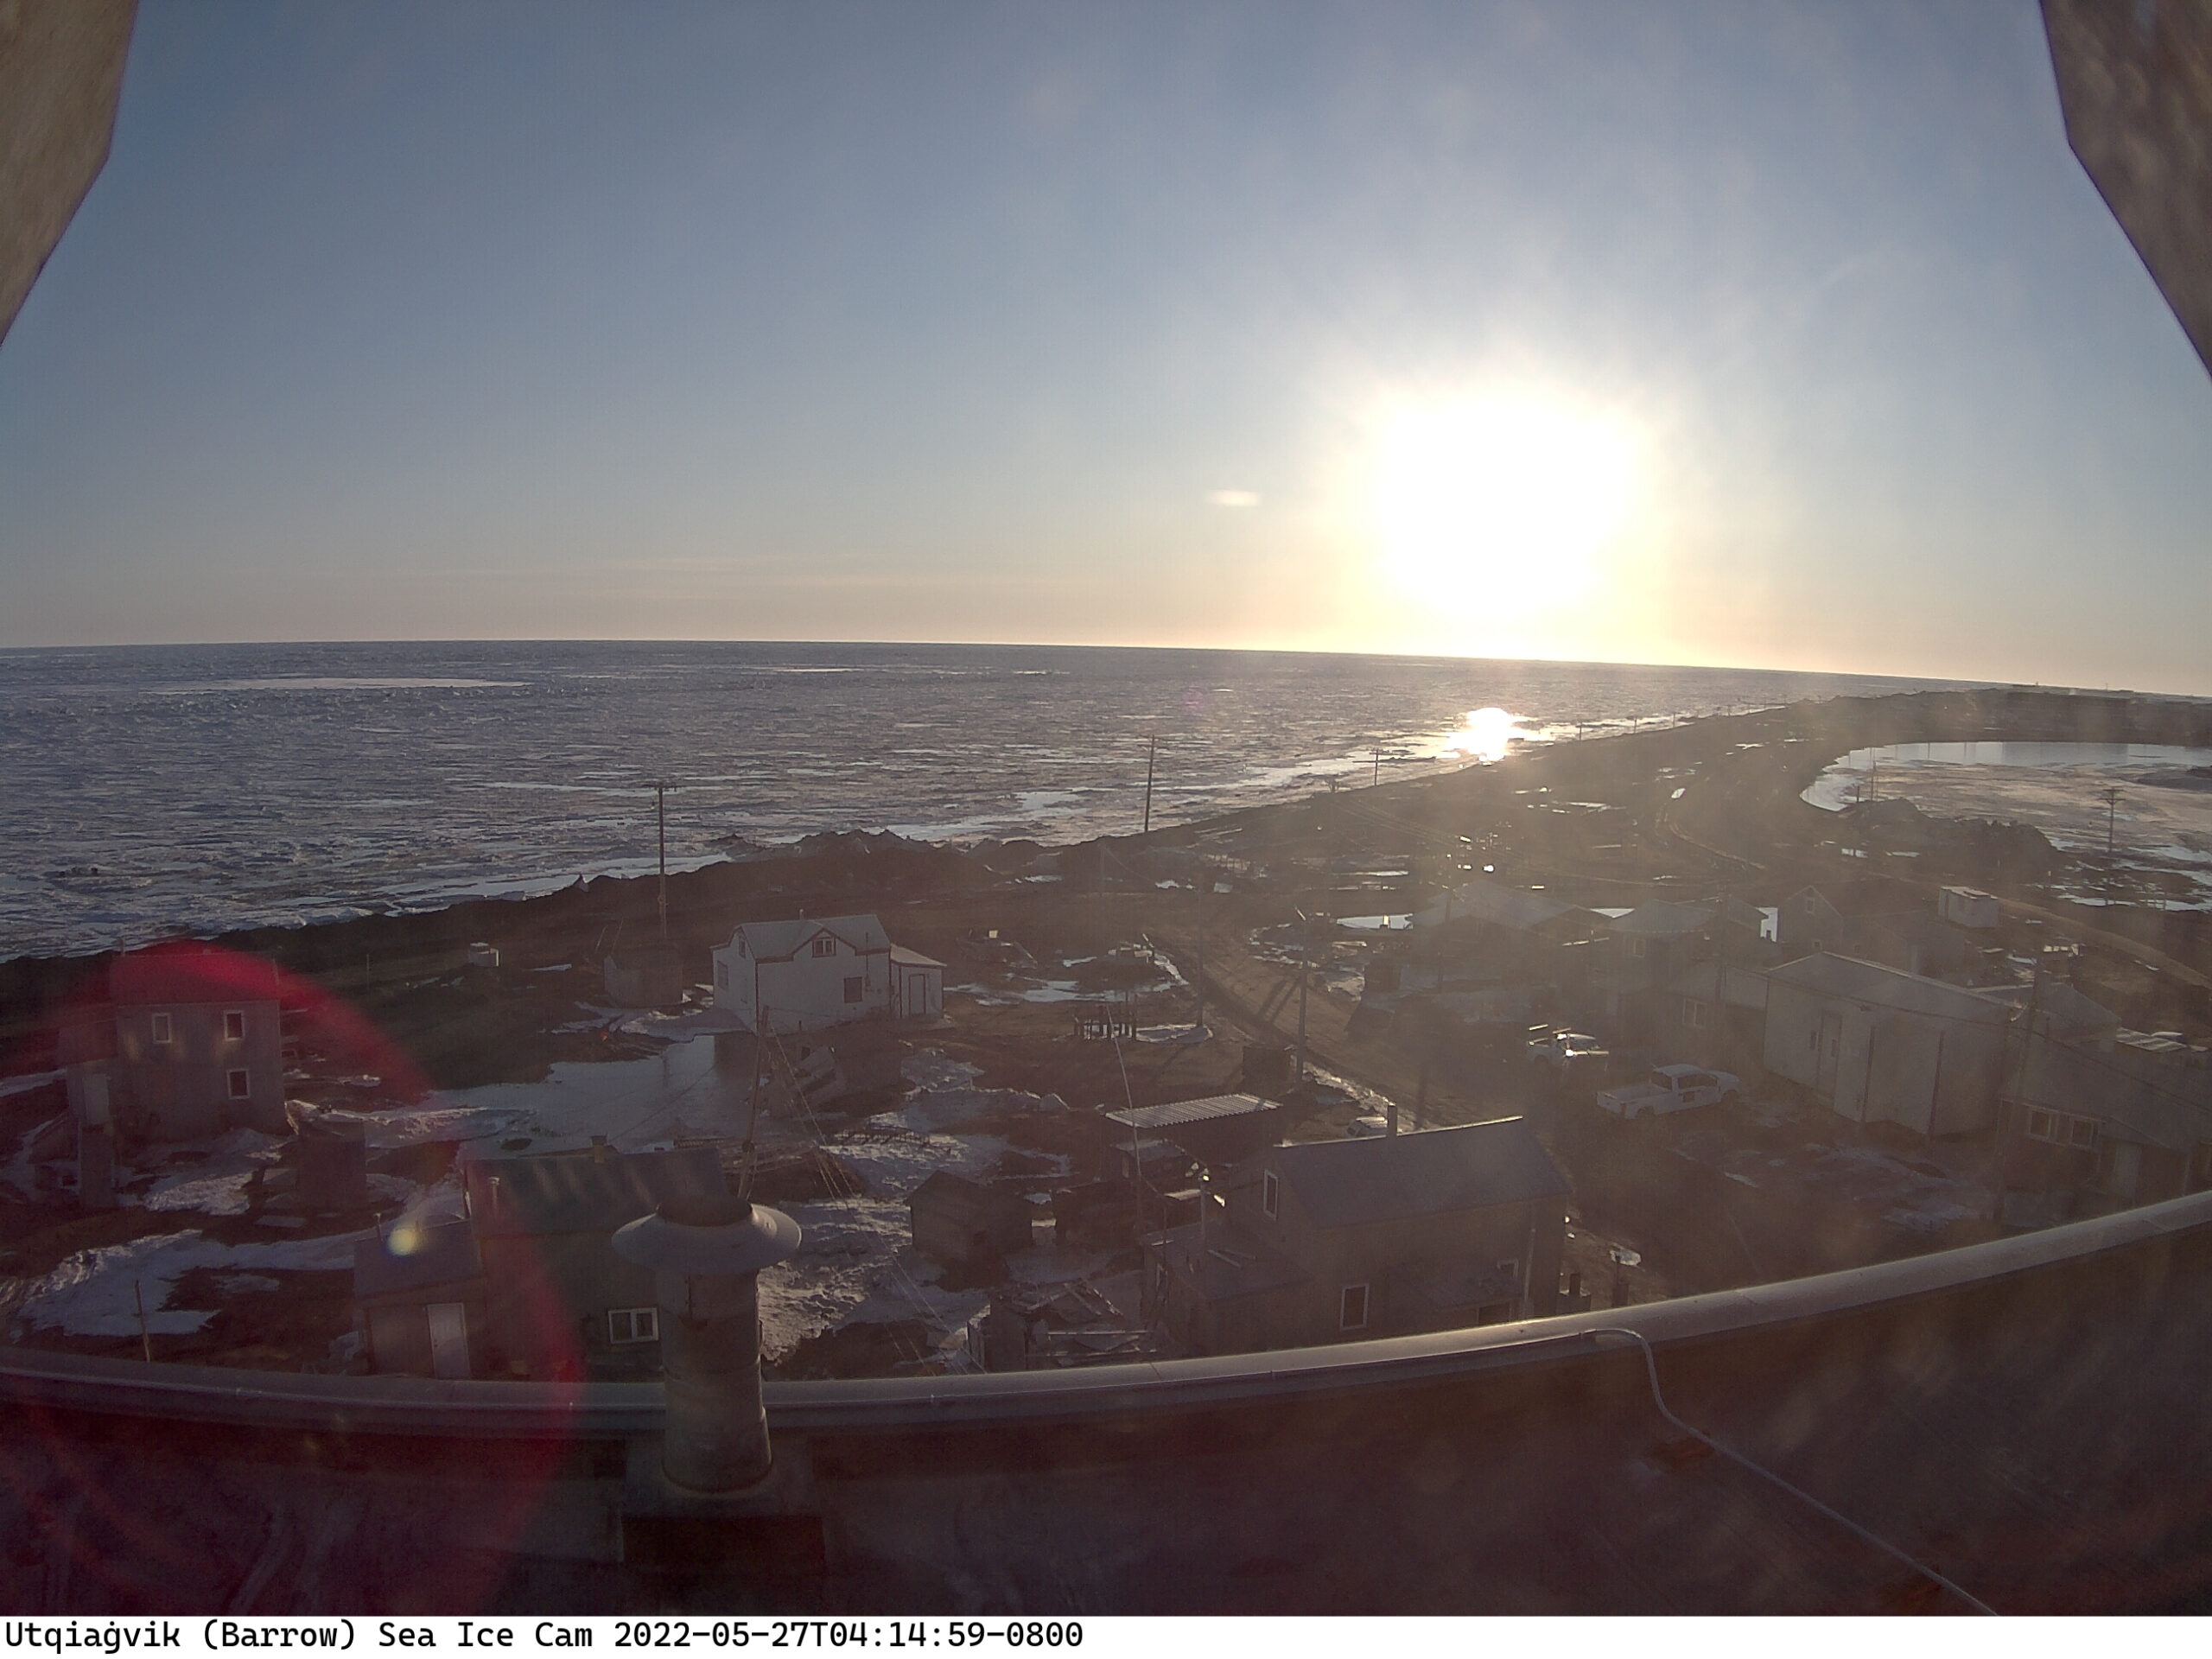
Some surface melt is now visible on the fast ice at Utqiaġvik:
No doubt the recent above zero temperatures are responsible, but the forecast is for colder conditions to return:
Discussion continues on the new open thread for June 2022.
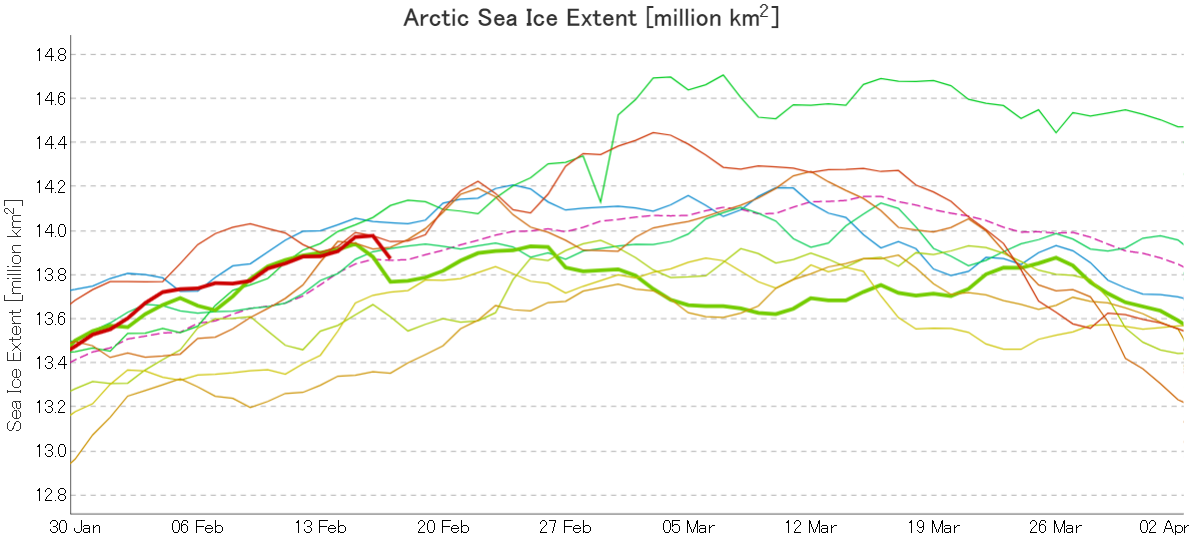
Here’s the latest graph of Arctic sea ice extent from JAXA/ViSHOP, with 2021 and 2015 highlighted:
Extent fell by over 100,000 square kilometres between February 16th and 17th! Can that steep fall continue, as it did for one more day in 2015?
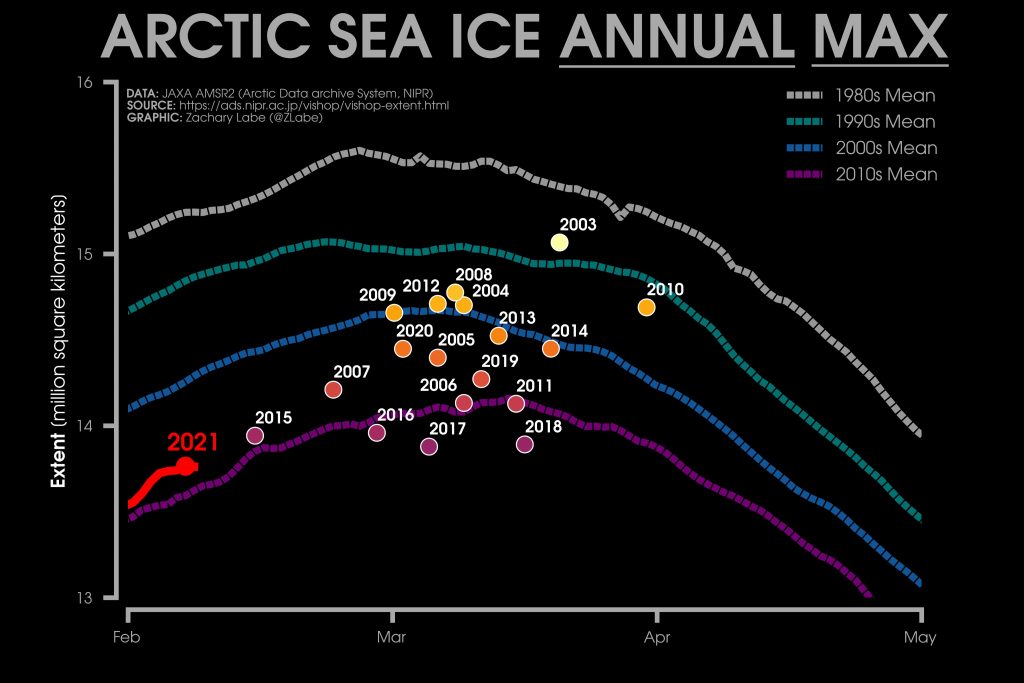
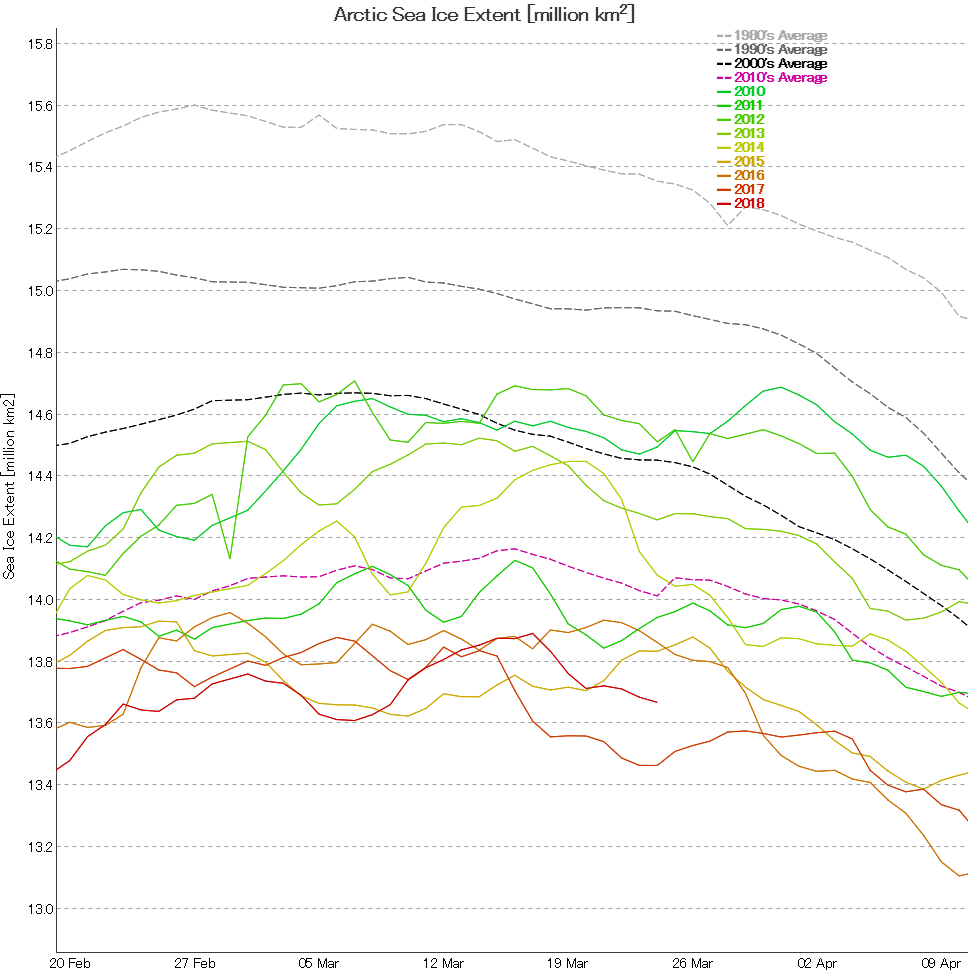
Here too is Zack Labe’s 2021 overview of JAXA maximum extent over the previous couple of decades:
2015’s maximum was very early, on February 15th. Hence the current extremely tentative 2021 maximum is already both higher and later than that. The decadal average extent graphs show the date of the maximum getting later and later, and the 2010’s peaks in the middle of March.
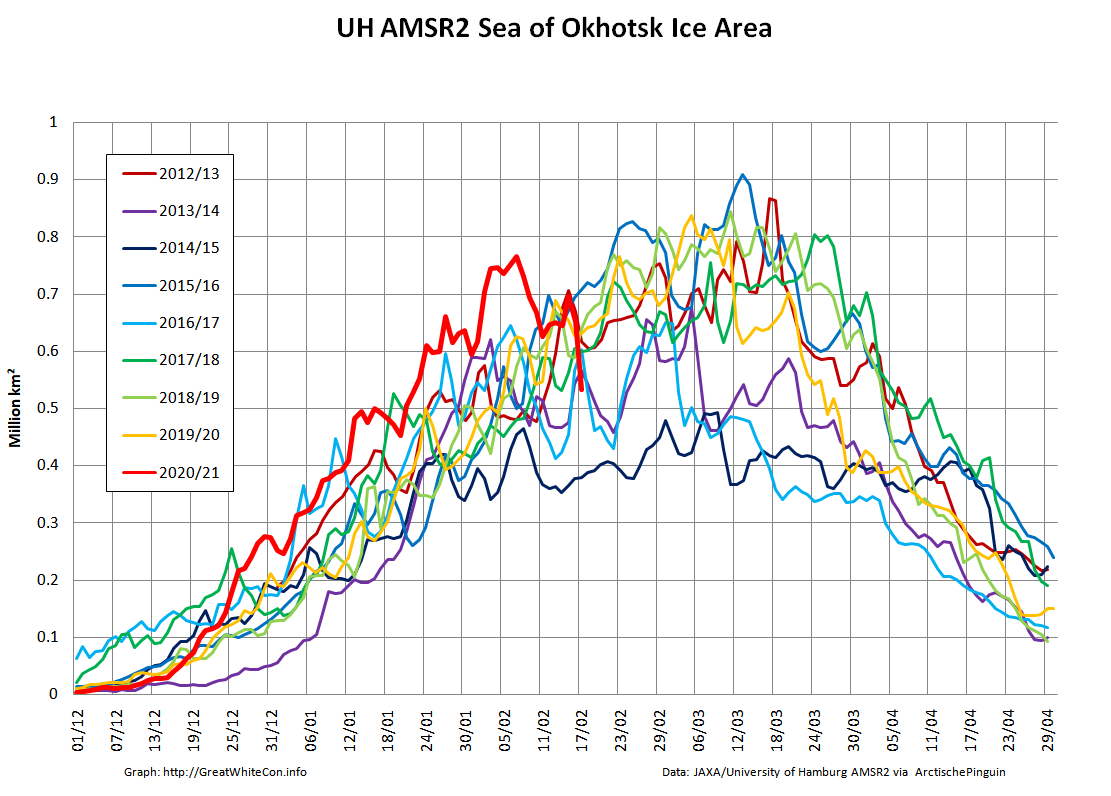
It therefore seems likely that there is more freezing still to come this year. However lets take a look at the high resolution AMSR2 sea ice area graph for the Sea Of Okhotsk:
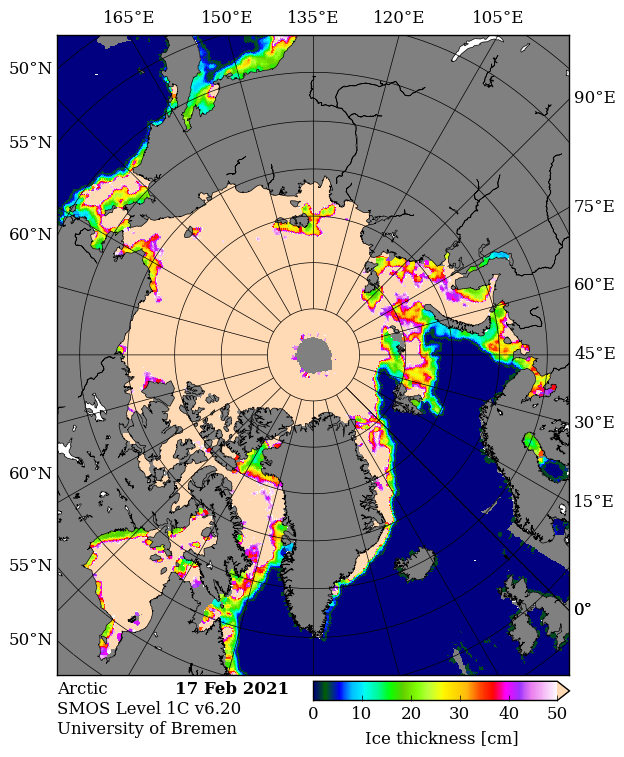
The recent fall in Arctic wide extent has evidently been driven by the recent rapid decline in this peripheral sea, where SMOS reveals more thin ice ripe for further melting:
In conclusion, the high res AMSR2 extent metric shows the tentative 2021 peak below that of 2015!
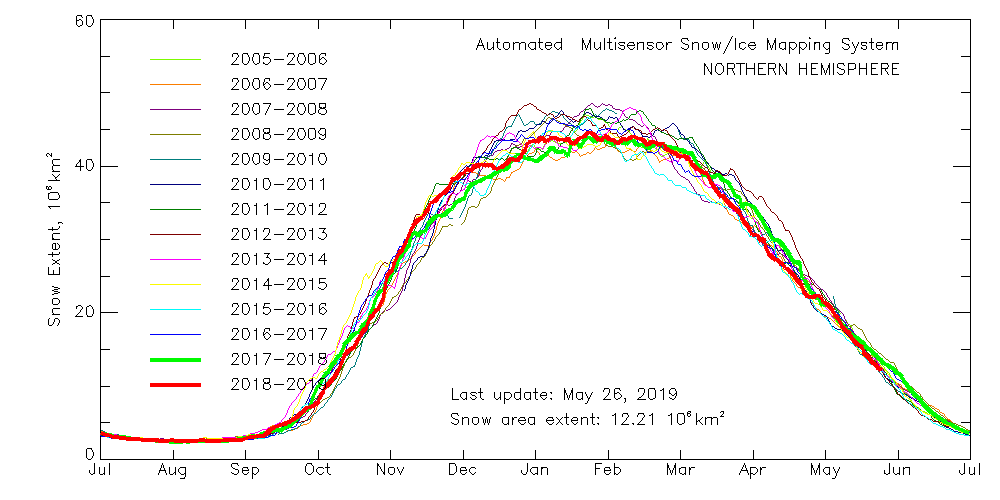
A couple of years ago I was asked to provide “a handful of things [you] will be keeping an eye on over the next few months to judge how ‘good’ or ‘bad’ the melt is going?”
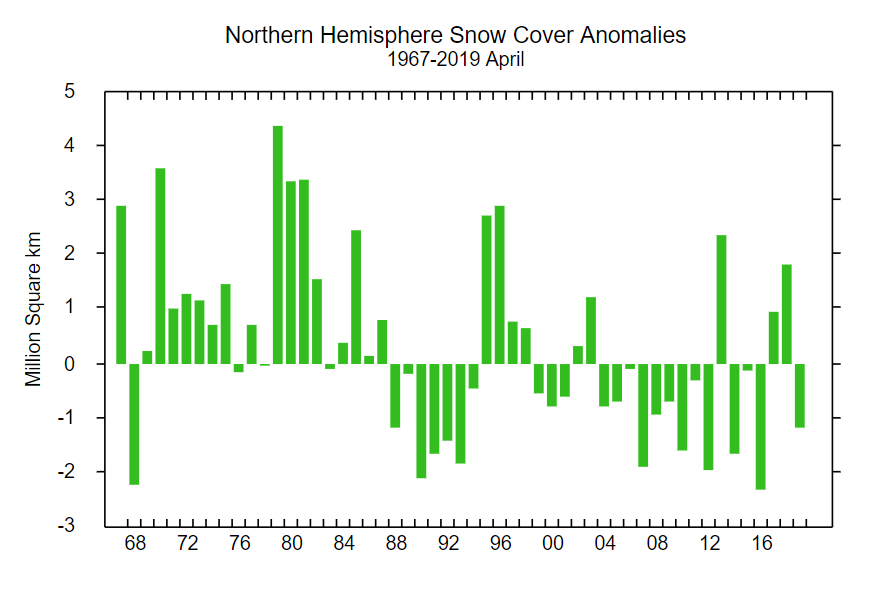
That suggests snow cover over land is close to recent lows, which is confirmed by the Rutgers University snow cover anomaly graph for April:
This year is anomalously low, but not by as much as 2012 and 2016. For completeness, here also is the current US National Ice Center snow cover map:
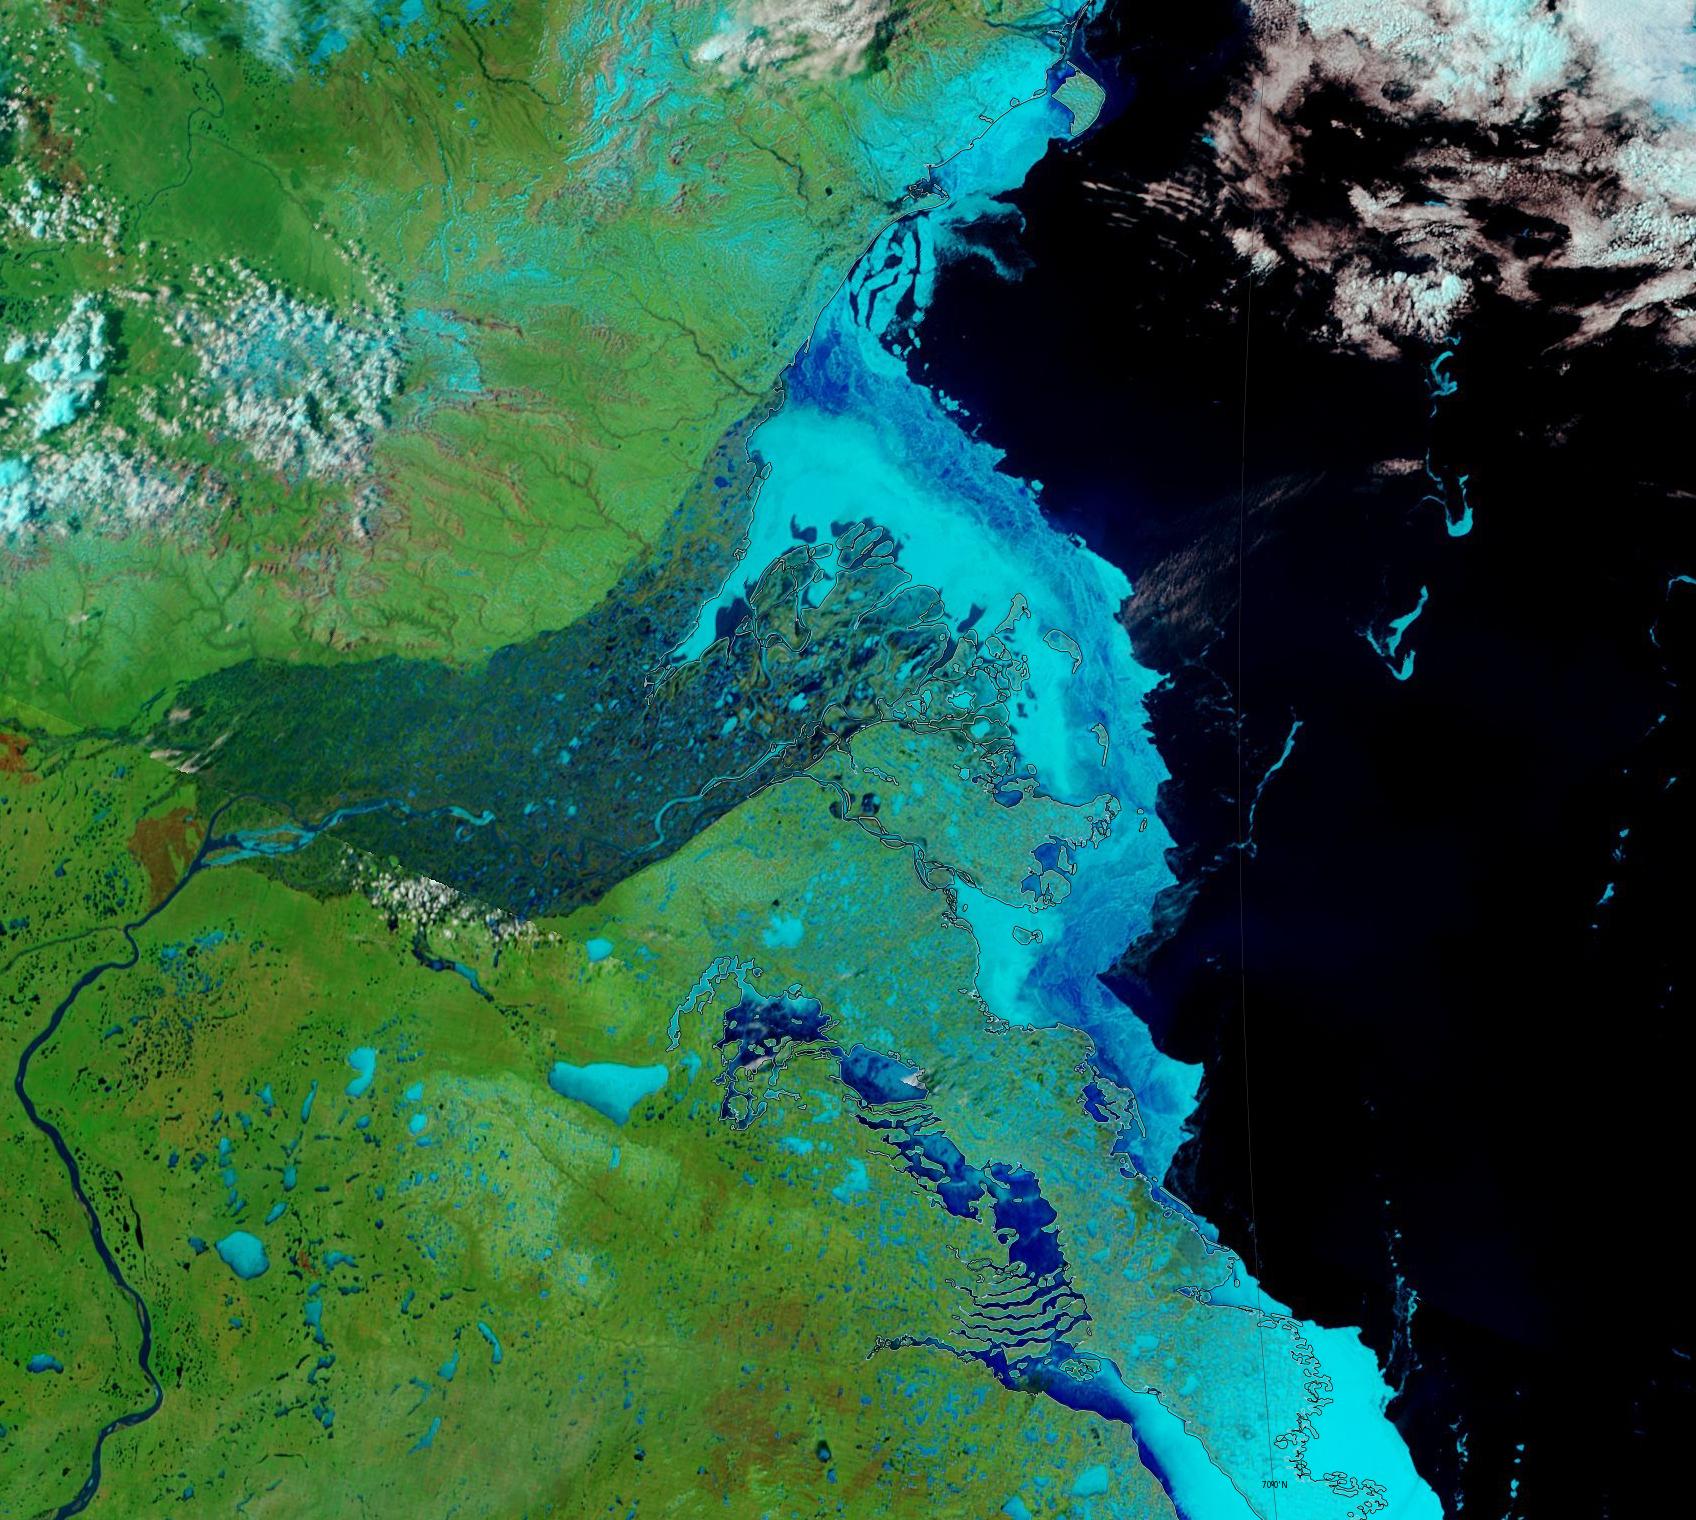
Moving on to melt ponds, there are plenty to be seen on the fast ice around the Mackenzie river delta:
NASA Worldview “false-color” image of the Mackenzie Delta on May 24th 2019, derived from the MODIS sensor on the Terra satellite
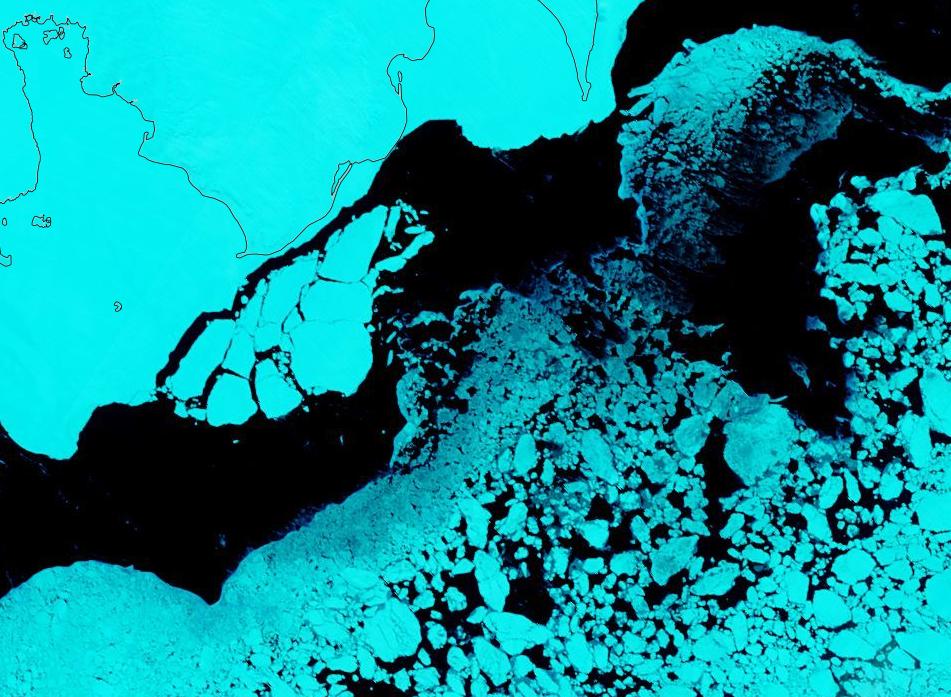
There also seem to be signs of some at a higher latitude off Ostrov Kotelny in the New Siberian Islands:
NASA Worldview “false-color” image of the Laptev Sea on May 23rd 2019, derived from the MODIS sensor on the Terra satellite
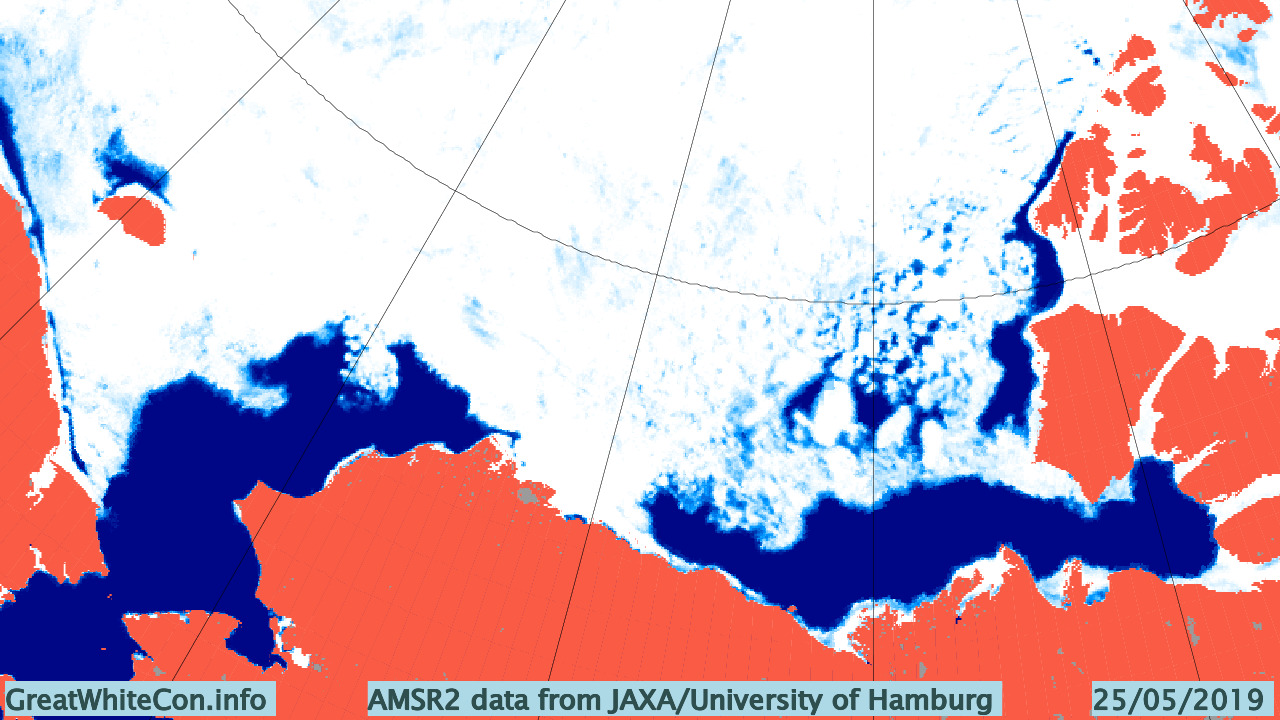
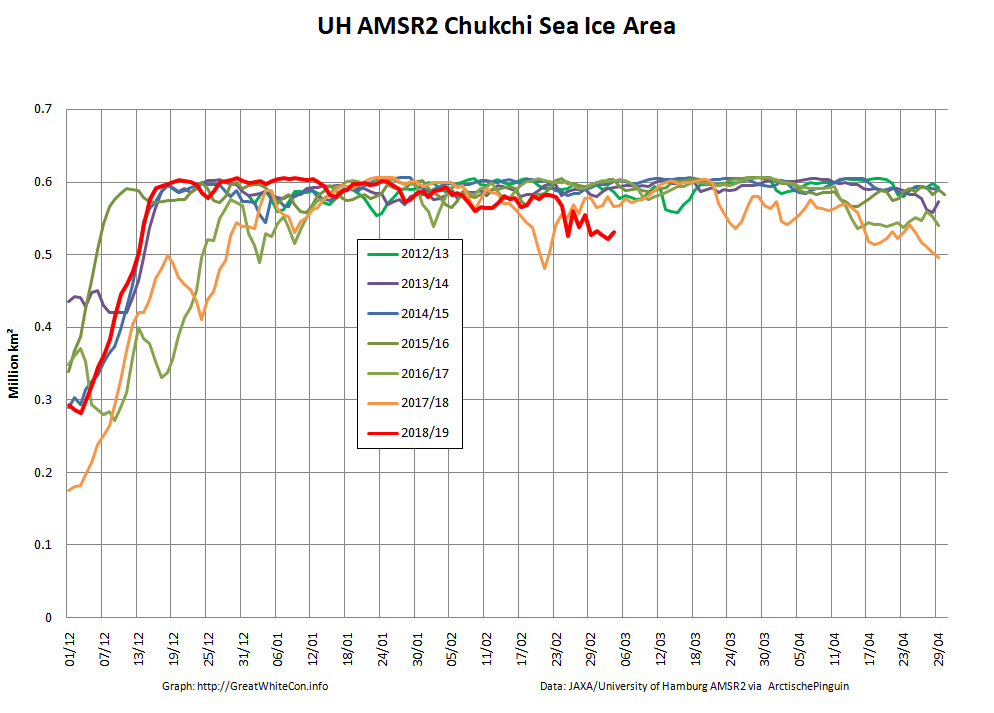
This year there is also a lot of open water in the Chukchi Sea, and almost no sea ice left in the Bering Sea:
Compared with 2016 at the same time of year I am compelled to say that with June 1st just around the corner the 2019 summer melting season is primed to progress more quickly.
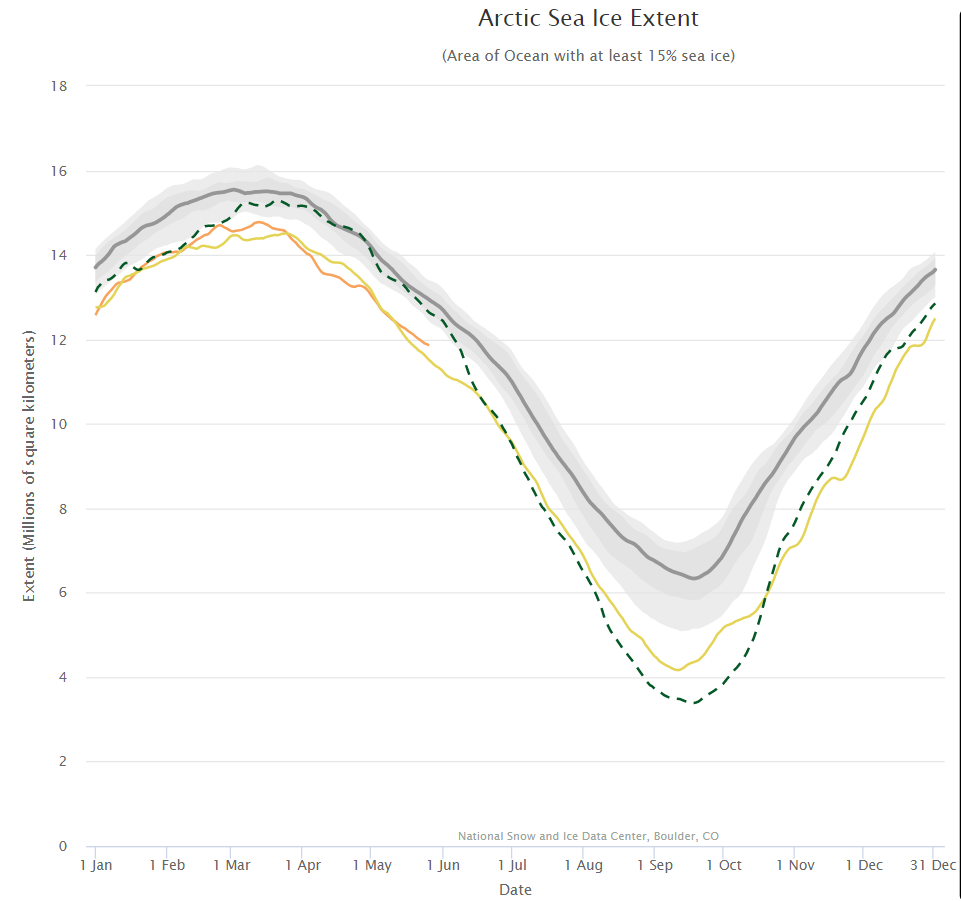
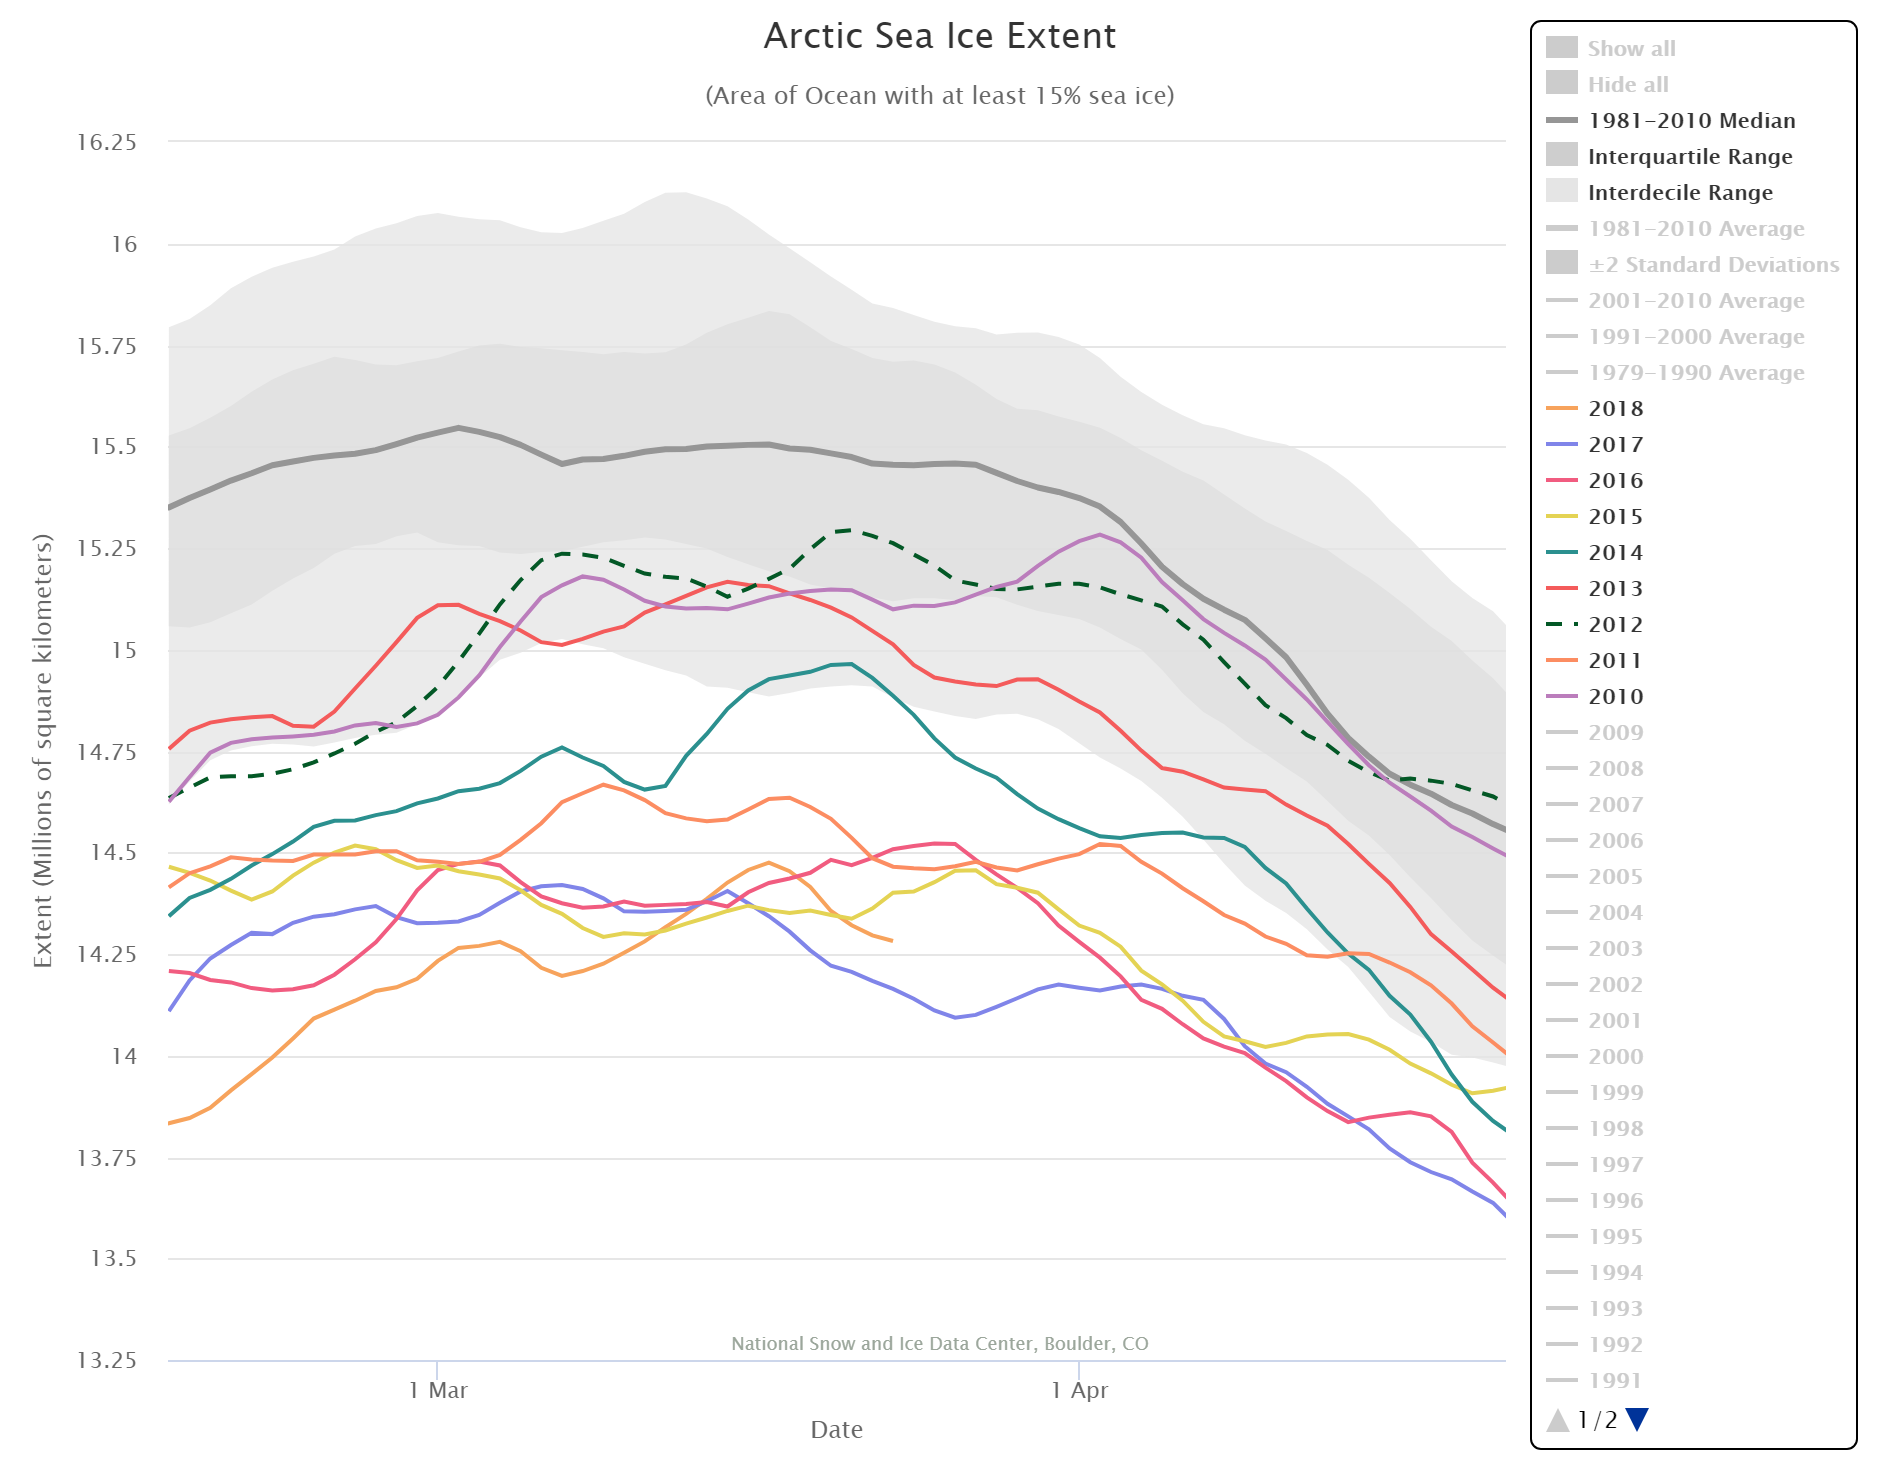
The next obvious comparison to make is with the (in)famous year of 2012, which resulted in the lowest ever minimum extent in the satellite record. Firstly let’s look at the National Snow and Ice Data Center’s graph of Arctic sea ice extent:
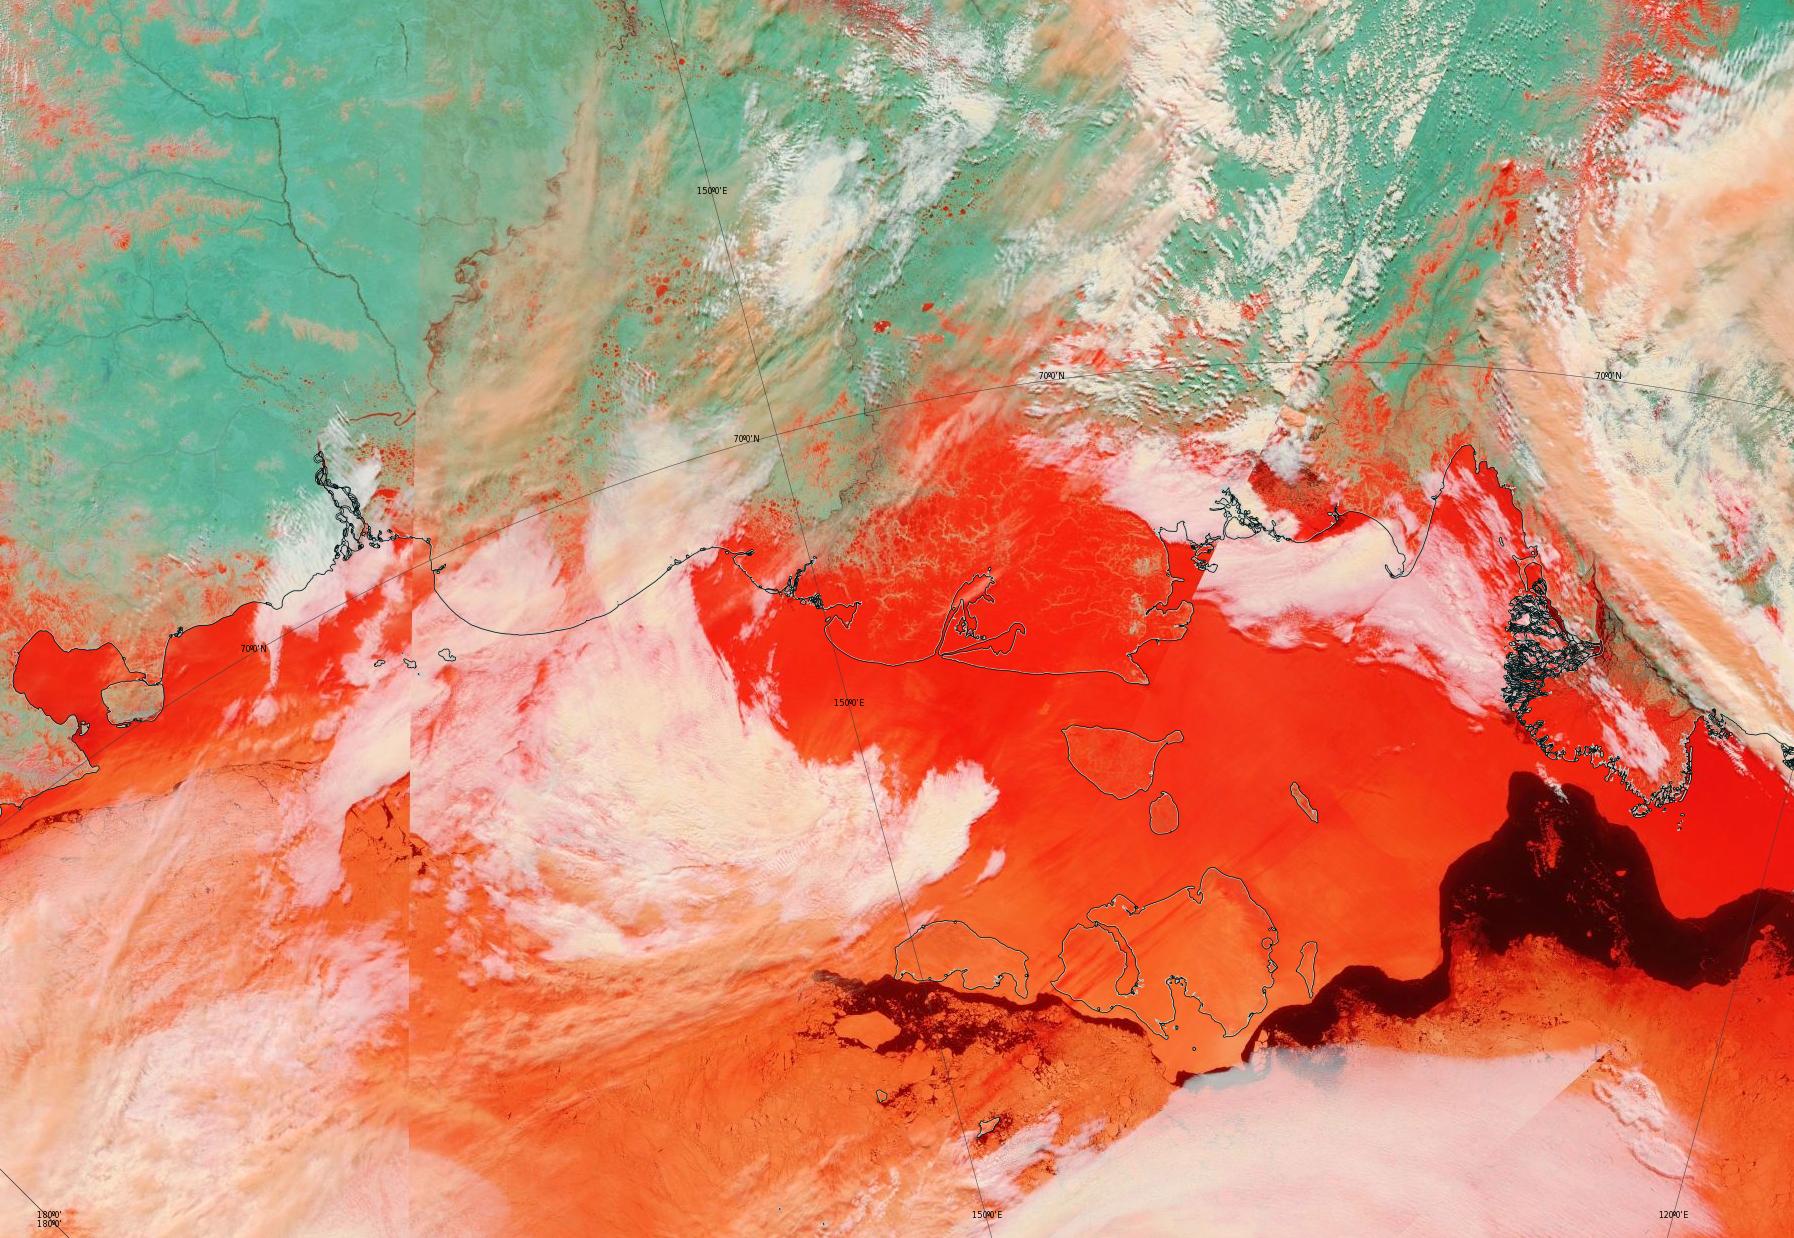
Currently extent is significantly below 2012, albeit somewhat above 2016 at the same time of year. And what of melt ponds? In 2012 there was evidence of less snow cover over land and more surface water on the ice on the Siberian side of the Arctic:
NASA Worldview “false-color” image of the Eastern Arctic on May 25th 2012, derived from the MODIS sensor on the Terra satellite
Other than that Arctic sea ice in 2019 looks to be in worse shape than in 2012.
[Edit – May 27th]
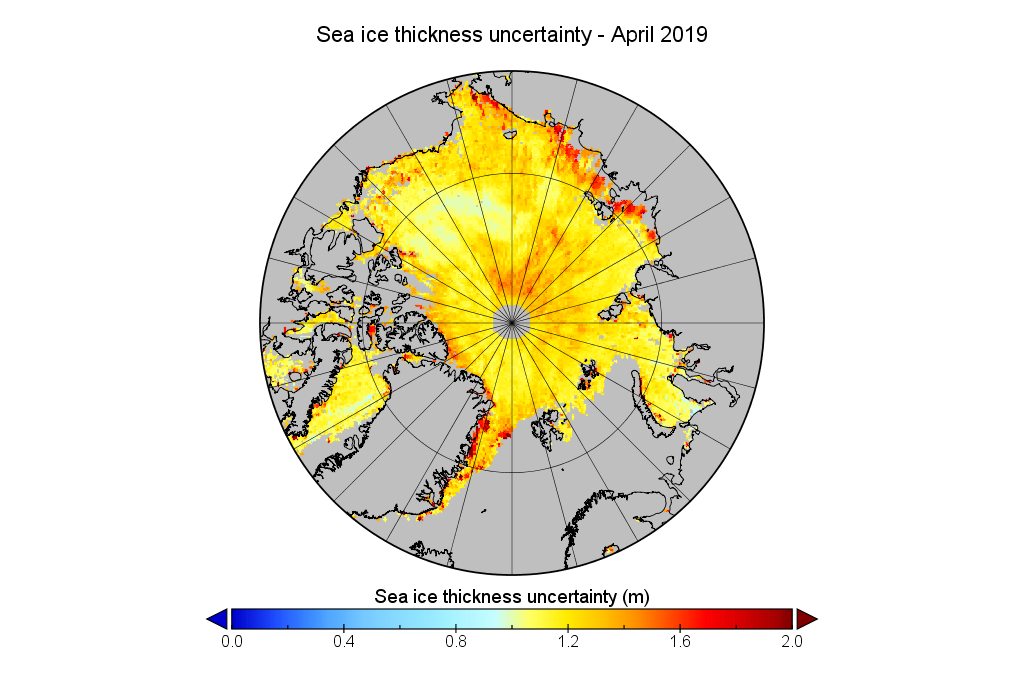
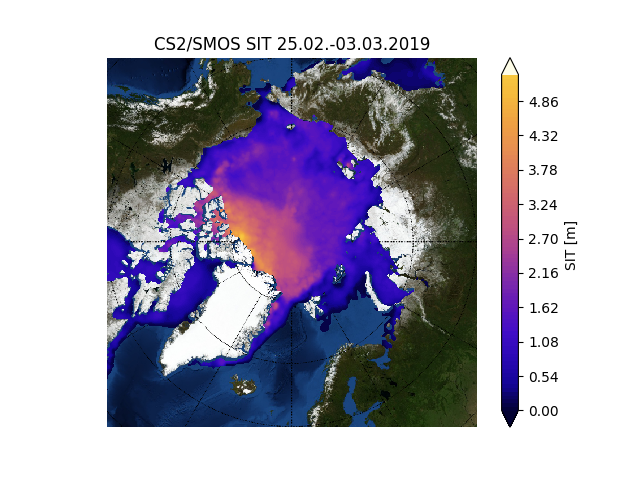
We’ve established that the extent of Arctic sea ice at the end of May 2019 is less than in 2012, but something else to consider is whether that ice is currently thicker than in 2012, or not. Satellites can have a reasonable stab at measuring the area of sea ice, but the third dimension is much trickier. The European Space Agency’s CryoSat-2 satellite has been attempting to measure sea ice thickness since 2010, so let’s take at the conclusions it has reached:
Don’t forget to take a good long look at the associated uncertainties too:
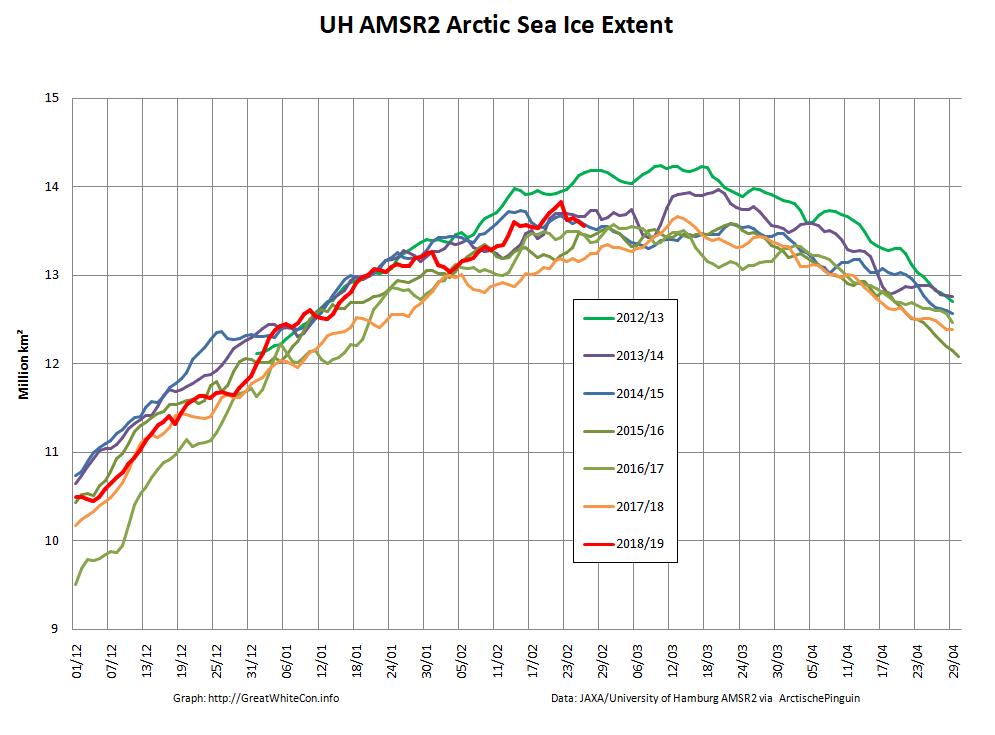
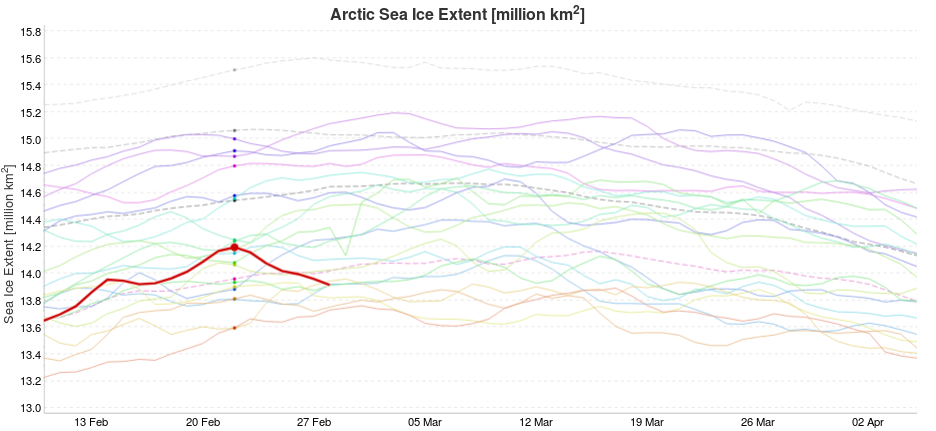
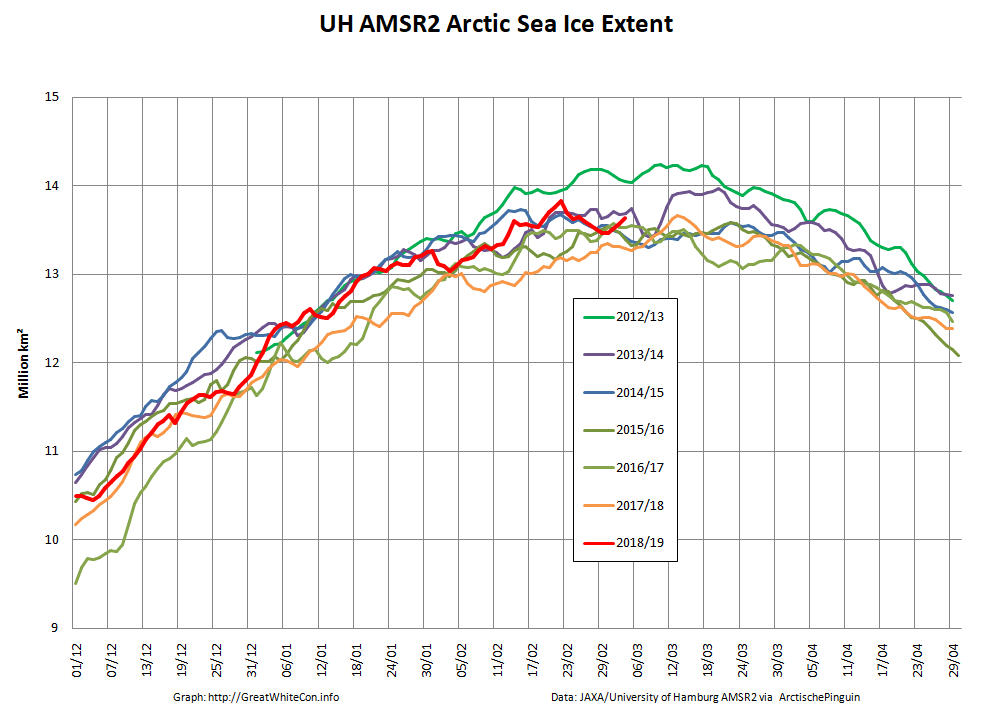
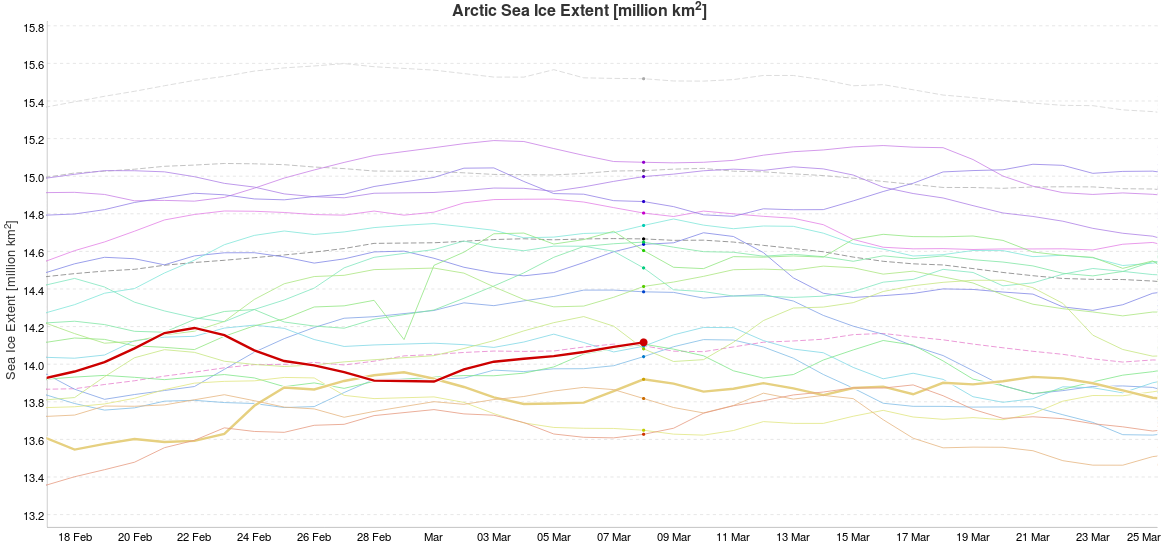
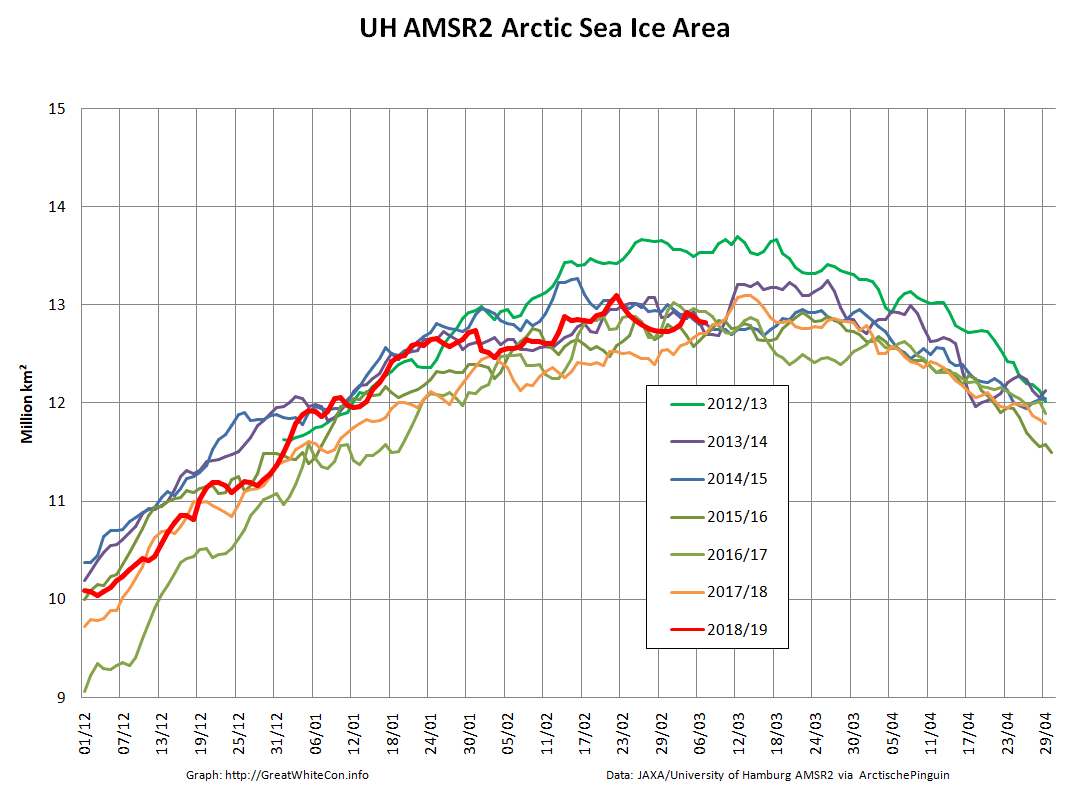
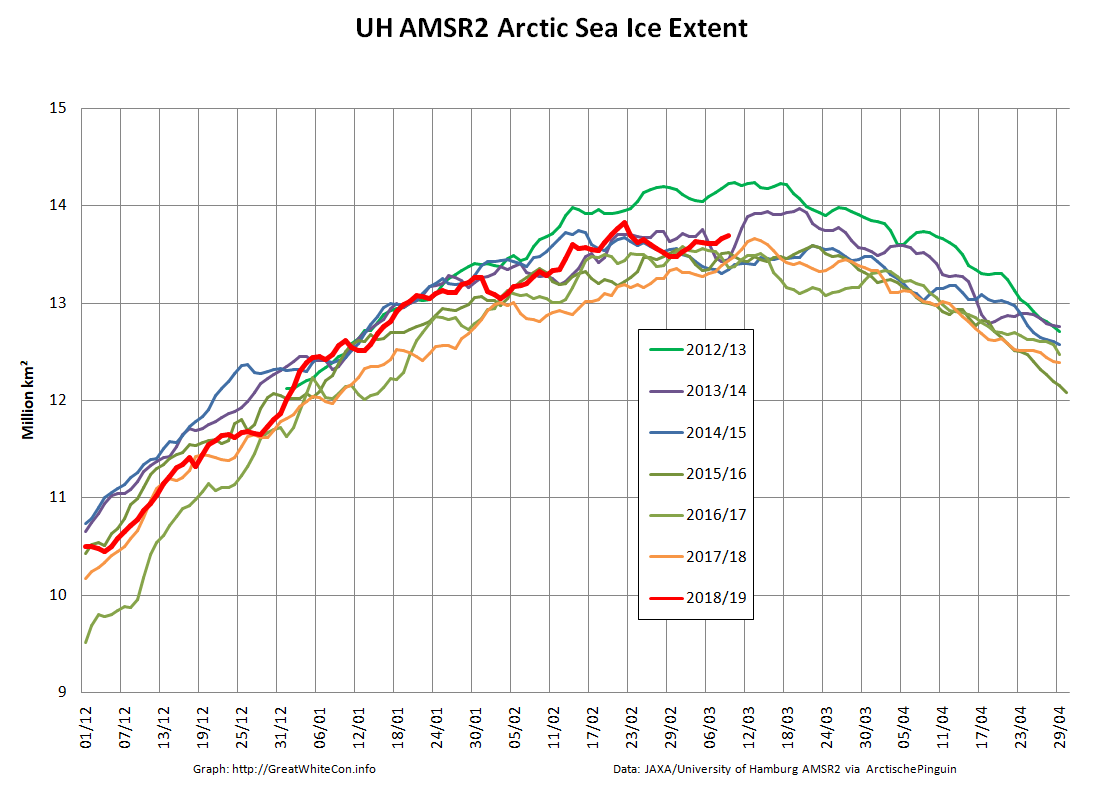
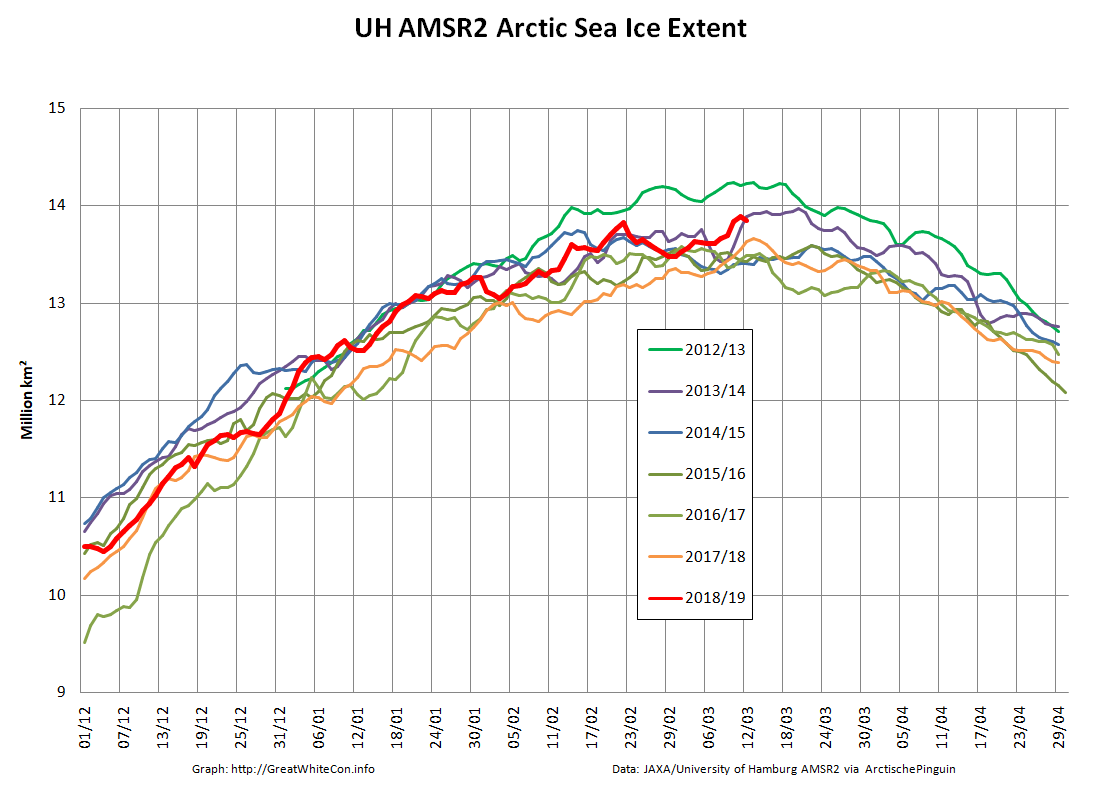
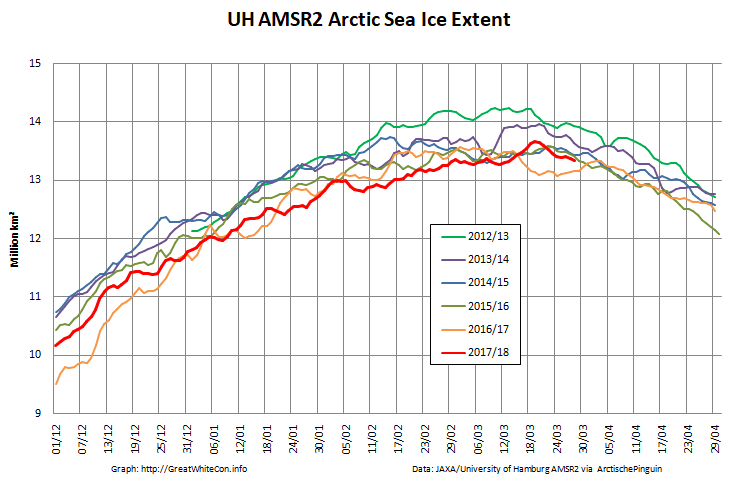
March 2019 has arrived, which in recent years has proved to be by far the likeliest month to contain the maximum extent of Arctic sea ice for the year. To begin with, here’s our favourite high resolution extent graph calculated by “Wipneus” from University of Hamburg/JAXA AMSR2 data:
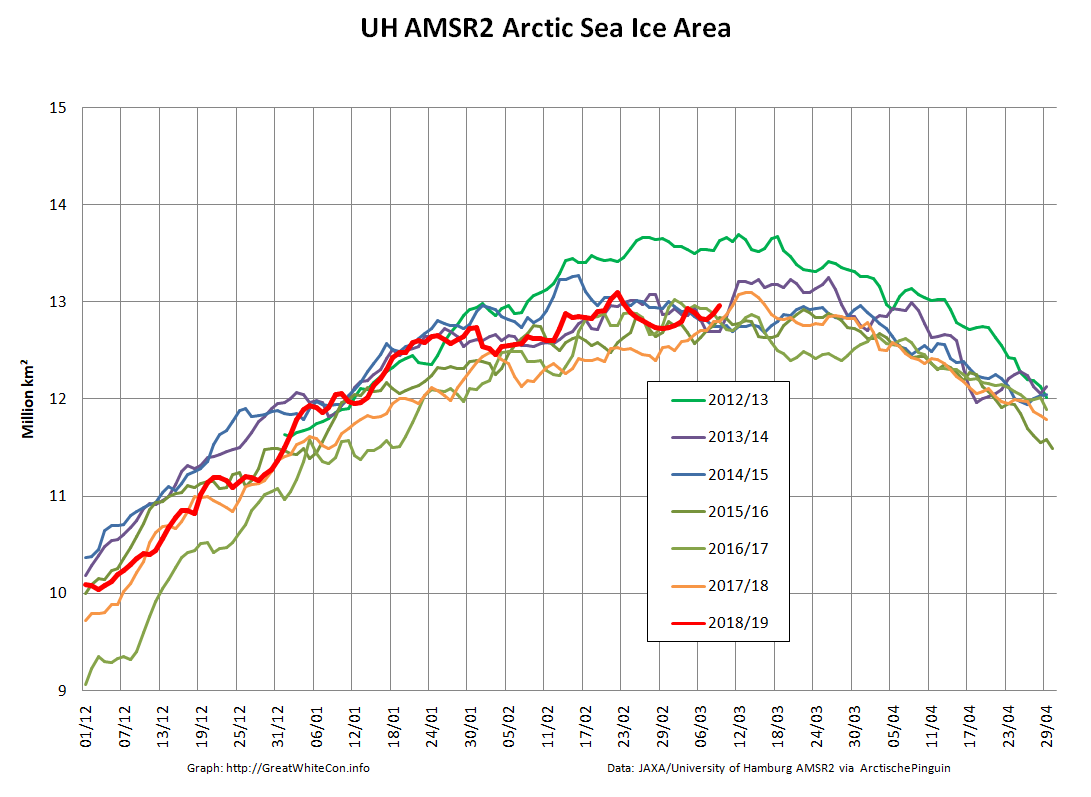
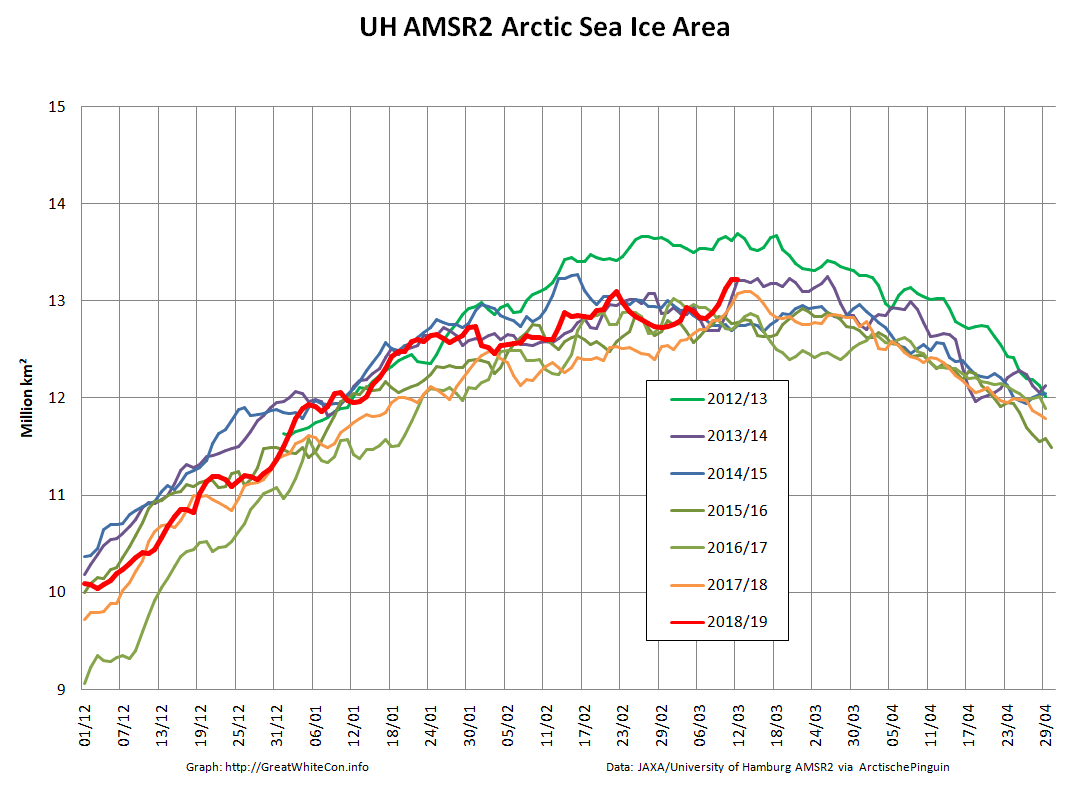
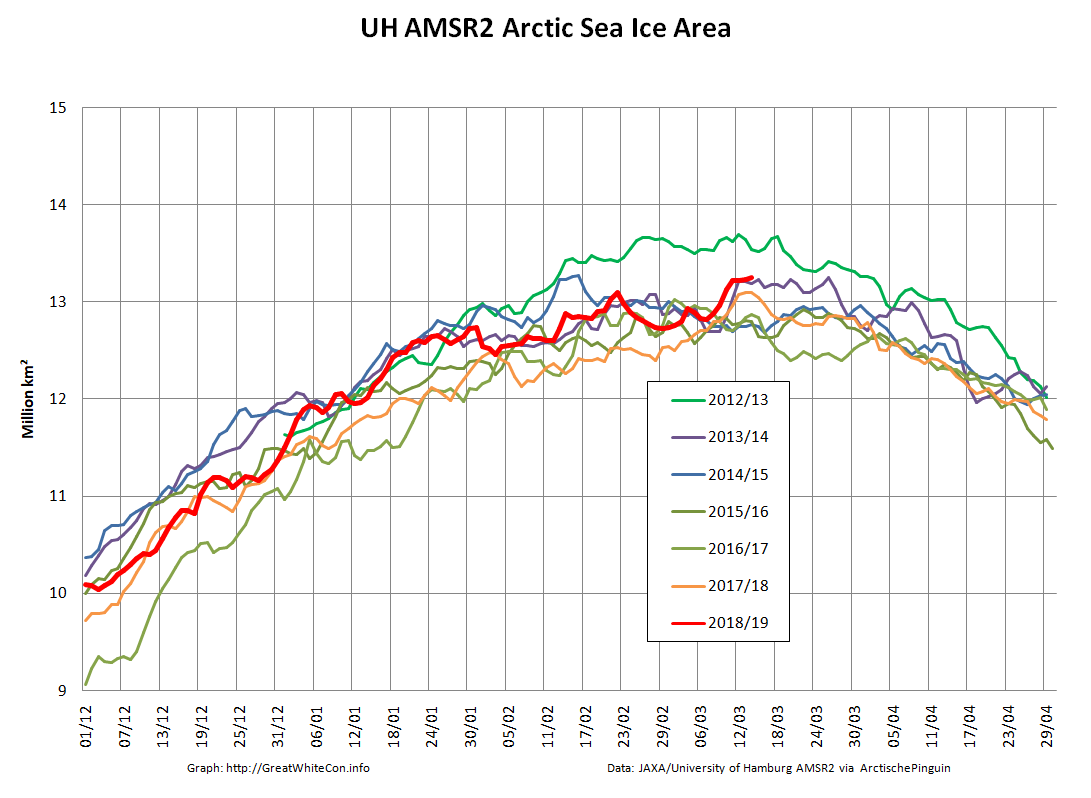
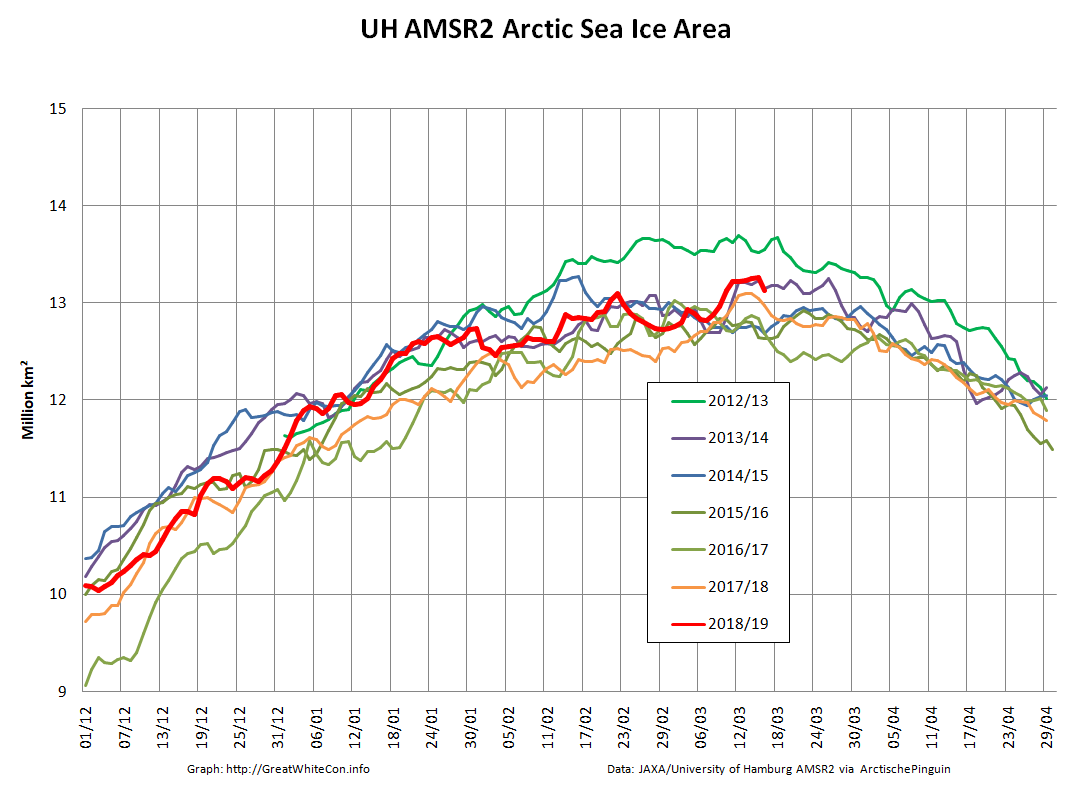
Hopefully you can plainly see the pronounced sharp peak towards the end of February 2019? The current maximum Arctic sea ice extent for 2019 is 13.83 million square kilometers on February 22nd. Here’s Arctic sea ice area for good measure:
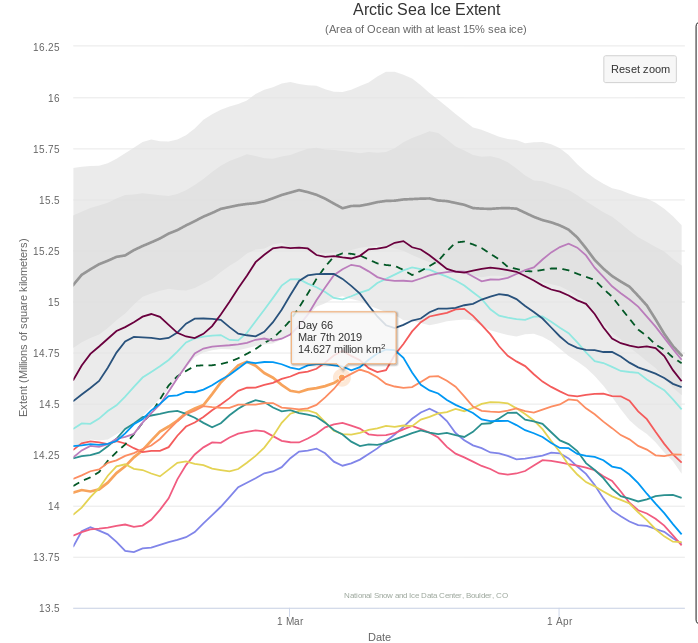
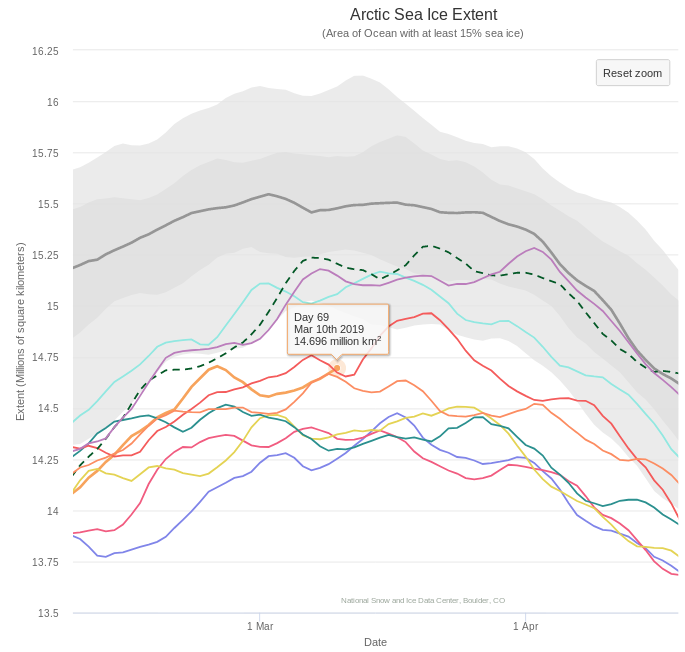
The current maximum area for 2019 is 13.10 million square kilometers, also on February 22nd. Here too is the NSIDC’s 5 day averaged extent:
This reveals a current maximum extent for 2019 of 14.705 million square kilometers on February 24th.
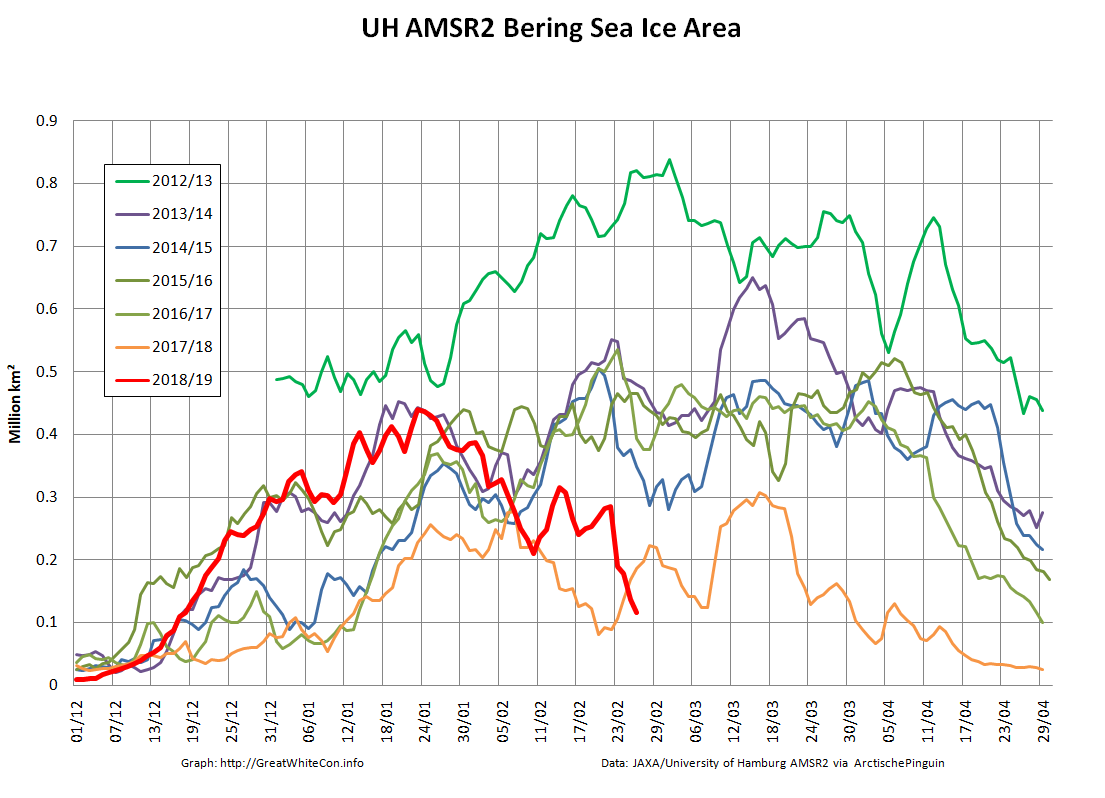
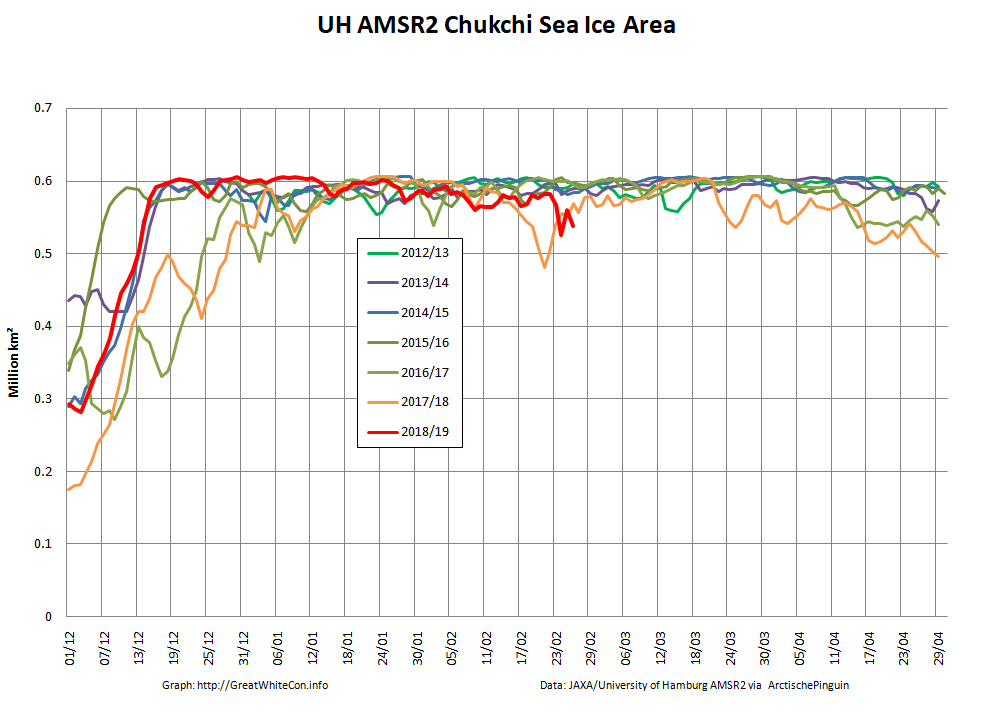
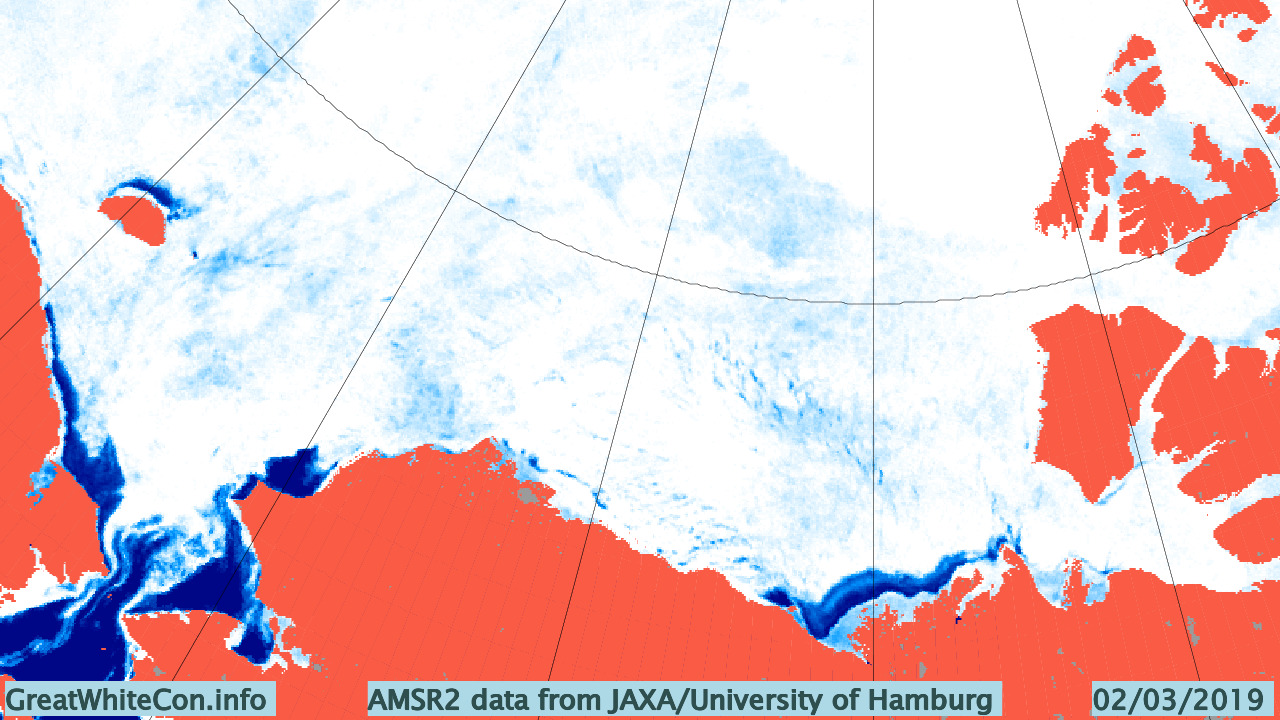
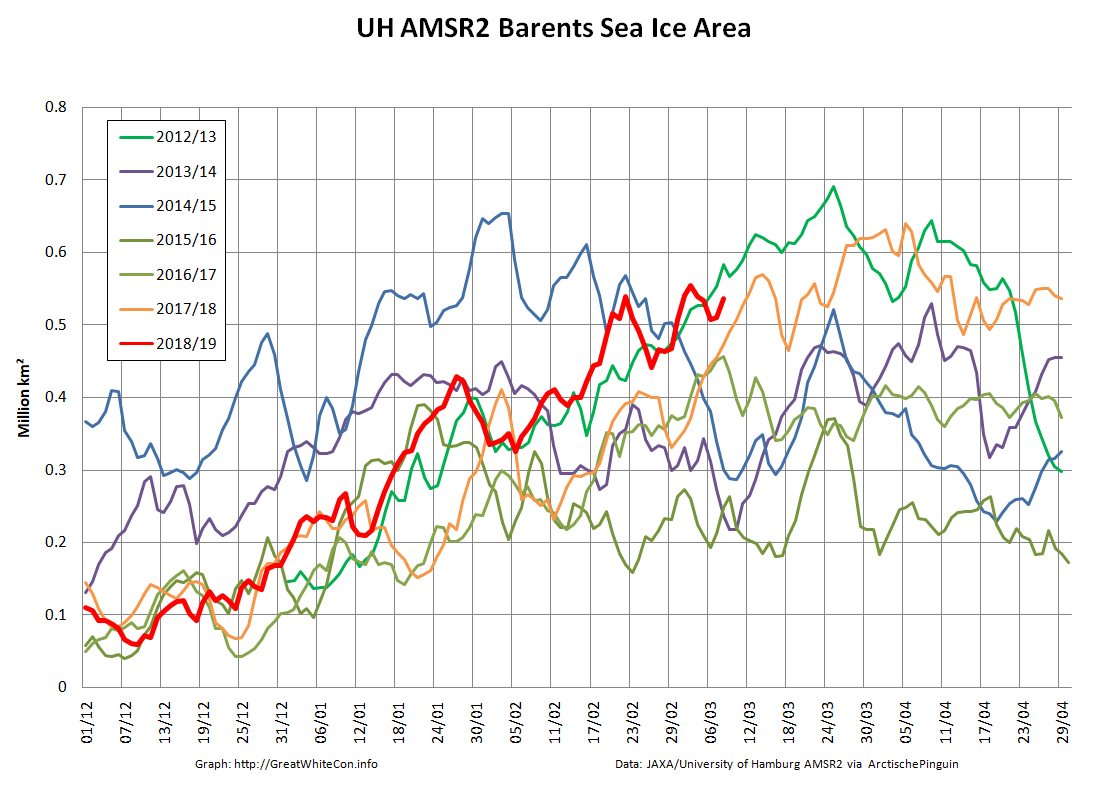
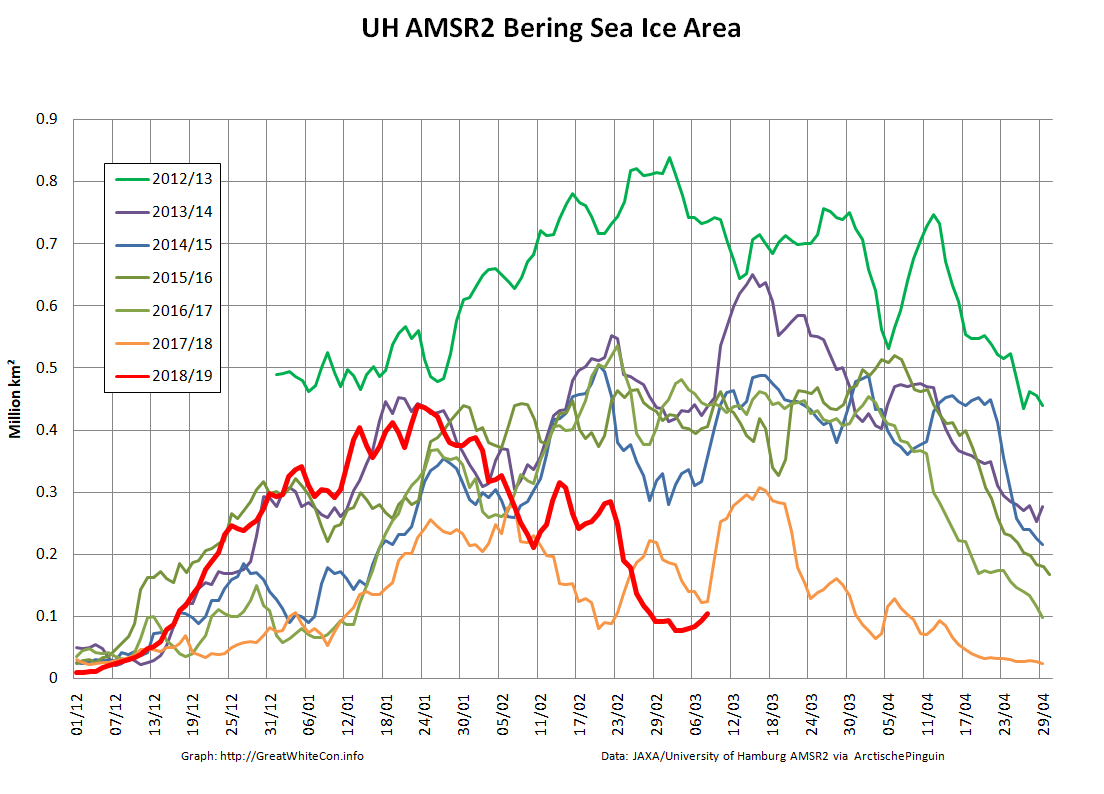
At this juncture you may well be wondering what the cause of that sudden sharp peak might be? Here’s your starter for ten:
Whilst overall Arctic sea ice area is unremarkable for the current decade, sea ice area in the Bering Sea is remarkable low for the time of year! What’s more much like last year the Chukchi Sea is not currently full to overflowing with sea ice, and is also lowest for the date in the AMSR2 satellite records:
I’ve also been experimenting with the new gridded CryoSat-2/SMOS thickness data from the Finnish Meteorological Institute, which reveals this:
That’s a weekly overview dated February 24th, but it does perhaps explain how such a large area of sea ice could melt so swiftly?
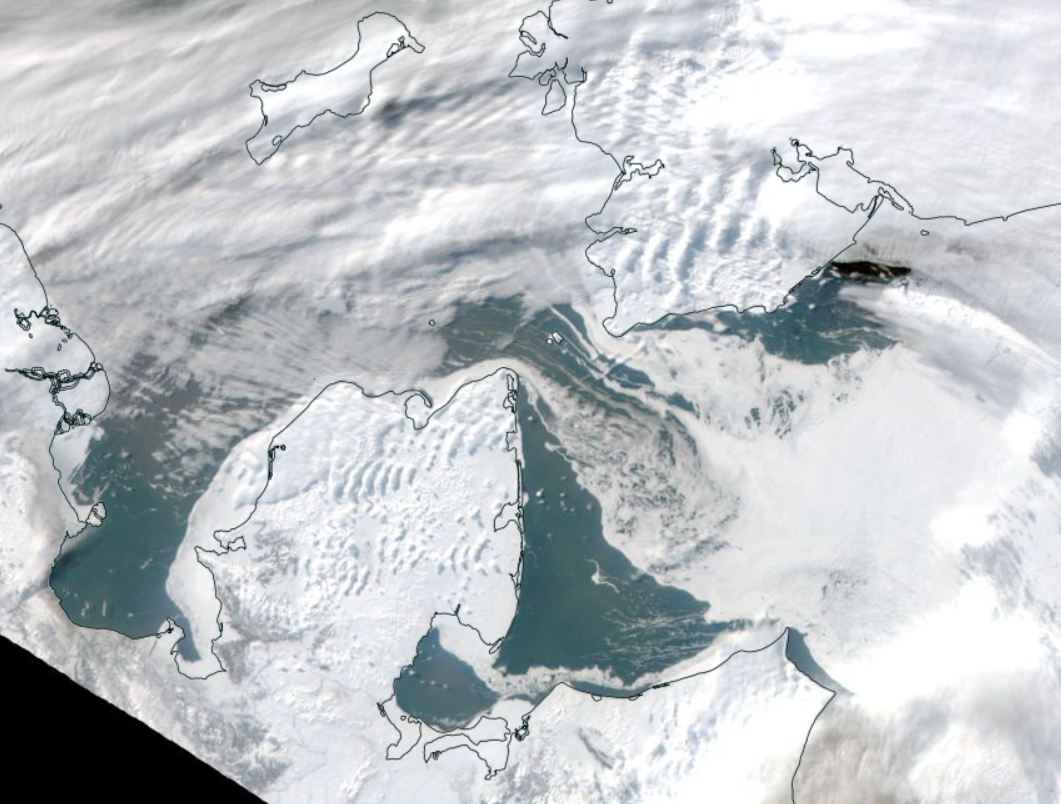
As luck would have it the skies are reasonably clear over the Bering Strait this morning (UTC). Here’s Terra’s view from on high of the current situation:
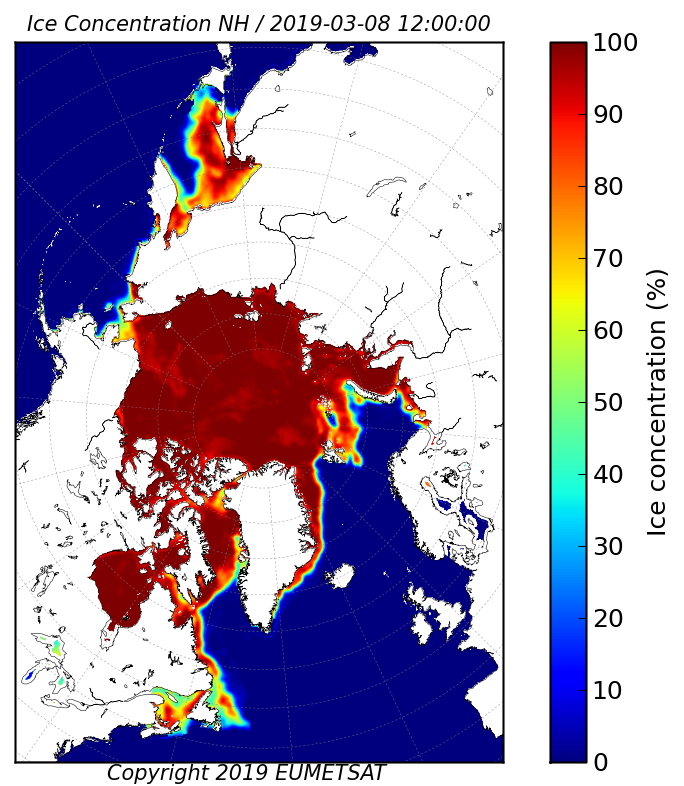
In addition, here is the underlying sea ice concentration data from the OSI-SAF:
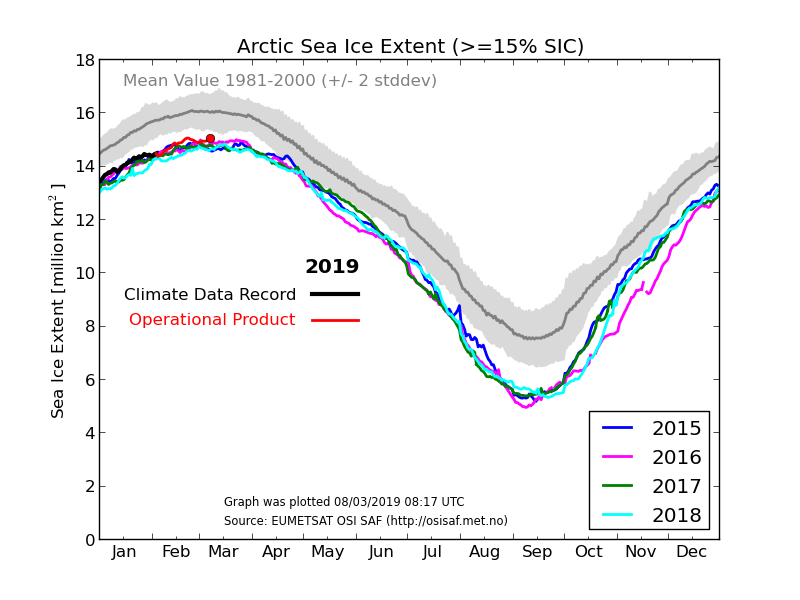
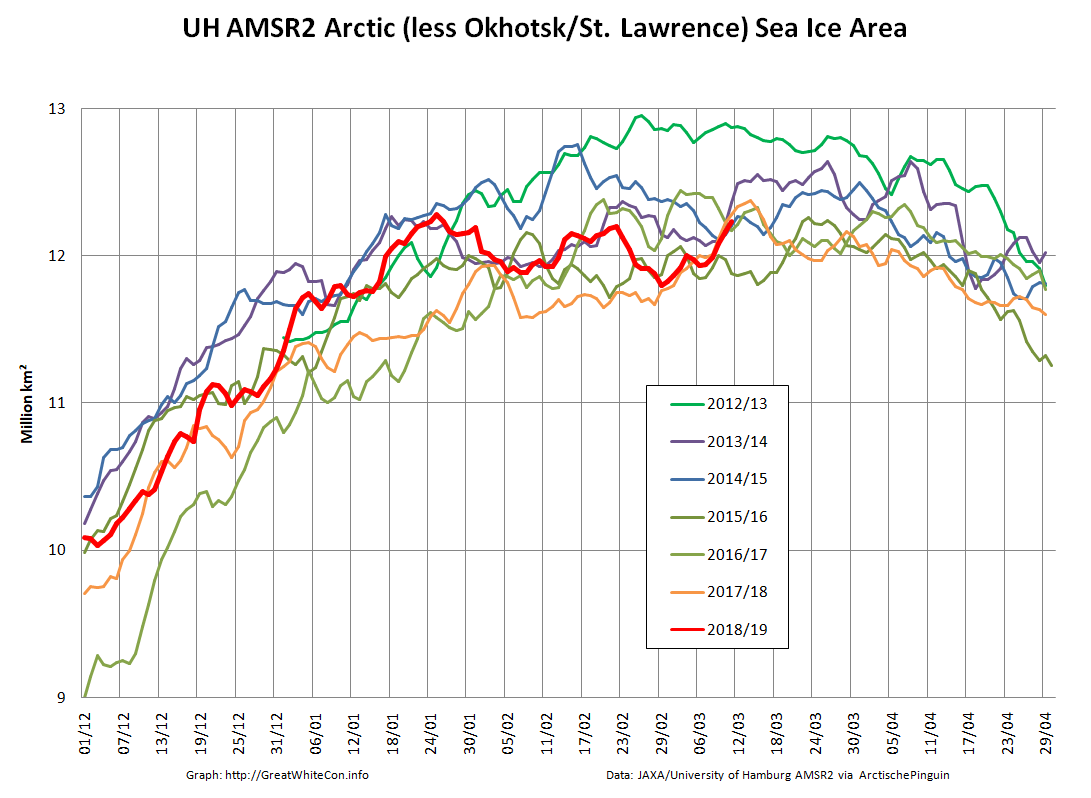
Since Michael is also asserting that there currently exists “the greatest February Arctic sea ice extent (according to DMI) in your blog’s history”, here’s Arctic sea ice area excluding the extremely peripheral Okhotsk and St. Lawrence regions:
P.S. Wipneus’ Pi has processed the AMSR2 data now, and area shows another, more modest, decline today:
Both area and extent are still moving inexorably upwards:
The late February maximum still holds, on the high resolution numbers at least. The JAXA/VISHOP web site is down at the moment, so we’ll have to wait for an update to that particular metric, as well as a post weekend update to the NSIDC’s Charctic chart.
P.S. Jaxa is still down this afternoon, but here’s the latest from the NSIDC:
[Edit – March 13th]
Arctic wide area and extent have blasted past their respective late February maxima:
However Arctic sea ice area excluding the Okhotsk and St. Lawrence peripheral regions has still not exceeded the maximum formed on January 25th:
[Edit – March 14th]
This morning’s data reveal the first decline in extent for several days:
The (extremely!) tentative new maximum Arctic sea ice extent for 2019 is 13.89 million square kilometers on March 12th.
[Edit – March 15th]
JAXA is back!
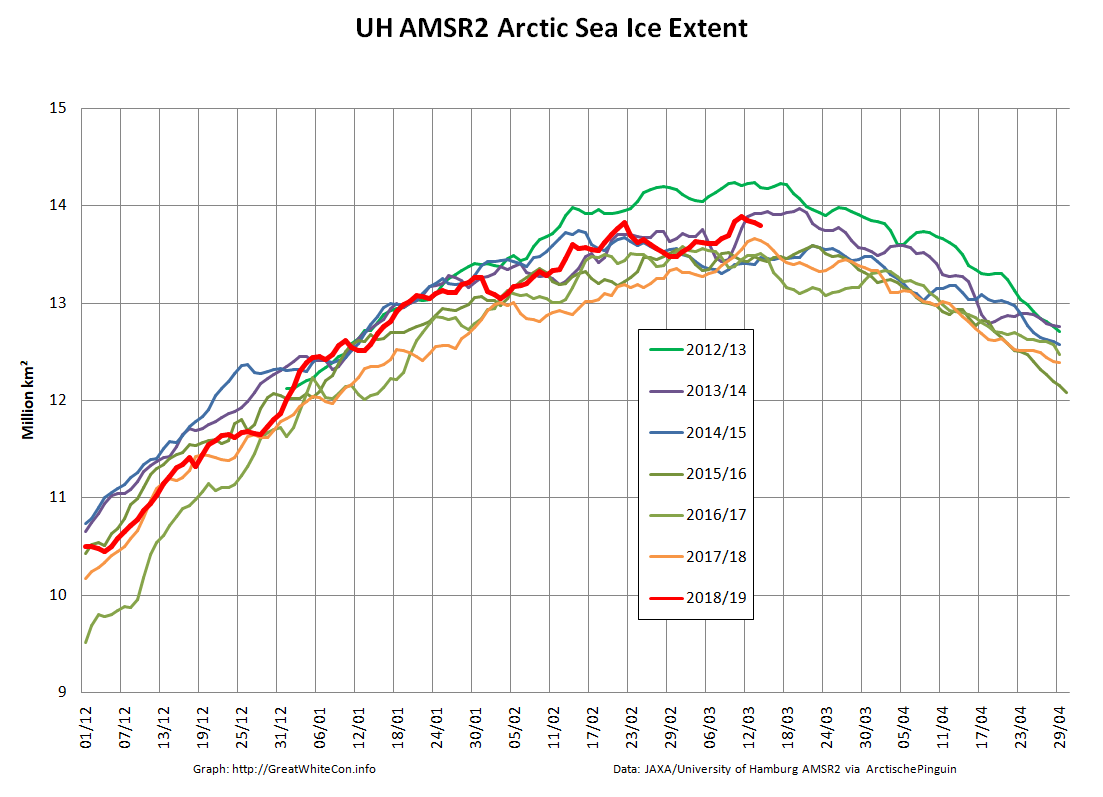
UH AMSR2 confirms that extent is still declining:
[Edit – March 16th]
Arctic sea ice extent continues to decline, whilst area is still flatlining:
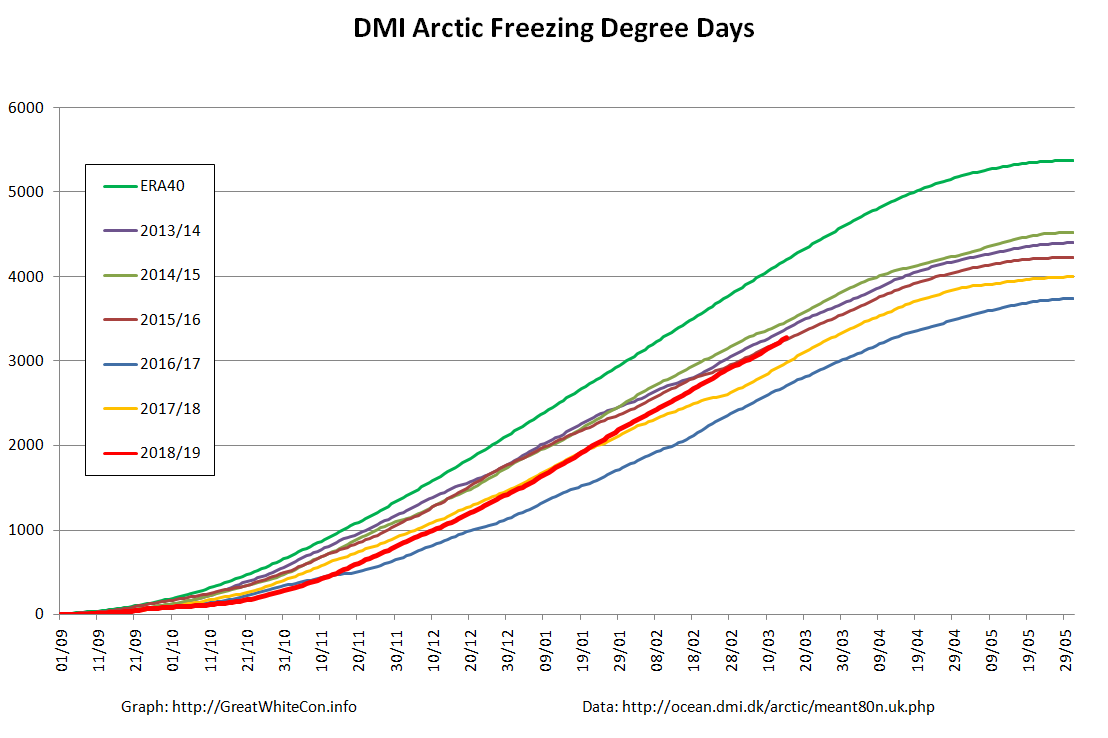
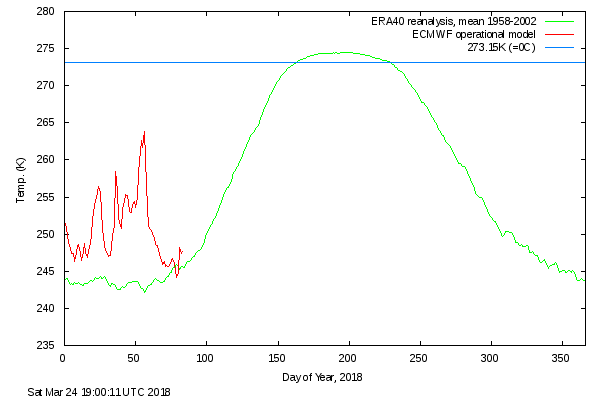
Meanwhile a look at freezing degree days based on the DMI’s dubiously weighted data for north of 80 degrees reveals the story of the freezing season. A historically warm start, but now back in amongst the pack of the 2010s:
[Edit – March 17th]
It looks as though there’ll be no going back from this. Arctic sea ice area is finally following extent’s decline in no uncertain terms:
Barring exceedingly unforeseen circumstances after this year’s “double top” that leaves the 2019 Arctic sea ice maximum extent numbers as follows:
UH/Wipneus AMSR2 – 13.89 million square kilometers on March 12th
JAXA/VISHOP AMSR2 – 14.27 million square kilometers on March 12th
NSIDC 5 day SSMIS – 14.78 million square kilometers on March 13th
[Edit – March 19th]
Arctic sea ice area has fallen off the proverbial cliff over the last few days. There can now be no doubt that the 2019 maximum extent has been reached:
That being the case, all other Arctic sea ice discussion for the month of March can now take place over at:
On March 13, 2019, Arctic sea ice likely reached its maximum extent for the year, at 14.78 million square kilometers (5.71 million square miles), the seventh lowest in the 40-year satellite record, tying with 2007. This year’s maximum extent is 860,000 square kilometers (332,000 square miles) below the 1981 to 2010 average maximum of 15.64 million square kilometers (6.04 million square miles) and 370,000 square kilometers (143,000 square miles) above the lowest maximum of 14.41 million square kilometers (5.56 million square miles) set on March 7, 2017. Prior to 2019, the four lowest maximum extents occurred from 2015 to 2018.
The date of the maximum this year, March 13, was very close to the 1981 to 2010 median date of March 12.
Please note this is a preliminary announcement of the sea ice maximum. At the beginning of April, NSIDC scientists will release a full analysis of winter conditions in the Arctic, along with monthly data for March.
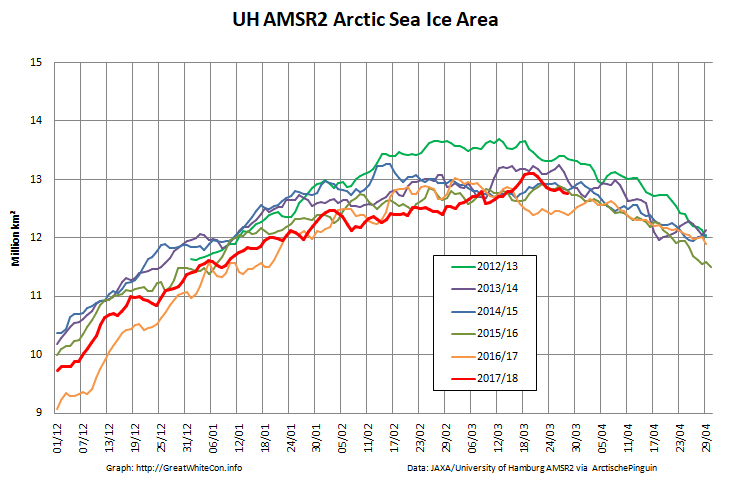
According to the latest edition of the National Snow and Ice Data Center’s “Arctic Sea Ice News”
On March 17, 2018, Arctic sea ice likely reached its maximum extent for the year, at 14.48 million square kilometers (5.59 million square miles), the second lowest in the 39-year satellite record, falling just behind 2017. This year’s maximum extent is 1.16 million square kilometers (448,000 square miles) below the 1981 to 2010 average maximum of 15.64 million square kilometers (6.04 million square miles).
The four lowest seasonal maxima have all occurred during the last four years. The 2018 maximum is 60,000 square kilometers (23,200 square miles) above the record low maximum that occurred on March 7, 2017.
Here’s a close up view of recent maxima via the NSIDC’s Charctic interactive sea ice graph:
Next let’s take a look at extent data from the Japanese National Institute of Polar Research, colloquially referred to as “JAXA extent”
In this case the maximum was 13.89 million square kilometers, also on March 17th.
Here too are the extent and area graphs based on Wipneus’ processing of the University of Hamburg’s AMSR2 based concentration data:
They highlight the surge in Arctic sea ice area in the middle of March due to the sudden “cold snap”:
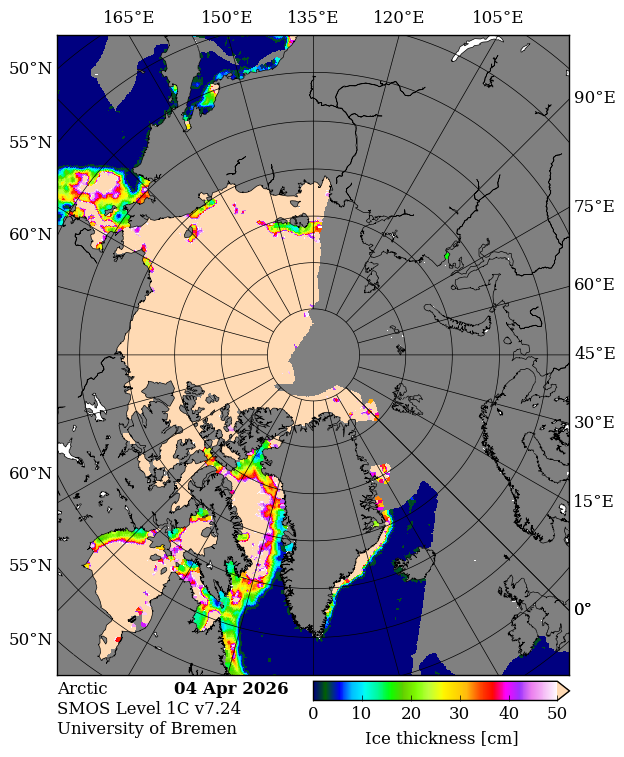
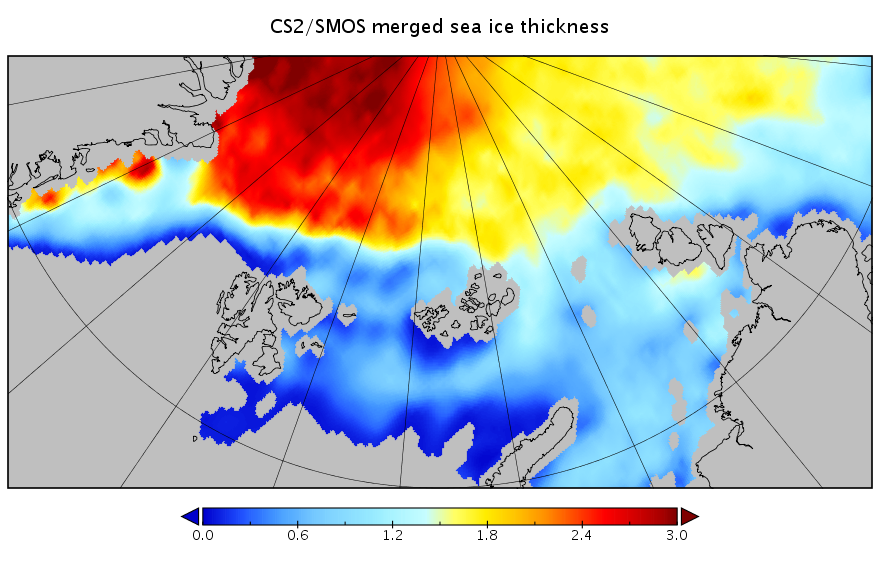
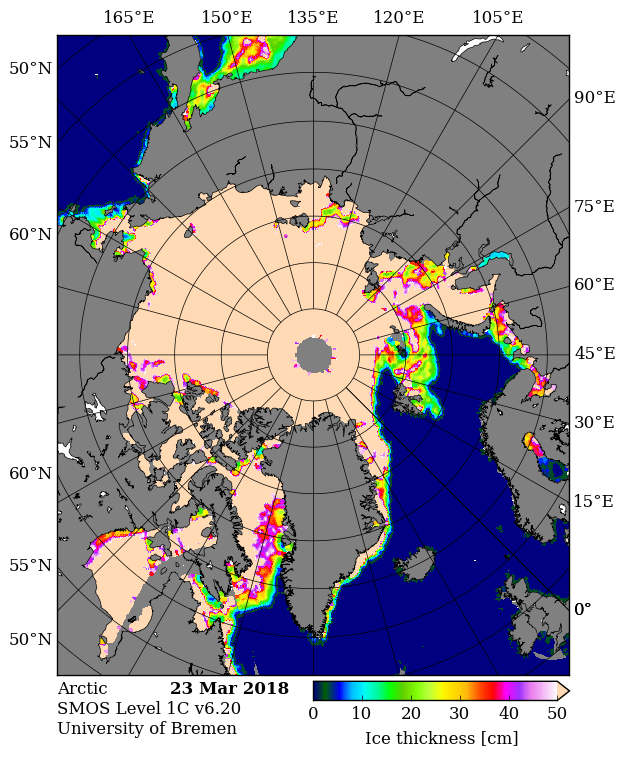
Looking at the third Arctic dimension, here’s the latest SMOS thickness map from the University of Bremen:
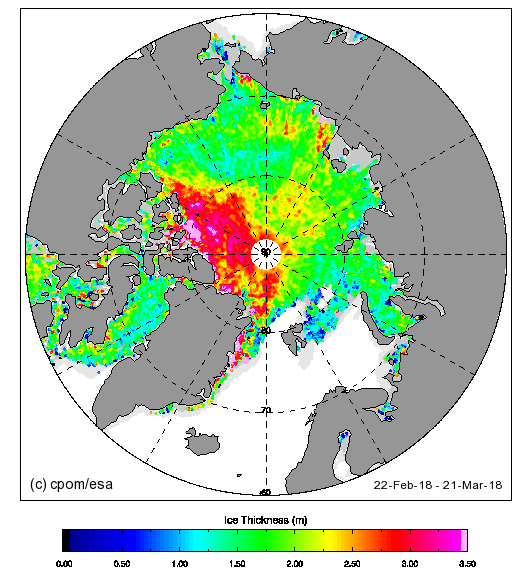
and here’s the latest CryoSat-2 thickness map:
They reveal large areas of relatively thin sea ice in the Okhotsk and Barents Seas where the ice can now be expected to melt as quickly as it formed. There is also remarkably little sea ice in the Bering Sea for the time of year:
This website uses cookies to improve your experience. We'll assume you're ok with this, but you can opt-out if you wish. Cookie settingsACCEPT
Privacy & Cookies Policy
Privacy Overview
This website uses cookies to improve your experience while you navigate through the website. Out of these, the cookies that are categorized as necessary are stored on your browser as they are essential for the working of basic functionalities of the website. We also use third-party cookies that help us analyze and understand how you use this website. These cookies will be stored in your browser only with your consent. You also have the option to opt-out of these cookies. But opting out of some of these cookies may affect your browsing experience.
Necessary cookies are absolutely essential for the website to function properly. This category only includes cookies that ensures basic functionalities and security features of the website. These cookies do not store any personal information.
Any cookies that may not be particularly necessary for the website to function and is used specifically to collect user personal data via analytics, ads, other embedded contents are termed as non-necessary cookies. It is mandatory to procure user consent prior to running these cookies on your website.