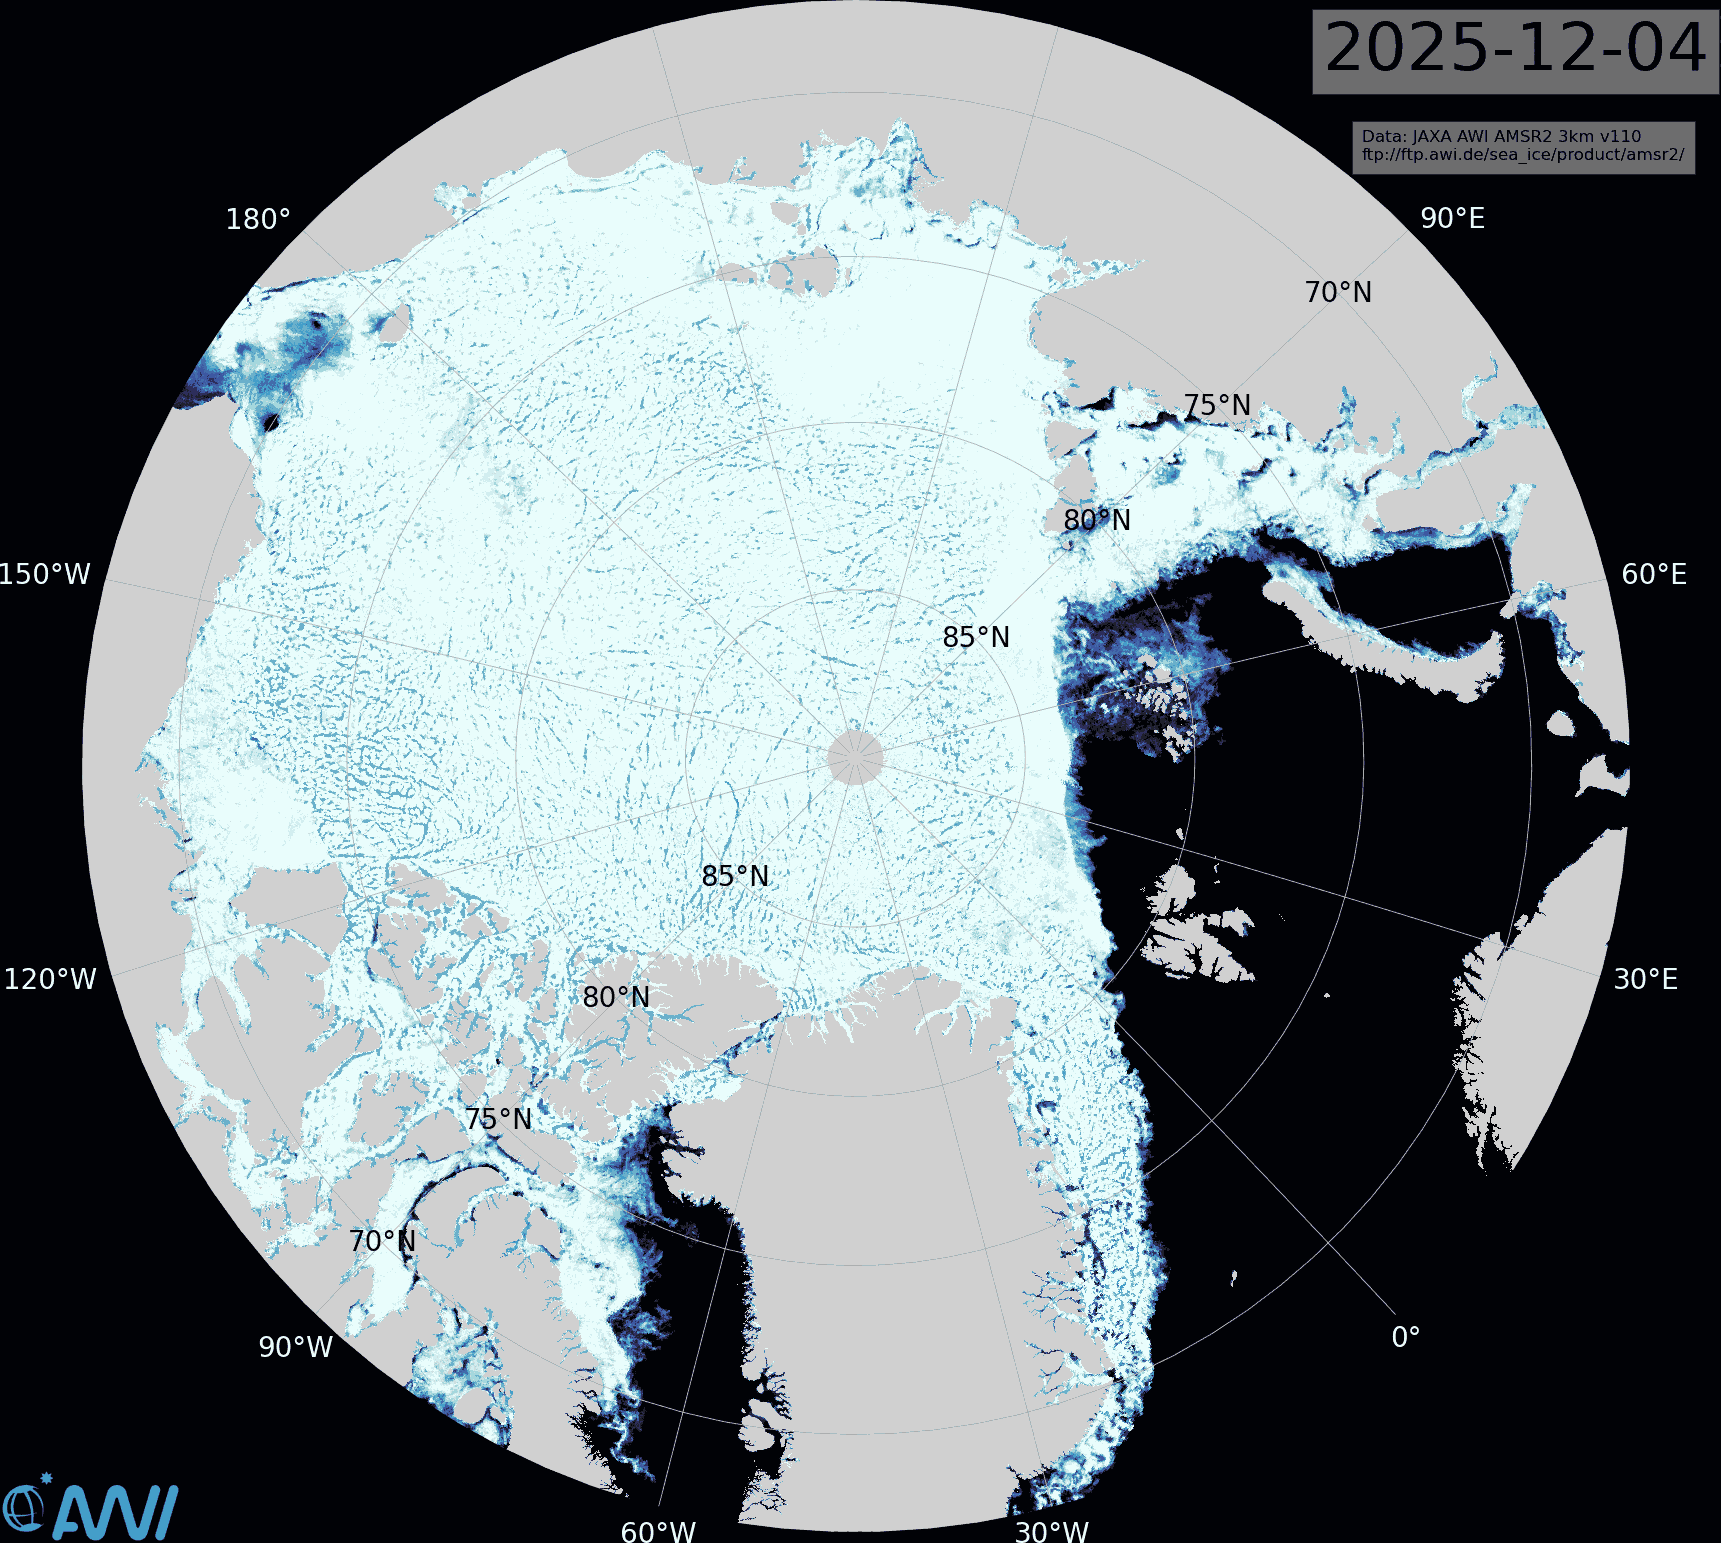
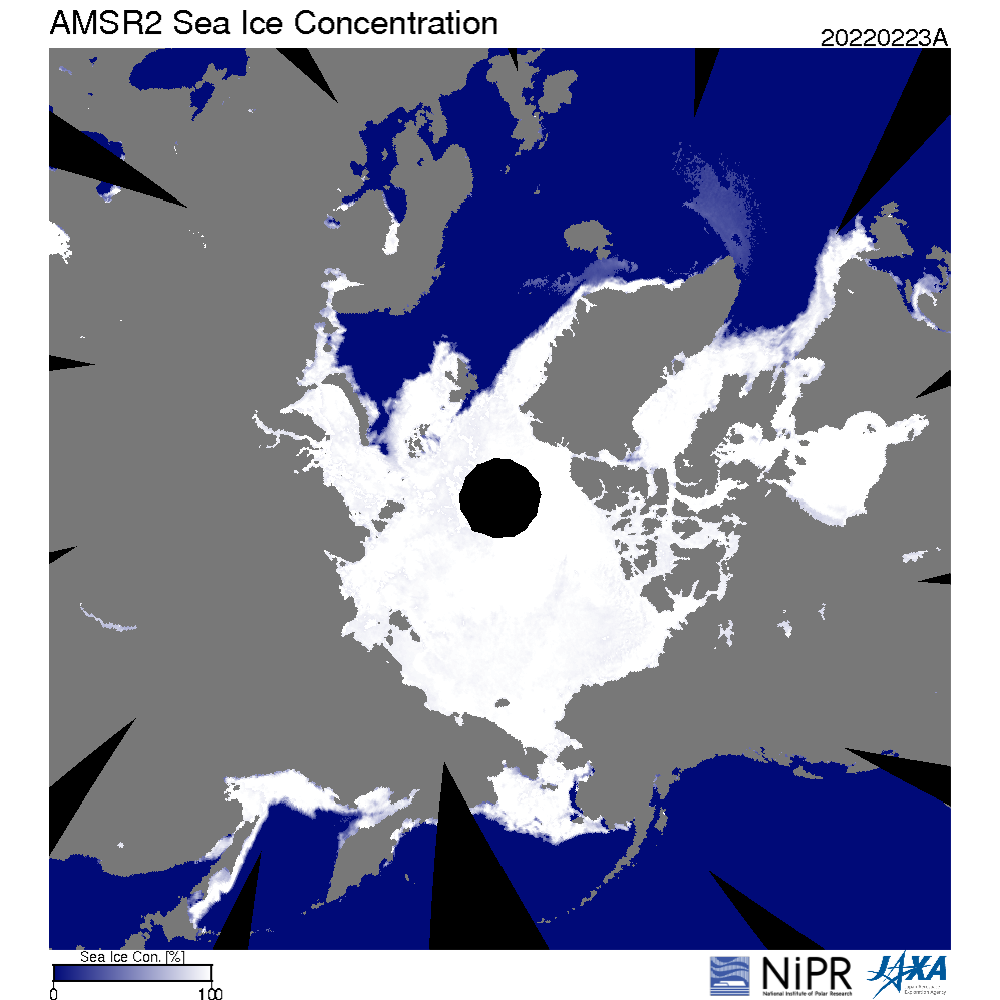
The latest Alfred Wegener Institute sea ice concentration map shows that the Pacific side of the Central Arctic Basin is now almost completely refrozen:
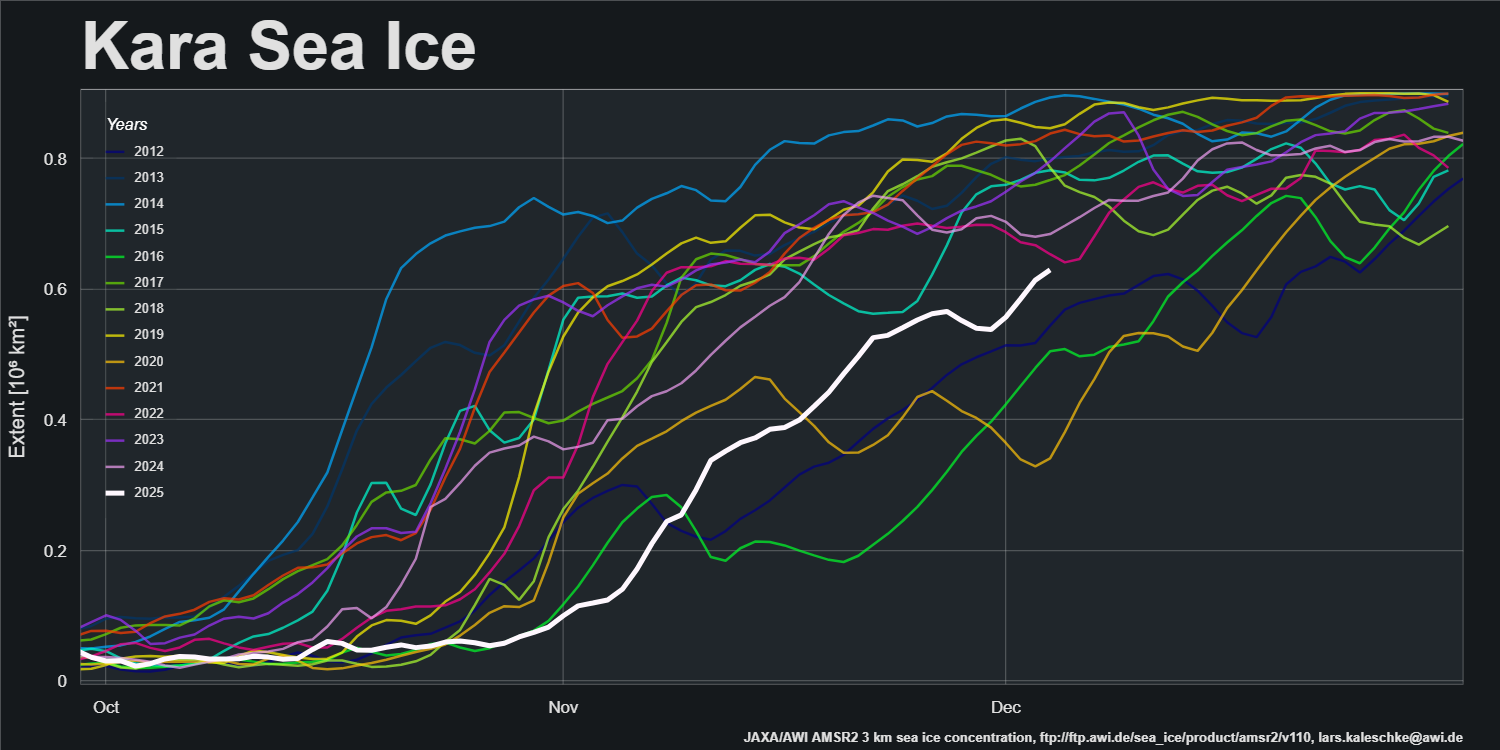
On the Atlantic side of the Arctic the Kara Sea is rapidly refreezing:
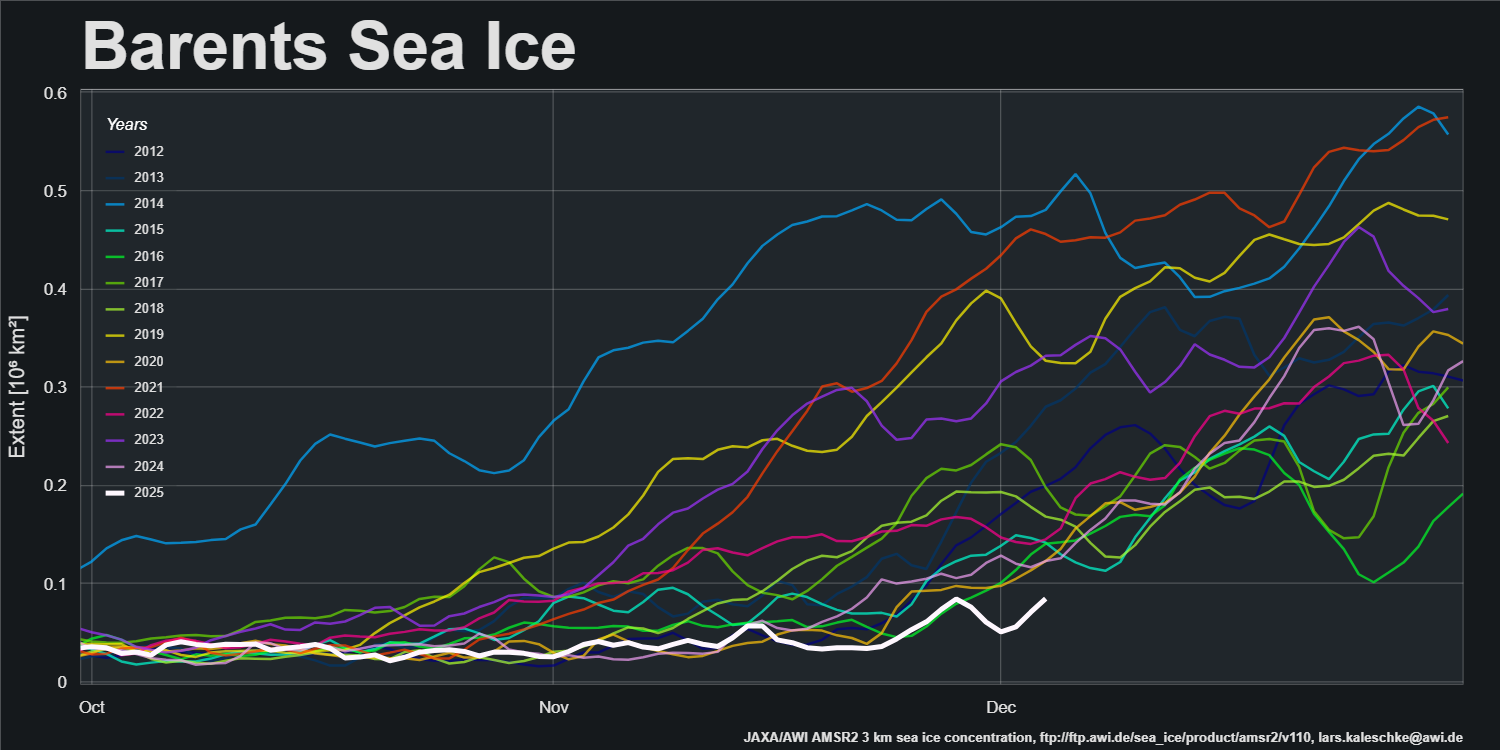
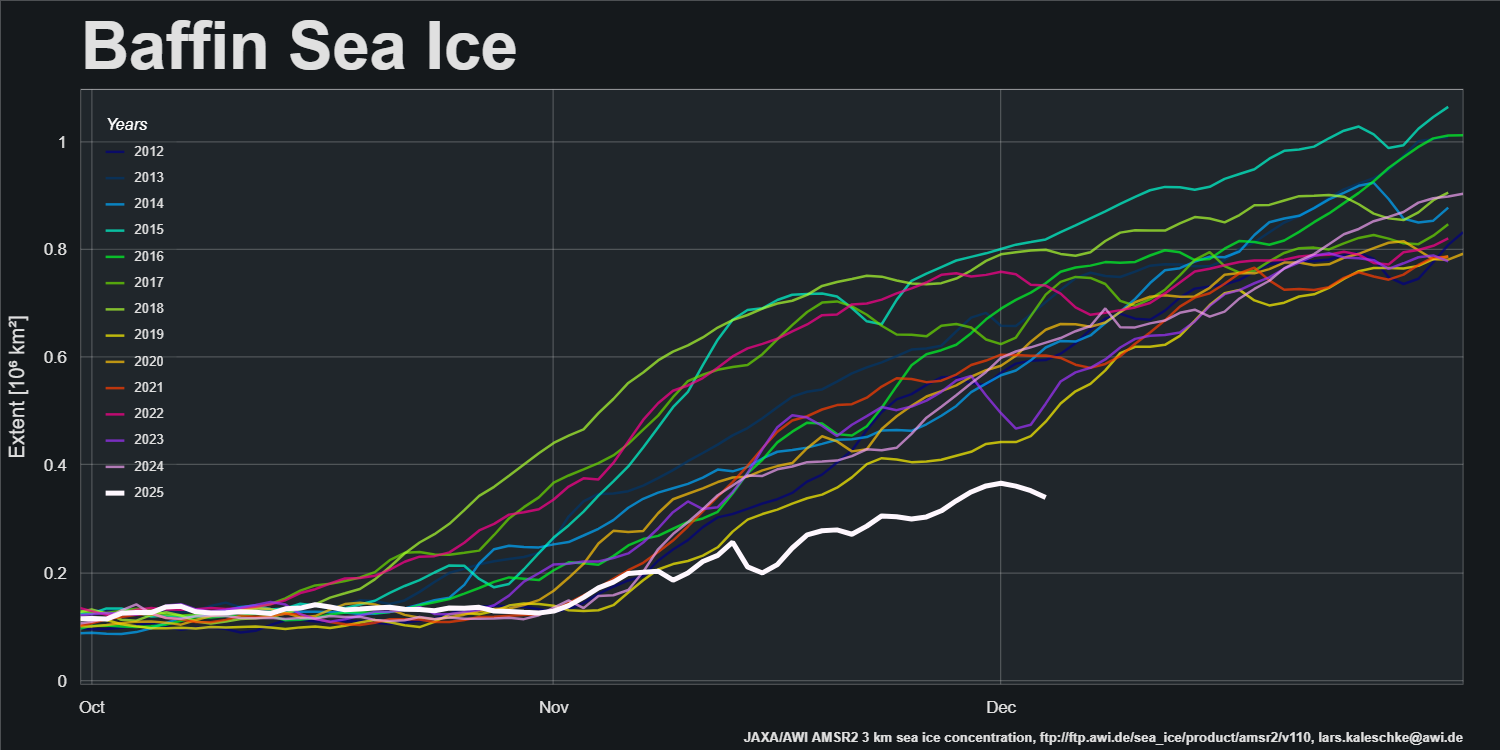
However, sea ice extent in the Barents Sea and Baffin Bay is currently lowest for the date in the AMSR2 record:
Pan Arctic JAXA/ViSHOP extent is currently lowest for the date in the satellite era:
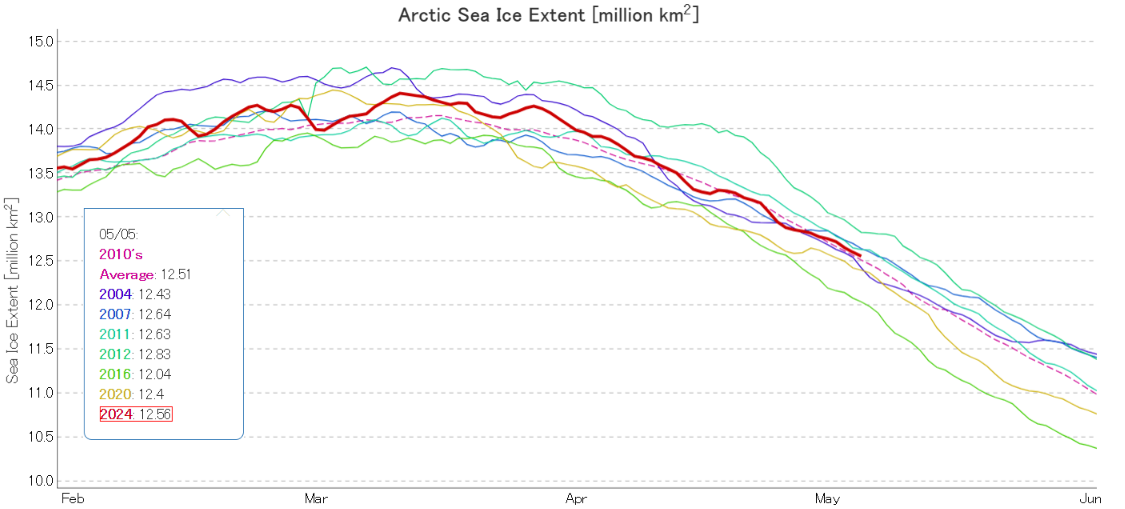
Since a certain “sceptic” has recently been comparing 2024 sea ice extent to “20 years ago”, here’s the current JAXA/ViSHOP extent graph of selected years, including 2004:
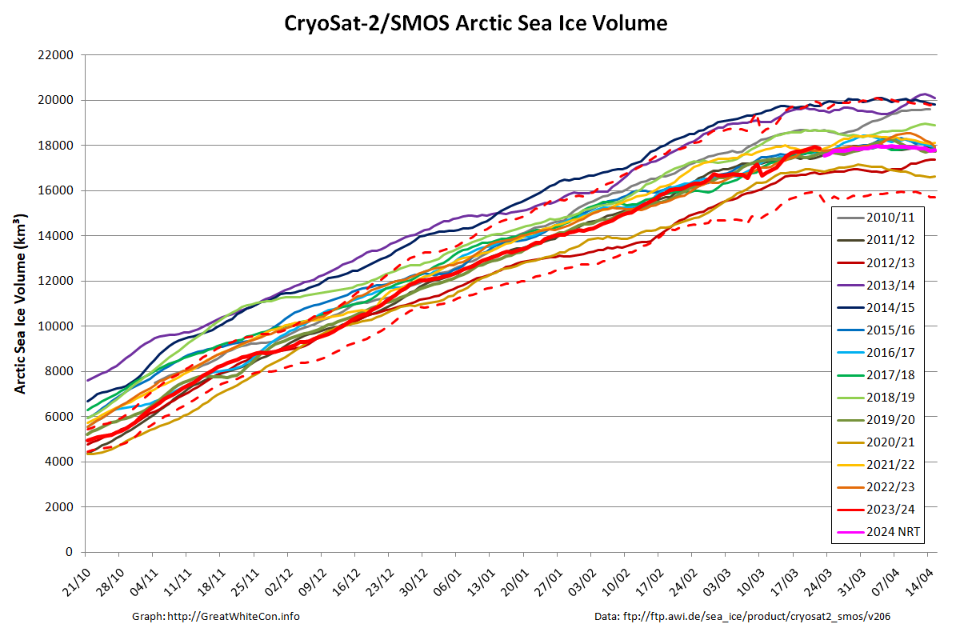
The CryoSat-2/SMOS merged Arctic sea ice volume graph finishes on April 15th, but older data is being reanalysed and here is the latest version:
The gap in the near real time data due to the problem with the SMOS satellite during the first half of March has been filled in, but the result doesn’t look very convincing to say the least!
The PIOMAS gridded thickness data for April 2024 is now available. Here’s the end of month volume graph:
A change is perhaps even better than a rest? Let’s start February with a reminder that following close behind another recent Arctic cyclone, Storm Ingunn caused red weather warnings for high winds and avalanches in Norway two days ago:
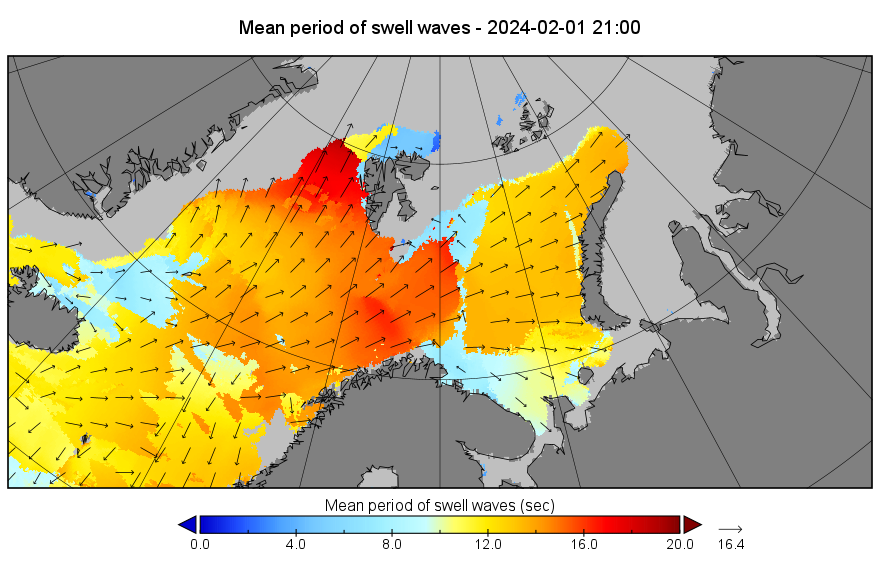
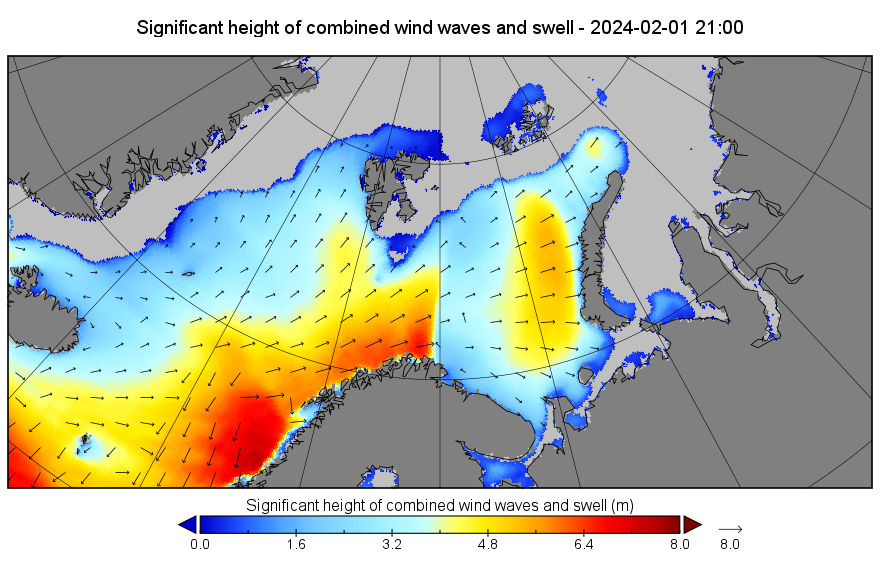
By yesterday evening another long period, storm driven swell was arriving at the sea ice edge in the Fram Strait, and to a lesser extent in the Barents Sea:
By this morning Ingunn had merged with the remnants of the prior cyclone, as revealed in Climate Reanalyzer’s visualisation of the latest GFS model run::
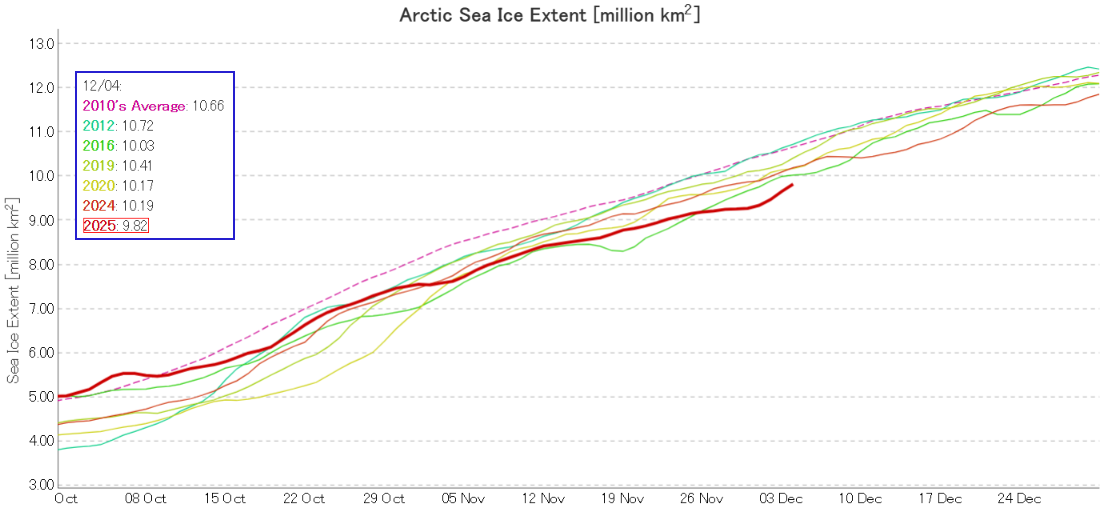
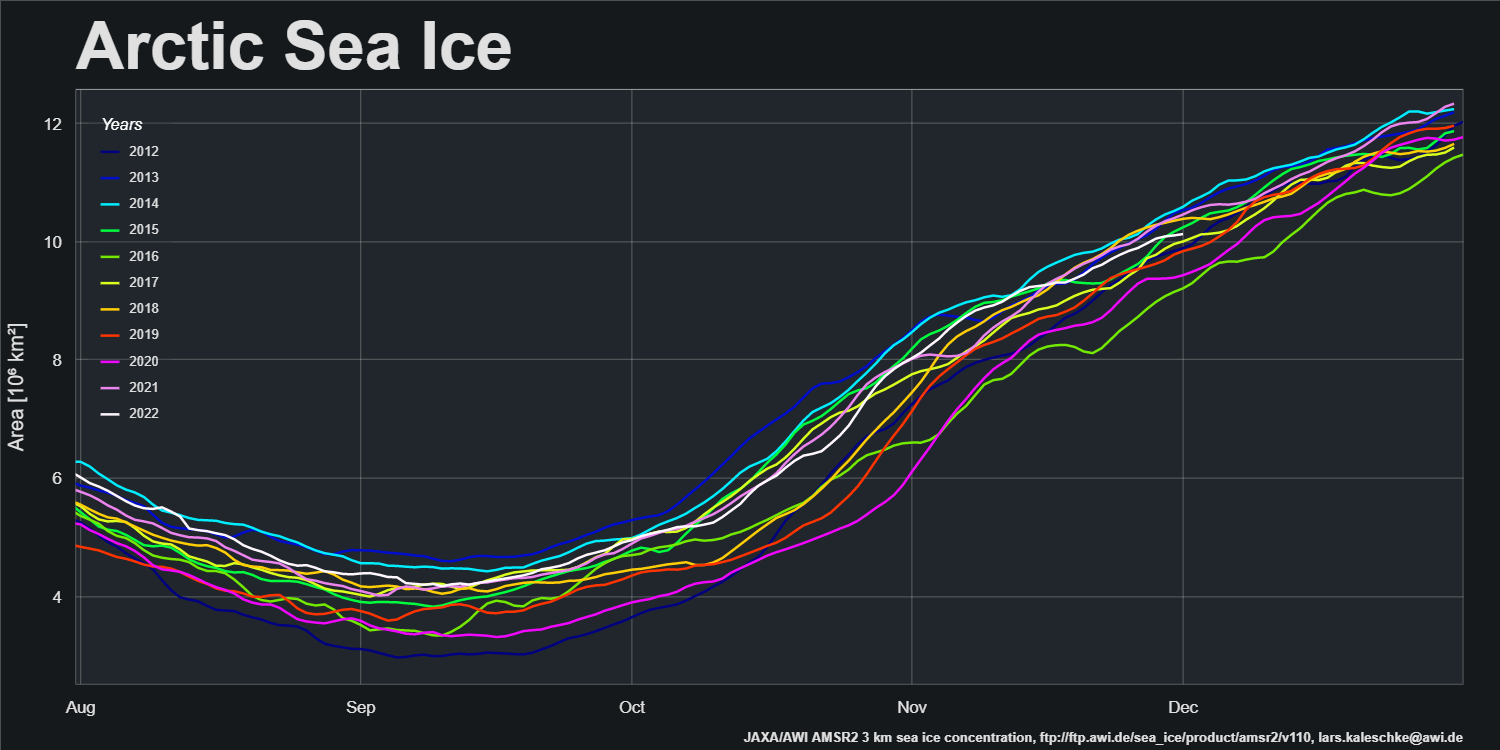
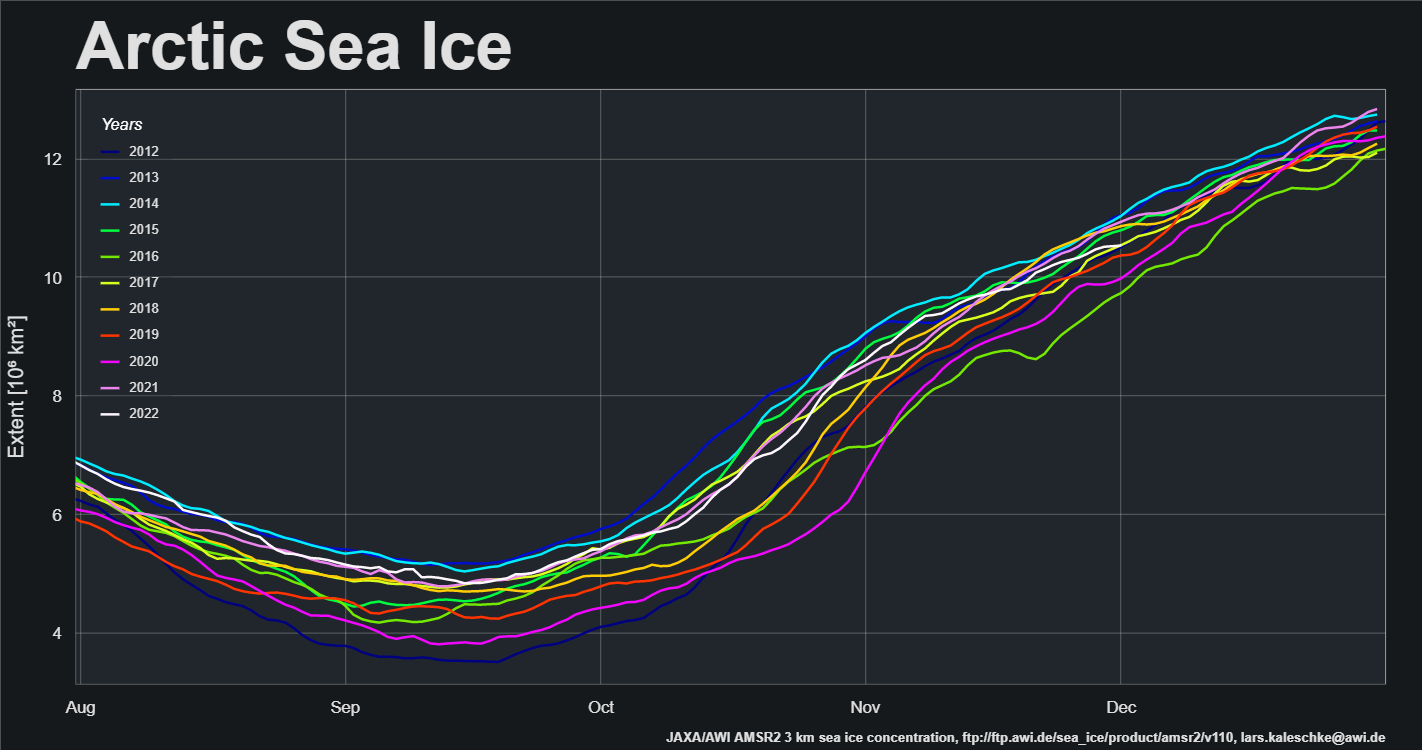
A new month is upon us and Christmas is coming! Here’s another look at Lars Kaleschke’s high resolution AMSR2 area and extent graphs for the Arctic as a whole:
Extent increase stalled for the last few days of November, and as a result extent is now in a “statistical tie” with 2017 for 4th lowest extent for the date in the AMSR2 record.
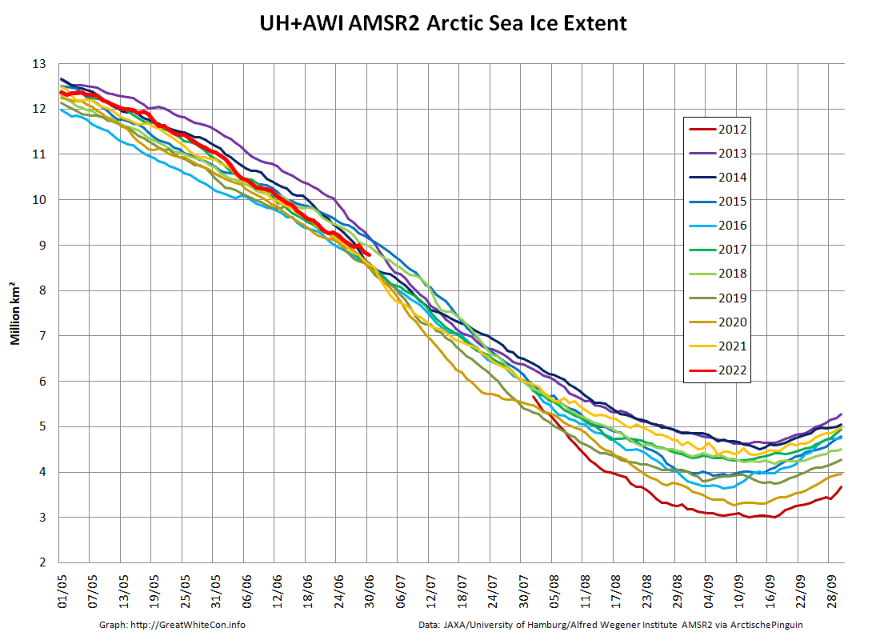
After a relatively rapid decline at the beginning of June Arctic sea extent is now very close to the 2010s average:
Both 2020 and 2021 began relatively rapid declines of their own at the beginning of July, so it will be interesting to see if 2022 follows suit.
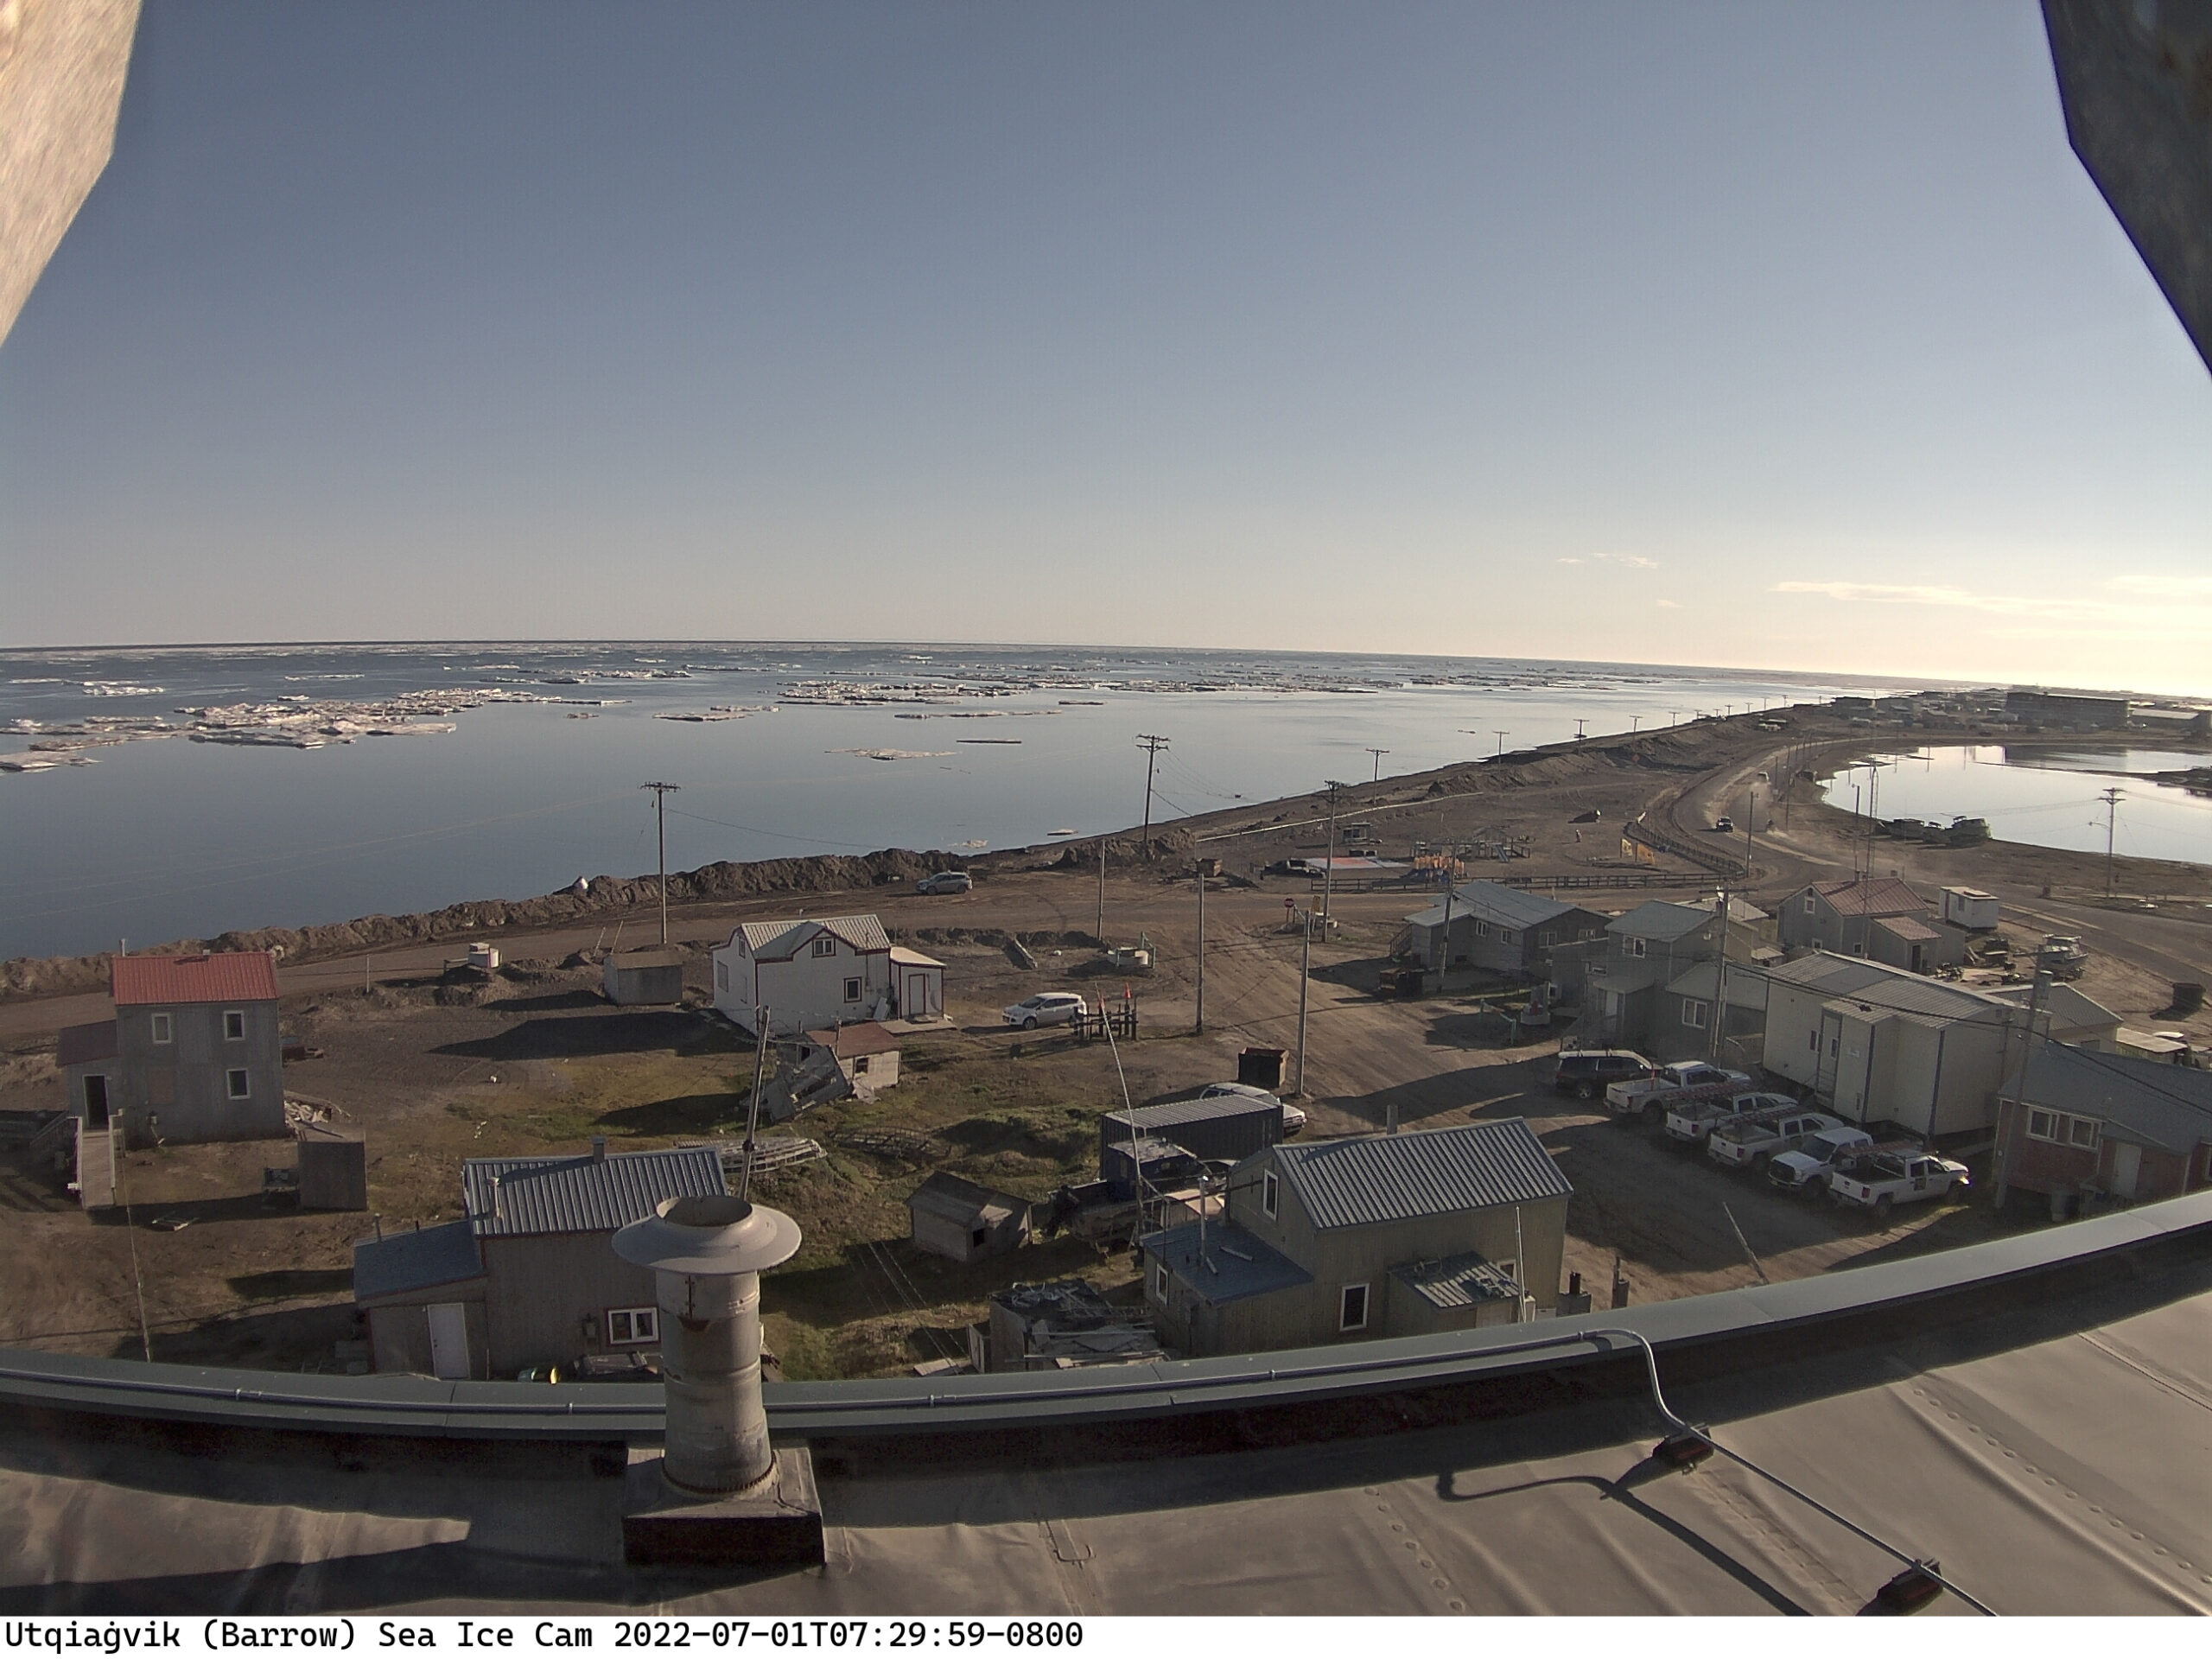
Most of the fast ice off Utqiaġvik has recently disappeared:
Meanwhile further out into the Chukchi Sea the sea ice looks to be in poor shape at the moment, with surface melting apparent across the entire region:
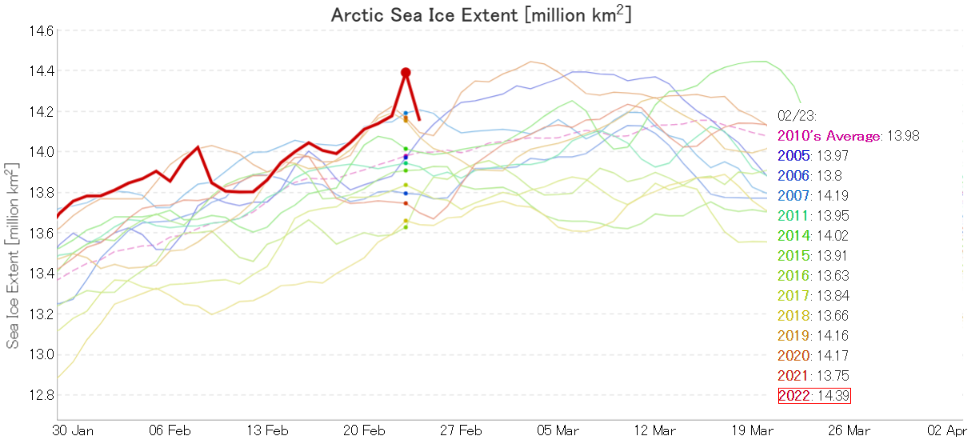
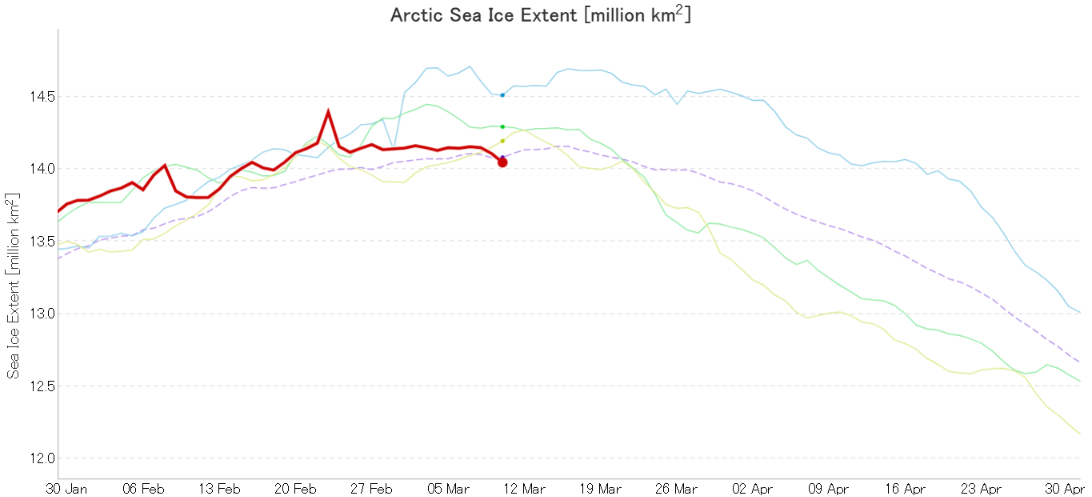
Here’s the latest graph of Arctic sea ice extent from JAXA/ViSHOP, which looks a bit unusual to say the least:
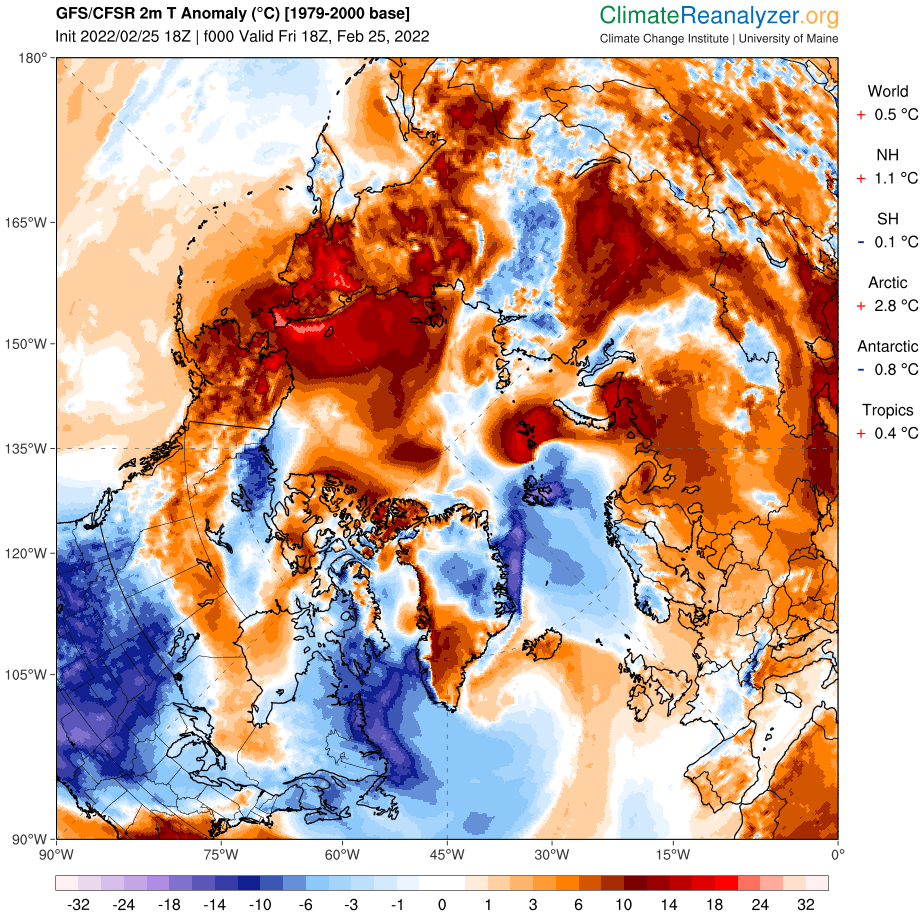
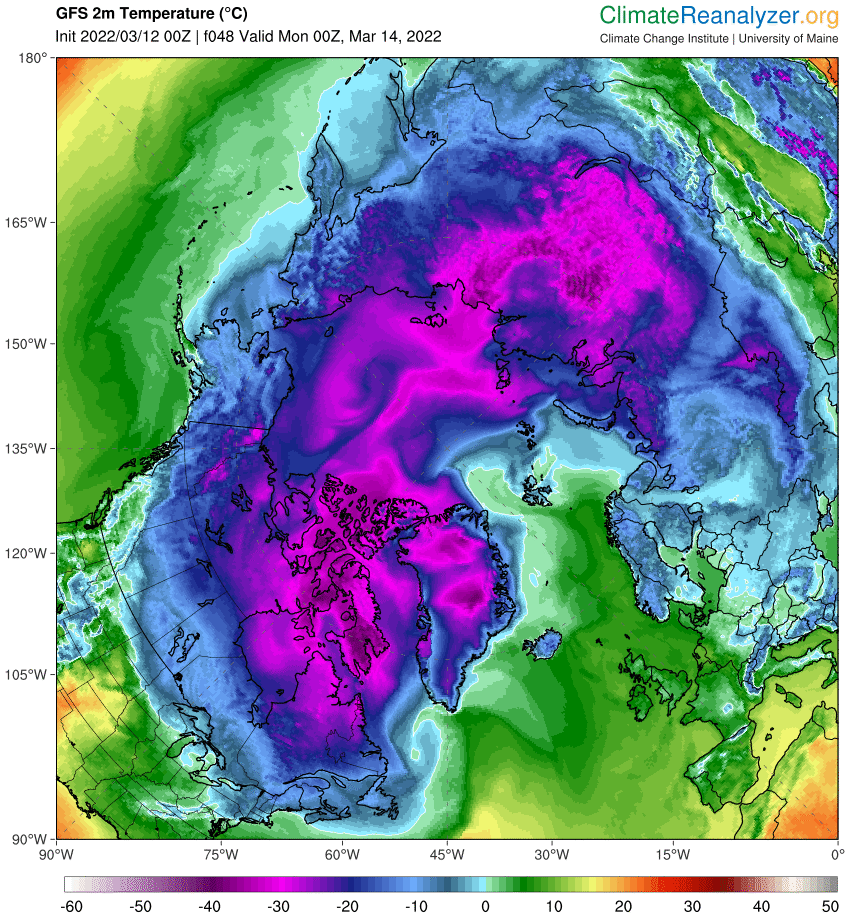
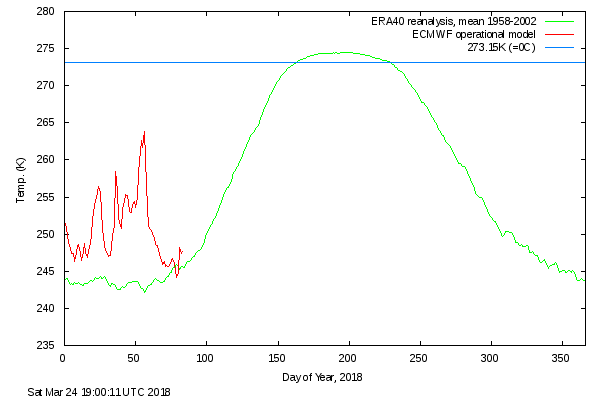
It certainly caught my eye! Could that sudden peak on February 23rd be the maximum extent for the year? To be frank it looks more like an artifact in the underlying gridded AMSR2 concentration data, but it’s not wholly beyond the bounds of possibility. The Pacific side of the Arctic is anomalously warm at the moment:
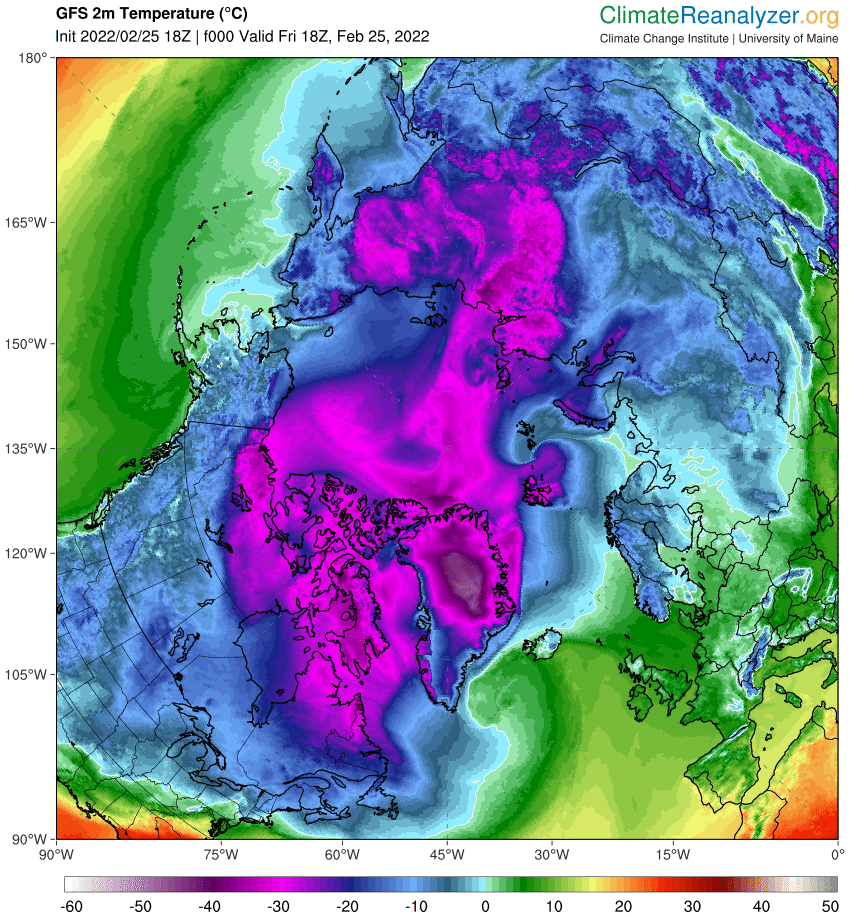
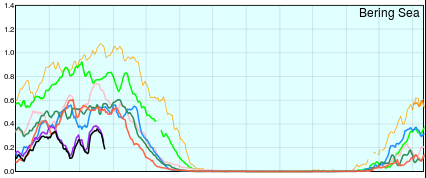
and parts of the Bering Sea are above freezing point:
For the moment then the (extremely!) provisional JAXA Arctic sea ice maximum extent for 2022 is 14.39 million km².
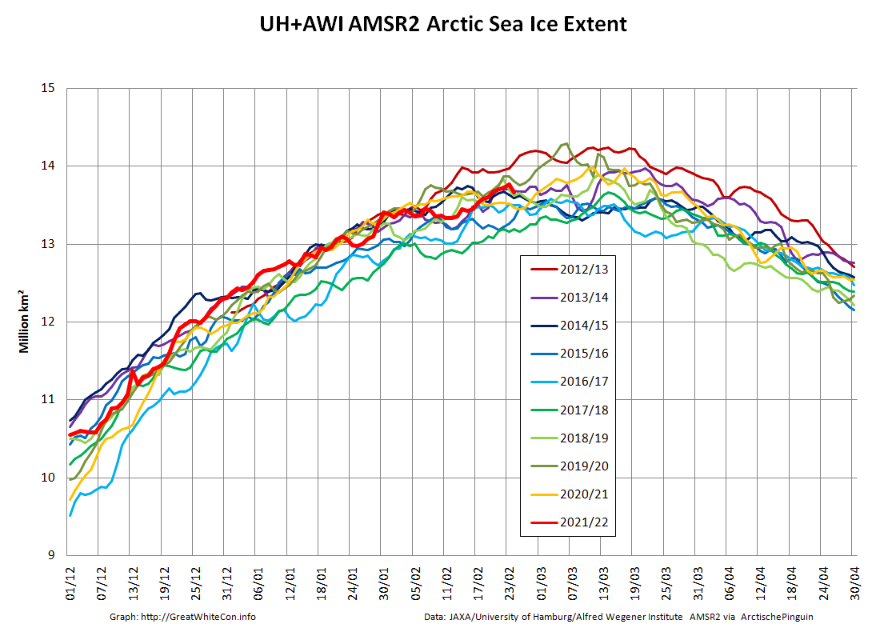
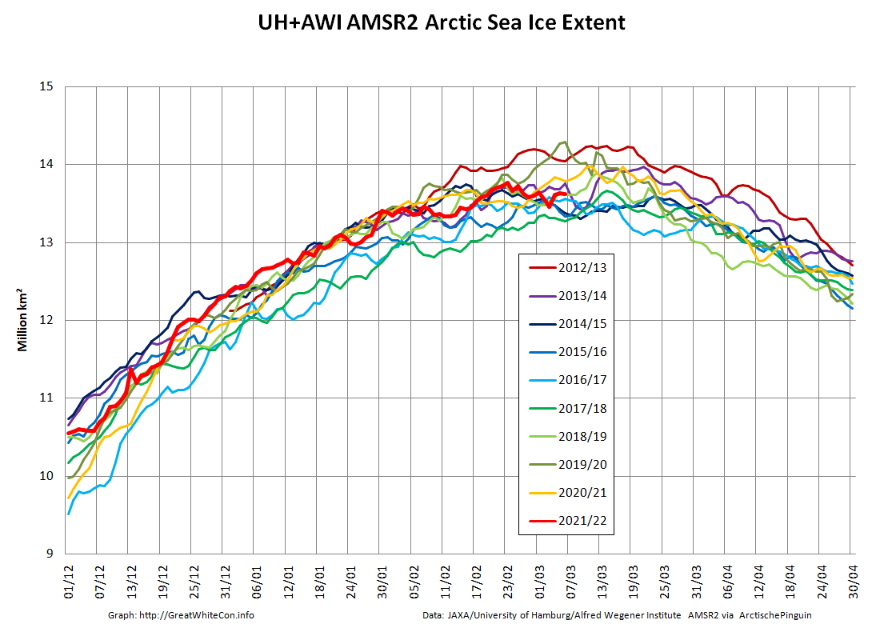
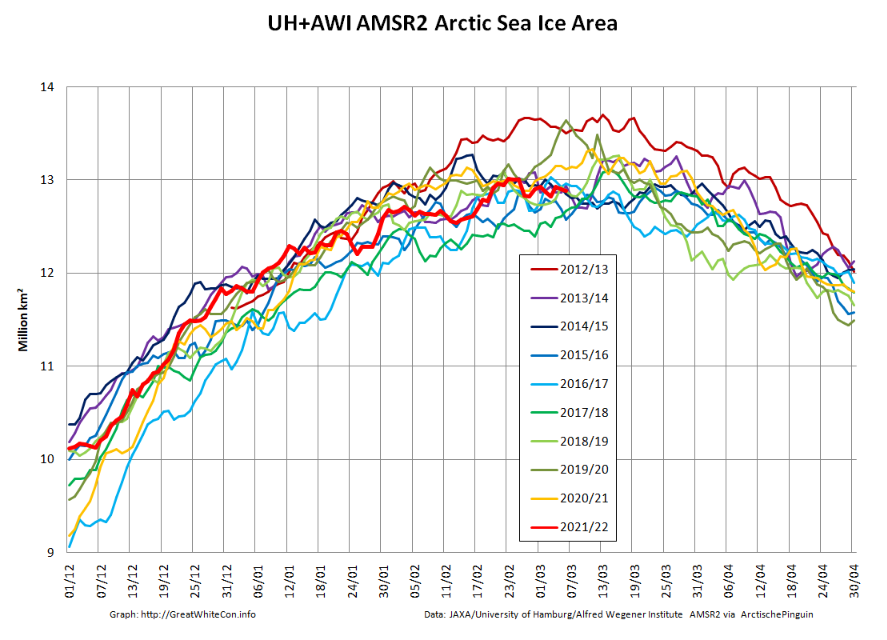
By way of an AMSR2 second opinion let’s also take a look at our favourite “high resolution” AMSR2 metrics, which combine recent data from the Alfred Wegener Institute with historical data from the University of Hamburg:
The extent peak on the 23rd is of much smaller magnitude, and it’s almost non existent on the area graph.
Curiouser and curiouser.
[Edit – March 1st]
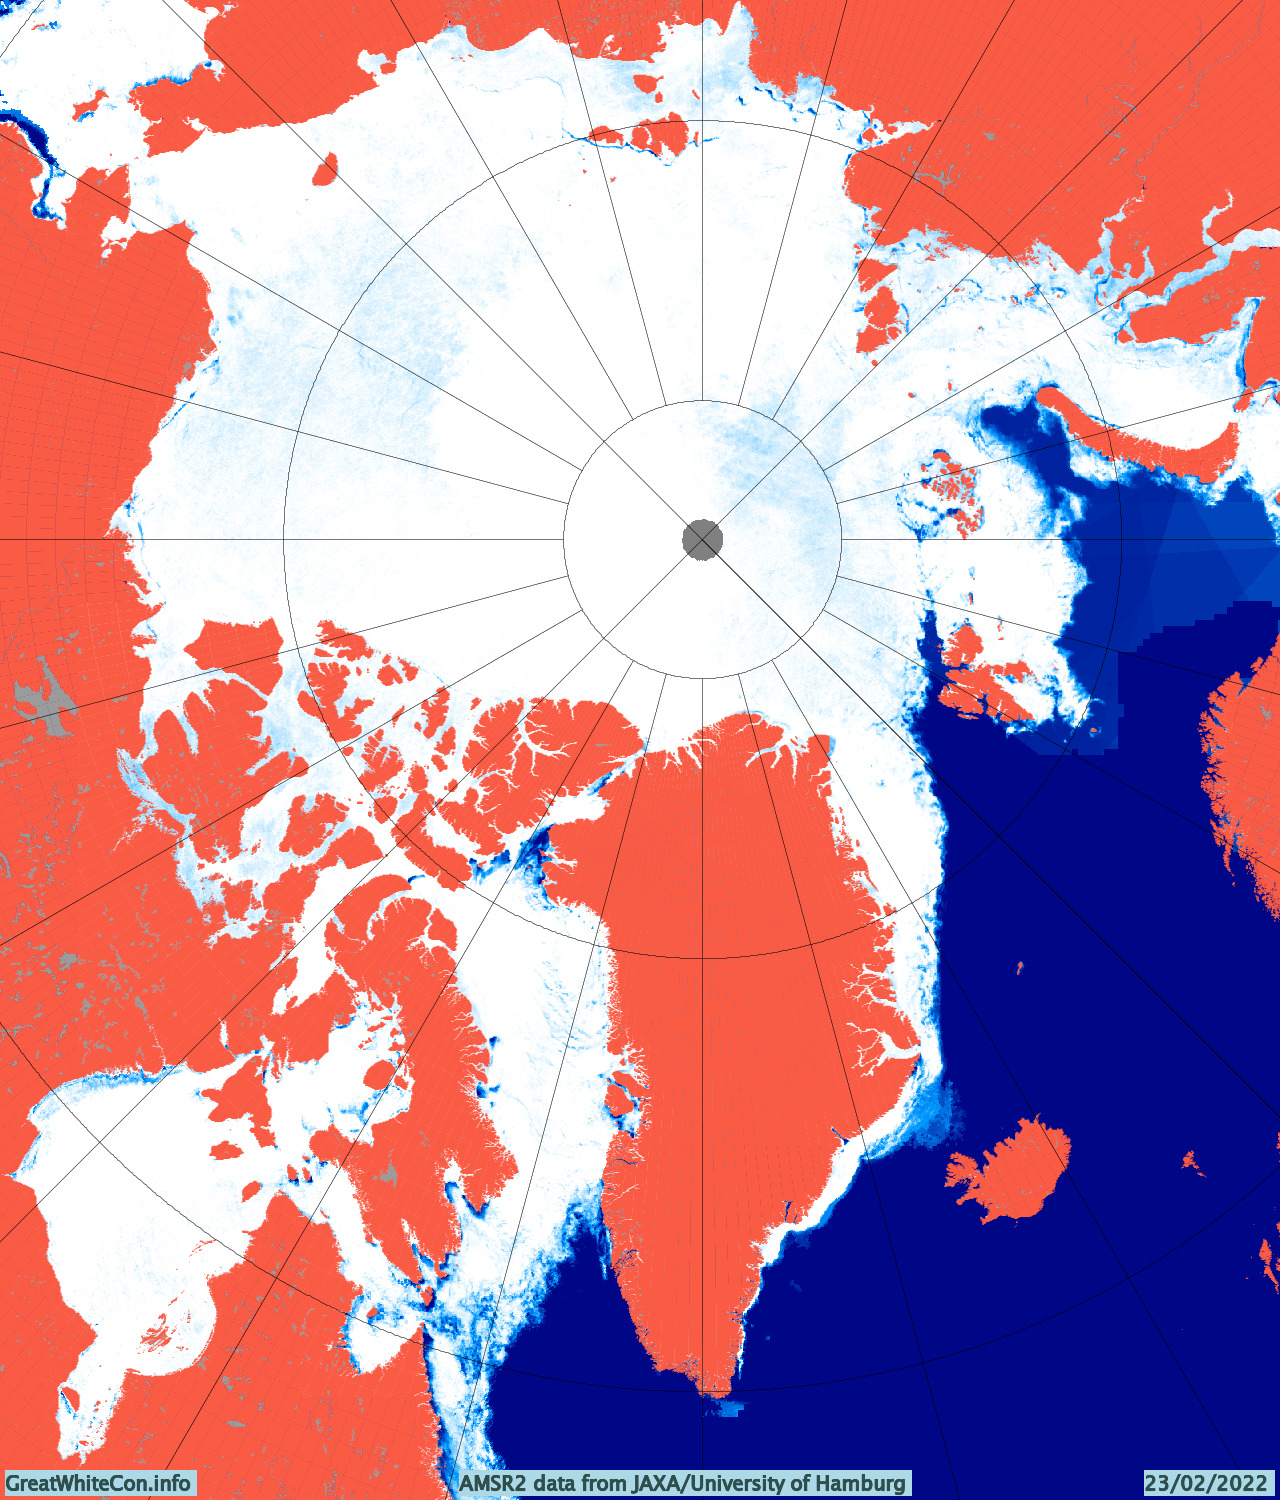
The JAXA maximum on February 23rd is definitely an artifact of dodgy AMSR2 data. Take a look at the Denmark Strait between Greenland and Iceland in particular:
The University of Hamburg version also shows an anomaly in the Barents Sea:
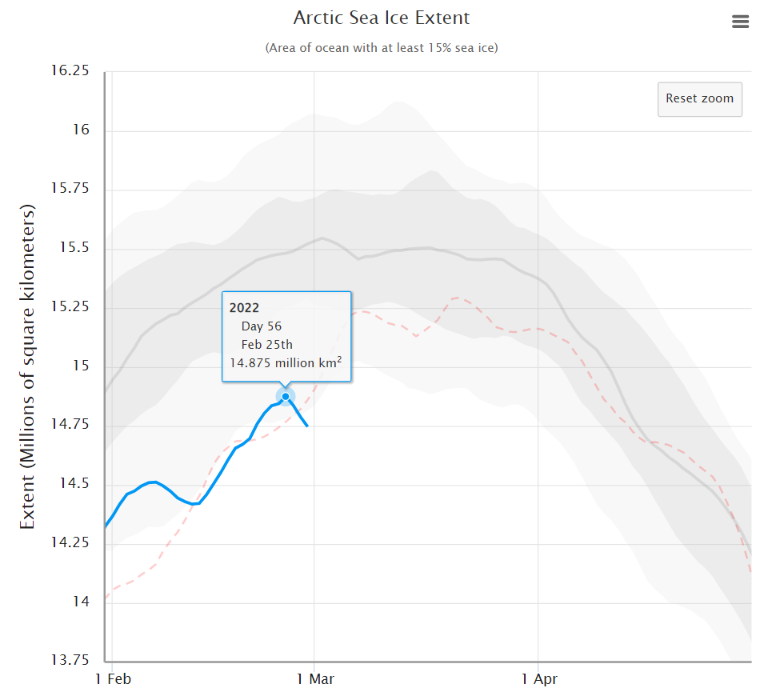
However the 5 day averaged NSIDC extent graph now shows a significant peak on February 25th:
Is anybody willing to put money on 14.875 million km² just yet?
[Edit – March 7th]
Here are the latest “high resolution” AMSR2 graphs:
The February 23rd maximum holds, for the moment at least.
[Edit – March 11th]
Here’s the latest JAXA Arctic sea ice extent graph:
A late surge is now looking exceedingly unlikely. However given that the maximum seems to have occurred during the brief period of dodgy data around February 23rd, what magnitude and date should be assigned to the 2022 maximum?
Whilst I ponder that thorny problem…
[Edit – March 12th]
Now I’ve really gone and done it! Started the “2022 melting season” thread on the Arctic Sea Ice Forum that is:
Arctic sea ice has likely reached its maximum extent for the year, at 14.88 million square kilometers (5.75 million square miles) on February 25. The 2022 maximum is the tenth lowest in the 44-year satellite record. On the same day, on the other pole, Antarctic sea ice reached a record minimum extent, at 1.92 million square kilometers (741,000 square miles).
The date of the maximum this year, February 25, was fifteen days earlier than the 1981 to 2010 average date of March 12. Only two years had an earlier maximum, 1987 and 1996, both on February 24. This year is the second earliest date on the satellite record, tying with 2015, which also reached its maximum extent on February 25.
Our title for today refers back to the Great Arctic Cyclone of August 2012. There has been some speculation over on the Arctic Sea Ice Blog about whether a similar event is about to occur this year.
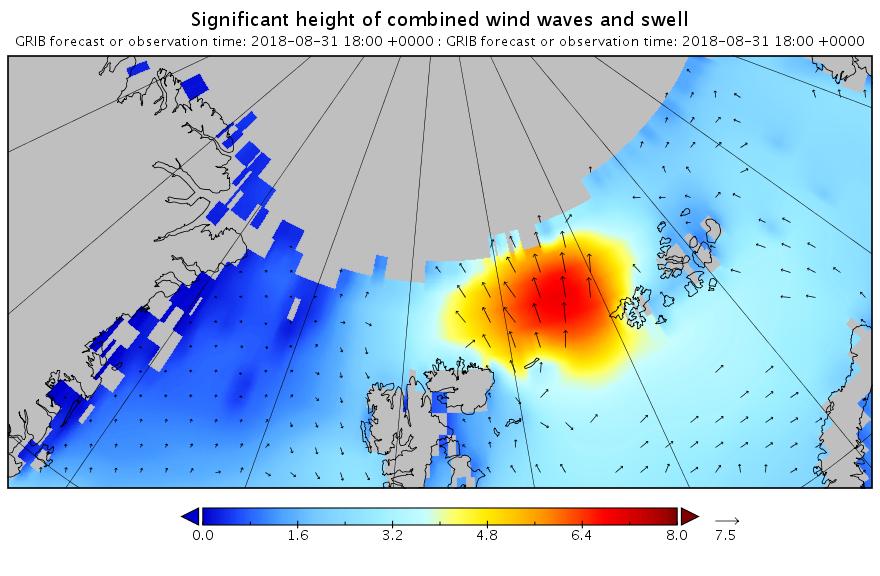
It’s later in the season of course, but as is our wont we always look at the waves first. Here is the current WaveWatch III forecast for the evening of August 31st UTC:
In summary the forecast shows some very large waves with a substantial period for inside the Arctic Circle directed straight at the ice edge. Let’s follow the forecast over the next few days carefully shall we?
[Edit – August 30th]
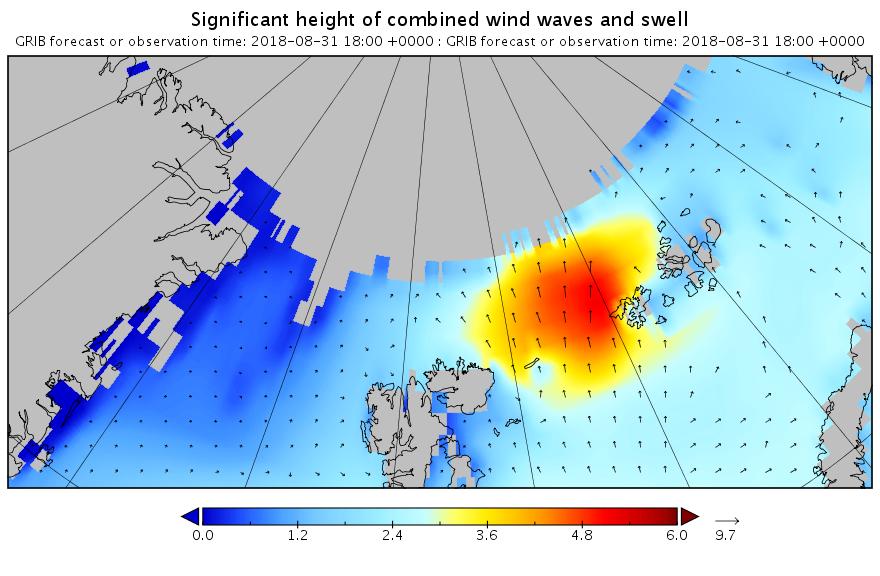
The latest wave forecast for tomorrow evening isn’t as extreme as 3 days ago. Note the change in the significant height scale:
Nonetheless the height and period are still very significant!
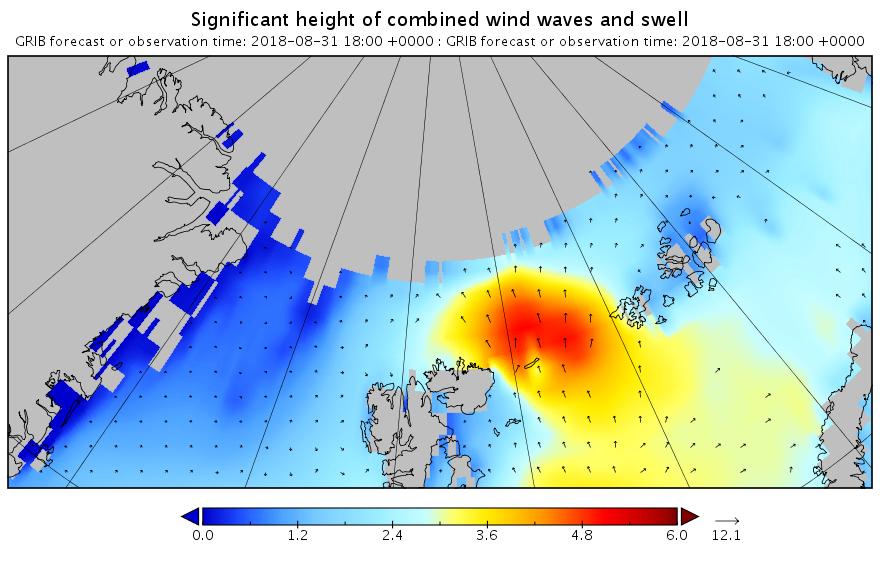
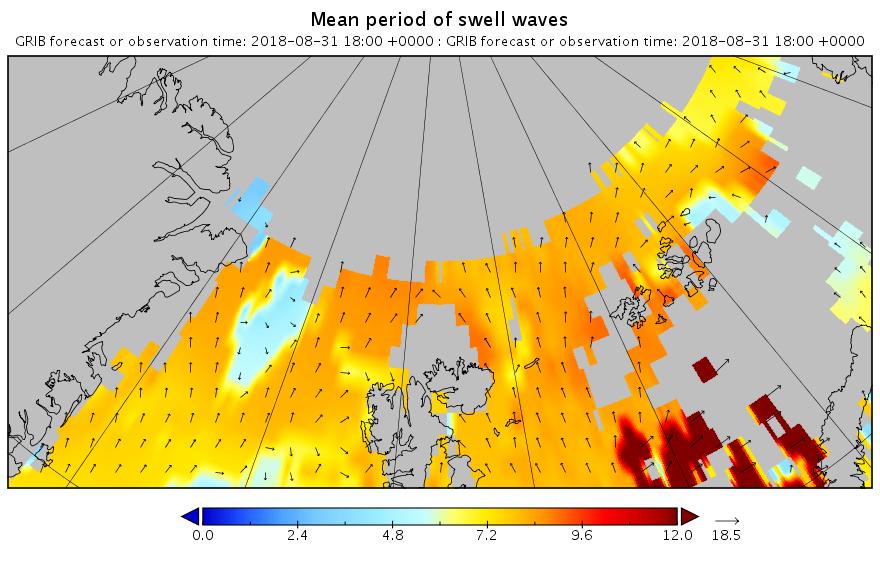
[Edit – August 31st]
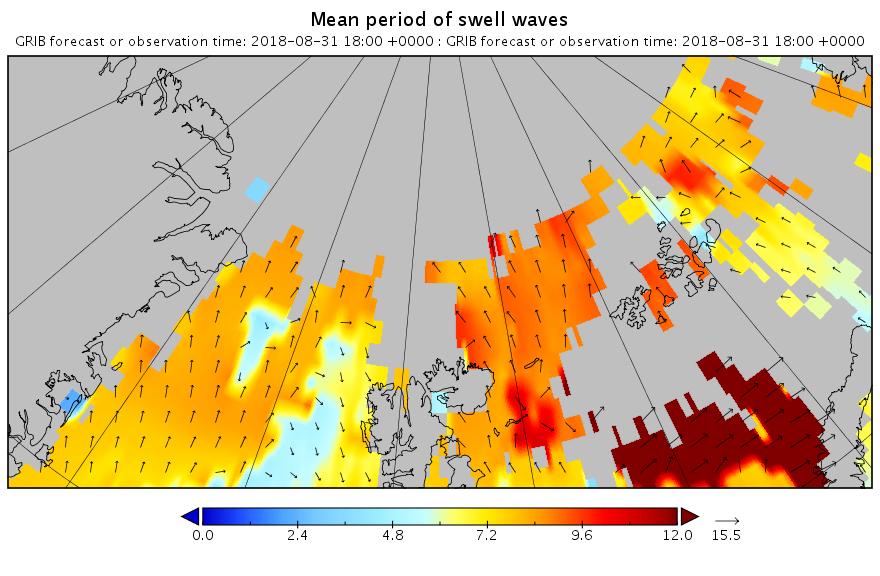
Here’s the latest forecast for 6 PM this evening (UTC):
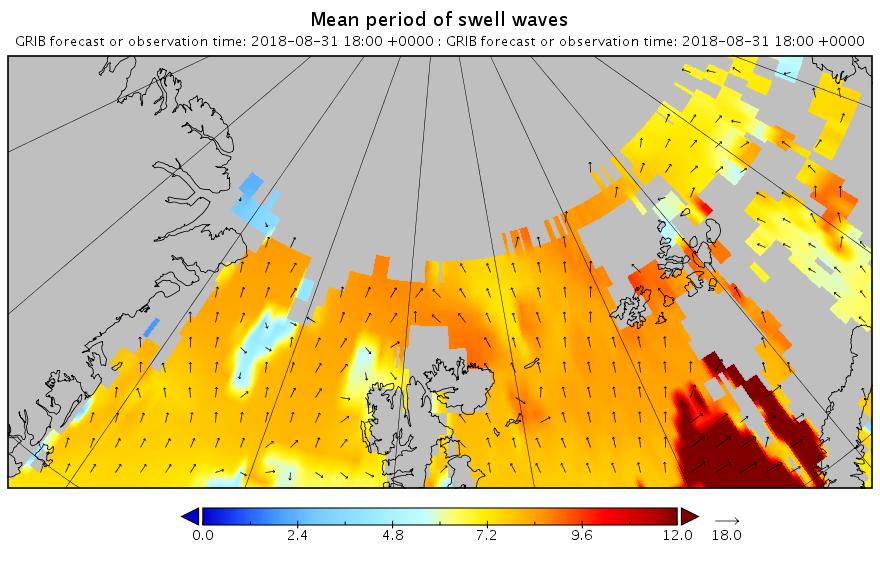
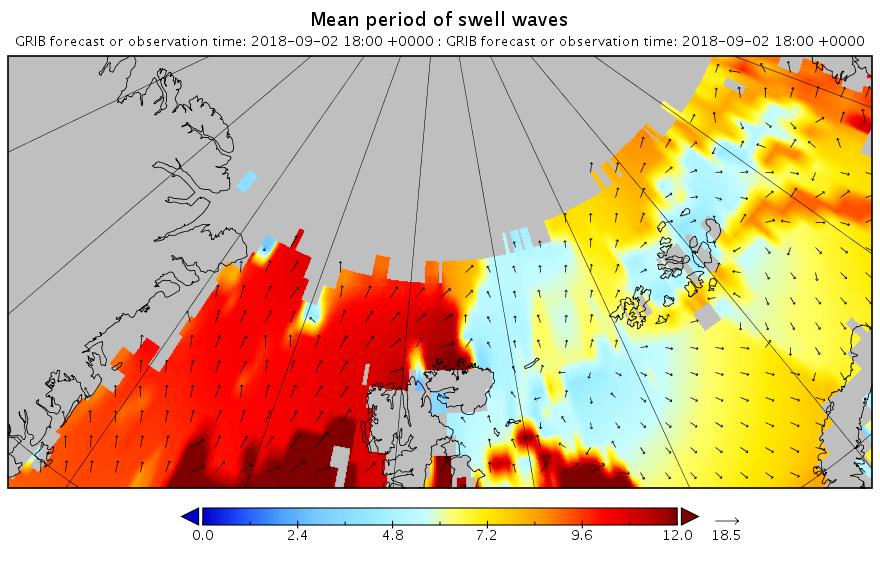
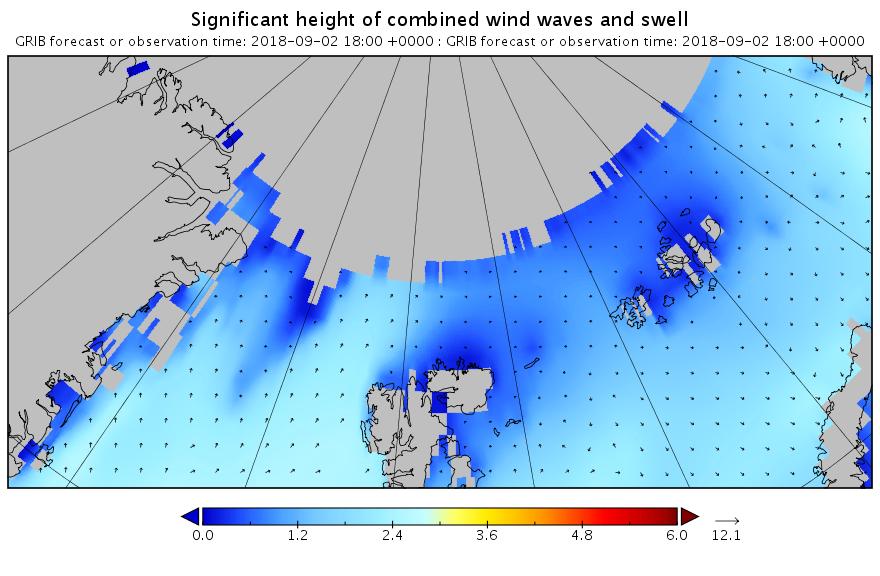
Note how the open water across almost the entire map is full of what in the Arctic counts as a long period swell. That means that the forecast for 2 days later looks like this:
Less height but with a longer period. All of which means that the sea ice north of the Atlantic Ocean isn’t about to receive a short sharp shock. It has a sustained battering lasting several days to look forward to.
[Edit – September 1st]
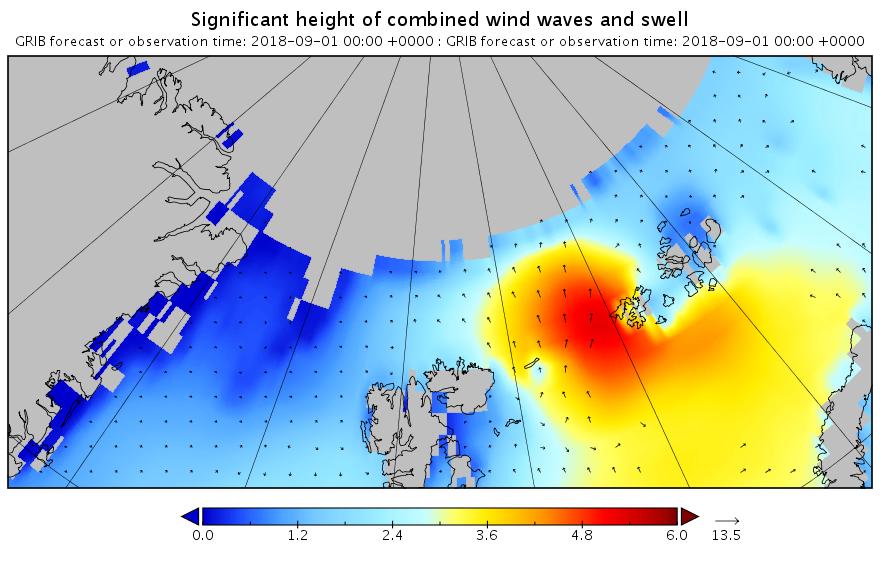
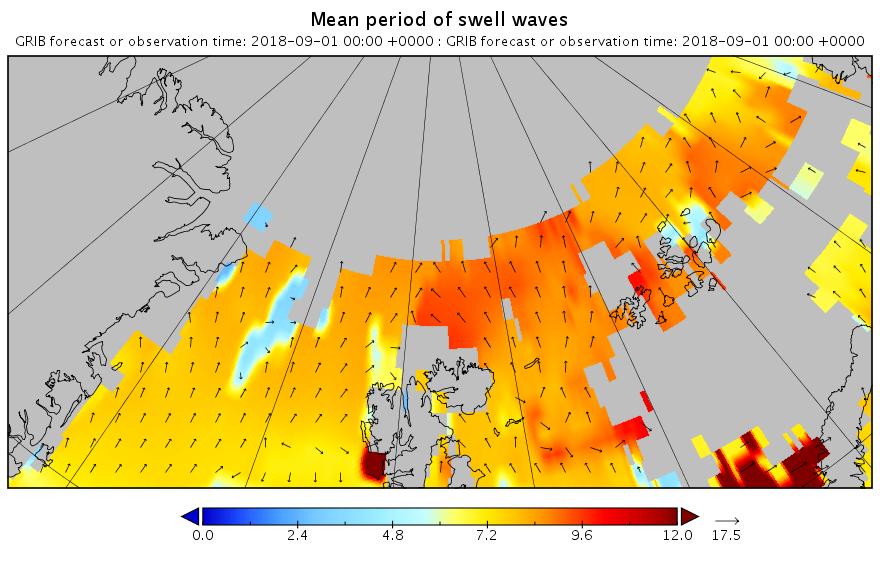
The barrage of assorted swells has begun. Here’s the “hindcast” from midnight last night UTC:
Now lets take a look at tomorrow’s forecast for the Laptev Sea. This is for 09:00 UTC:
Note once again the change of scale on the wave/swell height map. Nevertheless a 3+ meter swell heading over into the East Siberian Sea isn’t something you see every day.
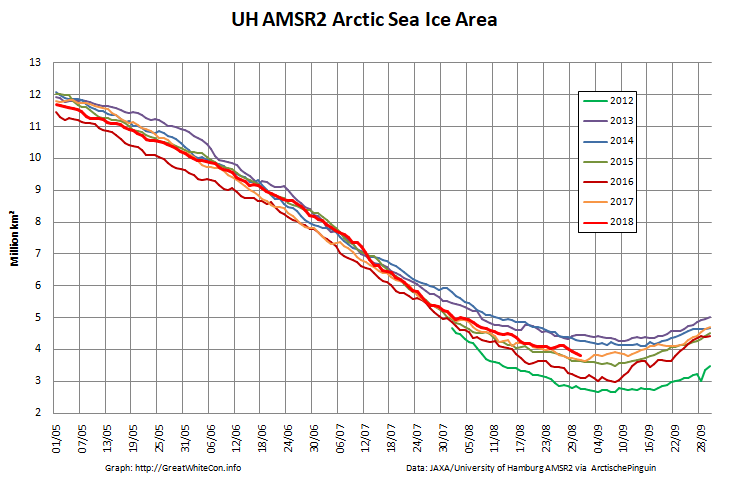
Now were into September the 2018 annual minimum extent can’t be too far away. Extent decline appears to have stalled. However “high res” AMSR2 area is currently falling fast, for the time of year at least:
[Edit – September 2nd]
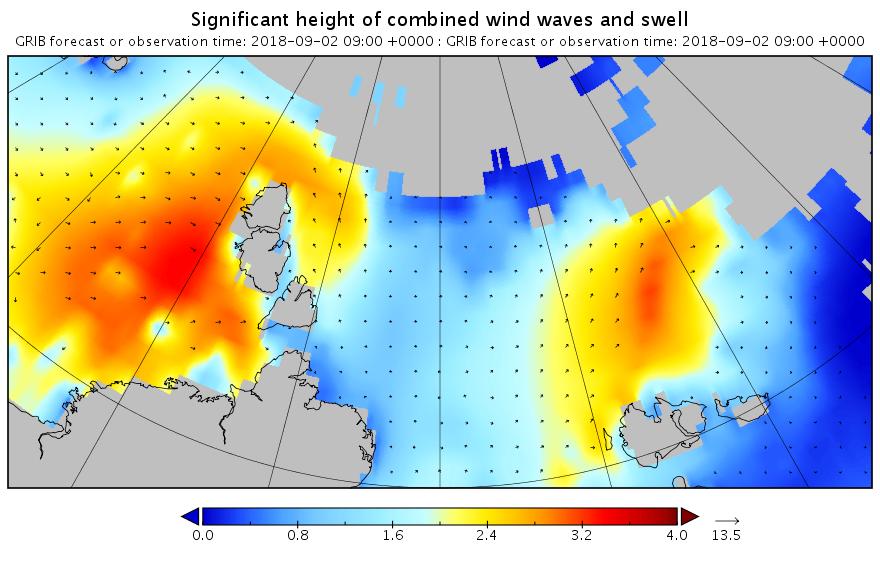
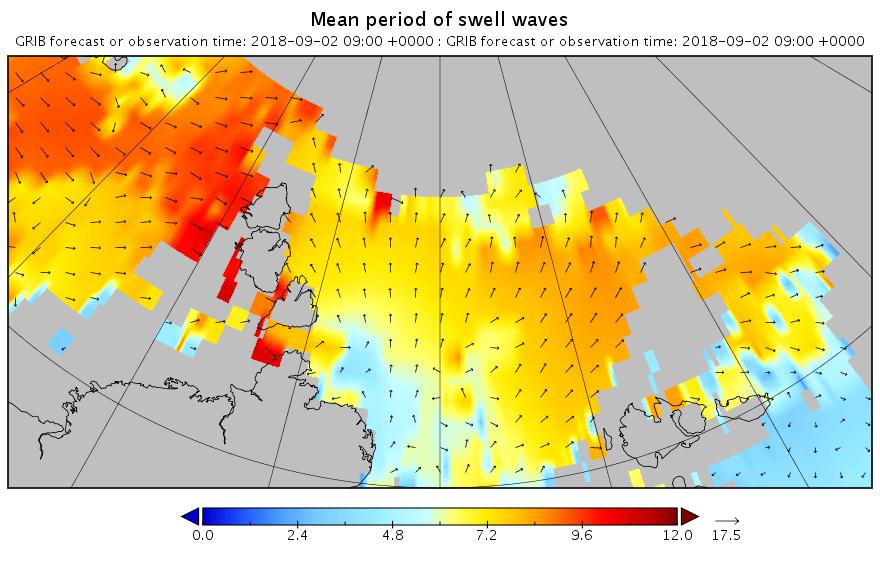
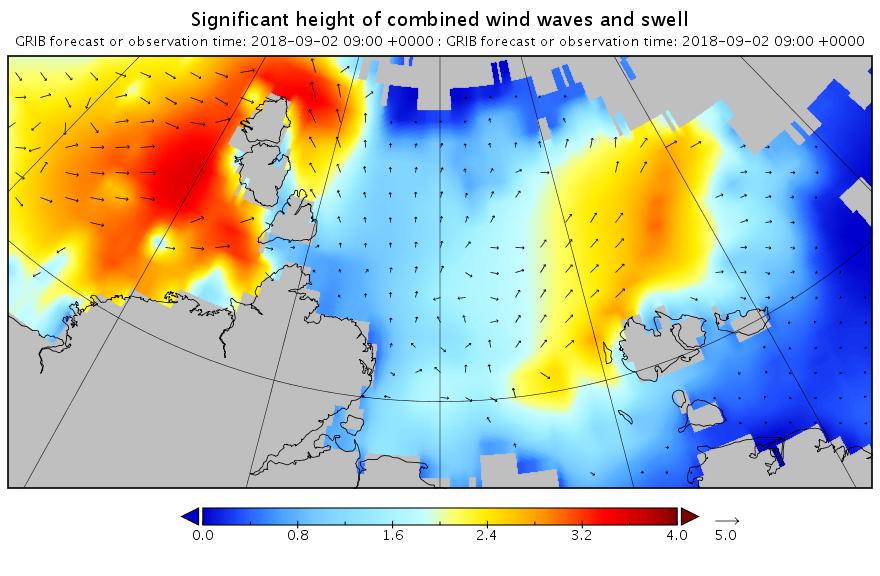
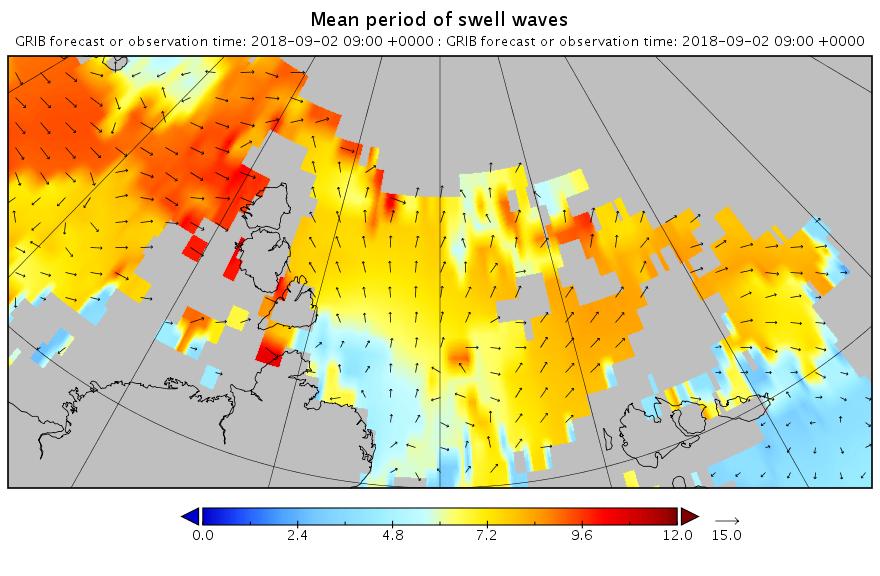
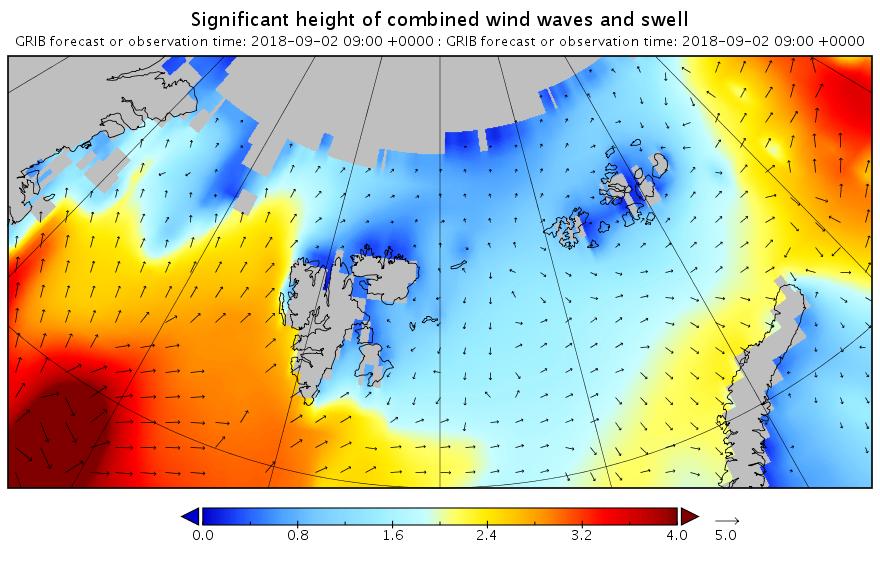
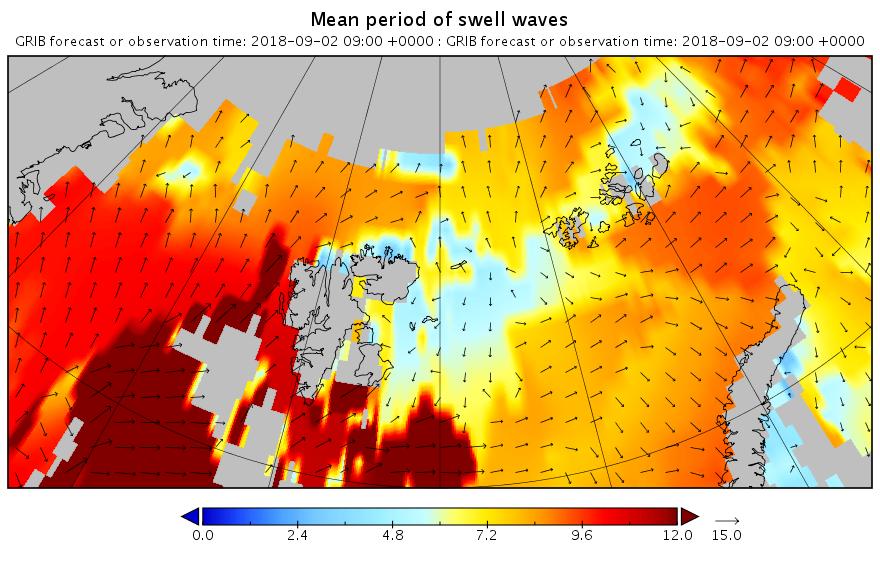
Here are the swell and period forecasts at midnight for round about now, 09:00 UTC:
All the seas between Greenland and the New Siberian Islands are awash with swells with a period of 8 second or greater. This is most unusual, to put it mildly!
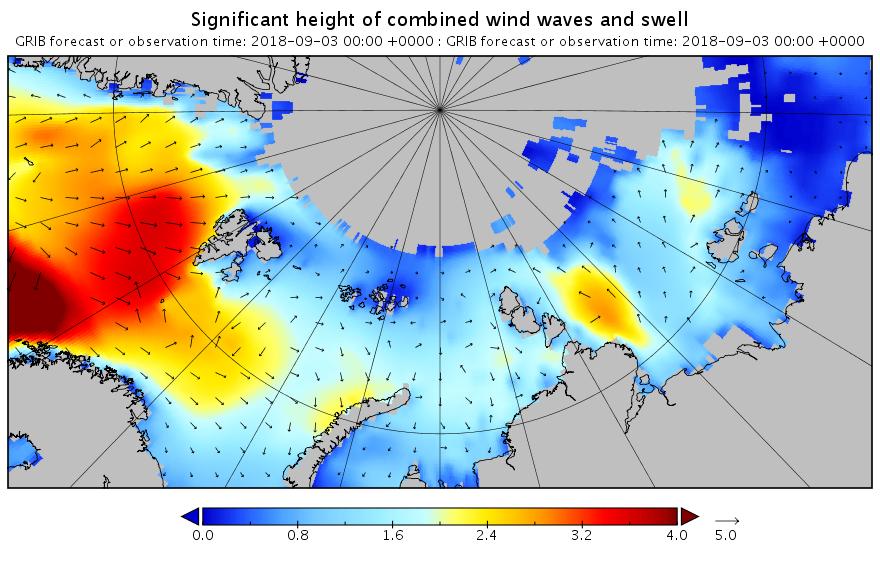
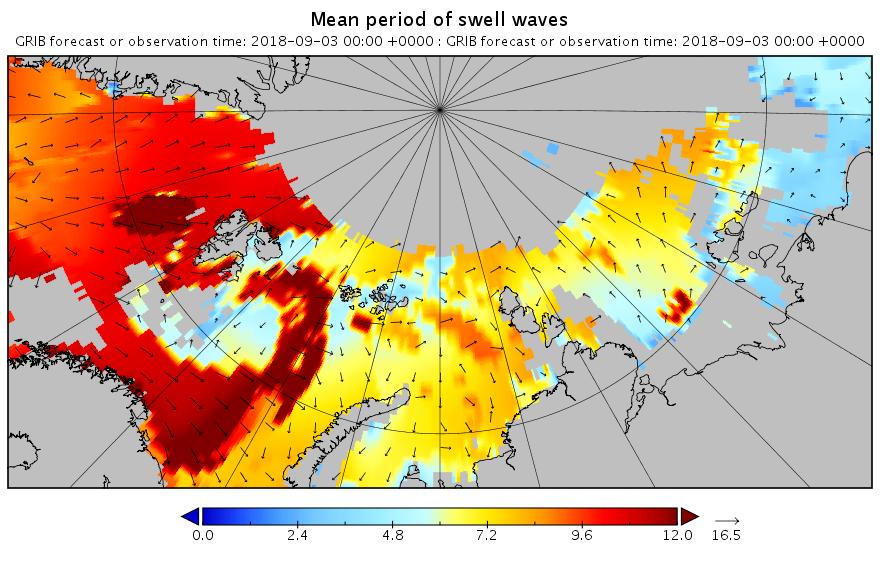
[Edit – September 3rd]
Here’s the WaveWatch III “hindcast” from midnight last night UTC for the Russian side of the Arctic Ocean:
There are still significant swells almost everywhere you look.
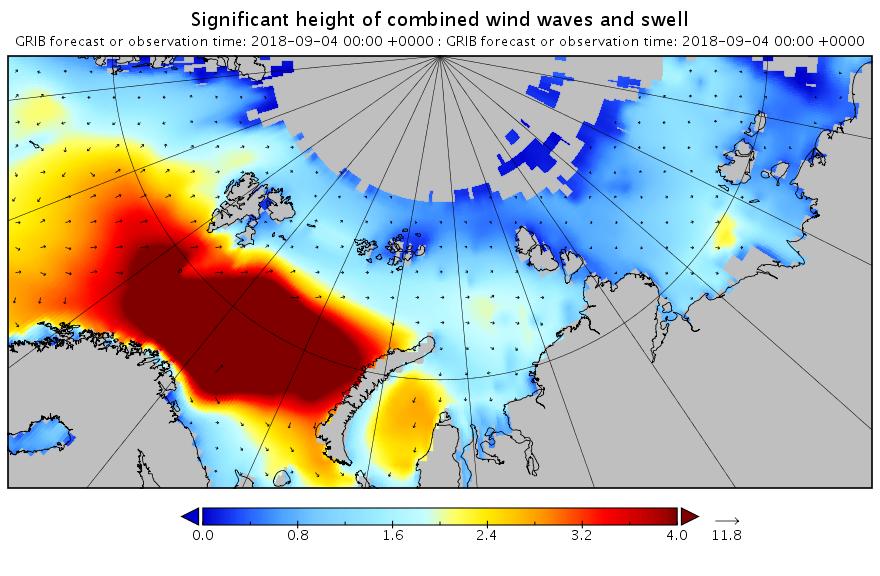
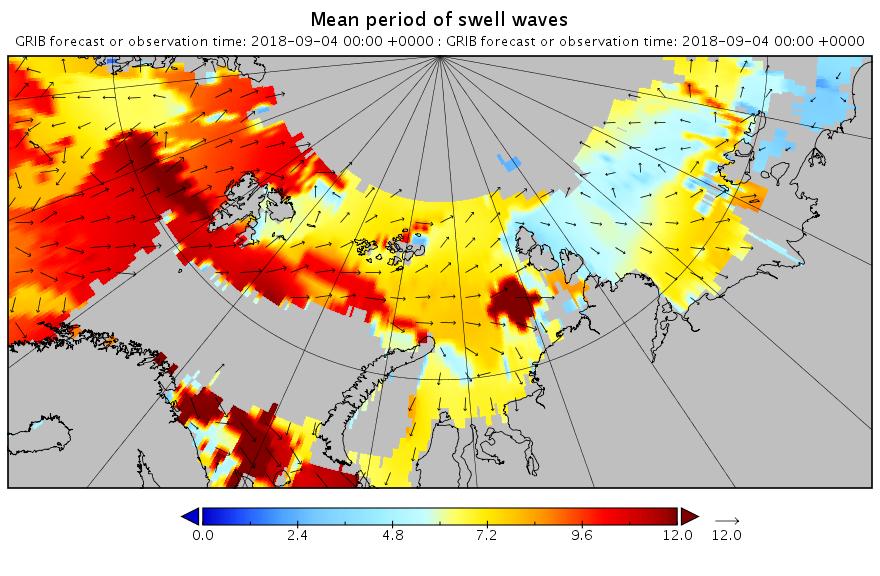
[Edit – September 4th]
Using the same scales as yesterday, here’s today’s hindcast from midnight:
There’s still plenty of action in the Arctic Ocean!
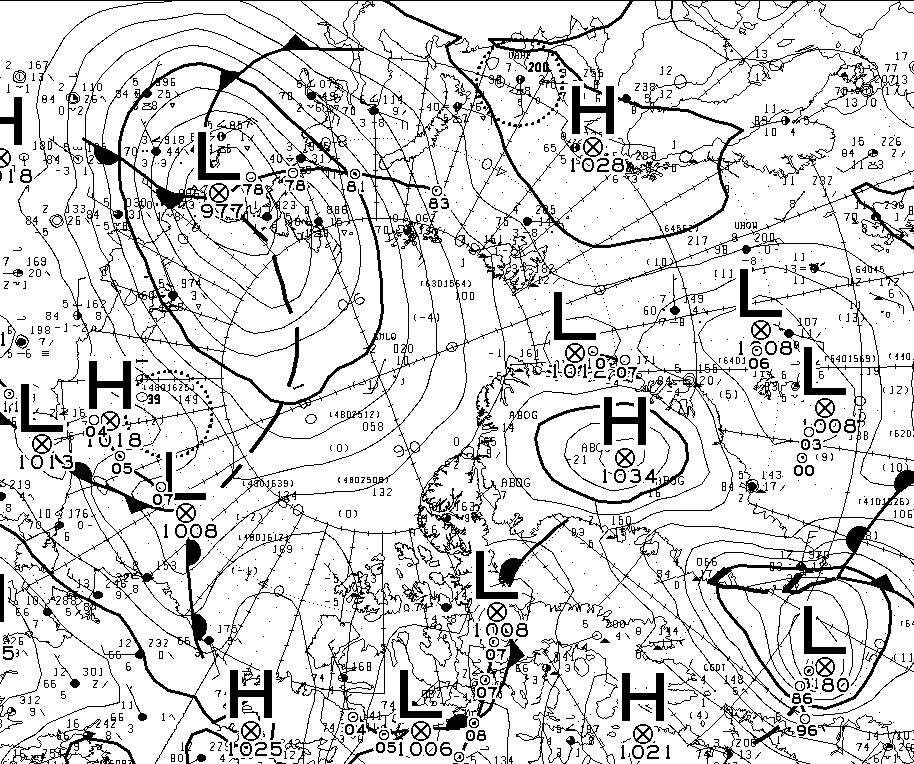
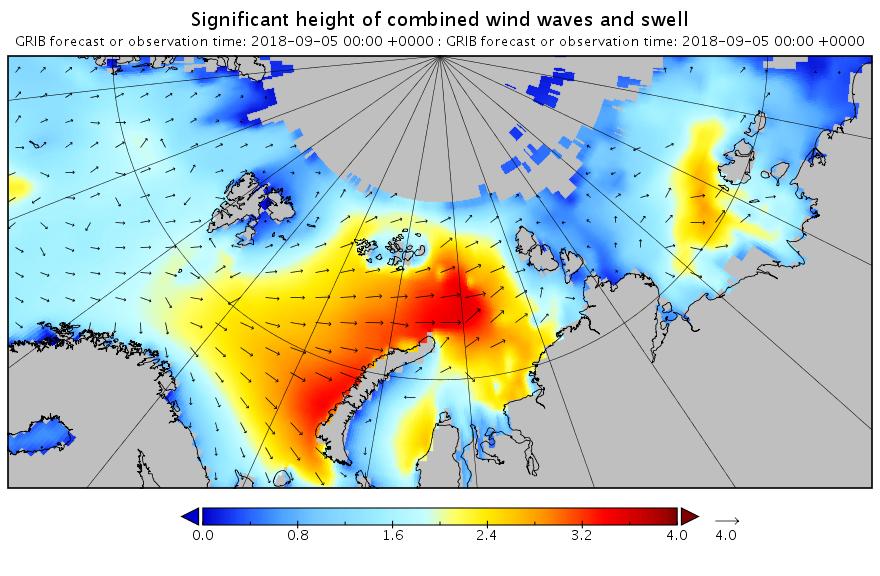
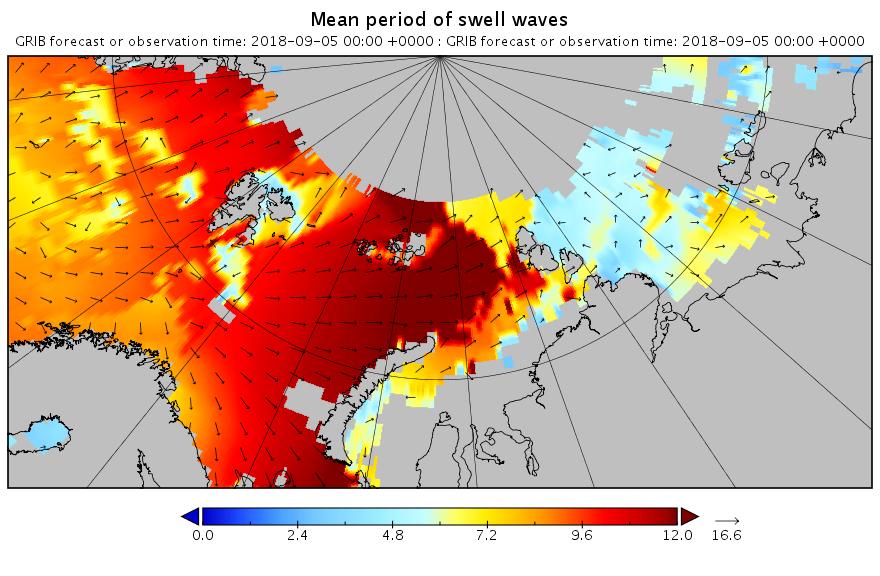
[Edit – September 5th]
Feel free to debate whether it merits the “Great” prefix, but this is how the early September 2018 Arctic cyclone has panned out. According to this morning’s Environment Canada synopsis the cyclone is centred near the coast of the Laptev Sea and is down to a MSLP of 977 hPa:
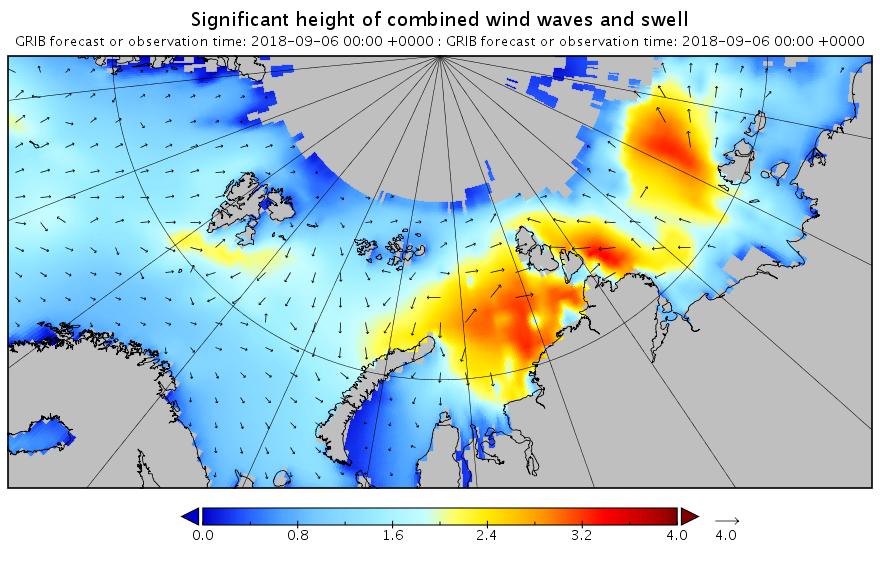
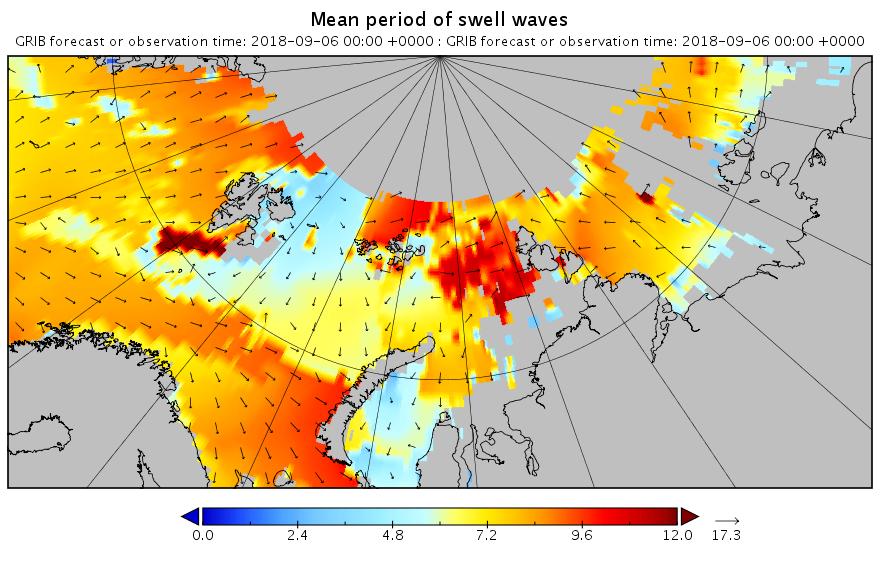
Here’s another WaveWatch III hindcast from midnight UTC:
[Edit – September 6th]
Need I say more?
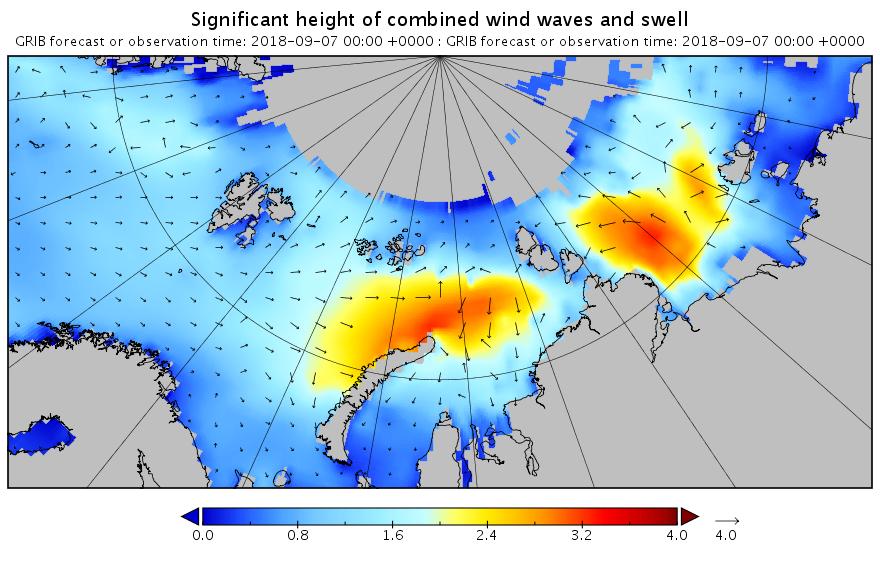
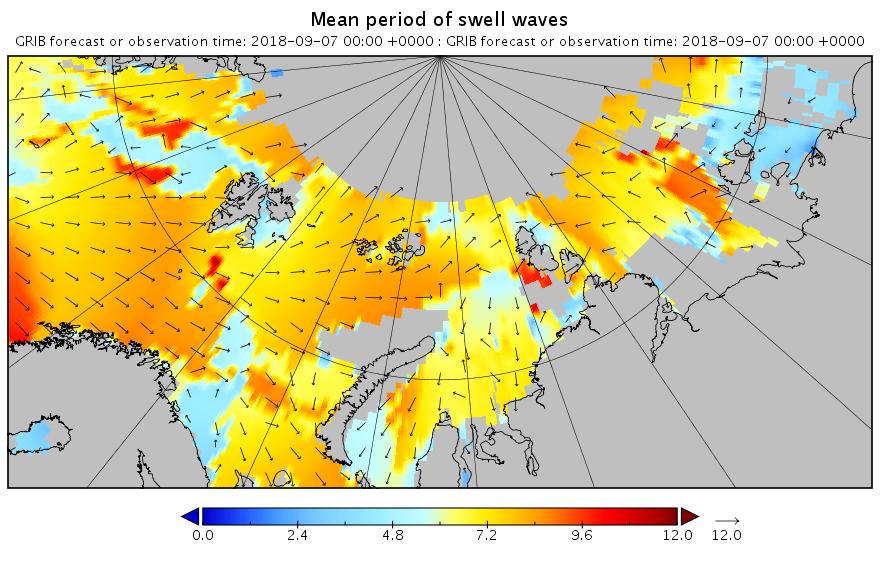
[Edit – September 7th]
The swell in the Fram Strait an Barents Sea is diminishing, but the period in the Laptev Sea is increasing now:
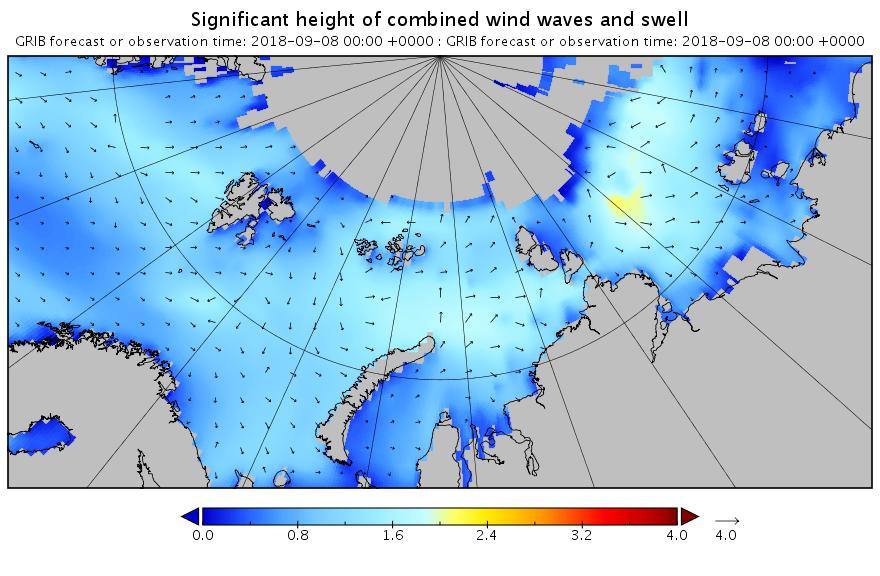
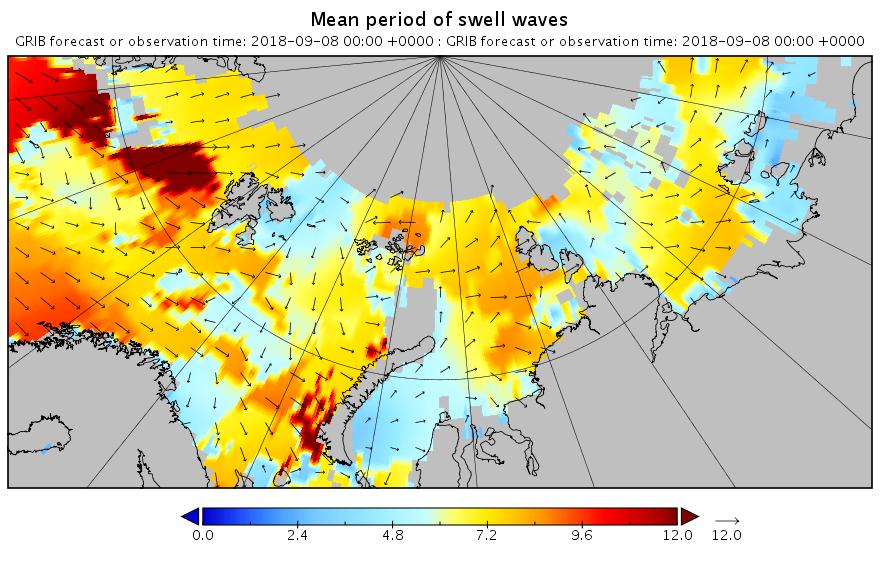
[Edit – September 8th]
All the wave activity in the Laptev Sea is diminishing. Here’s the hindcast from midnight:
Meanwhile things are warming up in the Chukchi and Beaufort Seas. Here’s the forecast for midnight tonight:
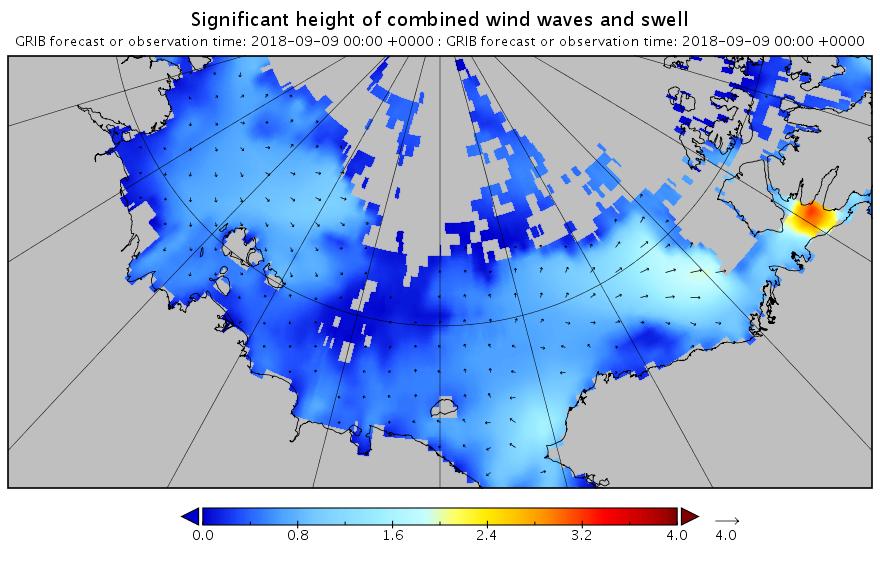
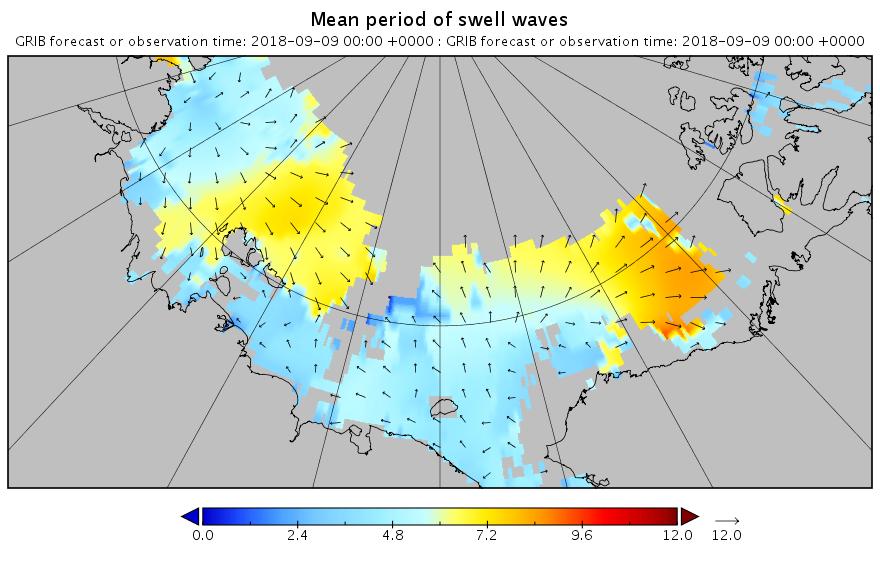
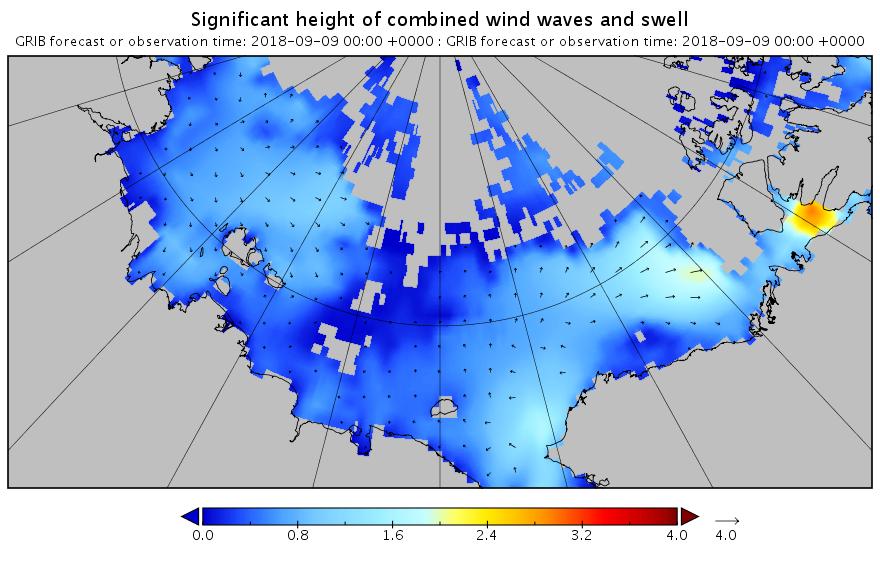
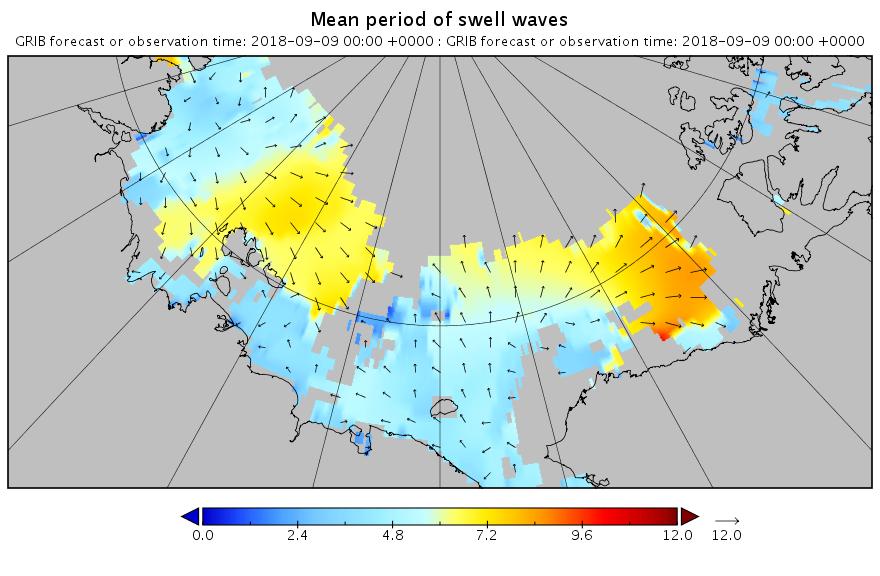
[Edit – September 9th]
Here’s the hindcast for this morning’s swell in the Beaufort Sea:
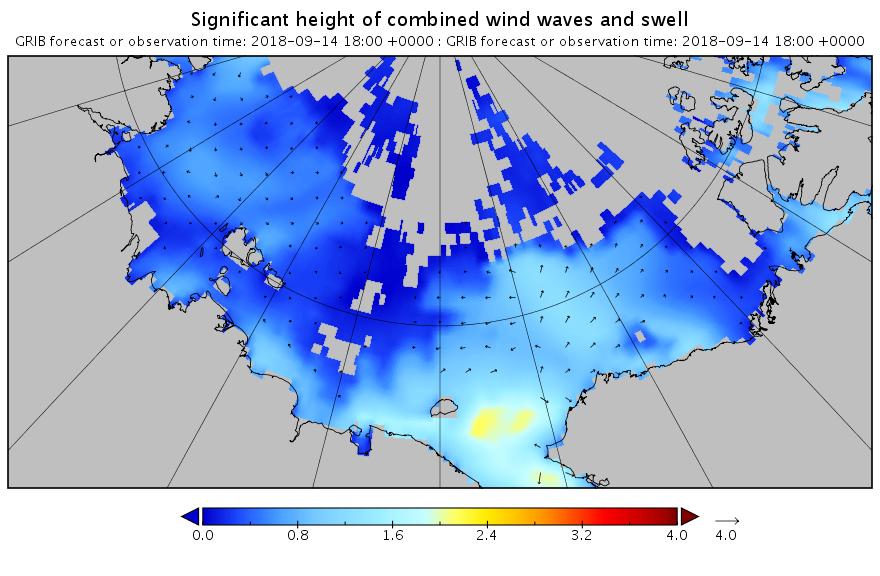
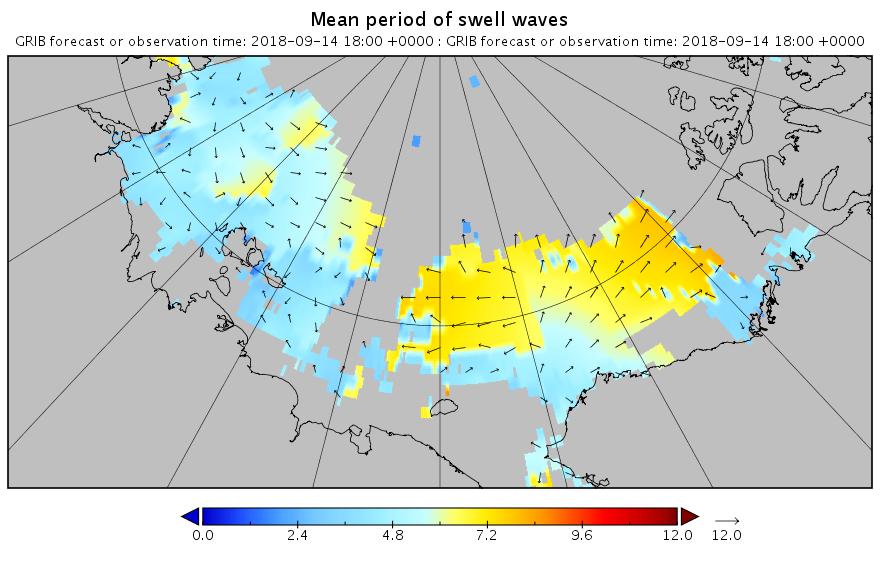
This is currently a long way into the future and hence may not verify in practice. However any pulse of swell is currently forecast for September 13th:
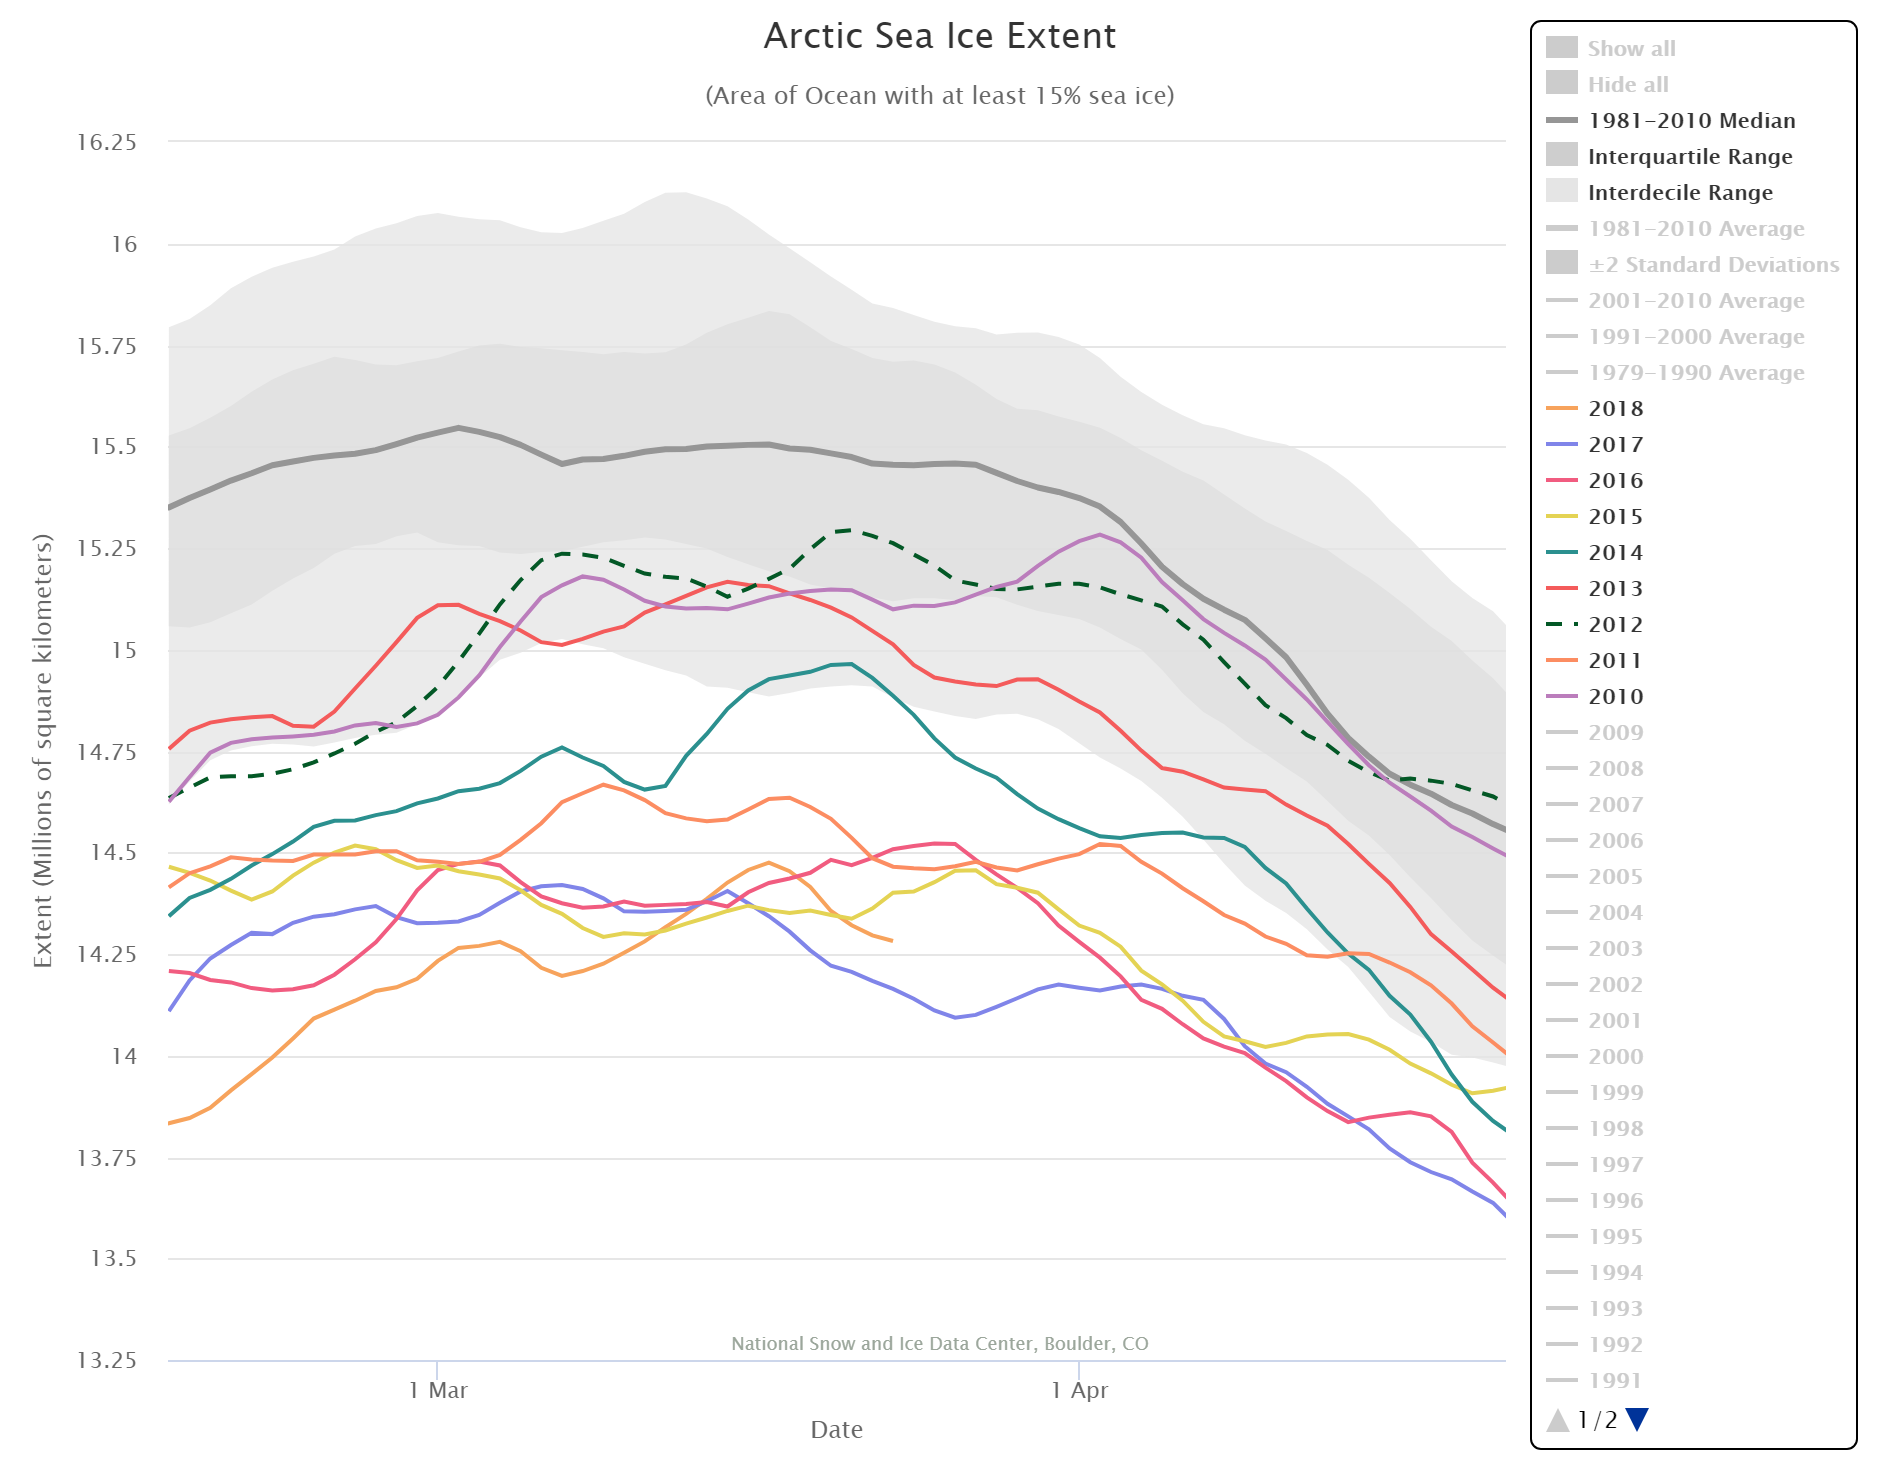
According to the latest edition of the National Snow and Ice Data Center’s “Arctic Sea Ice News”
On March 17, 2018, Arctic sea ice likely reached its maximum extent for the year, at 14.48 million square kilometers (5.59 million square miles), the second lowest in the 39-year satellite record, falling just behind 2017. This year’s maximum extent is 1.16 million square kilometers (448,000 square miles) below the 1981 to 2010 average maximum of 15.64 million square kilometers (6.04 million square miles).
The four lowest seasonal maxima have all occurred during the last four years. The 2018 maximum is 60,000 square kilometers (23,200 square miles) above the record low maximum that occurred on March 7, 2017.
Here’s a close up view of recent maxima via the NSIDC’s Charctic interactive sea ice graph:
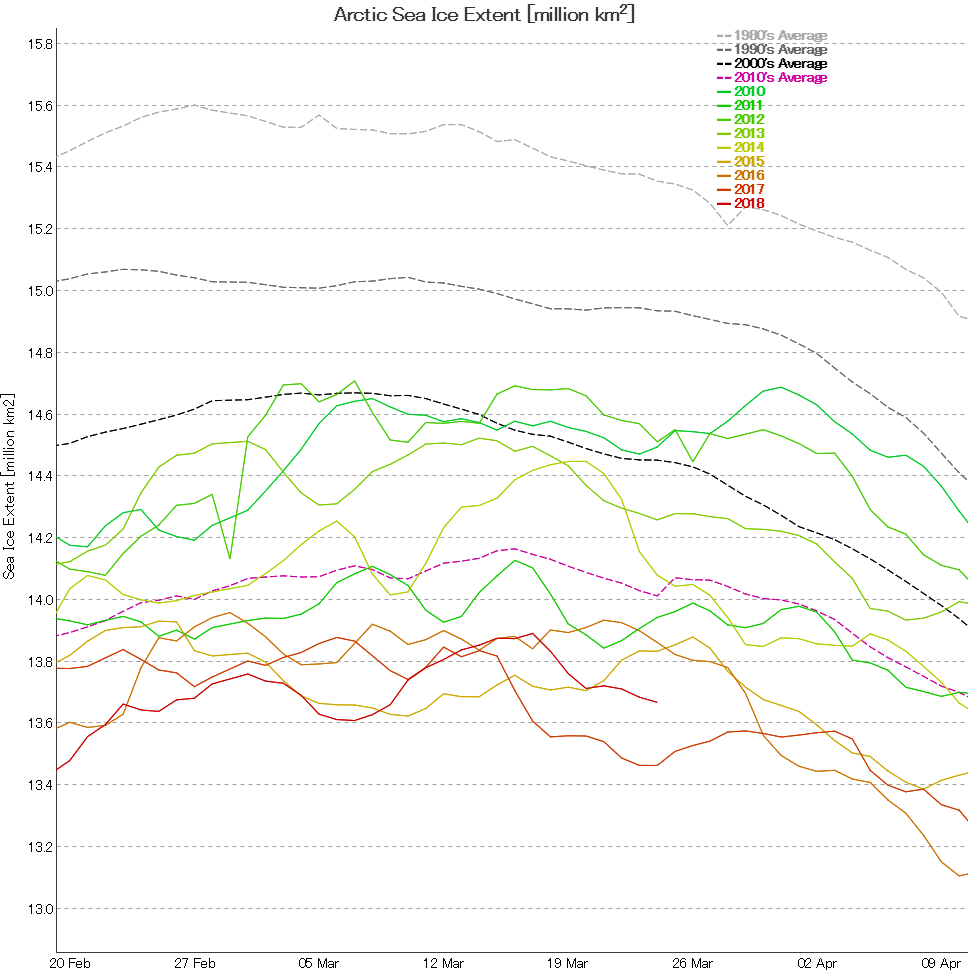
Next let’s take a look at extent data from the Japanese National Institute of Polar Research, colloquially referred to as “JAXA extent”
In this case the maximum was 13.89 million square kilometers, also on March 17th.
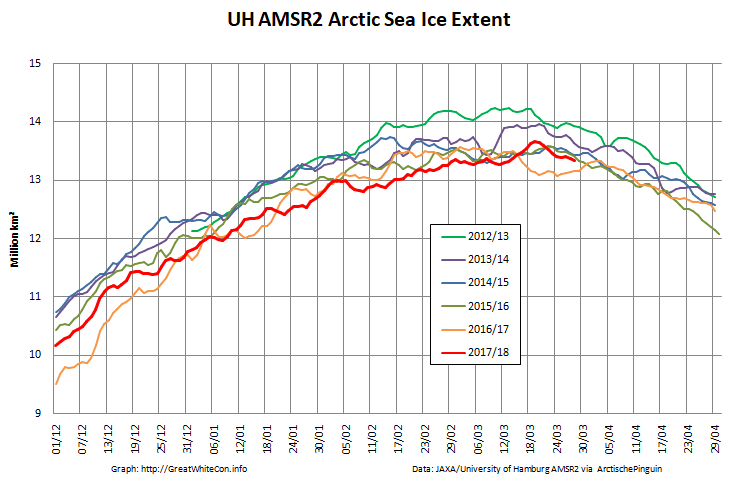
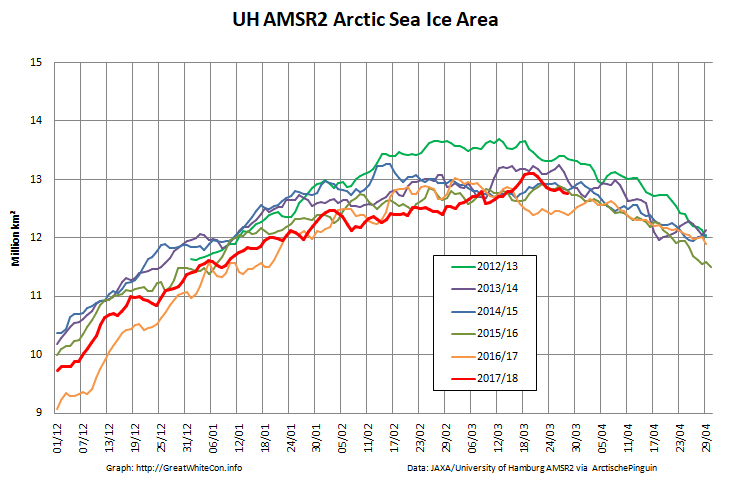
Here too are the extent and area graphs based on Wipneus’ processing of the University of Hamburg’s AMSR2 based concentration data:
They highlight the surge in Arctic sea ice area in the middle of March due to the sudden “cold snap”:
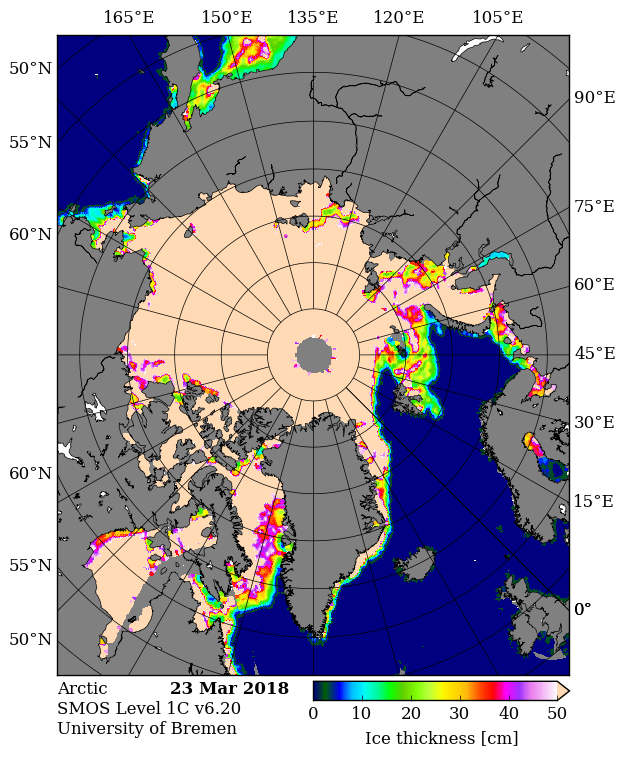
Looking at the third Arctic dimension, here’s the latest SMOS thickness map from the University of Bremen:
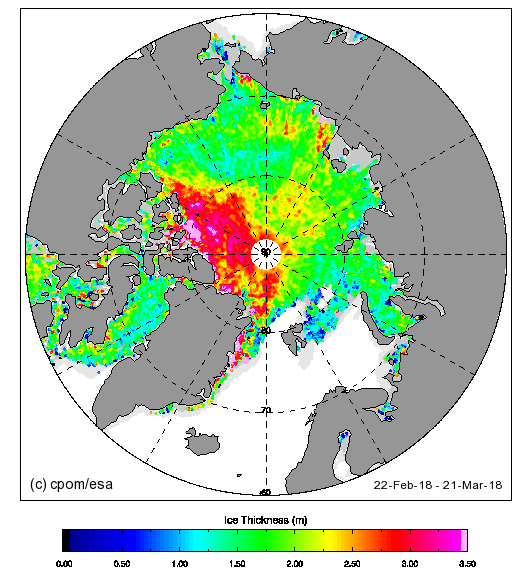
and here’s the latest CryoSat-2 thickness map:
They reveal large areas of relatively thin sea ice in the Okhotsk and Barents Seas where the ice can now be expected to melt as quickly as it formed. There is also remarkably little sea ice in the Bering Sea for the time of year:
Regular readers may recall that as 2016 began we pondered how “Storm Frank” might have affected the Arctic. Now NASA have published some research into that very topic, entitled ” The Impact of the Extreme Winter 2015/16 Arctic Cyclone on the Barents–Kara Seas”. The paper itself is paywalled, but according to an associated article on the NASA web site:
A large cyclone that crossed the Arctic in December 2015 brought so much heat and humidity to this otherwise frigid and dry environment that it thinned and shrunk the sea ice cover during a time of the year when the ice should have been growing thicker and stronger.
The cyclone formed on Dec. 28, 2015, in the middle of the North Atlantic, and traveled to the United Kingdom and Iceland before entering the Arctic on Dec. 30, lingering in the area for several days. During the height of the storm, the mean air temperatures in the Kara and Barents seas region, north of Russia and Norway, were 18 degrees Fahrenheit (10 degrees Celsius) warmer than what the average had been for this time of the year since 2003.
The extremely warm and humid air mass associated with the cyclone caused an amount of energy equivalent to the power used in one year by half a million American homes to be transferred from the atmosphere to the surface of the sea ice in the Kara-Barents region. As a result, the area’s sea ice thinned by almost 4 inches (10 centimeters) on average.
At the same time, the storm winds pushed the edges of the sea ice north, compacting the ice pack.
Here’s a video with commentary by Linette Boisvert, lead author of the paper:
From the commentary:
As a result of this cyclone, the concentration of the sea ice in the Barents and Kara Seas decreased by ten percent, and the sea ice edge moved northward. The loss in sea ice area during this time was equivalent to the size of Florida. Sea ice extent stayed low throughout the month of January with large parts of the Barents and Kara Seas remaining unseasonably ice-free, which probably helped contribute to a record low Arctic sea ice maximum.
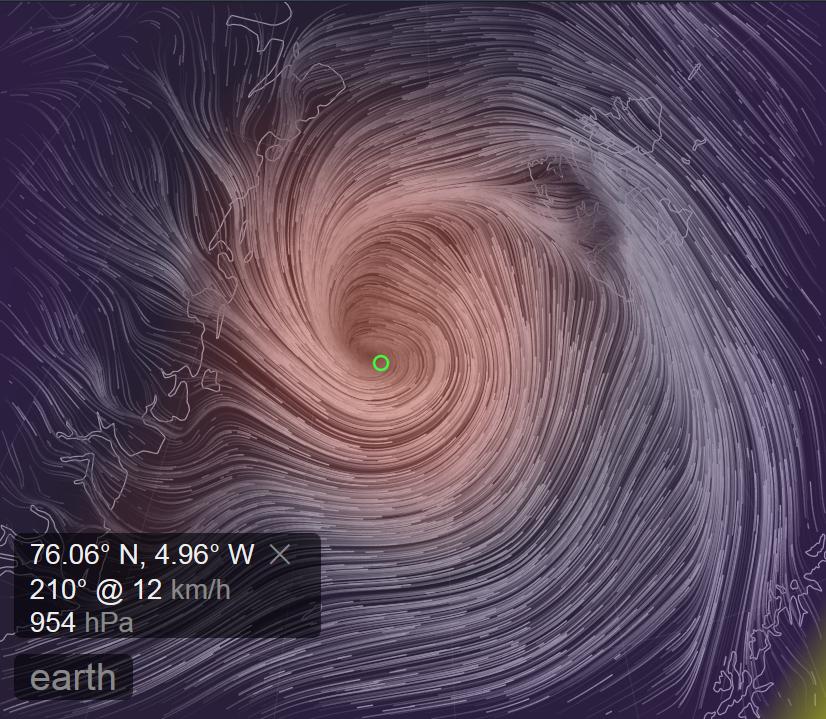
Somewhat earlier than last year another strong cyclone has been having a similar effect on the Arctic over the last week. A cyclone entered the Central Arctic via the Fram Strait, reaching a minimum central pressure of 954 hPa on November 14th:
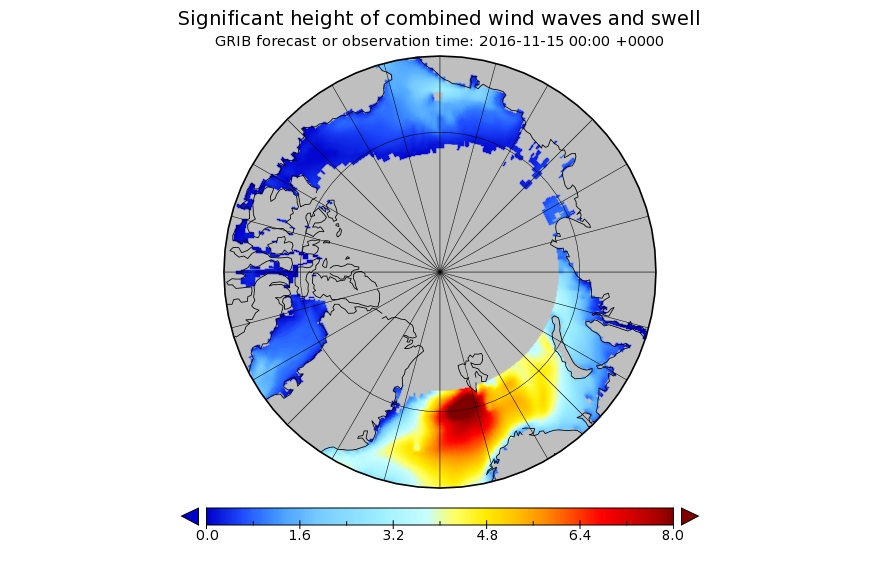
Here is the Wavewatch III wave height forecast for November 15th 2016:
and here is NOAA’s temperature anomaly reanalysis for November 16th 2016:
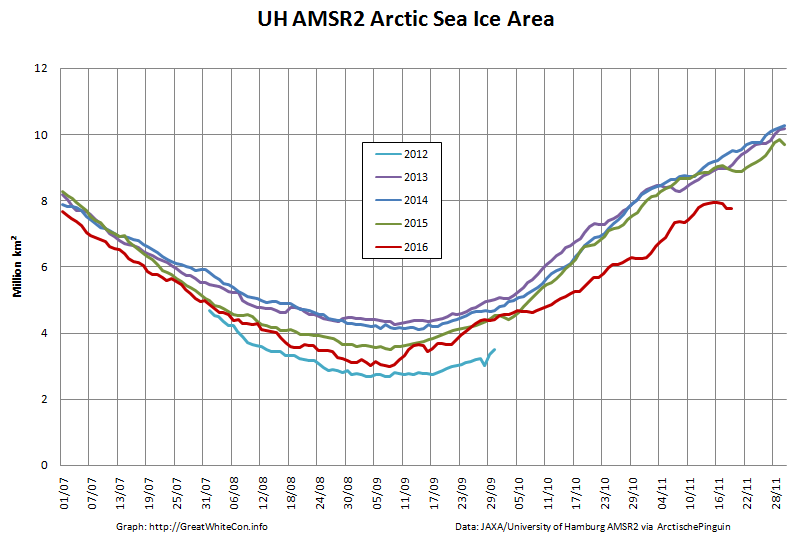
As a consequence of the strong winds, huge waves and 20 degrees Celsius temperature anomaly across much of the Arctic, sea ice area has been falling during a period when it is usually increasing rapidly:
According to the old saying “A change is as good as a rest”, so rather than plagiarise today’s title from a “skeptical” web site we’ve invented this one all by ourselves. Northabout is a small yacht with big ideas. (S)he wants to circumnavigate the North Pole in one summer season. However certain cryoblogospheric commenters are somewhat skeptical that this can be achieved this year. Take Tony Heller for example:
There has been very little melt going on in the Arctic Ocean the last few days, due to cold cloudy weather.
A group of climate clowns were planning on sailing around the entire Arctic Ocean through the Northeast and Northwest Passages (to prove there isn’t any ice in the Arctic) but are stuck in Murmansk because the Northeast Passage is completely blocked with ice.
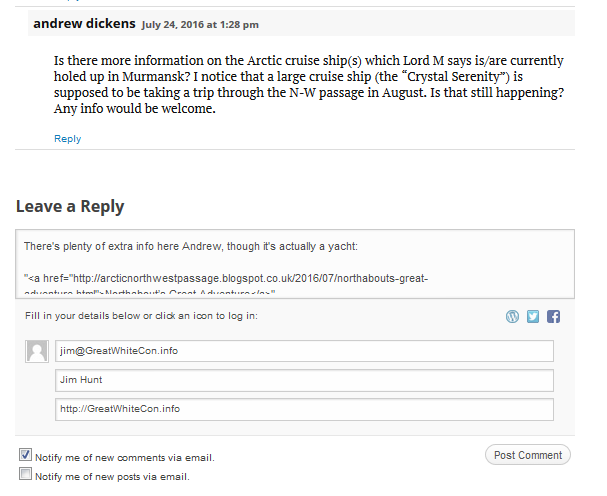
The “group of climate clowns” aboard Northabout that Mr. Heller refers to are led by David Hempleman-Adams. According to the Polar Ocean Challenge web site:
David is one of the most experienced and successful adventurers in the world.
In his forty years as an adventurer, David was the first person to reach the highest peaks on all seven continents and journey fully to the North and South Geographical and Magnetic Poles. He has broken forty-seven Federation Aeronautique Internationale ballooning records
My name is Tony Heller. I am a whistle blower. I am an independent thinker who is considered a heretic by the orthodoxy on both sides of the climate debate.
I have degrees in Geology and Electrical Engineering, and worked on the design team of many of the world’s most complex designs, including some which likely power your PC or Mac. I have worked as a contract software developer on climate and weather models for the US government.
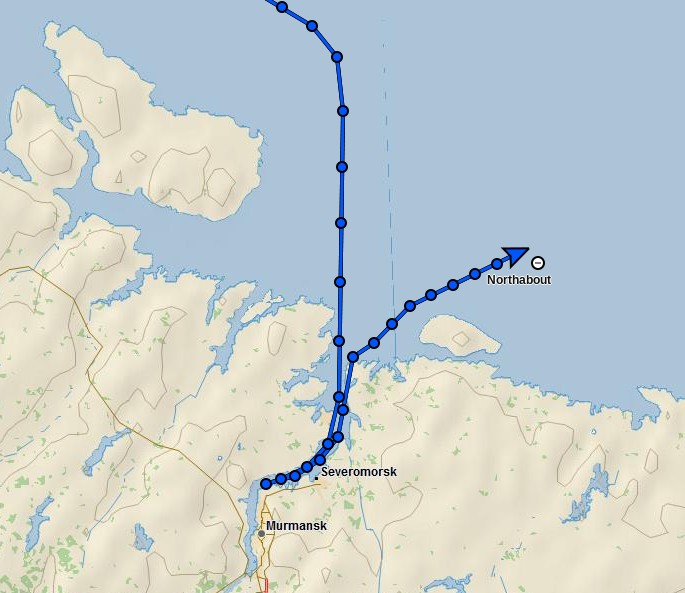
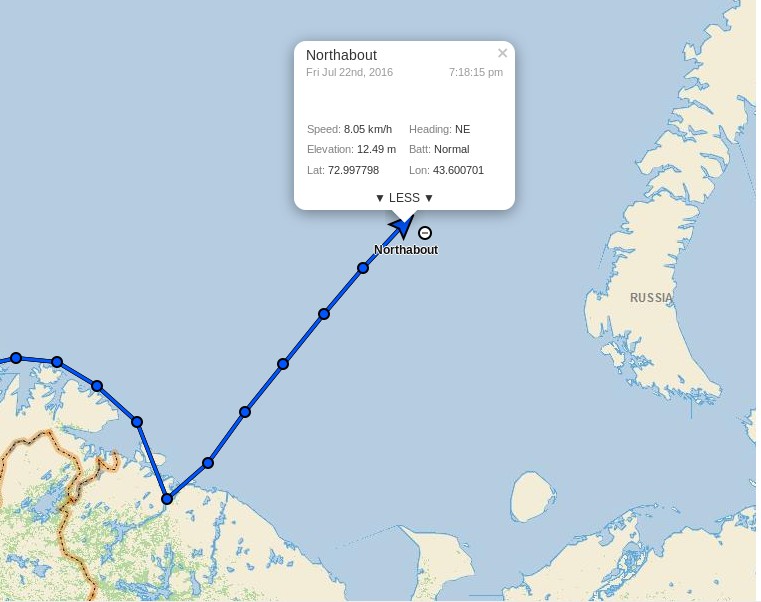
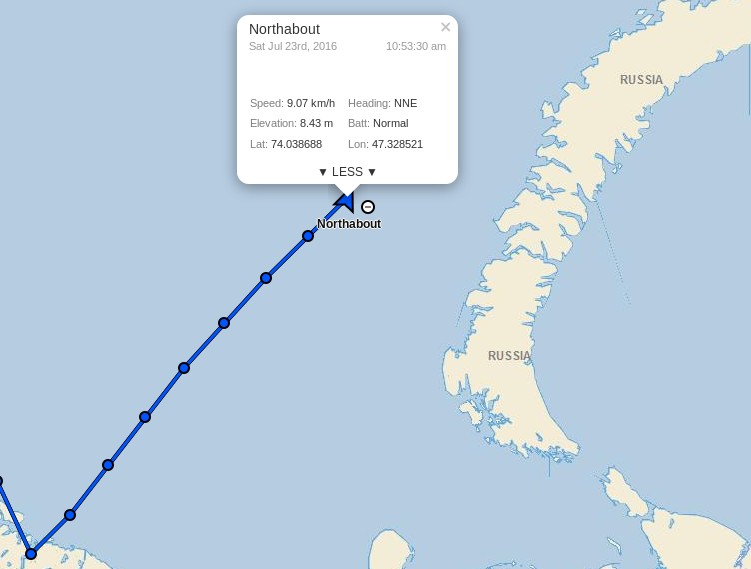
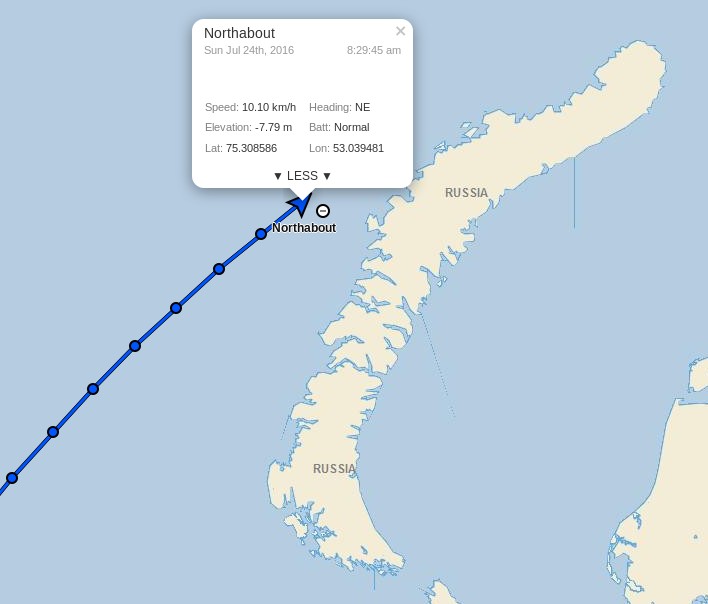
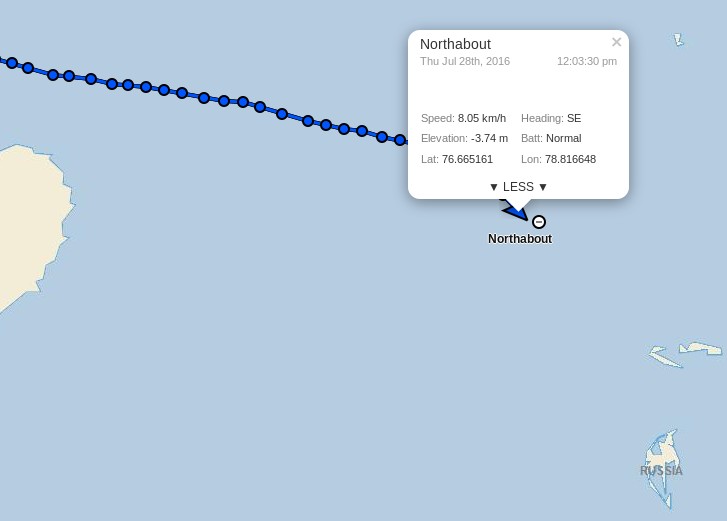
However despite Tony’s long list of qualifications he is evidently currently quite confused, since according to the Polar Ocean Challenge live tracking map David and Northabout are not in actual fact “stuck in Murmansk” at all:
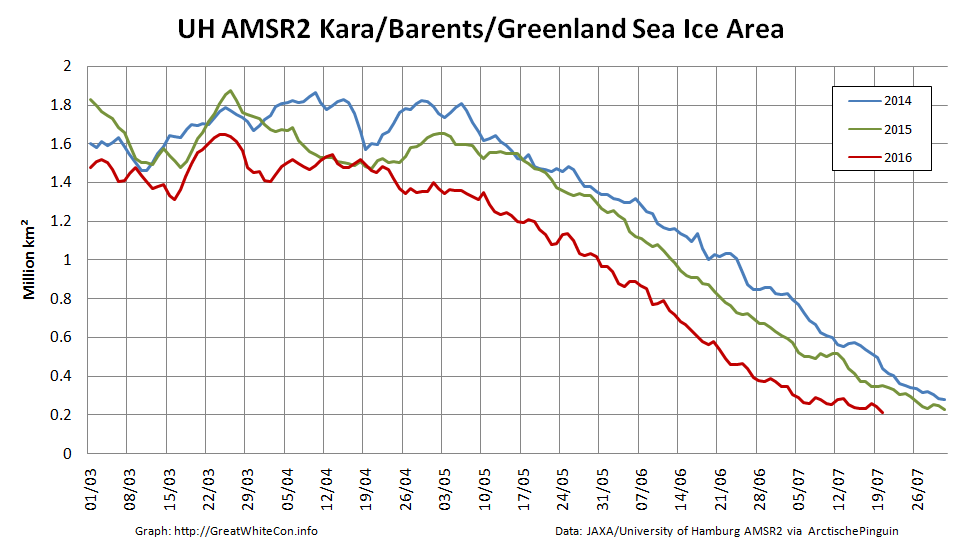
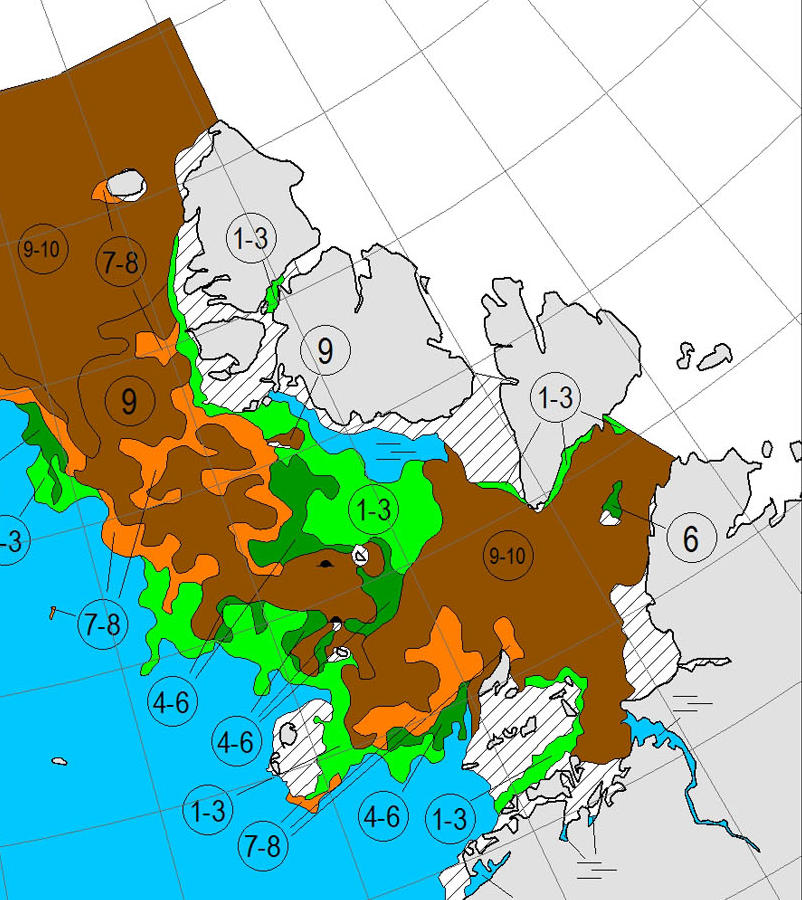
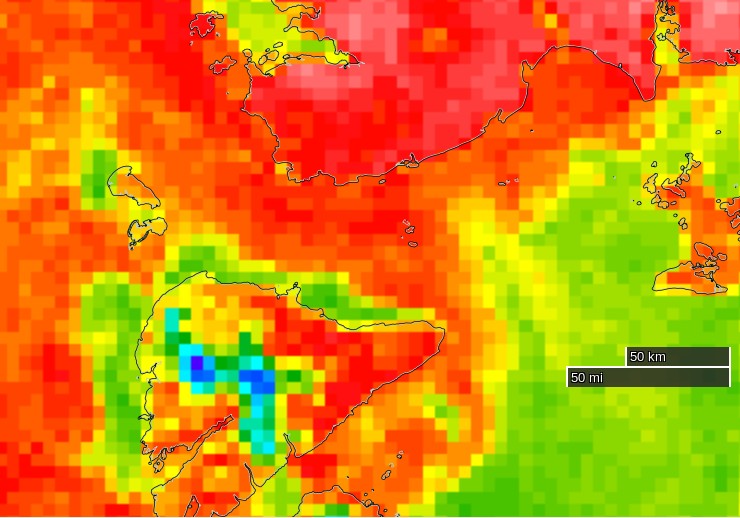
This shouldn’t come as surprise to anyone with an internet connection and a desire to check the facts, since as we speak there is currently remarkably little sea ice cover on the Atlantic side of the Arctic Ocean:
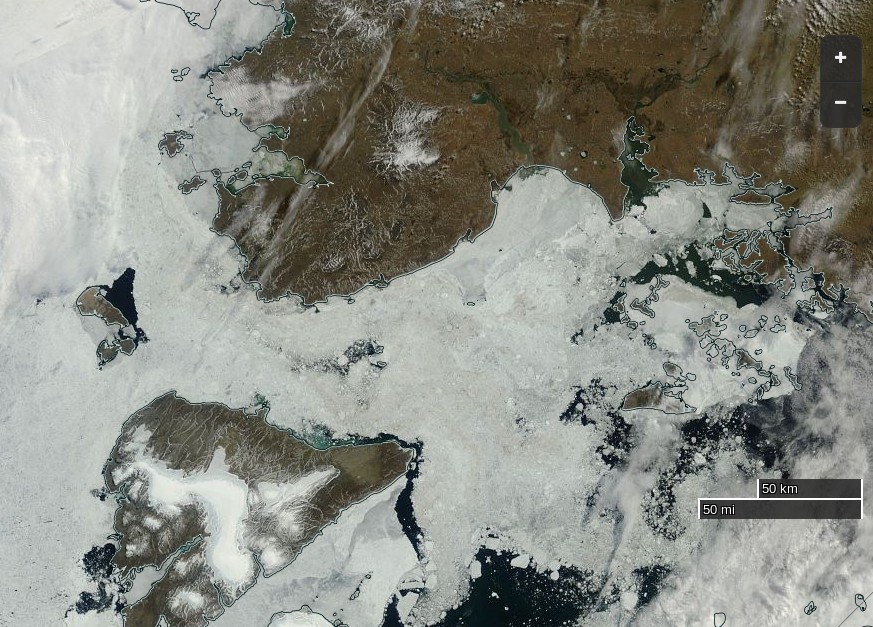
Hence Northabout should find the next leg of his/her voyage across the Barents and Kara Seas pretty plain sailing. However Vilkitsky Strait, the passage from the Kara into the Laptev Sea, is currently looking a trifle tricky:
NASA Worldview “true-color” image of the Vilkitsky Strait on July 20th 2016, derived from the MODIS sensor on the Terra satellite
Do you suppose Tony Heller suffers from precognitive dreams?
[Edit – July 22nd 2016]
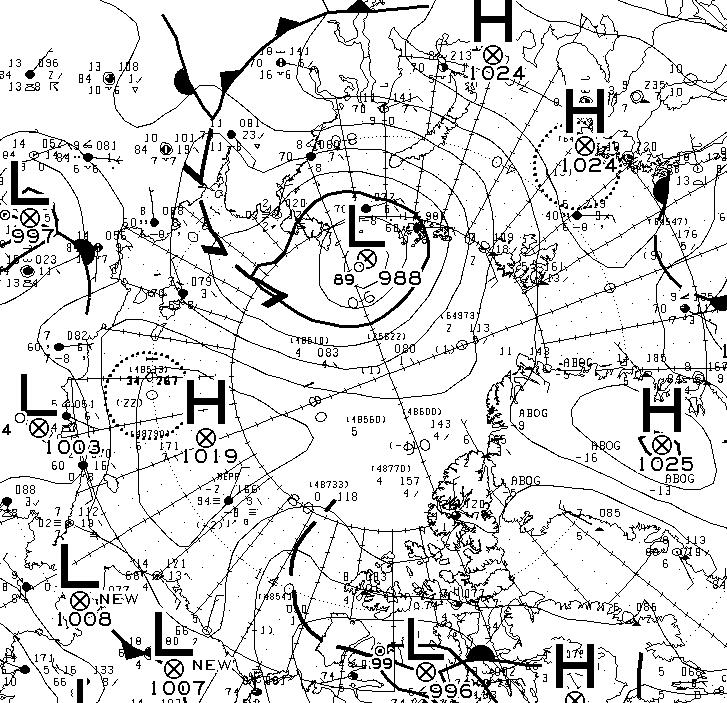
According to Environment Canada this morning there’s a 988 hPa central pressure cyclone causing a bit of a blow in the Vilkitsky Strait at the moment:
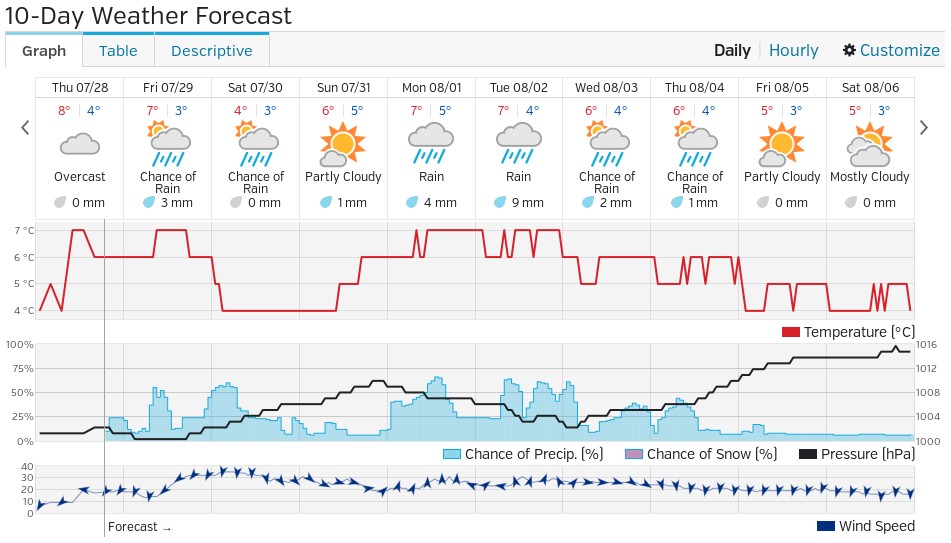
Sea and air temperature getting colder as we venture further north. Saw quite a lot of Dolphins for the first time around the Yacht. Still sea gulls flying behind and skimming the waves.
Had some promising Canadian ice charts yesterday, but that’s a long way off. Today we should get an update with the Russian side. fingers crossed it is still not solid around the cape and Laptev sea. That could slow us down considerably. The wind has been blowing the pack ice against the land, so very difficult to get around the shore, but let’s see what Santa brings.
P.S. Maintaining his usual modus operandi, Tony Heller has penned a new article today, containing a satellite image remarkably similar to the one just above. Under the headline “The 2016 Franklin Expedition” he tells his loyal readership:
The Polar Ocean Challenge is headed off into the ice.
They will run into this in three days – hundreds of miles of solid ice. Without an icebreaker, they are going nowhere. I asked them on Twitter if they have an icebreaker. I haven’t received a response, and will be monitoring them by satellite to see if they are cheating.
By some strange coincidence we’re “monitoring them by satellite” too:
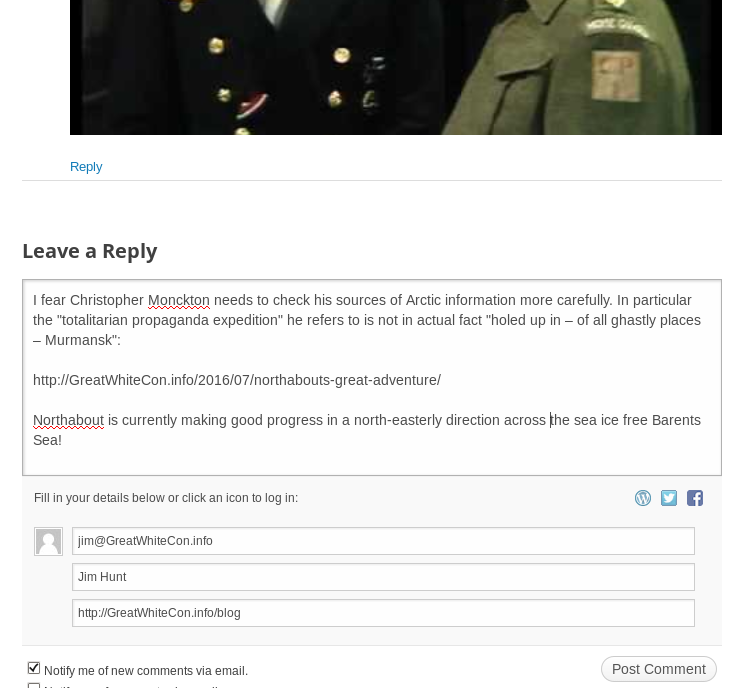
As for ice melt, yet another totalitarian propaganda expedition intended to “raise awareness” of climate “catastrophe” by trying to sail around the Arctic in the summer has just come a cropper owing to – er – too much ice. Neither the North-East Passage nor the North-West Passage is open, so the expedition is holed up in – of all ghastly places – Murmansk. That’ll teach Them.
However my corrective comment has yet to see the light of day at WUWT:
Meanwhile Northabout resolutely presses on regardless, and has just passed 74 degrees North:
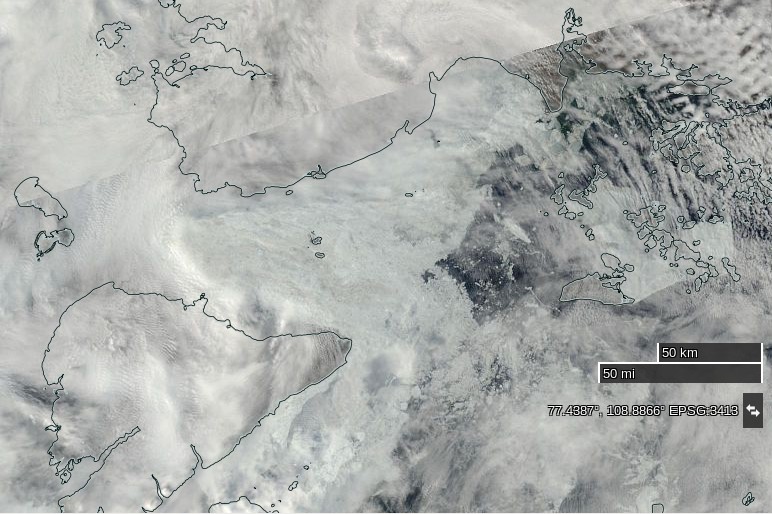
whilst the sea ice edge in the north-eastern Kara Sea has retreated somewhat over the last three days:
NASA Worldview “true-color” image of the Vilkitsky Strait on July 23rd 2016, derived from the MODIS sensor on the Terra satellite
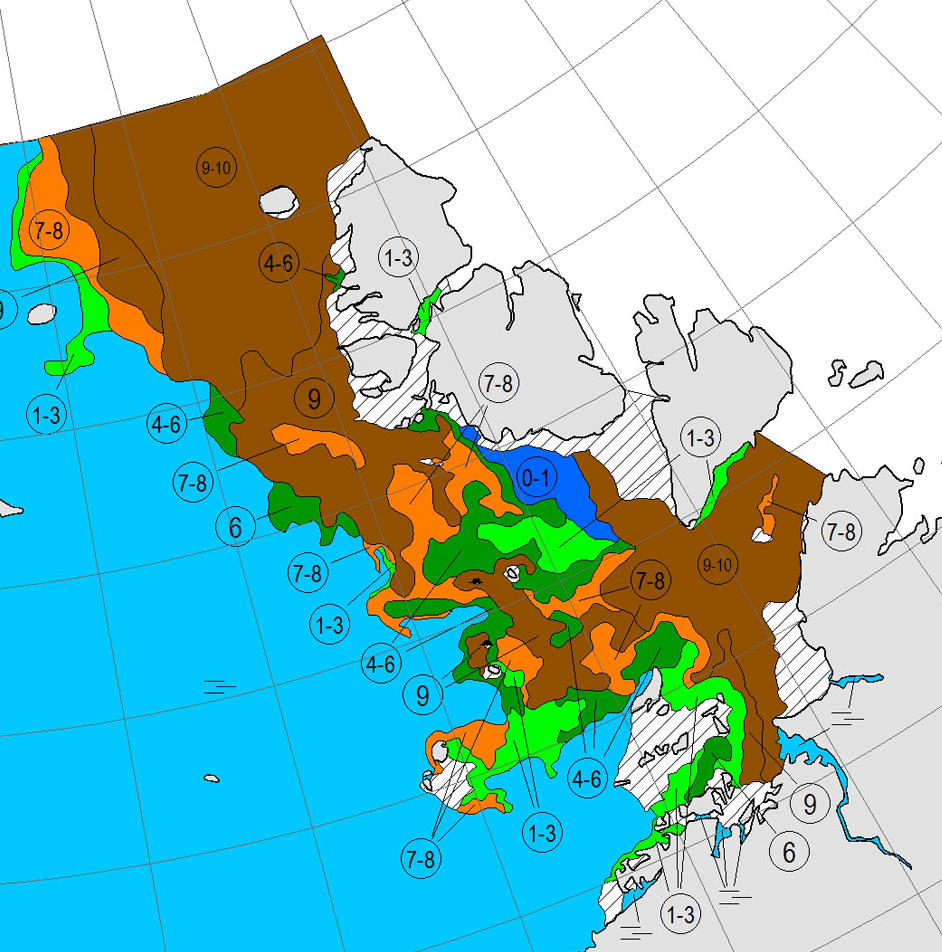
Here’s the July 20-22nd AARI map of the Vilkitsky Strait area:
On the topic of Arctic sea ice melt in general Viscount Monckton opines over on WUWT that:
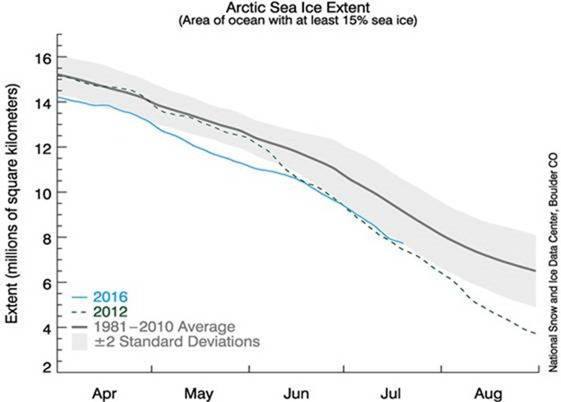
According to the National Snow and Ice Data Center’s graph, also available at WUWT’s sea-ice page, it’s possible, though not all that likely, that there will be no Arctic icecap for a week or two this summer:
Even if the ice disappears for a week or two so what? The same was quite possibly true in the 1920s and 1930s, which were warmer than today in the northern hemisphere, but there were no satellites to tell us about it.
The Good Lord seems to have a very tenuous grasp on reality, since the NSIDC’s graph shows nothing of the sort. Perhaps he is merely indulging in irony?
[Edit – July 24th 2016]
Northabout passed the 75 degrees North milestone overnight:
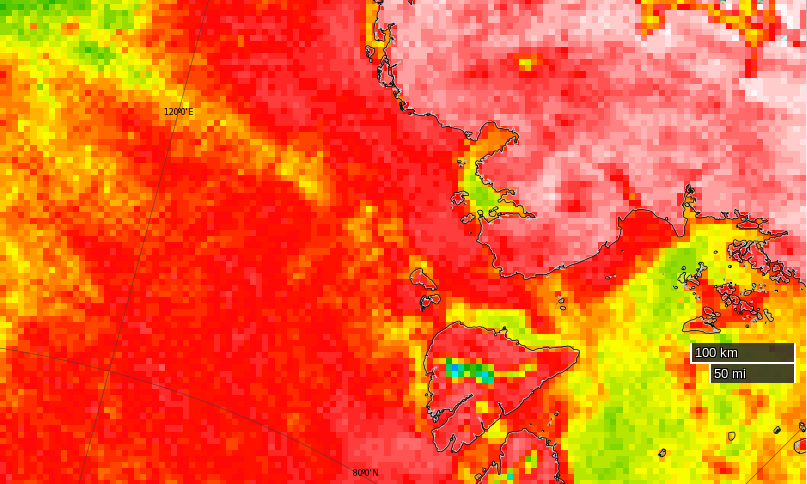
Clouds obscure the Vilkitsky Strait in visible light this morning but passive microwaves make it through the murk, albeit with reduced resolution. They reveal the sea ice edge in the Kara Sea receding and a narrow passage opening up along the Northern side of the Strait (North is down in the image):
NASA Worldview passive microwave image of the Vilkitsky Strait on July 24th 2016, derived from the AMSR2 instrument on the Shizuku satellite
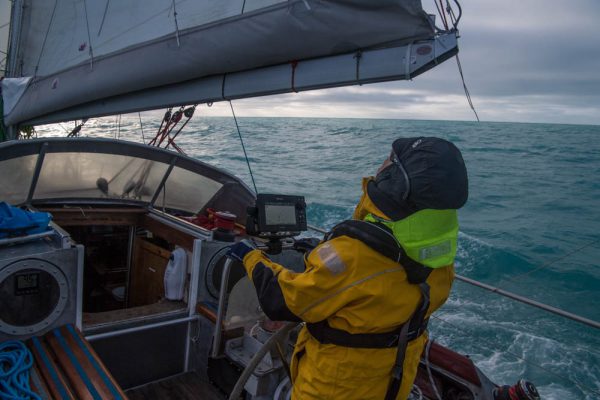
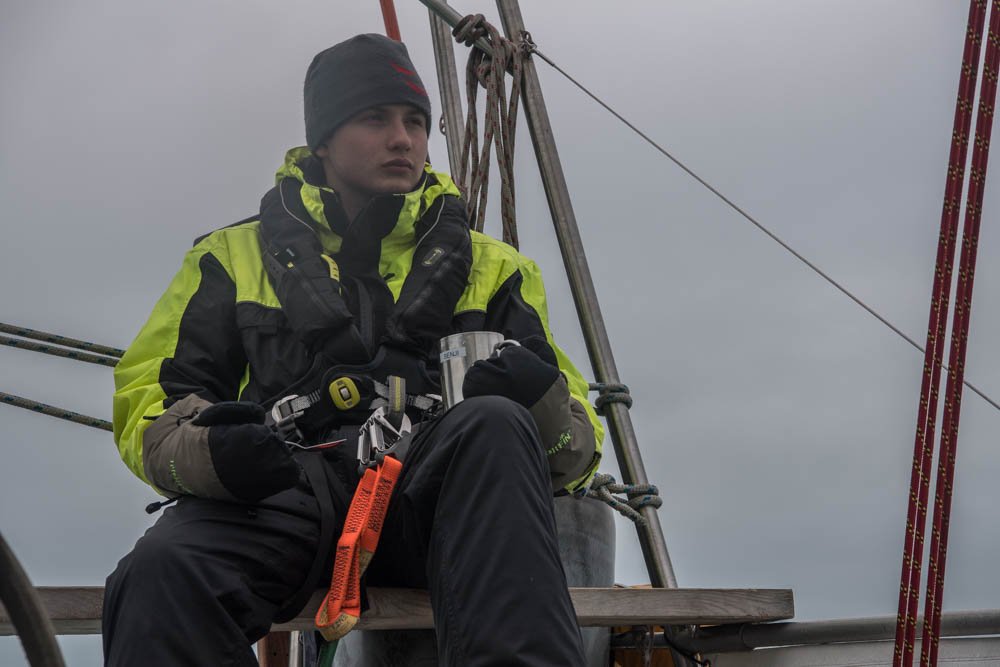
According to Ben Edwards’ latest blog post from the Barents Sea:
I just wore a T-shirt on my first watch out of Murmansk. Today I wore my trawler suit and a primaloft under it with gloves and a hat….
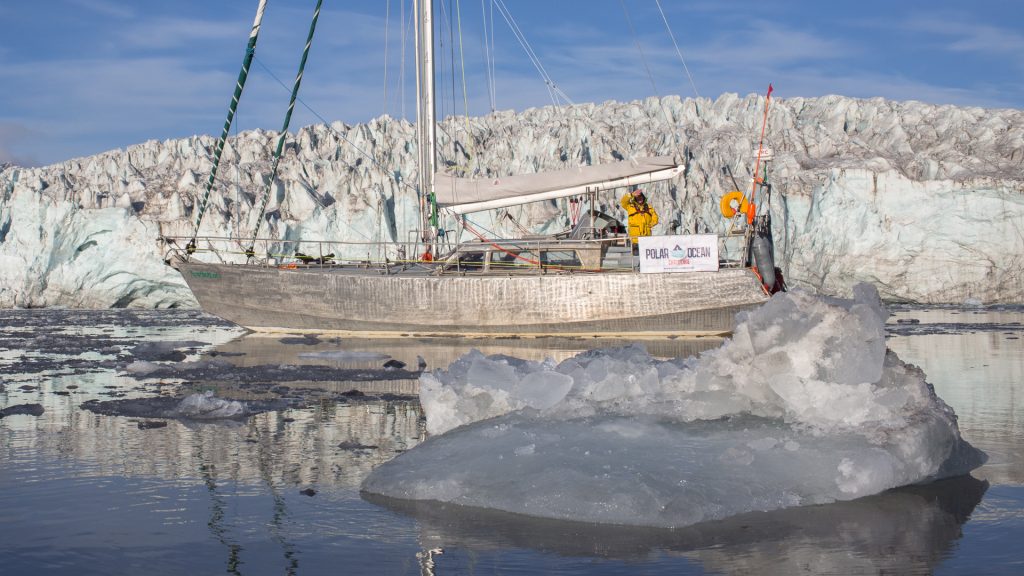
As the cryodenialosphere continue to retweet and reblog their regurgitated rubbish here’s a picture from last year of Northabout amidst some ice, especially for those apparently unable to distinguish a small yacht from a large icebreaker:
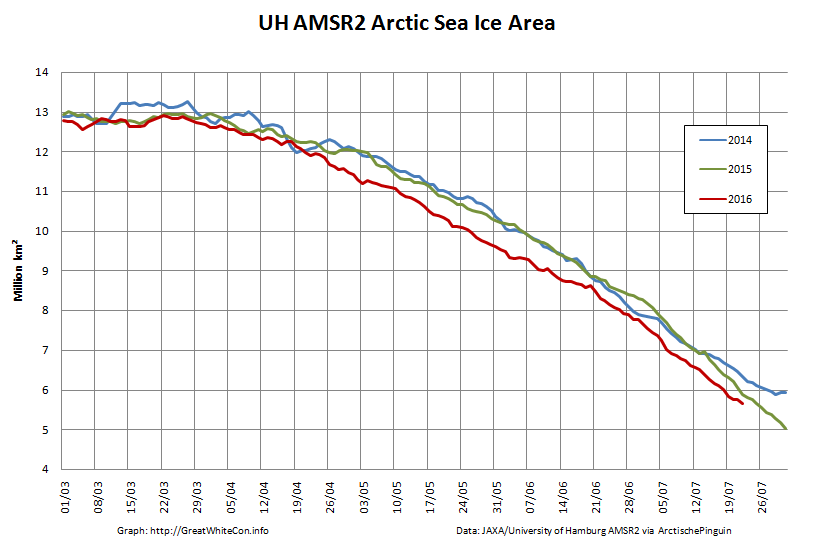
Meanwhile Arctic sea ice continues its inexorable decline:
[Edit – July 24th 2016 PM]
Shock News! Tony Heller has just published yet another article about Northabout’s Great Adventure, and yours truly gets a mention. In the headline no less!! Read all about it at:
Meanwhile the commenters over at unReal Science keep blathering on about icebreakers even though one of the more inquisitive denizens posted thisextract from the “Ship’s Log” over there yesterday:
Partly checked the new ice charts on www.nsra.ru, we still have no chance of getting through yet, not past the cape or through the Laptev sea. Nikolai, Our Russian Captain who is very familiar with this route, impresses on me that this is a very unusual year and normally clear, Not what I want to hear. We are under sail, so saving fuel, and will find a small island to shelter until we get improvements. We are still 5 days from the ice, so lets hope for some southerly winds to push the ice from shore.
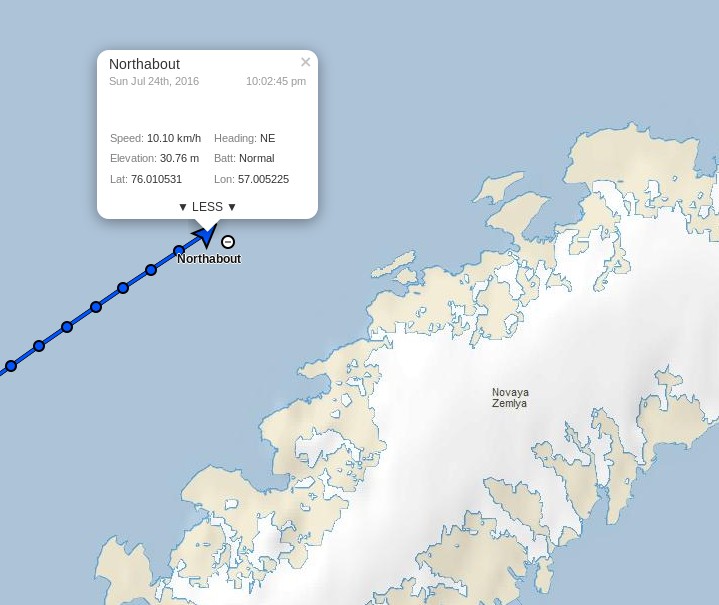
Northabout is heading for the Kara Sea past the northern tip of Novaya Zemlya, and has now passed 76 degrees North:
[Edit – July 25th 2016]
The skies are still cloudy over the Vilkitsky Strait and Cape Chelyuskin, so here’s another AMSR2 passive microwave visualisation of the state of play. Note the change of scale:
NASA Worldview passive microwave image of the Vilkitsky Strait on July 25th 2016, derived from the AMSR2 instrument on the Shizuku satellite
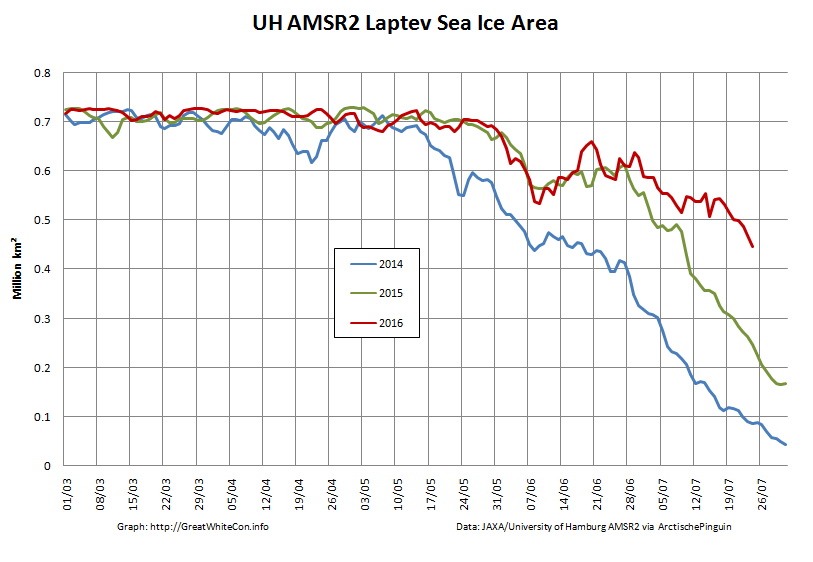
The sea ice area in the Laptev Sea has finally started decreasing at a more “normal” rate for late July, but still has a lot of catching up to do compared to recent years:
Meanwhile over at “Watts Up With That” at least one reader of Christopher Monckton’s purple prose is clearly confused. Needless to say my clarifying comment is still invisible to him:
Finally, for the moment at least, here’s some moving pictures of dolphins having fun in the Barents Sea:
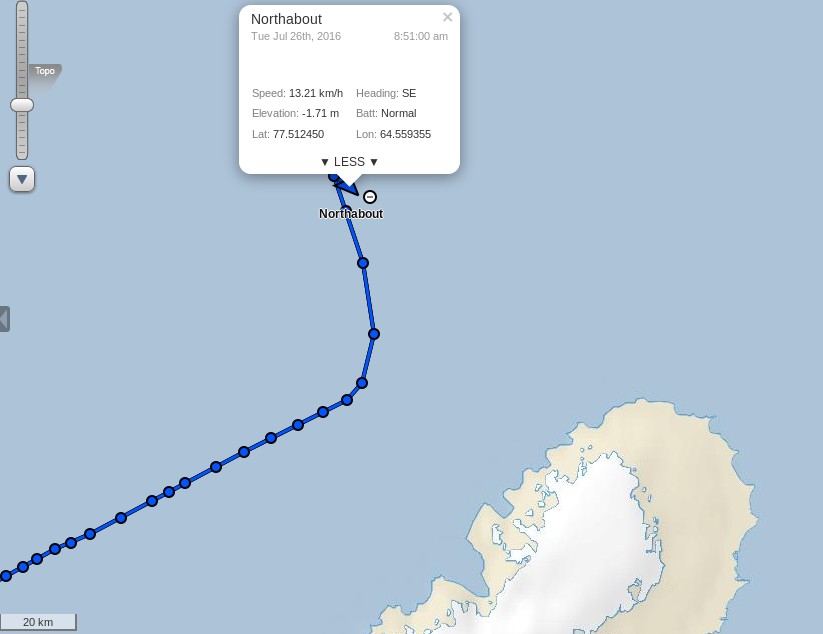
[Edit – July 26th 2016]
I was expecting Northabout to have entered the Kara Sea by now, but instead (s)he has headed north, and is now well above the 77th parallel:
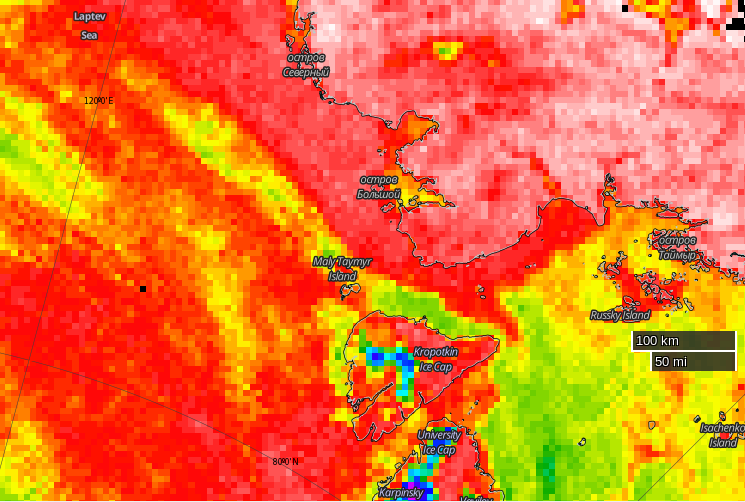
It’s still pretty cloudy up there so here once again is the latest AMSR2 passive microwave visualisation of the Vilkitsky Strait area, with a few place names added for a bit of variety:
NASA Worldview passive microwave image of the Vilkitsky Strait on July 26th 2016, derived from the AMSR2 instrument on the Shizuku satellite
P.S. The Polar Ocean Challenge team explain via Twitter:
@GreatWhiteCon Ha ha! Thanks for interest! Waiting game, manoeuvring, strategy. Difficult to update in choppy conditions! New SHIPSLOG now
— PolarOceanChallenge (@PolarOceanChall) July 26, 2016
Choppy sea, taking four hour tacks. These sea conditions make it hard to sleep, cook or relax.
We are considering many elements all the time. We are due new Russian Ice charts today.
We know the North west is pretty clear, but this year is a very unusual year in the north east passage. Normally the Laptev Sea would be pretty open now as in previous years. It is not. This is also partly due to the wind blowing the pack ice down south and consolidating next to the land.
So, we need to get through the straight and through the Laptev Sea. So where do we wait until we can do this? We have deliberately taken our time to get to this point, and used the wind as much as we can to conserve fuel.
Now the weather has changed, the wind direction has also changed. From the calm turquoise seas, to choppy short seas, wet, windy and cold.
So we took a long tack north, and then tacked east again. There is No hurry. We will slowly make our way east, and if we can find an island with no fast ice around, will look for a sheltered spot, until we get better ice conditions.
The other options are to Heave to and wait, but this is a sailing Yacht, she needs to sail. And if we get a Southerly blow, it could change our chances very quickly to get around, so we need to be close to react.
So, another day at the office.
There was a report on the BBC Radio 4 Today programme this morning from the crew of Northabout, and an interview with Dr. Ed Blockley from the UK Met Office about the current state of sea ice in the Arctic:
Note in particular the part at 2:59:00 where Justin Webb says to Ed:
I thought that I’d read somewhere that [Northabout] had got stuck.
I cannot help but wonder what on Earth gave him that idea?
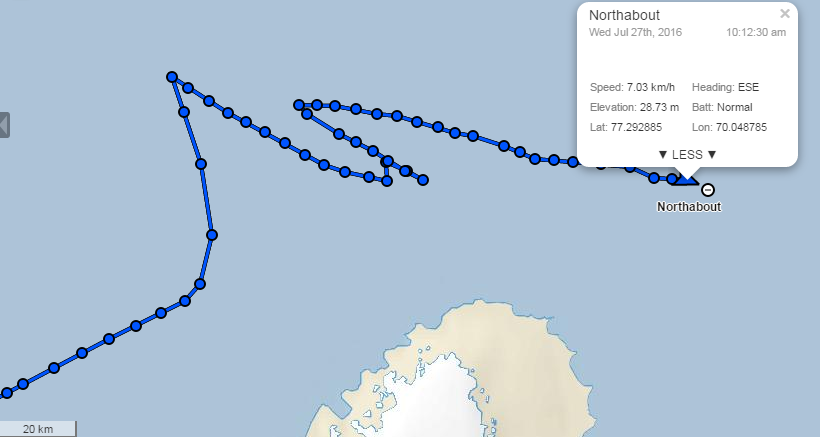
[Edit – July 27th 2016]
After “going round in circles” north of Novaya Zemlya yesterday Northabout is now heading East across the Kara Sea:
Synthetic aperture radar images from the European Space Agency’s Sentinel 1A satellite have started flowing through Polarview once again, so here’s one of where Northabout is heading:
Sentinel 1A synthetic aperture radar image of the Vilkitsky Strait on July 26th 2016
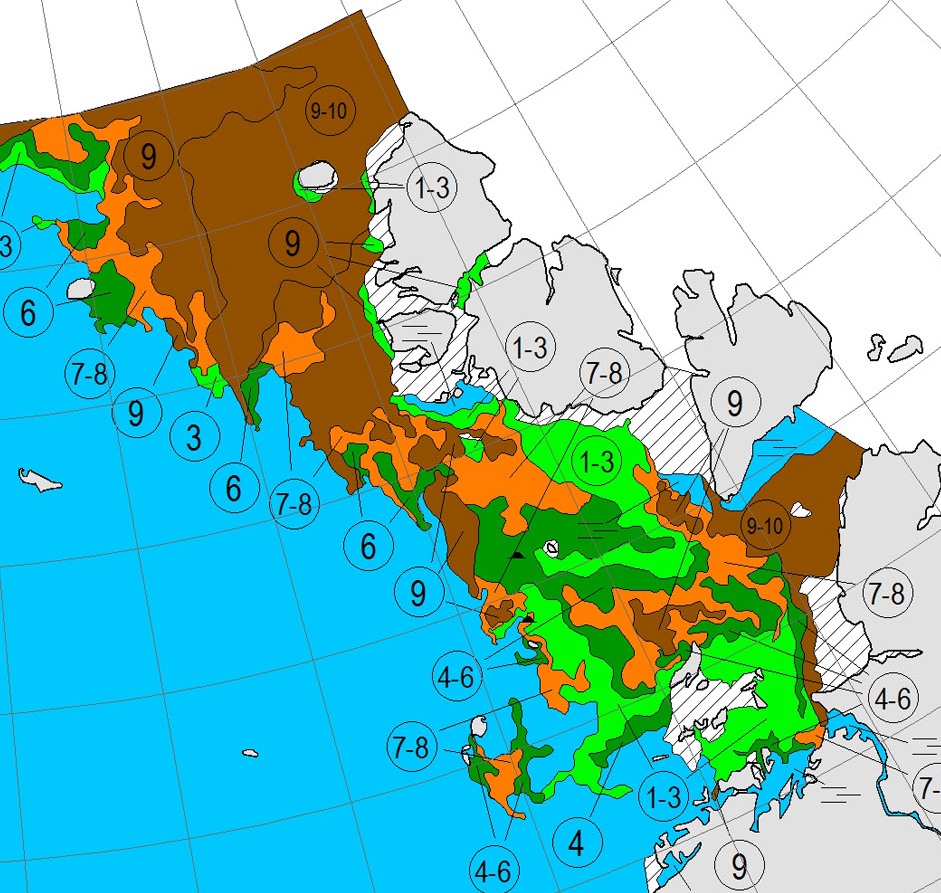
Here’s the current Arctic and Antarctic Research Institute map of the same area:
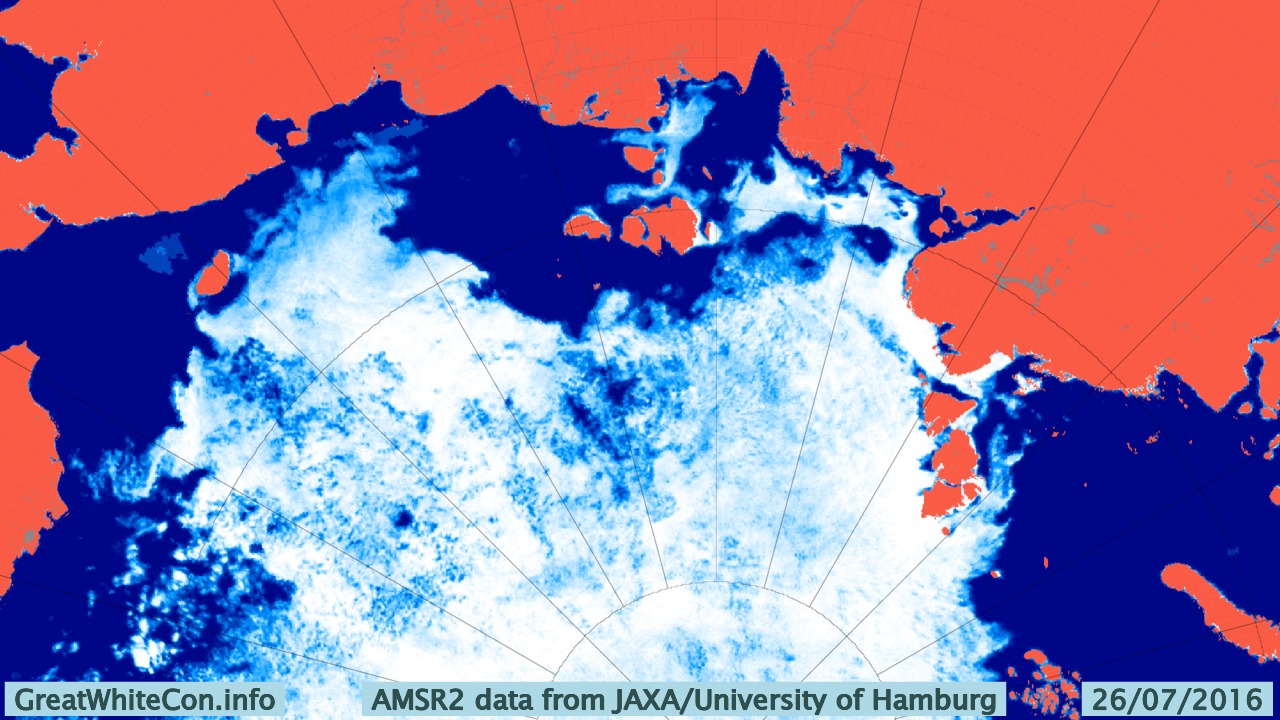
There’s still no way through by which Northabout might avoid an encounter with 9-10 tenths sea ice coverage. Then of course there’s the Laptev Sea to contend with too. Here’s the latest AMSR2 visualisation from the University of Hamburg:
It’s not exactly plain sailing there either just yet!
[Edit – July 28th 2016]
This morning Northabout has almost reached 79 degrees East, and appears to be heading in the direction of Ostrov Troynoy:
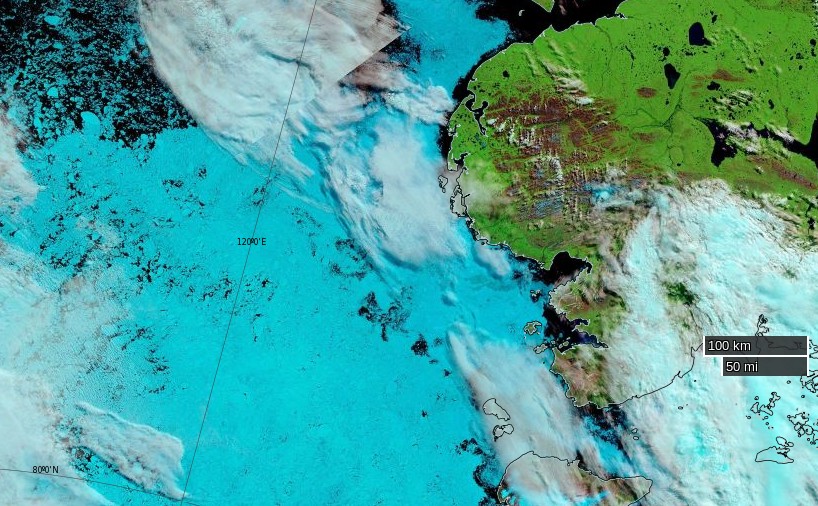
The clouds over the Laptev Sea have cleared somewhat as the recent cyclone heads for the Beaufort Sea, to reveal that the “brick wall” of ice referred to in certain quarters now looks more like Swiss cheese:
NASA Worldview “false-color” image of the Laptev on July 28th 2016, derived from the MODIS sensor on the Terra satellite
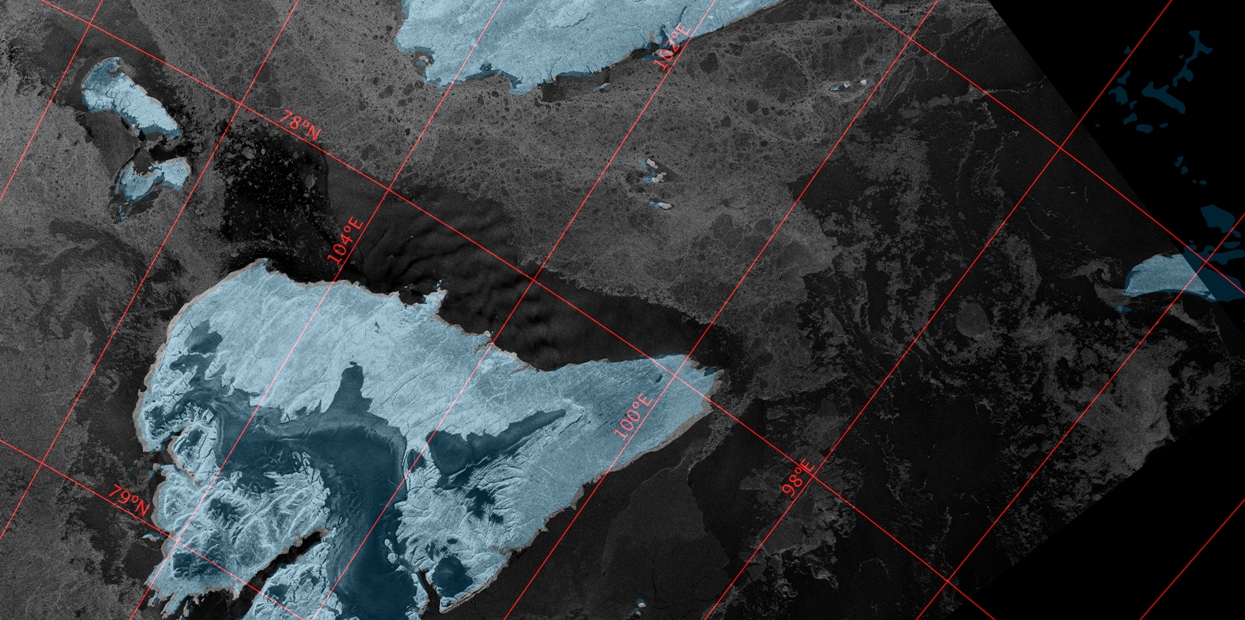
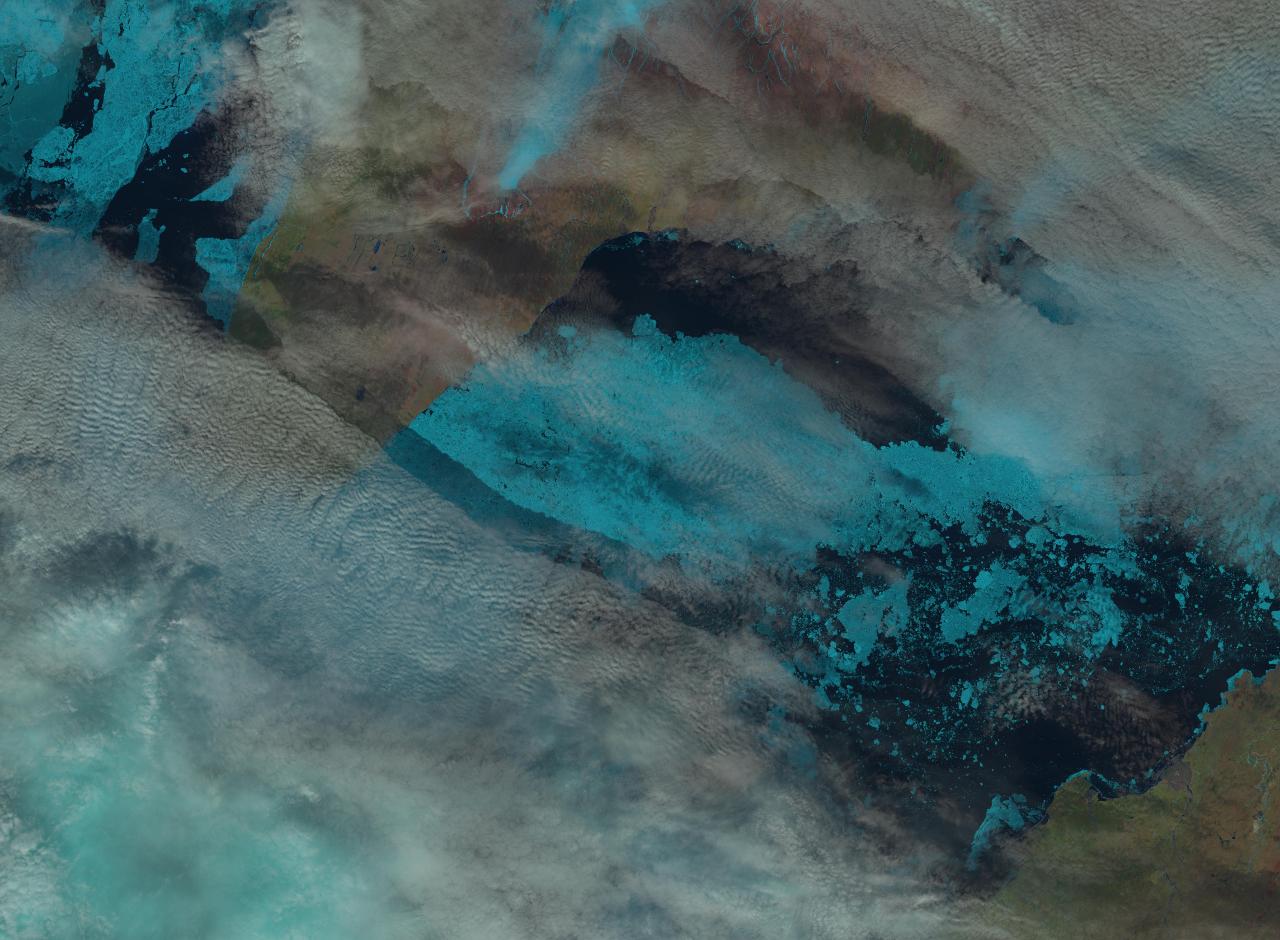
Here’s a close up look at the Vilkitsky Strait from the Landsat 8 satellite this morning. Note that unlike the MODIS image above, north is at the top of this one:
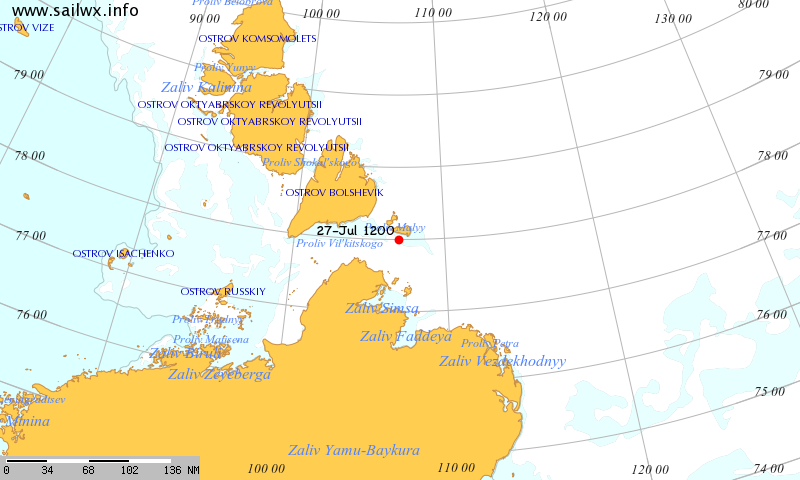
Meanwhile according to SailWX the Russian icebreaker Yamal is traversing the Vilkitsky Strait from east to west:
This website uses cookies to improve your experience. We'll assume you're ok with this, but you can opt-out if you wish. Cookie settingsACCEPT
Privacy & Cookies Policy
Privacy Overview
This website uses cookies to improve your experience while you navigate through the website. Out of these, the cookies that are categorized as necessary are stored on your browser as they are essential for the working of basic functionalities of the website. We also use third-party cookies that help us analyze and understand how you use this website. These cookies will be stored in your browser only with your consent. You also have the option to opt-out of these cookies. But opting out of some of these cookies may affect your browsing experience.
Necessary cookies are absolutely essential for the website to function properly. This category only includes cookies that ensures basic functionalities and security features of the website. These cookies do not store any personal information.
Any cookies that may not be particularly necessary for the website to function and is used specifically to collect user personal data via analytics, ads, other embedded contents are termed as non-necessary cookies. It is mandatory to procure user consent prior to running these cookies on your website.