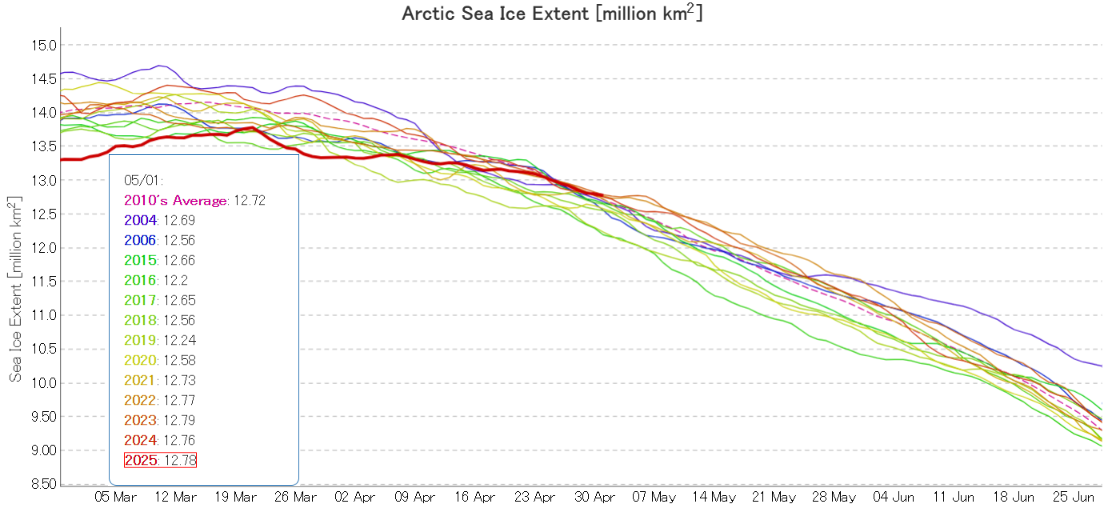
JAXA/ViSHOP extent is no longer “lowest for the date”! After “flatlining” for most of April the metric is now in the midst of a close knit group of the other years in the 2020s:
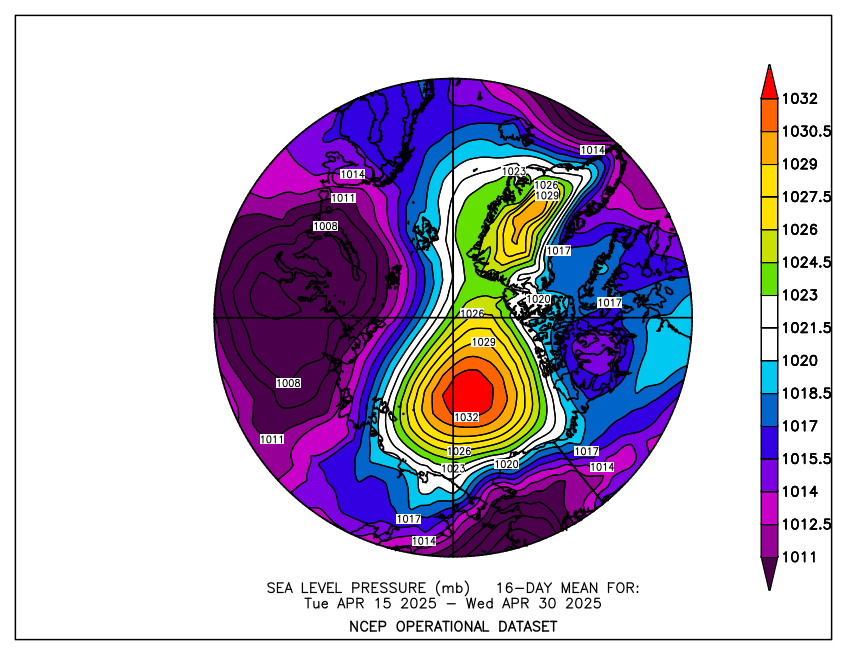
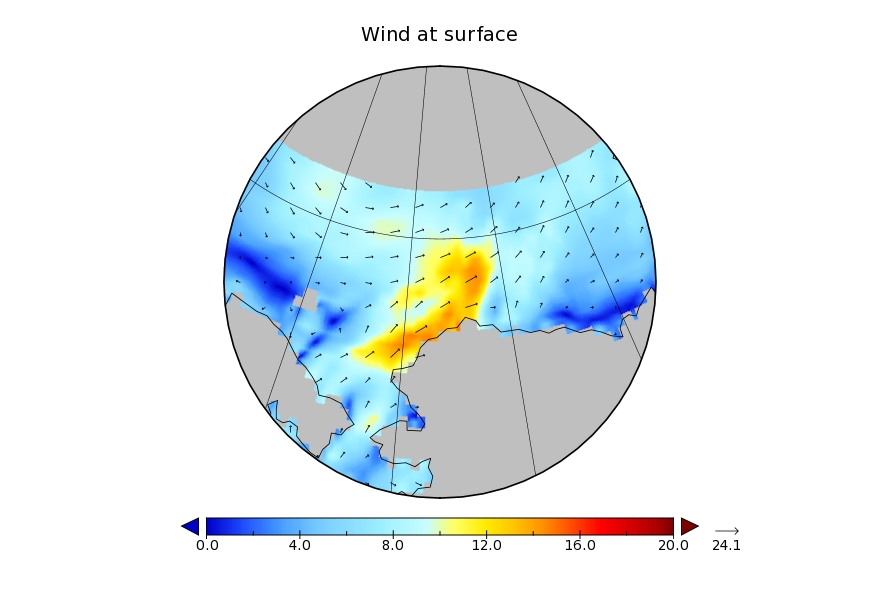
The high pressure area over the Central Arctic persisted through the second half of April, and so did the consequent drift of ice from the Pacific side of the Arctic to the Atlantic periphery:
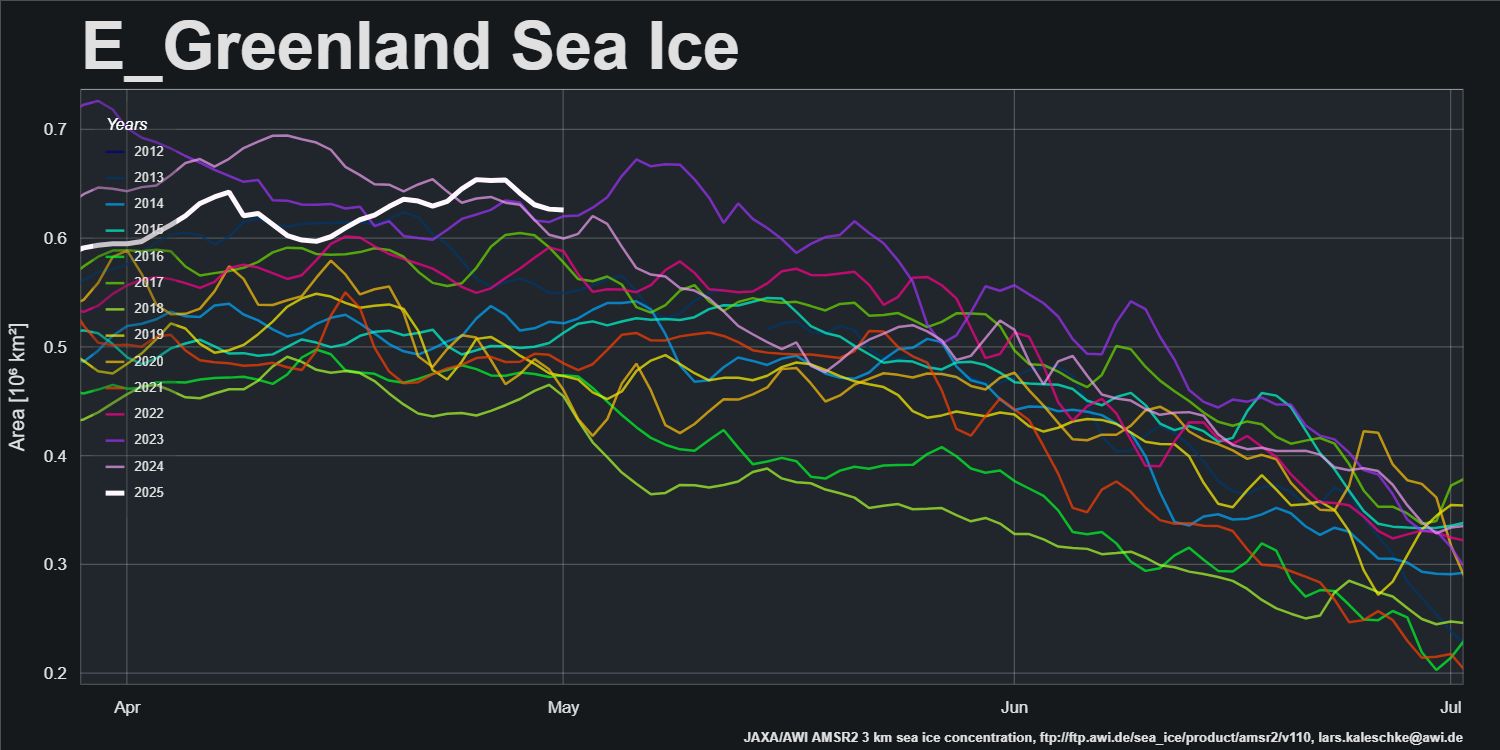
AWI’s sea ice area for the Greenland Sea is currently “highest for the date” in the AMSR2 record that started in July 2012:
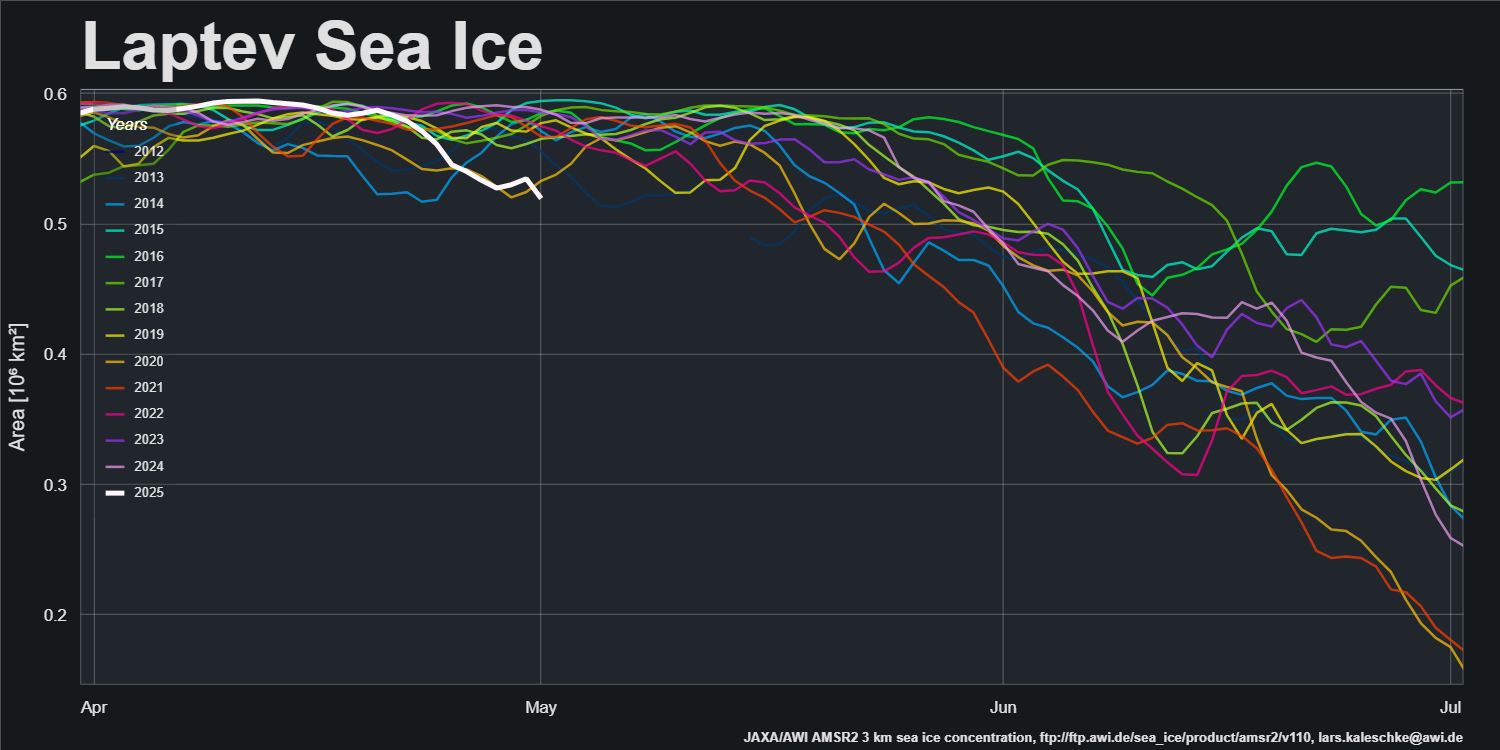
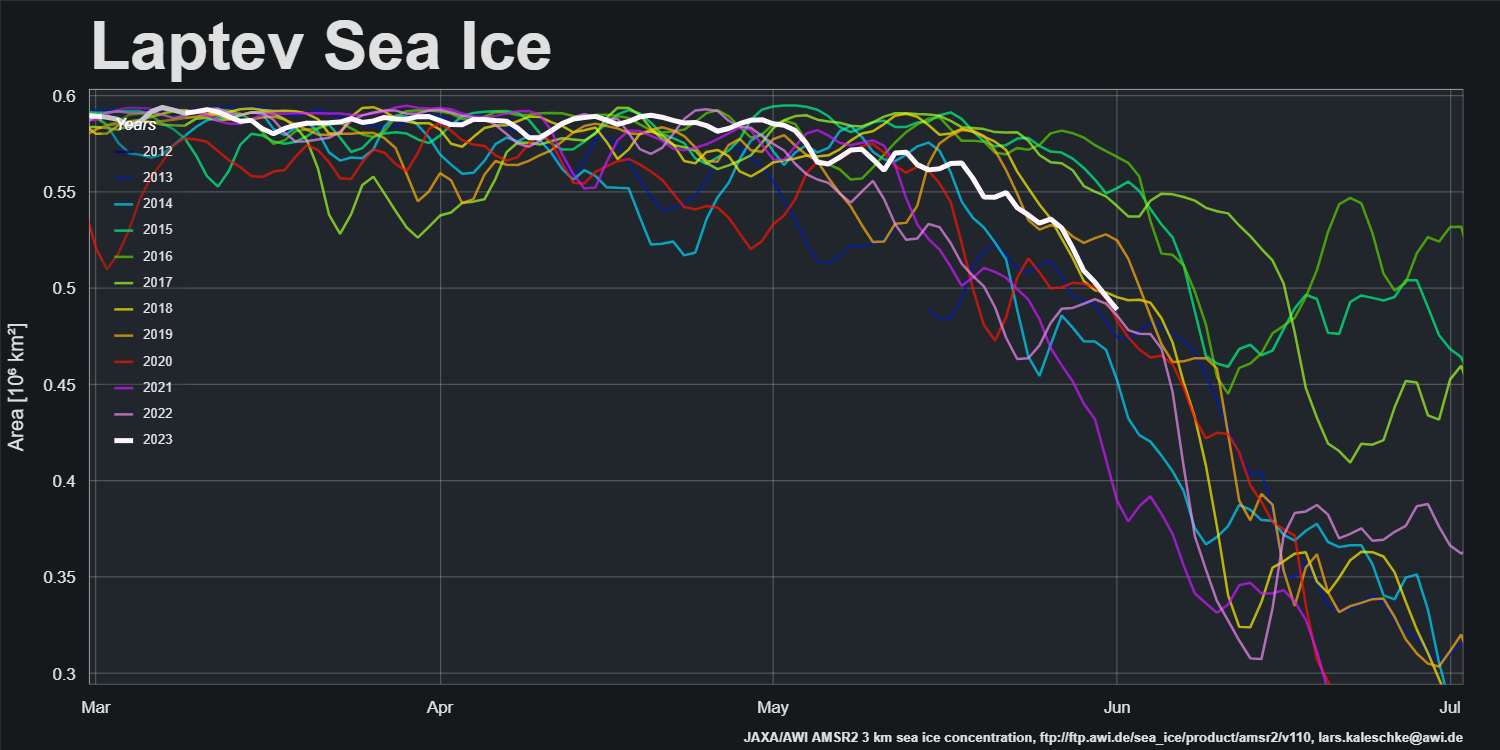
The offshore winds along the Laptev Sea coast have continued, and sea ice area is now “lowest for the date”:
The first signs of a break in the high pressure dominance are appearing. GFS currently forecasts that a low pressure area will enter the Central Arctic, bring above zero temperatures over the Kara Sea on Sunday:
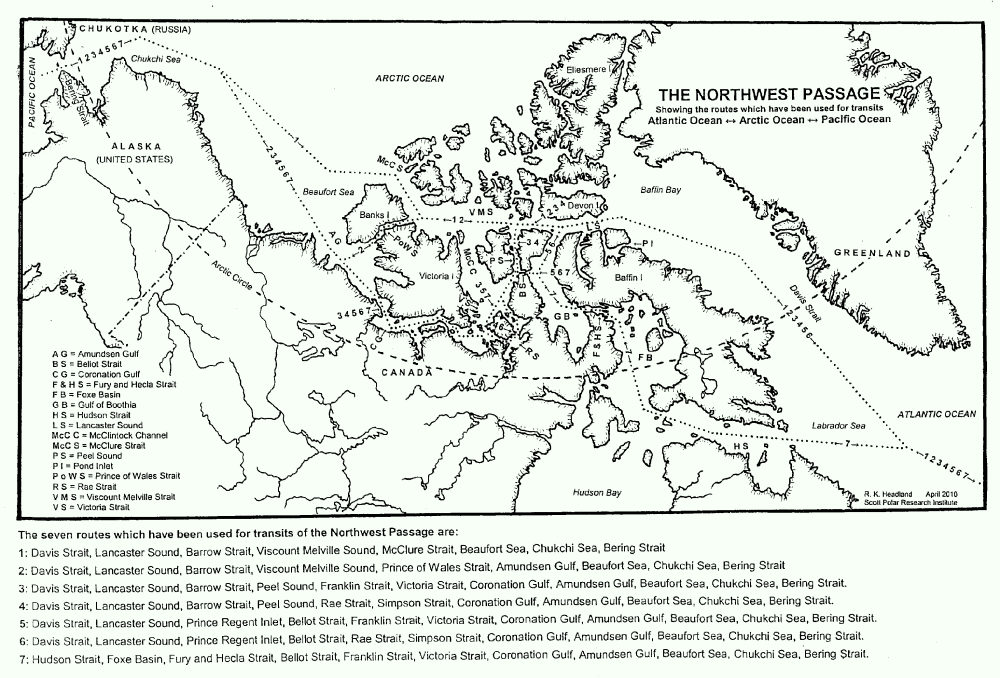
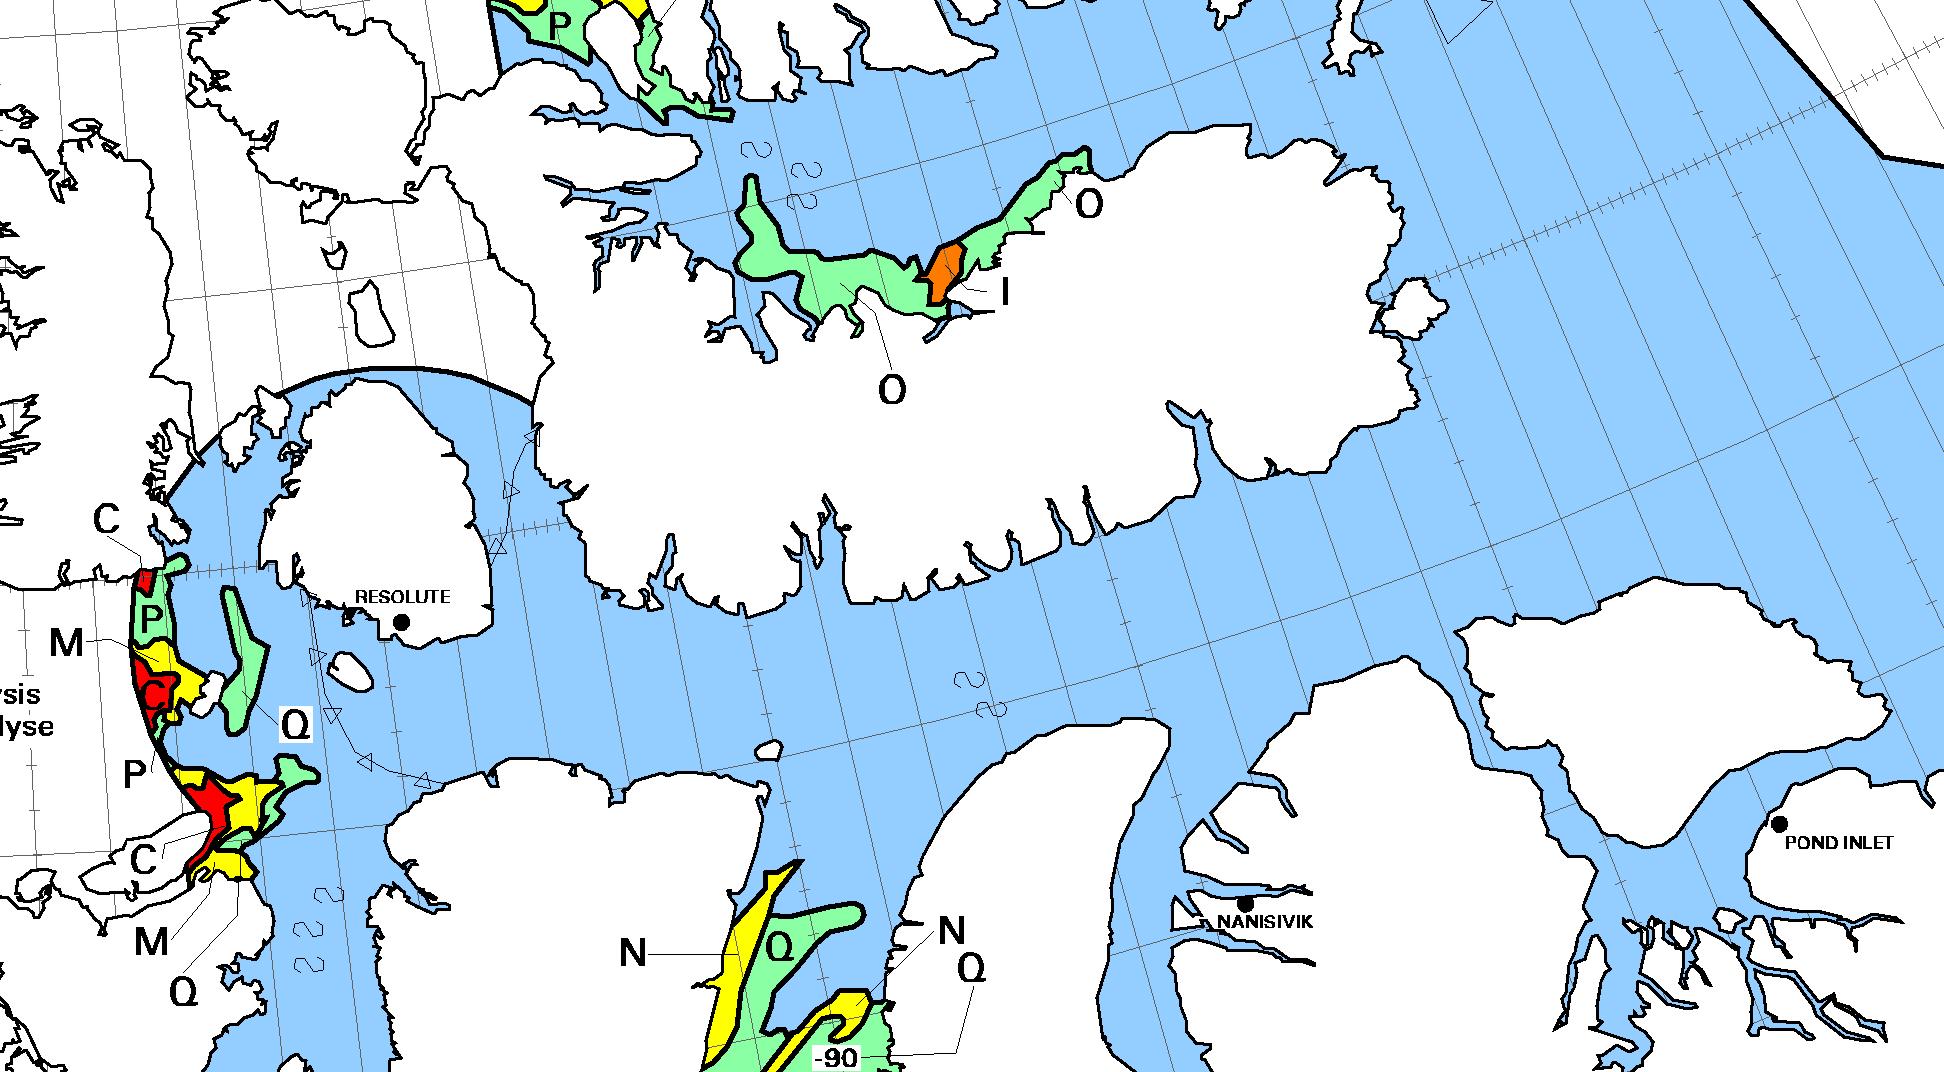
Some “pleasure craft” are currently heading up the west coast of Greenland en route to the Bering Strait via Lancaster Sound and one of the assorted routes through the Canadian Arctic Archipelago. For those of you unfamiliar with the geography of the Northwest Passage, here are couple of hopefully helpful maps:
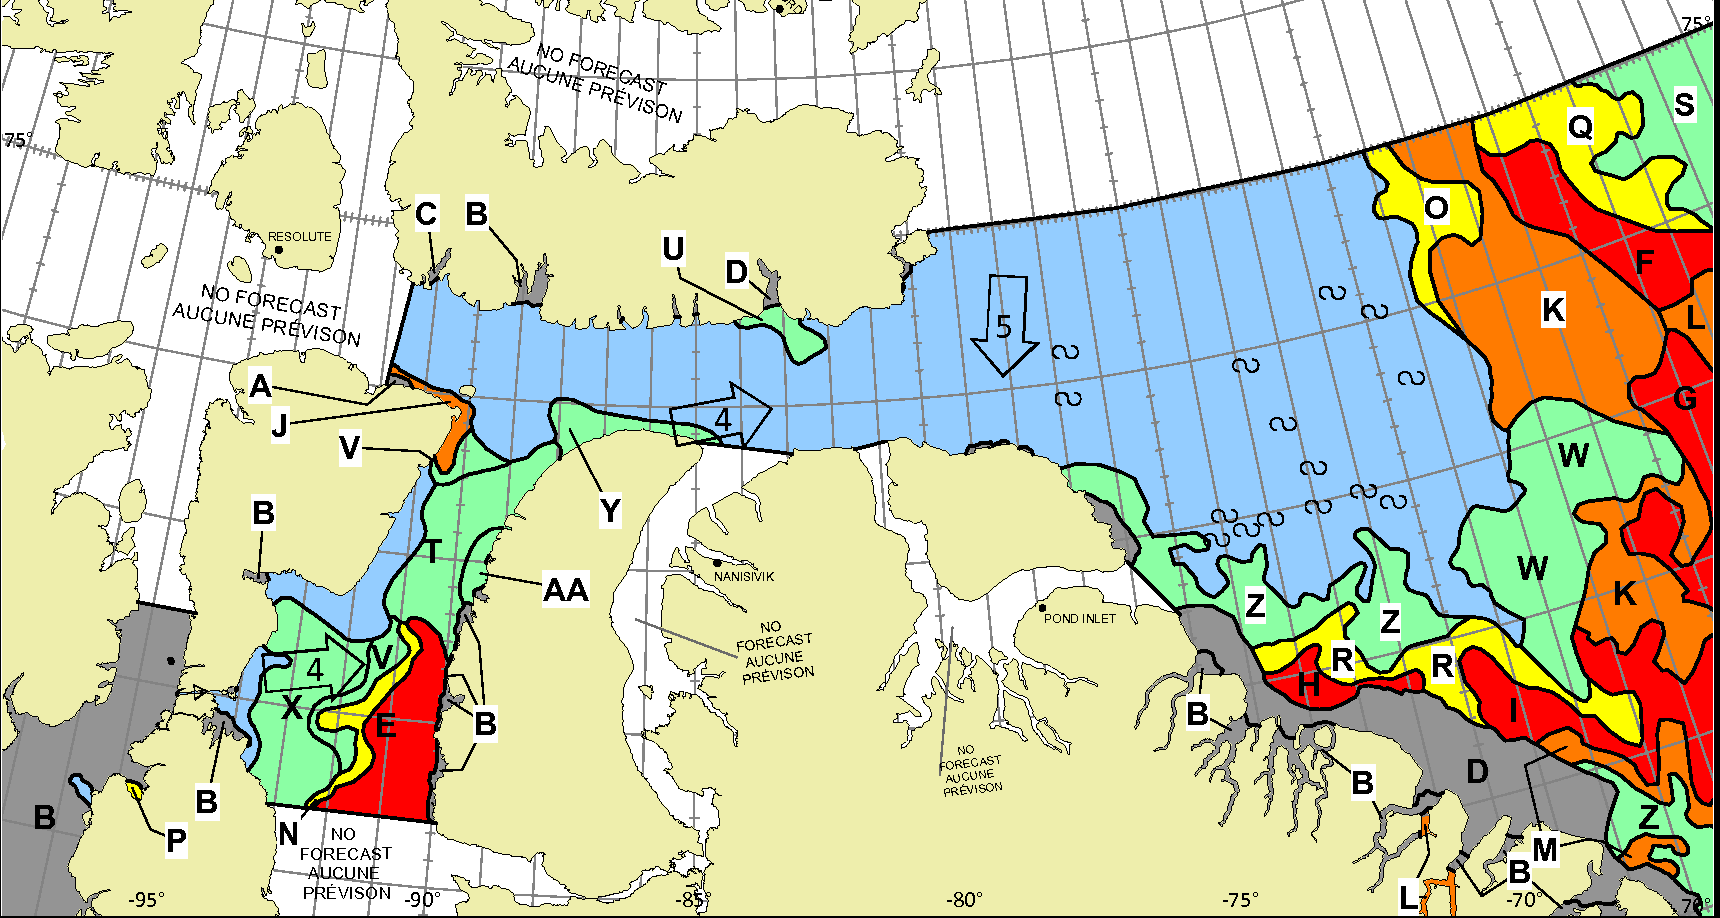
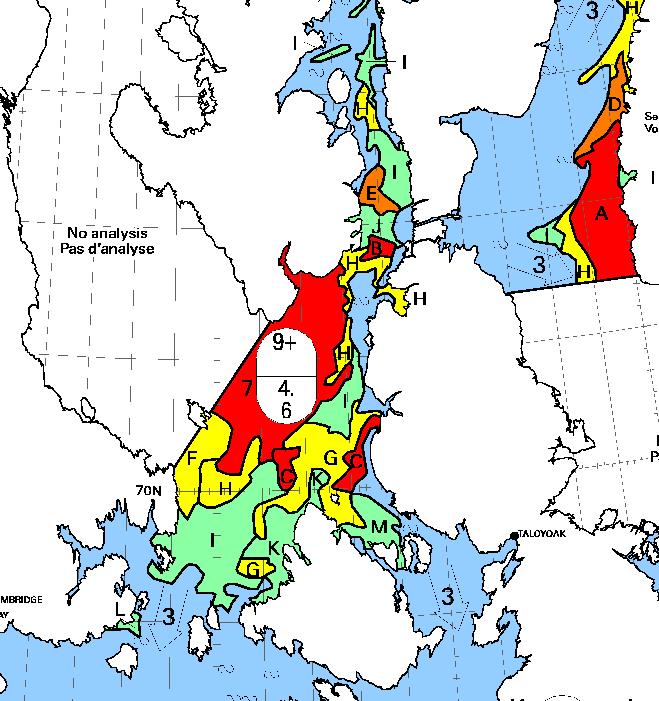
Whilst there is still ice blocking the route across Baffin Bay from Greenland, the Canadian Ice Service has already started daily coverage of the heart of the southern route through the Northwest Passage. There’s plenty of open water in Lancaster Sound and low concentration sea ice in Prince Regent Inlet:
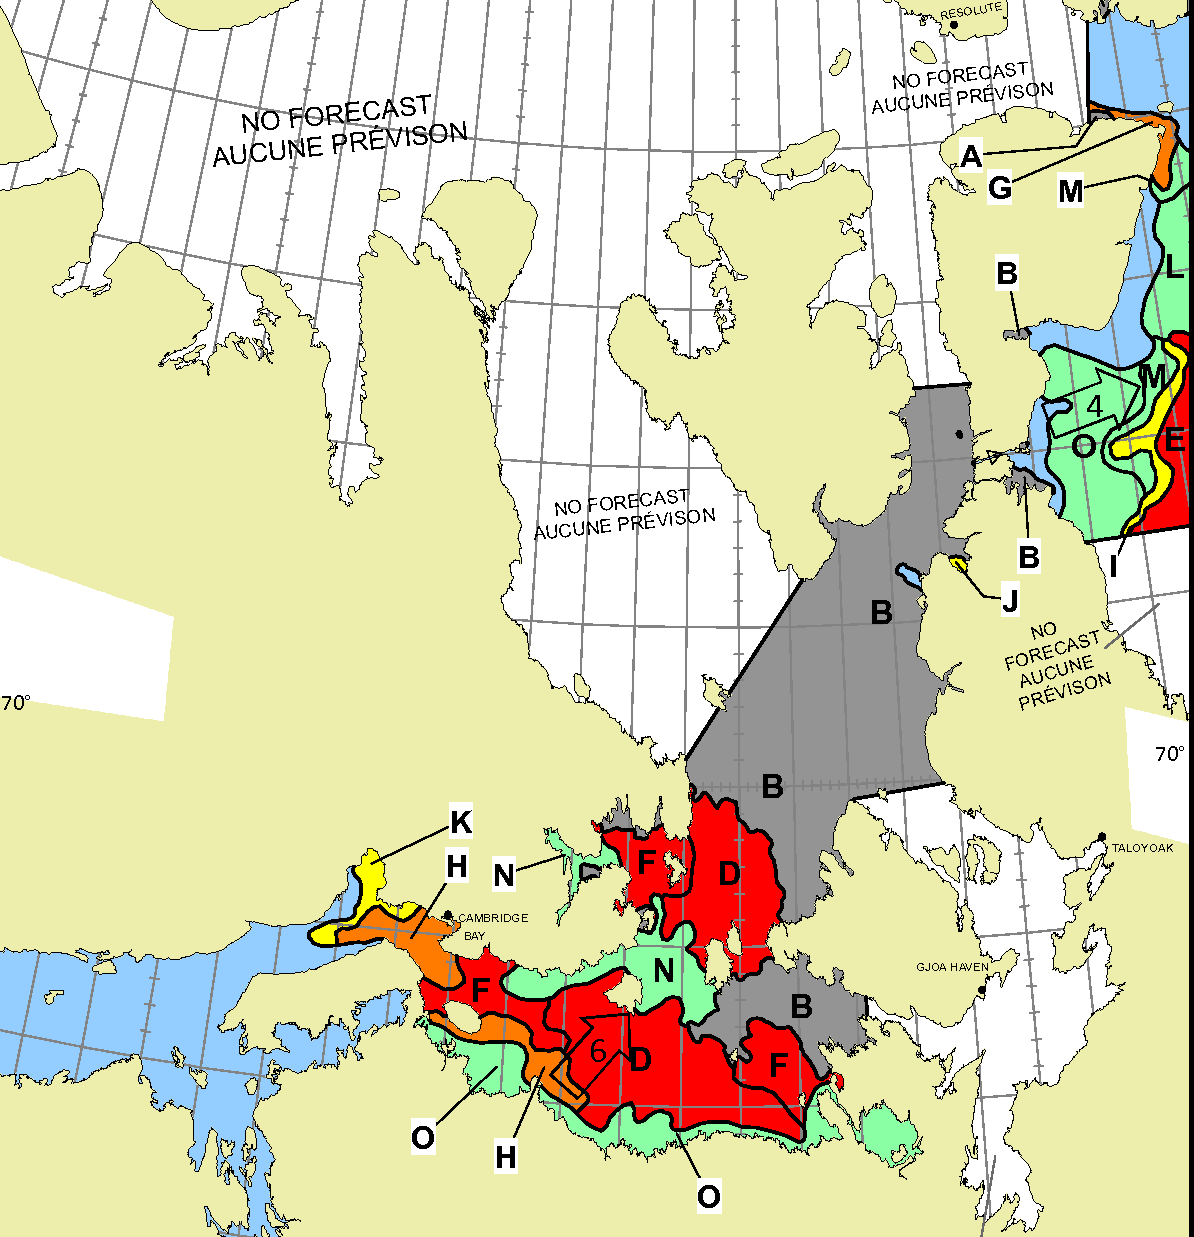
Further south there is also open water in the Coronation Gulf, but the fast ice between Peel Sound and King William Island has not yet started breaking up:
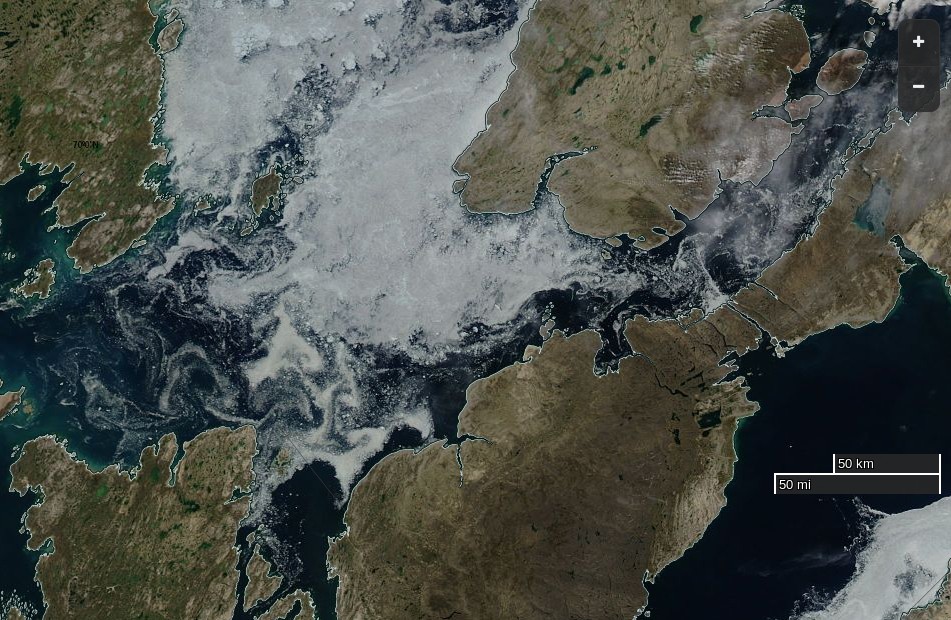
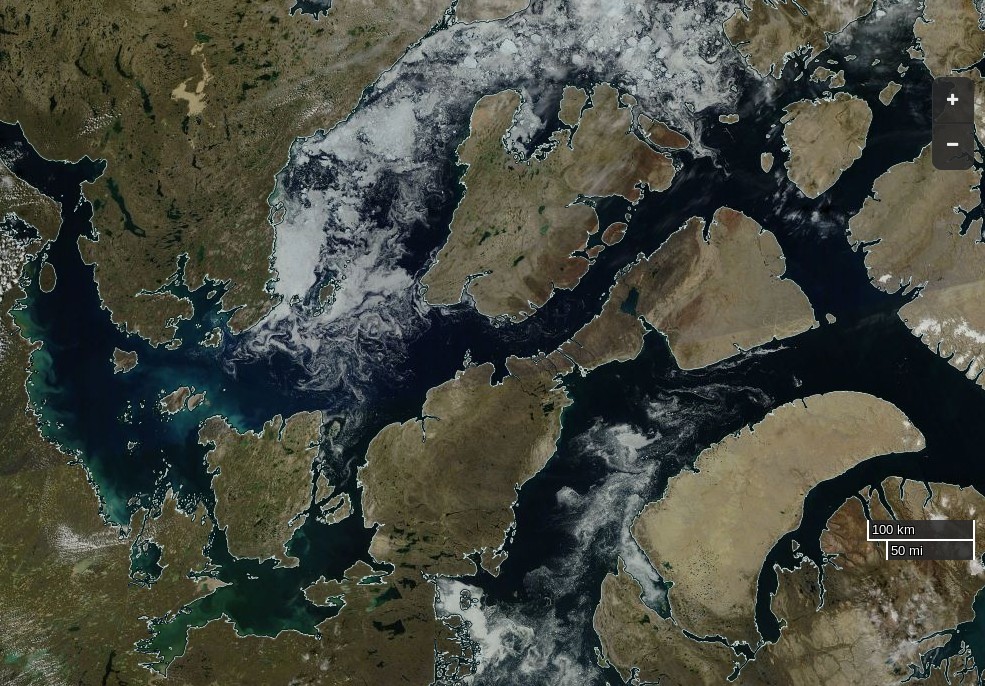
This slightly cloudy satellite image of the Canadian Arctic Archipelago also shows that the exit of the northern route via McClure Strait into the Beaufort Sea is already navigable:
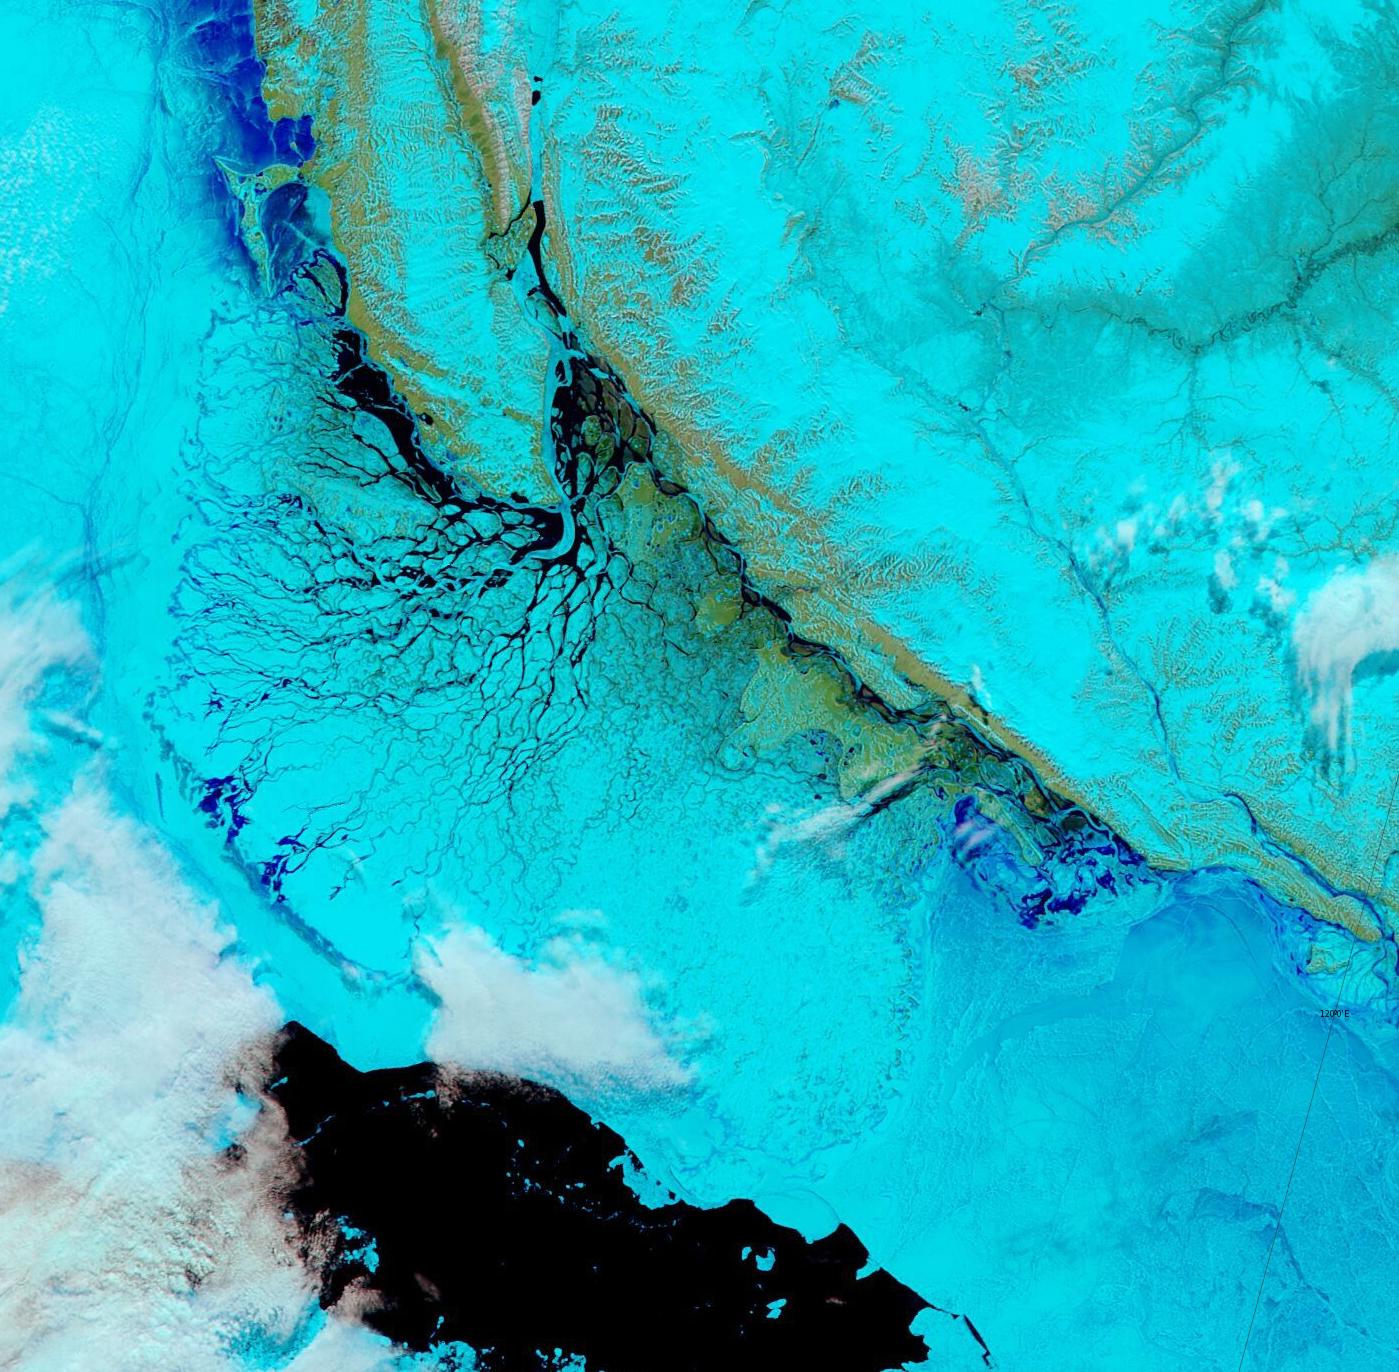
By way of a change, which is allegedly as good as a rest, let’s start the new month with a very pretty and almost cloud free “pseudo-colour” image of the Lena Delta and adjacent areas of the Laptev Sea:
“False colour” image of the Lena Delta on June 1st from the MODIS instrument on the Aqua satellite
We asked this question last year, albeit a couple of weeks later. It looks like it is if you only peruse passive microwave visualisations such as this one:
However if you were the captain of a yacht attempting to sail through the Northwest Passage this year you might well have some reservations. For example, the Barrow webcam (currently stuck on July 31st) reveals this:
Discretion being the better part of valour, in all the circumstances waiting a day or two longer before casting off might prove prudent:
[Edit – August 3rd]
Clearer skies over the Northwest Passage yesterday reveal the remaining ice:
NASA Worldview “true-color” image of Larsen Sound on August 2nd 2016, derived from the MODIS sensor on the Aqua satellite
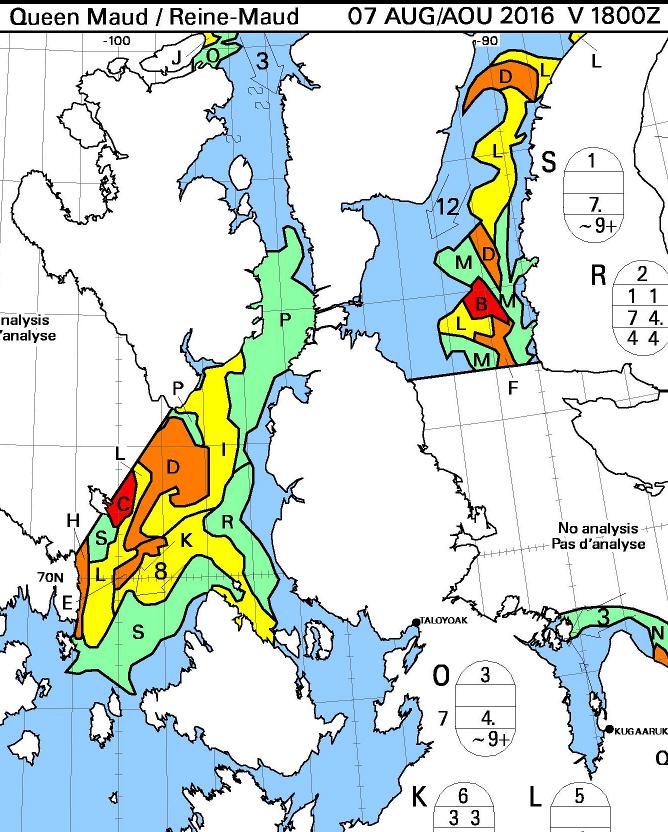
Here’s the CIS chart of the area from yesterday evening:
[Edit – August 7th]
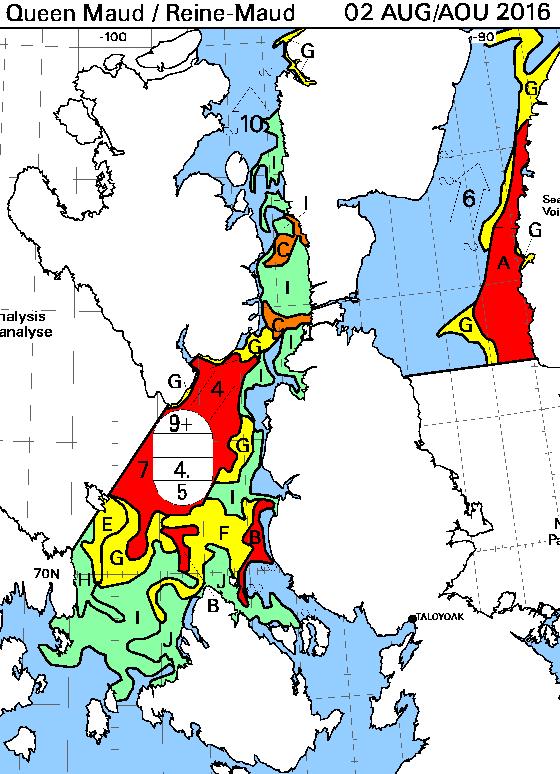
Here’s the August 7th CIS chart for the Queen Maud Gulf and points north:
Today there looks to be a route past Gjoa Havn and through Bellot Strait that doesn’t involve negotiating more than 3/10 concentration sea ice. The ice has been pushed back from Point Barrow too, so by my reckoning we can now declare one route through the Northwest Passage “open”, for the moment at least.
[Edit – August 10th]
A nice clear MODIS image of the Northwest Passage yesterday:
NASA Worldview “true-color” image of the Northwest Passage on August 9th 2016, derived from the MODIS sensor on the Terra satellite
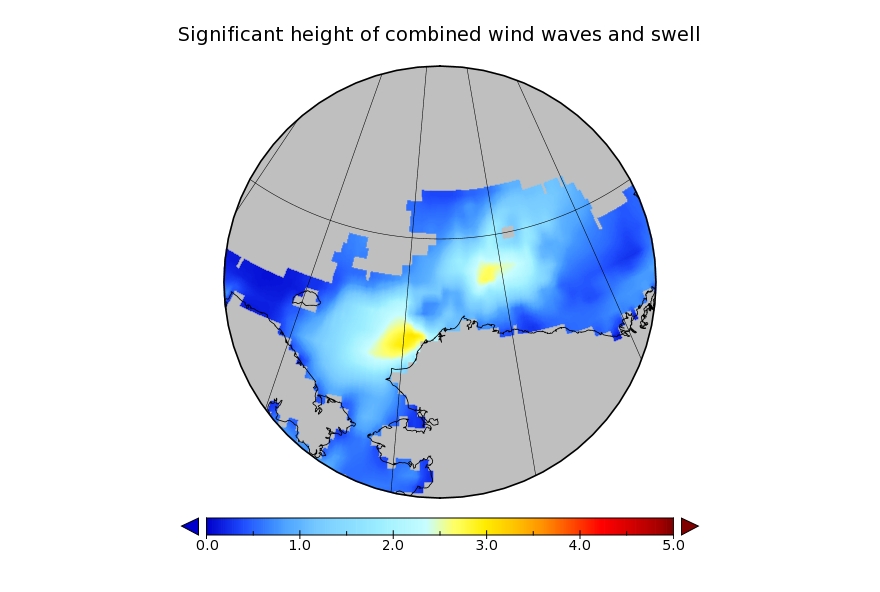
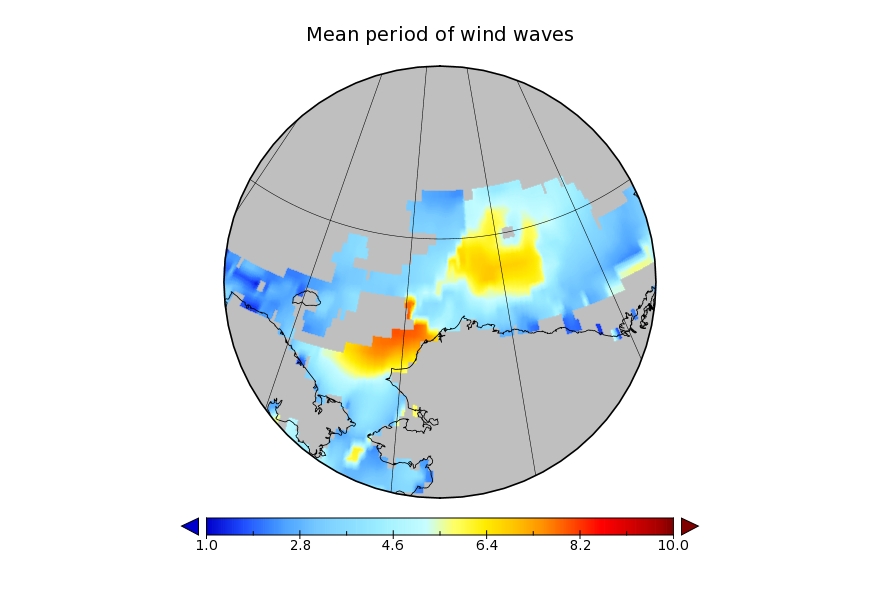
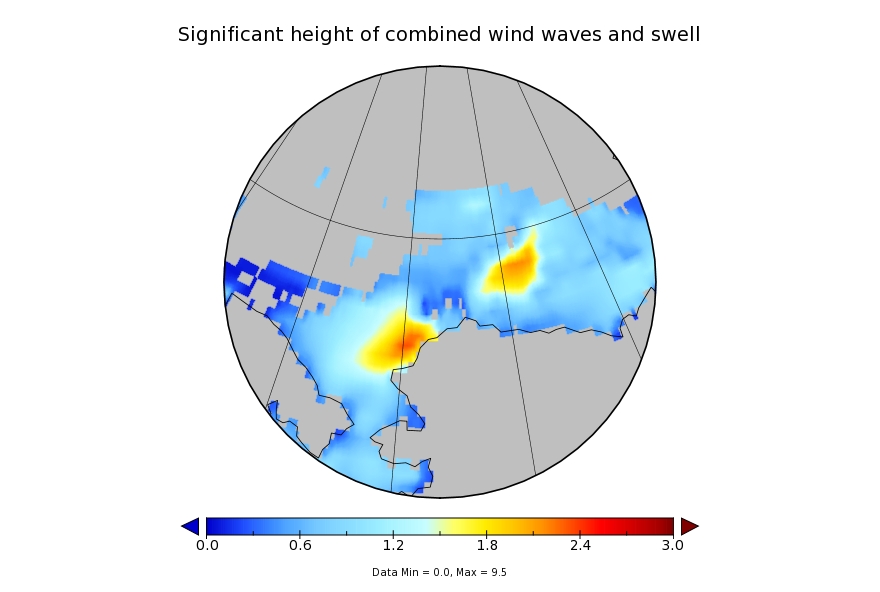
It looks like a storm is brewing in the Arctic. The long range weather forecasts for the Arctic have been remarkably unreliable recently, but this one is for a mere three days from now. WaveWatch III suggests there will be some significant waves in the Chukchi and Beaufort Seas this coming weekend, travelling in the direction of the ice edge:
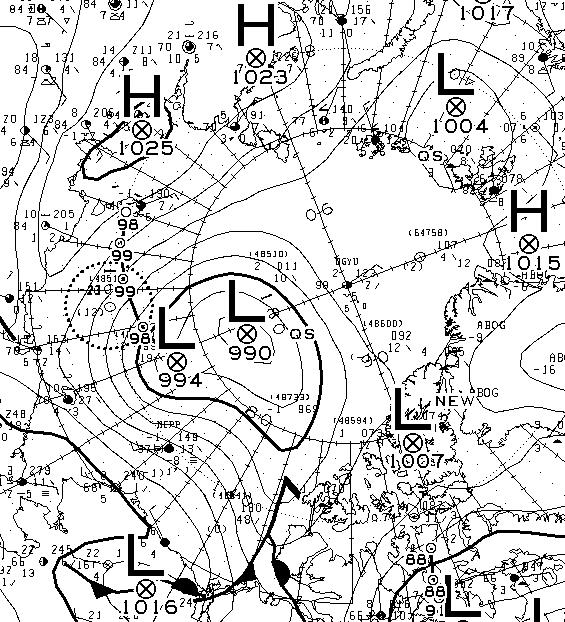
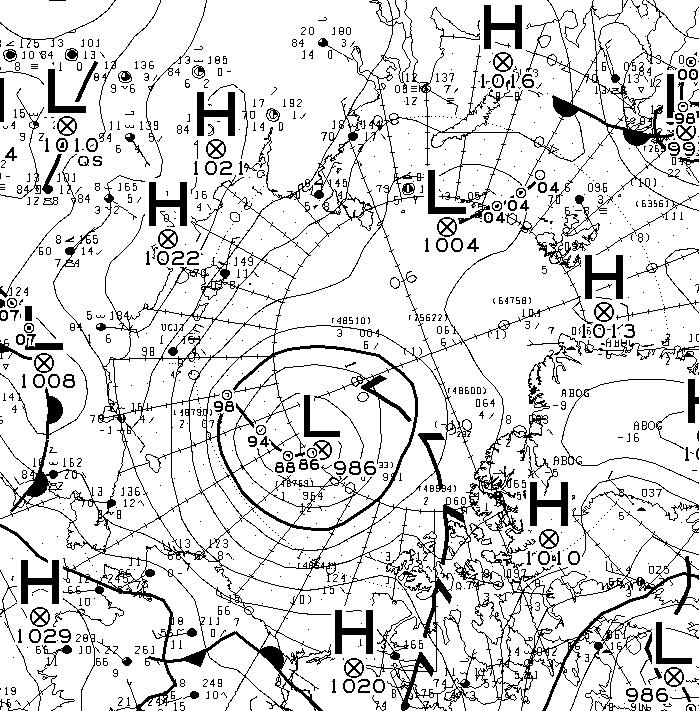
Another day has dawned, and the Environment Canada synoptic chart shows that the low pressure system currently over the Arctic has reached a central pressure of 990 hPa:
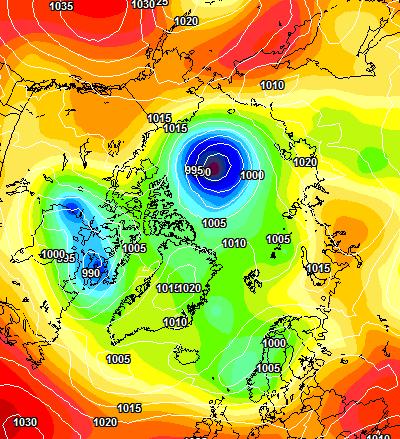
The latest ECMWF SLP forecast for tomorrow is firming up:
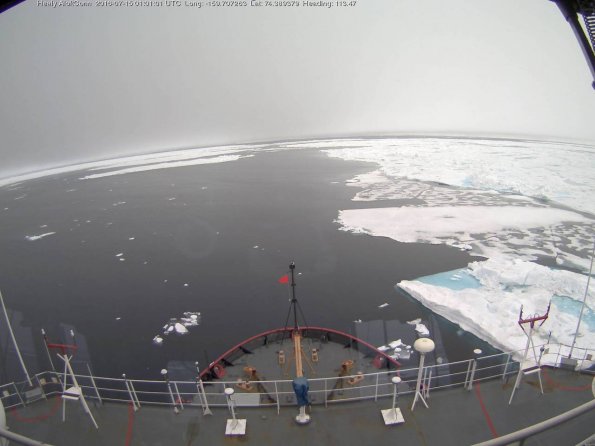
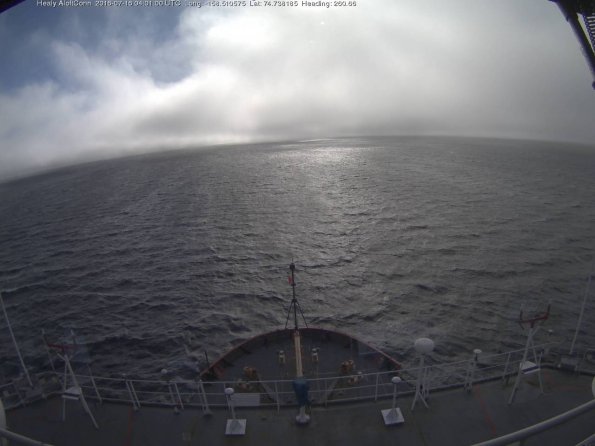
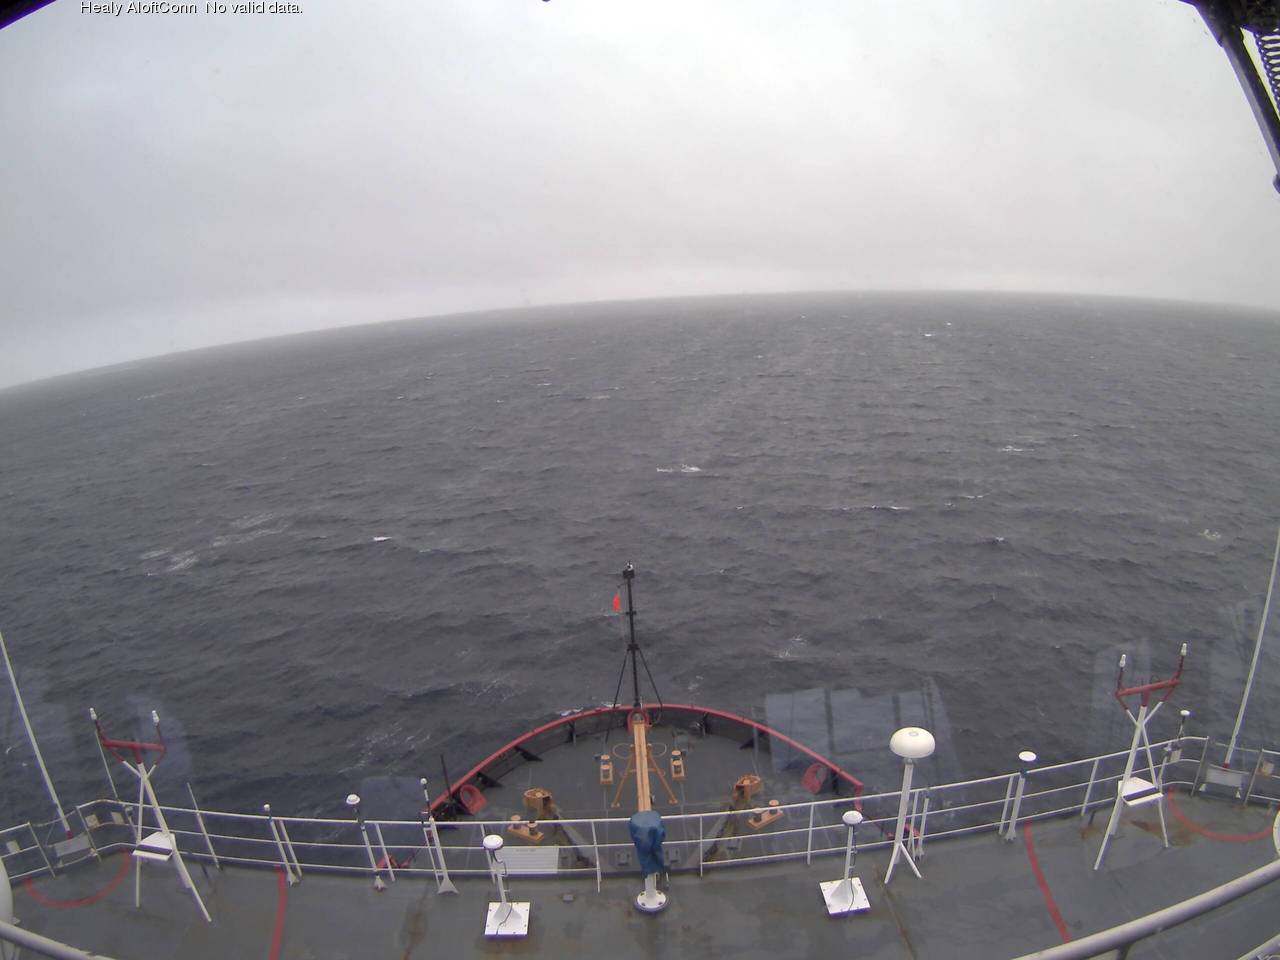
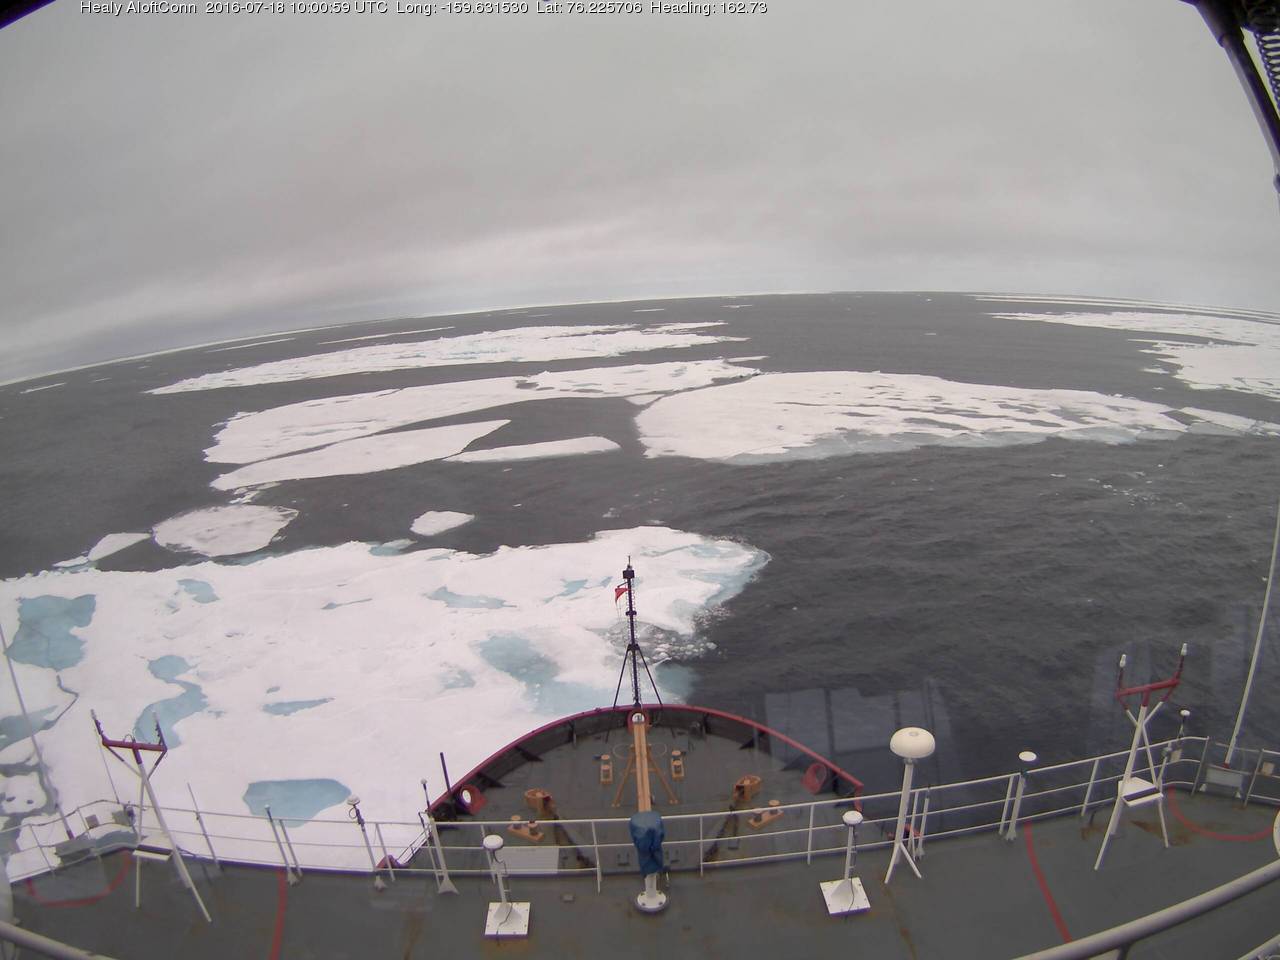
A modest swell is now visible from USCGC Healy’s “AloftCon” webcam:
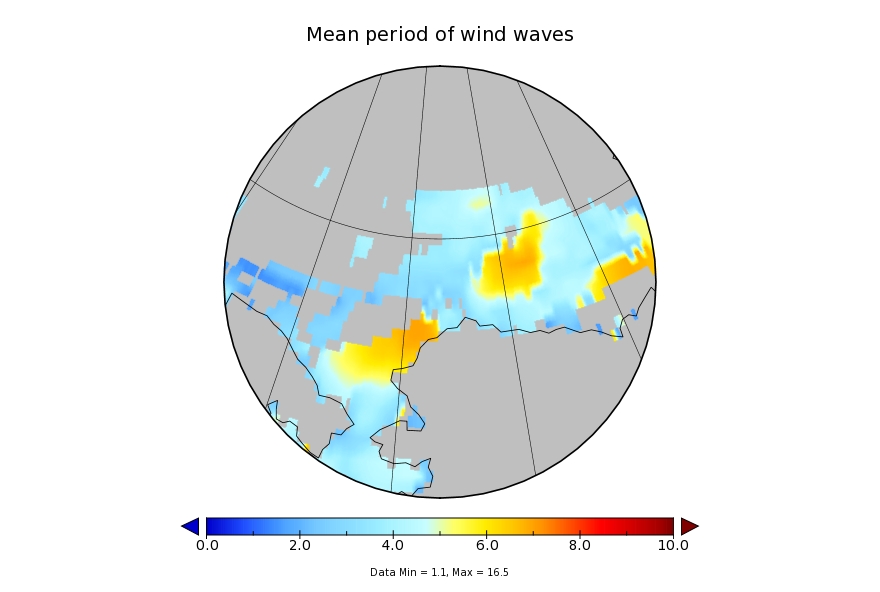
whilst the WaveWatch III forecast for tomorrow has dropped off to a significant wave height of around 2 metres with an average period of 7 seconds:
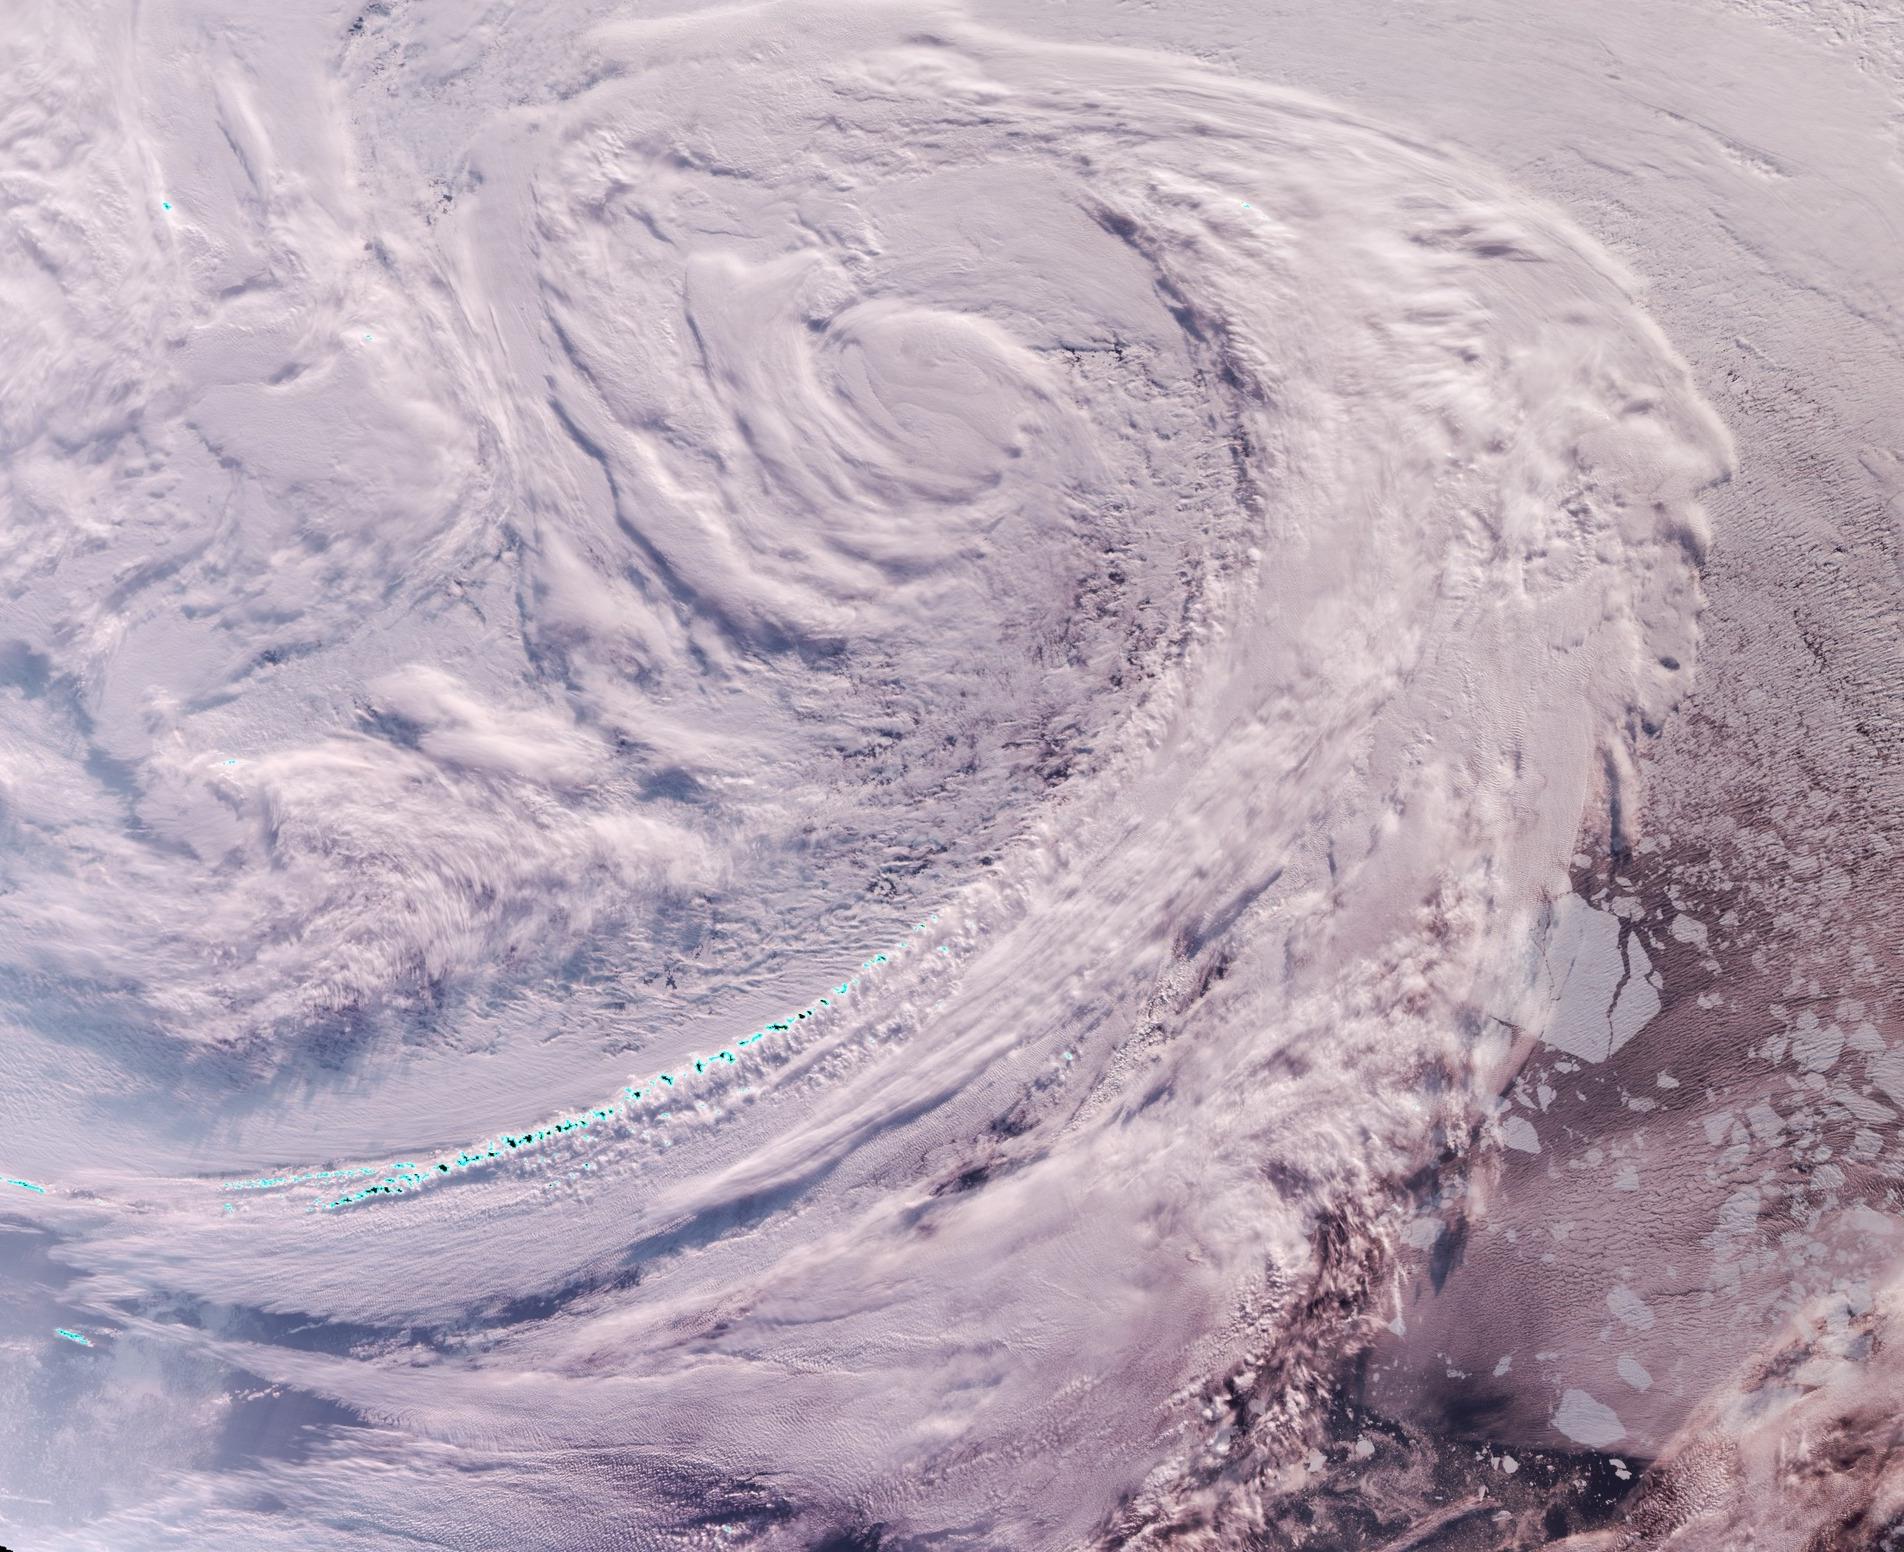
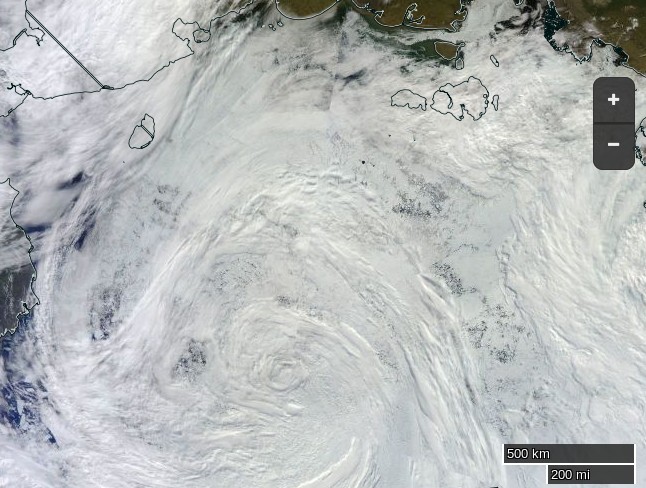
Meanwhile an image from the VIIRS instrument on the Suomi NPP satellite reveals the current storm in all its glory, together with confirmation that the “Big Block” multi-year ice floe north of Barrow has split asunder overnight:
[Edit July 17th 2016]
Sunday morning has now arrived. The storm in the Arctic looks to have bottomed out at 986 hPa central pressure. Here’s the Environment Canada synoptic chart for 00:00 this morning:
This is how the resultant swell looked from USCGC Healy at 06:00:
[Edit July 18th 2016]
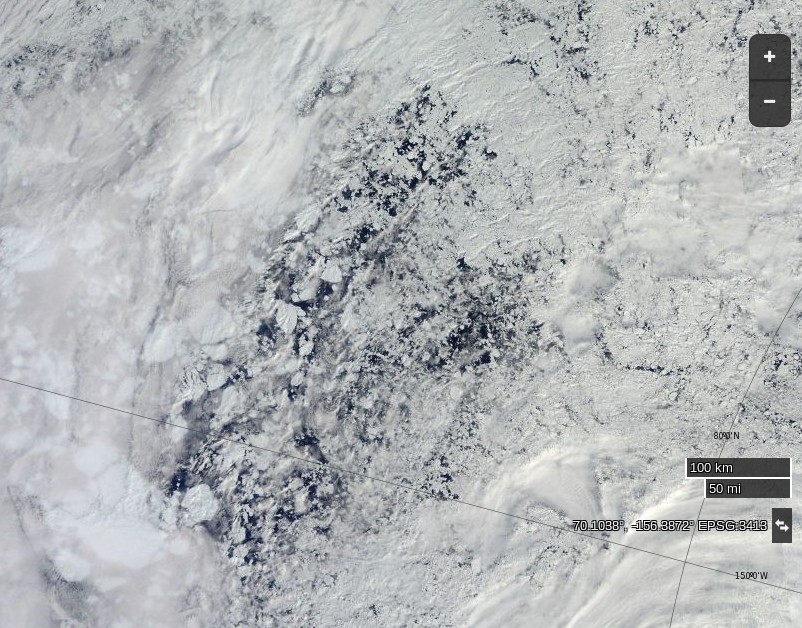
Here’s what the Beaufort and Chukchi Sea north of Barrow look like this morning through the clouds:
NASA Worldview “true-color” image of the Beaufort Sea on July 18th 2016, derived from the MODIS sensor on the Terra satellite
The remains of the now not so “Big Block” can just be made out in the bottom left. For a cloud free image here’s the latest AMSR2 passive microwave imagery of the area from the University of Hamburg:
The USCGC Healy and the remnants of the swell are in amongst the ice:
[Edit July 20th 2016]
As the remnants of the storm head off across the Canadian Arctic Archipelago here is what it has left in its wake in the Central Arctic Basin:
NASA Worldview “false-color” image of the Central Arctic Basin on July 19th 2016, derived from the MODIS sensor on the Aqua satellite
University of Hamburg AMSR2 concentration visualisation of the Central Arctic on July 19th 2016
[Edit July 21st 2016]
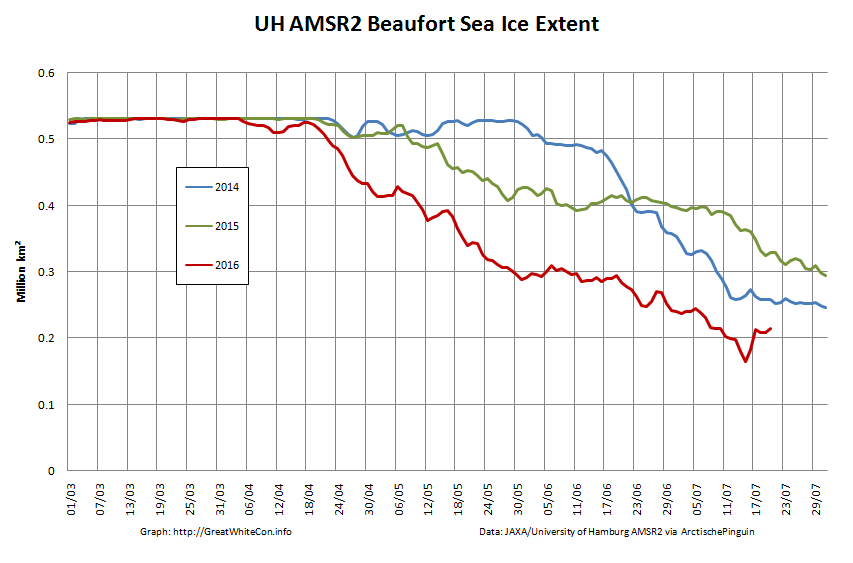
The storm has dispersed the remaining ice in the Beaufort Sea over the last few days:
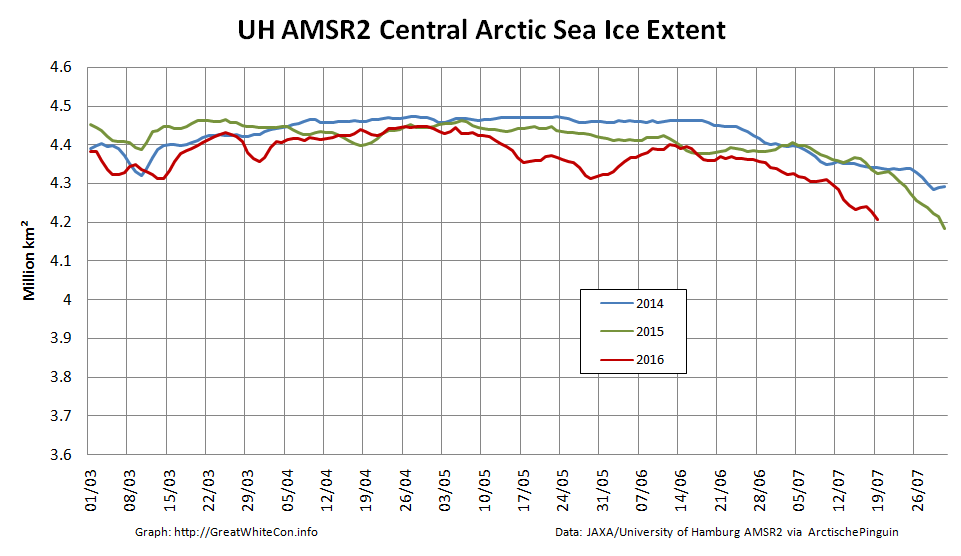
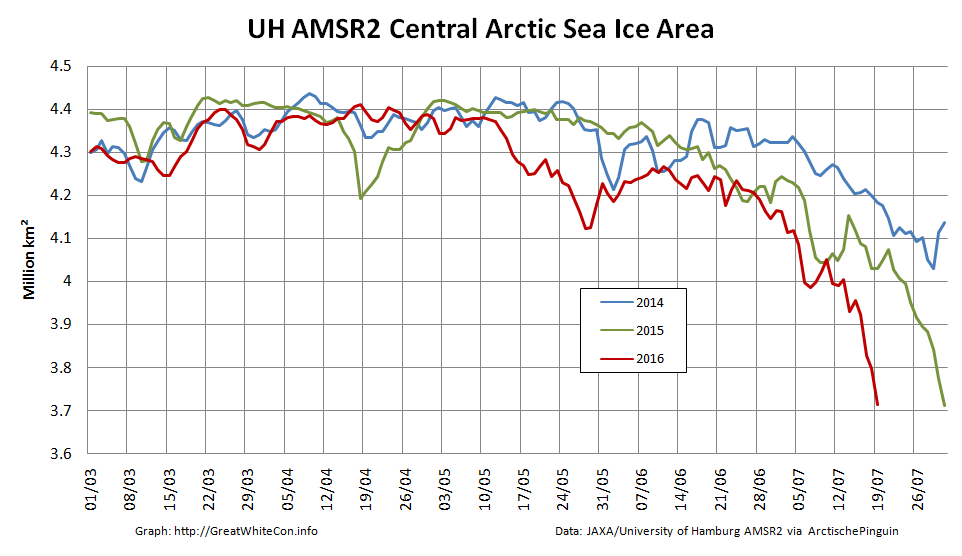
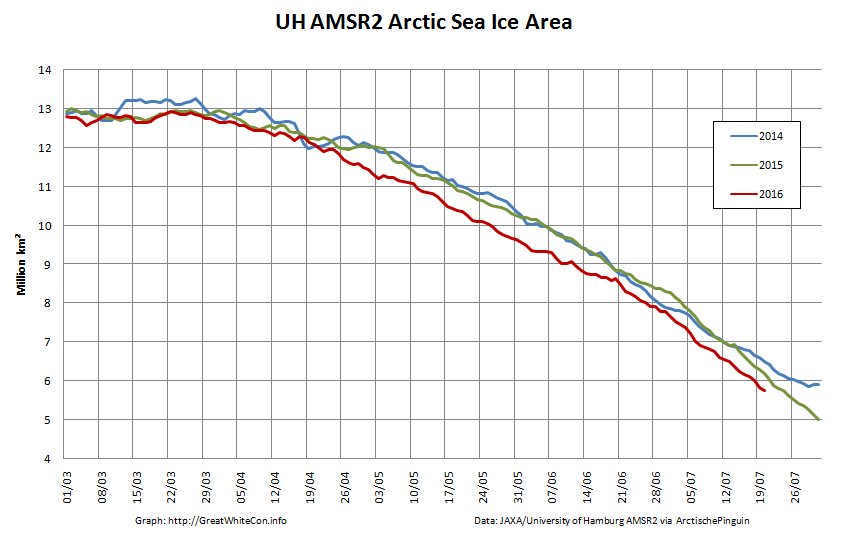
However across the Arctic as a whole sea ice area continues its downward trend:
The Zachariæ Isstrøm glacier in North East Greenland is in the news at the moment. Here’s a recent article from The Guardian for example, which states that:
A major glacier in Greenland that holds enough water to raise global sea levels by half a metre has begun to crumble into the North Atlantic Ocean, scientists say. The calving of the glacier into chunks of floating ice will set in train a rise in sea levels that will continue for decades to come, the US team warns.
“Even if we have some really cool years ahead, we think the glacier is now unstable,” said Jeremie Mouginot at the University of California, Irvine. “Now this has started, it will continue until it retreats to a ridge about 30km back which could stabilise it and perhaps slow that retreat down.”
Mouginot and his colleagues drew on 40 years of satellite data and aerial surveys to show that the enormous Zachariae Isstrom glacier began to recede three times faster from 2012, with its retreat speeding up by 125 metres per year every year until the most recent measurements in 2015.
The same records revealed that from 2002 to 2014 the area of the glacier’s floating shelf shrank by a massive 95%, according to a report in the journal Science. The glacier has now become detached from a stabilising sill and is losing ice at a rate of 4.5bn tonnes a year.
Eric Rignot, professor of Earth system science at the University of California, Irvine, said that the glacier was “being hit from above and below”, with rising air temperatures driving melting at the top of the glacier, and its underside being eroded away by ocean currents that are warmer now than in the past.
“The glacier is now breaking into bits and pieces and retreating into deeper ground,” he said. The rapid retreat is expected to continue for 20 to 30 more years, until the glacier reaches another natural ledge that slows it down.
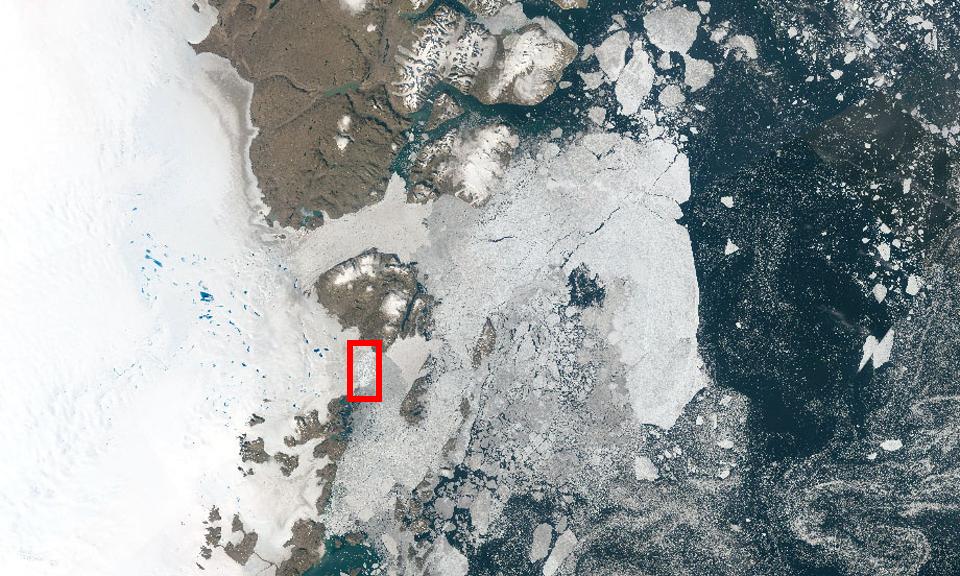
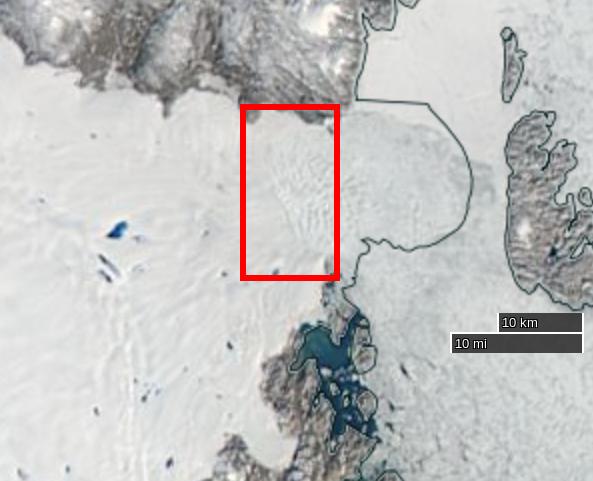
The Guardian article includes a picture of Zachariæ Isstrøm, along with much of the rest of North East Greenland. Here it is again, together with a helpful annotation revealing the location of the calving face of Zachariæ Isstrøm in amongst all the snow and ice:
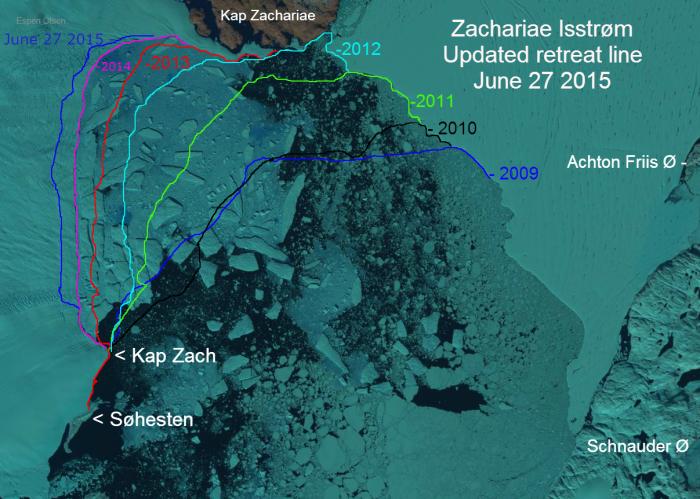
That’s still not really much help when it comes to visualising the “retreat speeding up by 125 metres per year”, so here’s a closer look at Zachariae Isstrom using an image prepared by Espen Olsen for the Arctic Sea Ice Forum, which is based on a Landsat 8 satellite image from September 2014:
Retreat of the calving face of the Zachariae Isstrøm glacier between 2009 and 2015
North East Greenland is in the dark at the moment, but if you want to take a closer look at recent changes to Zachariæ Isstrøm for yourself you can do so with the aid of NASA’s EOSDIS Worldview web site, which allows you to scroll through images from both the Aqua and Terra satellites. Here’s one from August 26th 2015:
NASA Worldview “true-color” image of the Zachariae Isstrøm glacier on August 26th 2015, derived from the MODIS sensor on the Aqua satellite
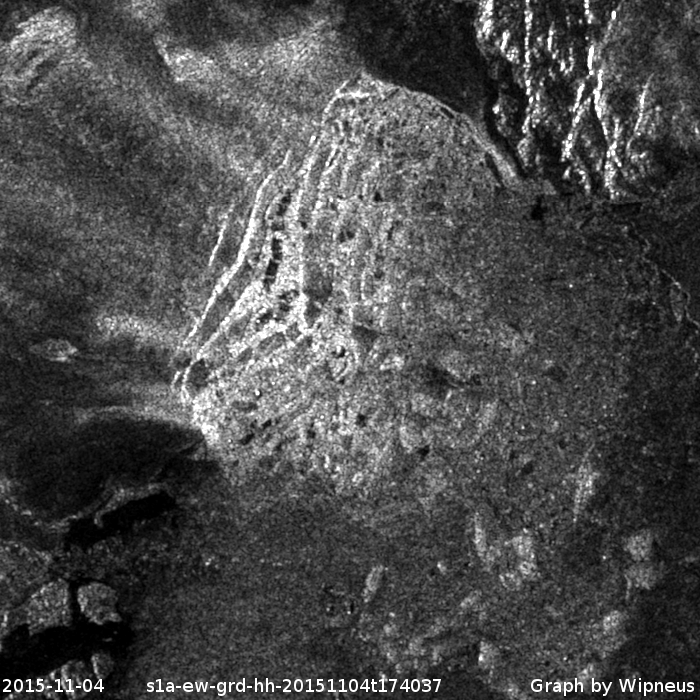
Our headline for today announces that yet another large chunk of ice has just detached itself from Zachariæ Isstrøm. You may wonder how we can be so sure of that when it’s dark in North East Greenland? That’s because yet another satellite can “see” in the dark, using synthetic aperture radar. Here’s an animation prepared earlier today by “Wipneus” using data from the European Space Agency’s Sentinel 1A satellite, once again for the Arctic Sea Ice Forum:
Animated comparison of Sentinel 1A visualisations of the Zachariae Isstrøm calving face on 4th and 16th November 2015
Can you spot “The new iceberg [that] seems to lie on its side”?
The conclusion to all this frantic activity, according to Mouginot, Rignot et al. at least, is that:
The Zachariæ Isstrøm / Nioghalvfjerdsfjorden sector is one of three major marine-based basins in Greenland along with the Jakobshavn Isbræ and Petermann–Humboldt glaciers, each holding a 0.6-m sea-level equivalent. Jakobshavn Isbræ started a rapid retreat (18 km in 2001-2015) following the collapse of its ice shelf and has undergone massive calving events since 2010. The central channel of the Petermann ice shelf lost 250 m of ice in 2002-2010, and the ice front retreated 33 km in 2010-2012. The Nioghalvfjerdsfjorden ice shelf will become vulnerable to break up in the near future if thinning continues. These observations combined suggest that all three major marine-based basins are undergoing significant changes at present. Jakobshavn Isbræ and Zachariæ Isstrøm have already transitioned to tidewater glacier regime, with increased calf-ice production and ice melting by the ocean. The retreat of these marine-based sectors is likely to increase sea-level rise from Greenland for decades to come.
Both of the last two years, temperatures stayed below normal for the entire melt season.
The below normal summer temperatures are keeping the ice from melting, and have led to a large expansion in the amount of thick multi-year ice.
However the Arctic is unfortunately failing to cooperate with that narrative. Today we are unhappy to report that Tony Heller‘s favourite Arctic sea ice metric, the Danish Meteorological Institute 30% threshold extent, is at the lowest level ever for the date since their records began:
As if that wasn’t enough to be going on with, some big holes have already appeared in the middle of the supposedly multi-meter thick, multi-year sea ice in the Beaufort Sea, well away from the open water already warming up off the Mackenzie Delta:
NASA Worldview “true-color” image of The Beaufort Sea on May 11th, derived from bands 1, 4 and 3 of the MODIS sensor on the Aqua satellite
Whilst a variety of climate change “skeptics” have been pointing out recently that the April 2014 edition of the National Snow and Ice Data Center’s Arctic Sea Ice News mentioned that:
A large area of the multiyear ice has drifted to the southern Beaufort Sea and East Siberian Sea
There is a lot of thick ice in the western Arctic, which will be difficult to melt this summer.
they glossed over the bit where the NSIDC added:
Where warm conditions are likely to exist later in the year.
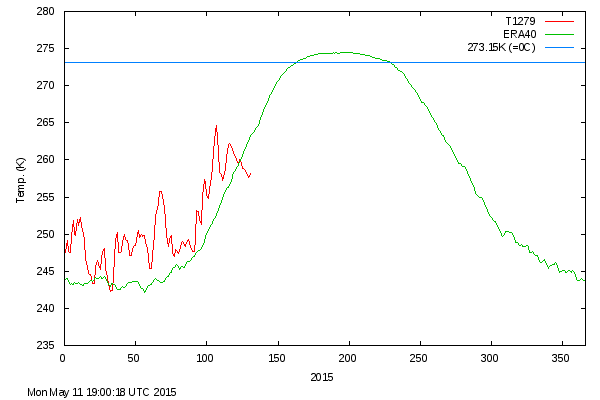
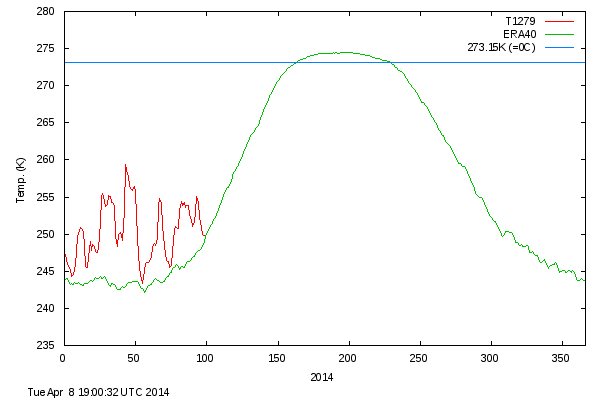
In fact conditions have been very warm (relatively speaking!) in the Arctic for all of 2014 so far. The DMI daily mean temperature of the Arctic area north of the 80th northern parallel has never dropped below the long term average all winter:
DMI mean temperature north of the 80th northern parallel, on April 8th 2014
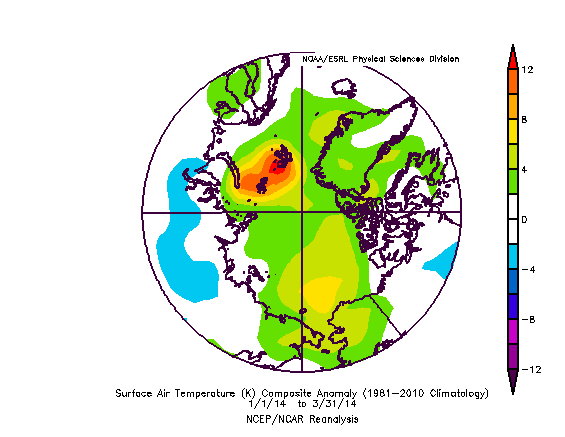
and the surface air temperature anomaly chart for the Arctic for the first three months of 2014 looks like this:
Arctic surface air temperature anomaly plot for January to March 2014
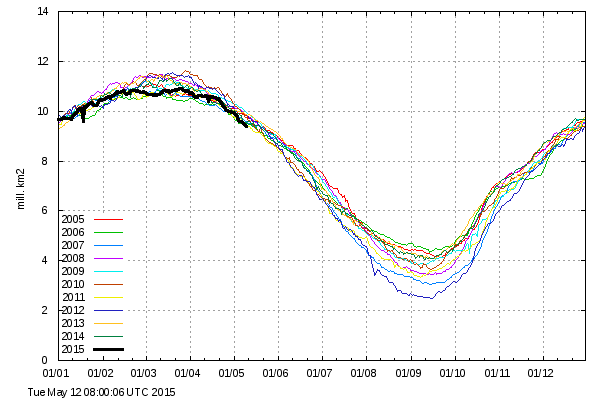
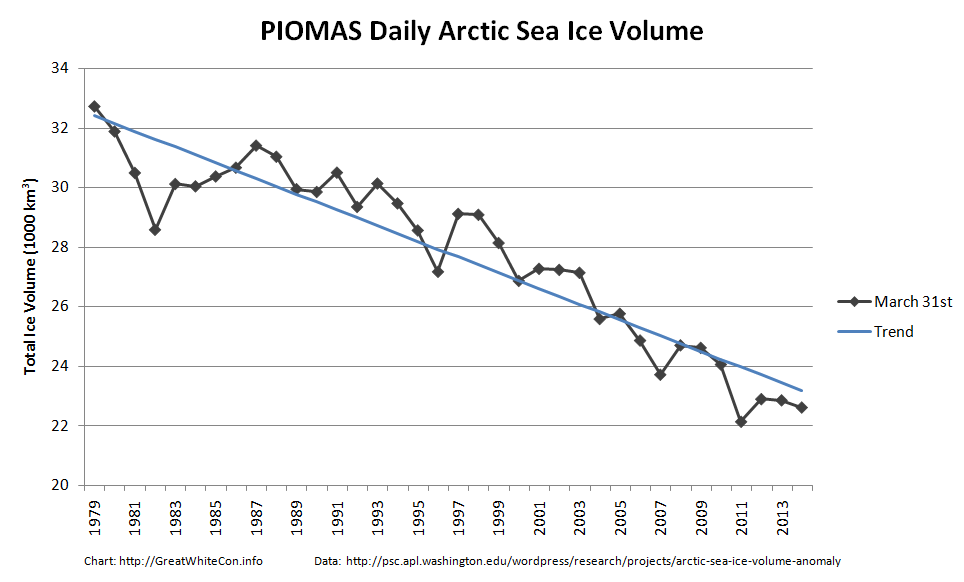
Those anomalously warm temperatures may well have something to do with the fact that the latest PIOMAS Arctic sea ice volume estimates which have just been released reveal this:
PIOMAS arctic sea ice volume on March 31st from 1979-2014
As you can see, according to the PIOMAS model at least, Arctic sea ice volume has now reached the second lowest level for the date since the satellite record began.
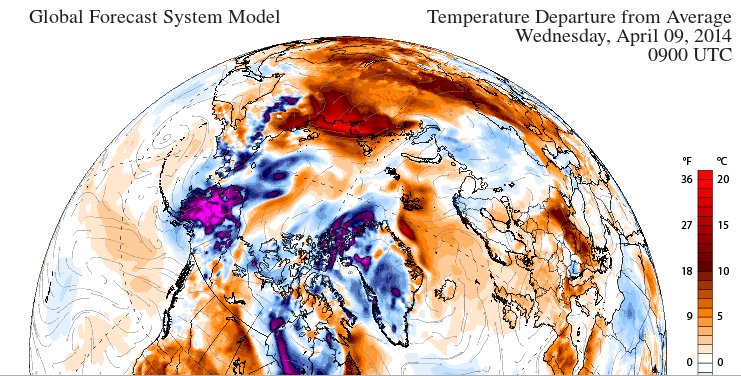
Whilst the skeptics have been complaining about the amount of ice on the Great Lakes of North America they seem to have somehow failed to notice the anomalously low coverage of snow over Siberia. Here’s the surface air temperature anomaly forecast for the northern hemisphere tomorrow:
GFS 2m temperature anomaly forecast for 09:00 UTC on April 9th 2014
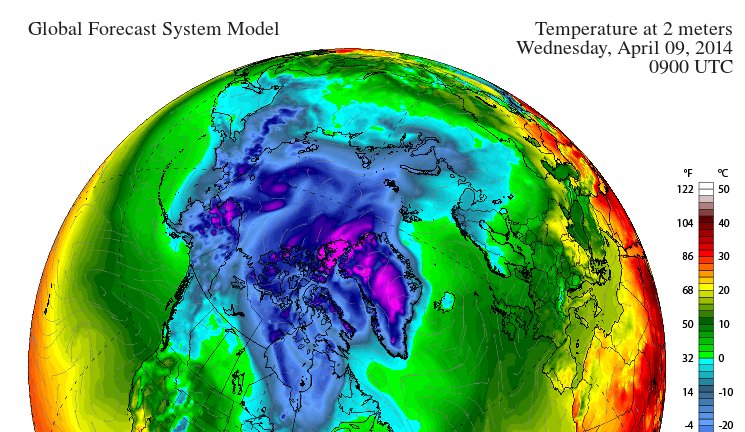
Do you see the bright red patch over the coast of the Laptev Sea, indicating temperatures 20 degrees Celsius above normal? Now take a look at a similar chart, but of the surface air temperatures themselves:
GFS 2m temperature forecast for 09:00 UTC on April 9th 2014
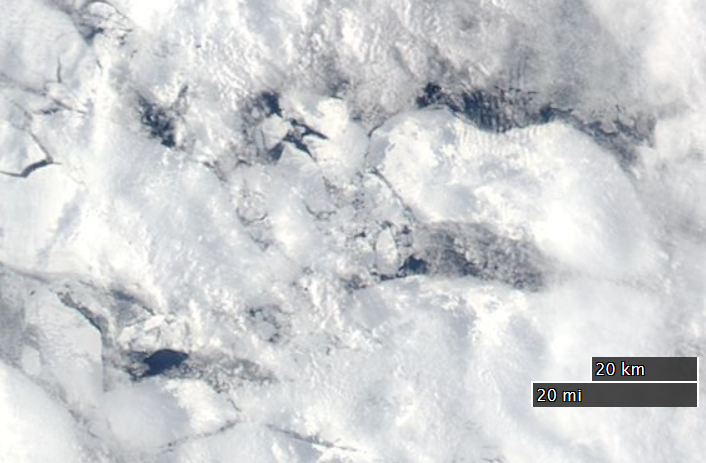
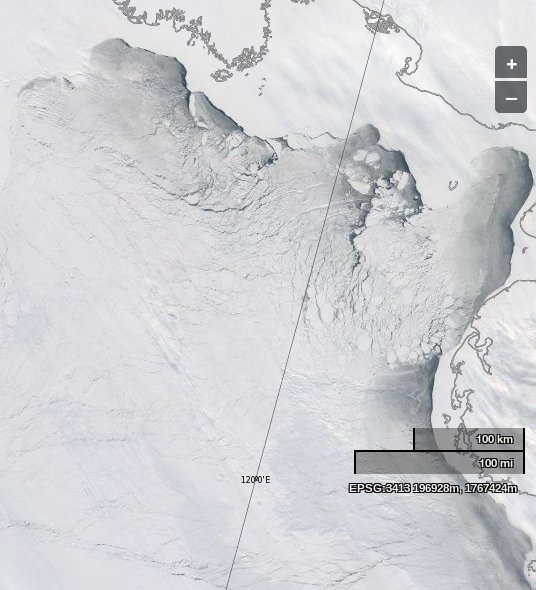
That reveals that the temperatures over the edge of the Laptev Sea are forecast to be above the freezing point of fresh water tomorrow. Just in case you’re wondering what the shores of the Laptev Sea look like at the moment, here’s a picture we recorded earlier today, courtesy of NASA Worldview and the MODIS sensor on the Aqua satellite:
The Laptev Sea as seen by the Aqua satellite on April 8th 2014
What do you suppose the same area will look like in a day or two’s time, or in a month or two’s time for that matter?
The ice off “Russia’s northern shores” today. (Click image for a larger version)
The ice off “Russia’s northern shores” as seen by the Aqua satellite on Saturday September 21st 2013. This is a pseudo-colour image based on MODIS bands 1, 2 and 7. The image was obtained via NASA Worldview.
This website uses cookies to improve your experience. We'll assume you're ok with this, but you can opt-out if you wish. Cookie settingsACCEPT
Privacy & Cookies Policy
Privacy Overview
This website uses cookies to improve your experience while you navigate through the website. Out of these, the cookies that are categorized as necessary are stored on your browser as they are essential for the working of basic functionalities of the website. We also use third-party cookies that help us analyze and understand how you use this website. These cookies will be stored in your browser only with your consent. You also have the option to opt-out of these cookies. But opting out of some of these cookies may affect your browsing experience.
Necessary cookies are absolutely essential for the website to function properly. This category only includes cookies that ensures basic functionalities and security features of the website. These cookies do not store any personal information.
Any cookies that may not be particularly necessary for the website to function and is used specifically to collect user personal data via analytics, ads, other embedded contents are termed as non-necessary cookies. It is mandatory to procure user consent prior to running these cookies on your website.