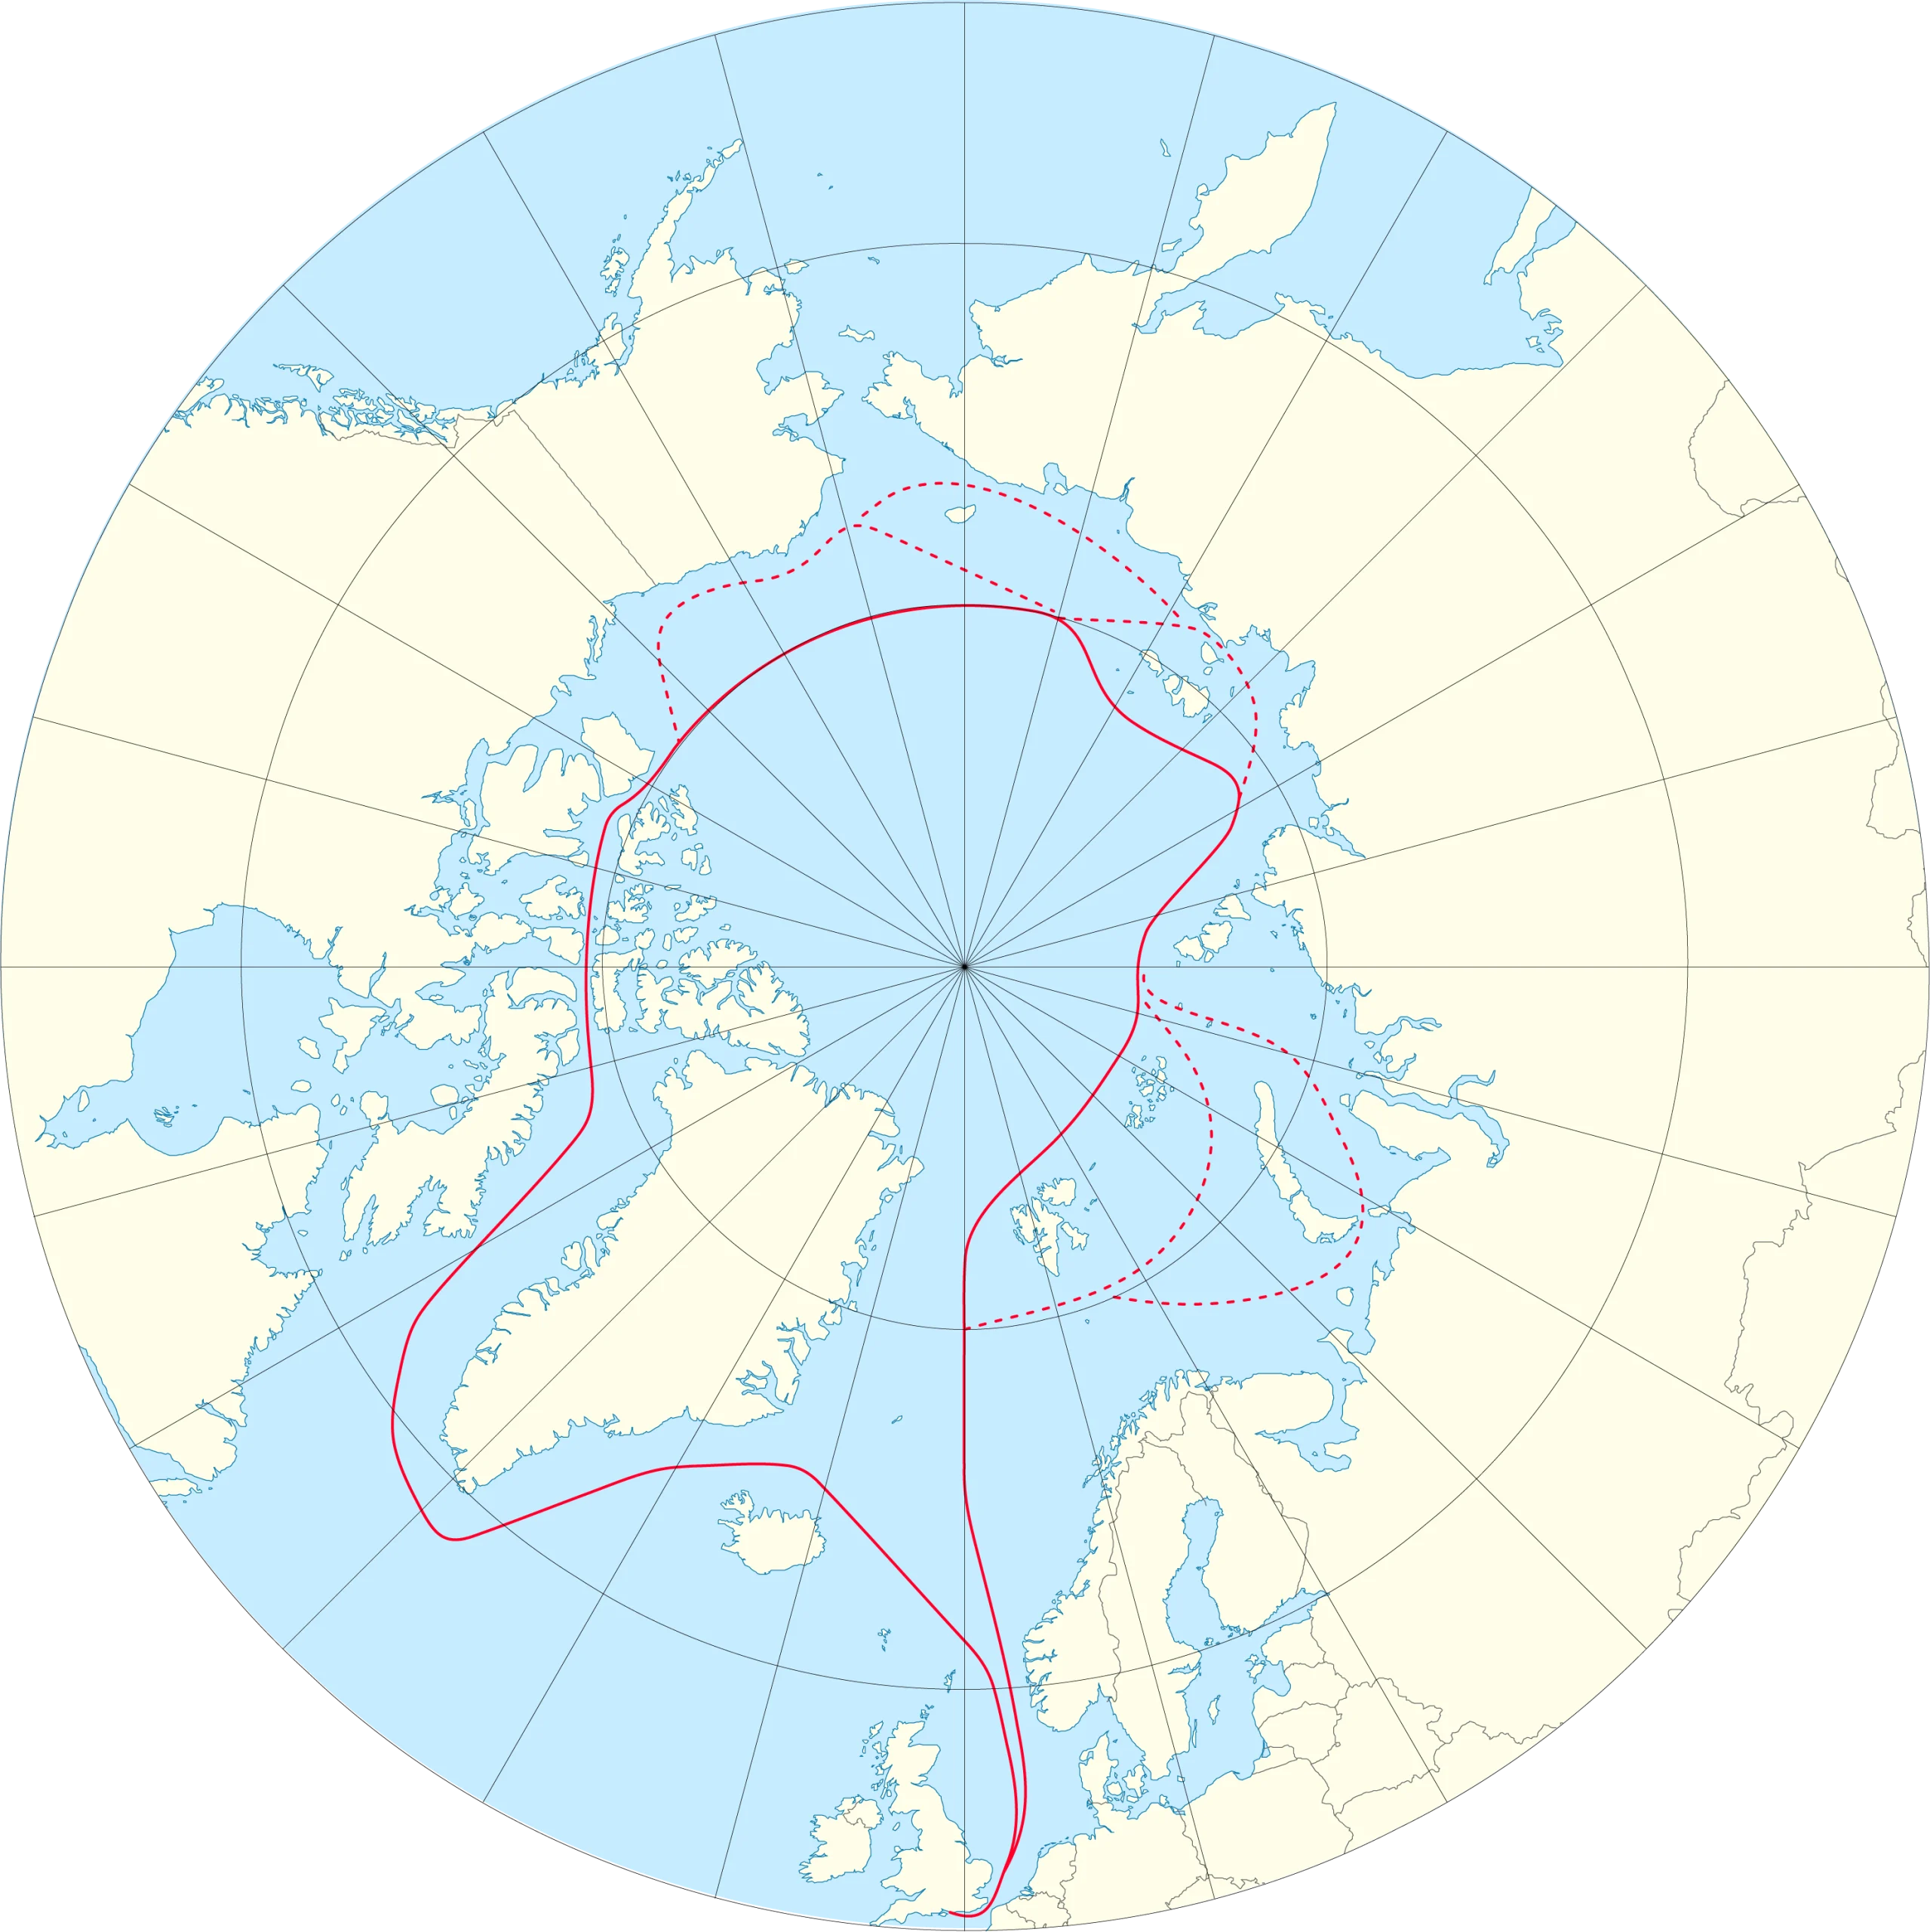
I’m opening the 2025 Northwest Passage thread earlier than usual, because of some news you can read if you scroll down. However, let’s first of all get our bearings with the help of this map of the area:
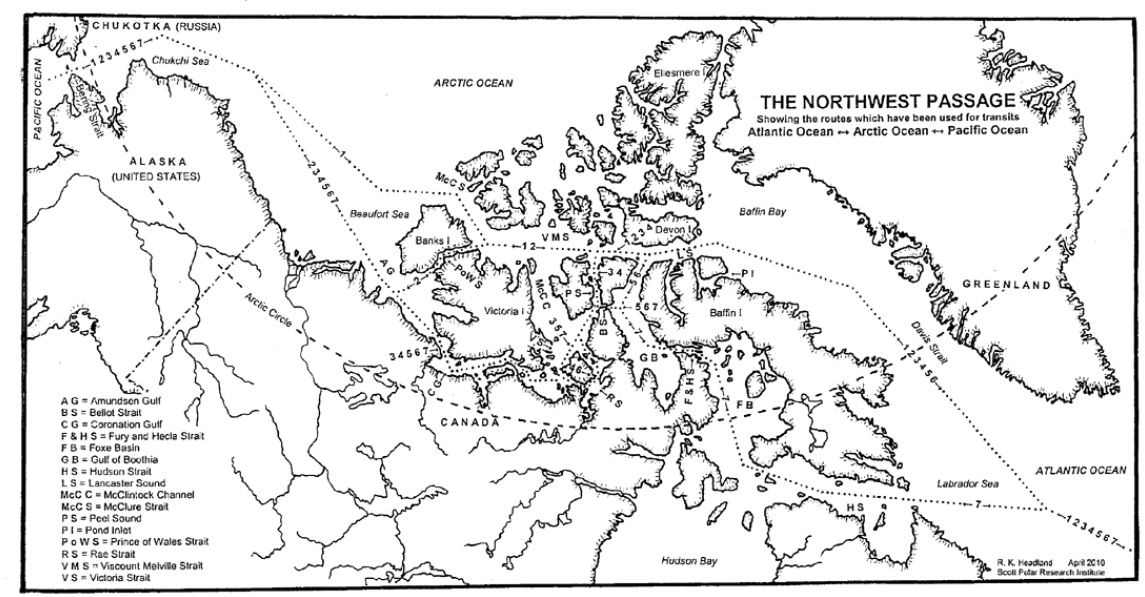
and another map detailing the routes through Canadian Arctic Archipelago that have previously been successfully traversed:
The news I was referring to is that at lunchtime today Ella Hibbert is setting off in her yacht Yeva from Haslar Marina near Portsmouth in southern England for a rather unusual voyage through the Northwest Passage this summer. Here is Ella’s current route plan:
You will note some unusual features. Apparently Ella is intent on taking Route 1 into the Beaufort Sea via McClure Strait. After that she is not heading for the Bering Strait, but is instead taking the route less travelled back to Haslar via the Northern Sea Route. Perhaps even more surprising in this day and age is that Ella has received permission to sail through Russian waters without an ice pilot. She is aiming to complete an entire circumnavigation of the Arctic in a single summer single handed! As Ella puts it, this is “A voyage that should not be possible”:
Ella is hoping to overcome terrifying challenges including icebergs, freezing water and polar bears.
Her journey – which has only recently become possible due to melting polar ice caps – aims to showcase the devastating environmental impact of sea ice decline, both in the Arctic and across the world.
Ella’s voyage also aims to support two charities working tirelessly to protect the Arctic: Polar Bears International and the Ocean Conservancy.
At the end of her voyage, Ella will auction her ship Yeva with proceeds to go to these two charities.
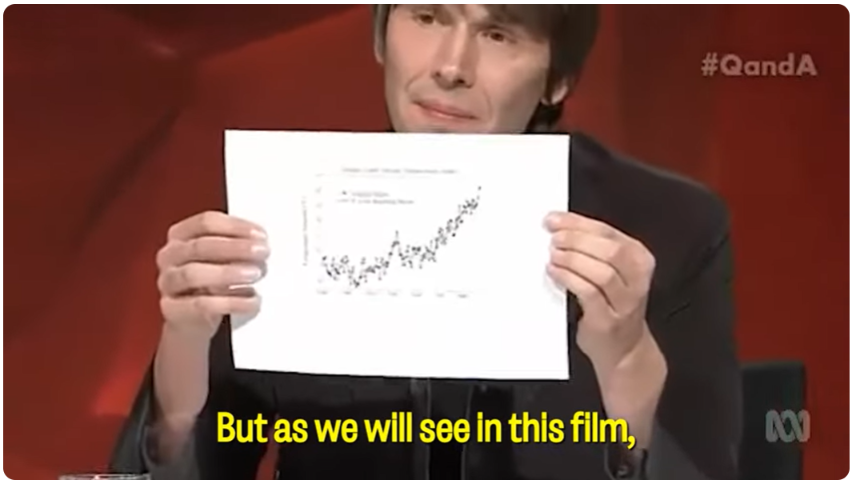
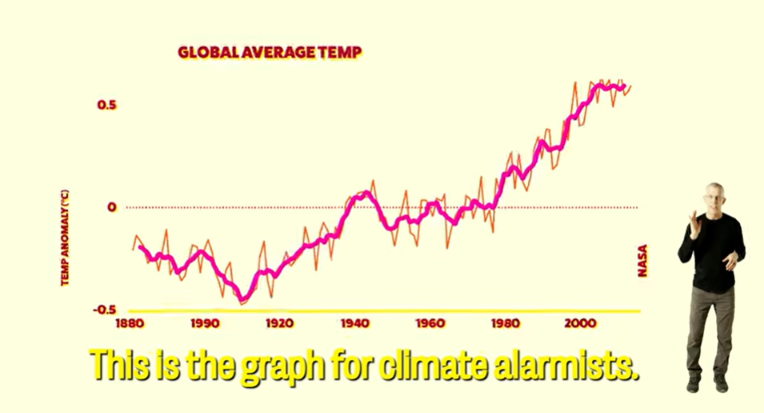
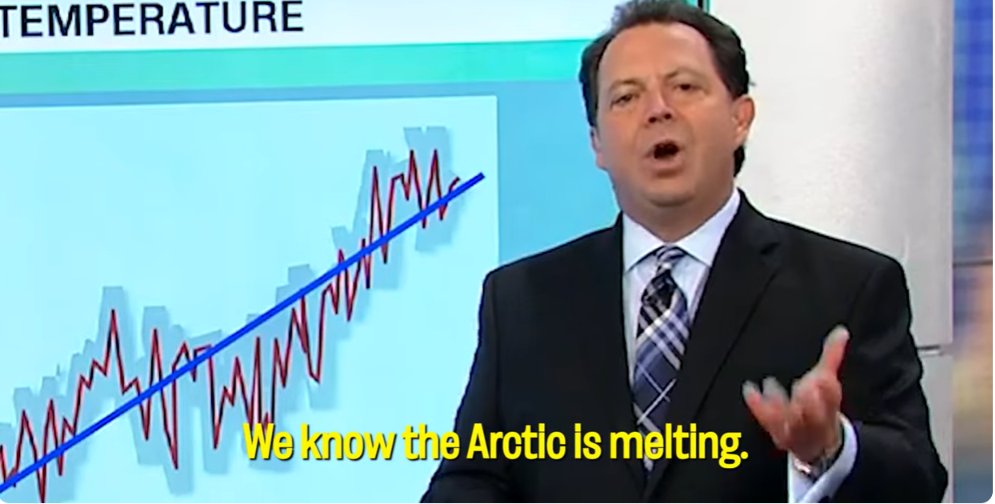
Fresh from his enlightening “debate” with Peter Hadfield about the numerous errors in Climate: The Movie, skeptical superstar Tom Nelson has produced another movie directed by Martin Durkin. The duo’s second cinematic masterpiece is entitled “The Graph That Lied”, and this time around Tom is the star of the show!
Allegedly its subject is:
The graph they built on a lie. The iconic ‘climate’ graph that’s undermining industrial capitalism and taking our freedom…and it’s 100 percent garbage.
Watch this film, and learn the shocking truth.
But as we will see:
This is the shocking truth:
If you want a good laugh, the shocking truth about the Gorilla Science team’s Ig Nobel contender for the climate science prize can be found on their YouTube channel.
World renowned climate scientist Roger Pielke Jr. has just published an interesting paper in the highly respected academic journal the New York Post. It is entitled:
When it comes to climate change, to invoke one of Al Gore’s favorite sayings, the biggest challenge is not what we don’t know, but what we know for sure but just isn’t so.
Two new studies show that the Earth’s climate is far more complex than often acknowledged, reminding us of the importance of pragmatic energy and climate policies.
One of them, led by researchers at China’s Tongji University, finds that after years of ice sheet decline, Antarctica has seen a “surprising shift”: a record-breaking accumulation of ice…
Roger then heads for the far north, where he assures his learned readers that:
A second new paper, a preprint now going through peer review, finds a similar change at the opposite end of the planet.
“The loss of Arctic sea ice cover has undergone a pronounced slowdown over the past two decades, across all months of the year,” the paper’s US and UK authors write.
They suggest that the “pause” in Arctic sea ice decline could persist for several more decades.
Together, the two studies remind us that the global climate system remains unpredictable, defying simplistic expectations that change moves only in one direction.
I feel compelled to point out to Roger that apart from the fact that they both include the word “ice”, Arctic sea ice and the Antarctic ice sheet are approximately as similar as chalk and cheese.
Roger neglects to provide NY Post readers with a reference or helpful link to the preprint he is referring to. However luckily for my own reader(s) I have already done so. Hence I am able to quote the authors’ own words, which read as follows:
According to these climate model simulations, this pause in the loss of Arctic sea ice could plausibly continue for the next 5-10 years.
I have already emailed the authors of the preprint asking them to justify their use of the term “pause”. I’ll let you know what they have to say on the matter in due course. In the meantime I suggest that Dr. Pielke consults an English dictionary. In pseudo code:
"pause" != "rebound"
I also suggest that he directs Post readers to more recent activity of yours truly’s virtual pen:
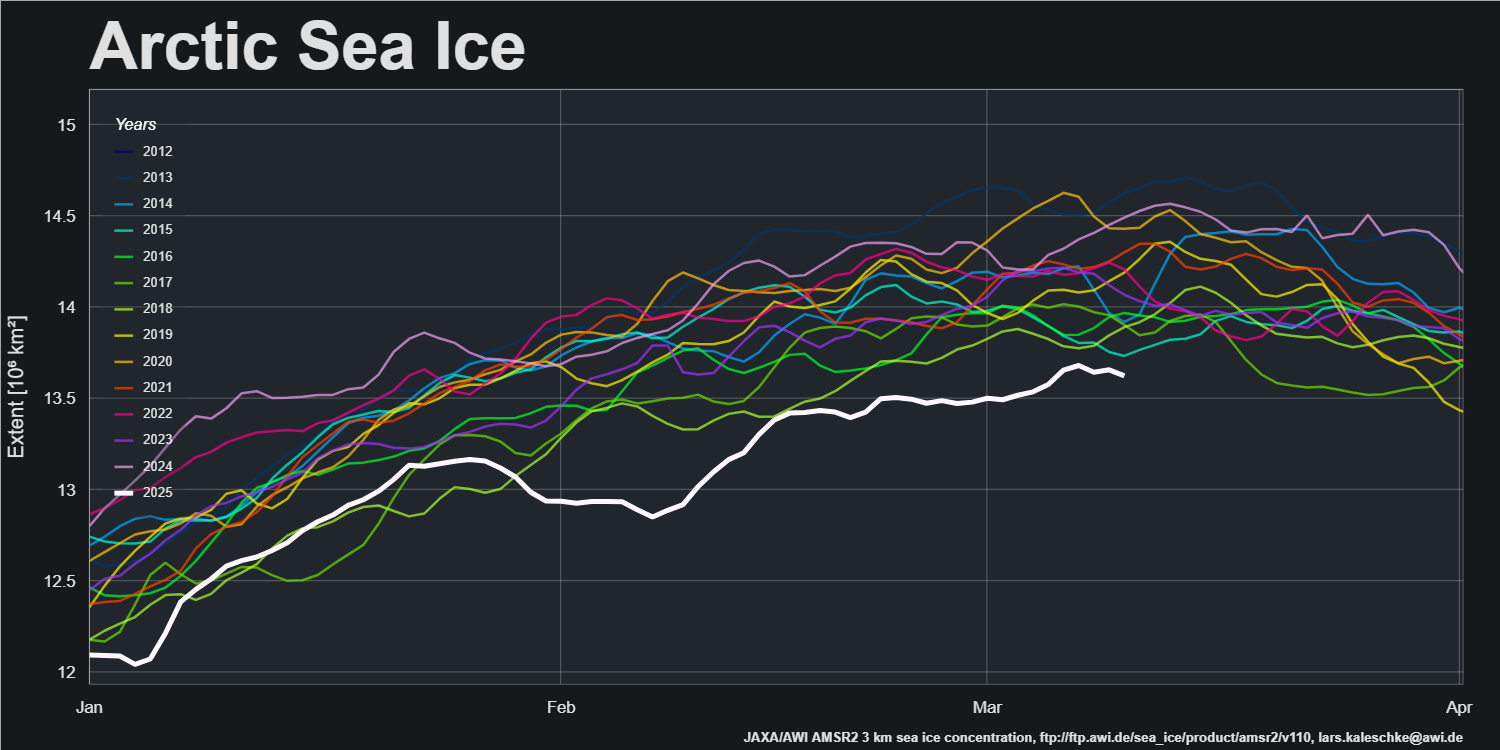
This year’s maximum extent is 1.31 million square kilometers below the 1981 to 2010 average maximum of 15.64 million square kilometers and 80,000 square kilometers below the previous lowest maximum that occurred on March 7, 2017:
Perhaps he also wouldn’t mind asking the Post’s online editor(s) to reveal this explanatory video to their viewers?
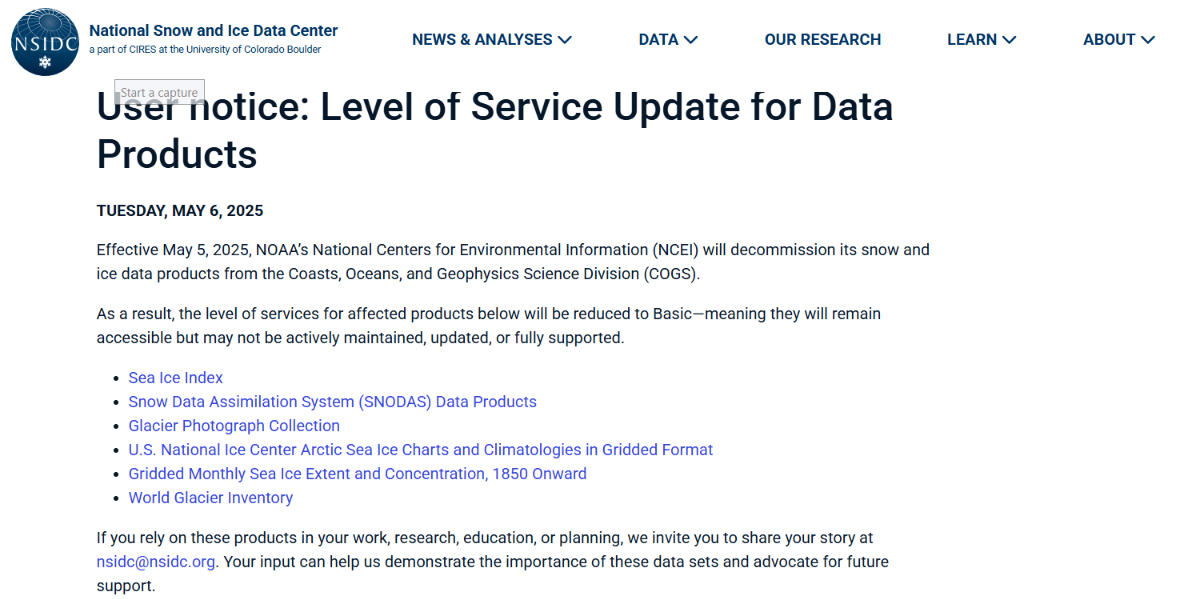
I frequently post a summary of the Arctic section of the United States’ National Snow and Ice Data Center’s monthly review of the current state of the cryosphere. Here is the most recent edition.
Effective May 5, 2025, NOAA’s National Centers for Environmental Information (NCEI) will decommission its snow and ice data products from the Coasts, Oceans, and Geophysics Science Division (COGS).
As a result, the level of services for affected products below will be reduced to Basic—meaning they will remain accessible but may not be actively maintained, updated, or fully supported.
If you rely on these products in your work, research, education, or planning, we invite you to share your story at [email protected]. Your input can help us demonstrate the importance of these data sets and advocate for future support.
I will certainly share my story with the NSIDC. If you are a resident of the US you may also wish to contact your local friendly neighbourhood politician(s) about the matter?
[Update – May 9th]
Mark Serreze, Director of the National Snow and Ice Data Center, replied to my email and told me that:
We are acutely aware of the importance of the SII and Sea Ice Today. Millions of visits per year. High priority. We’re in the middle of discussions about to make sure that we have continuity.
Thanks for your support. Everything helps.
One of the less well known data products provided by the NSIDC is EASE-Grid Sea Ice Age.
I recently used that particular mine of essential cryospheric information to produce this educational YouTube video:
The video reveals the underlying reason for the “fast transition” of Arctic sea ice cover from thick multi-year ice to a reduced area of much more mobile young ice.
This article not directly related to Arctic sea ice, but instead is one of our (very!) occasional series on the psychology of anthropogenic global warming “skepticism”.
Peter Hadfield is better known as the man behind Buster Keaton’s face on the “Potholer54” channel on YouTube. Tom Nelson is the “producer” of Martin Durkin’s “Climate: The Movie”. Peter produced a video criticising that movie. Many months later Peter and Tom have just recorded a “long-form, man-to-man debate” via Zoom about those criticisms. Here is episode 1 of Potholer’s version of events:
Here is “Snow White’s” hot take on the first 10 minutes of Tom Nelson’s version of events on X (formerly Twitter):
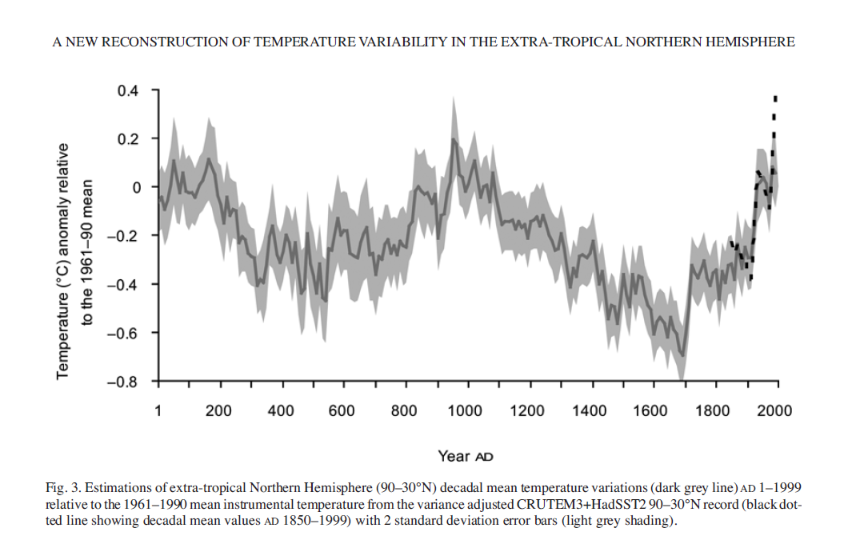
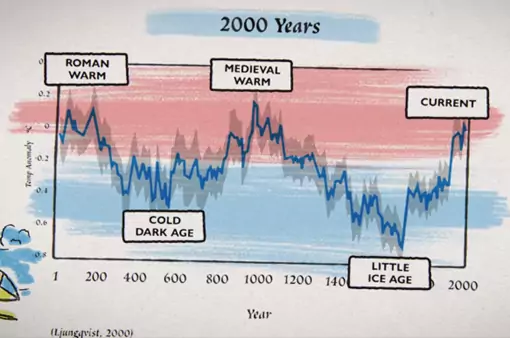
6:37 "You've referenced this as (Ljungqvist, 2000). It's not actually, it's 2010. But that's a minor mistake"
6:46 "It's also not global temperatures, as it says in the title. These are NH temperatures, above the Tropic of Cancer… But that's just another mistake"
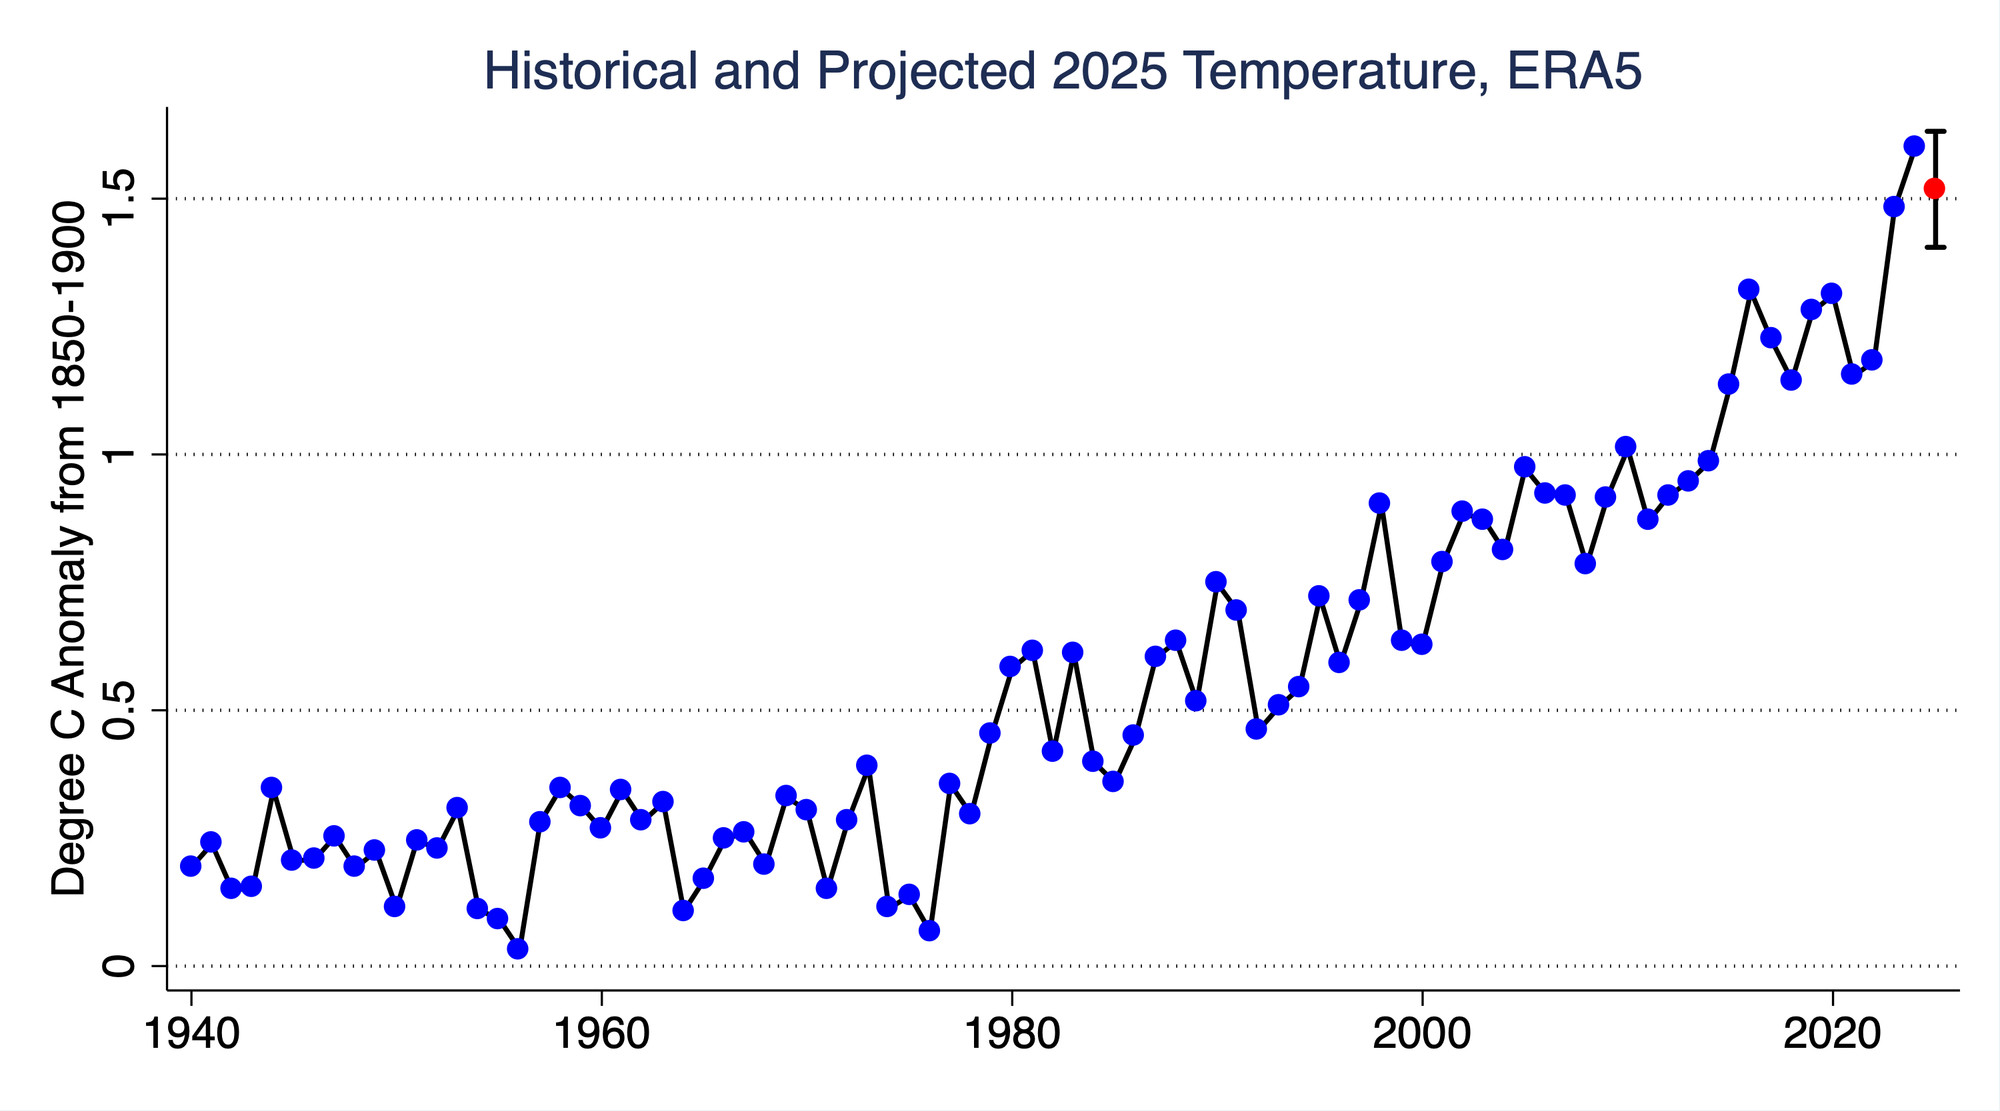
In brief, Tom seems to be incapable of providing a straight answer to a straight question, and instead loudly rails against what he continually refers to as the instrumental temperature “spike of doom”.
Can you spot the difference between these two graphs? The first is from Ljungqvist (2010):
The second is from Climate: The Movie (The Cold Truth):
[Update – May 5th]
Note that at 2:18 in the video above Tom says:
I want to make sure that my audience hears everything that you have to say, so I’d hope that we don’t filibuster and try to keep our answers short and snappy.
Here’s the second episode of the Peter v Tom “debate”:
Would anybody here care to run a stopwatch past the time spent “filibustering” by each of the two participants?
In the video description Peter has this to say:
During the debate, Tom asked me a gish-gallop of questions, including whether I ‘believe’ CO2 is the control knob of global temperature, and about the Medieval Warm Period, and the weather, etc. He did not choose any of these as topics for the debate…
So why didn’t I simply answer all his questions and explain this? Because I have had 40 years experience interviewing politicians and government officials, whose strategy is always to divert attention onto another subject whenever you are homing in on a contradiction or a mistake. Even if I had taken the bait and explained what the science actually shows regarding the weather, or the control knob, or the MWP, as soon as I got close to busting another of Tom’s fallacies, he would have interrupted me mid-sentence to try to divert onto another subject. The trick is to always keep them on the topic.
Here’s are Peter’s subsequent musings on the “debate”:
Here’s an excerpt from Peter’s conclusion at ~ 13:40:
People who lobby for industry and vested interests don’t want to discuss the science, they want to support their beliefs. If you agree with their beliefs you’re on their side. If you don’t agree with their beliefs you’re on the other side.
If changing graphs, airbrushing out contradictory information, hiding sources and misrepresenting studies is what it takes to support those beliefs, then it’s perfectly OK.
If the other person is trying to make a point that gets to the facts and the reality, then do everything you can to interrupt, filibuster and deflect. What matters outside the world of science is not getting to “the truth”, but what they call “winning”.
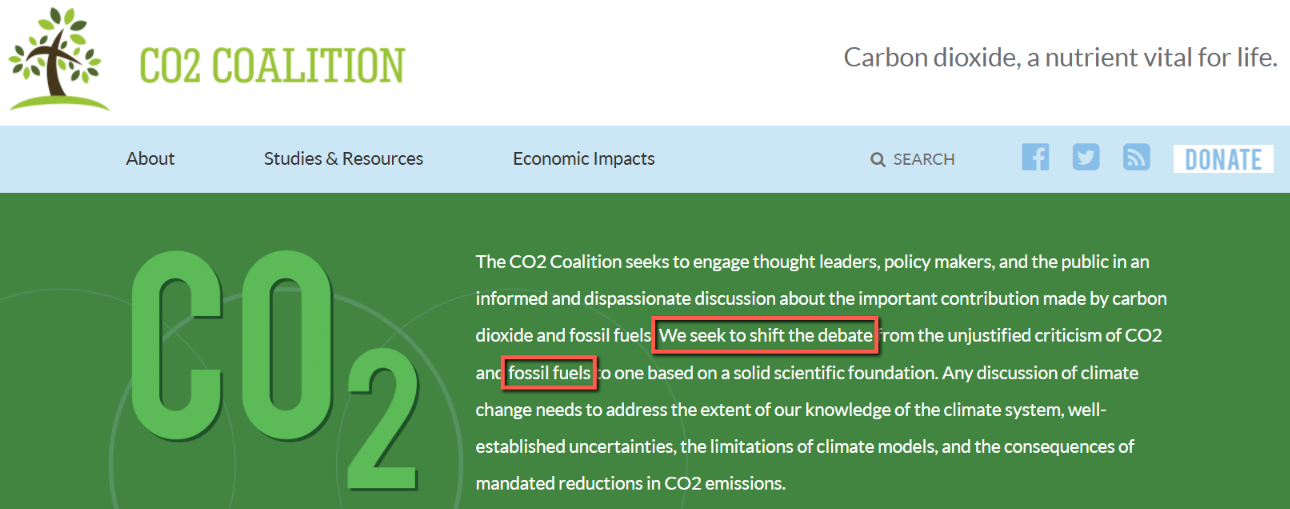
Unfortunately for Tom Nelson, Martin Durkin and the CO2 Coalition, the internet keeps receipts of airbrushing:
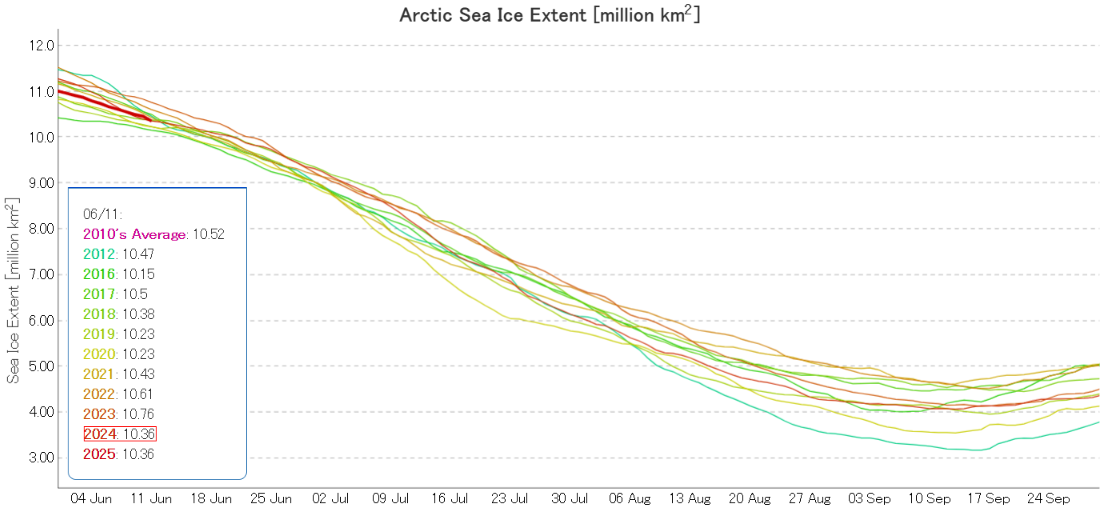
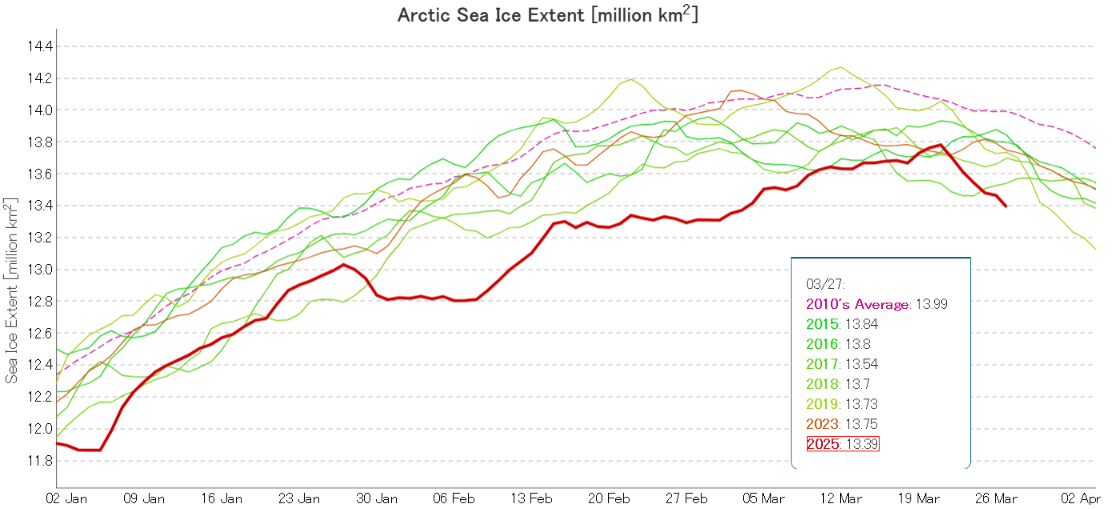
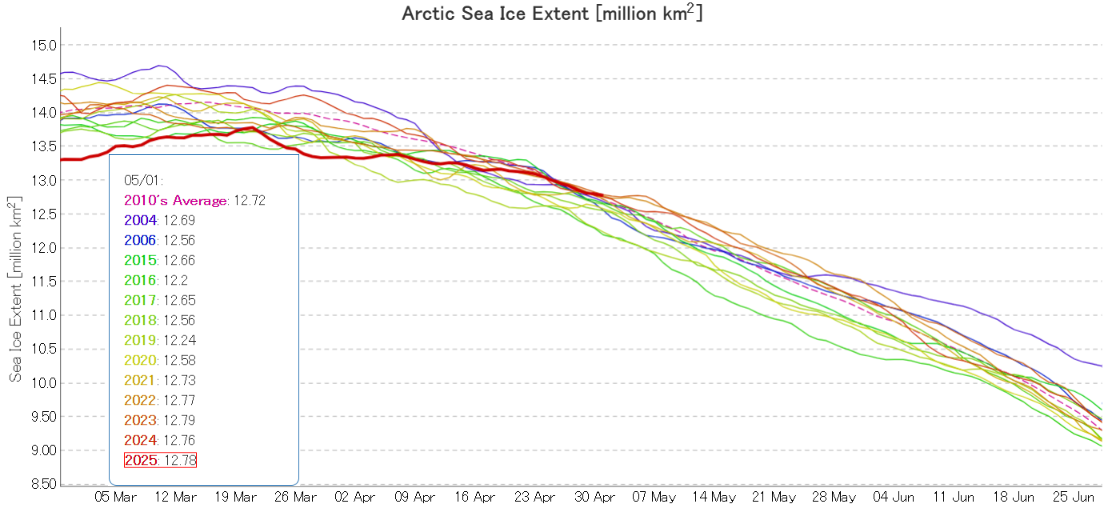
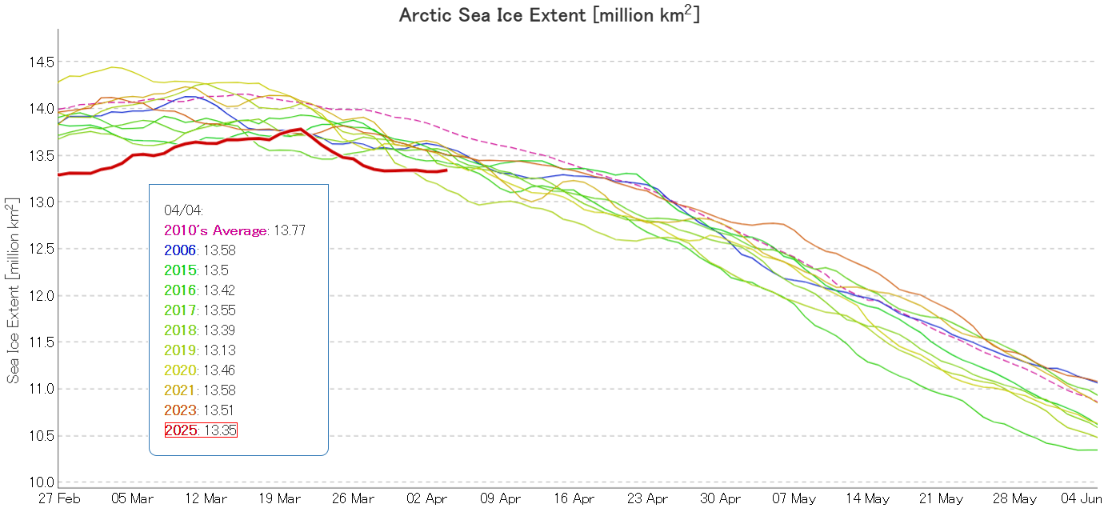
JAXA/ViSHOP extent is no longer “lowest for the date”! After “flatlining” for most of April the metric is now in the midst of a close knit group of the other years in the 2020s:
The high pressure area over the Central Arctic persisted through the second half of April, and so did the consequent drift of ice from the Pacific side of the Arctic to the Atlantic periphery:
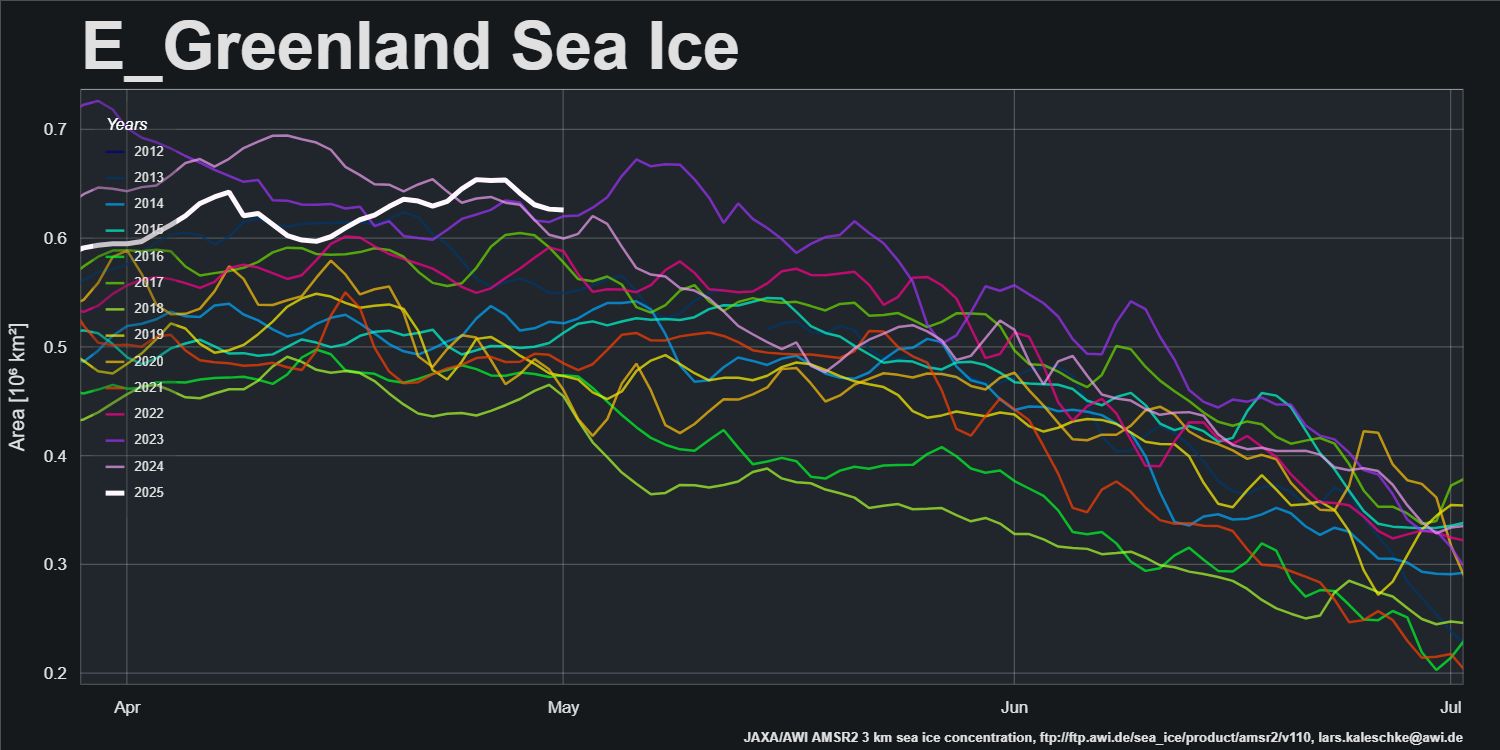
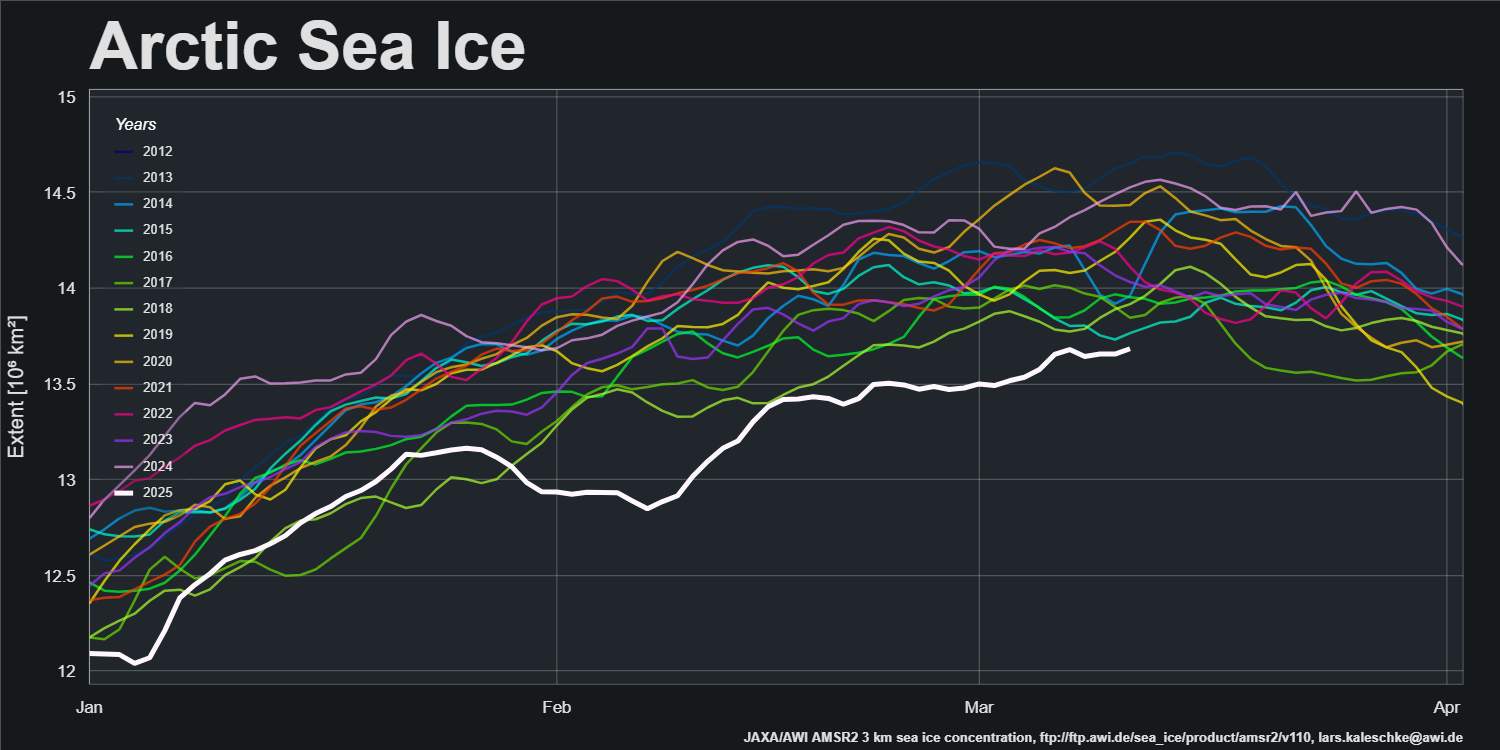
AWI’s sea ice area for the Greenland Sea is currently “highest for the date” in the AMSR2 record that started in July 2012:
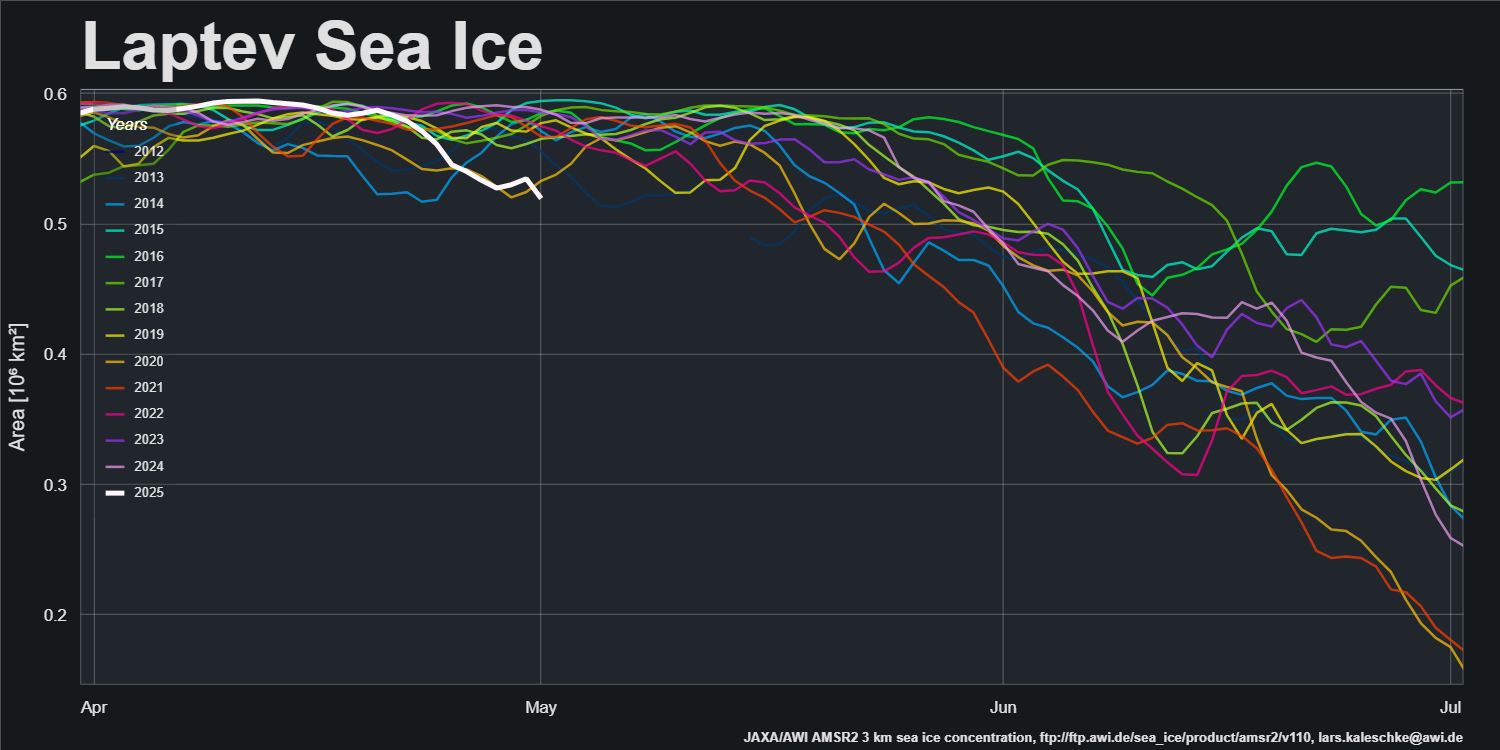
The offshore winds along the Laptev Sea coast have continued, and sea ice area is now “lowest for the date”:
The first signs of a break in the high pressure dominance are appearing. GFS currently forecasts that a low pressure area will enter the Central Arctic, bring above zero temperatures over the Kara Sea on Sunday:
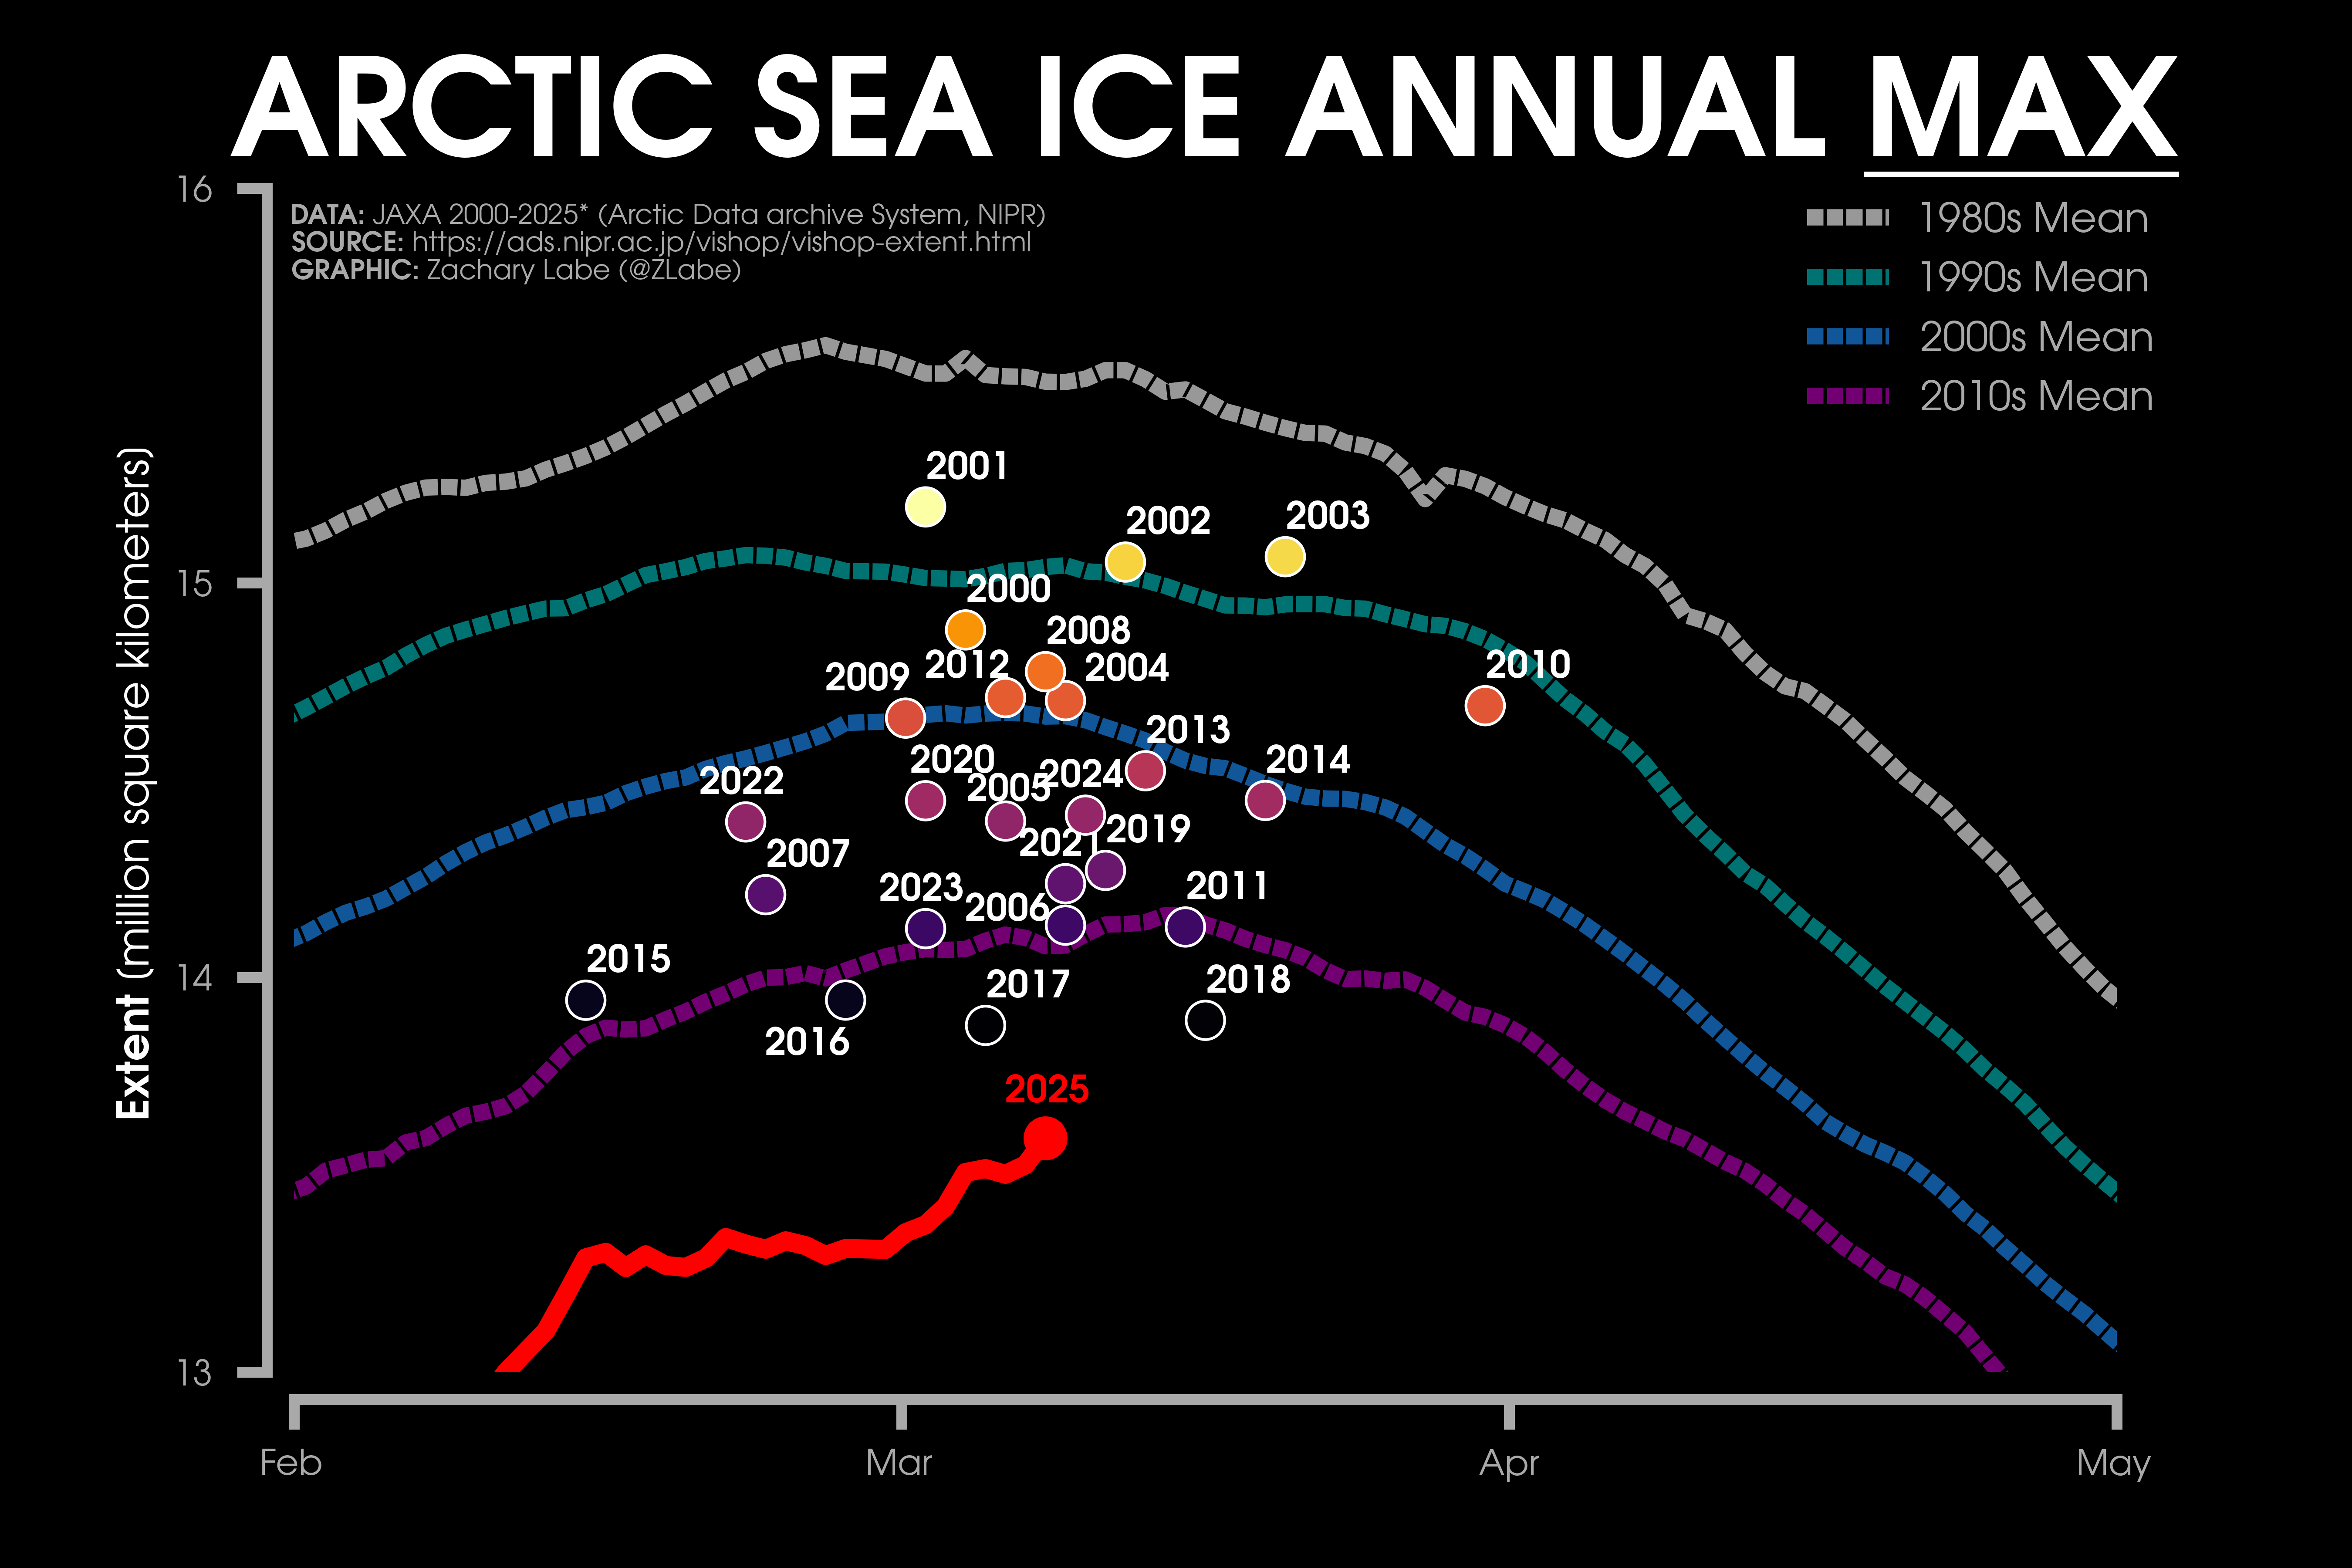
The time has arrived to start taking a close look at the assorted different Arctic sea ice extent metrics, in order to ascertain their respective maxima for 2025. To begin with here’s Zack Labe’s overview of previous years’ maxima:
It now seems highly likely that 2025’s maximum extent will ultimately prove to be the lowest in the satellite era. The remaining question is when this year’s maximum will occur.
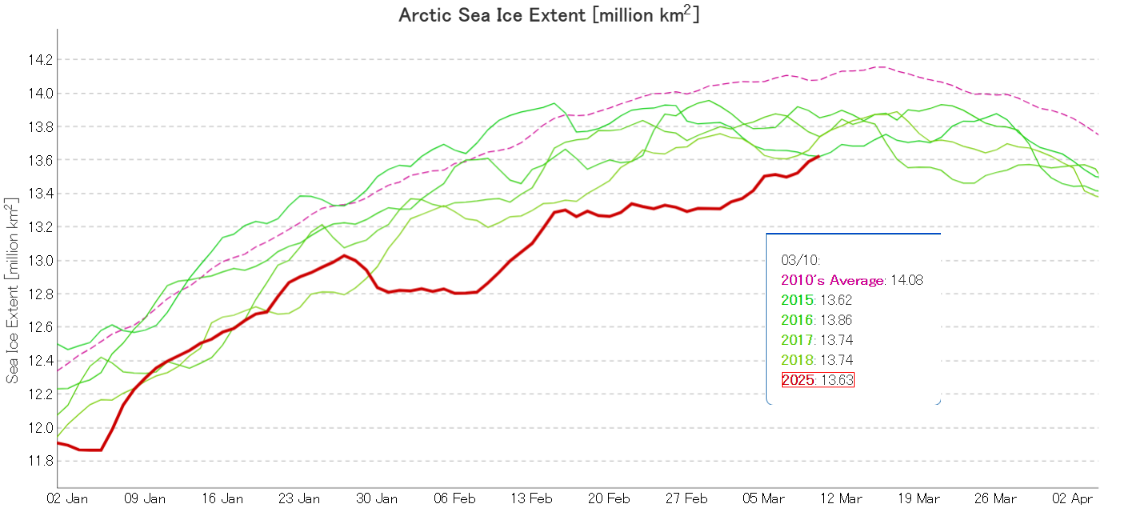
My speculation yesterday that AWI’s flavour of Arctic sea ice extent had already achieved its maximum value for 2025 has been negated today:
The NSIDC 5 day average and JAXA extent metrics are also currently at their maximum levels for the year so far, so let’s wait and see which one is the first to take a downward turn.
On March 22, Arctic sea ice likely reached its maximum extent for the year, at 14.33 million square kilometers, the lowest in the 47-year satellite record. This year’s maximum extent is 1.31 million square kilometers below the 1981 to 2010 average maximum of 15.64 million square kilometers and 80,000 square kilometers below the previous lowest maximum that occurred on March 7, 2017.
After spending several weeks in the unfortunate position of lowest for the date, JAXA/ViSHOP Arctic sea ice extent has just risen above 2015. By a mere 10,000 km²:
Despite the fact that JAXA extent is still rising, AWI extent has potentially already achieved its maximum value for 2025:
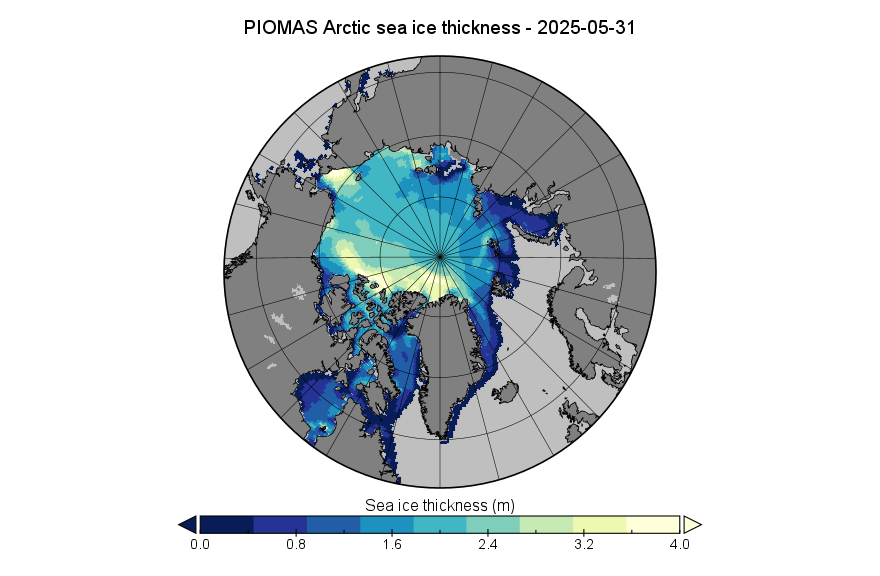
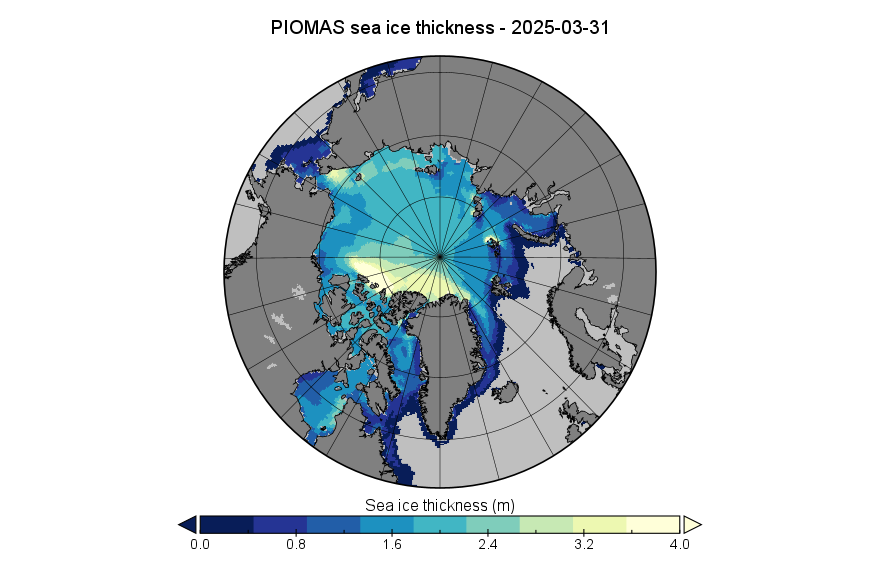
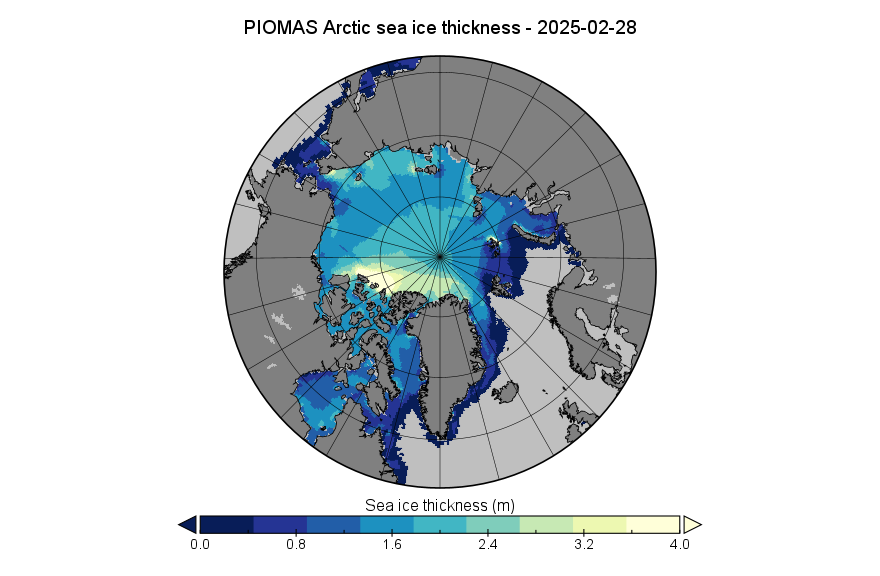
Somewhat belatedly, here is the PIOMAS sea ice thickness map for February 28th 2025:
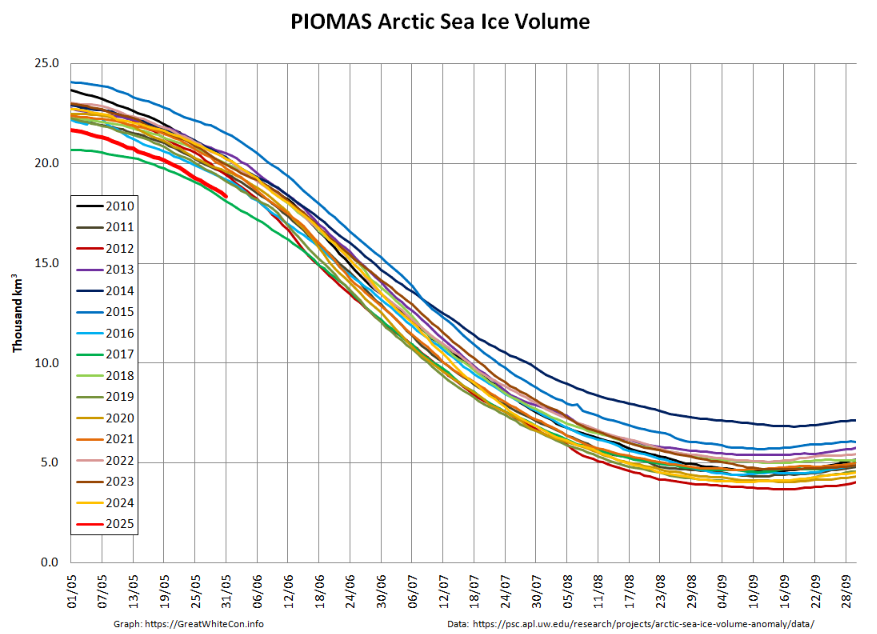
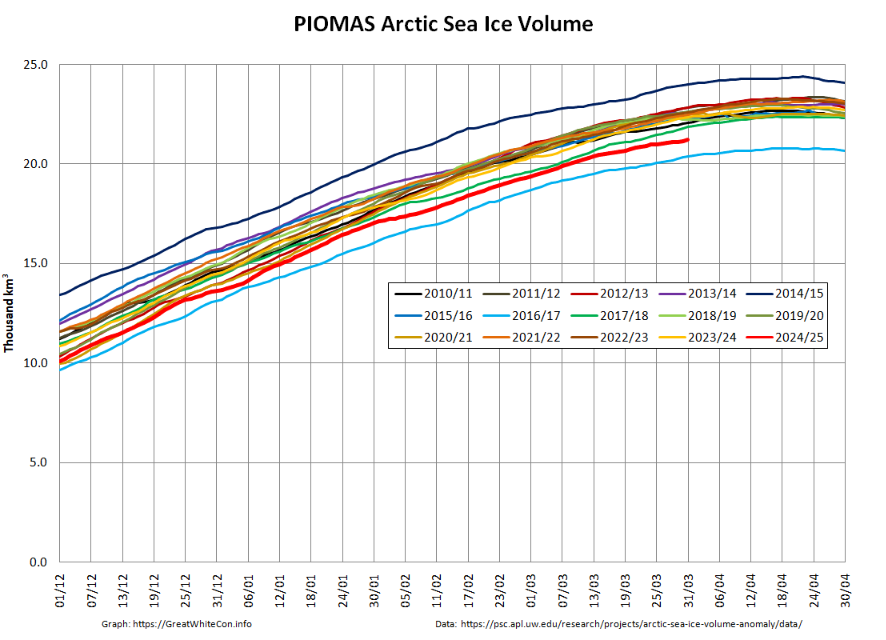
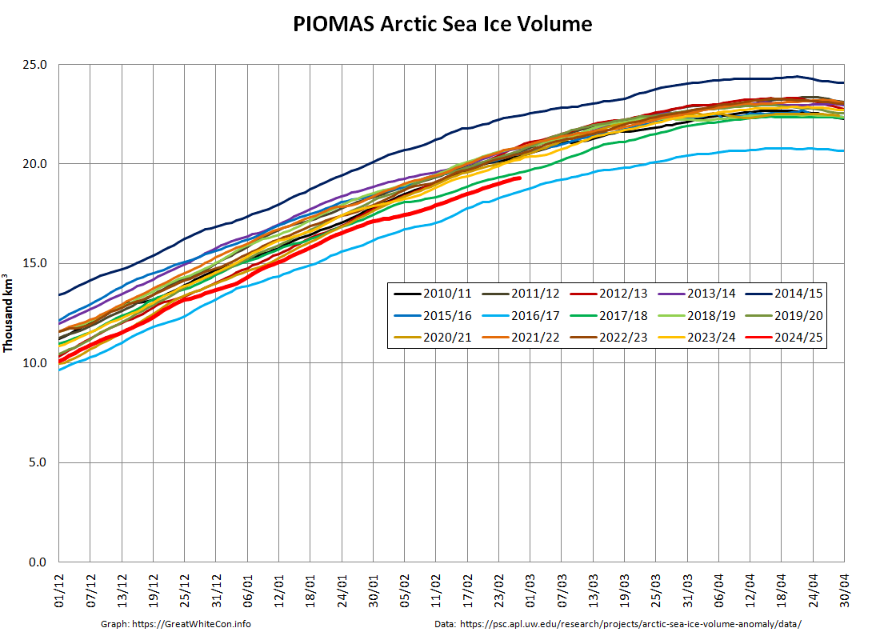
At the end of February Arctic sea ice volume had increased to 19.32 thousand km³, still 2nd lowest for the date in the PIOMAS record:
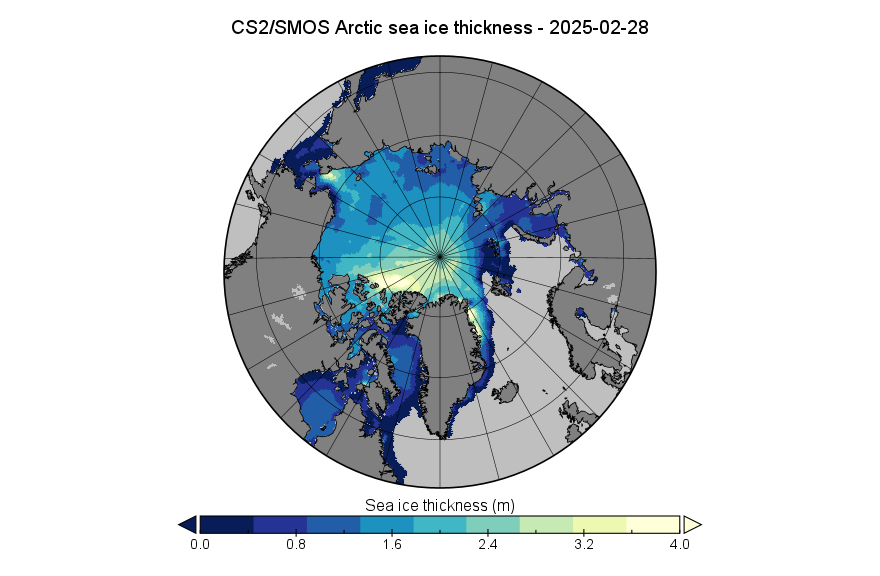
AWI have also released a new version of their thickness product, incorporating additional data from the two Sentinel 3 satellites. The thickness data for February 28th, looks slightly different:
This website uses cookies to improve your experience. We'll assume you're ok with this, but you can opt-out if you wish. Cookie settingsACCEPT
Privacy & Cookies Policy
Privacy Overview
This website uses cookies to improve your experience while you navigate through the website. Out of these, the cookies that are categorized as necessary are stored on your browser as they are essential for the working of basic functionalities of the website. We also use third-party cookies that help us analyze and understand how you use this website. These cookies will be stored in your browser only with your consent. You also have the option to opt-out of these cookies. But opting out of some of these cookies may affect your browsing experience.
Necessary cookies are absolutely essential for the website to function properly. This category only includes cookies that ensures basic functionalities and security features of the website. These cookies do not store any personal information.
Any cookies that may not be particularly necessary for the website to function and is used specifically to collect user personal data via analytics, ads, other embedded contents are termed as non-necessary cookies. It is mandatory to procure user consent prior to running these cookies on your website.