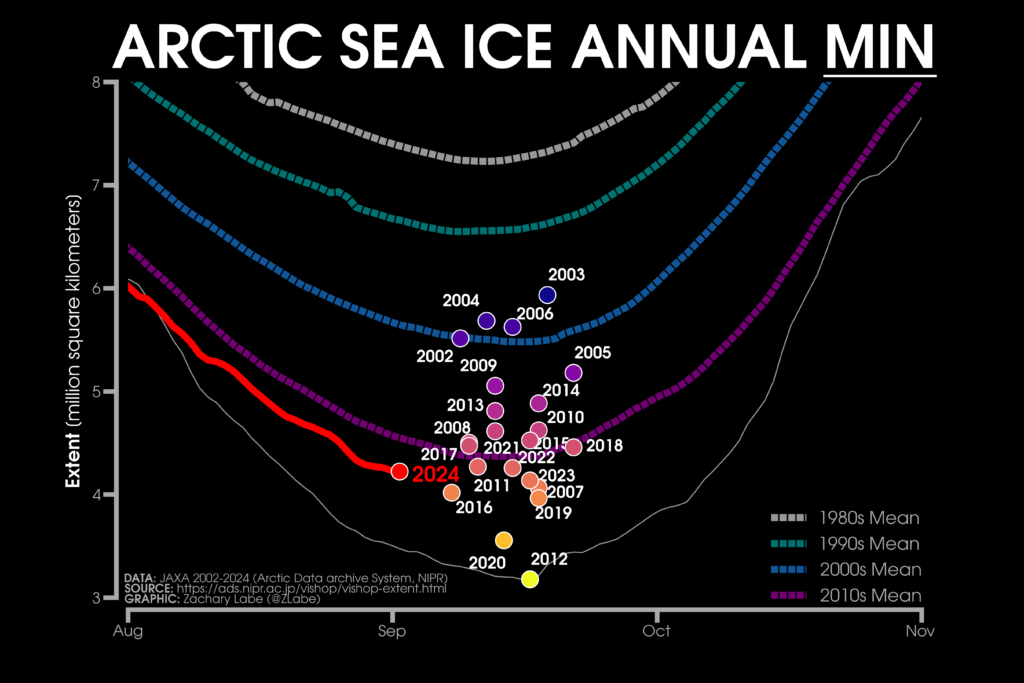
The 2024 Arctic sea ice minimum extent will almost certainly occur at some point over the next month. The exact date and level will vary from one extent metric to the next. Here’s a comparison of the current JAXA extent with previous minima, courtesy of Zack Labe:
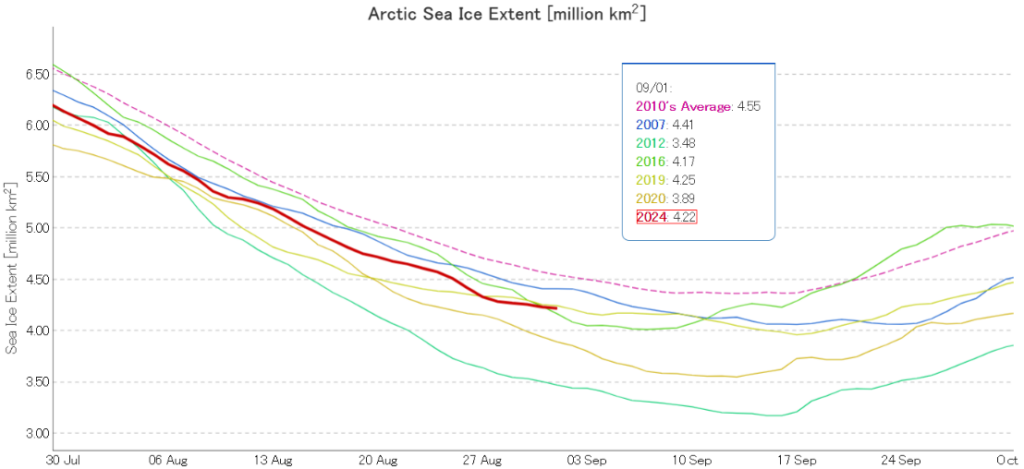
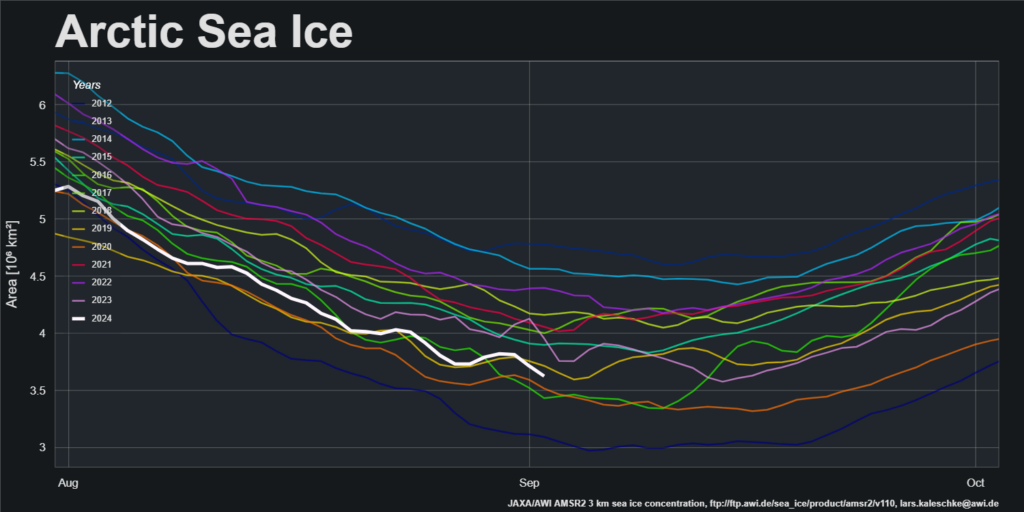
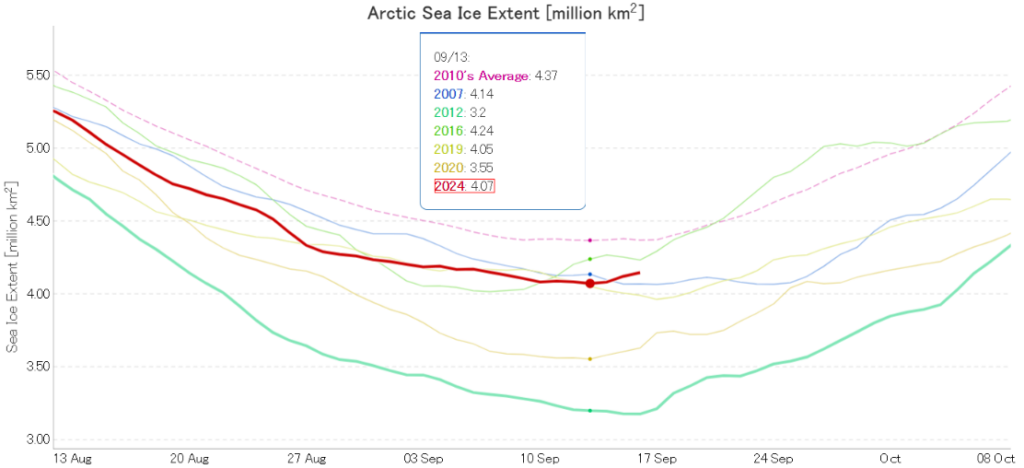
Here too is a more detailed look at 2024 extent compared with the 5 lowest annual minima in the JAXA record:
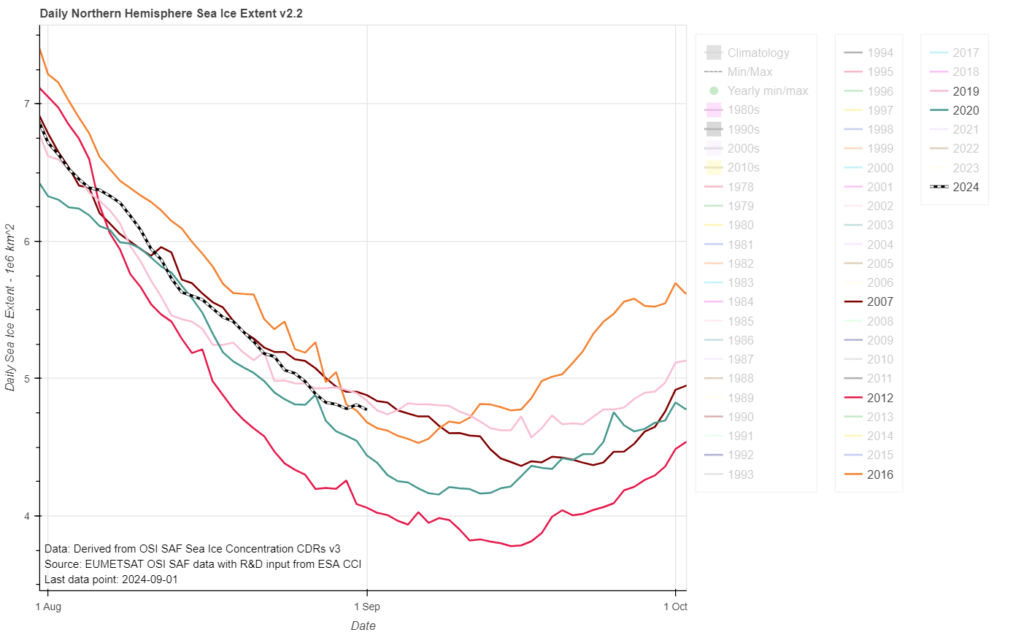
By way of comparison, here is the equivalent graph for the OSI SAF extent metric, which experienced an up tick yesterday but has now reached a new low for the year:
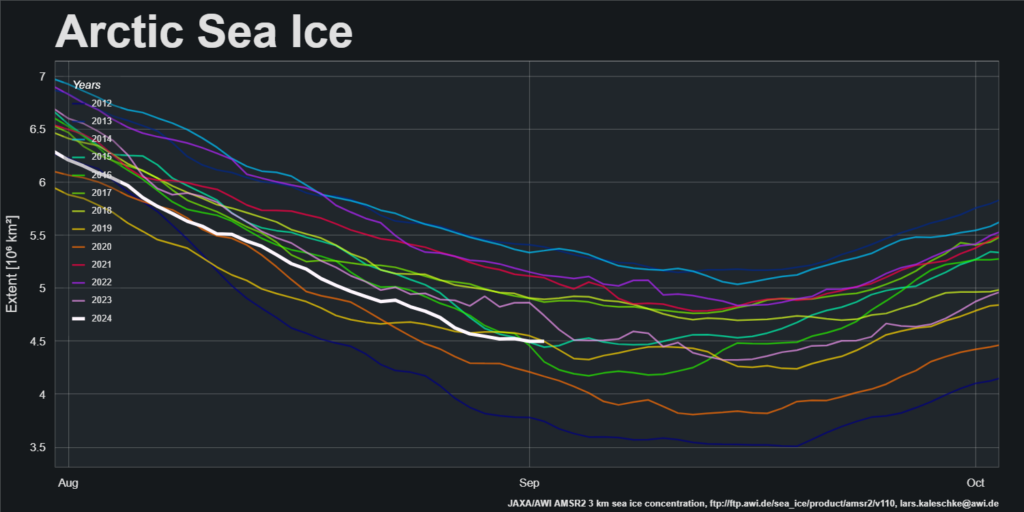
The Alfred Wegener Institute’s extent metric has flatlined over the last two days:
However AWI Arctic sea ice area is currently falling, which may well presage further significant falls in extent:
The NSIDC web site is currently “experiencing technical difficulties”, but hopefully we’ll be able to take a look at their extent graph in the very near future.
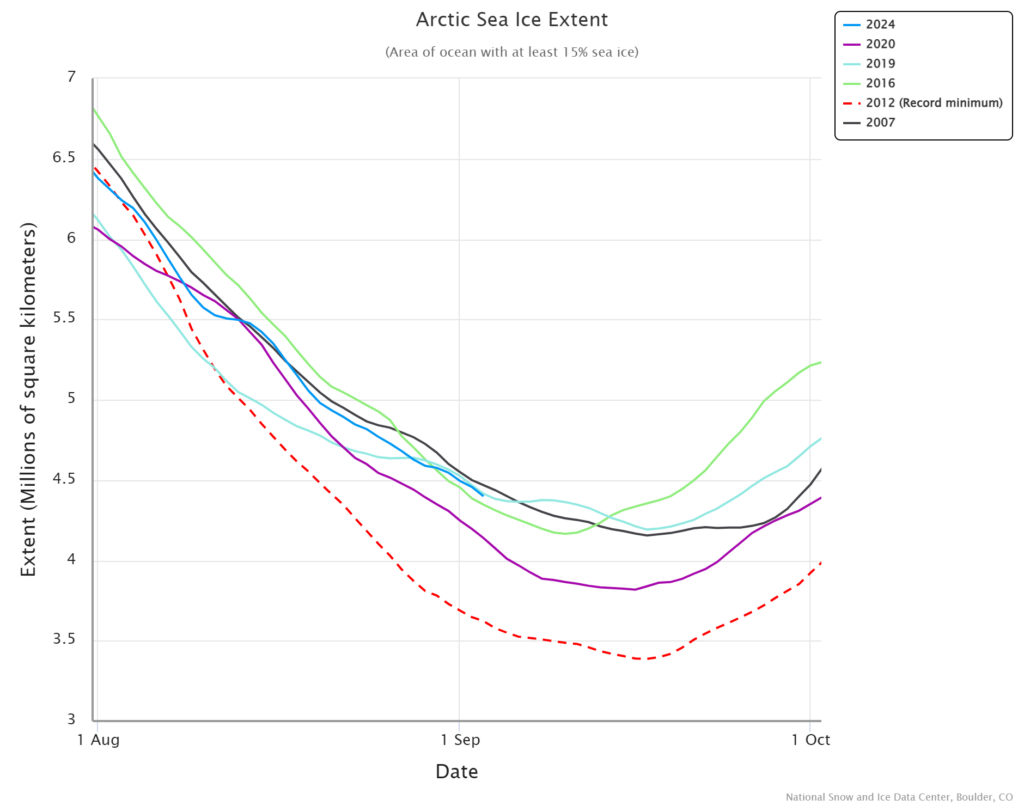
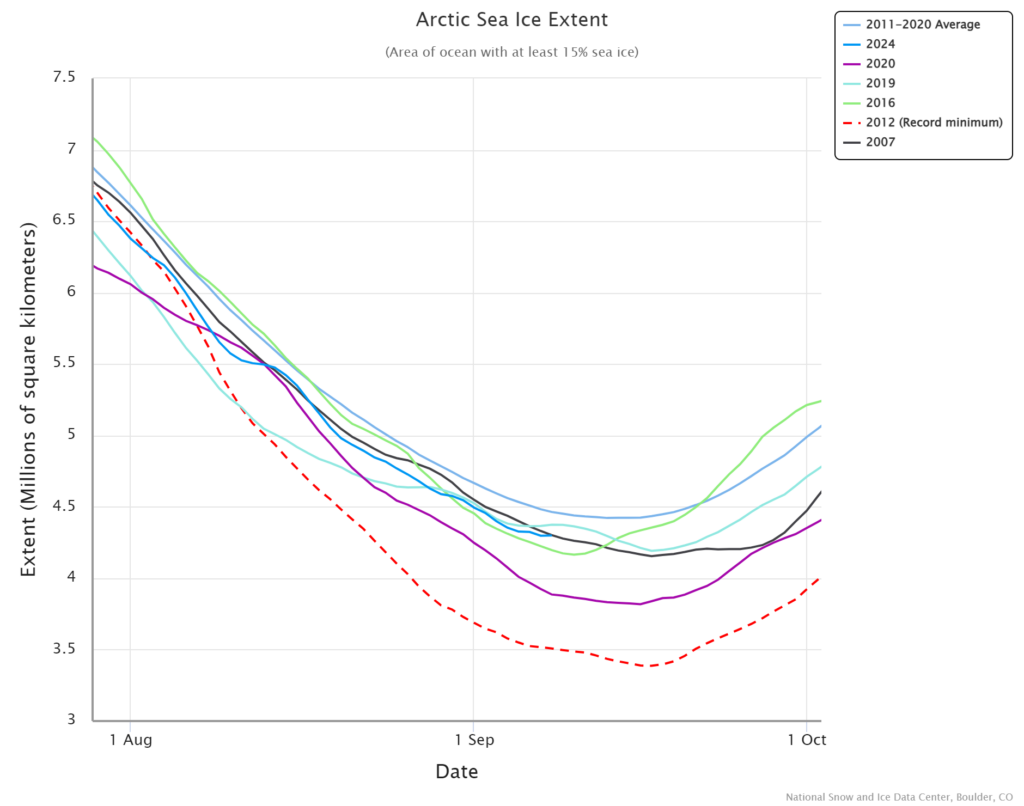
[Update – September 4th]The NSIDC web site is back in action, and their 5 day averaged extent metric is currently still falling quickly:
The ARCUS Sea Ice Prediction Network August report has been published. Note that the predicted numbers are for the September monthly average extent rather than the daily minimum:
For the August Outlook, we received 24 contributions of September pan-Arctic sea-ice extent forecasts…
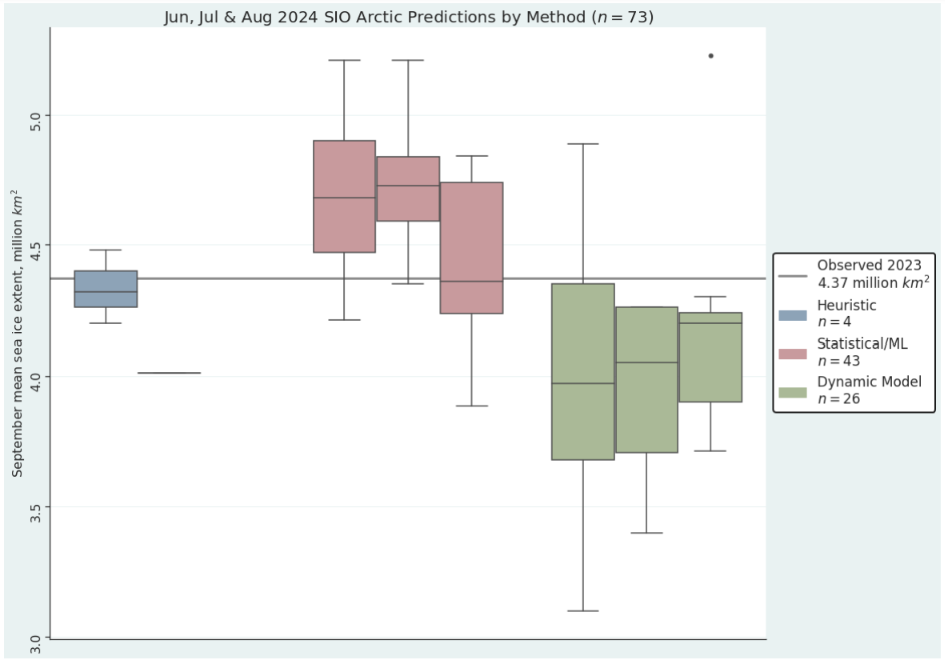
The August 2024 median forecasted value for pan-Arctic September sea-ice extent is 4.27 million square kilometers with an interquartile range of 4.11 to 4.54 million square kilometers. This is about 200,000 square kilometers lower than the June median and about 250,000 square kilometers lower than the July median, which reflects the faster than average ice loss during July.
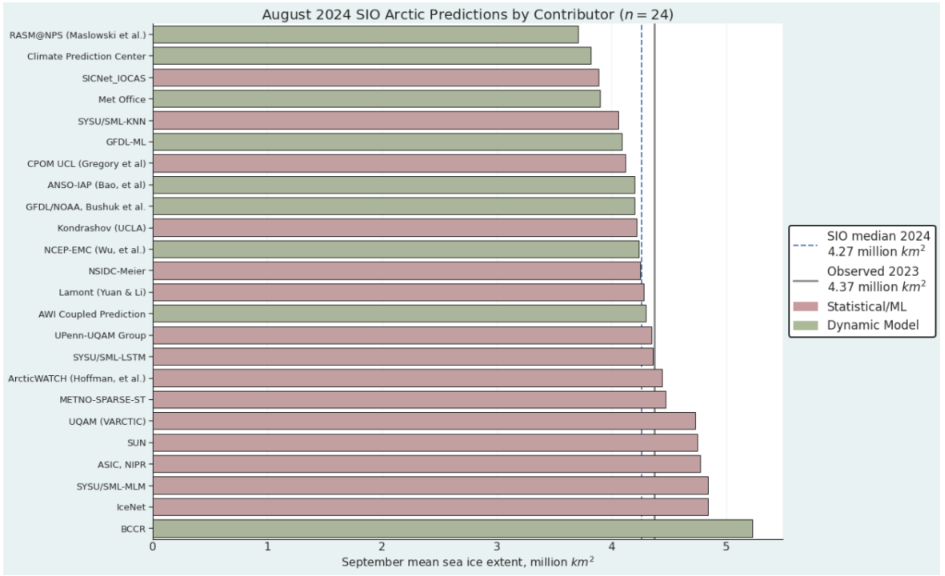
The lowest sea-ice extent forecast is 3.71 million square kilometers and the highest sea-ice extent forecast is 5.23 million square kilometers. These extremes are actually higher, particularly on the low end, than the estimates from July.
There’s been the tiniest of upticks in the NSIDC 5 day extent metric. 1 thousand km² to be precise. However, the others are still slowly declining:
[Update – September 10th]NSIDC extent has posted a new low for the year, and JAXA extent is still declining. However there has been a slightly more substantial uptick in the OSI SAF metric:
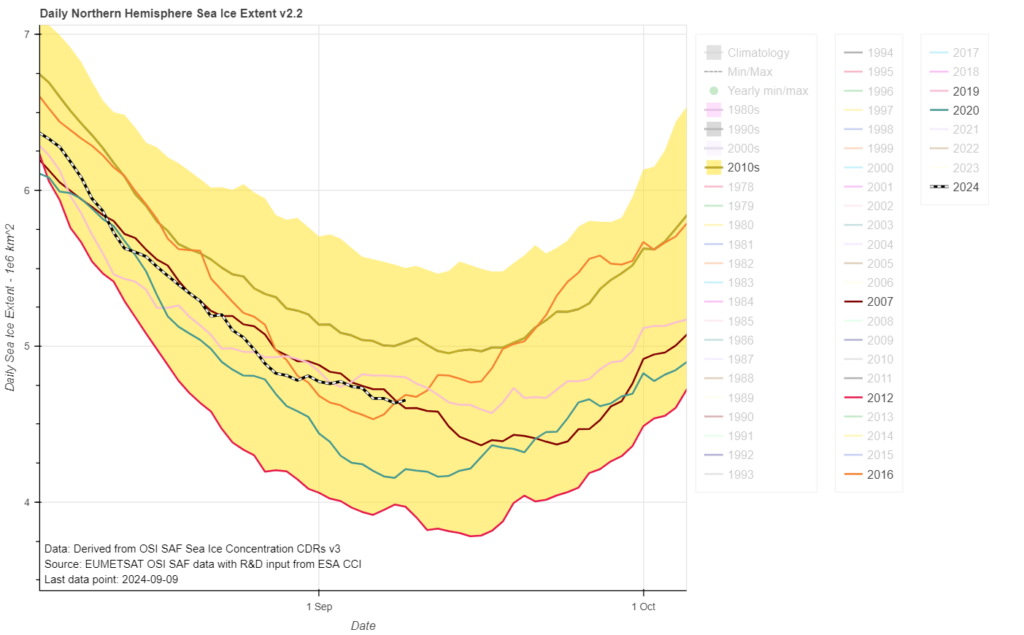
The current minimum is 4.64 million km² on September 8th.
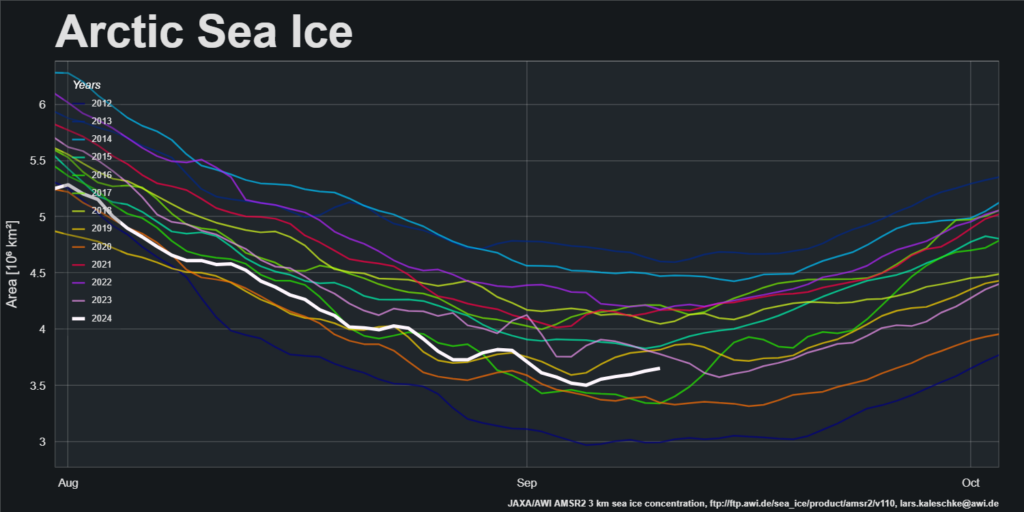
AWI sea ice area has posted a convincing looking minimum on September 4th, which suggests that the central refreeze is already well under way:
JAXA/ViSHOP/ADS extent has risen significantly over the last two days:
It now looks highly likely that the 2024 minimum will prove to be 4.07 million km² on September 13th. That is 4th lowest for the date, but equal 5th lowest minimum in the JAXA record.
A closer look at some of the other extent metrics will have to wait until this problem is solved:
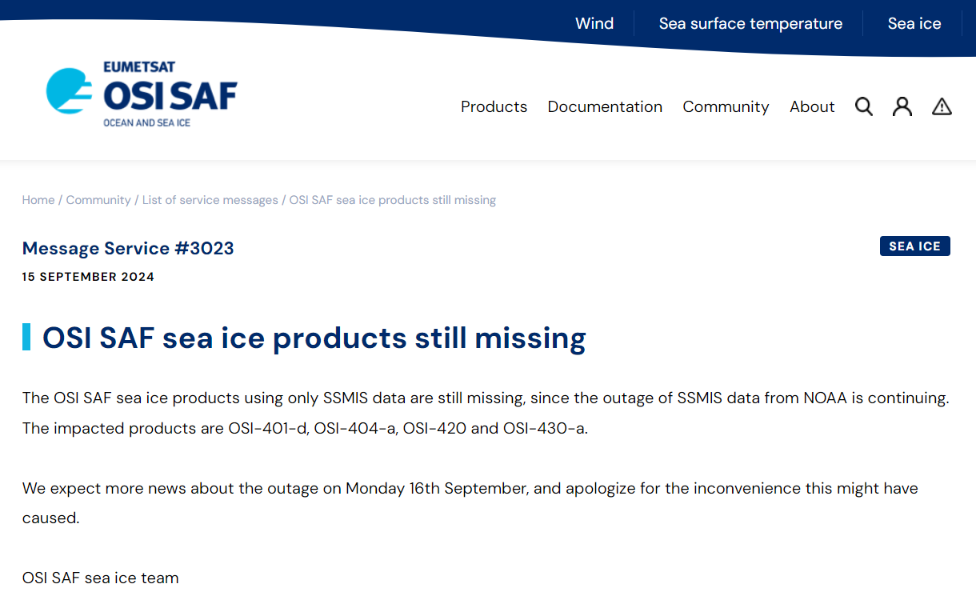
Not good timing for a data outage!
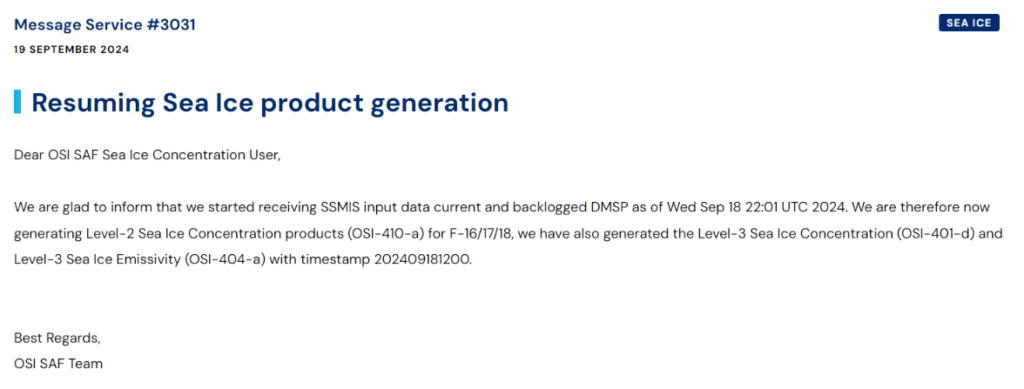
[Update – September 22nd]SSMIS data has been flowing again for a couple of days:
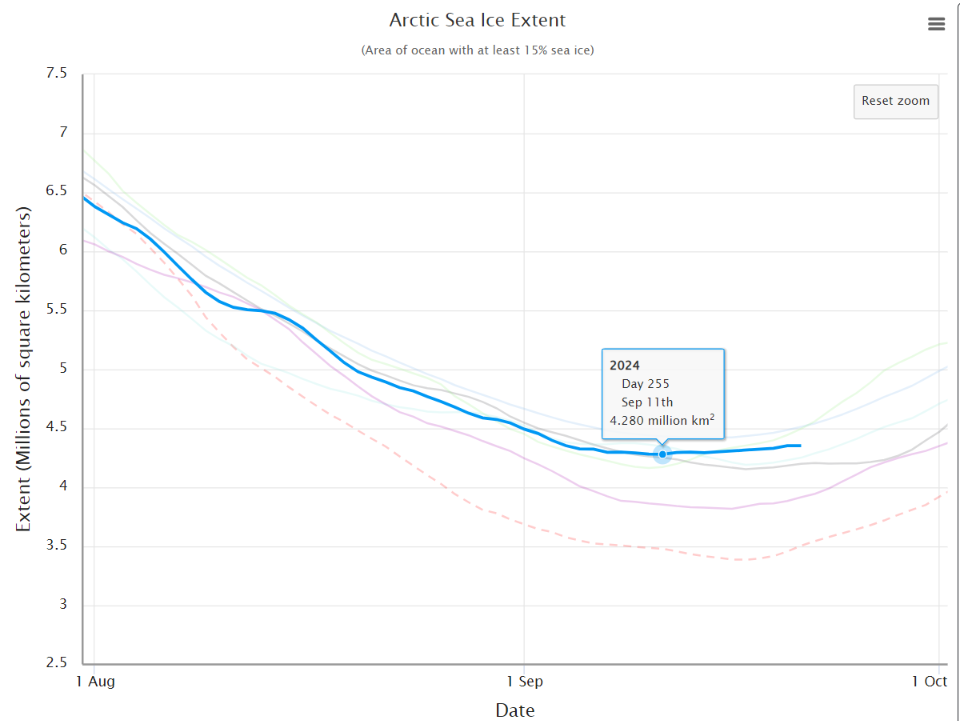
This graph may be subject to revision if and when the missing data is recovered, but currently it looks as though the 2024 minimum of the NSIDC 5 day averaged extent metric is 4.28 million km² on September 11th.
The National Snow and Ice Data Center formally announced today that:
On September 11, Arctic sea ice likely reached its annual minimum extent of 4.28 million square kilometers. The 2024 minimum is the seventh lowest in the nearly 46-year satellite record. The last 18 years, from 2007 to 2024, are the lowest 18 sea ice extents in the satellite record…
Note that this is a preliminary announcement. Changing winds or late-season melt could still reduce the Arctic ice extent, as happened in 2005 and 2010. NSIDC scientists will release a full analysis of the Arctic melt season, and discuss the Antarctic winter sea ice growth, in early October.
The NSIDC also addressed the recent missing SSMIS data issue mentioned above as follows:
Note that a gap exists in the input source data between September 12 and September 18. This gap somewhat lowers our confidence in the minimum extent estimate. However, it appears that September 11 is the mostly likely date of the minimum based on data trends in daily extent values leading up to the 5-day average on September 11 and the extent values after data restarted on September 18. If extent did drop further between September 11 and September 18, it would have been marginal. If the input source data becomes available to fill that gap, our team will update the minimum estimate if necessary.
Watch this space!
Thanks Jim! echoughton
Not seeing much decline elsewhere, Jim. JAXA seems stalled at just above 4 million, but of course, it’s usually the lowest of all the various measures. It seems to be sitting right at last years low.
Any idea what’s happening at DMI on extent? They are saying ‘issues’ and don’t seem to have an update since late August.
Overall, looks like another undramatic year for extent, but volume, particularly at DMI, seems to be the story.
There’s been plenty of “drama” from the usual “skeptical” suspects though Taylor! See for example:
https://GreatWhiteCon.info/2024/01/tony-heller-denies-global-warming/
The DMI extent graph is based on the OSI SAF data, and the Norwegian Meteorological Institute’s interactive graph is much more user friendly. See the latest data above.
“- AREA is 1st lowest in the 46 year satellite record which makes global sea ice area lowest for the day for 30 days this year.”
This statement from gerontocrat on the, “Global sea ice area and extent”, thread seems to be untrue when you look at the graph supplied below it…
Weird. I always trusted everything he posted.
*(I know it’s not arctic specific but I like the area stuff so it still points to the idea of area. The artic specific thread gives the information as it being second lowest so no problems with the information according with the graph there.. just wondered why it seemed out in the global area thread.!!)
You’ve confused me SML. This is the last graph from an ASIF post where Gerontocrat made the “1st lowest” claim:
As suggested by that projection, NSIDC global sea ice area is now second lowest.
Pardon if you’ve heard me rant about this before, Jim, but this discussion about which version of a sea ice metric says what is frustrating. JAXA, DMI and NSDIC (to name just three) are a good 10% off from each other on what purports to be the same metric (extent). This descrepancy comes at a time of the most critical sea ice season. Various scientists have varying predictions on when we get down to 1 Wadham, and what that means to the planet, yet they can’t agree on the current state.
If Eratosthenes could measure the earth to within 0.1% accuracy over 2,000 years ago, why can’t today’s scientists at least find a way to agree on how to measure this critical metric. And that’s just one of several we should know and track more precisely.
Why isn’t there an international conference where everybody with a stake in this gets locked in a room until they can agree on a single best methodology so we can agree on the current situation and trends?
And don’t get me started on global temperature…
/end of rant
Thanks for listening
Typo. NSIDC, not NSDIC.
I’m afraid it’s not that simple Taylor. First of all note that there are assorted different types of sensor up in space, and different algorithms for processing the data they acquire.
Then I suggest you read my conversation with Walt Meier:
https://GreatWhiteCon.info/2016/02/dmi-masie-and-the-sea-ice-index-an-interview-with-walt-meier/
The SSMIS sensor on board a few Defense Meteorological Satellite Program satellites is currently used to generate the NSIDC’s sea ice index. However the US has no plans to launch any more of them into space. What do you suppose will happen when the last of them dies?
Well, I see that MASIE is making a brave attempt to keep reporting, and now shows 4.6M, up slightly from their bottom of 4.5M. Nobody else of note is anywhere close to current at the most critical time of the year. Why haven’t we heard from NASA about a solution? Should somebody reach out to Elon for a solution? He’s bailed out NASA before…
And while we’re on the subject, is there a plan to resolve the ARCUS contest, given this data situation? It appears they use the NSIDC extent metric, which seems a bit problematic now. Given that the September average is highly likely to be ABOVE the mean prediction, I’m sure many are anxious for the answer.
It sounds as though ARCUS/SIPN have run out of funding, and are currently continuing on a “voluntary” basis.
MASIE is still reporting, which rather proves Walt Meier’s point:
And don’t get me started on Elmo’s algos!
Oh, OK… the 30 days he mentioned wasn’t contiguous! Got it!!
Another year the arctic isn’t ice free. Al Gore is looking very silly now.
If you insist on introducing political takes on climate…
Not as silly as Donald J. Trump!
N.B. https://GreatWhiteCon.info/2014/09/david-roses-apocalyptic-vision-of-al-gores-nobel-lecture/
That counter to David Rose was not your finest hour, Jim. Gore spoke from a global podium with all the credibility due a Laureate. He quoted, as fact and strong likelihood, some scientists who were dead wrong.
In response, you quibbled about ‘projection’ vs ‘prediction’, a distinction the lay public is unlikely to grasp. Gore’s talk was aimed at that same lay public, specifically to raise alarm, an unjustified alarm, given the ‘projections’ he used.
Scientists, and the scientifically-minded (and you are certainly in that group), have a responsibility to own up to their words if they are wrong. This is particularly true if those words had a deliberate purpose, and even more particularly true if that purpose was political.
I would be fine with Gore if at some point he’d said “well, I guess we got that wrong, but…”. Haven’t heard that from him, and have accordingly lost respect.
Al Gore is a politician Taylor, not a climate scientist. Perhaps he doesn’t understand the difference between a “prediction” and a “projection” either? He used the word “estimated”.
How often have you heard a politician say words along the lines of “sorry, I got that wrong”?
The lay public is educated!
The lay public is hardly ‘educated’. Surveys indicate that a large segment is well indoctrinated, and another segment has reacted so badly to the attempted indoctrination that they no longer believe in the science at all. There is a segment of unknown size that fits in the ‘lukewarmer’ category and disputes CAGW alarmism. That’s the only segment I believe can be characterized as ‘educated’, and I fear it’s the smallest segment of all…
It’s not an unjustified alarm.
I think Al Gore is fine with you losing respect for him. He would rather the respect of generations to come for warning them of the numbers they are now seeing getting worse.
Given Gore’s attempt to profit from his doomsaying, and his patently false claims and ‘projections’, he has declining respect now, and I do not expect that respect to increase as the future reveals even more discrepancies between his assertions and climate reality. Let’s give it ten more years, ok? That should be enough to put the final nails in his rhetorical coffin.
There never will be ice-free! Ice-free is defined as not being ice-free!
“Ice-free is not ice-free…”. Correct. The latest definition I’ve seen is that ‘ice-free’ will be declared when 1M sq Km remain, what more than one wag has labeled “1 Wadham”. In honor of the Professor who most often and most loudly has predicted the end of Arctic ice, any day now…
What is a wag?
“What is a wag?”
From the online Free Dictionary:
wag (wæɡ)
n
a humorous or jocular person; wit
[C16: of uncertain origin]
ˈwaggery n
ˈwaggish adj
ˈwaggishly adv
ˈwaggishness n
The general connotation as I have heard it used is someone who uses sarcastic or ironic humor, poking fun at people or events.