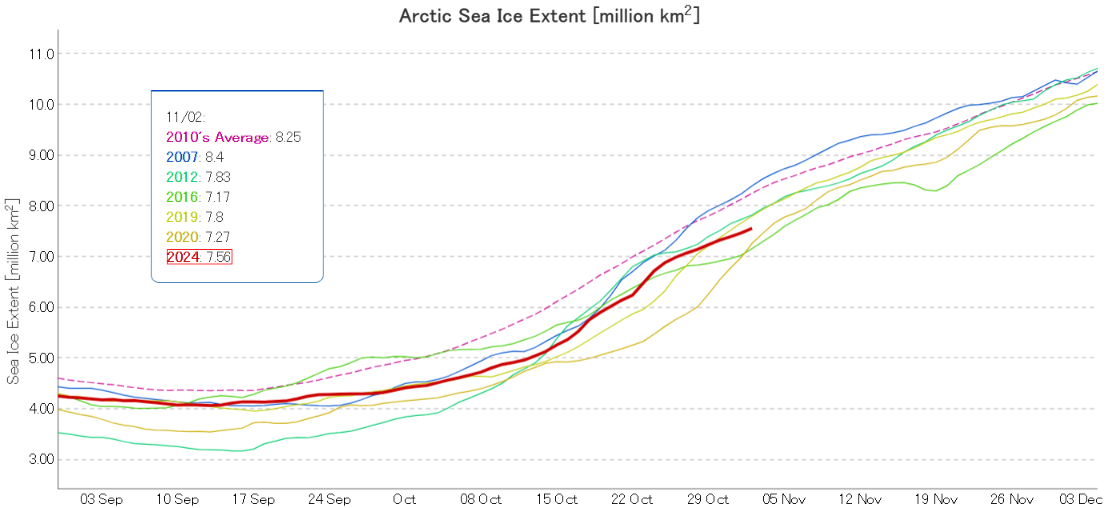
The Laptev and East Siberian Seas have now refrozen. Consequently Arctic sea ice extent is now increasing more slowly, and JAXA/ViSHOP extent is 3rd lowest for the date in the satellite era:
Note the change in scale from previous months, to allow for easier comparison with the “near real time” CryoSat-2/SMOS merged thickness data from the Alfred Wegener Institute:
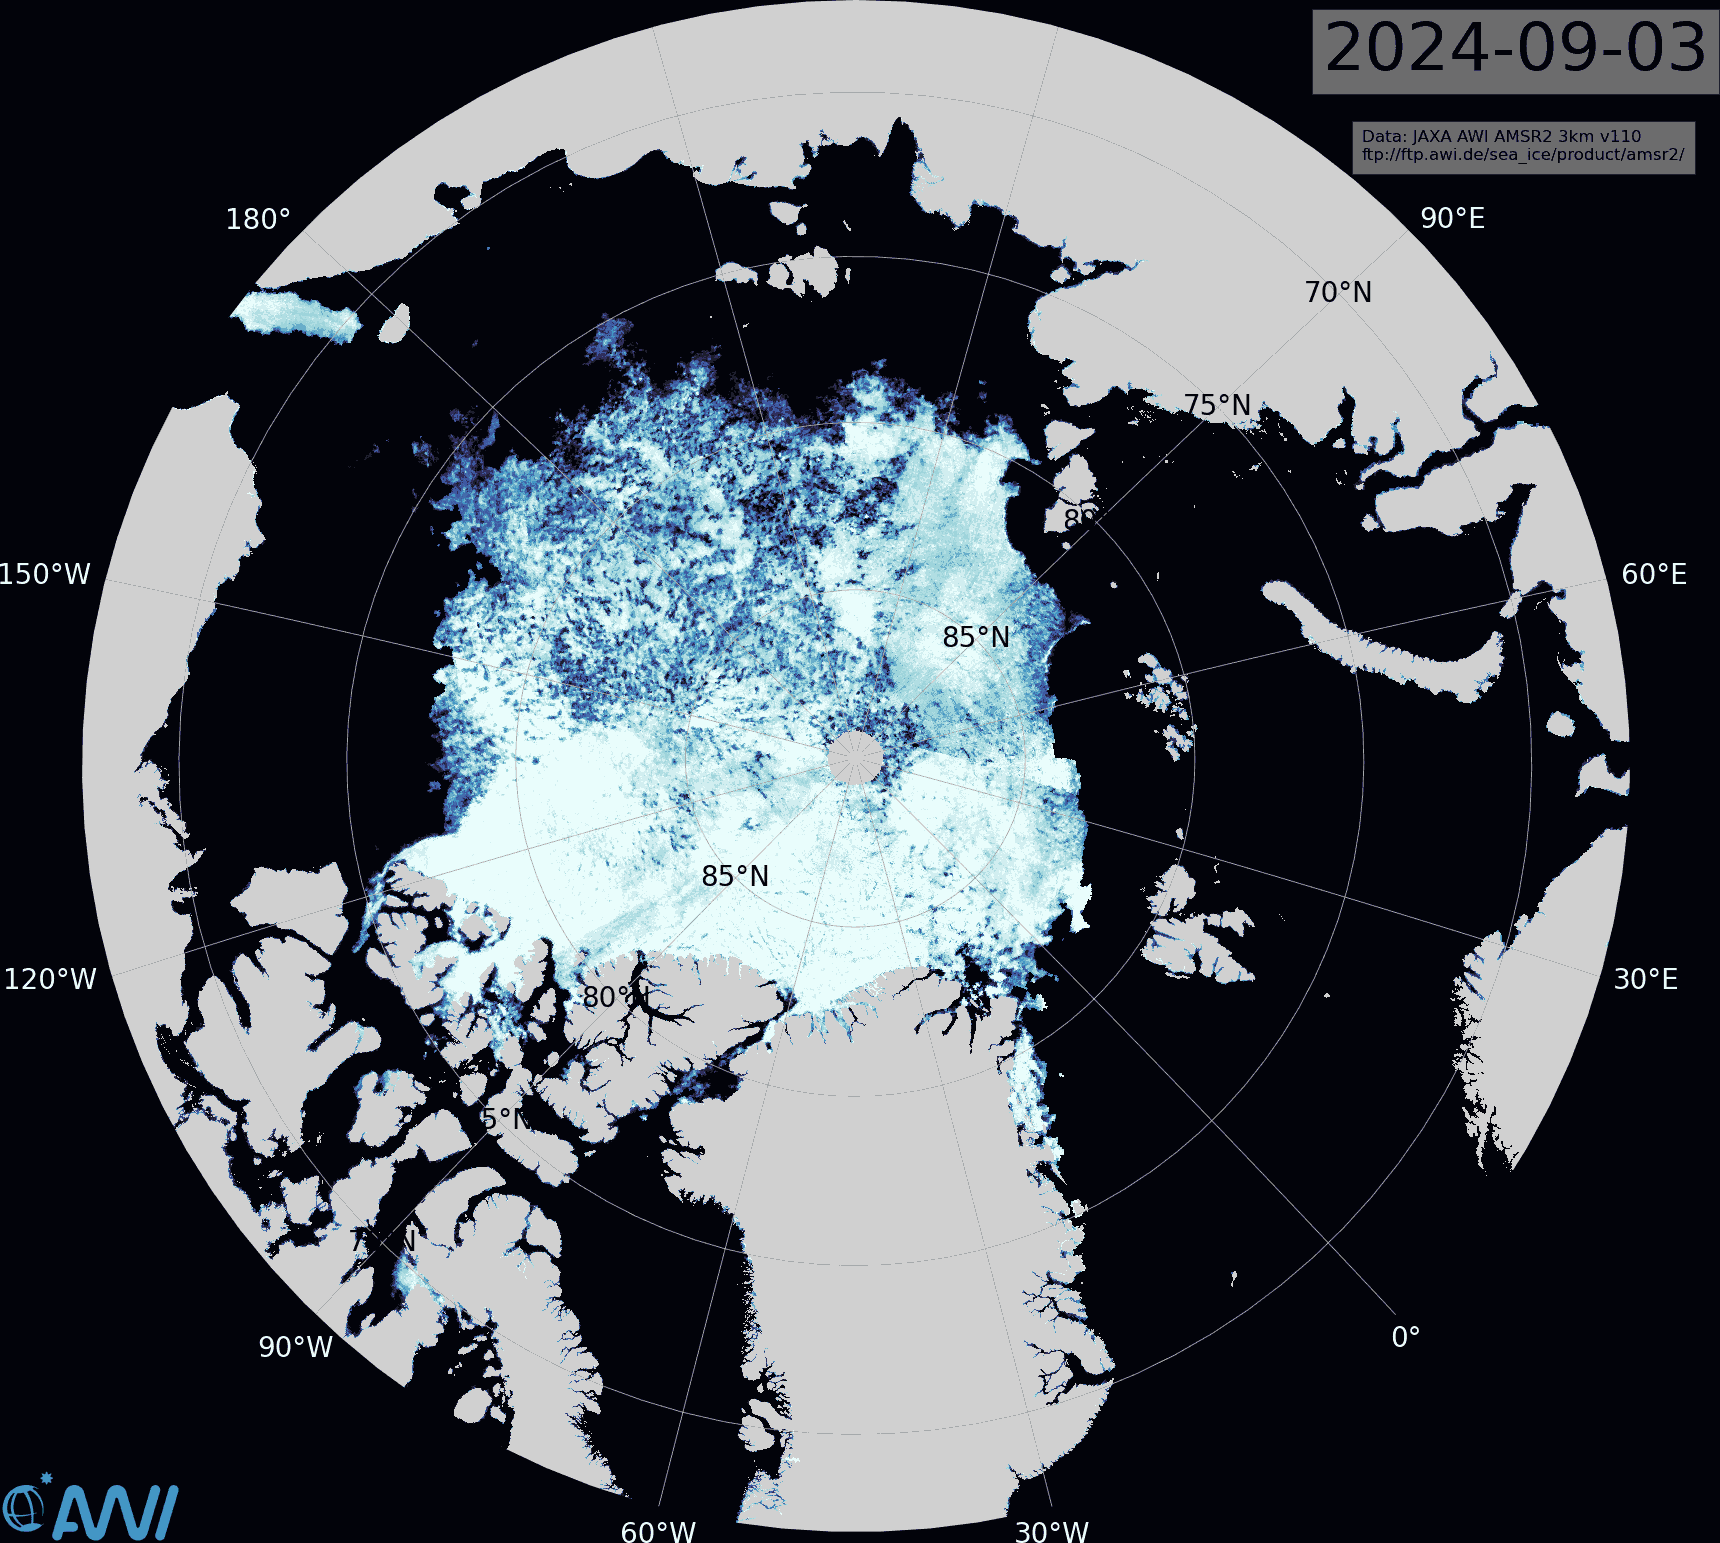
The JAXA extent graph is currently not updating, so let’s begin this month with the latest AMSR2 sea ice concentration map from the Alfred Wegener Institute. Click the image to see a ~10 Mb animation of the last four weeks:
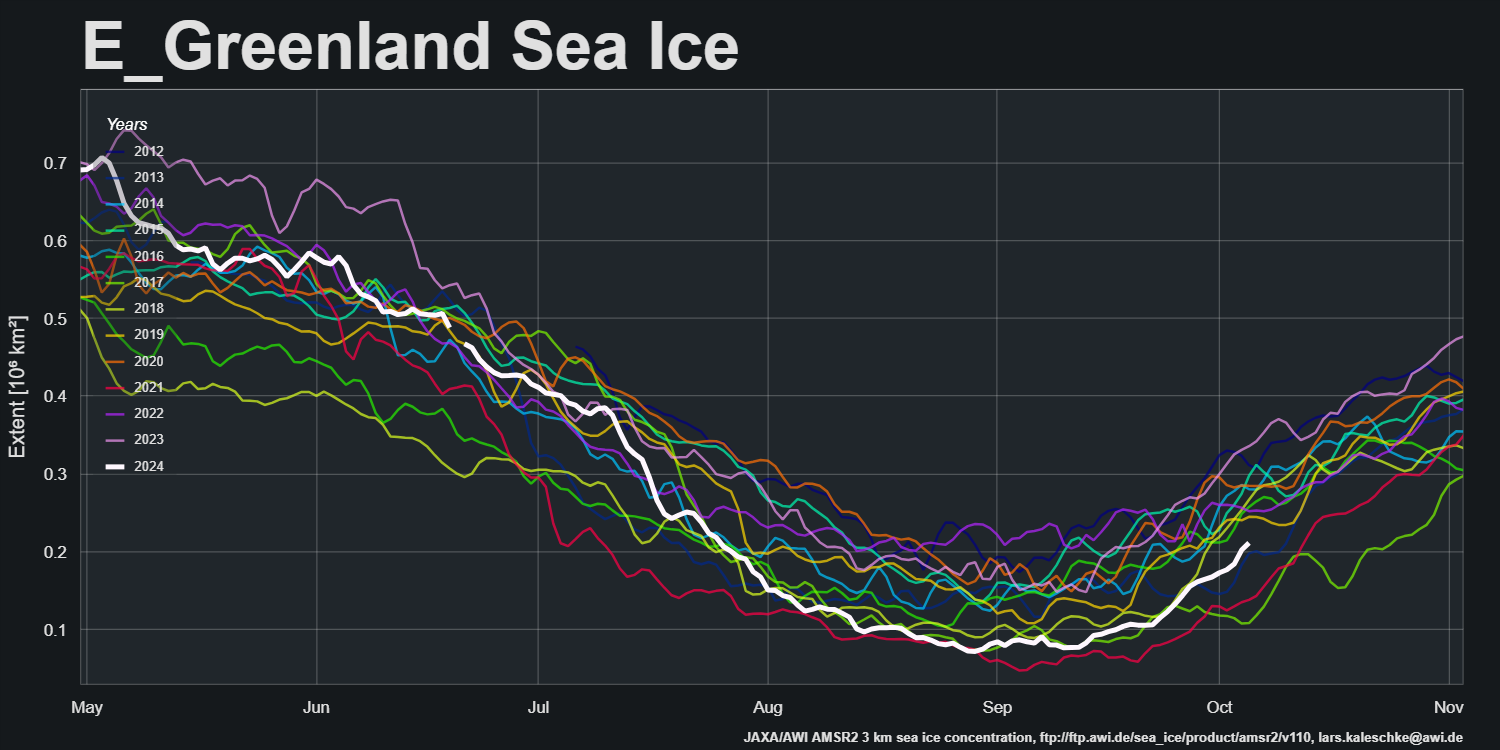
Note in particular the restart of export into the East Greenland Sea via the Fram Strait:
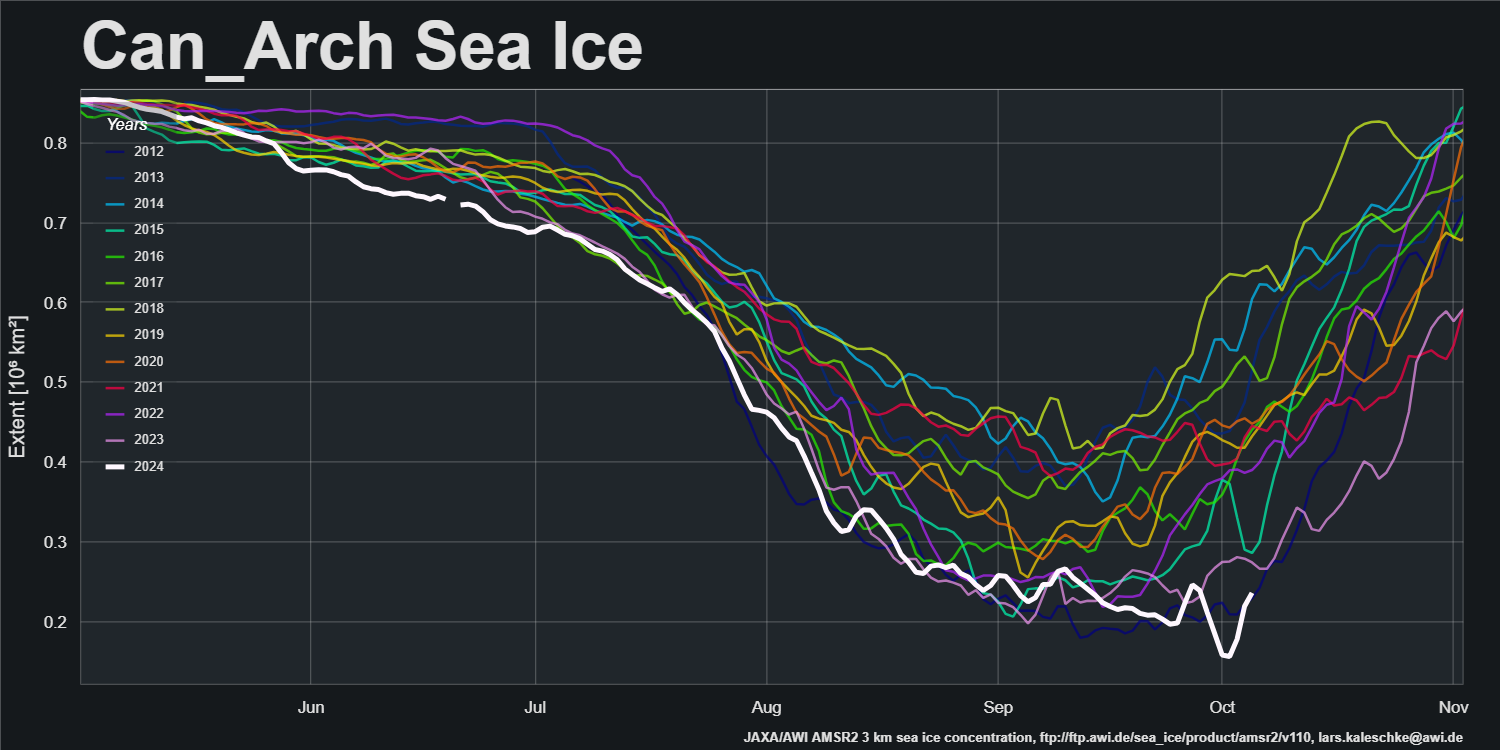
and the movement of ice within the Canadian Arctic Archipelago:
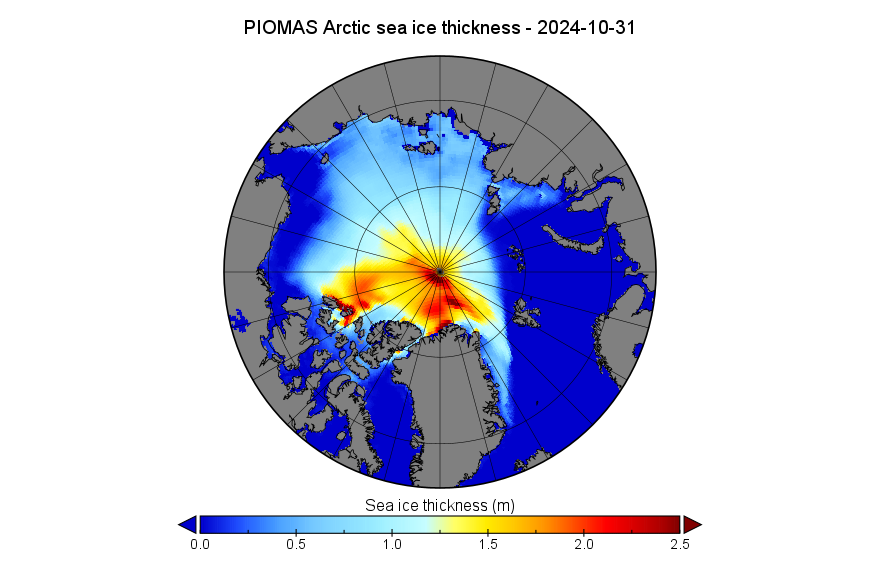
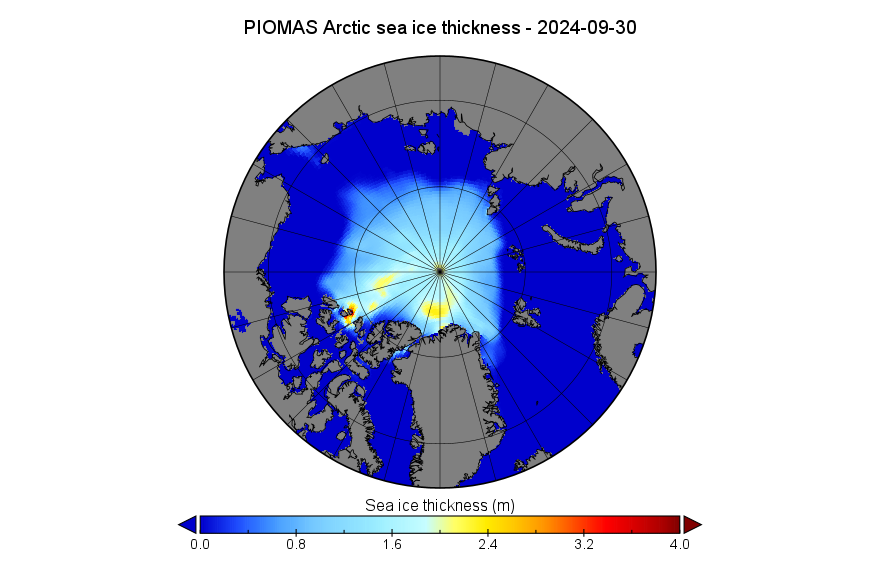
The PIOMAS gridded thickness data for September 2024 has been released:
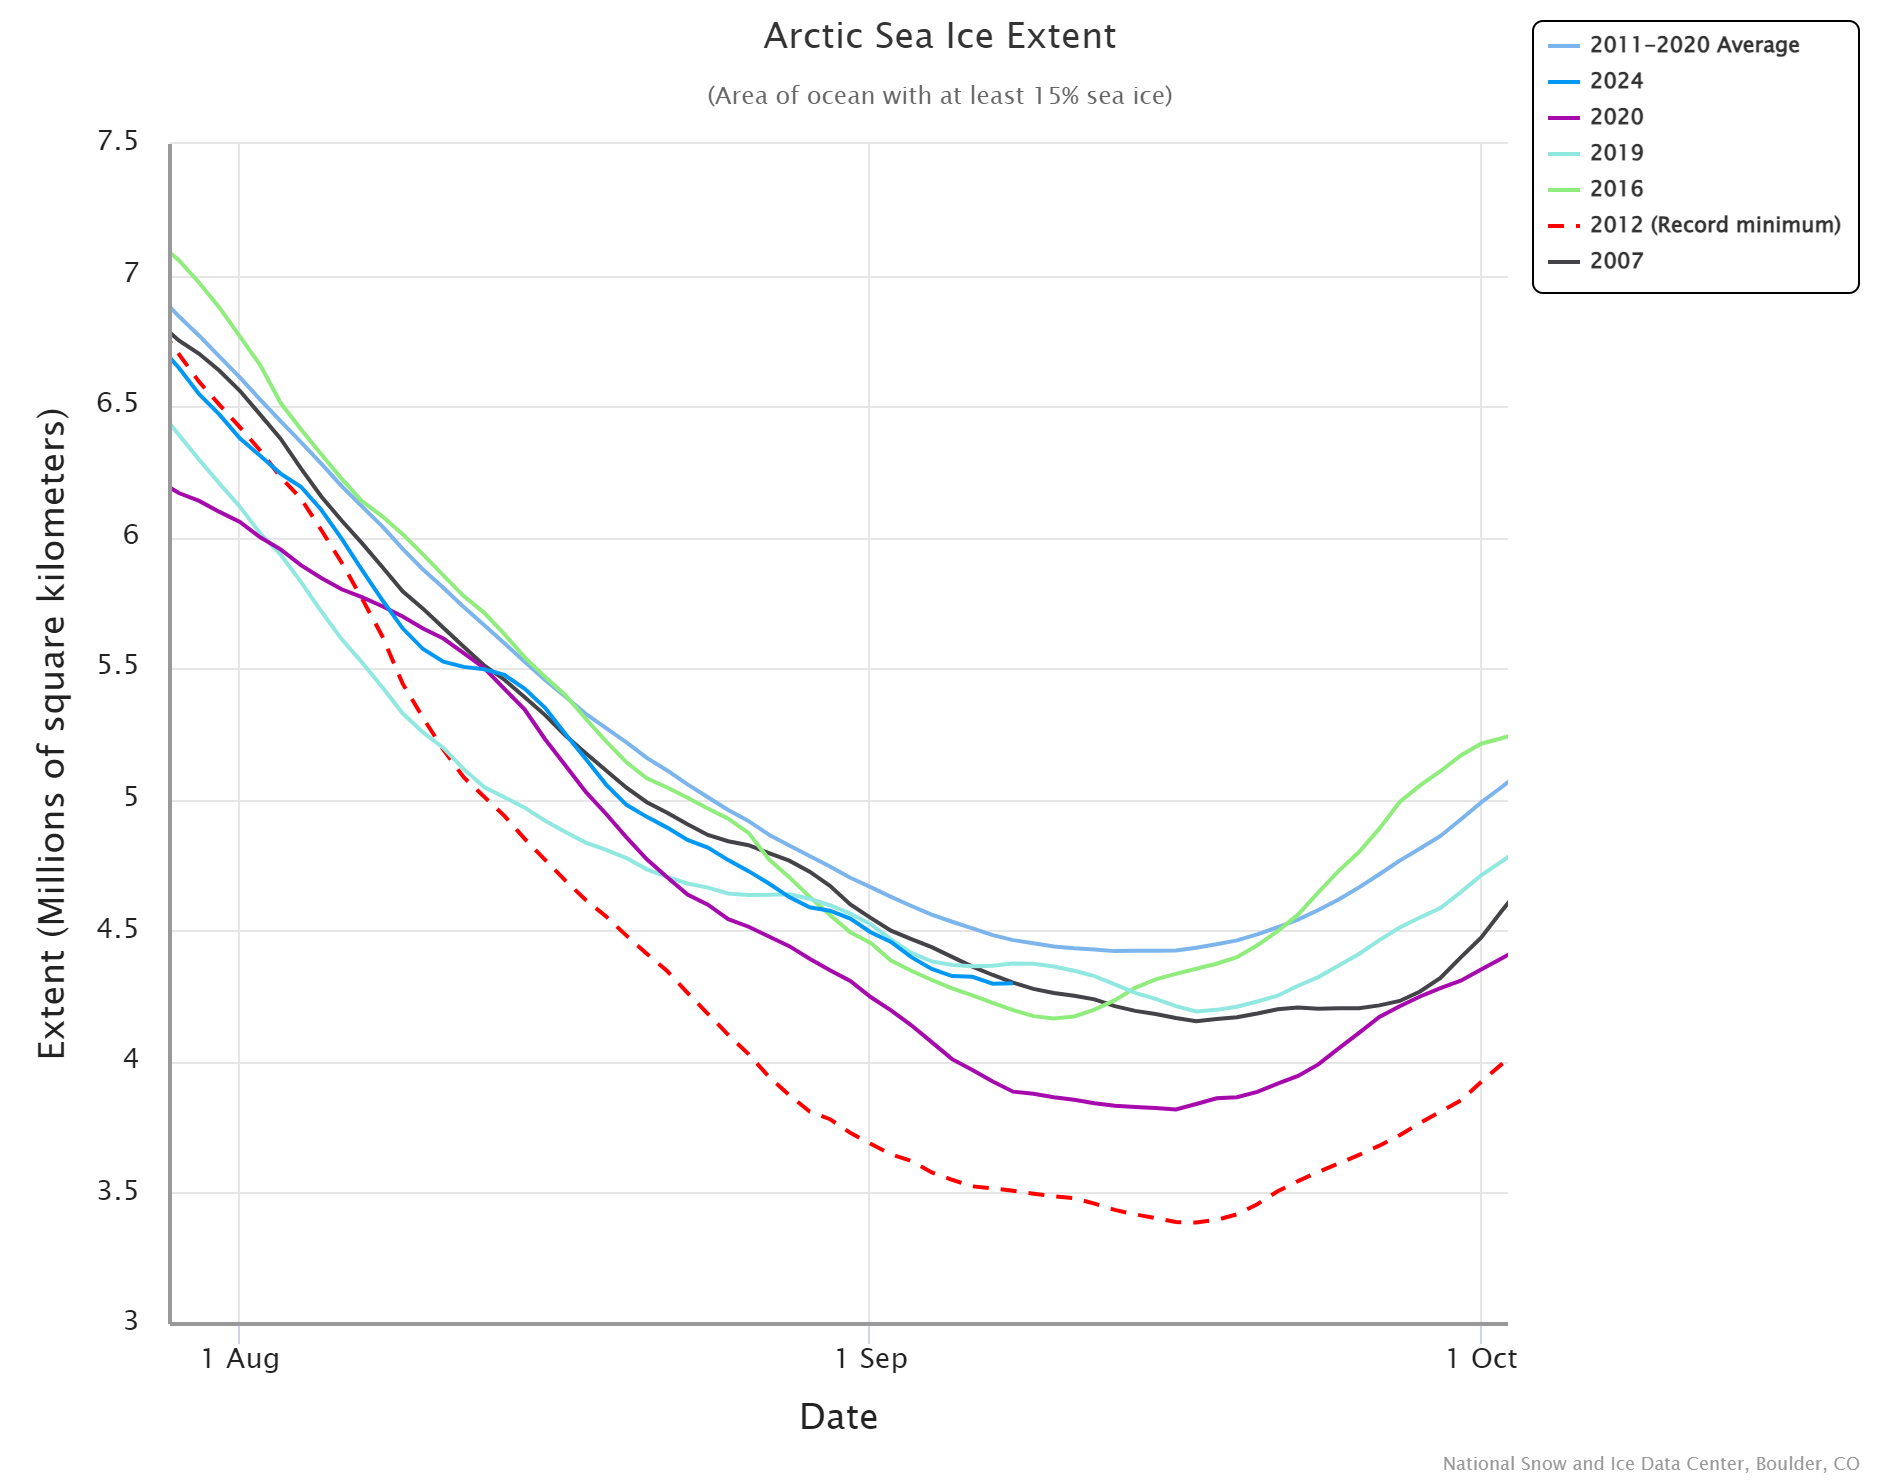
Earlier today the National Snow and Ice Data Center announced that:
On September 11, Arctic sea ice likely reached its annual minimum extent of 4.28 million square kilometers (1.65 million square miles). The 2024 minimum is the seventh lowest in the nearly 46-year satellite record. The last 18 years, from 2007 to 2024, are the lowest 18 sea ice extents in the satellite record…
Note that this is a preliminary announcement. Changing winds or late-season melt could still reduce the Arctic ice extent, as happened in 2005 and 2010. NSIDC scientists will release a full analysis of the Arctic melt season, and discuss the Antarctic winter sea ice growth, in early October.
Consequently several of the usual cryodenialospheric suspects have been frantically spinning their webs of deceit around the announcement.
First up was Javier Vinós, who beat the NSIDC’s starting gun by firing a broadside on X (formerly Twitter) on Sunday. If you’re unfamiliar with the name, Javier frequently pontificates about Arctic sea ice, amongst other things, on Judith Curry’s “Climate Etc.” blog. He confidently announced that:
Arctic sea ice reaches its annual minimum with an extent greater than in 2007, 2012, 2016, 2019, 2020 and 2023.
The two warmest years in a row at > +1.5°C have ZERO IMPACT on the 17-year resilience of Arctic sea ice.
Needless to say, “Snow White” felt compelled to quibble:
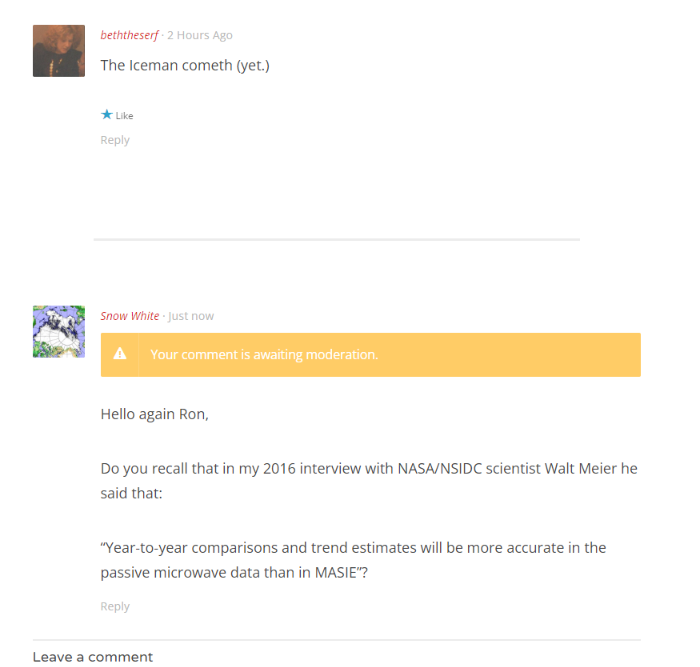
On several previous occasions “Snow White” and I have documented Ron Clutz’s misuse of MASIE Arctic sea ice extent data on his “Science Matters” blog. We agree with Ron that science matters, so on several occasions we have attempted to direct his attention to my interview with NASA/NSIDC scientist Walt Meier. Walt’s words of wisdom included:
Year-to-year comparisons and trend estimates will be more accurate in the passive microwave data than in MASIE.
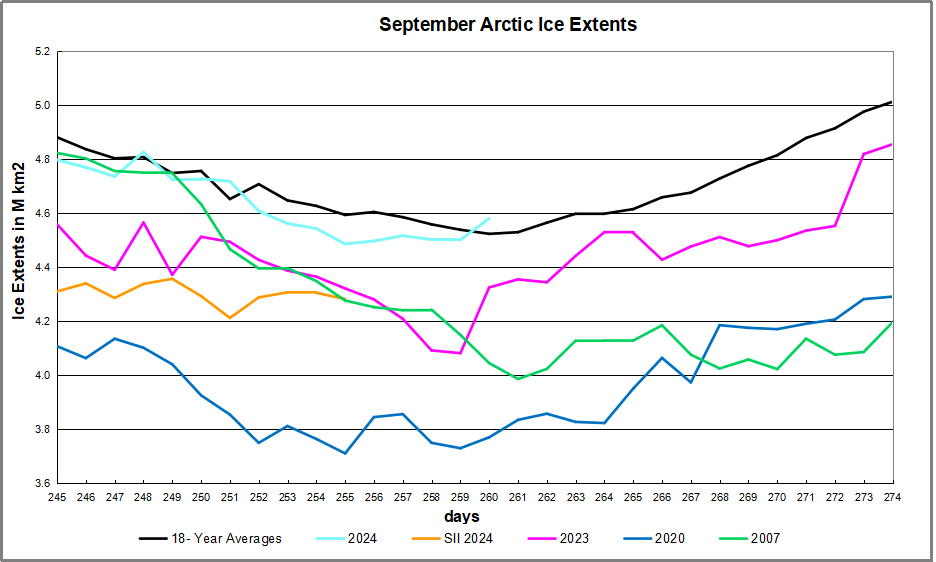
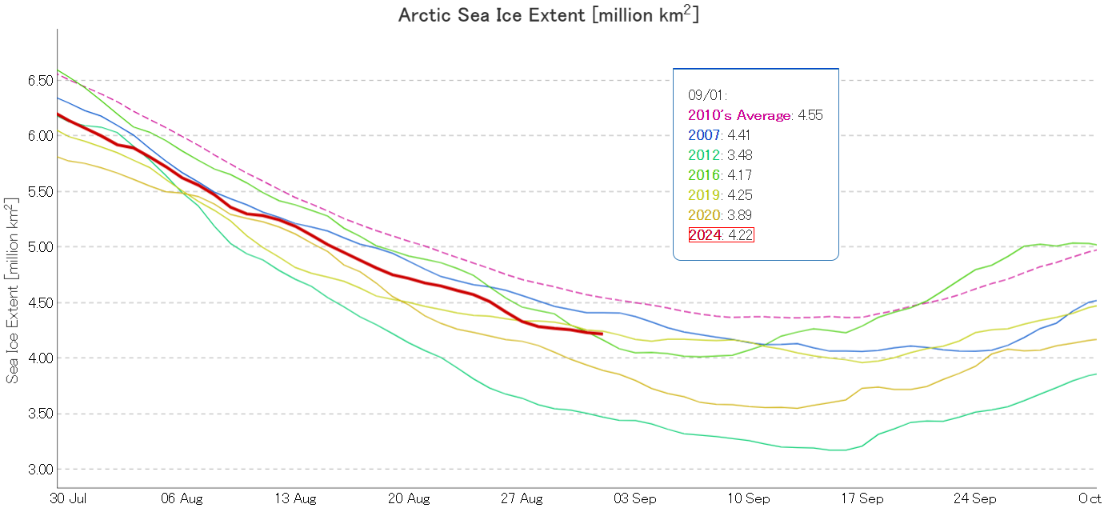
It will probably not surprise you to learn that Ron has not learned anything from our repeated efforts. In his article entitled “2024 Arctic Ice Beats 2007 by Half a Wadham” earlier today Ron proudly displays this graph:
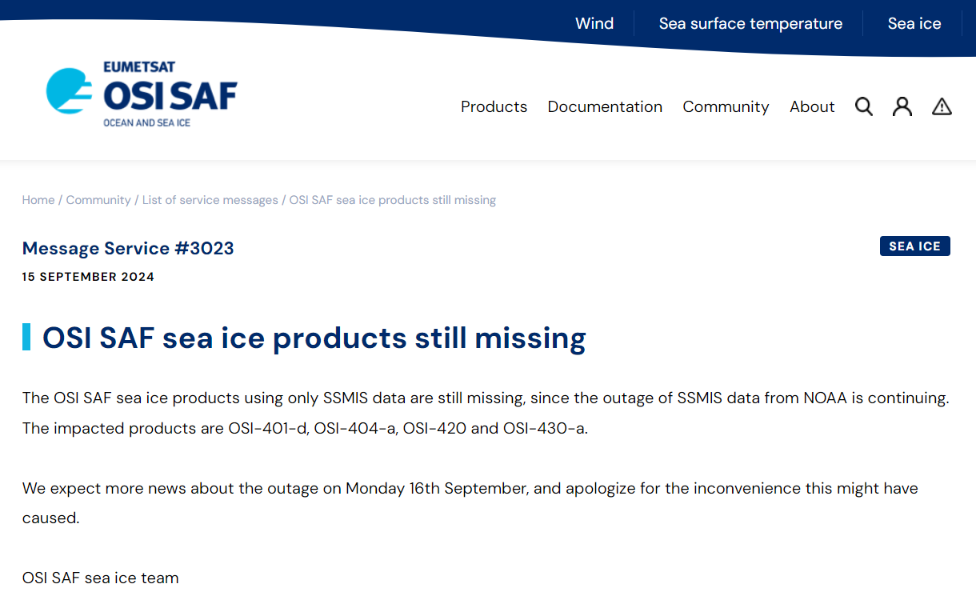
You will note that Ron does not provide details of his data source. However I have recently noted a sudden lack of SSMIS passive microwave data emanating from NOAA. The OSI SAF reported it this way on September 12th:
Dear OSI SAF Sea Ice Concentration User,
Due to missing input data, we have not been able to generate L2 products, corresponding to F-16 / F-17 / F-18 since Sep 11 19:36 UTC.
We apologize for any inconvenience.
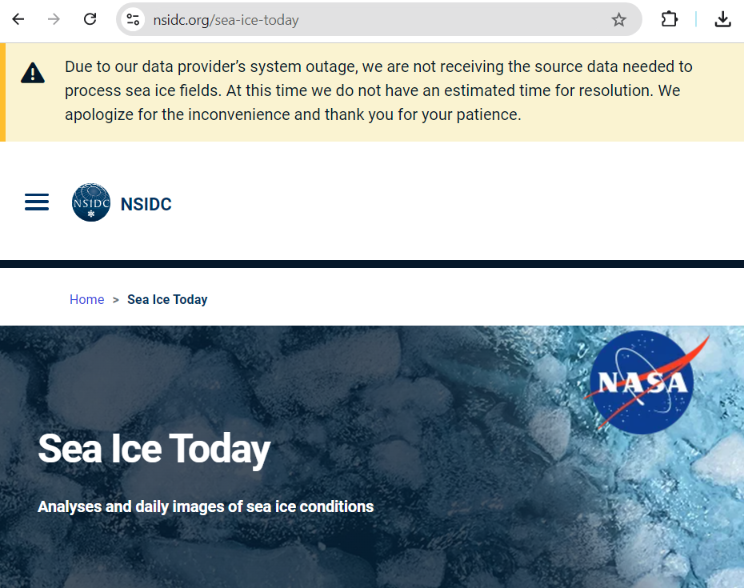
The NSIDC’s sea ice home page puts it this way today:
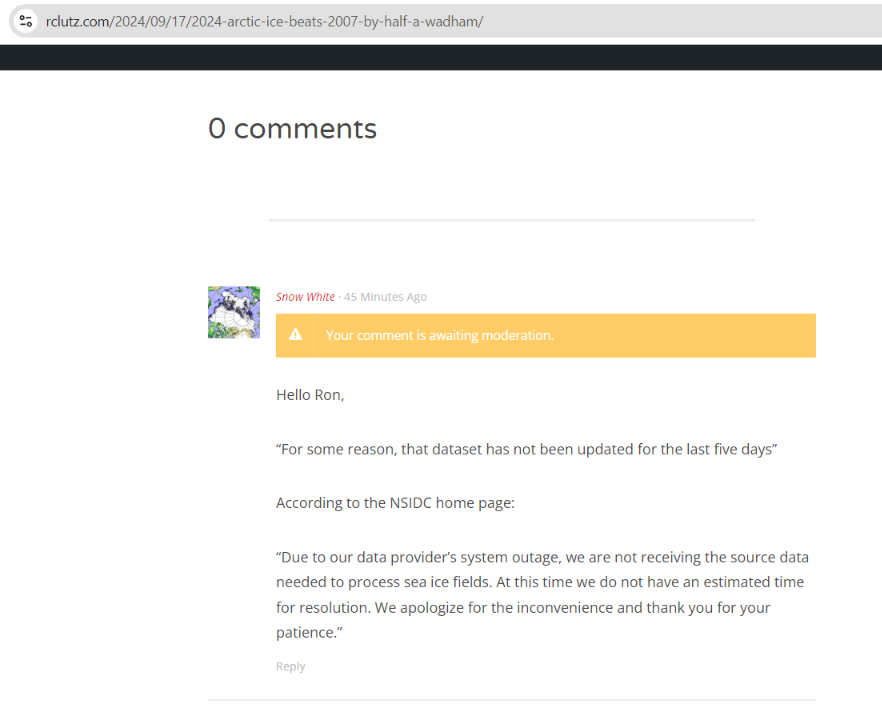
Now day 260 of 2024 is September 16th, so it seems safe to assume that Ron is erroneously using his favourite MASIE metric for year to year comparisons yet again. In his article Ron states that:
SII was reporting deficits as high as 0.5M km2 (half a Wadham) compared to MASIE early in September. For some reason, that dataset has not been updated for the last five days.
It appears as though Ron has also not yet learned how to find NSIDC’s sea ice home page on the world wide interweb!
I added this hopefully helpful comment below Ron’s article. For some strange reason it is yet to emerge from his moderation queue:
[Update – September 18th]
Our regular reader(s) will not be surprised to learn that my helpful comment yesterday is no longer in Ron’s moderation queue, but is now languishing underfoot on his cutting room floor.
Ron has written another Arctic article using the graph reproduced above. This one is entitled: “2024 Arctic Ice Abounds at Average Daily Minimum“. In it Ron assures his flock of faithful followers that:
We are close to the annual Arctic ice extent minimum, which typically occurs on or about day 260 (mid September). Some take any year’s slightly lower minimum as proof that Arctic ice is dying, but the image above shows the Arctic heart is beating clear and strong.
Over this decade, the Arctic ice minimum has not declined, but since 2007 looks like fluctuations around a plateau.
Ron has also changed his phraseology regarding the recent SSMIS data outage. This time it reads:
For some reason, apparently data access issues, that dataset has not been updated for the last five days.
“Snow White” felt compelled to leave Ron another helpful comment concerning his new words of Arctic wisdom:
At the beginning of September JAXA/ViSHOP extent was 4th lowest for the date in the satellite era:
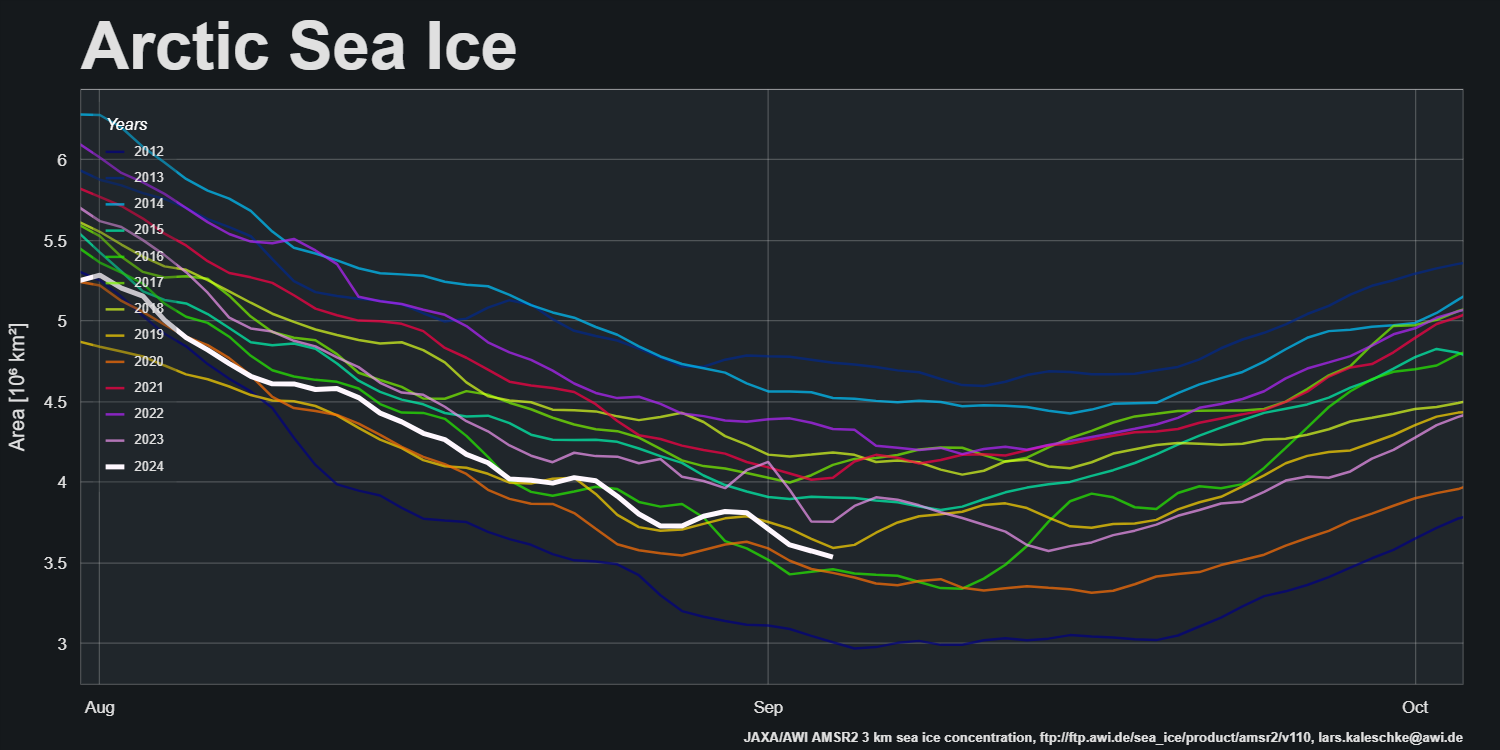
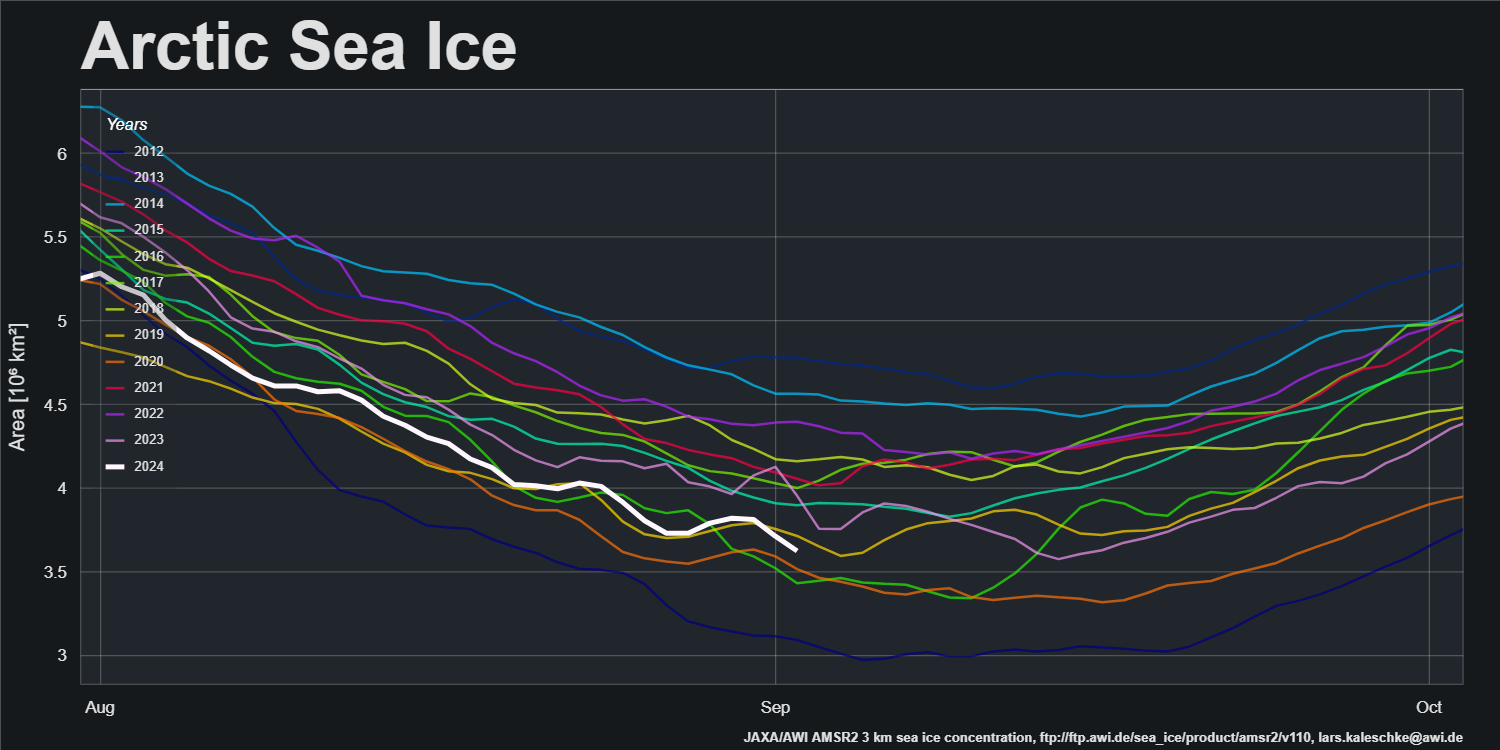
For much more detail on sea ice extent for the next few weeks please see the dedicated 2024 minimum thread. However, note that as extent has been flatlining sea ice area is still declining:
The latest AMSR2 sea ice concentration map from the Alfred Wegener Institute reveals that the area of thick ice in the Chukchi Sea has still not melted:
The most recent sea ice age map currently available dates from the beginning of August. Comparison with the concentration map shows that most of the remaining first year ice is highly fragmented, even close to the North Pole:
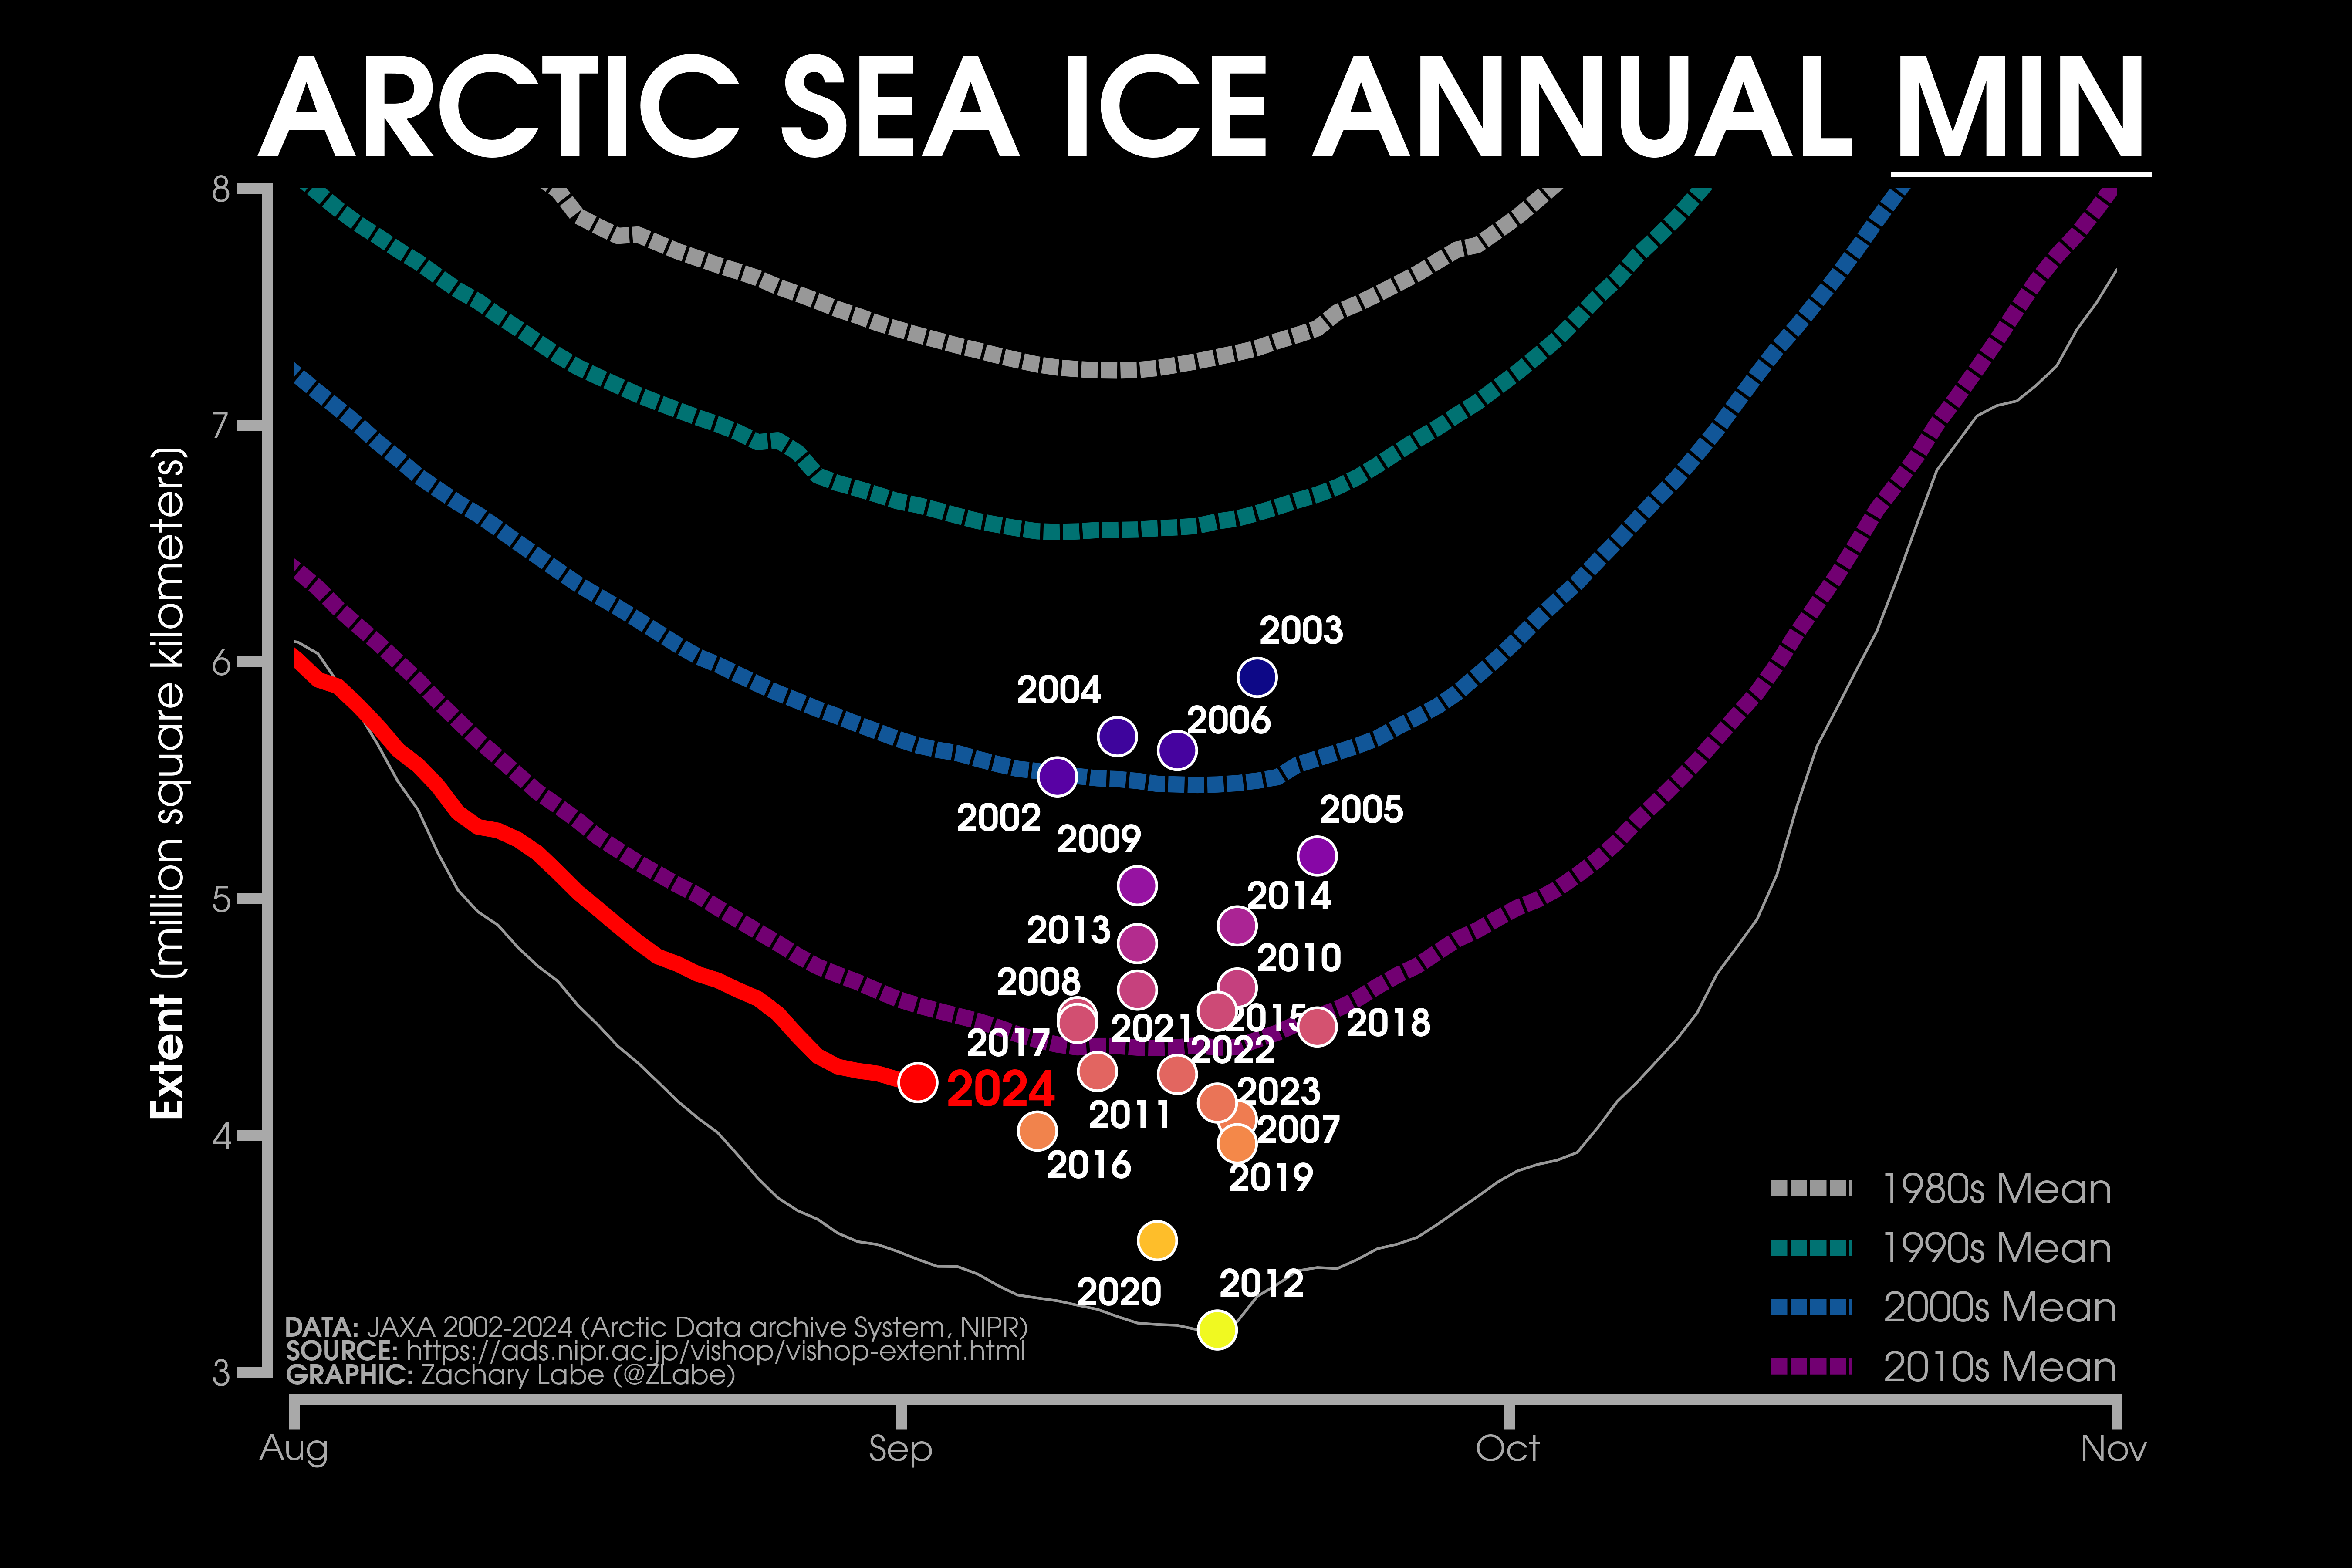
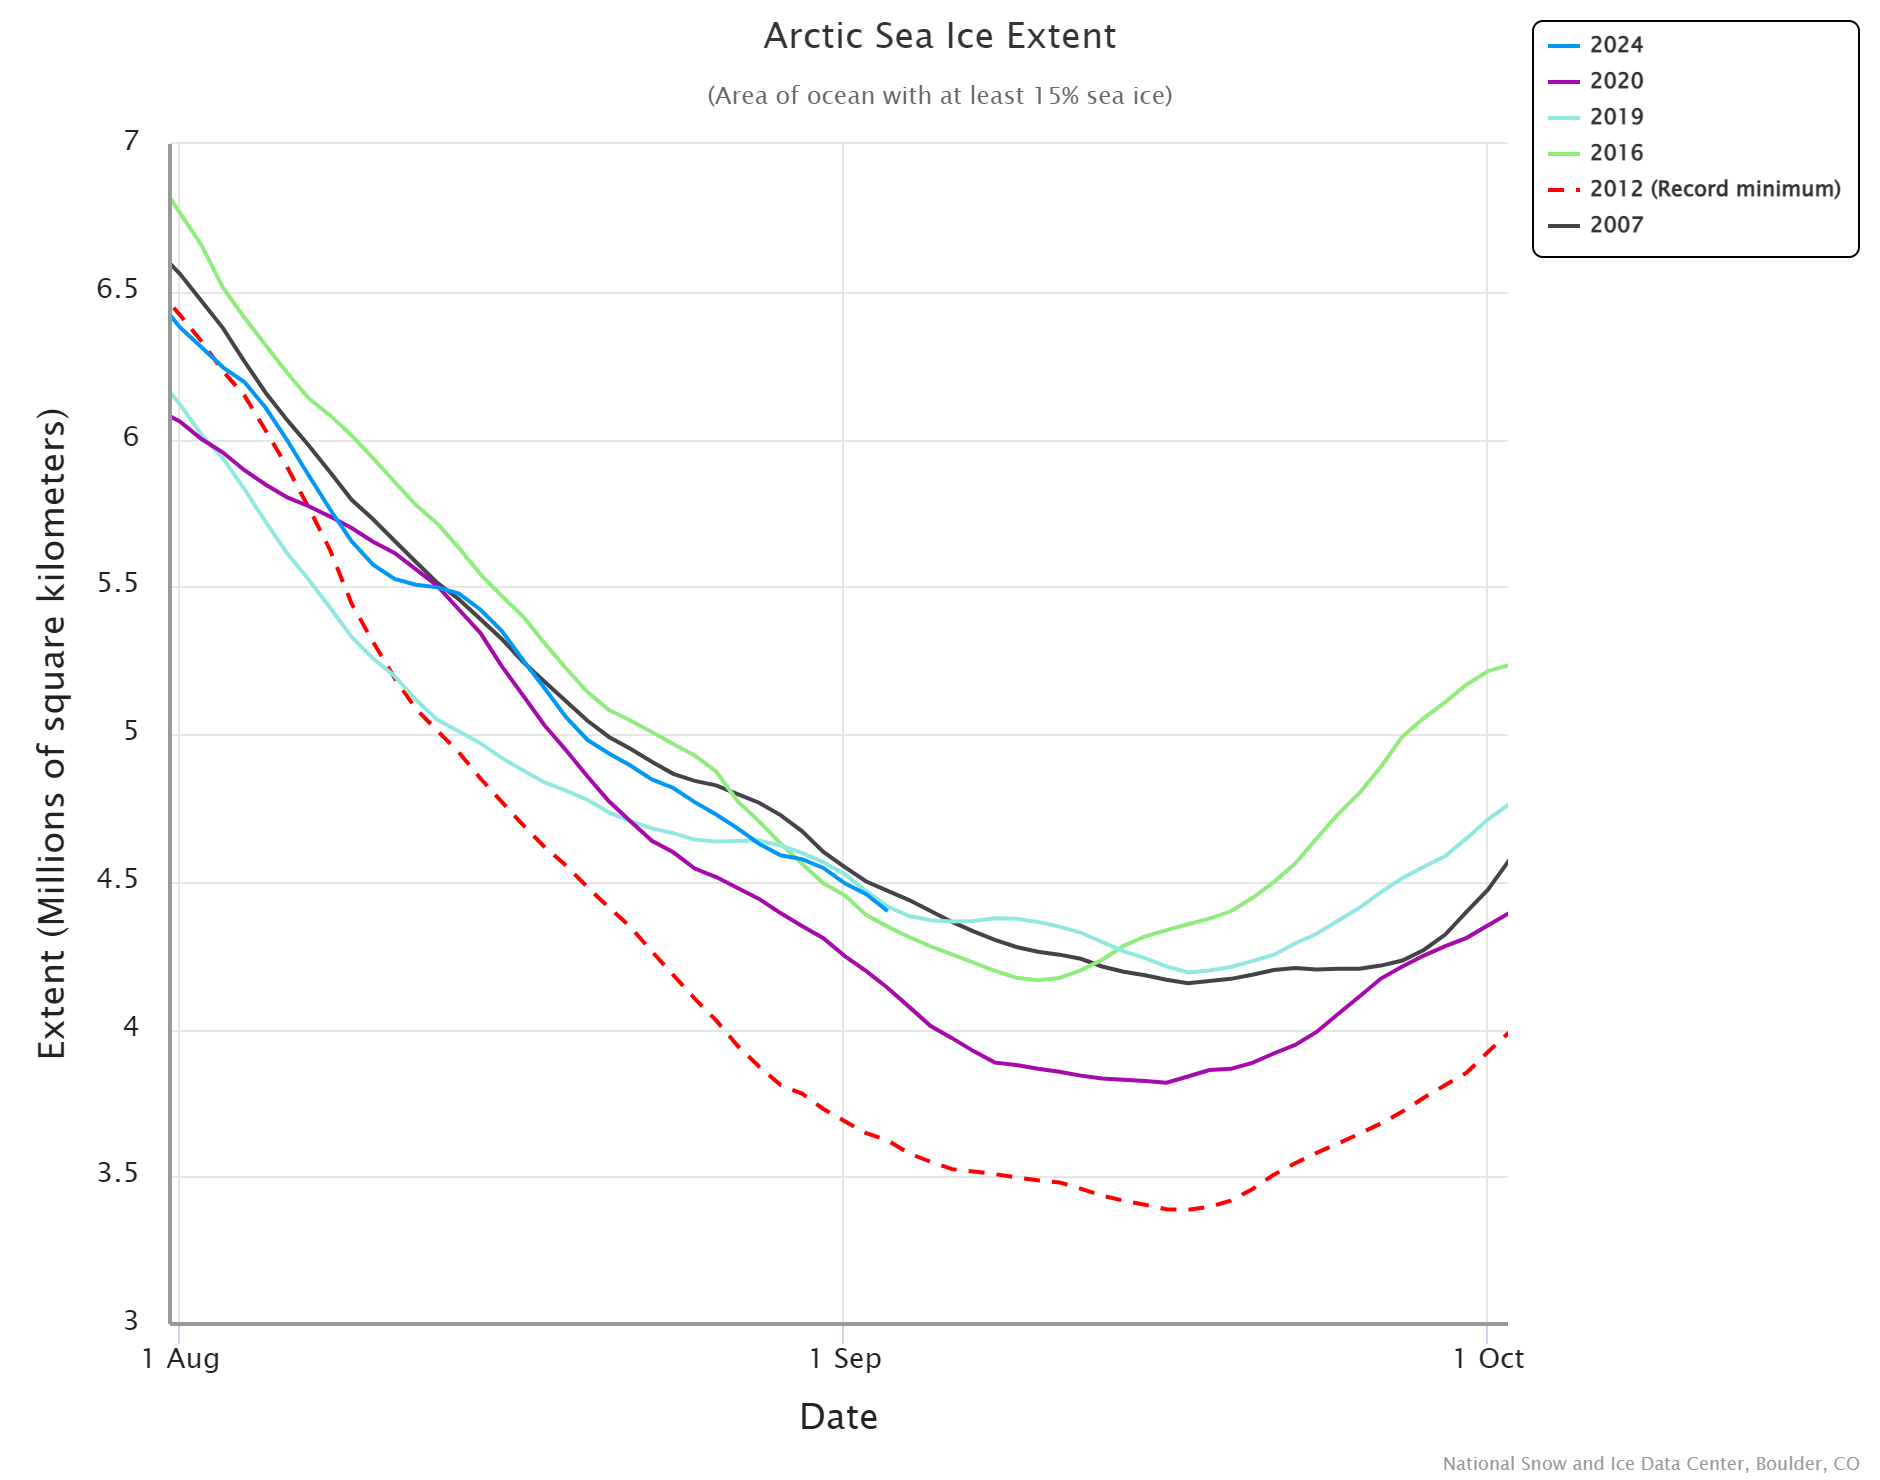
The 2024 Arctic sea ice minimum extent will almost certainly occur at some point over the next month. The exact date and level will vary from one extent metric to the next. Here’s a comparison of the current JAXA extent with previous minima, courtesy of Zack Labe:
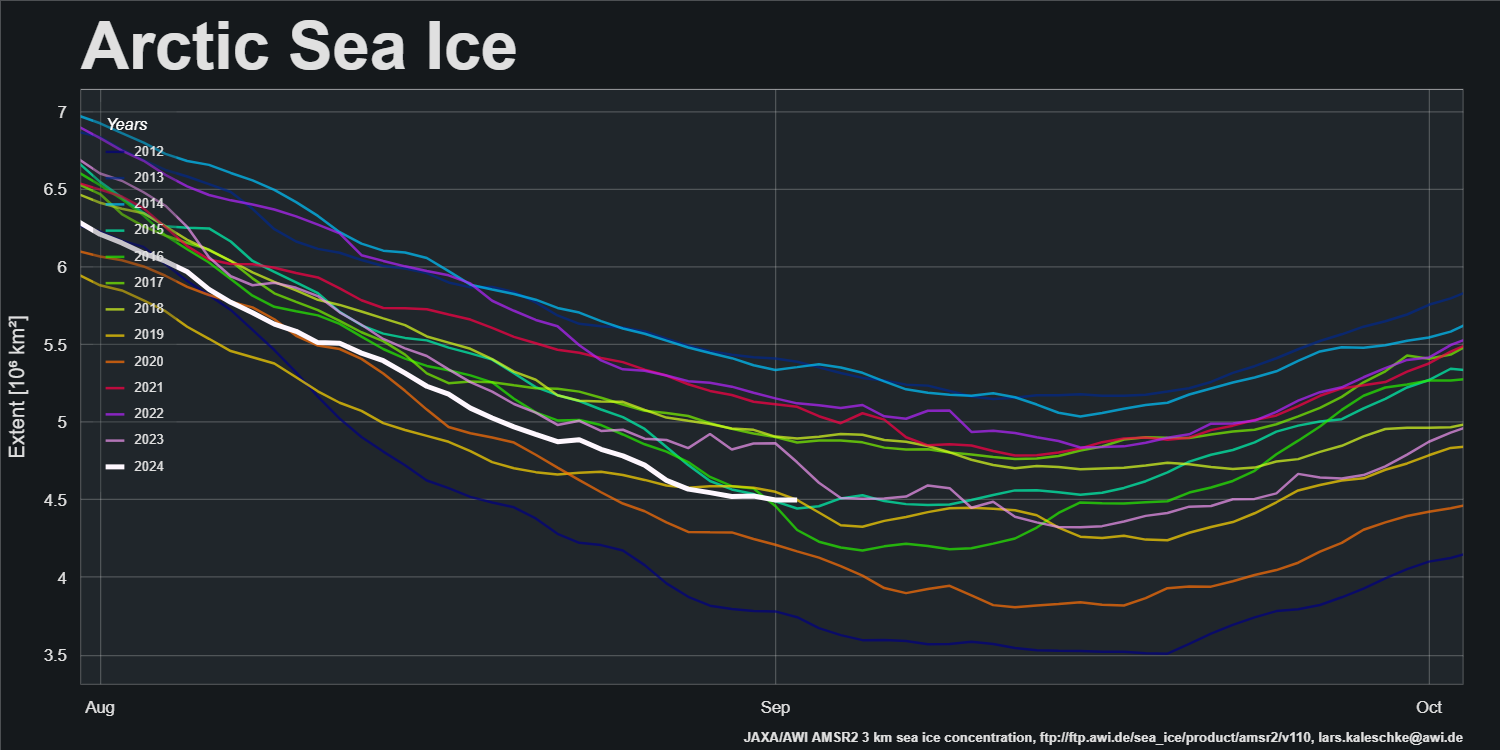
Here too is a more detailed look at 2024 extent compared with the 5 lowest annual minima in the JAXA record:
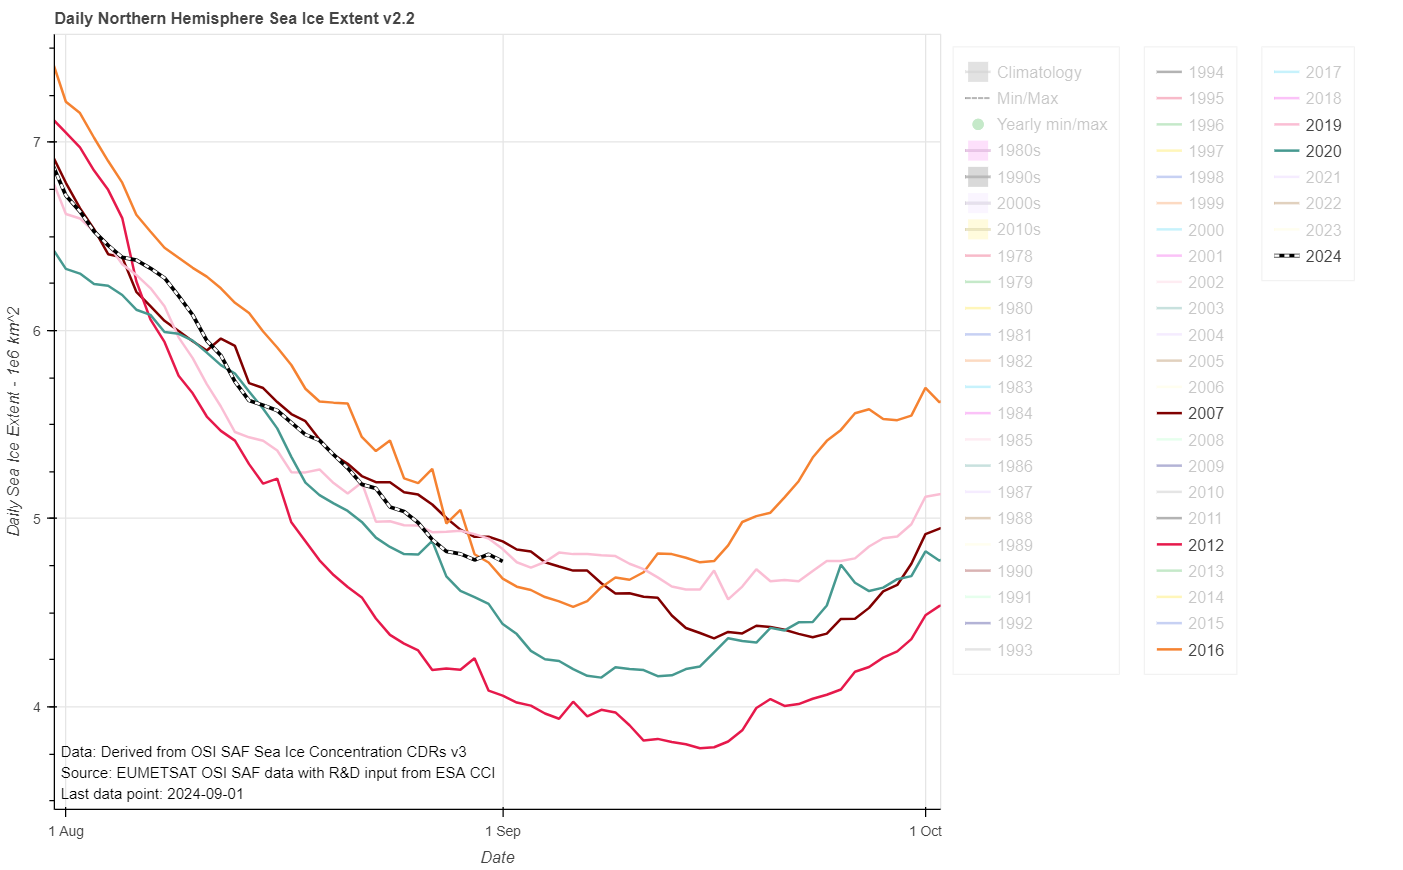
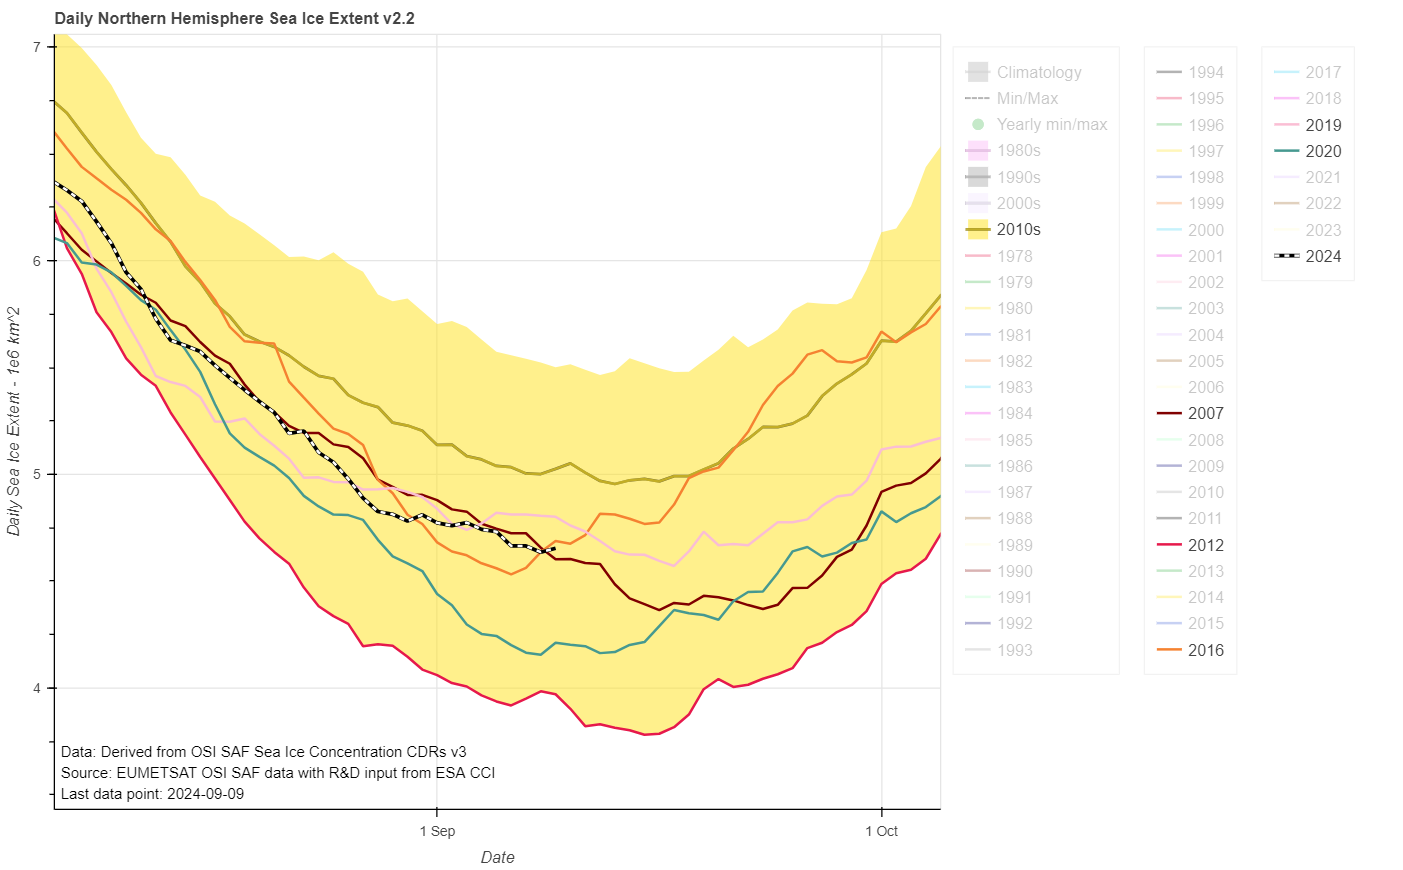
By way of comparison, here is the equivalent graph for the OSI SAF extent metric, which experienced an up tick yesterday but has now reached a new low for the year:
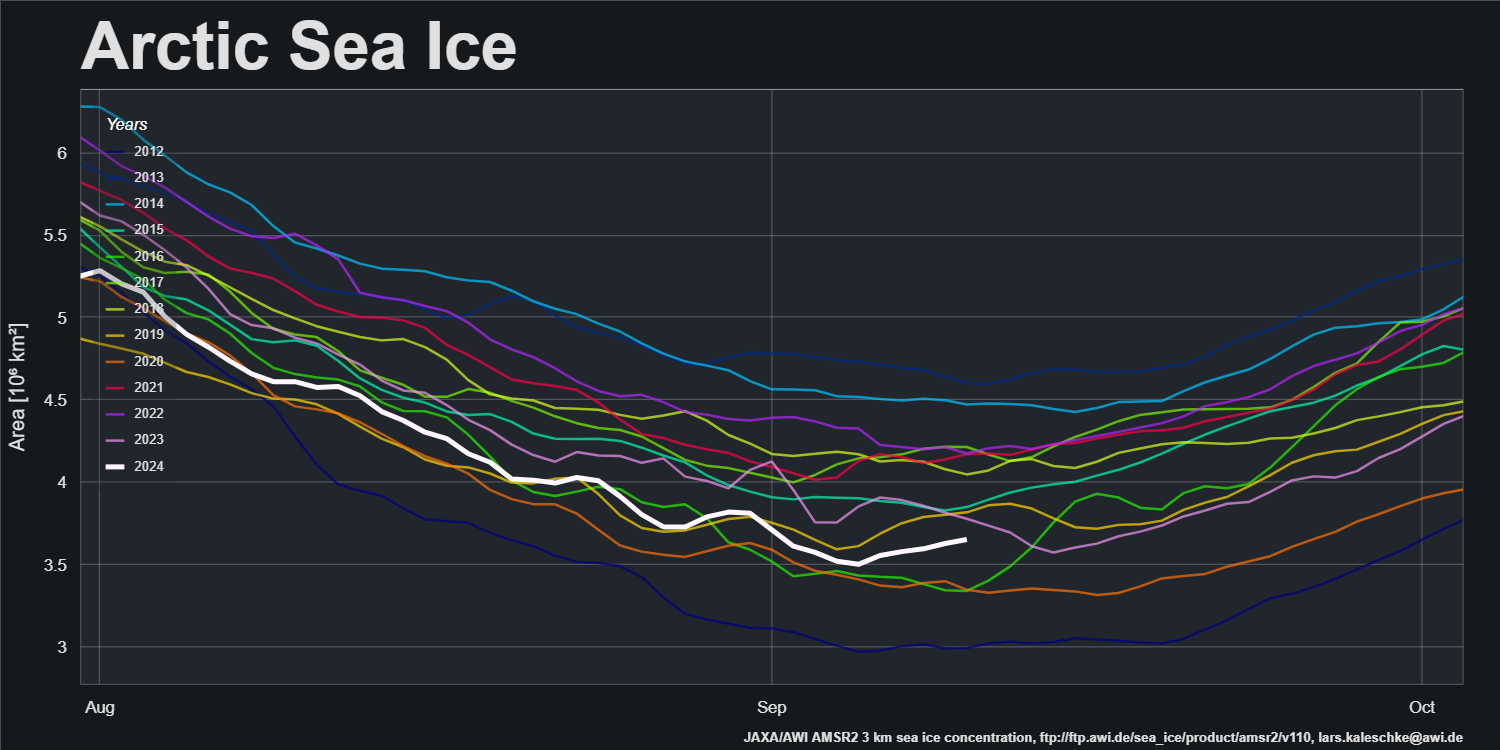
However AWI Arctic sea ice area is currently falling, which may well presage further significant falls in extent:
The NSIDC web site is currently “experiencing technical difficulties”, but hopefully we’ll be able to take a look at their extent graph in the very near future.
[Update – September 4th]
The NSIDC web site is back in action, and their 5 day averaged extent metric is currently still falling quickly:
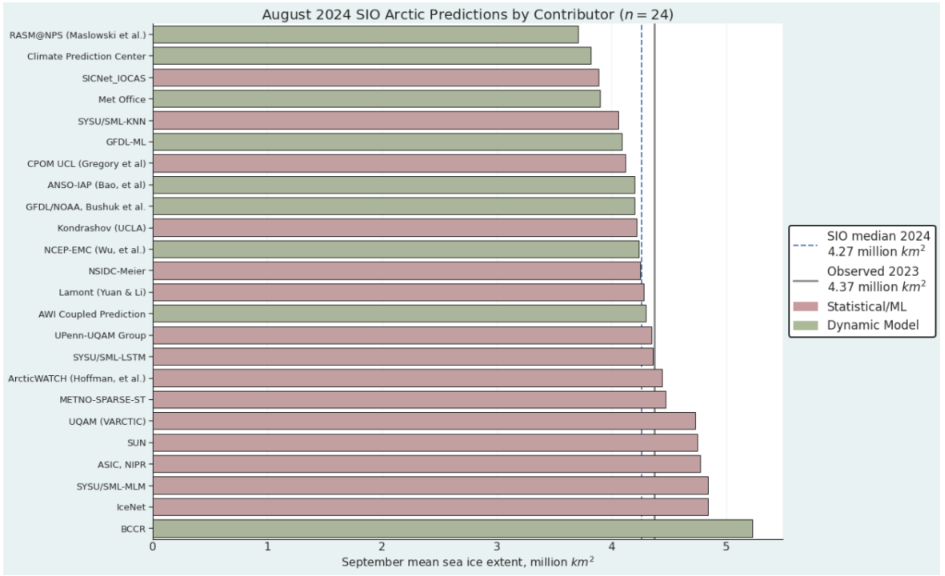
The ARCUS Sea Ice Prediction Network August report has been published. Note that the predicted numbers are for the September monthly average extent rather than the daily minimum:
For the August Outlook, we received 24 contributions of September pan-Arctic sea-ice extent forecasts…
The August 2024 median forecasted value for pan-Arctic September sea-ice extent is 4.27 million square kilometers with an interquartile range of 4.11 to 4.54 million square kilometers. This is about 200,000 square kilometers lower than the June median and about 250,000 square kilometers lower than the July median, which reflects the faster than average ice loss during July.
The lowest sea-ice extent forecast is 3.71 million square kilometers and the highest sea-ice extent forecast is 5.23 million square kilometers. These extremes are actually higher, particularly on the low end, than the estimates from July.
[Update – September 9th]
There’s been the tiniest of upticks in the NSIDC 5 day extent metric. 1 thousand km² to be precise. However, the others are still slowly declining:
[Update – September 10th]
NSIDC extent has posted a new low for the year, and JAXA extent is still declining. However there has been a slightly more substantial uptick in the OSI SAF metric:
The current minimum is 4.64 million km² on September 8th.
AWI sea ice area has posted a convincing looking minimum on September 4th, which suggests that the central refreeze is already well under way:
[Update – September 17th]
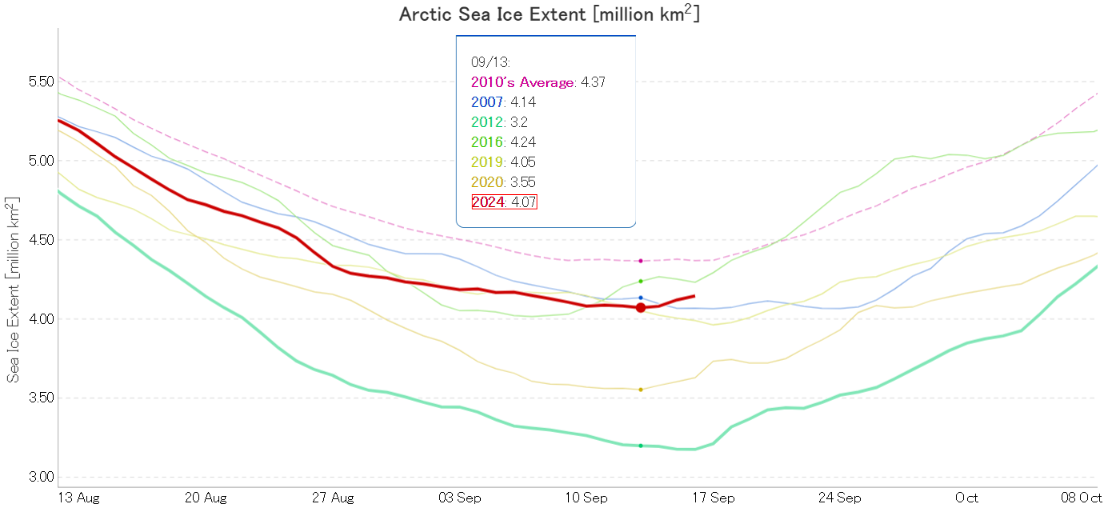
JAXA/ViSHOP/ADS extent has risen significantly over the last two days:
It now looks highly likely that the 2024 minimum will prove to be 4.07 million km² on September 13th. That is 4th lowest for the date, but equal 5th lowest minimum in the JAXA record.
A closer look at some of the other extent metrics will have to wait until this problem is solved:
Not good timing for a data outage!
[Update – September 22nd]
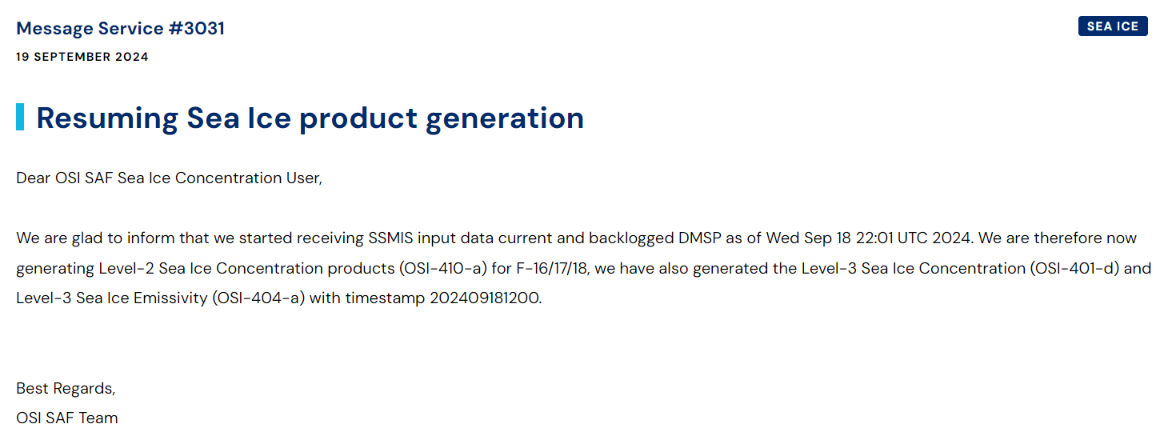
SSMIS data has been flowing again for a couple of days:
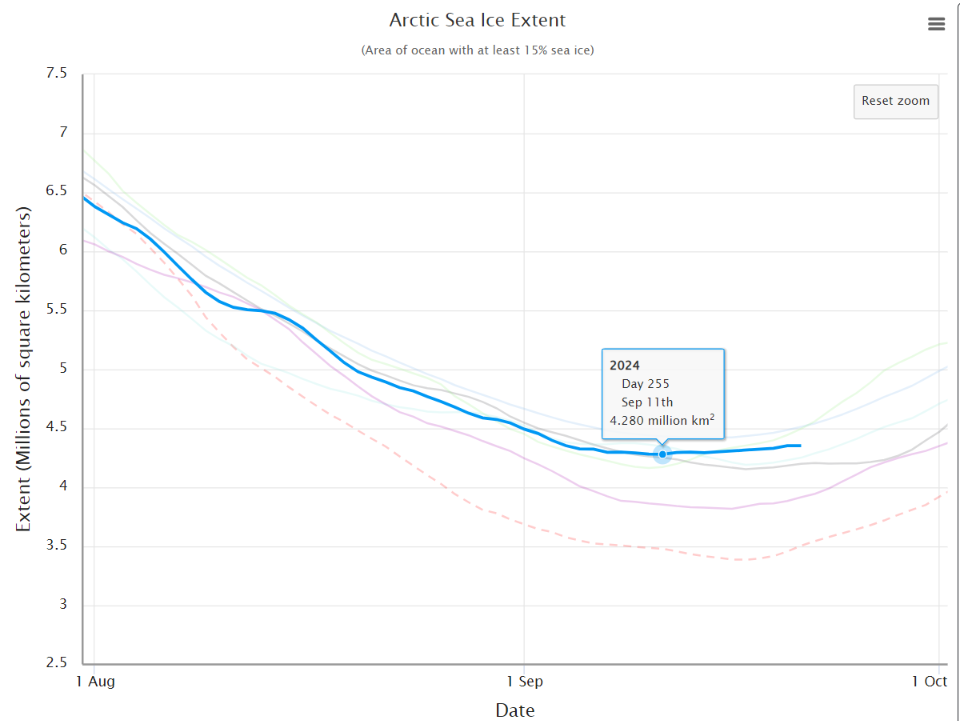
This graph may be subject to revision if and when the missing data is recovered, but currently it looks as though the 2024 minimum of the NSIDC 5 day averaged extent metric is 4.28 million km² on September 11th.
[Update – September 24th]
The National Snow and Ice Data Center formally announced today that:
On September 11, Arctic sea ice likely reached its annual minimum extent of 4.28 million square kilometers. The 2024 minimum is the seventh lowest in the nearly 46-year satellite record. The last 18 years, from 2007 to 2024, are the lowest 18 sea ice extents in the satellite record…
Note that this is a preliminary announcement. Changing winds or late-season melt could still reduce the Arctic ice extent, as happened in 2005 and 2010. NSIDC scientists will release a full analysis of the Arctic melt season, and discuss the Antarctic winter sea ice growth, in early October.
The NSIDC also addressed the recent missing SSMIS data issue mentioned above as follows:
Note that a gap exists in the input source data between September 12 and September 18. This gap somewhat lowers our confidence in the minimum extent estimate. However, it appears that September 11 is the mostly likely date of the minimum based on data trends in daily extent values leading up to the 5-day average on September 11 and the extent values after data restarted on September 18. If extent did drop further between September 11 and September 18, it would have been marginal. If the input source data becomes available to fill that gap, our team will update the minimum estimate if necessary.
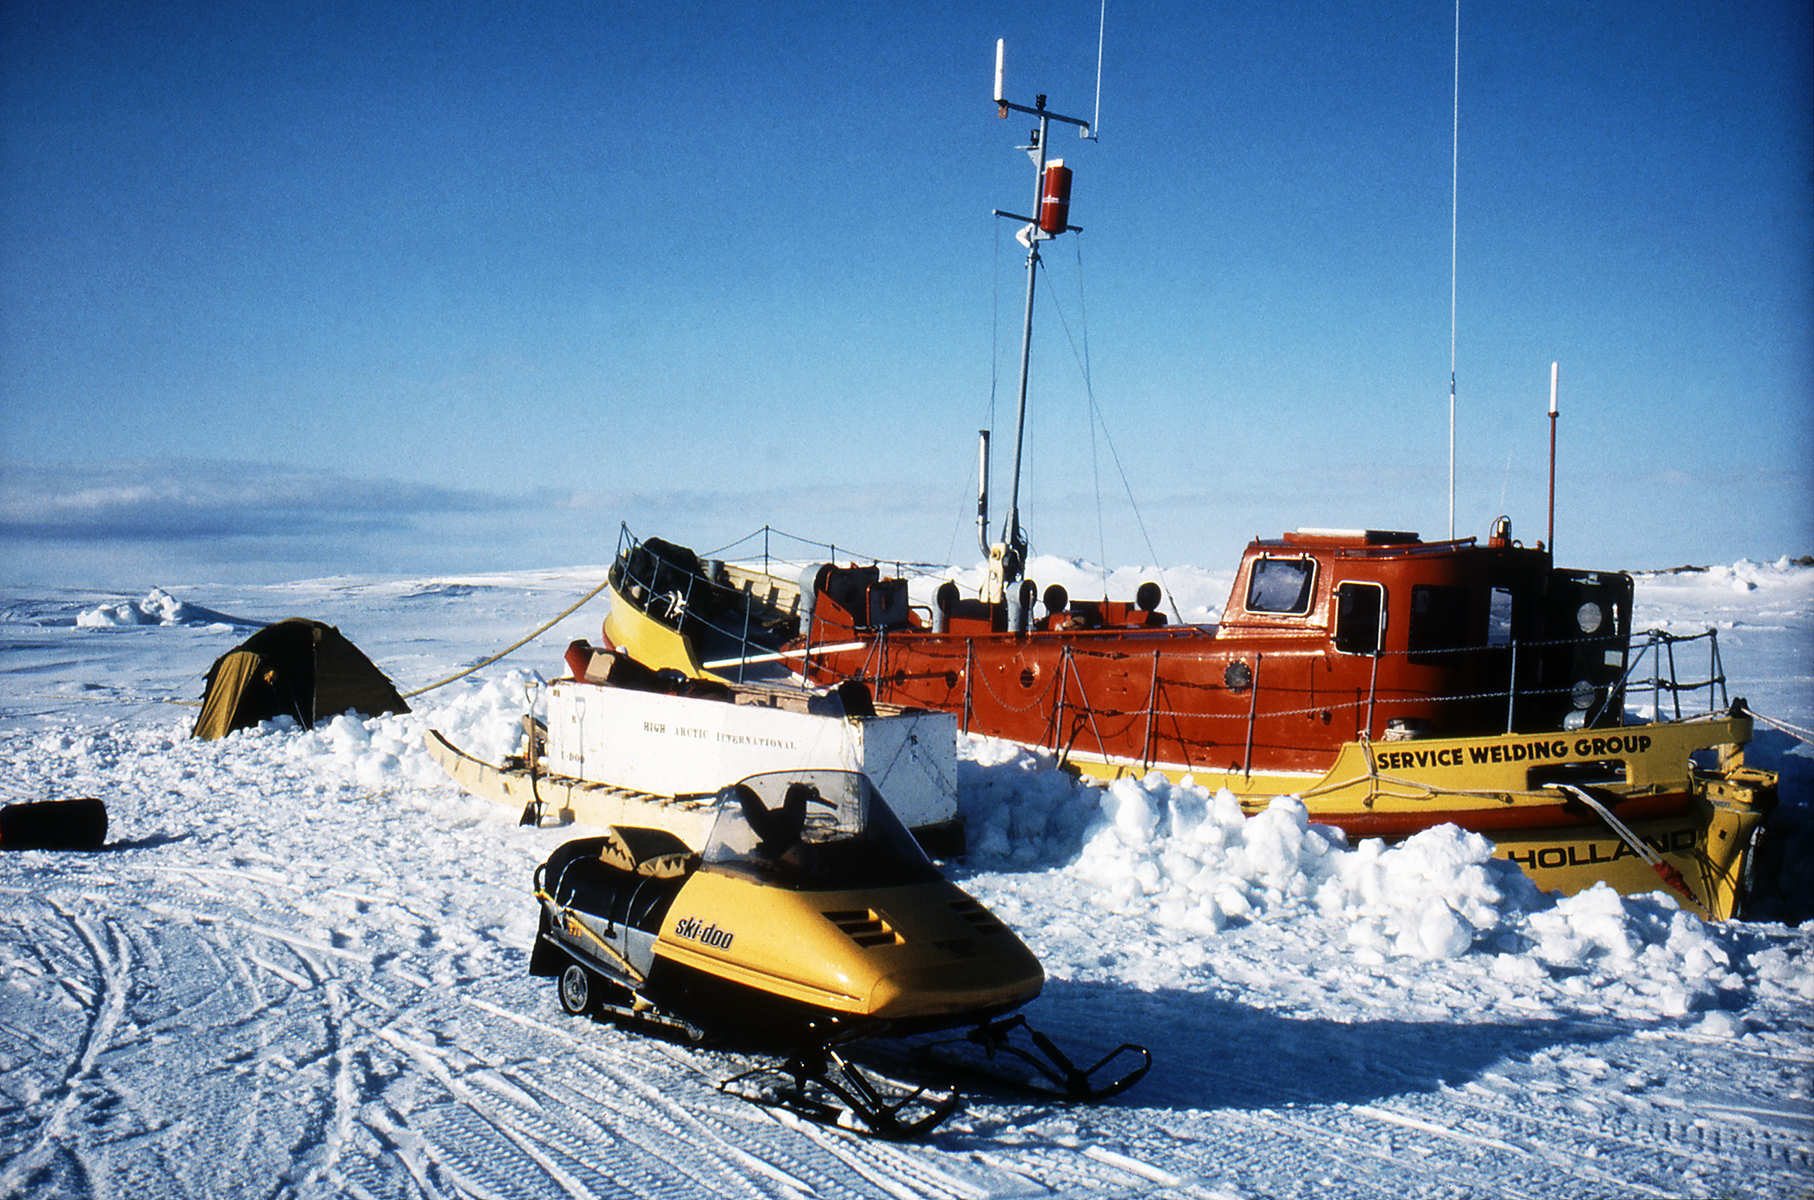
David Scott Cowper is 82, and his first solo voyage through the Northwest Passage, in the converted lifeboat Mabel E. Holland, began in the Davis Strait in 1986. After spending 3 winters north of the Arctic Circle, Mabel eventually travelled south through the Bering Strait in 1989:
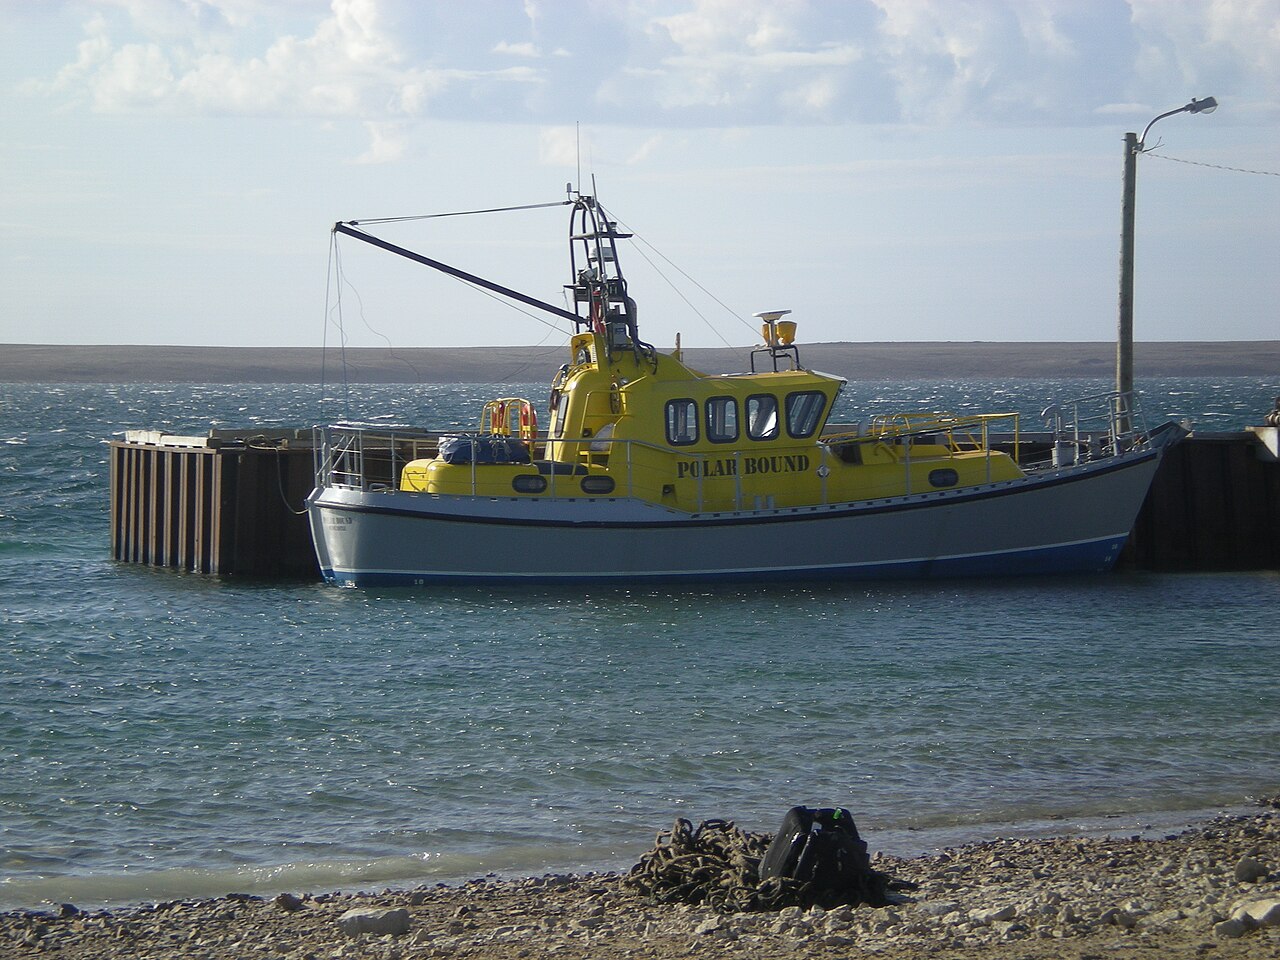
David’s second solo voyage through the Northwest Passage took place from east to west starting in 2003. His purpose built motor vessel, Polar Bound, spent the winter in Cambridge Bay and completed the voyage in the summer of 2004:
For this summer’s east to west voyage David is travelling in Polar Bound once again, this time accompanied by Susannah Broome. They have crossed the North Atlantic from Newcastle and have recently departed from Qaqortoq in the south west of Greenland:
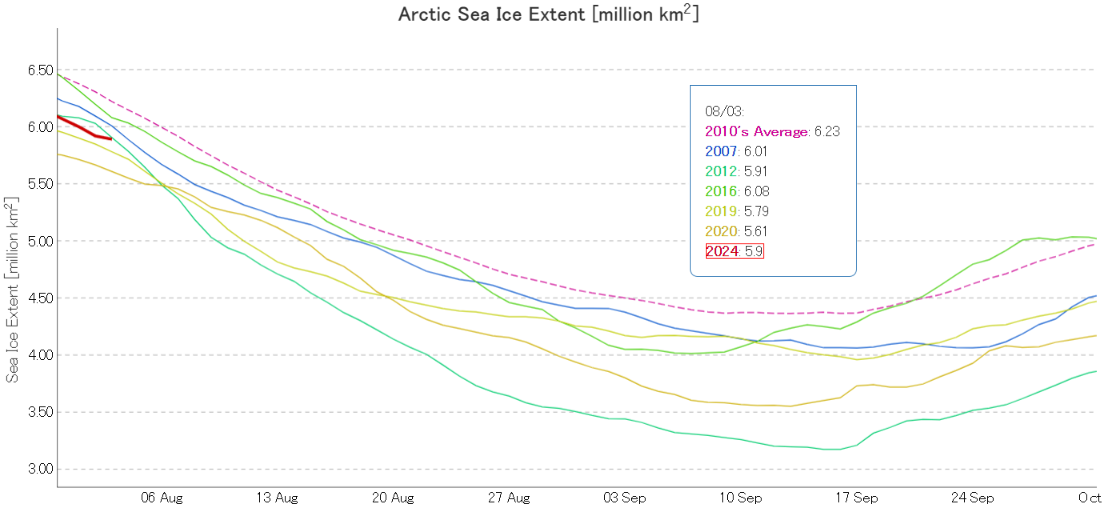
At the beginning of August JAXA/ViSHOP extent is 3rd lowest for the date in the satellite era:
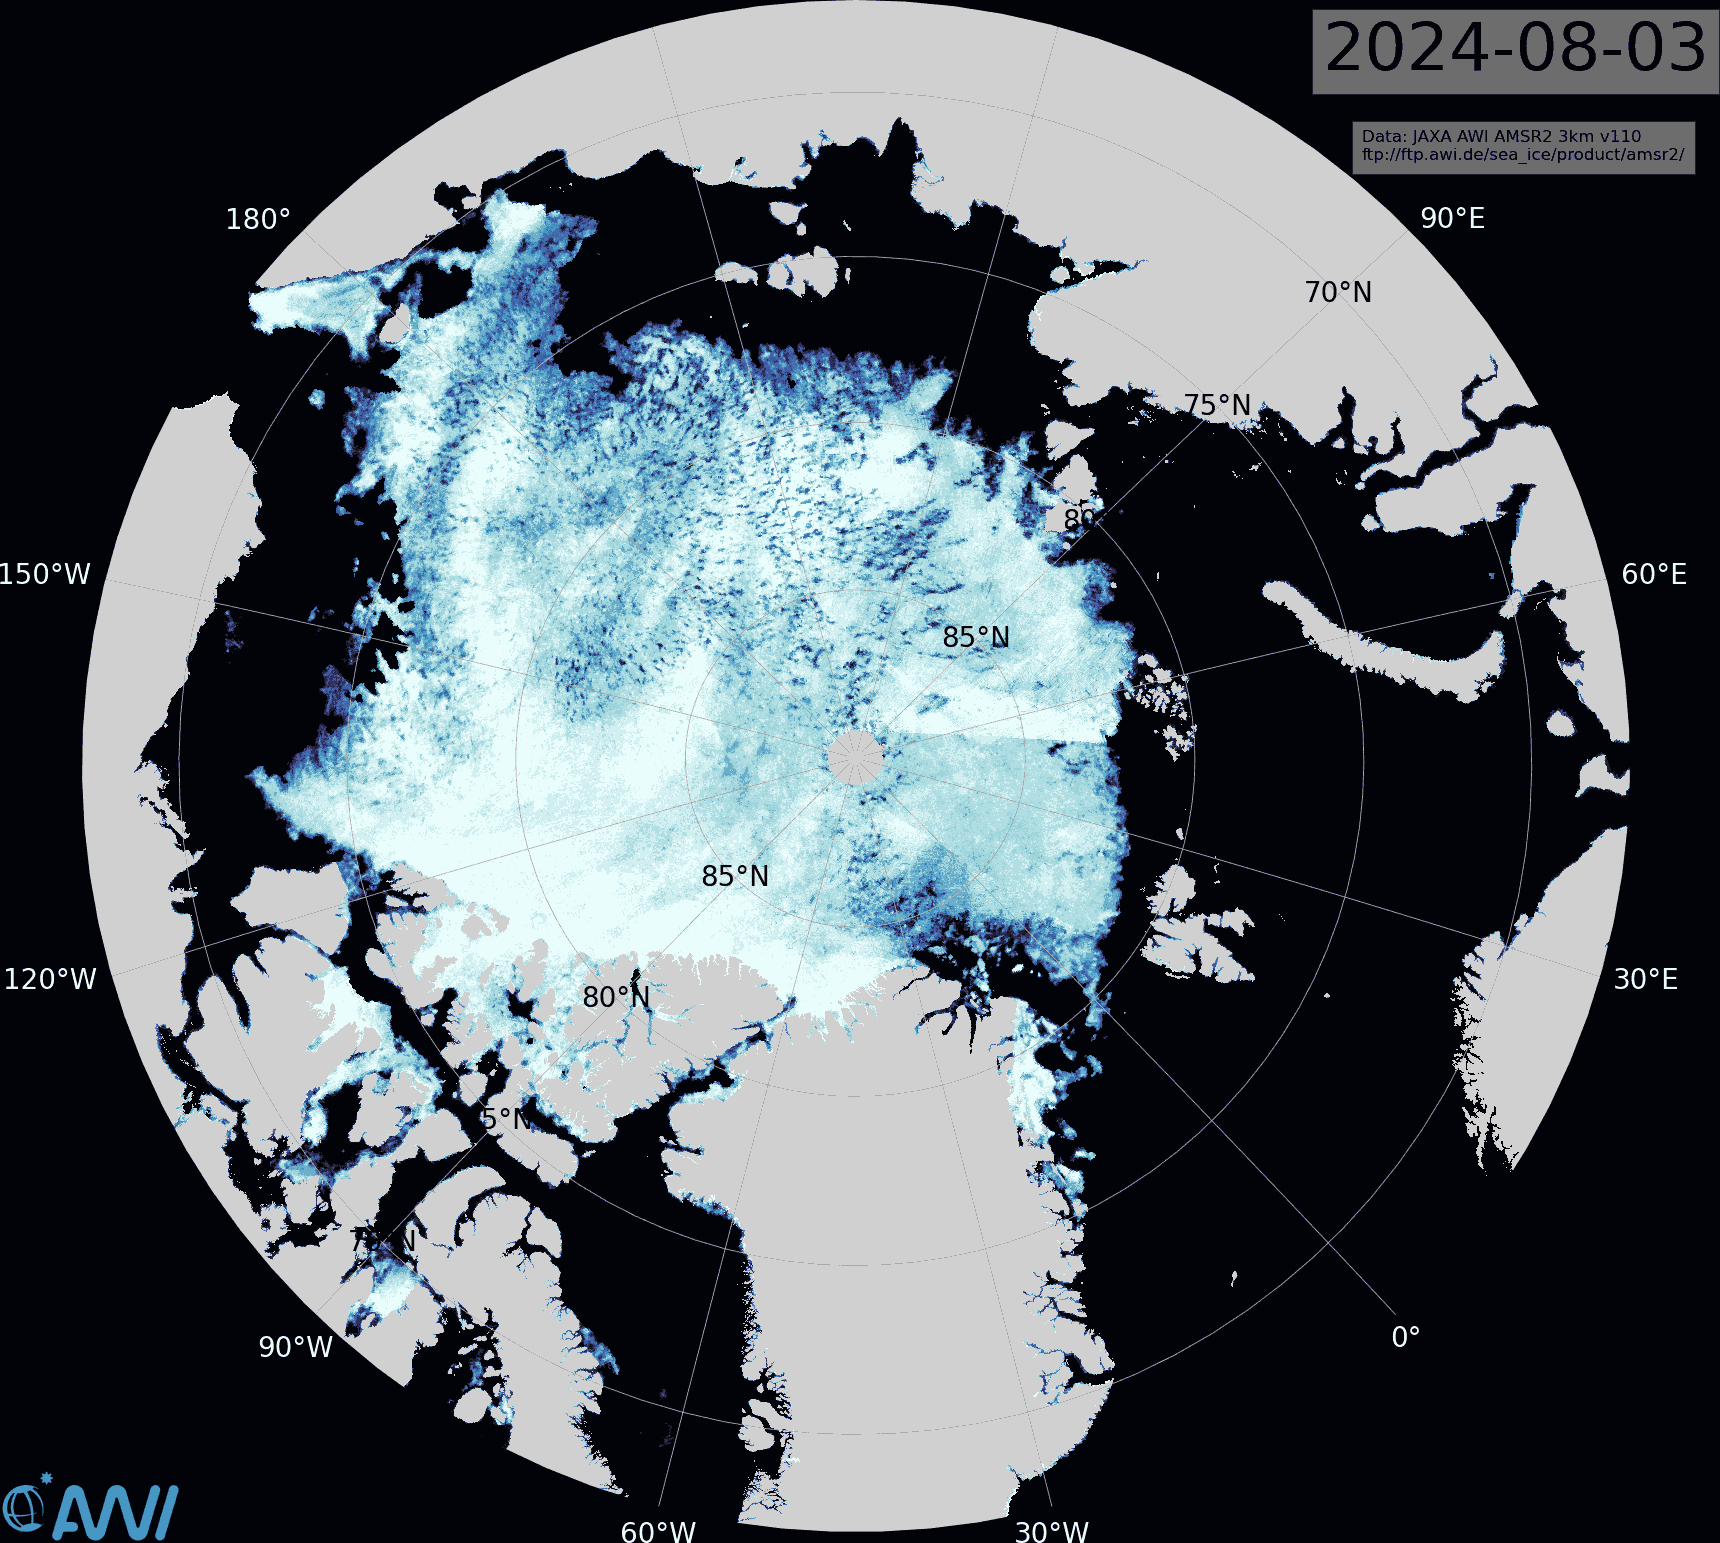
In 2012 extent had just started its unprecedented plunge towards the record September minimum, and 2024 seems certain to cross above the 2012 curve shortly. However, the latest AMSR2 sea ice concentration map from the Alfred Wegener Institute reveals areas of open water across the majority of the Central Arctic Basin:
In particular the sea ice between the North Pole and northern Greenland is remarkably fragmented:
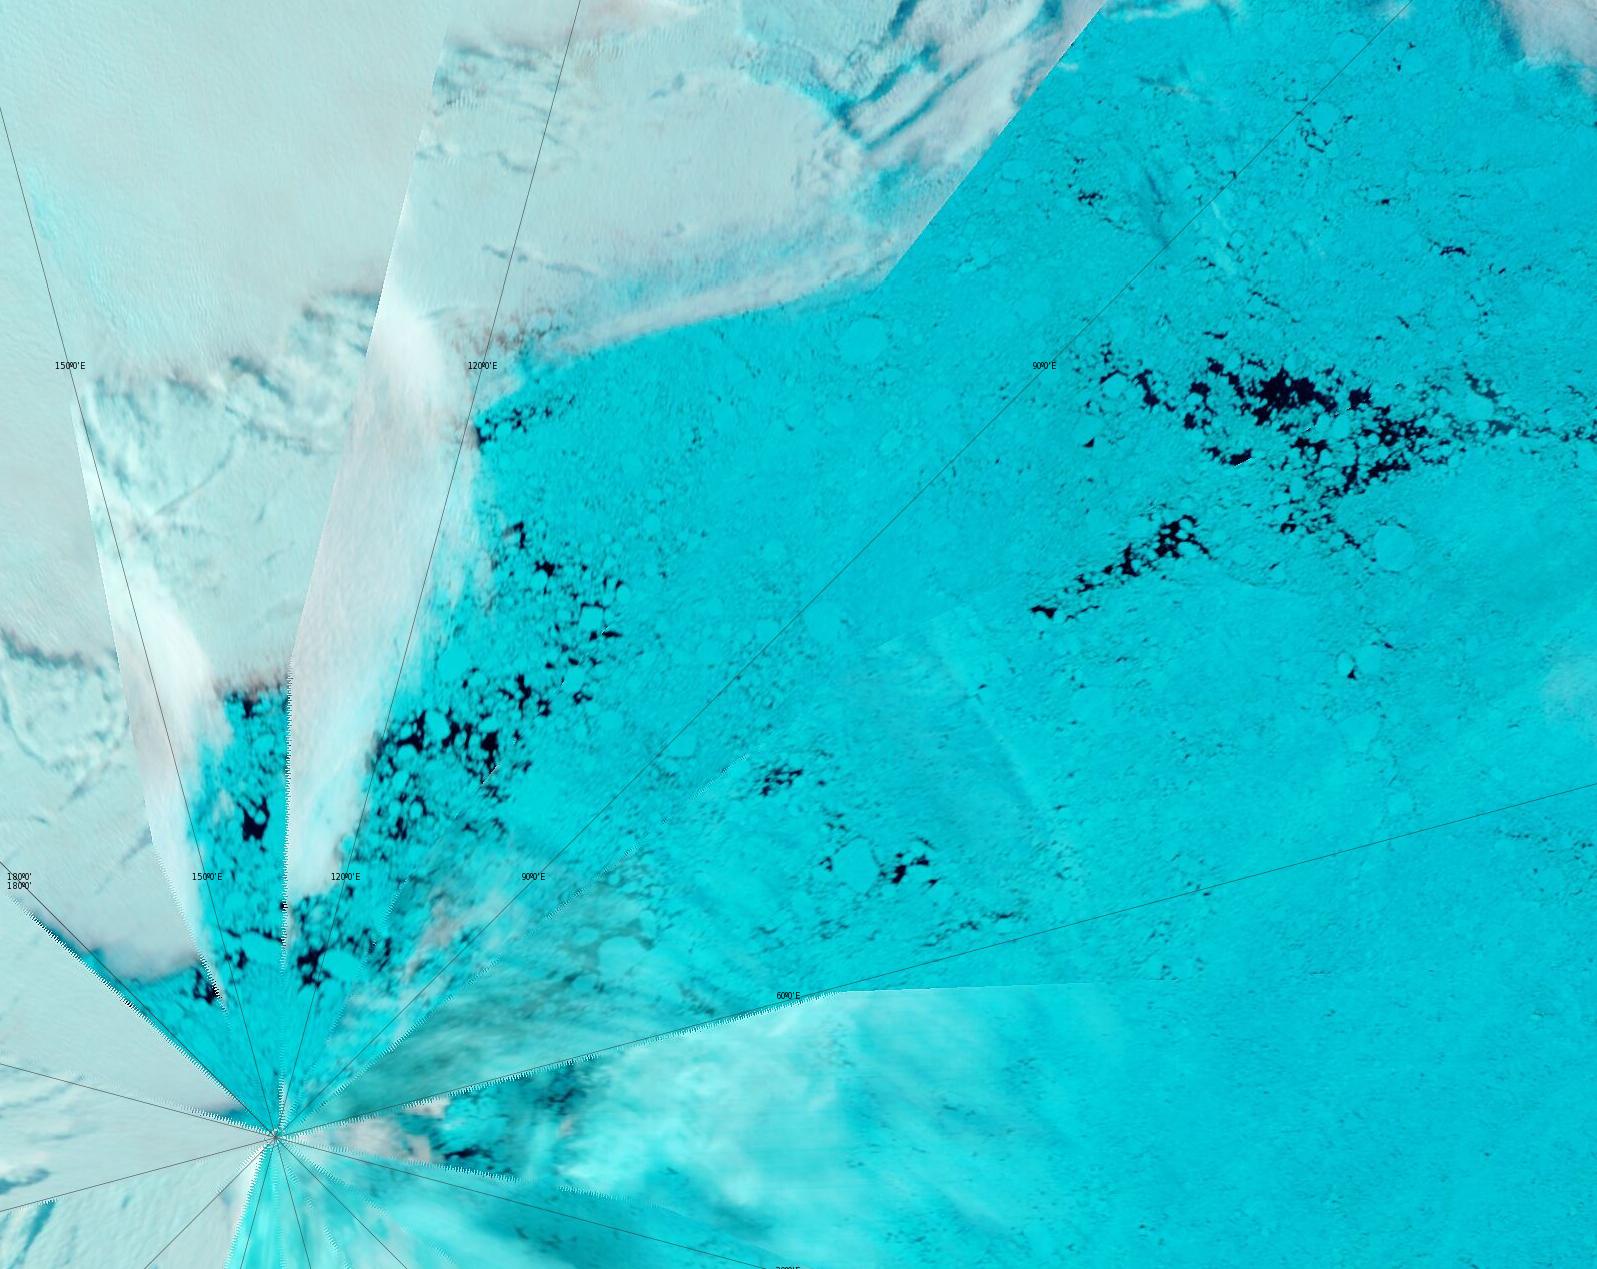
“False colour” image of the North Pole on August 3rd from the MODIS instrument on the Terra satellite
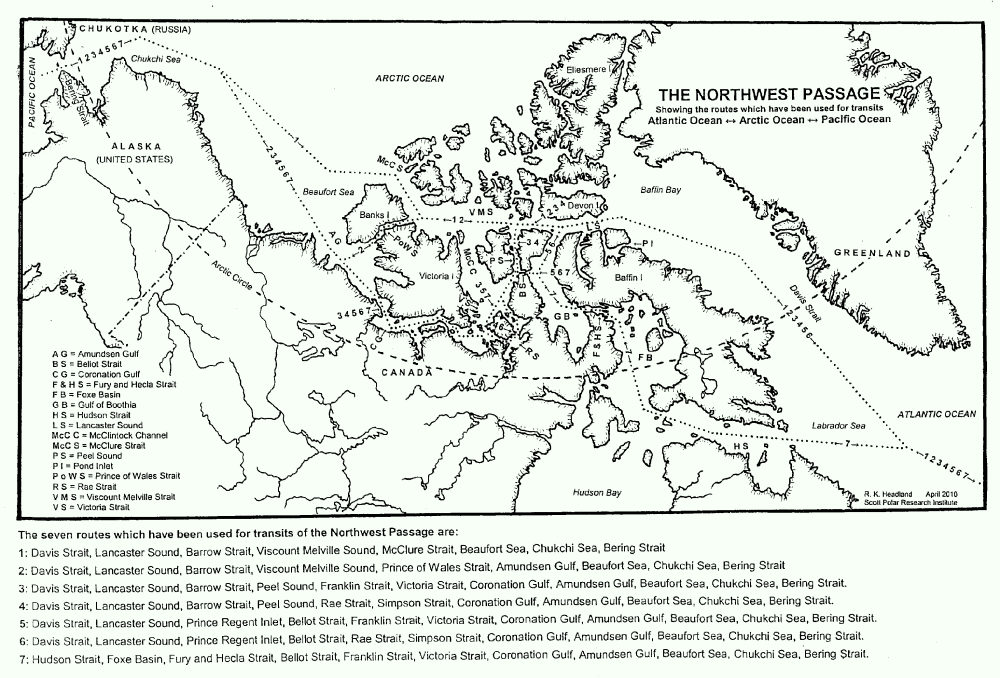
Some “pleasure craft” are currently heading up the west coast of Greenland en route to the Bering Strait via Lancaster Sound and one of the assorted routes through the Canadian Arctic Archipelago. For those of you unfamiliar with the geography of the Northwest Passage, here are couple of hopefully helpful maps:
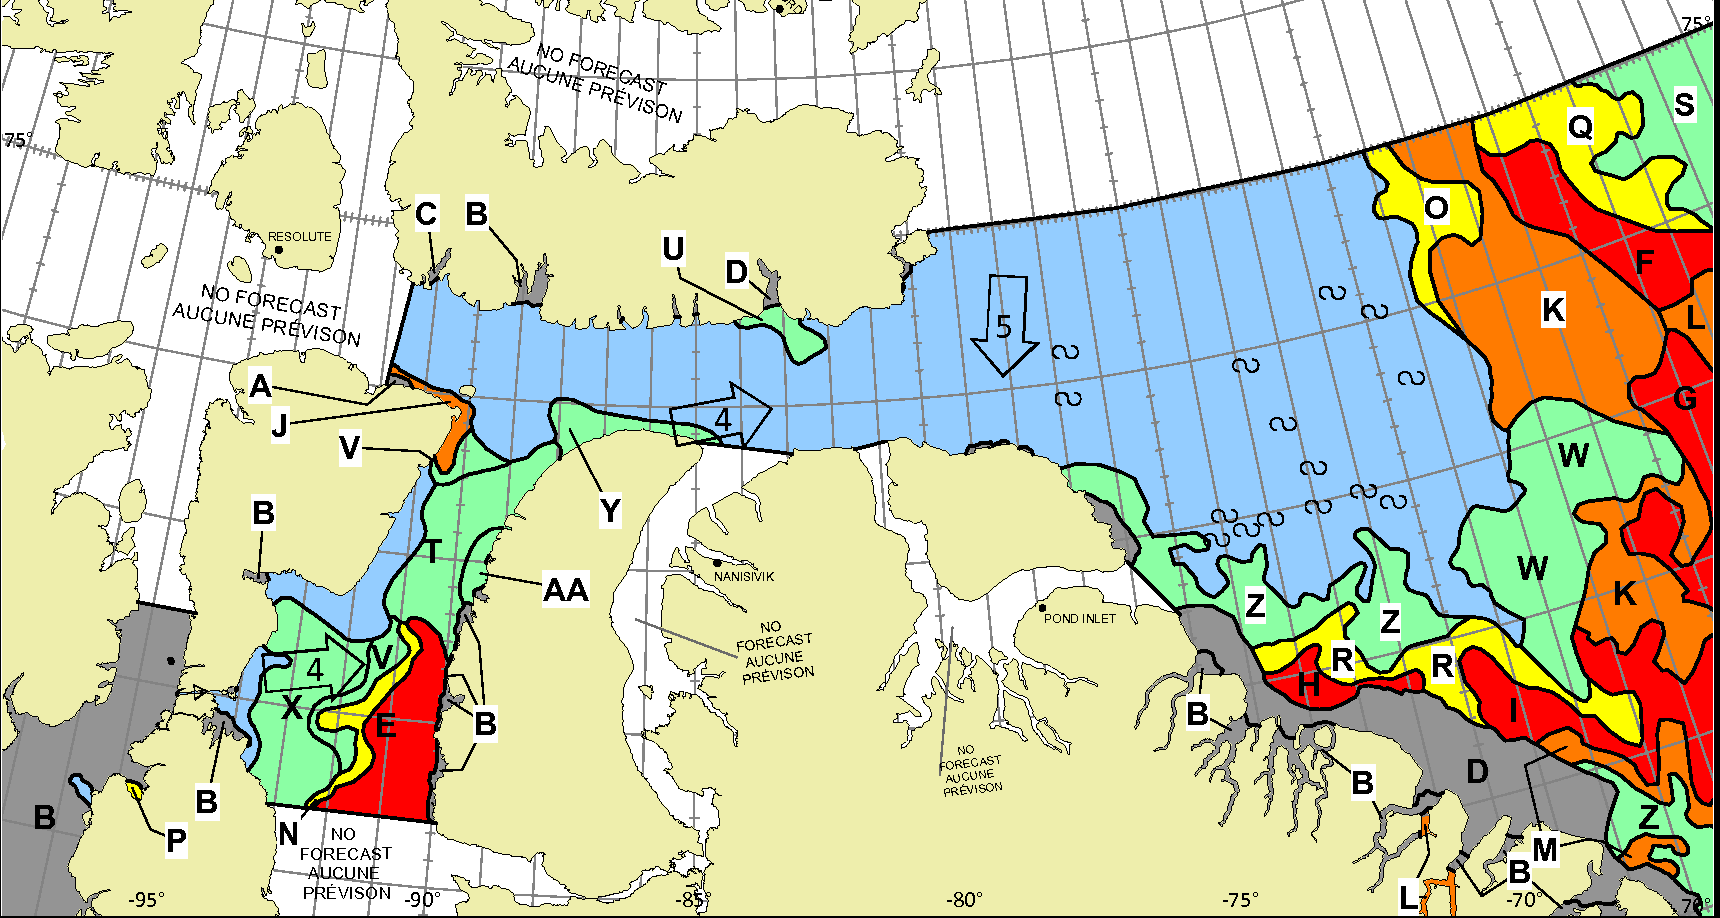
Whilst there is still ice blocking the route across Baffin Bay from Greenland, the Canadian Ice Service has already started daily coverage of the heart of the southern route through the Northwest Passage. There’s plenty of open water in Lancaster Sound and low concentration sea ice in Prince Regent Inlet:
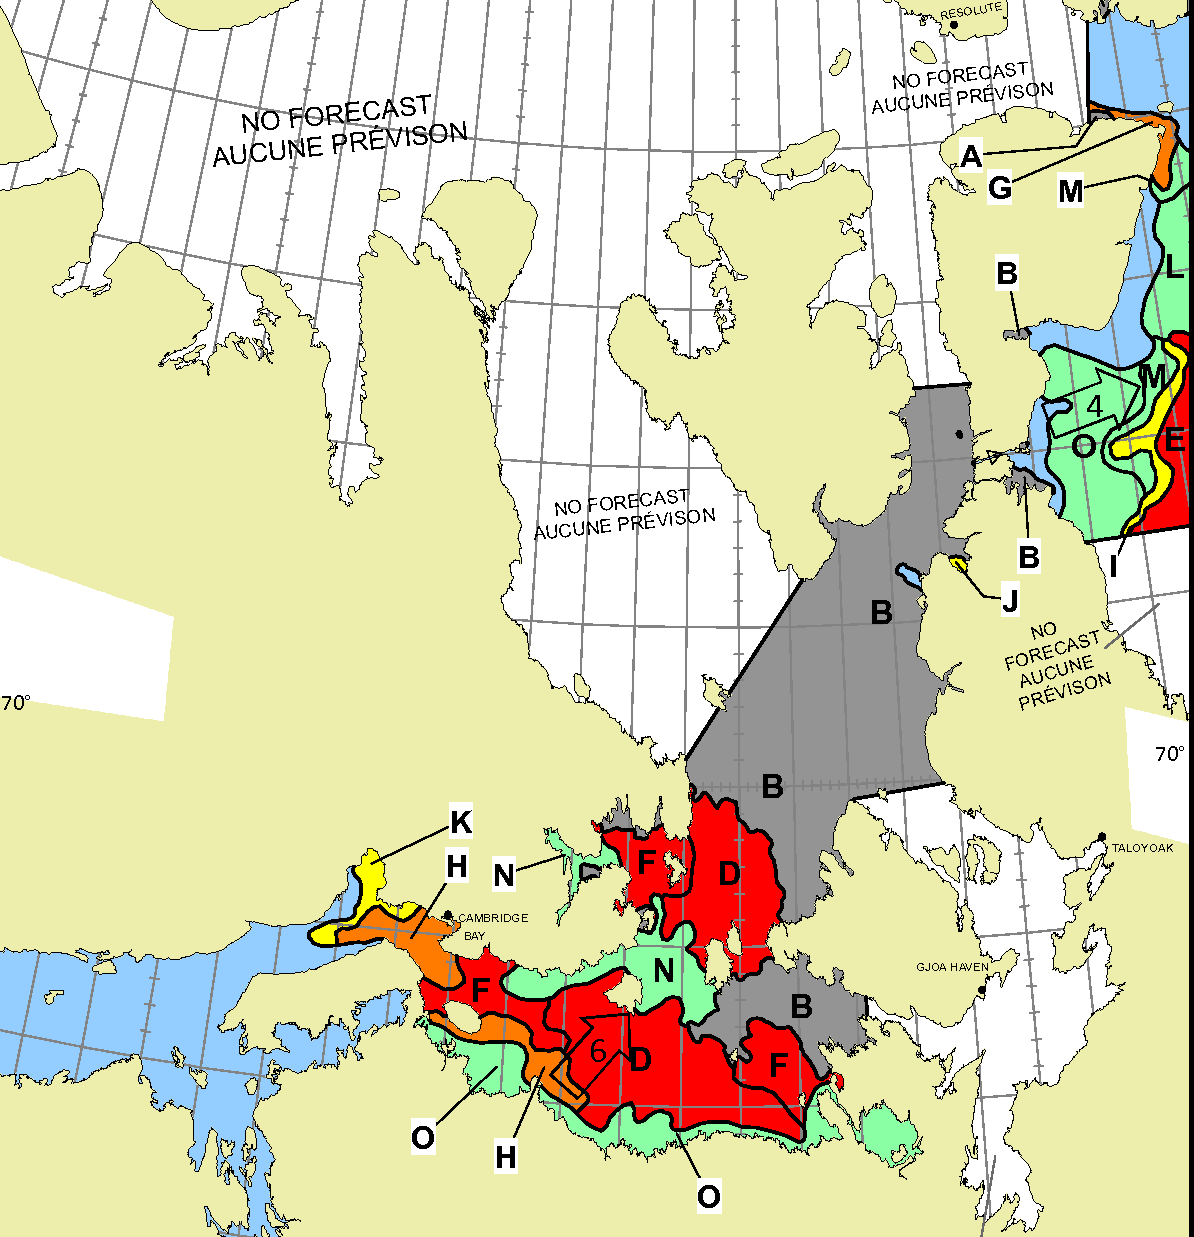
Further south there is also open water in the Coronation Gulf, but the fast ice between Peel Sound and King William Island has not yet started breaking up:
This slightly cloudy satellite image of the Canadian Arctic Archipelago also shows that the exit of the northern route via McClure Strait into the Beaufort Sea is already navigable:
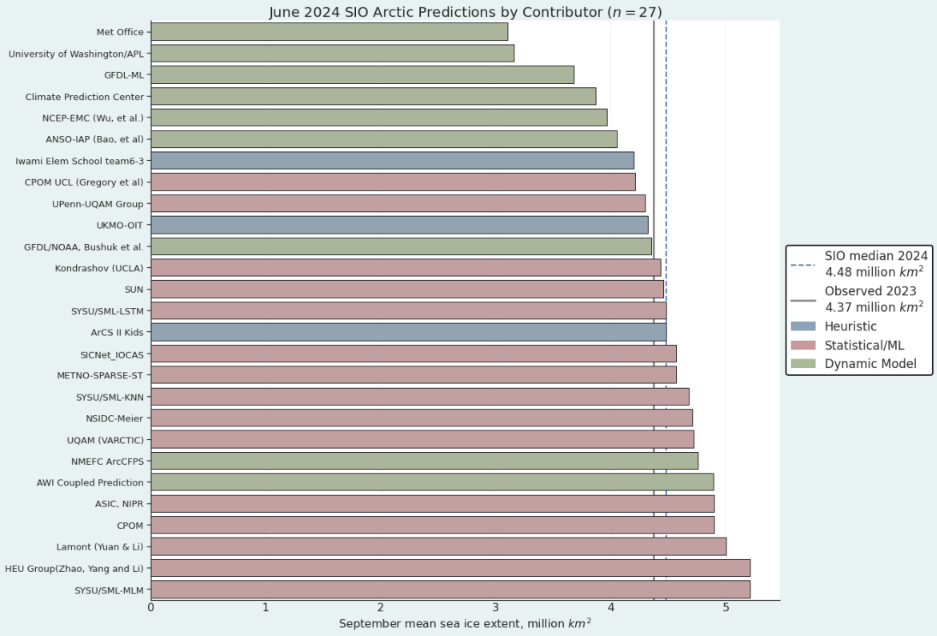
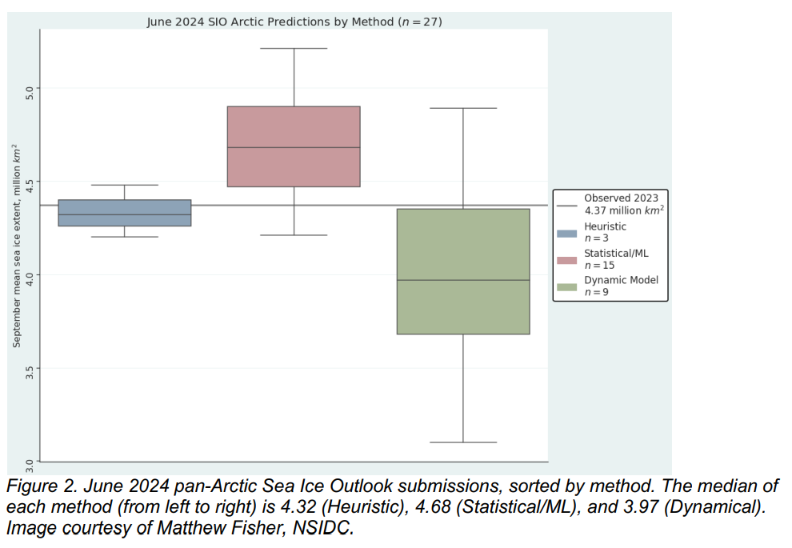
The first sea ice outlook report for 2024 has been published by the Sea Ice Prediction Network:
This year’s median forecasted value for pan-Arctic September sea-ice extent is 4.48 million square kilometers with an interquartile range of 4.21 to 4.74 million square kilometers. This is slightly lower than the 2022 (4.57 million square kilometers) and 2023 (4.54 million square kilometers) June median forecasts for September.
The lowest sea-ice extent forecast is 3.1 million square kilometers, from the UK Met Office, which would be a new record low for the satellite period (1979-present); the highest sea-ice extent forecast is 5.21 million square kilometers, submitted by both the HEU Group and SYSU/SML-MLM, which would be the highest September extent since 2015:
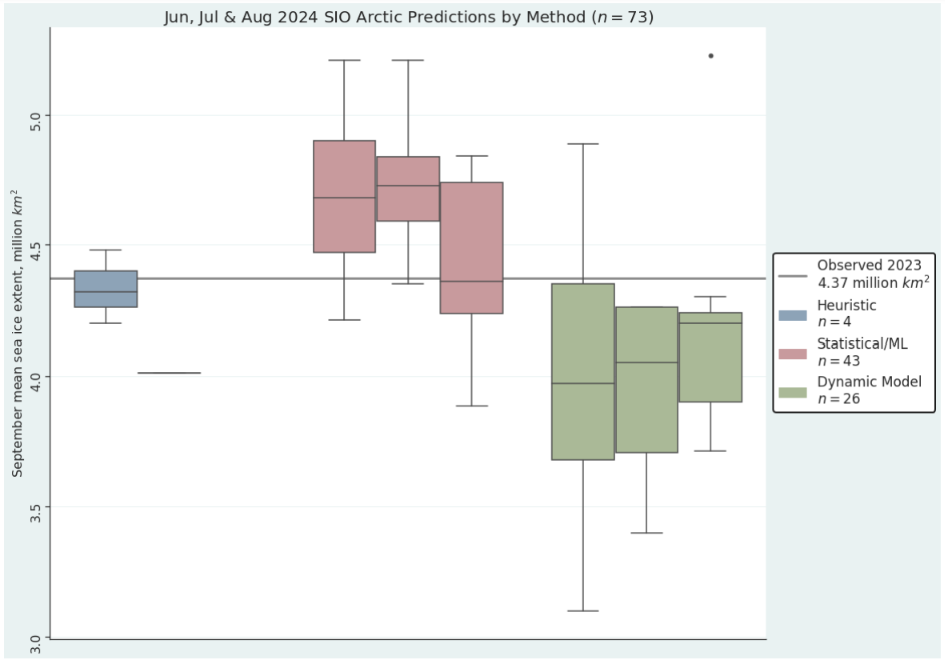
There are three heuristic Outlooks, with a median of 4.32 million square kilometers and an interquartile range of 4.26 to 4.4 million square kilometers. Statistical submissions total fifteen Outlooks with a median of 4.68 million square kilometers and an interquartile range of 4.47 to 4.9 million square kilometers. There are nine dynamical model contributions. The dynamical models have a median forecast of 3.97 million square kilometers with an interquartile range of 3.68 to 4.35 million square kilometers.
This website uses cookies to improve your experience. We'll assume you're ok with this, but you can opt-out if you wish. Cookie settingsACCEPT
Privacy & Cookies Policy
Privacy Overview
This website uses cookies to improve your experience while you navigate through the website. Out of these, the cookies that are categorized as necessary are stored on your browser as they are essential for the working of basic functionalities of the website. We also use third-party cookies that help us analyze and understand how you use this website. These cookies will be stored in your browser only with your consent. You also have the option to opt-out of these cookies. But opting out of some of these cookies may affect your browsing experience.
Necessary cookies are absolutely essential for the website to function properly. This category only includes cookies that ensures basic functionalities and security features of the website. These cookies do not store any personal information.
Any cookies that may not be particularly necessary for the website to function and is used specifically to collect user personal data via analytics, ads, other embedded contents are termed as non-necessary cookies. It is mandatory to procure user consent prior to running these cookies on your website.