The United States seeks an Arctic region that is peaceful, stable, prosperous, and cooperative. Climate change is making the Arctic more accessible than ever, threatening Arctic communities and vital ecosystems, creating new potential economic opportunities. and intensifying competition to shape the region’s future. Russia has invested significantly in its presence in the Arctic over the last decade, modernizing its military infrastructure and increasing the pace of exercises and training operations. Its aggressive behavior has raised geopolitical tensions in the Arctic, creating new risks of unintended conflict and hindering cooperation. The PRC has also sought to increase its influence in the Arctic by rapidly increased its Arctic investments, pursuing new scientific activities, and using these scientific engagements to conduct dual-use research with intelligence or military applications.
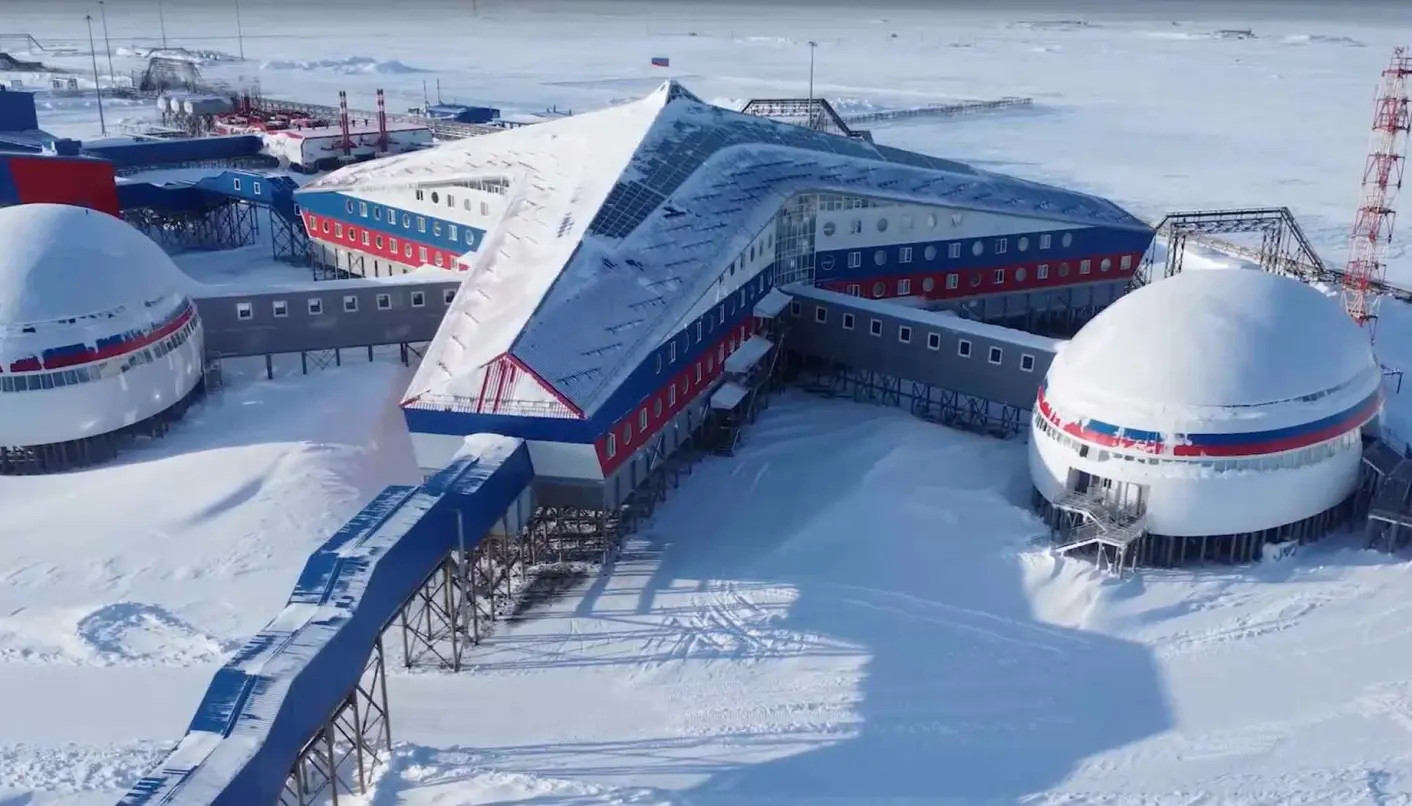
The Nagurskoye military base on on Aleksandra Island in Franz Josef Land. Image via the Barents Observer
We will uphold U.S. security in the region by improving our maritime domain awareness, communications, disaster response capabilities, and icebreaking capacity to prepare for increased international activity in the region. We will exercise U.S. Government presence in the region as required, while reducing risk and preventing unnecessary escalation. Arctic nations have the primary responsibility for addressing regional challenges, and we will deepen our cooperation with our Arctic allies and partners and work with them to sustain the Arctic Council and other Arctic institutions despite the challenges to Arctic cooperation posed by Russia’s war in Ukraine. We will continue to protect freedom of navigation and determine the U.S. extended continental shelf in accordance with international rules. We must build resilience to and mitigate climate change in the region, including through agreements to reduce emissions and more cross-Arctic research collaboration. As economic activity in the Arctic increases, we will invest in infrastructure, improve livelihoods, and encourage responsible private sector investment by the United States, our allies, and our partners, including in critical minerals, and improve investment screening for national security purposes. Across these efforts, we will uphold our commitment to honor Tribal sovereignty and self-governance through regular, meaningful, and robust consultation and collaboration with Alaska Native communities.
By way of contrast the Trump Administration’s document makes no mention of the Arctic or Alaska or even Greenland. It does, however state that:
After years of neglect, the United States will reassert and enforce the Monroe Doctrine to restore American preeminence in the Western Hemisphere, and to protect our homeland and our access to key geographies throughout the region. We will deny non-Hemispheric competitors the ability to position forces or other threatening capabilities, or to own or control strategically vital assets, in our Hemisphere. This “Trump Corollary” to the Monroe Doctrine is a common-sense and potent restoration of American power and priorities, consistent with American security interests.
Specifically regarding Europe the 2025 Security Strategy has this to say:
Continental Europe has been losing share of global GDP—down from 25 percent in 1990 to 14 percent today—partly owing to national and transnational regulations that undermine creativity and industriousness.
But this economic decline is eclipsed by the real and more stark prospect of civilizational erasure. The larger issues facing Europe include activities of the European Union and other transnational bodies that undermine political liberty and sovereignty, migration policies that are transforming the continent and creating strife, censorship of free speech and suppression of political opposition, cratering birthrates, and loss of national identities and self-confidence. Should present trends continue, the continent will be unrecognizable in 20 years or less. As such, it is far from obvious whether certain European countries will have economies and militaries strong enough to remain reliable allies. Many of these nations are currently doubling down on their present path. We want Europe to remain European, to regain its civilizational self-confidence, and to abandon its failed focus on regulatory suffocation.
At this juncture Russia does at last receive a mention:
This lack of self-confidence is most evident in Europe’s relationship with Russia. European allies enjoy a significant hard power advantage over Russia by almost every measure, save nuclear weapons. As a result of Russia’s war in Ukraine, European relations with Russia are now deeply attenuated, and many Europeans regard Russia as an existential threat. Managing European relations with Russia will require significant U.S. diplomatic engagement, both to reestablish conditions of strategic stability across the Eurasian landmass, and to mitigate the risk of conflict between Russia and European states.
There is no mention of any risk of conflict between Russia and the United States, in the Arctic or anywhere else on Planet Earth.
The whole document is worth a long look, but here is a brief extract:
Russia has a larger Arctic military presence and ice-breaking capability than other Arctic states, and has embarked on a substantial rebuilding of Soviet-era military infrastructure in the region. Nevertheless, Russian influence efforts seek to depict US and NATO activity in the Arctic as provocative and destabilizing, in contrast with casting Russia’s military presence as routine and defensive. For example, since 2024, state media has covered NATO “flexing its muscles” with exercises in Finland on “Russia’s Arctic doorstep” and featured Kremlin officials’ promises to protect Russia’s Arctic interests from “NATO’s expansionist ambitions,” while a known proxy site warned of “steps towards the Arctic war.” These narratives have found renewed salience since 2025 amid public calls from US President Trump for Greenland to join the United States.
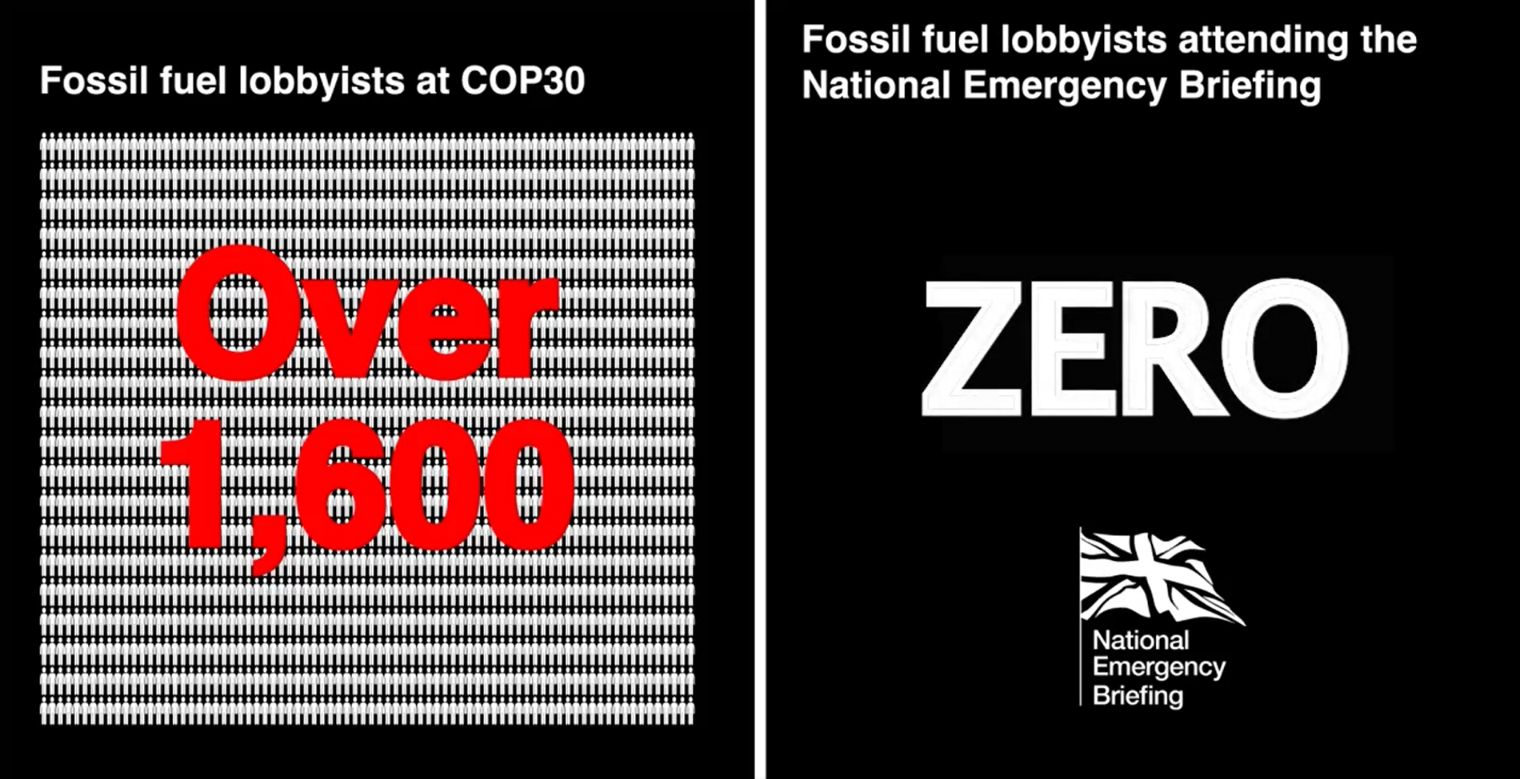
Sadly I missed the advance publicity for this event, part of which looked like this:
I’ve belatedly discovered that on November 27th at Westminster Central Hall:
Ten of the UK’s leading experts briefed an invite-only audience of around 1,250 politicians and leaders from business, culture, faith, sport and the media with the latest implications for health, food, national security and the economy.
According to the National Emergency Briefing’s web site:
These briefings are the clearest, most up-to-date picture of the climate and nature crisis in Britain. For the first time, the UK’s top experts give one integrated, unfiltered account of the risks and the solutions. This is the baseline the national conversation must now start from. Every policymaker needs to see it.
The talks will be available on our YouTube channel in the coming days…
A 45 minute documentary is now in production for release early next spring.
Whilst we wait for the official videos, here’s a summary of the event via Dave Borlace’s “Just Have a Think” YouTube channel:
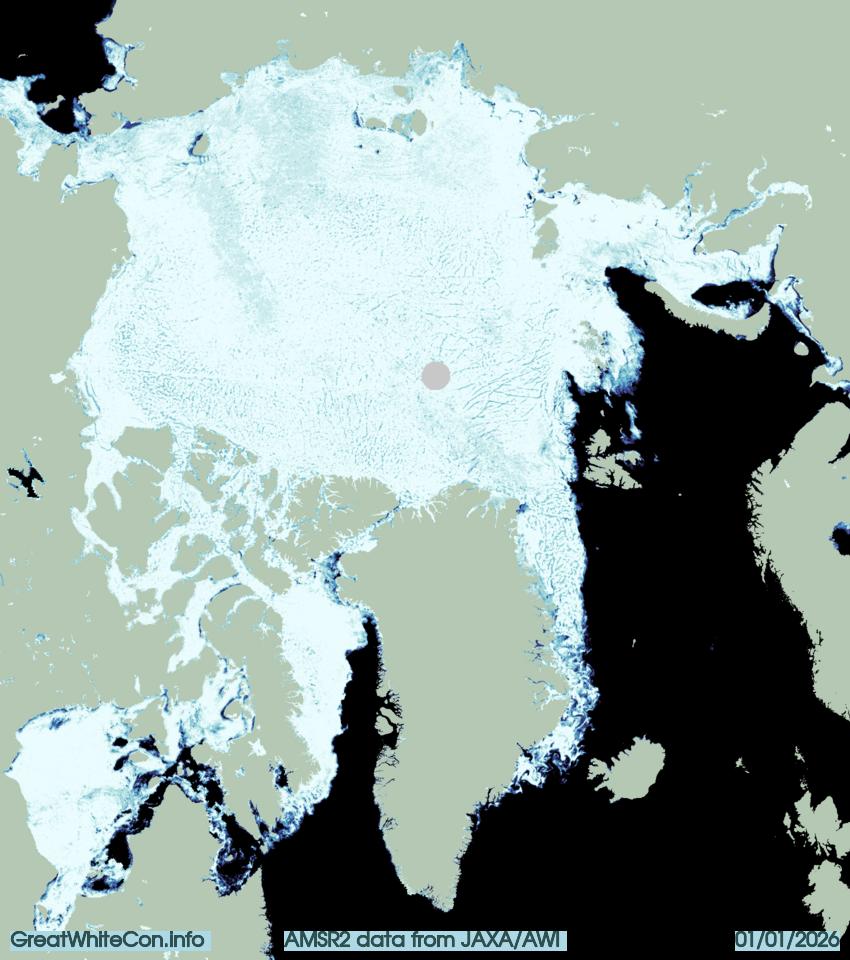
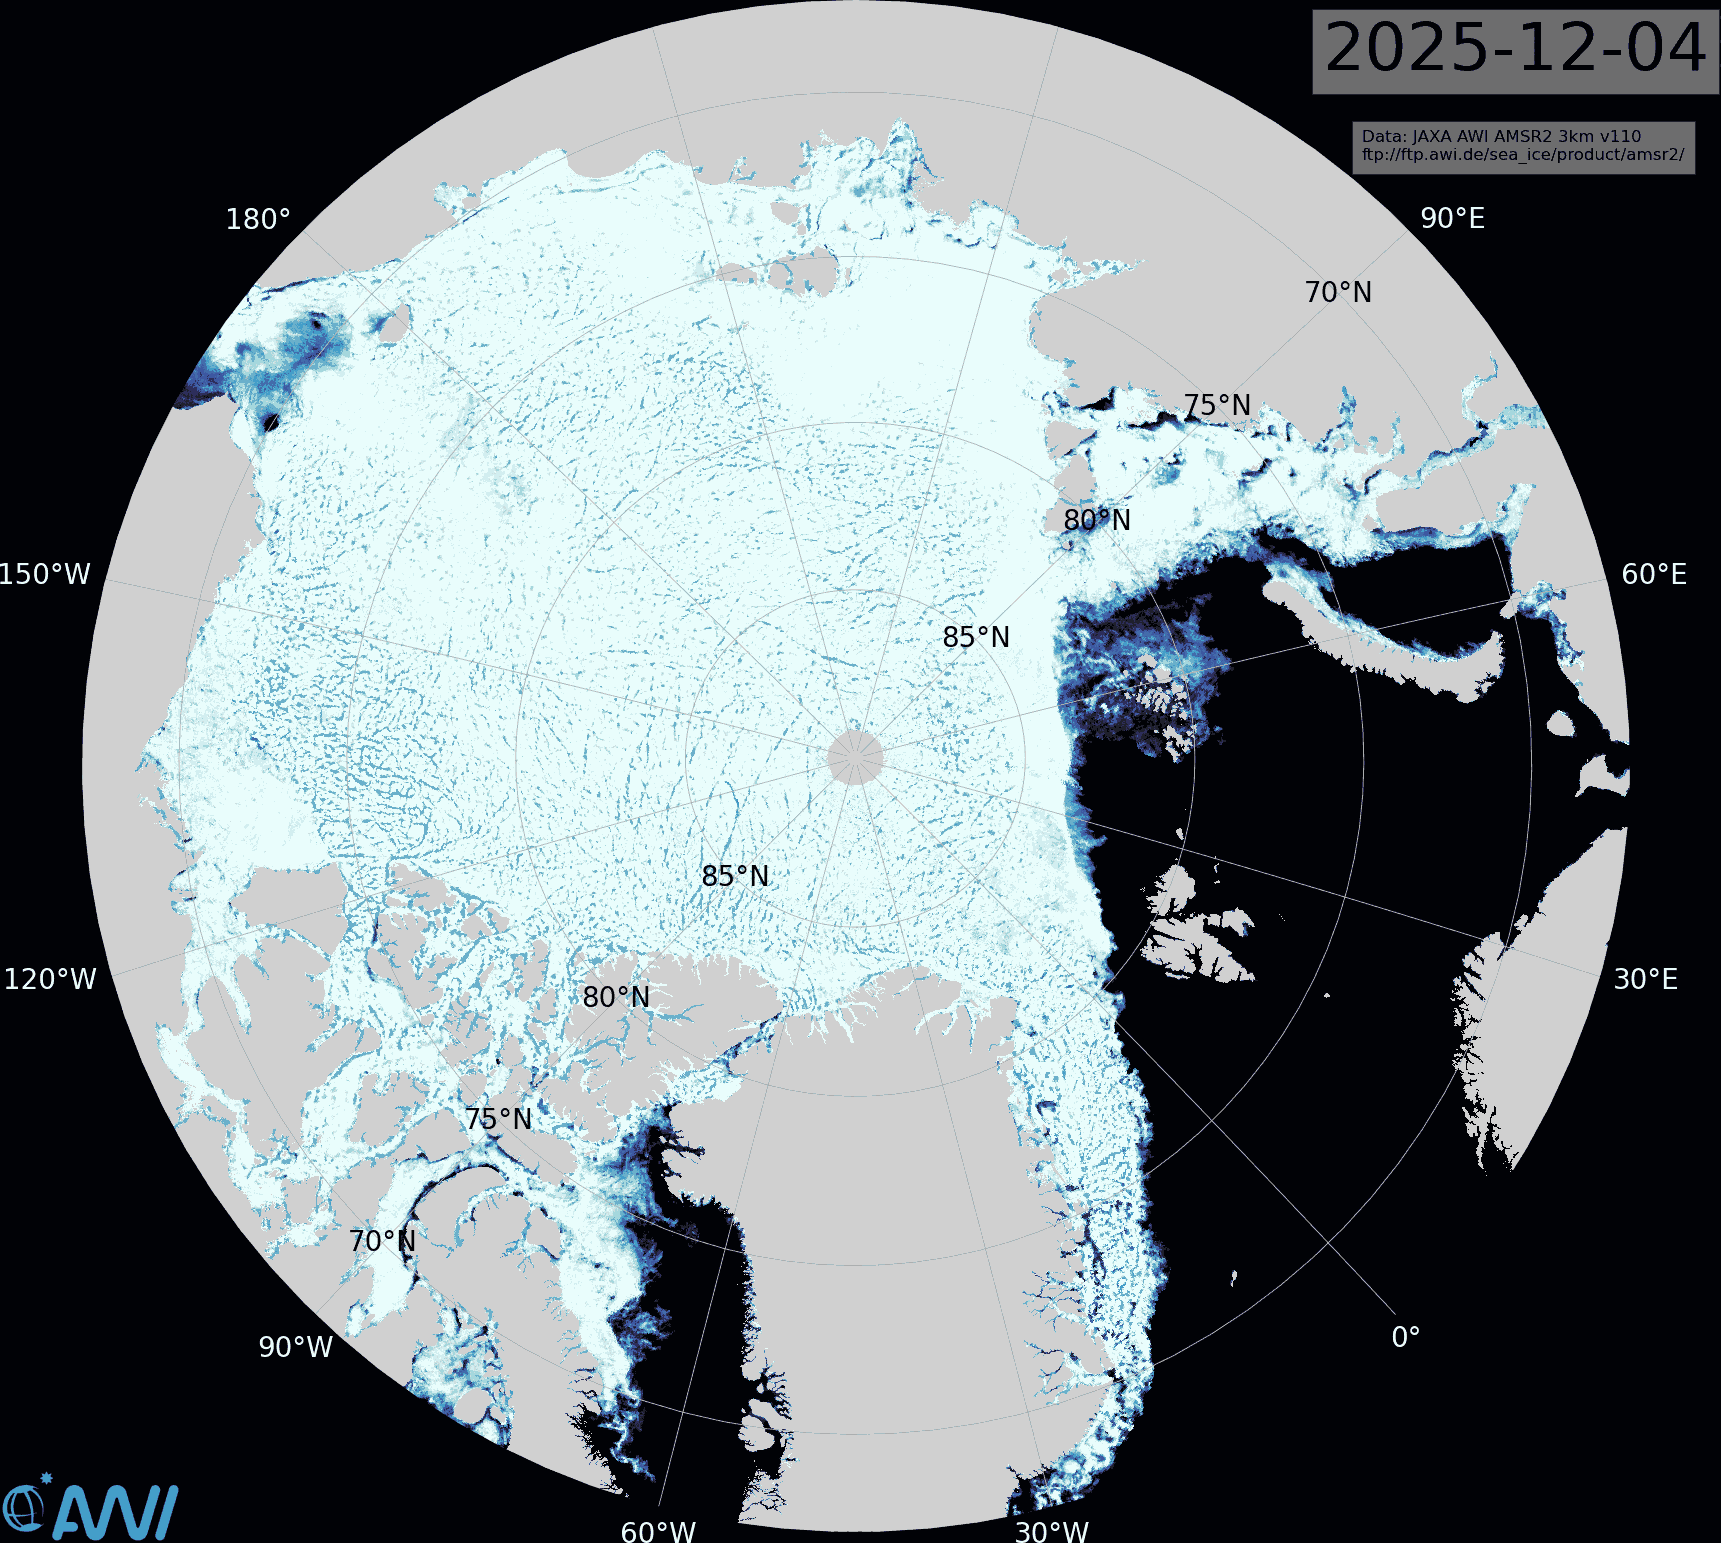
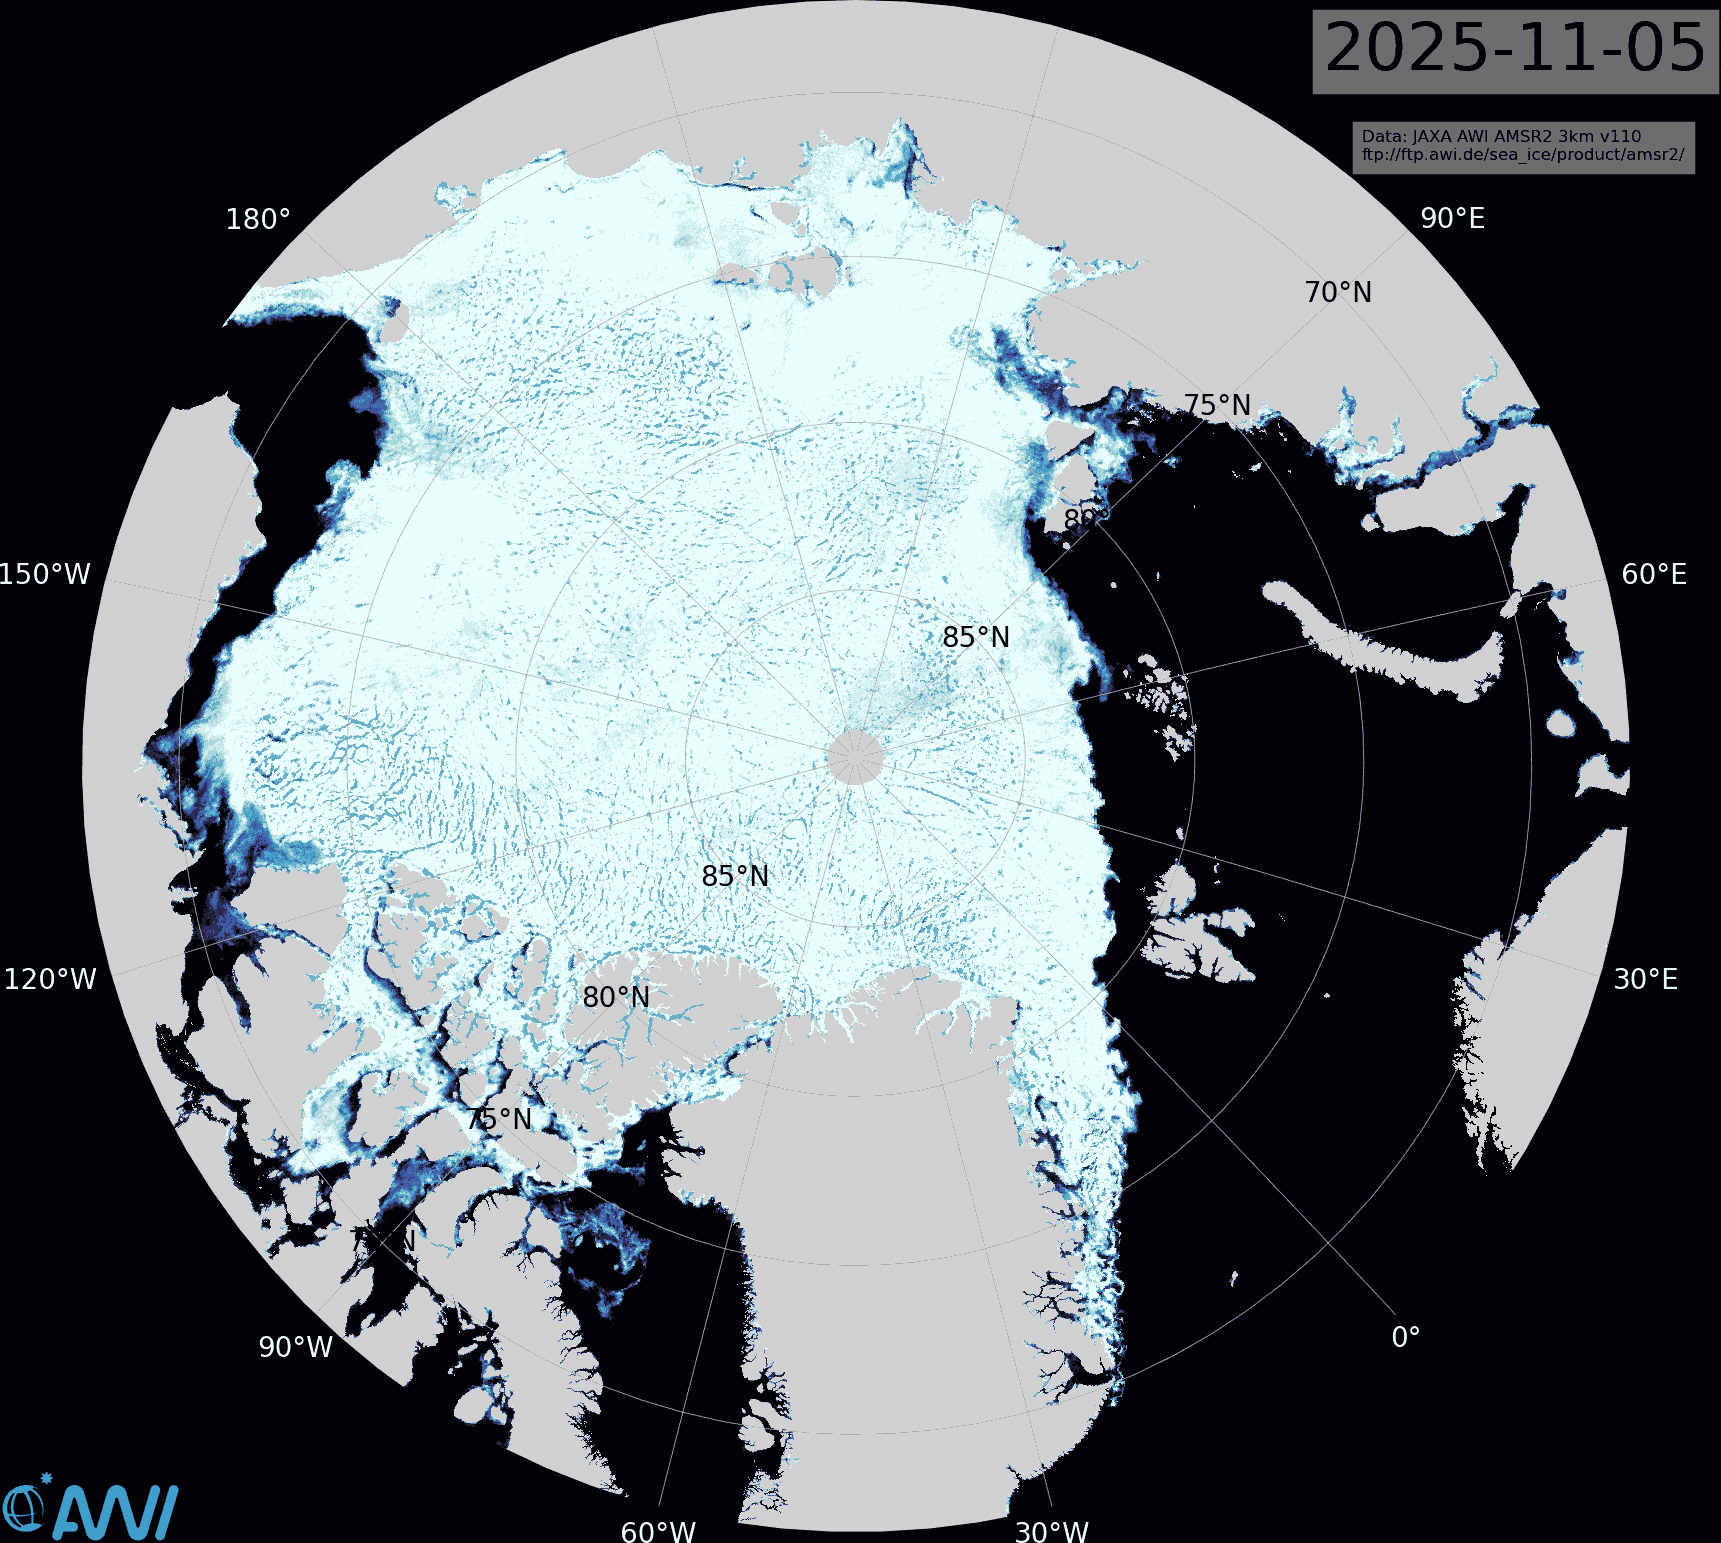
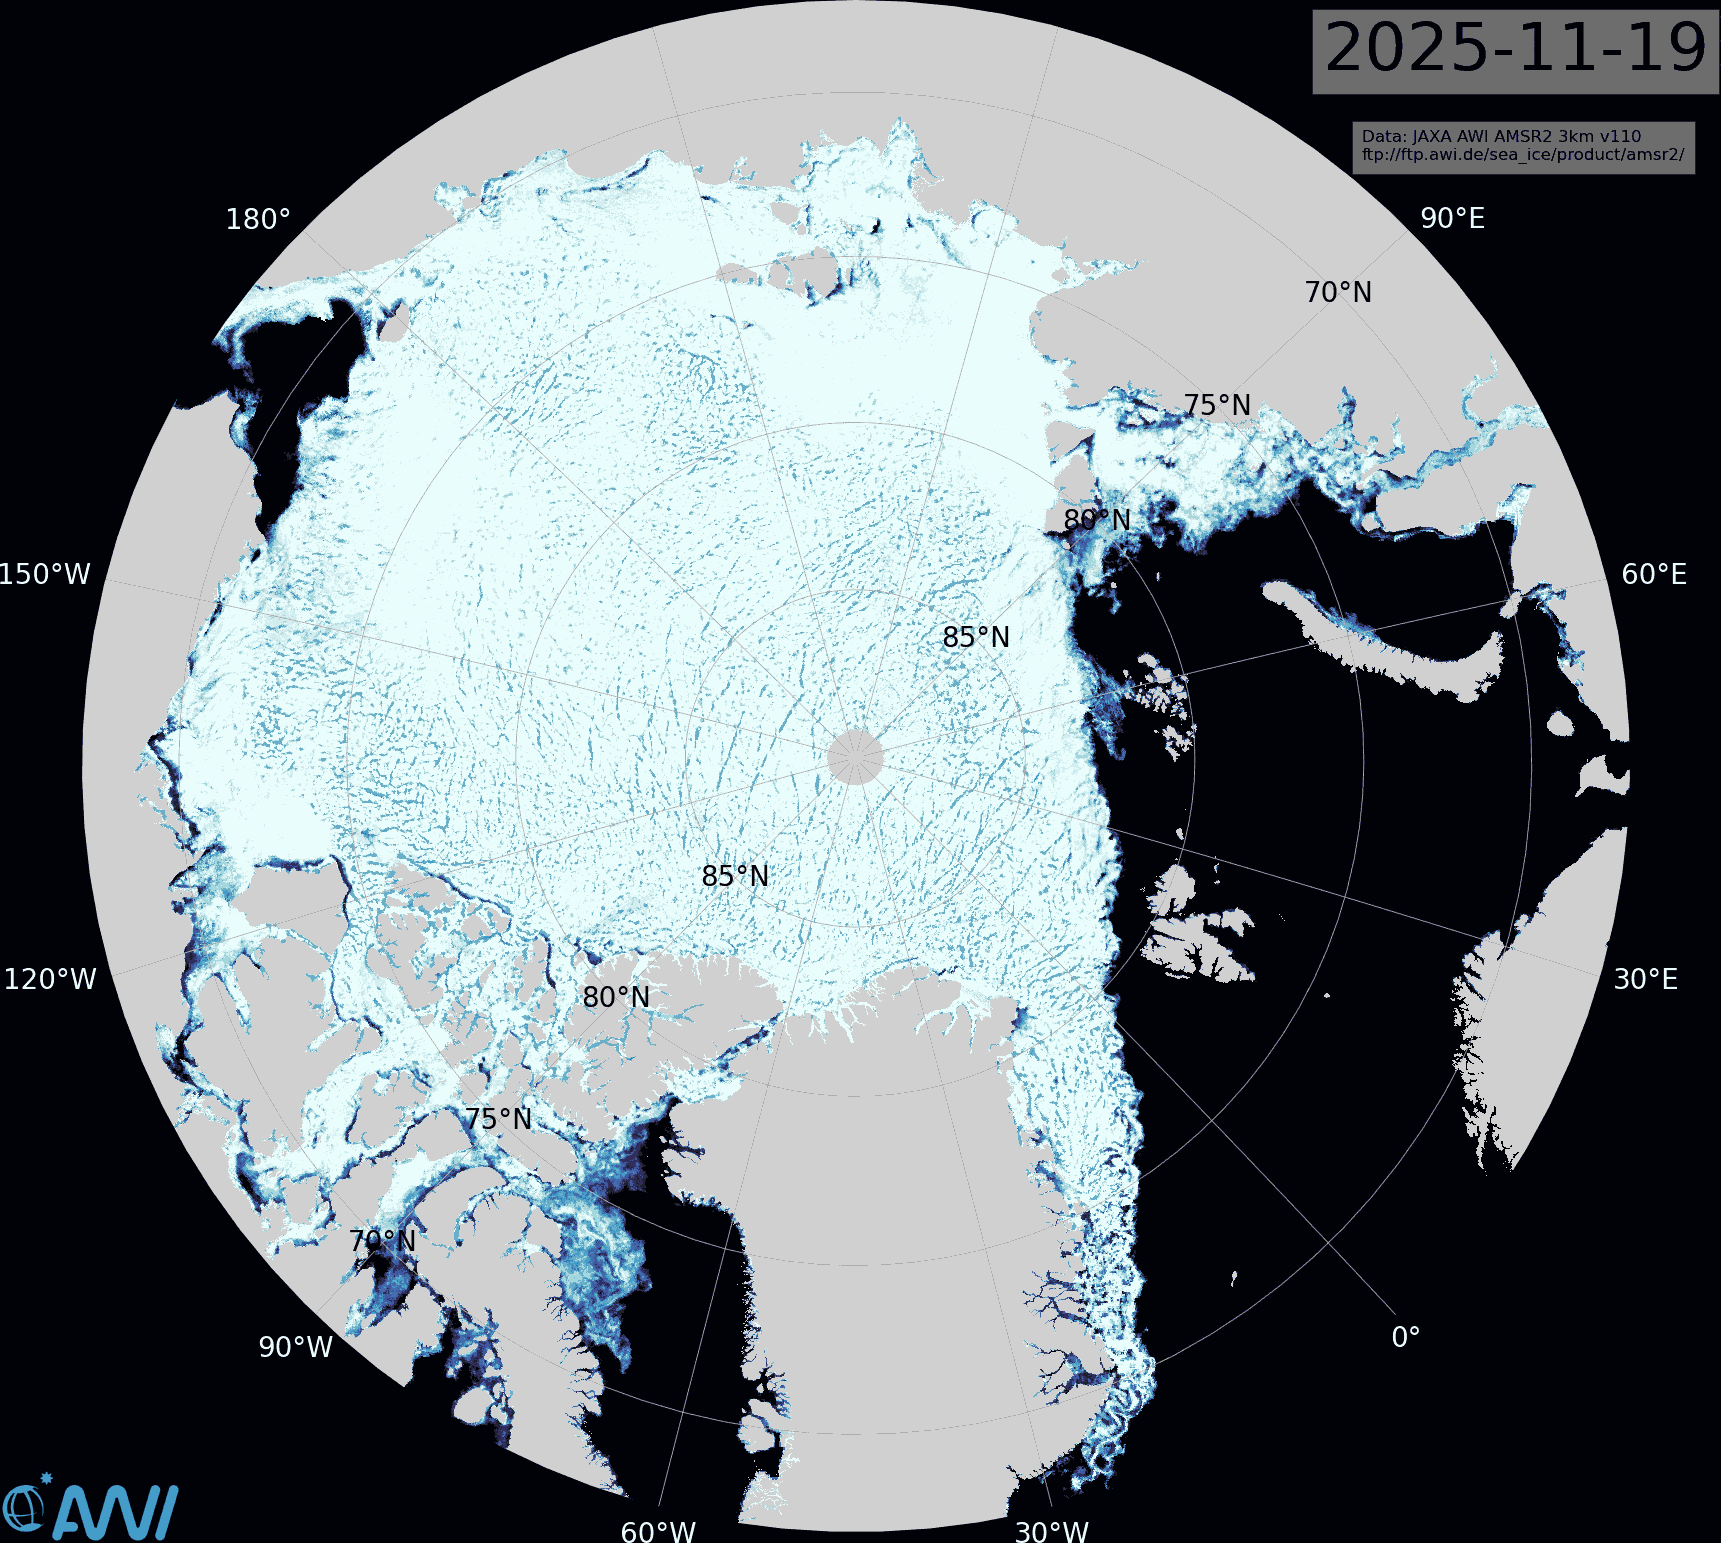
The latest Alfred Wegener Institute sea ice concentration map shows that the Pacific side of the Central Arctic Basin is now almost completely refrozen:
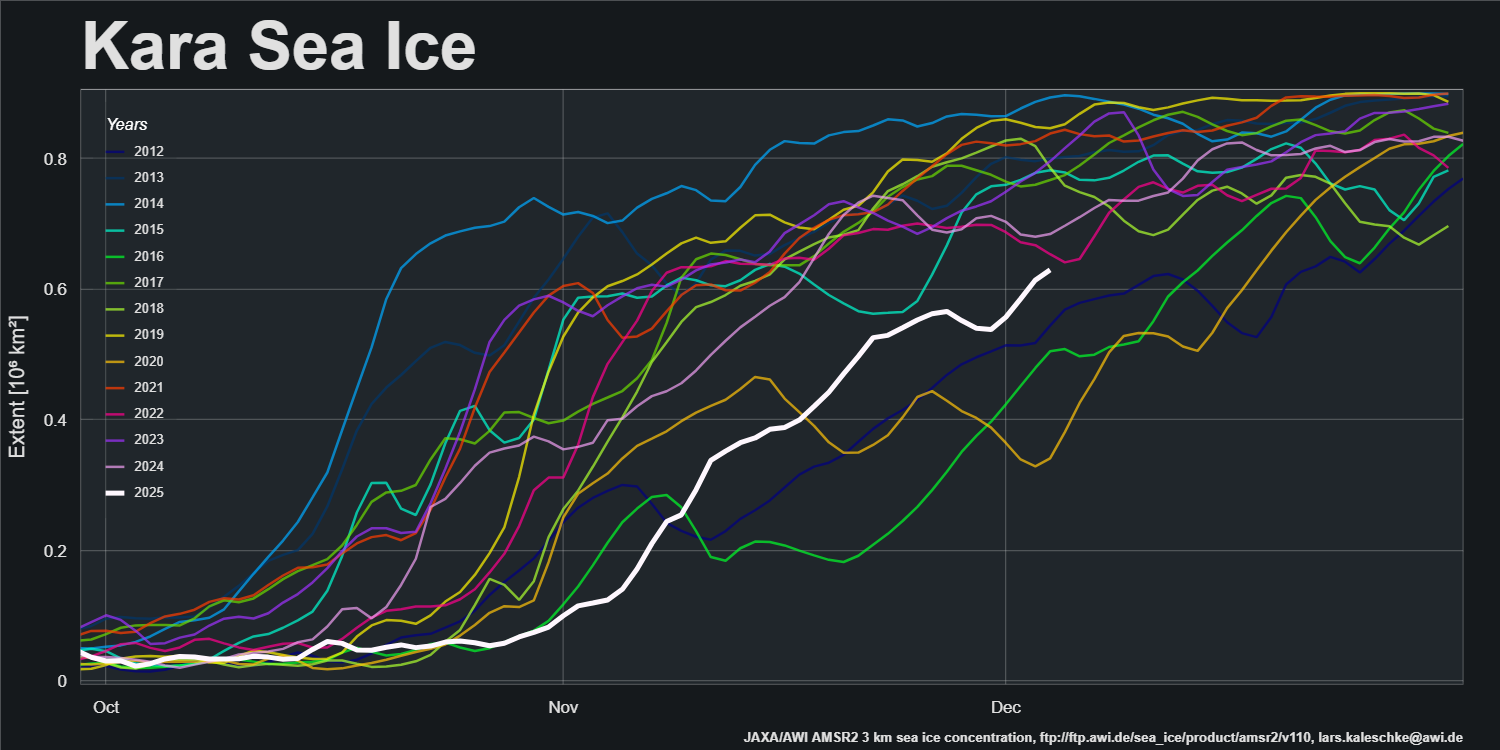
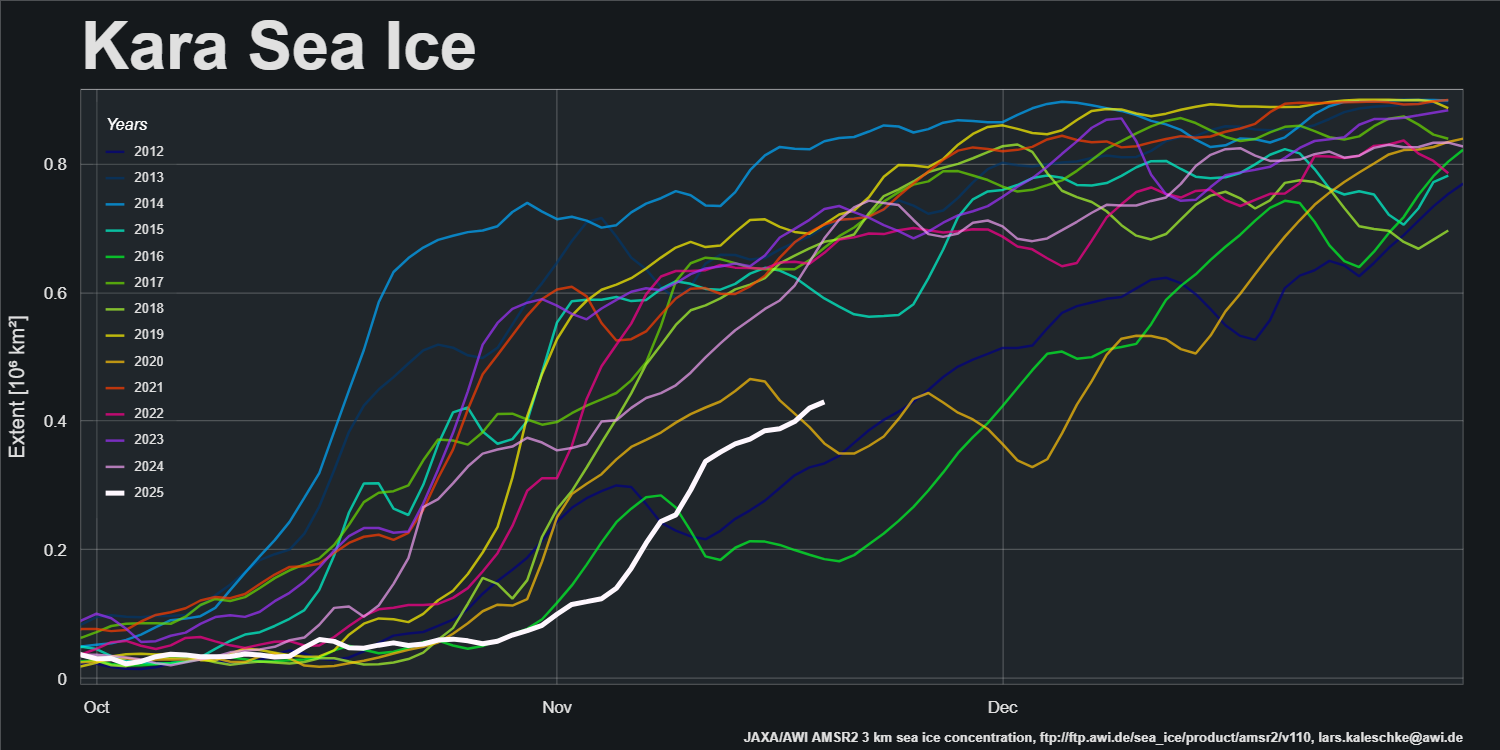
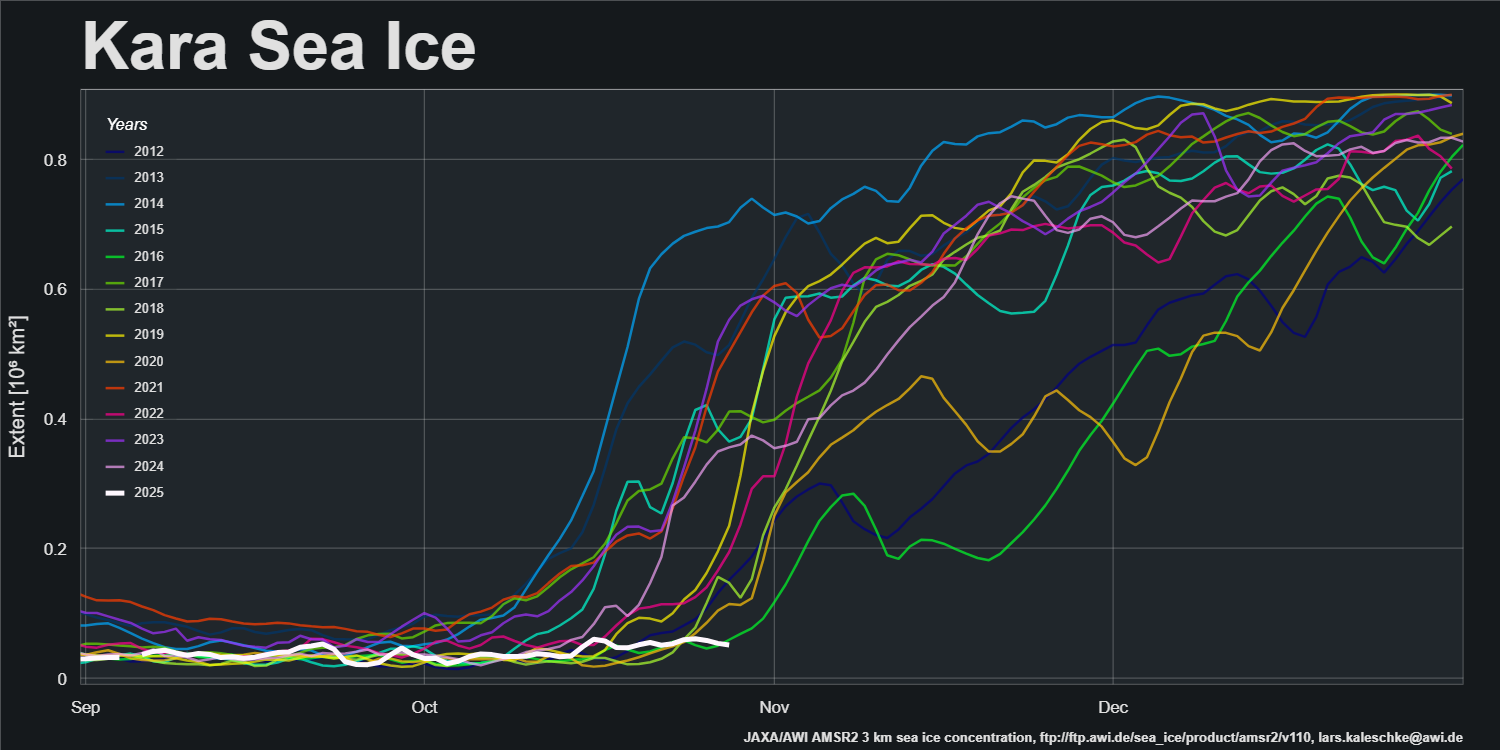
On the Atlantic side of the Arctic the Kara Sea is rapidly refreezing:
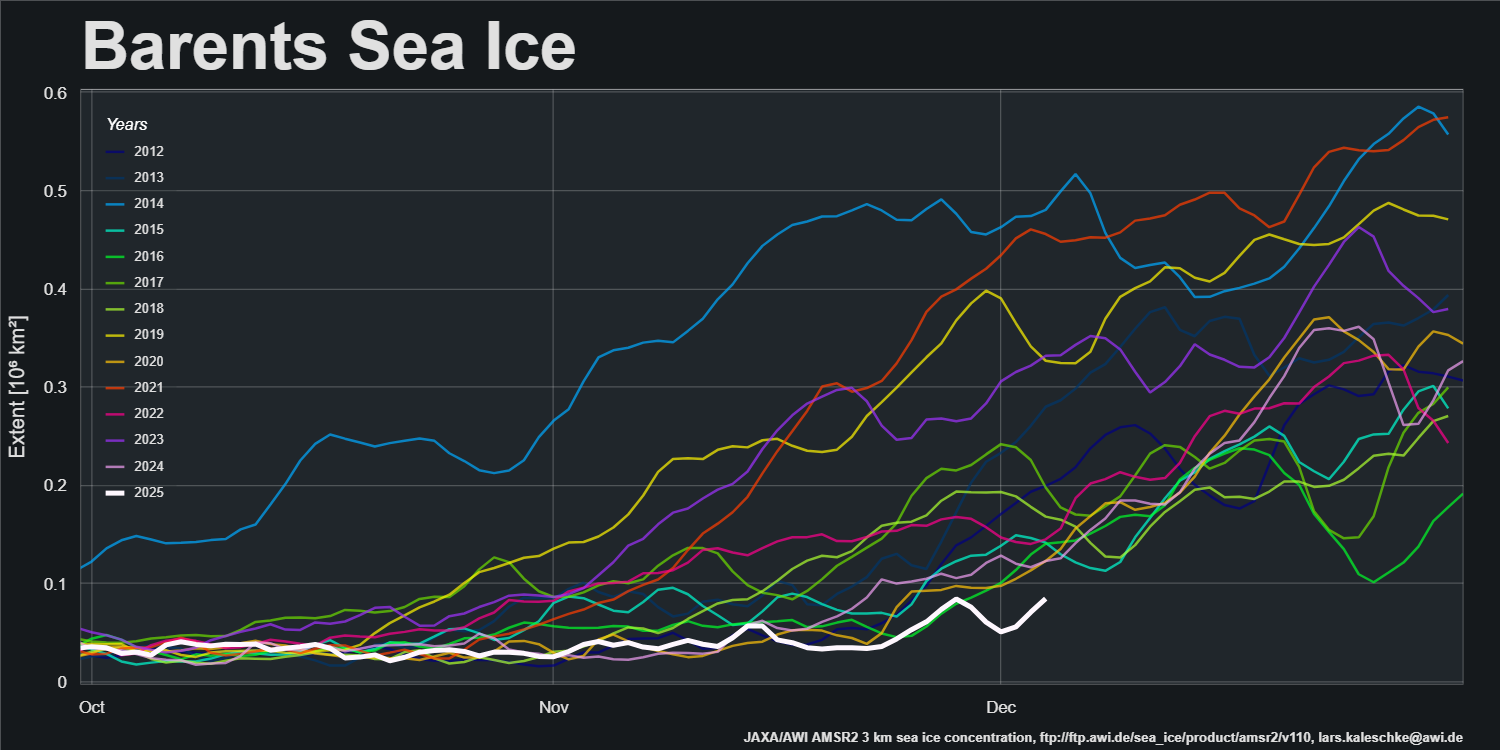
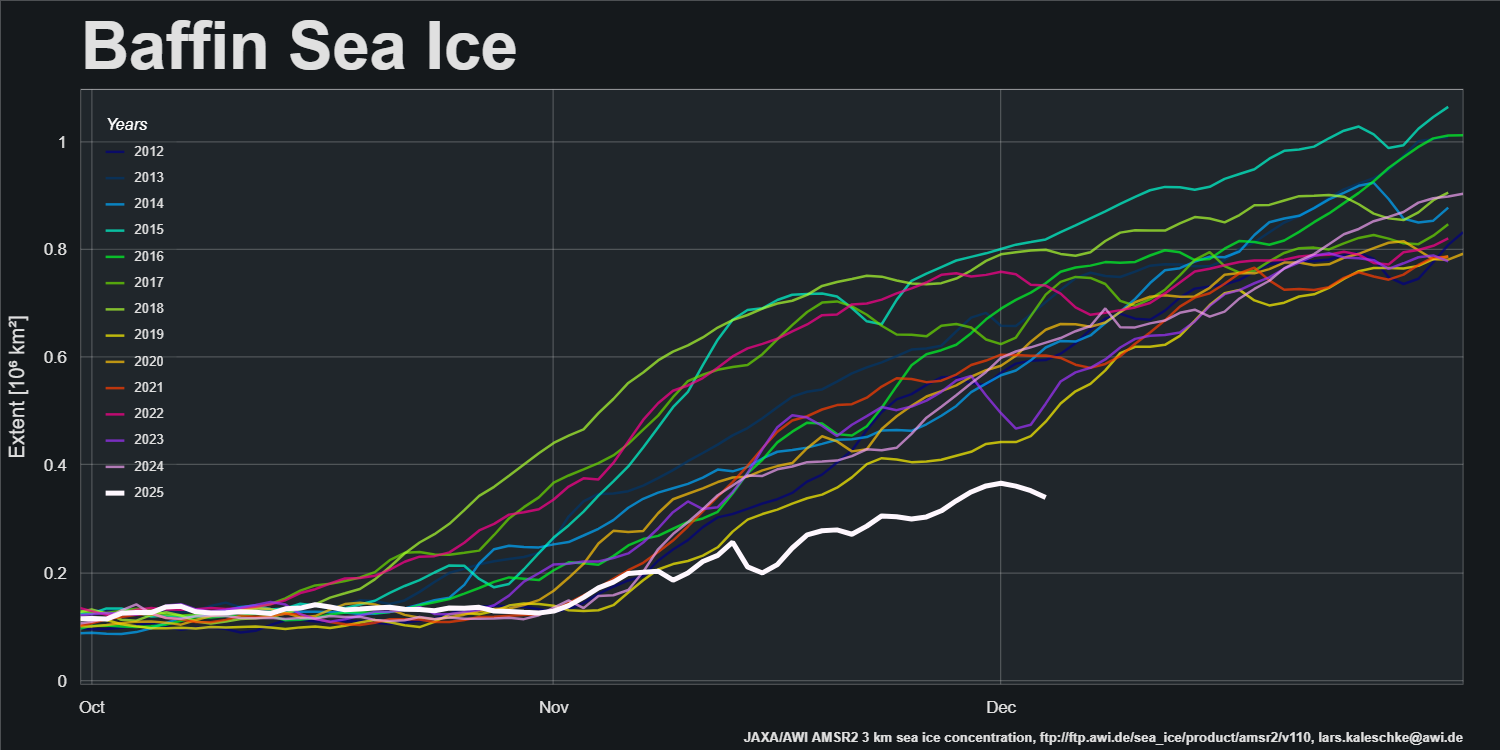
However, sea ice extent in the Barents Sea and Baffin Bay is currently lowest for the date in the AMSR2 record:
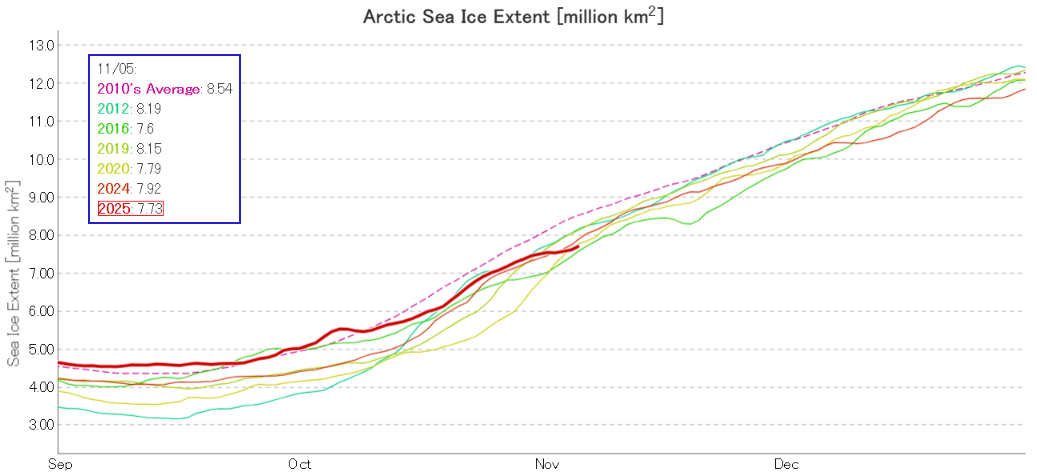
Pan Arctic JAXA/ViSHOP extent is currently lowest for the date in the satellite era:
The latest Alfred Wegener Institute sea ice concentration map shows the East Siberian and Laptev Seas almost completely refrozen. However, refreeze of the Kara Sea has barely begun:
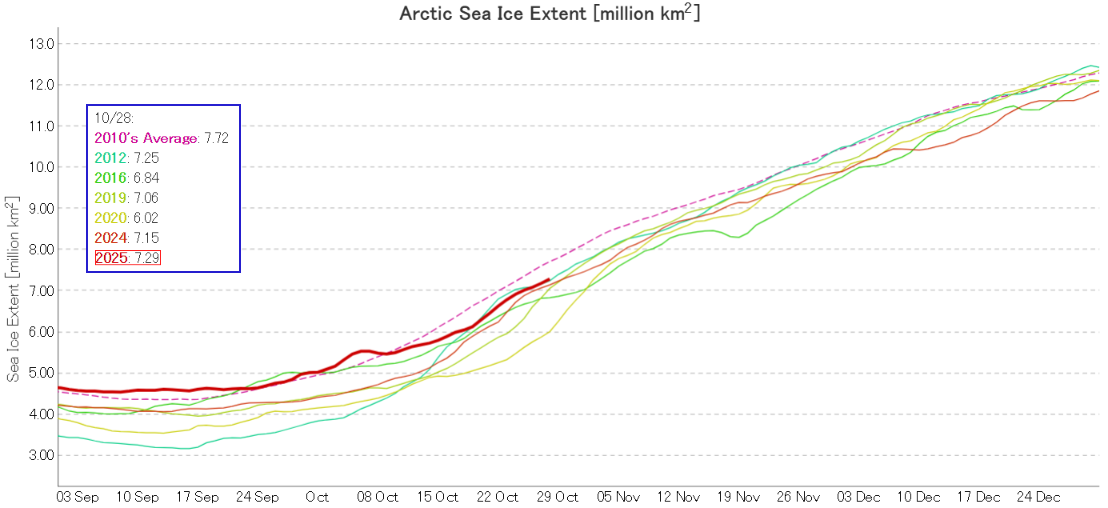
Across the Arctic as a whole the refreeze has slowed significantly, and JAXA/ViSHOP extent is now 2nd lowest in the satellite era:
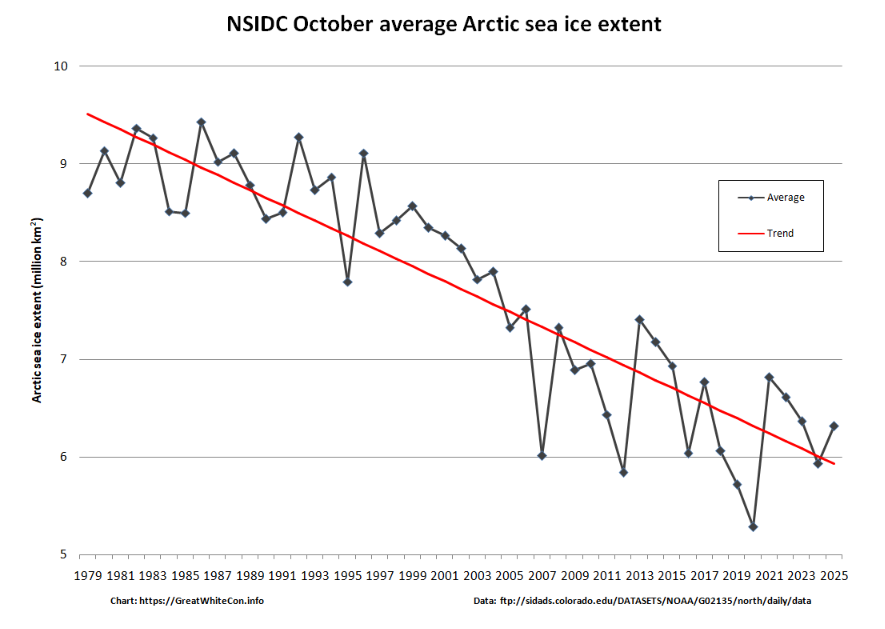
However, average NSIDC extent for the month of October was higher than last year and above the linear trend:
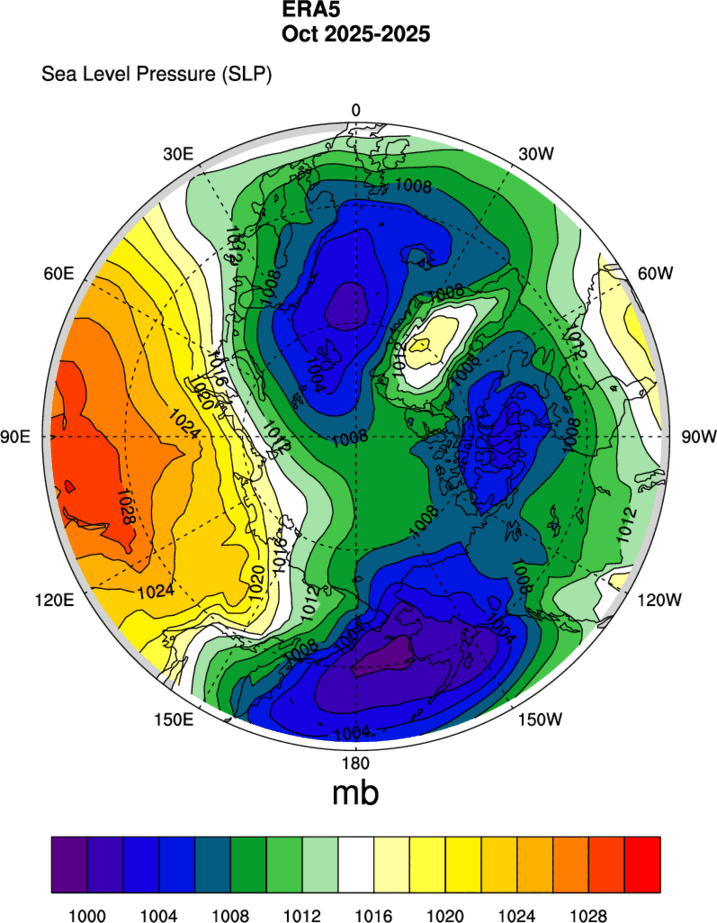
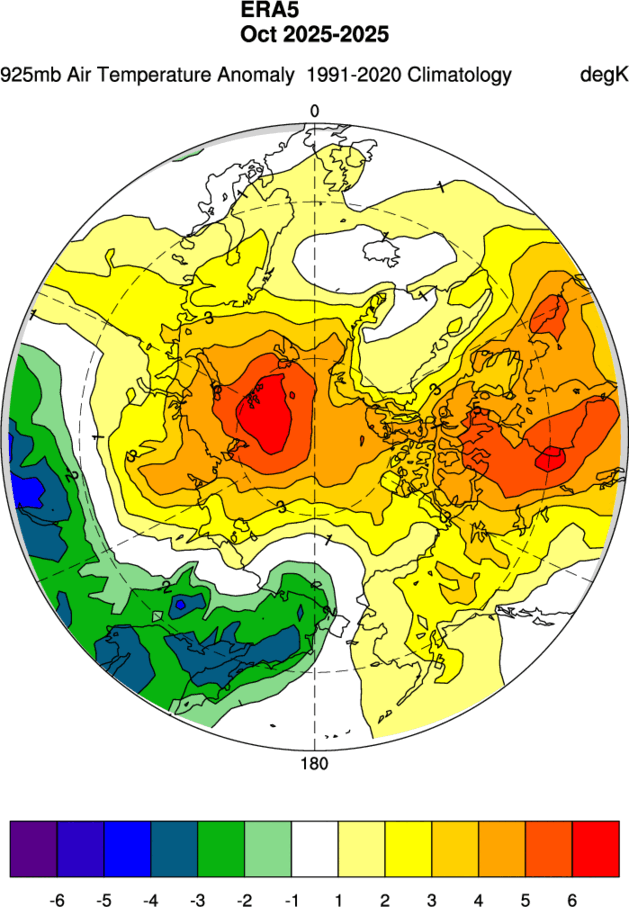
The ERA5 MSLP map for October shows high pressure over Siberia, associated with lower than normal air temperatures at 925 hPa across the region. However, temperatures across almost the entire Arctic Ocean were above normal:
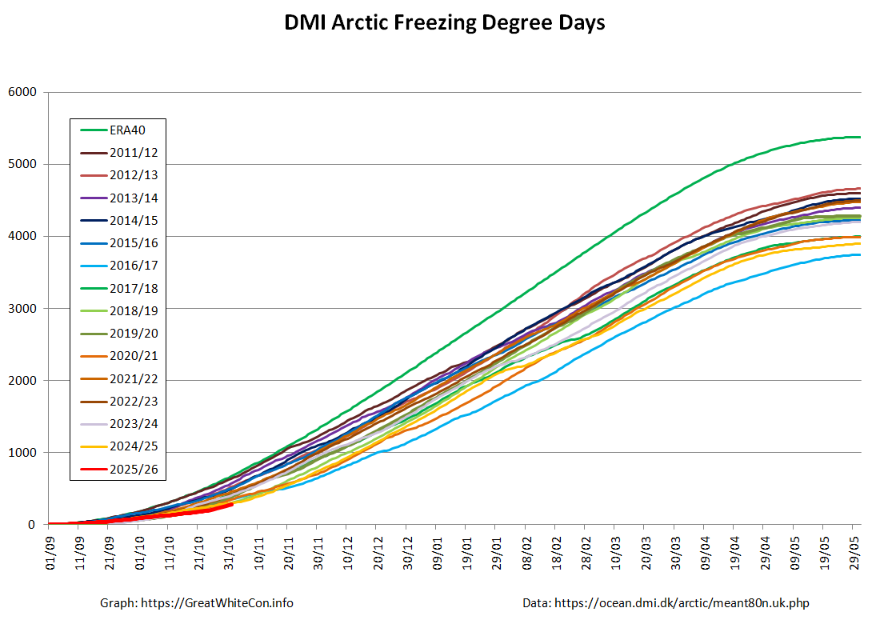
High Arctic freezing degree days based on DMI >80N data were lowest for the date at the beginning of November:
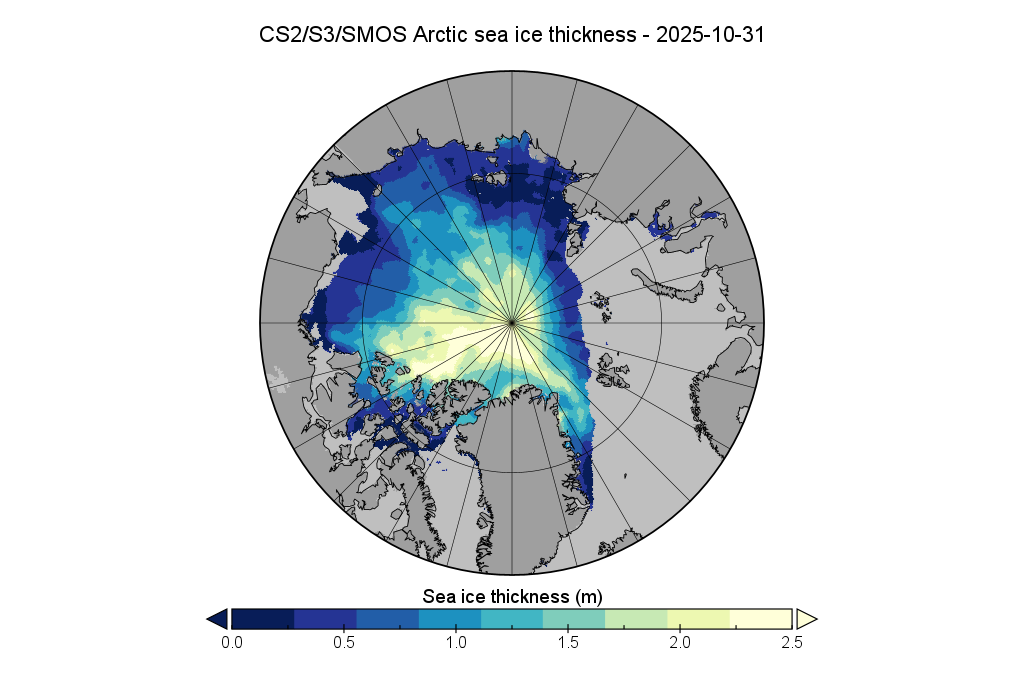
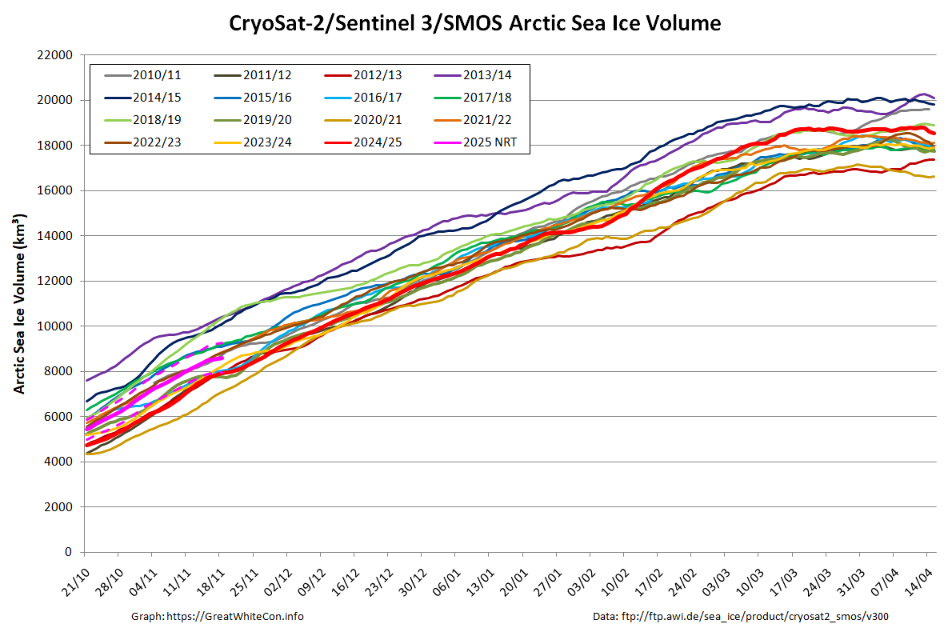
Bear in mind the caveats about the current lack of reliable SMOS data on the Atlantic side of the Arctic, and that Sentinel 3 data is only incorporated from Autumn 2023.
[Update – November 20th]
Refreeze of the Beaufort Sea is complete, and refreeze of the Kara Sea has started in earnest:
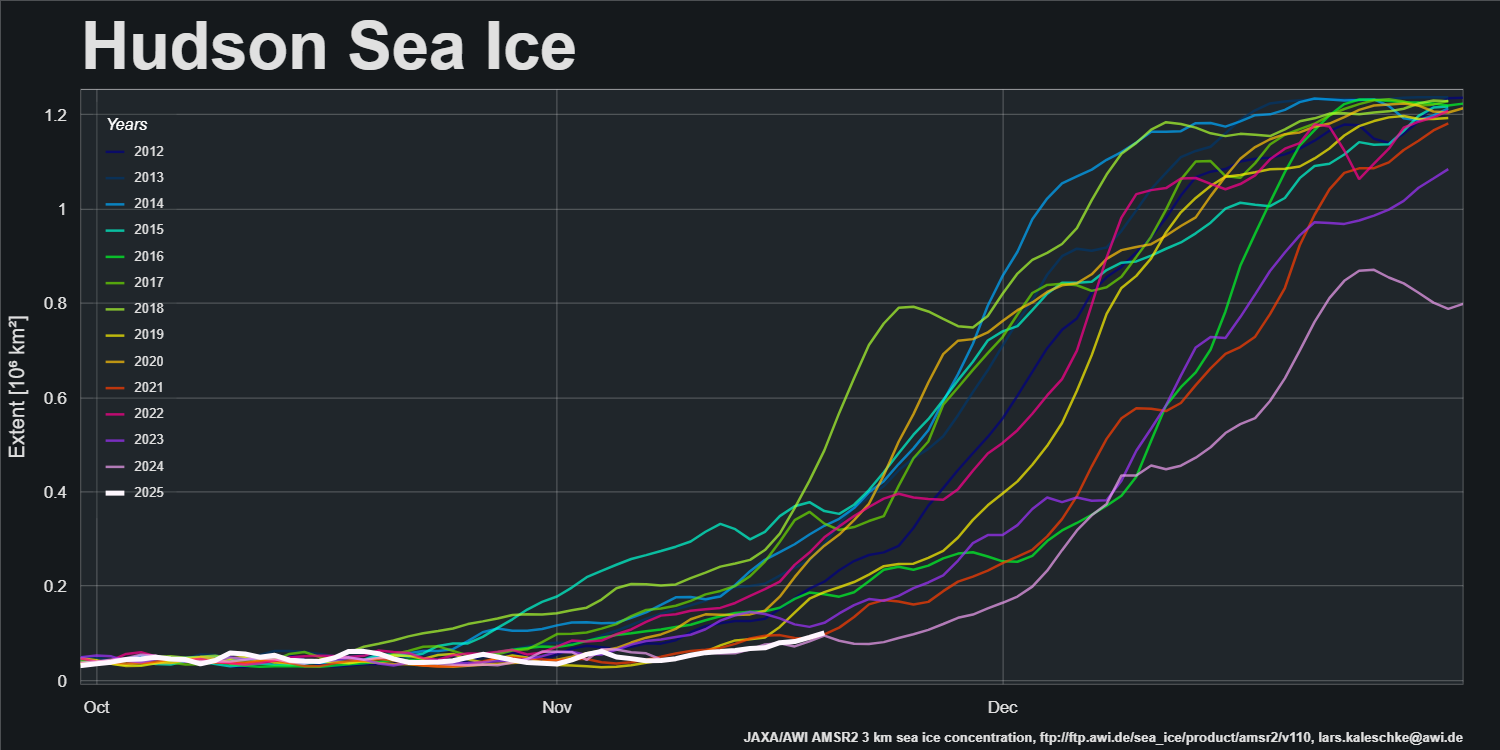
However, the Barents Sea is still sea ice free and refreeze of Hudson Bay has barely begun:
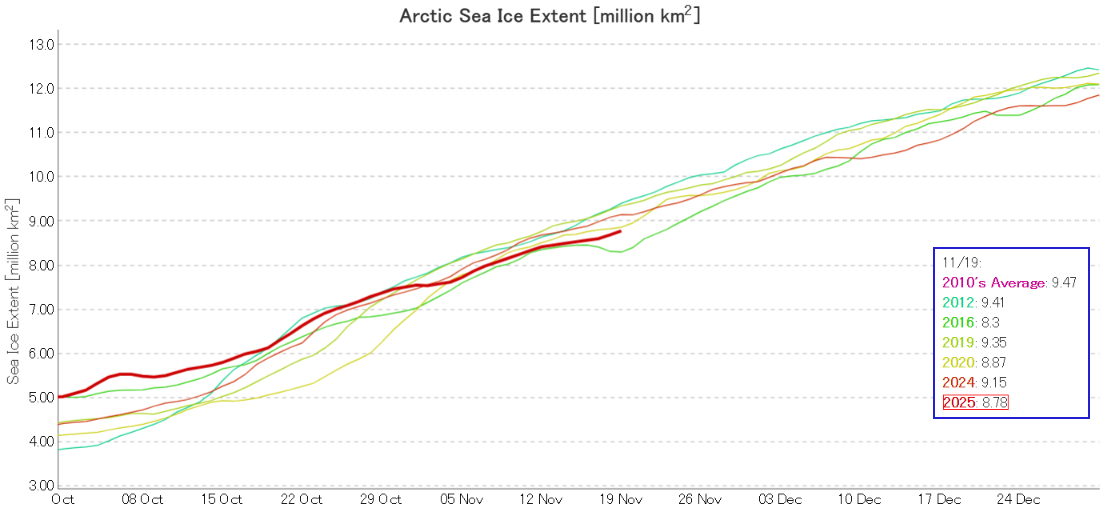
JAXA extent is still second lowest for the date:
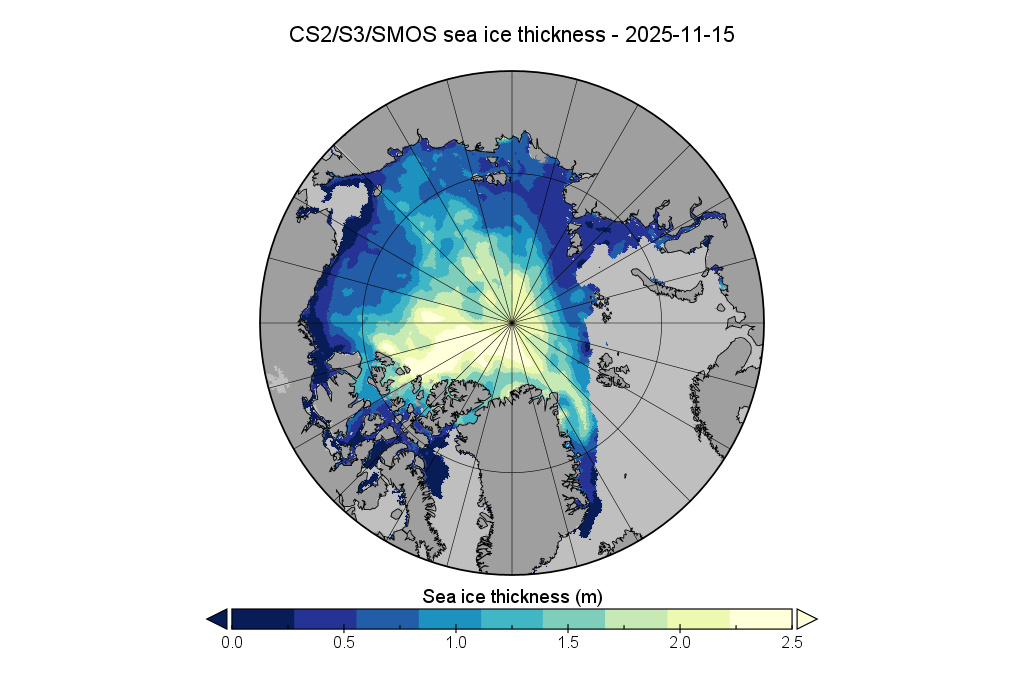
The PIOMAS gridded thickness data for October has yet to be corrected, but here is the mid month thickness map from AWI:
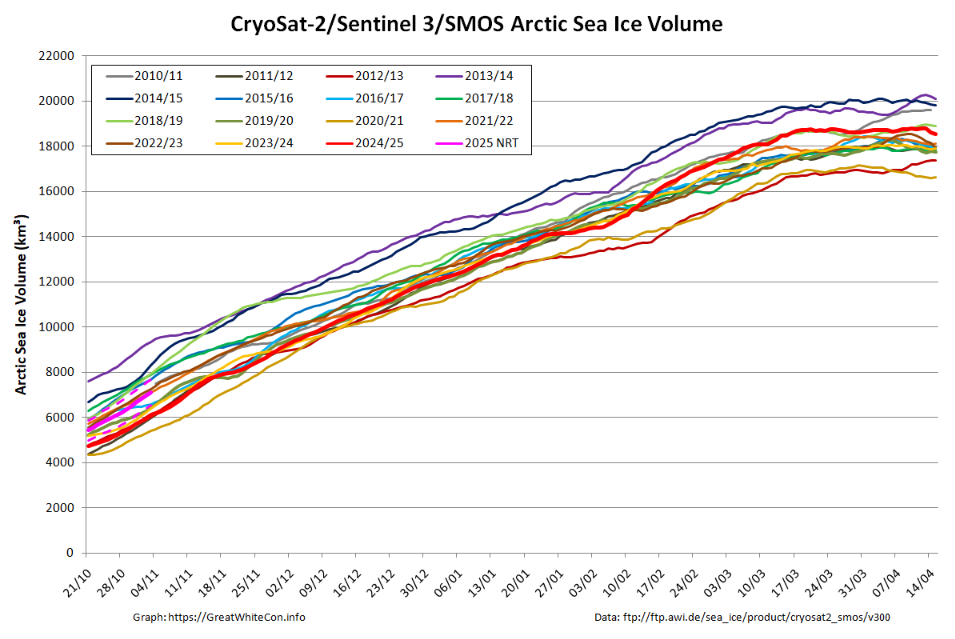
Here too is the associated volume graph:
[Update – November 27th]
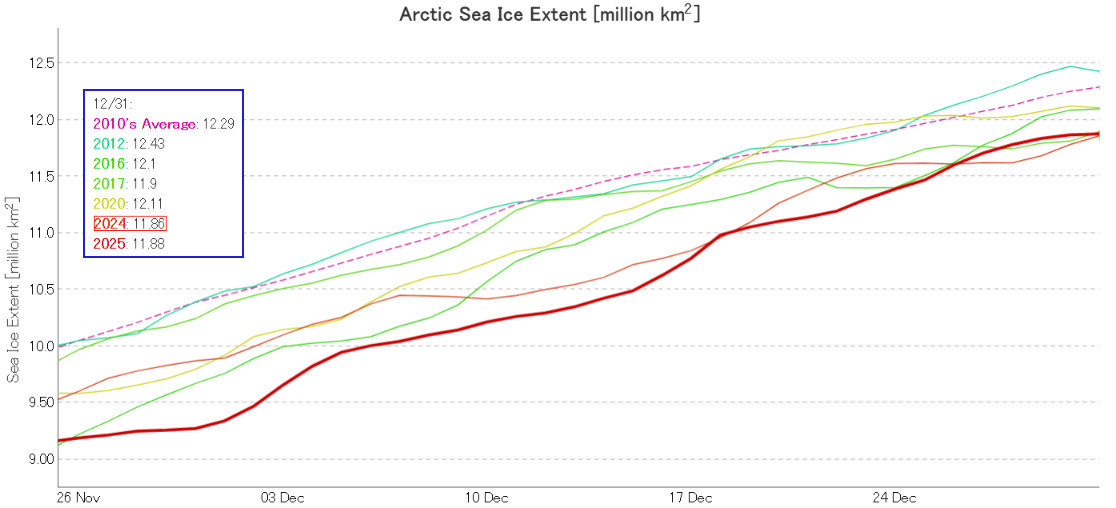
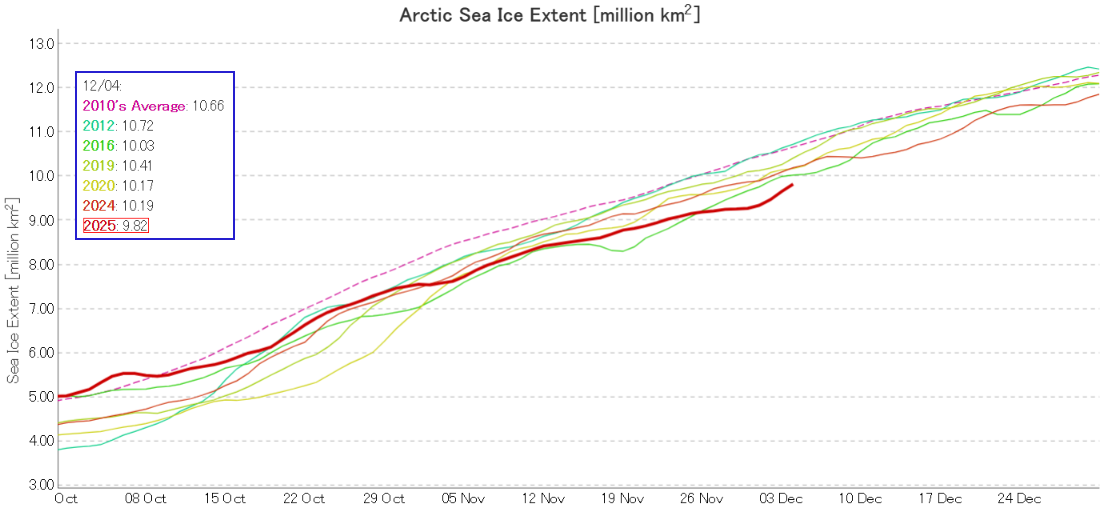
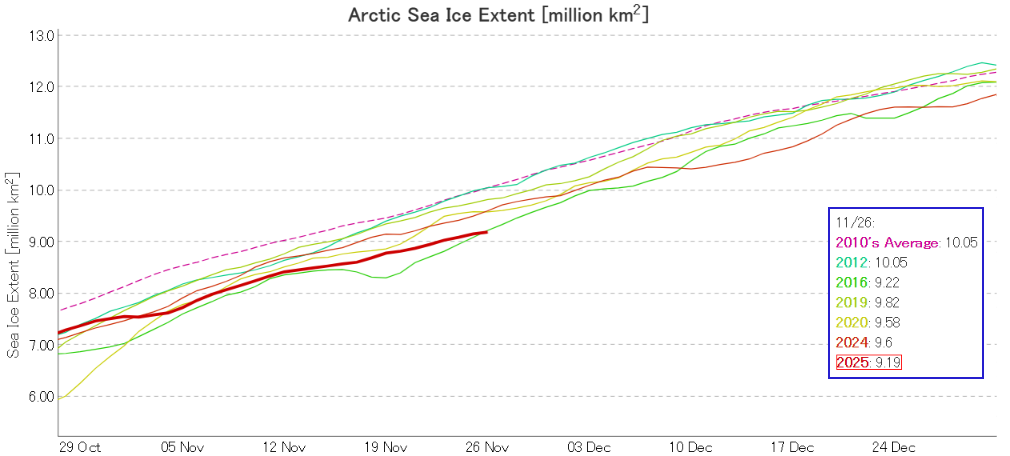
JAXA/ViSHOP extent is now lowest for the date in their record going back to 1978:
[Update – December 5th]
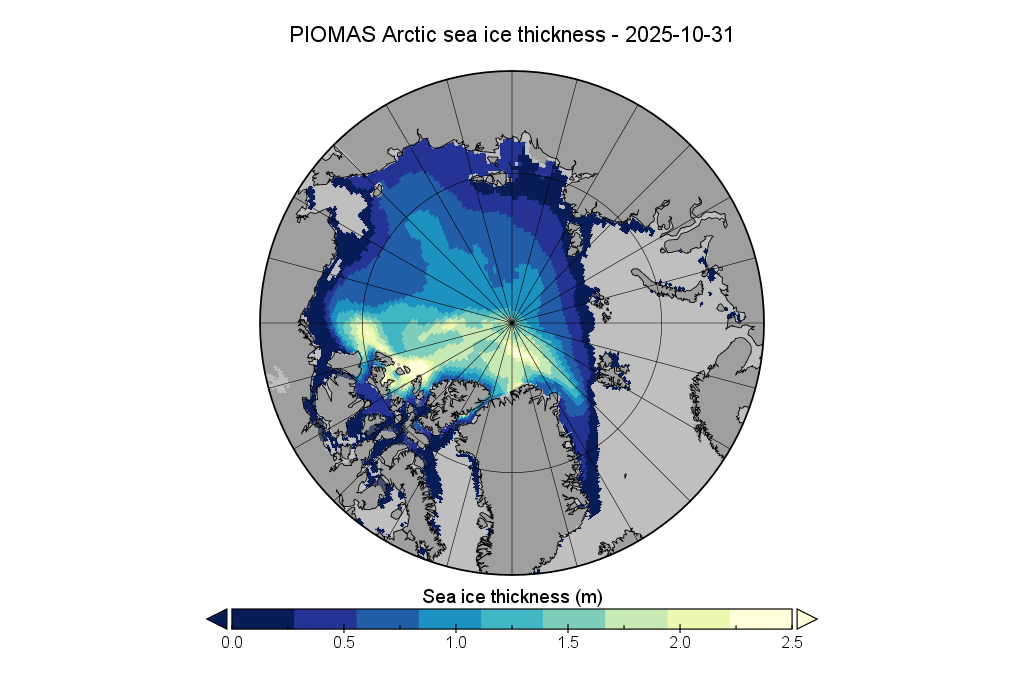
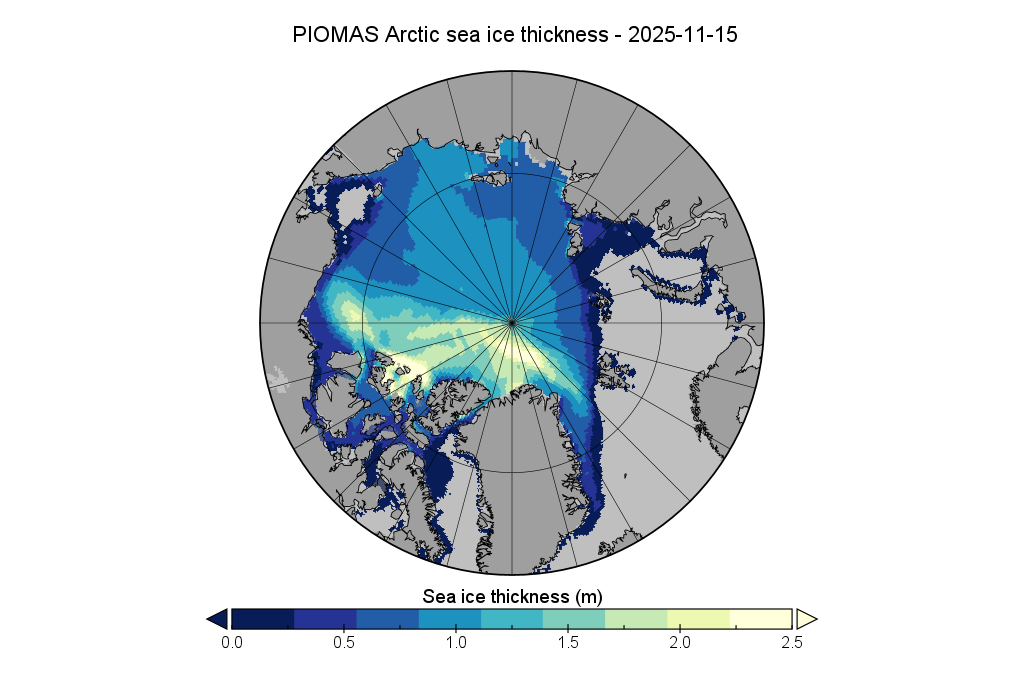
The PIOMAS team have finally published gridded thickness data for October and November, so here are the October 31st and November 15th thickness maps:
The conversation continues over on the December open thread, including the latest PIOMAS data.
Yes. NSIDC satellite data shows Arctic September sea ice extent declined from ~6.5 million km² in the early 2000s to ~4.2 million km² by 2024, while PIOMAS volume estimates fell from ~12,000 km³ to under 4,000 km³. Shellenberger's claim ignores these multi-decadal trends, though…
By way of additional background information, Wikipedia asserts that:
Grok is a generative artificial intelligence chatbot developed by xAI. It was launched in November 2023 by Elon Musk as an initiative based on the large language model (LLM) of the same name. Grok has apps for iOS and Android and is integrated with the social media platform X (formerly known as Twitter), Tesla vehicles, and Tesla’s Optimus robot. The chatbot is named after the verb grok, coined by American author Robert A. Heinlein in his 1961 science fiction novel Stranger in a Strange Land to describe a deeper than human form of understanding.
The bot has generated various controversial responses, including conspiracy theories, antisemitism, and praise of Adolf Hitler, as well as referring to Musk’s views when asked about controversial topics or difficult decisions. Updates since 2023 have shifted the bot politically rightward to provide conservative responses to user queries.
and that:
Michael D. Shellenberger is an American author and journalist. He is the first endowed professor at the University of Austin, serving as CBR Chair of Politics, Censorship, and Free Speech.
Shellenberger is a prominent heterodox thinker on topics including climate change and homelessness…
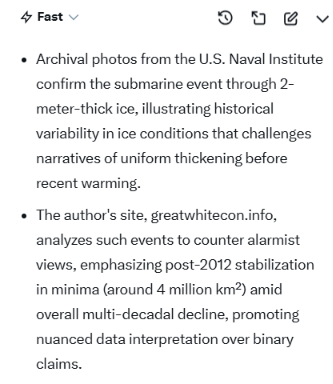
An archived photograph in the NHHC image collection: “USN 1040961 USS SKATE (SSN–578)” which shows the submarine moored to the ice pack. flickr.com
A blog article “USS Skate at the North Pole – Truth and Fantasy Fiction” that collects several of the historic photographs and discusses their context. greatwhitecon.info
I asked ChatGPT to check out the final link in more detail. I was informed:
What GreatWhiteCon does well:
It collects and reproduces the historic images and contemporary captions, and discusses how those images have been interpreted (or misinterpreted) over time. That makes it a handy one-stop place to see the pictures and some commentary.
What GreatWhiteCon is not:
It is a blog/analysis piece (2018) rather than an official or archival source. That means its interpretation is useful, but any factual claim that matters (dates, official captions, archival catalog numbers) is best checked against the primary records (Naval History & Heritage Command, National Archives, contemporary magazines, USNI Proceedings).
Grok has a rather different interpretation of what Great White Con does well. Allegedly “Snow White”:
Counters alarmist views… promoting nuanced data interpretation over binary claims.
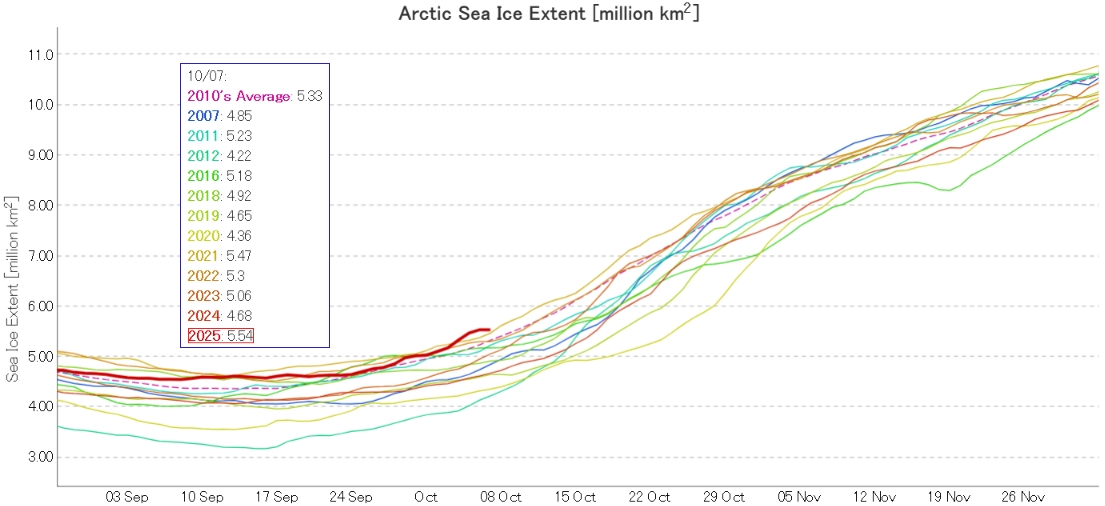
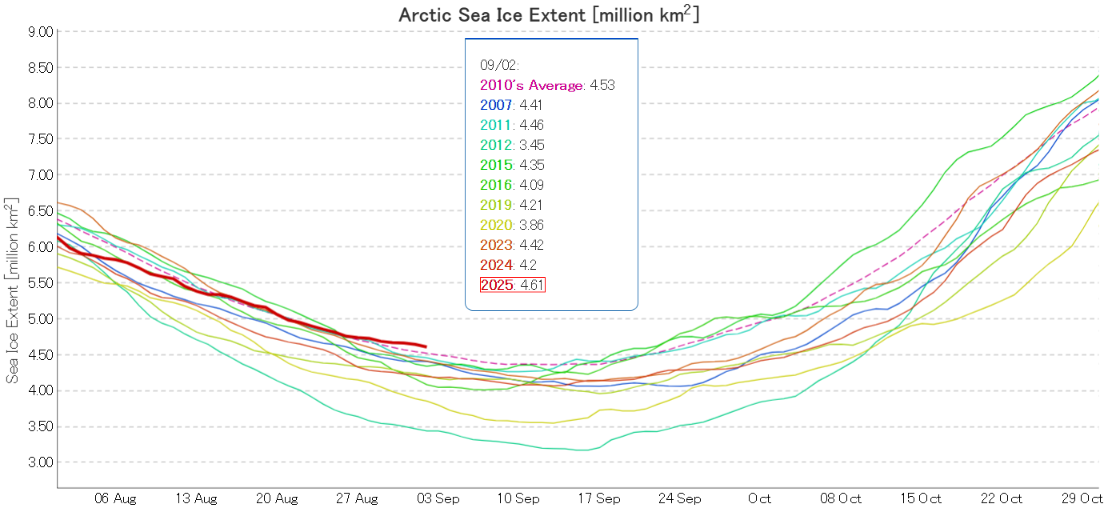
I was hoping that the September PIOMAS gridded thickness data would have been published by now, but no such luck. Reverting to JAXA/ViSHOP extent, after flatlining for most of September the refreeze has started in earnest over the last two weeks. Extent is currently 12th lowest in the satellite era:
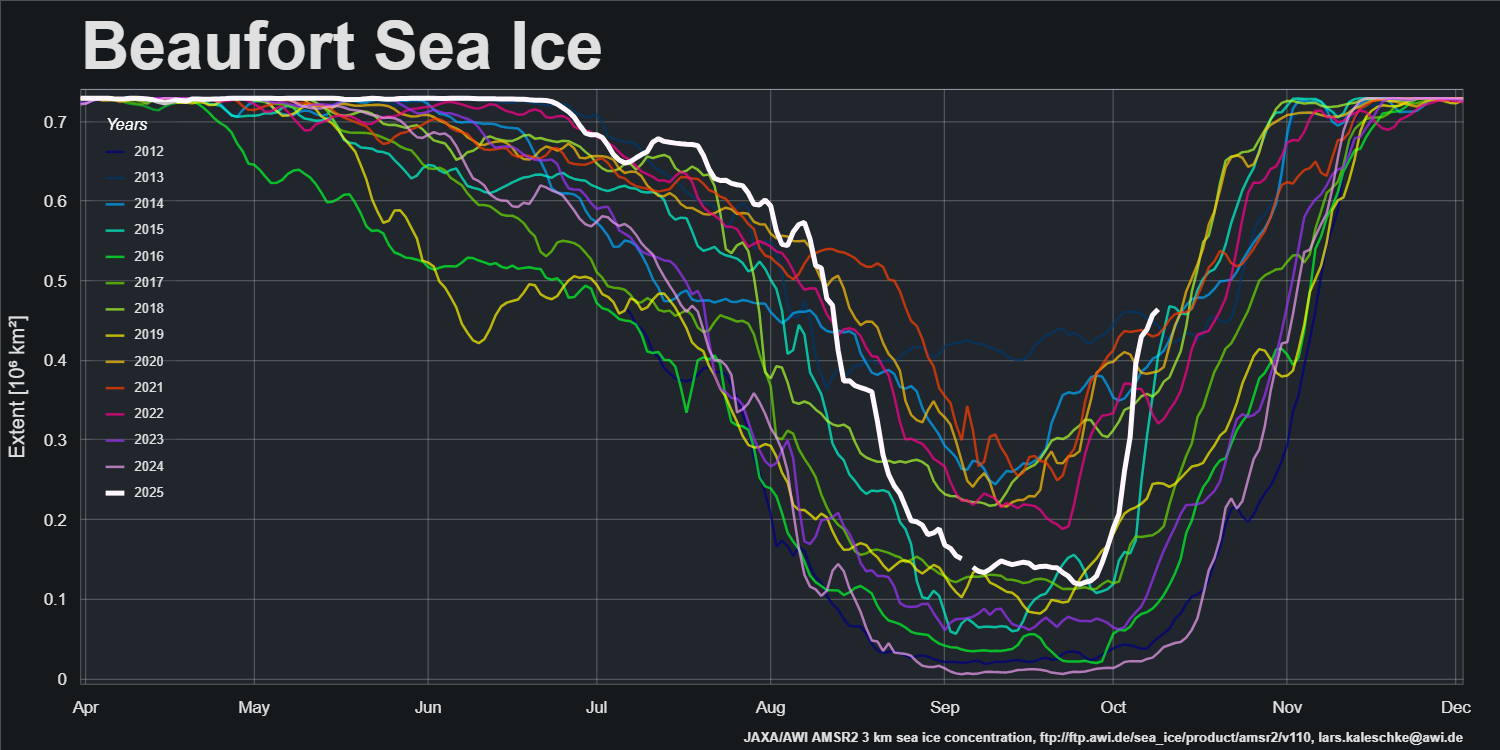
The latest sea ice concentration map from Lars Kaleschke of the Alfred Wegener Institute, based on AMSR2 data, reveals plenty of new ice in the Beaufort Sea, plus a bit more to the north of the Laptev Sea:
The latest sea ice “stage of development” charts from the Canadian Ice Service confirm that, and reveal more new ice that has yet to show up in the AMSR2 data:
[Update – October 11th]
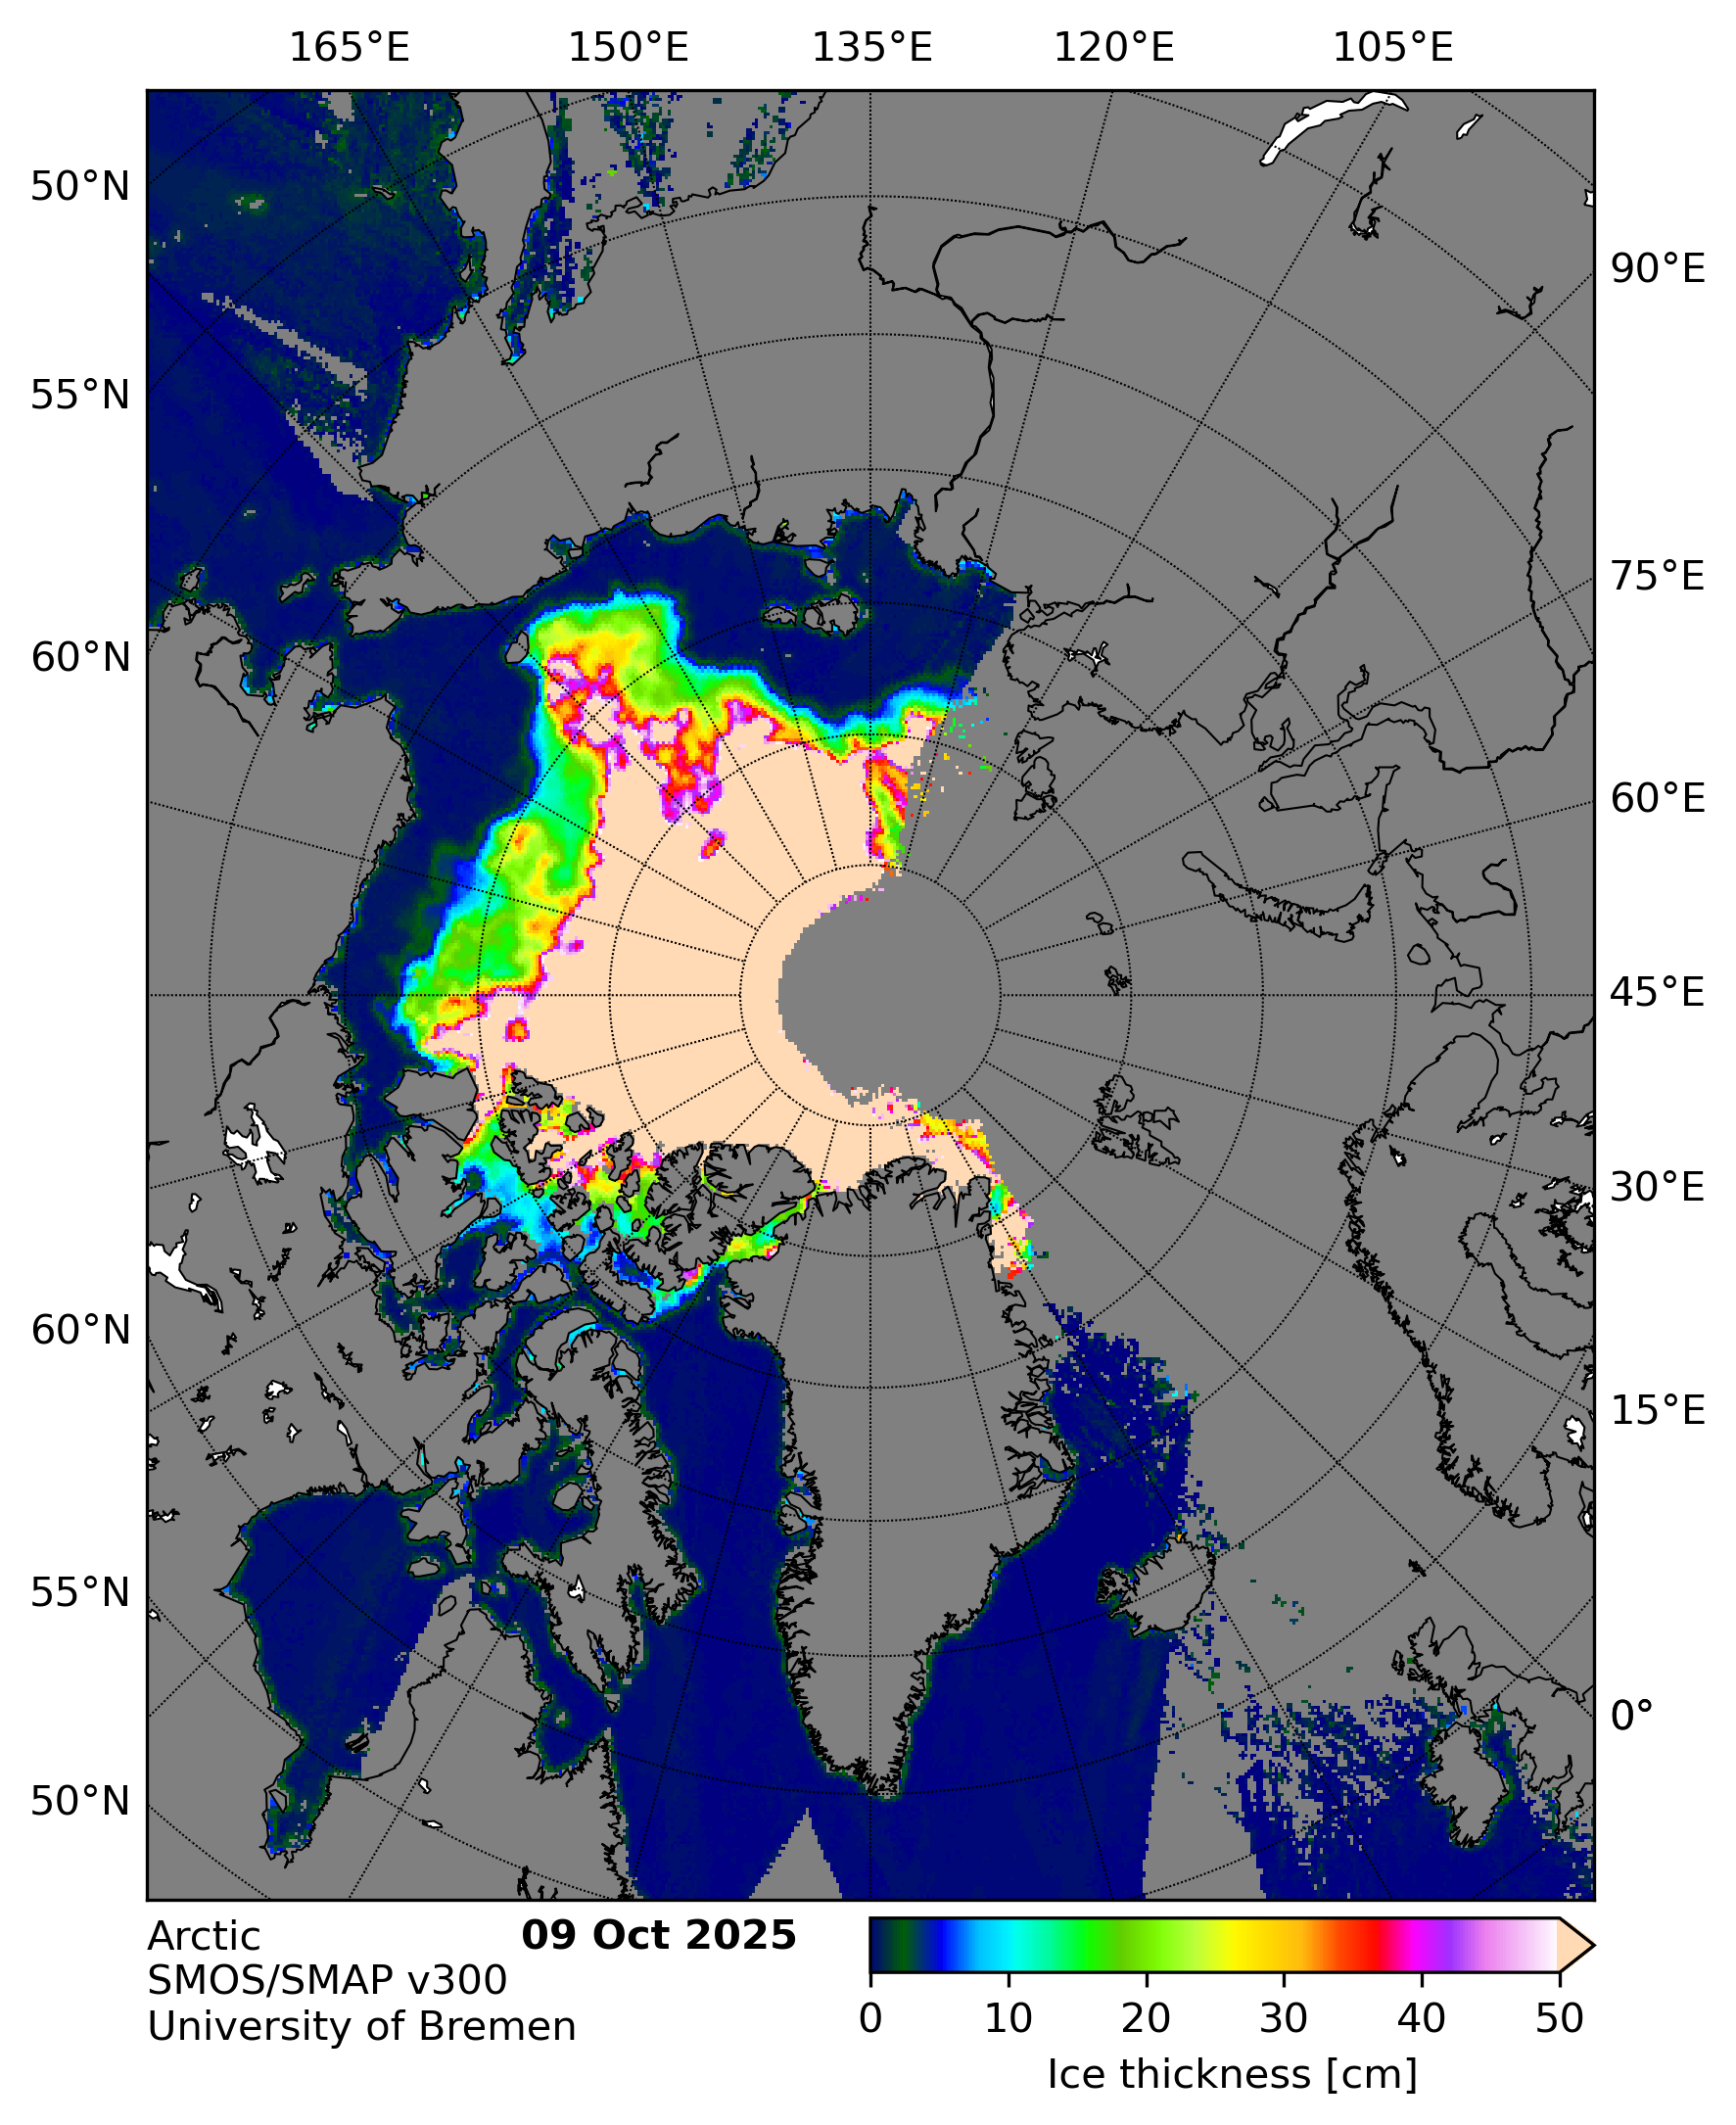
In the continuing absence of PIOMAS gridded thickness data (see below), here’s the latest SMOS/SMAP “thin ice thickness” map:
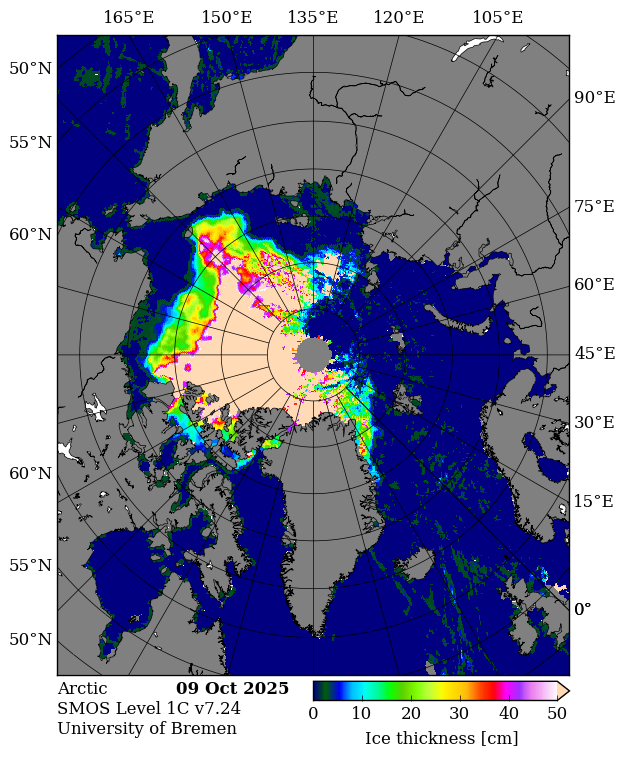
It appears to be badly affected by radio frequency interference on the Atlantic side of the Arctic. Here’s the raw SMOS map:
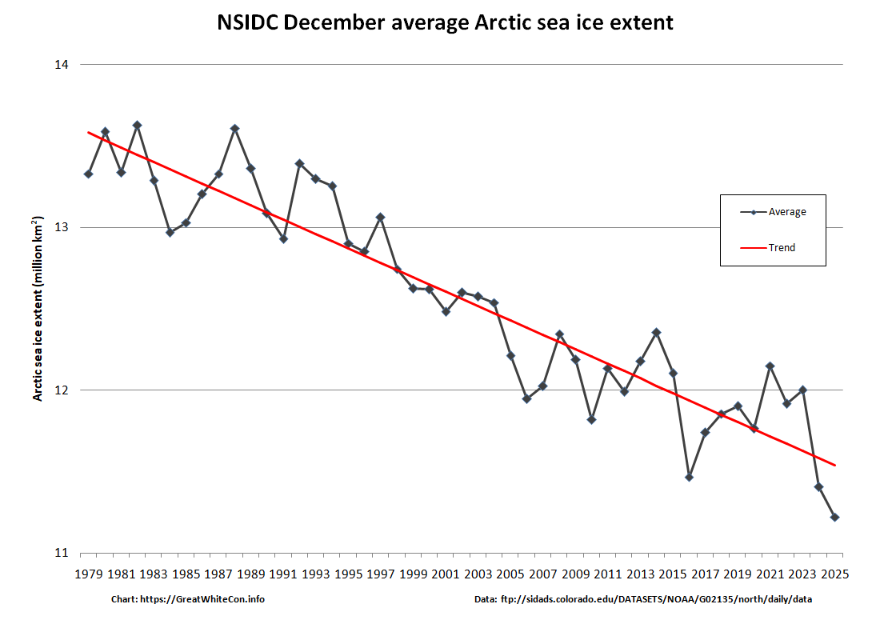
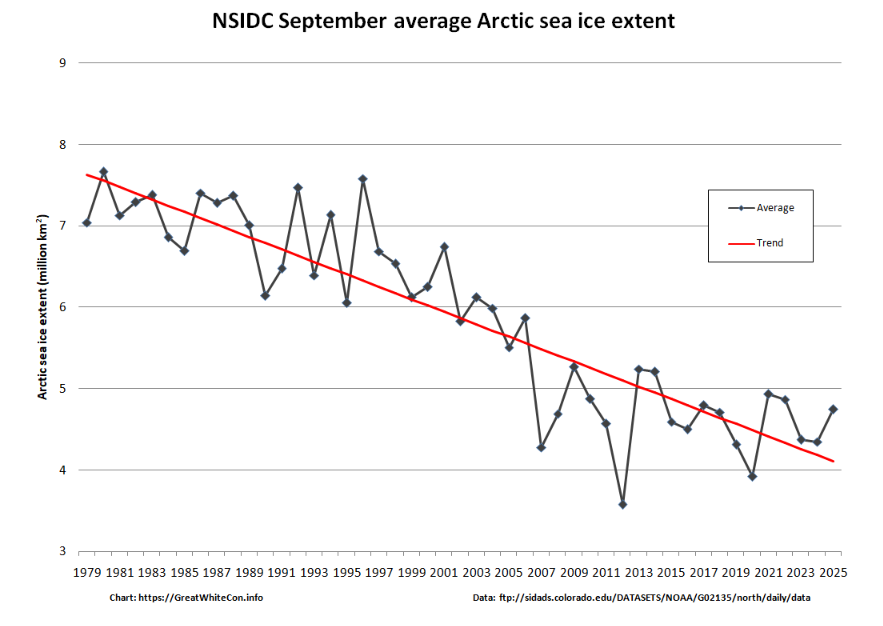
Further to a previous conversation on the subject, here’s the final NSIDC annual average extent graph for September:
As anticipated, 2025 annual average extent has proved to be the lowest in the satellite era.
[Update – October 16th]
I was hoping that the September edition of the NSIDC’s “Sea Ice Today” analysis would have been published by now, but no such luck. Here’s the latest data announcement from the NSIDC:
Effective October 15, 2025, due to non-renewed funding, NSIDC has suspended or reduced several Sea Ice Today tools and services.
Sea ice annual maximum and minimum announcements (typically occurring in March and September)
Previously-published Sea Ice Today analysis posts will remain online. The discontinued Sea Ice Today products will no longer update or be maintained, and will be removed in the next several weeks.
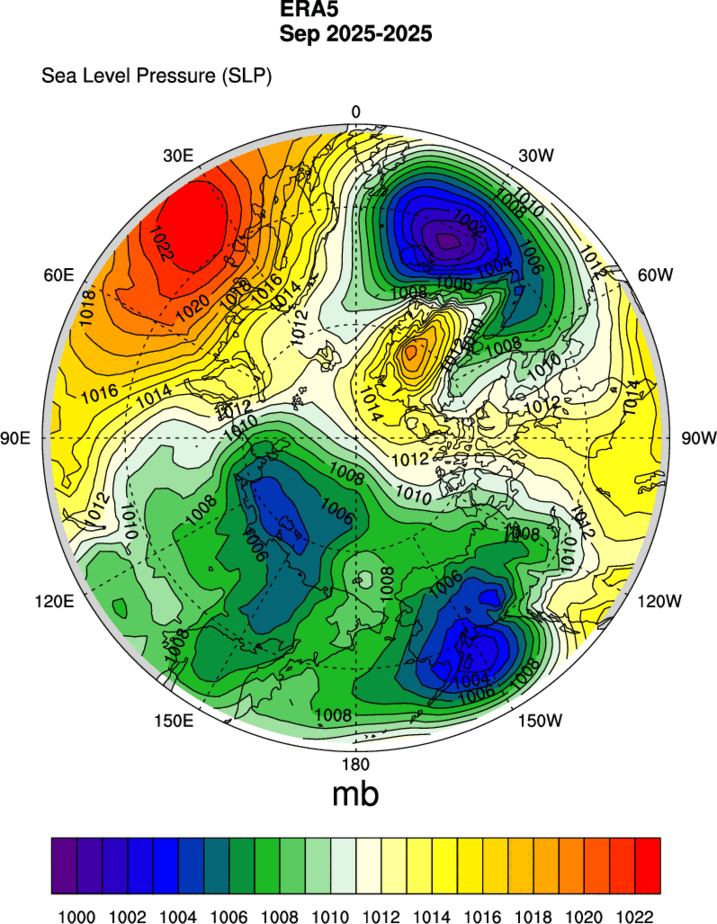
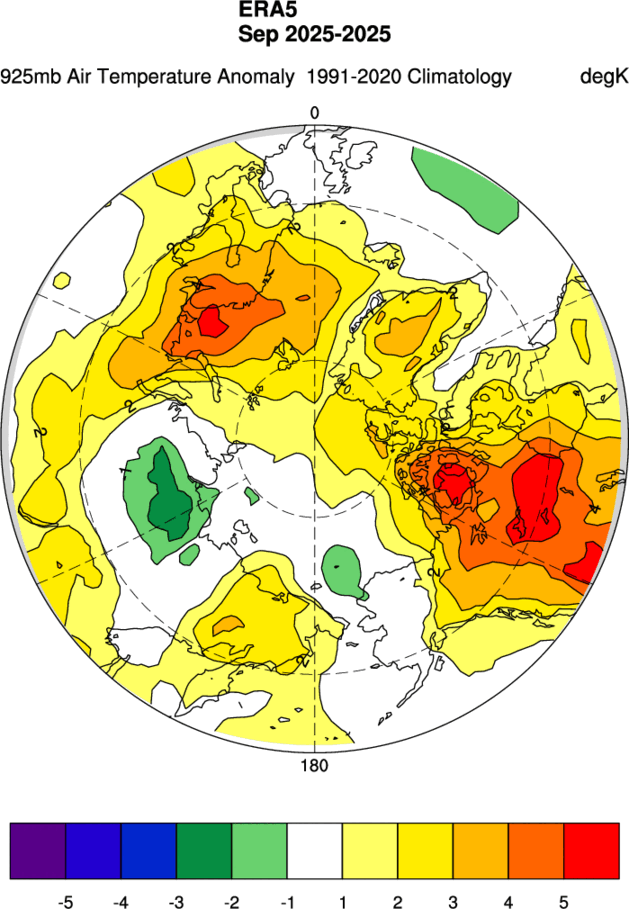
In Sea Ice Today’s absence, here’s the MSLP and 925 hPa temperature maps for September, usually contained in the monthly analysis articles:
Plus a hastily constructed graph of the monthly average extent for September:
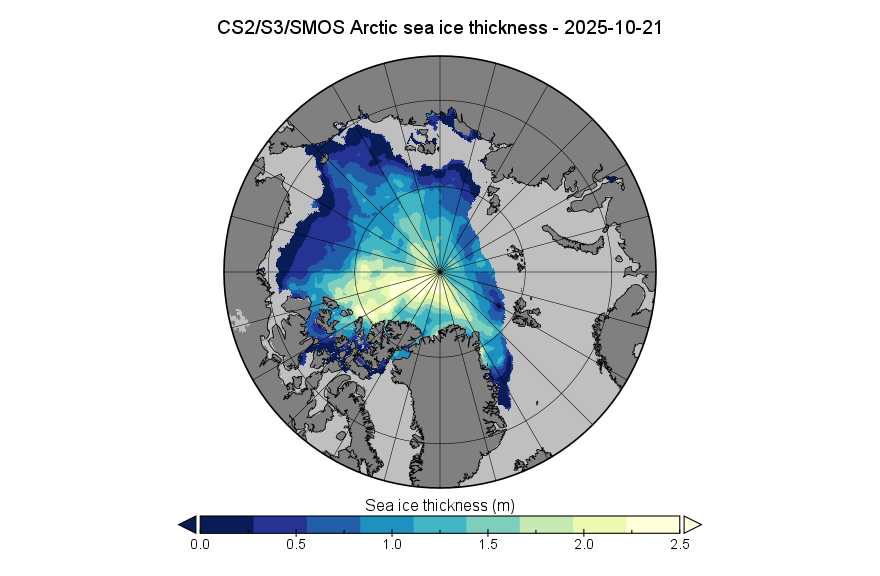
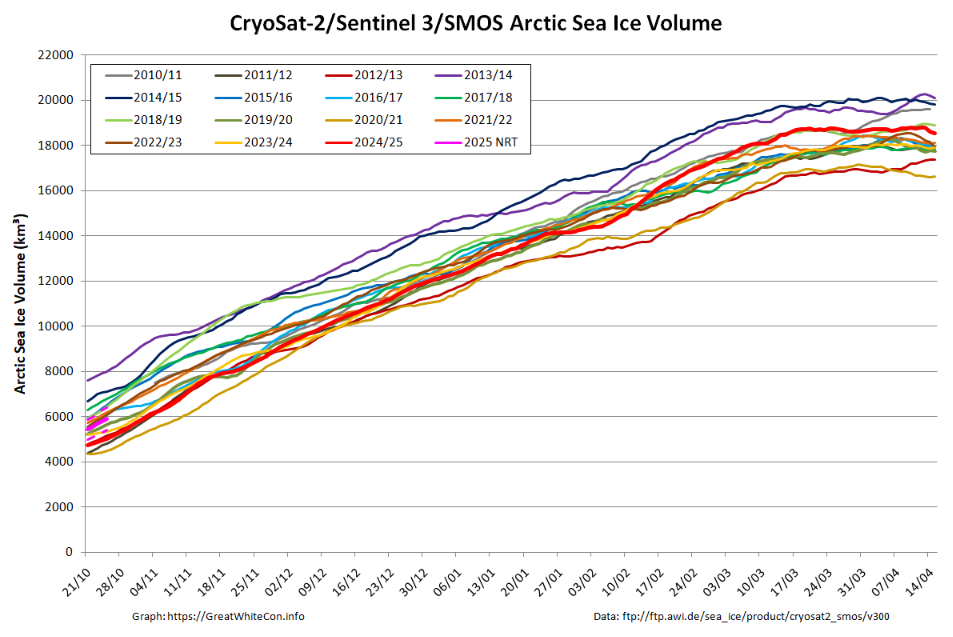
The Arctic sea ice volume derived therefrom is 5.43 thousand km³. The data is accompanied by the following “Product Degradation Warning”:
SMOS input data continues to be affected by persistent and frequent radio-frequency interference (RFI) in the Barents, Kara, and Laptev Seas, resulting in missing thin ice thickness measurements. Consequently, sea ice thickness estimates for this region in the product will rely exclusively on radar altimeter data, which may lead to higher reported values than would have been obtained using SMOS.
[Update – October 27th]
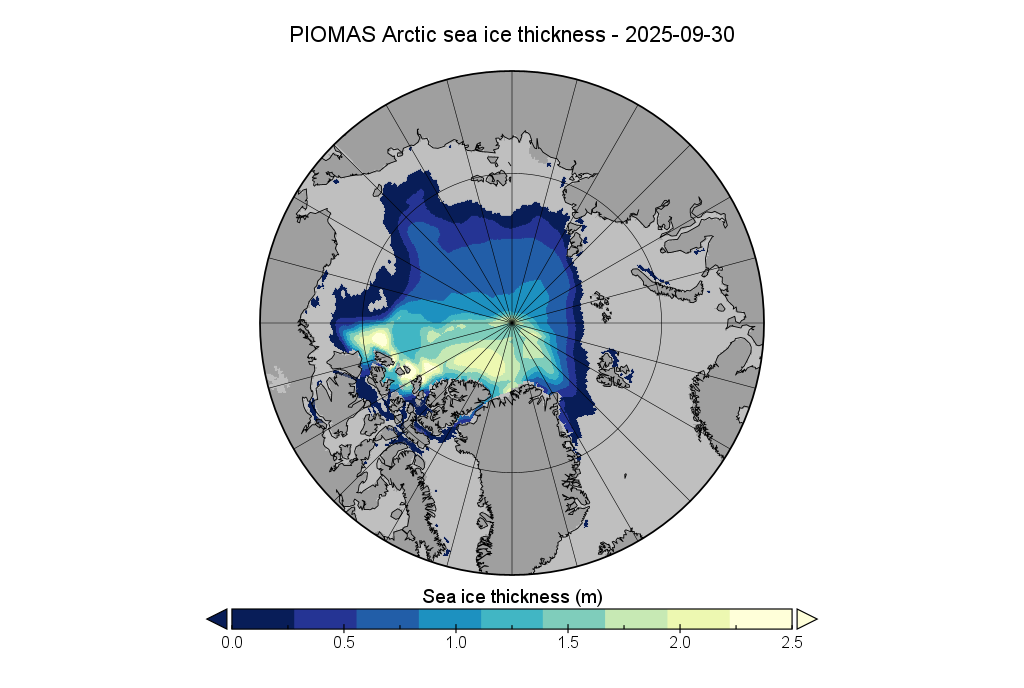
The PIOMAS gridded thickness data for September 2025 has been belatedly released:
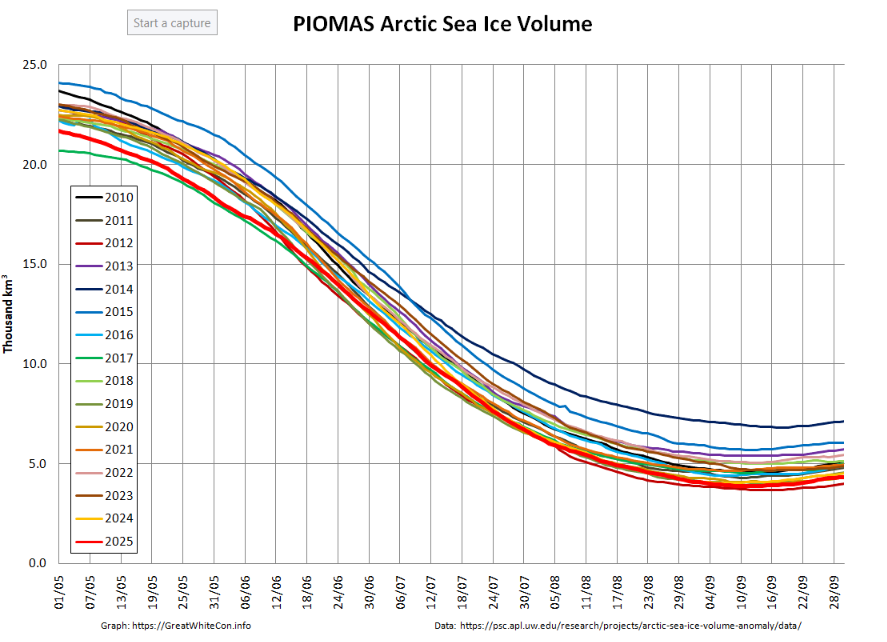
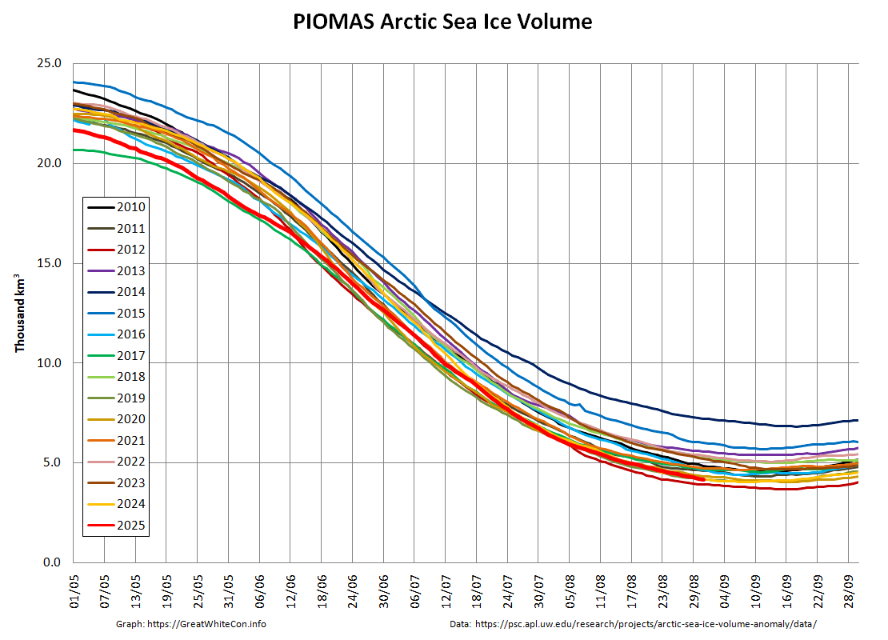
The associated volume graph reveals that the 2025 minimum modelled Arctic sea ice volume was 3.87 thousand km³ on September 12th, which is the 2nd lowest minimum in the PIOMAS record going back to 1979:
Whilst we’re on the topic of sea ice volume, here’s the latest “measured” volume graph:
Note the proviso about recent SMOS data above, and also that the version 3.00 data from AWI is currently only available beginning in Autumn 2023. Prior years shown on the graph above are based on version 2.06 data, which amongst other things does not incorporate Sentinel 3 data.
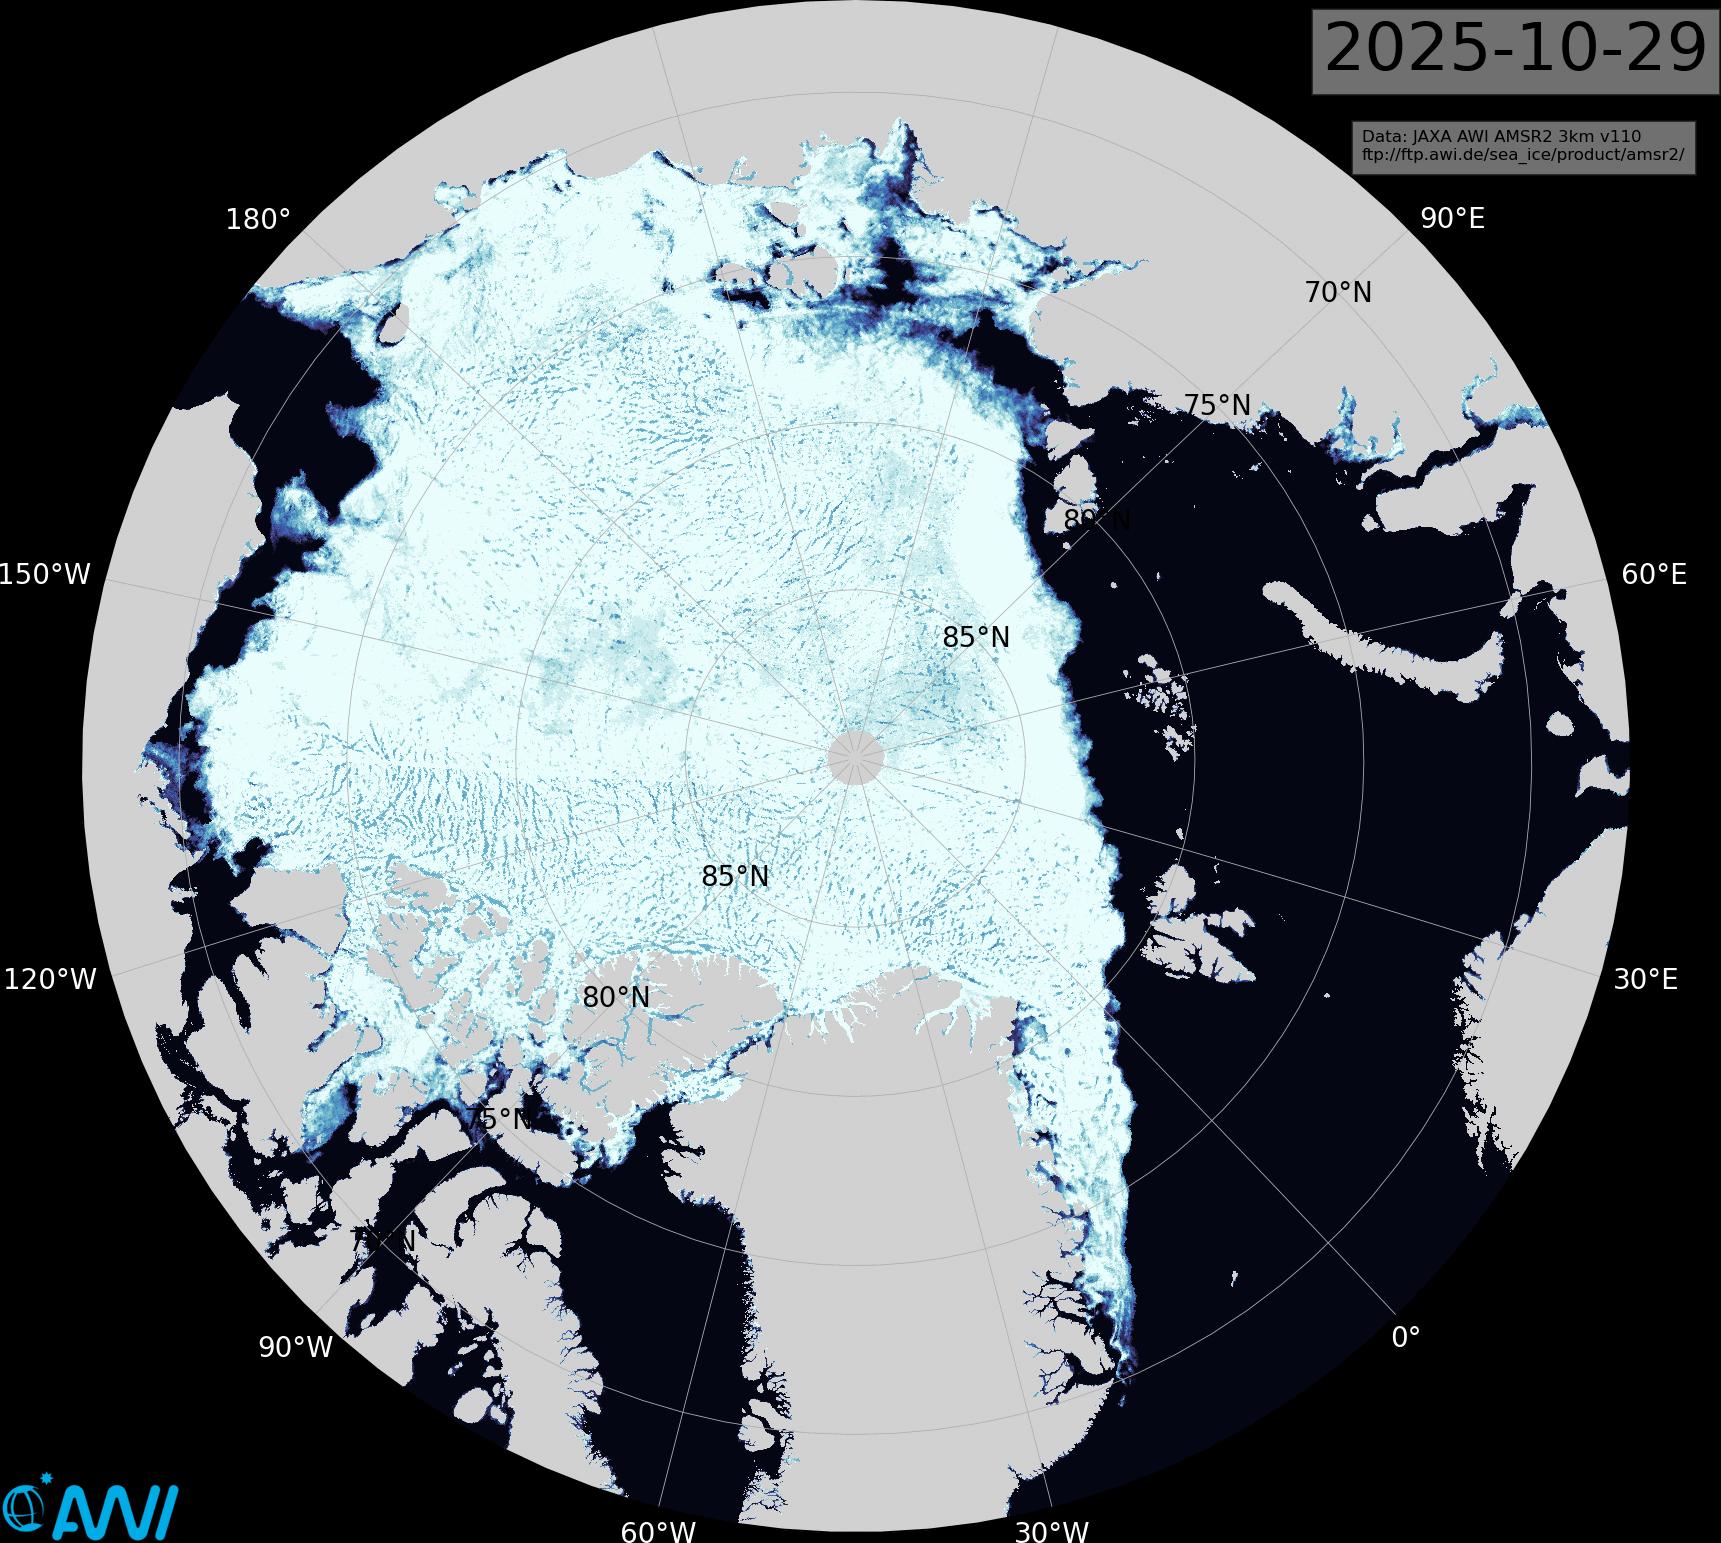
[Update – October 29th]
Much of the Siberian side of the Arctic Ocean has now refrozen:
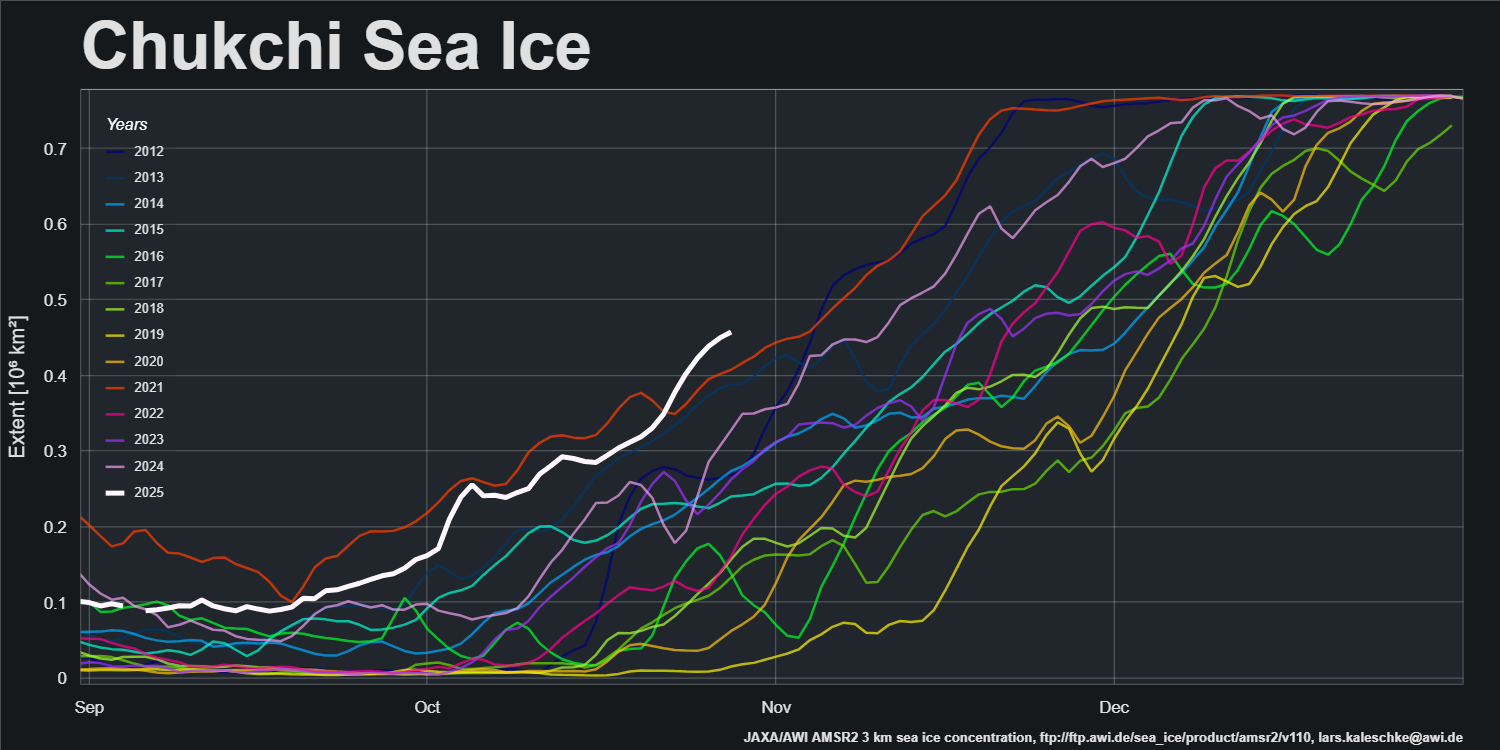
There is a significant difference between progress of the refreeze on the the Pacific and Atlantic sides of the Arctic. Extent in the Chukchi Sea is currently highest for the date in the AMSR2 record:
However, refreeze of the Kara Sea has yet to begin, and extent is currently lowest for the date in the AMSR2 record:
Pan Arctic JAXA/ViSHOP extent is now 6th lowest in the satellite era:
At the beginning of last month JAXA/ViSHOP extent was third lowest for the date in the satellite era. With the date of the 2025 minimum extent rapidly approaching that is no longer the case:
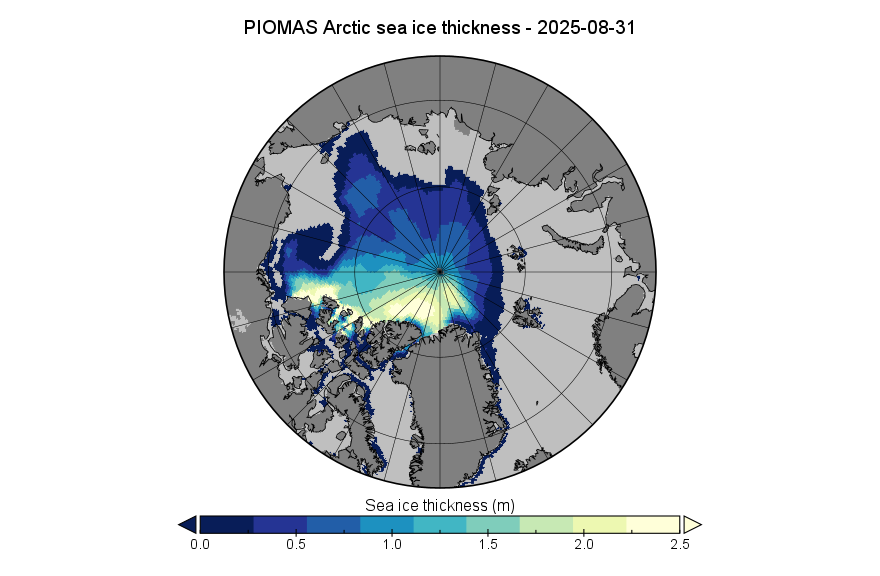
Whilst JAXA extent is now 10th lowest, PIOMAS volume remains second lowest for the date:
Here’s the associated thickness map. Note the change of scale from last month
Compare and contrast that map with the AWI’s sea ice concentration map, particularly in the Beaufort Sea area:
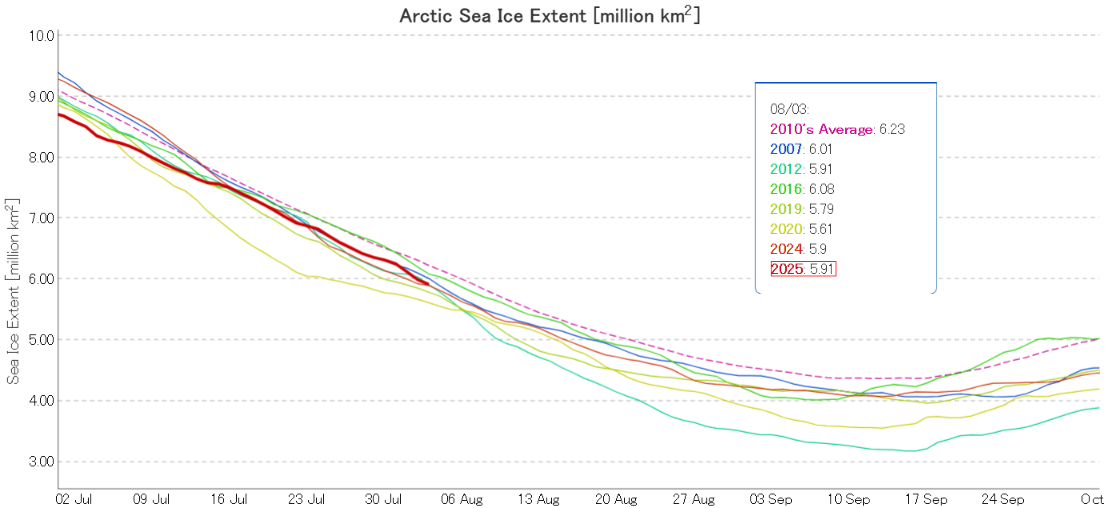
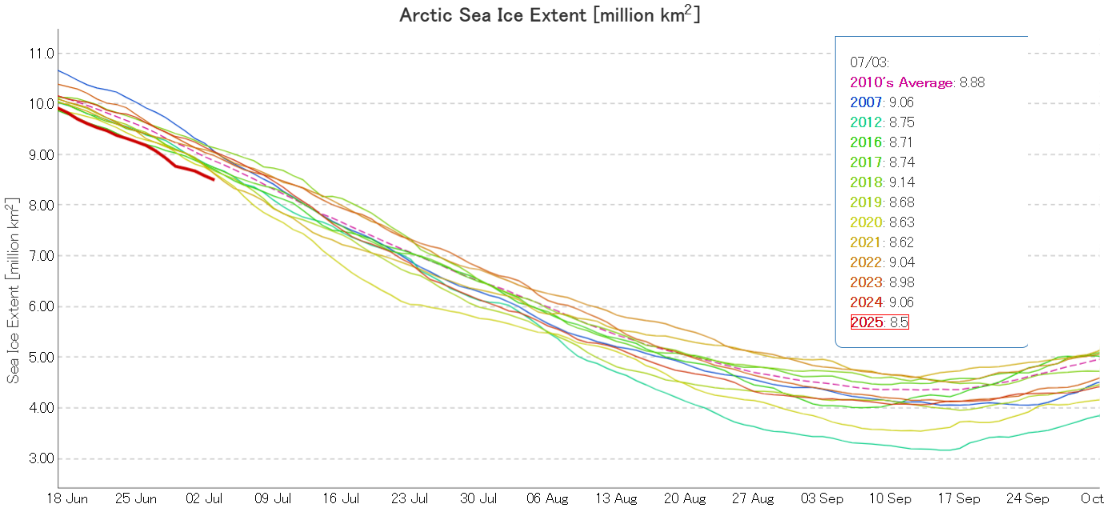
At the beginning of August JAXA/ViSHOP extent is in a “statistical tie” for 3rd lowest for the date in the satellite era:
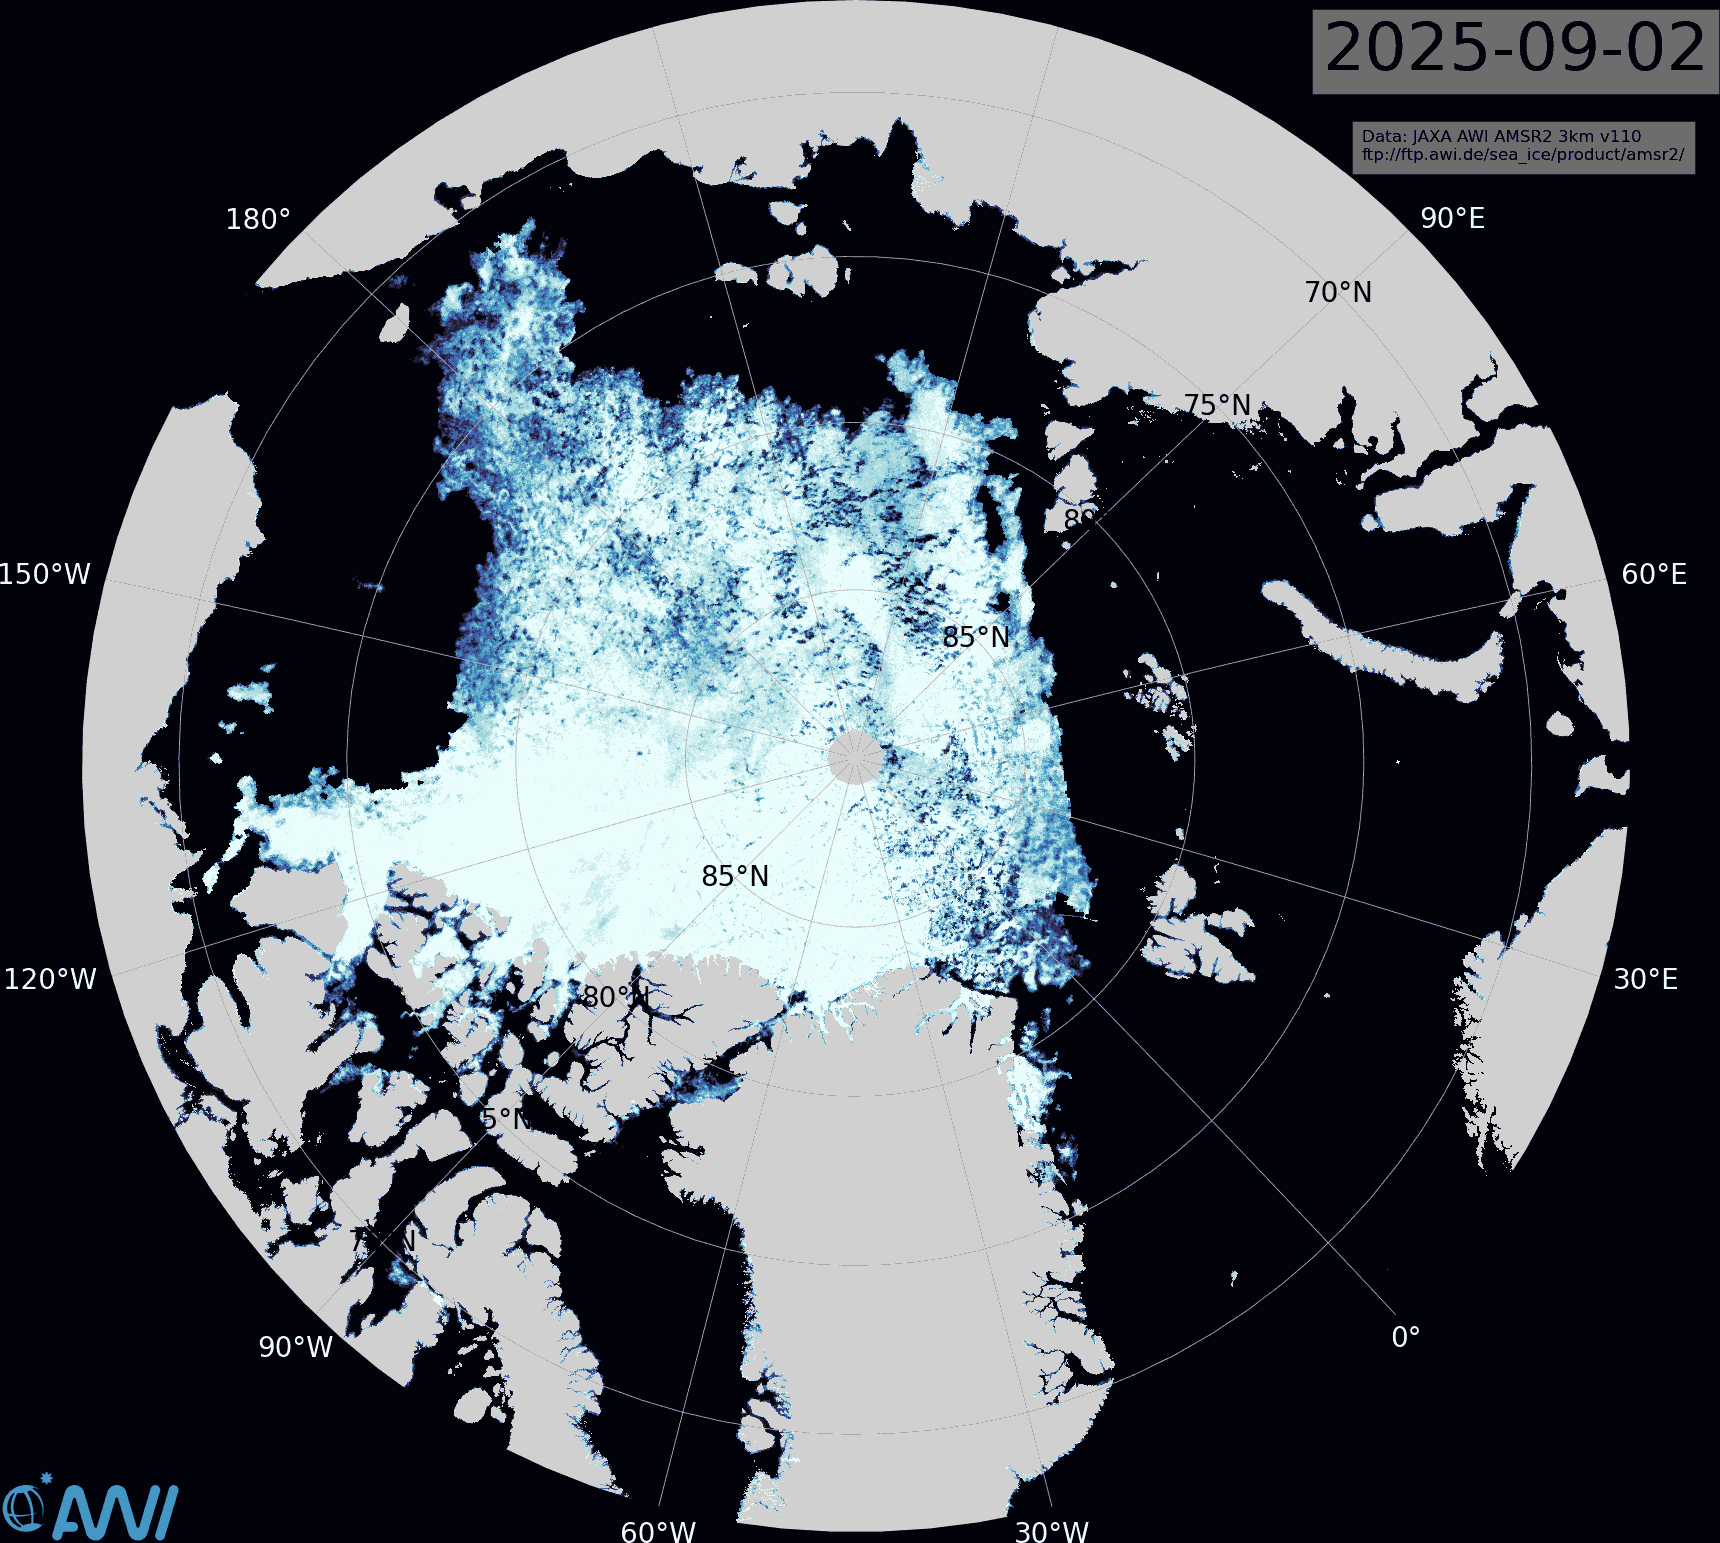
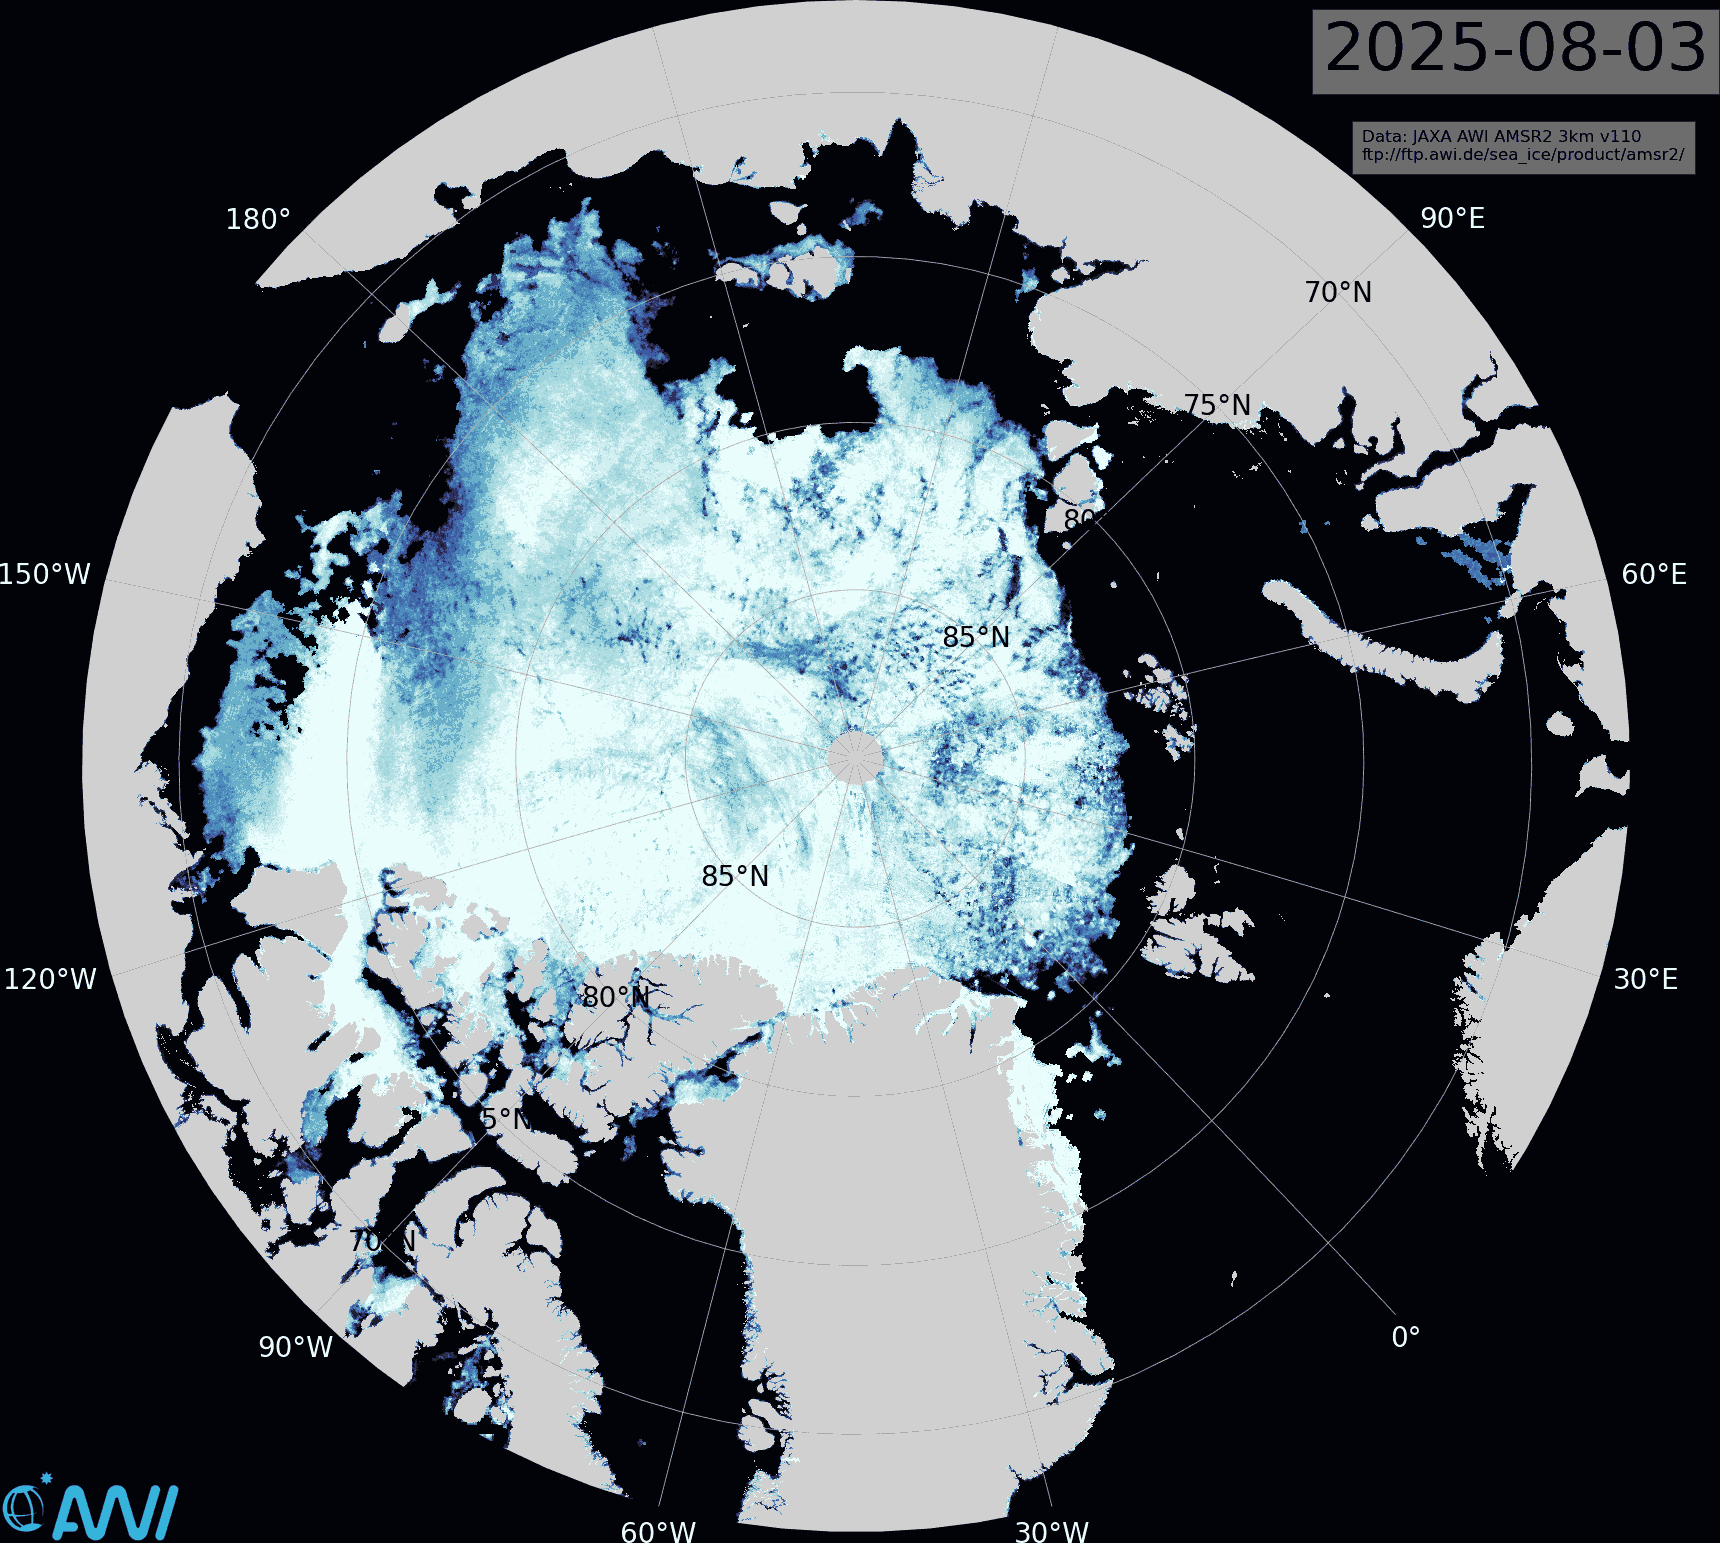
Extent has been declining rapidly for the past few days, and further losses look likely in the Beaufort Sea on either side of an arm of high concentration ice visible in the Alfred Wegener Institute’s map of sea ice concenration:
The ice on the Atlantic side of the Arctic is starting to look highly fragmented, all the way to the North Pole.
This website uses cookies to improve your experience. We'll assume you're ok with this, but you can opt-out if you wish. Cookie settingsACCEPT
Privacy & Cookies Policy
Privacy Overview
This website uses cookies to improve your experience while you navigate through the website. Out of these, the cookies that are categorized as necessary are stored on your browser as they are essential for the working of basic functionalities of the website. We also use third-party cookies that help us analyze and understand how you use this website. These cookies will be stored in your browser only with your consent. You also have the option to opt-out of these cookies. But opting out of some of these cookies may affect your browsing experience.
Necessary cookies are absolutely essential for the website to function properly. This category only includes cookies that ensures basic functionalities and security features of the website. These cookies do not store any personal information.
Any cookies that may not be particularly necessary for the website to function and is used specifically to collect user personal data via analytics, ads, other embedded contents are termed as non-necessary cookies. It is mandatory to procure user consent prior to running these cookies on your website.