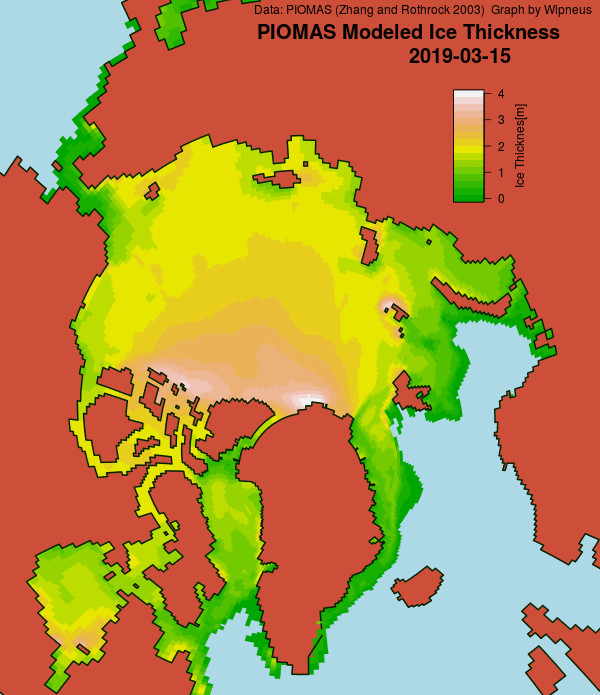
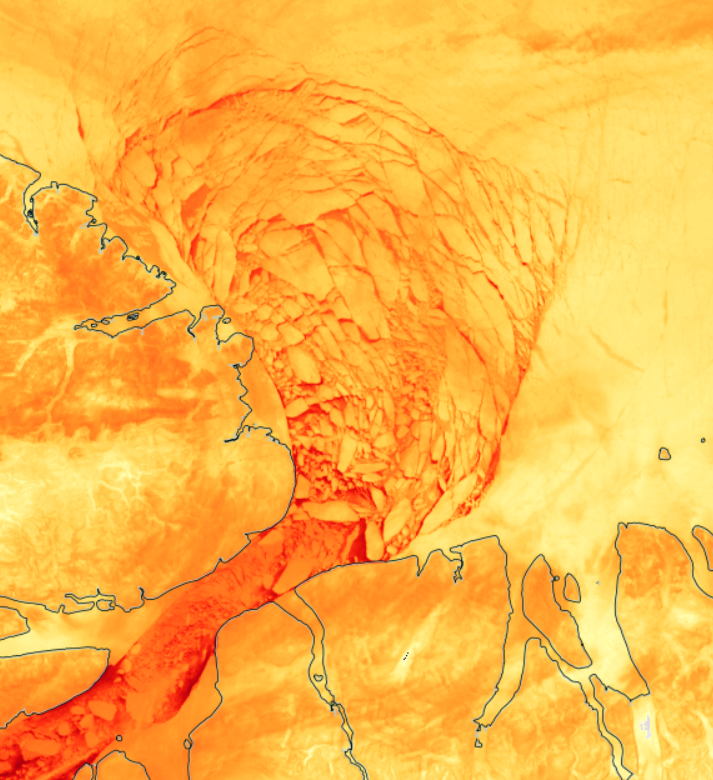
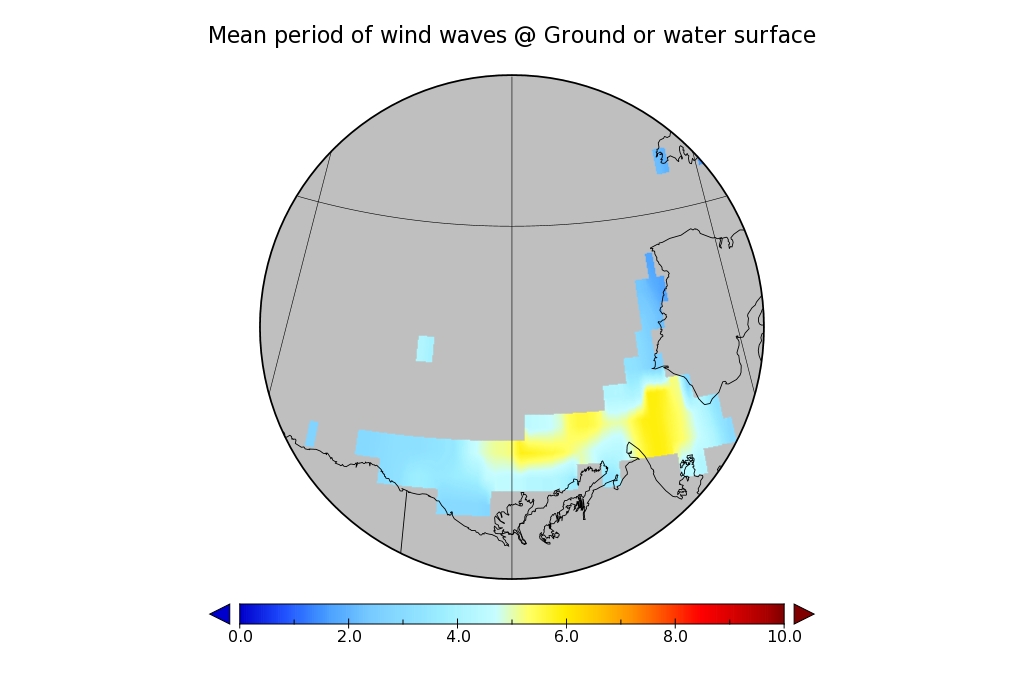
Since the FMI make the gridded data available as well as that visualisation, here’s a closer look at the Bering/Chukchi area:
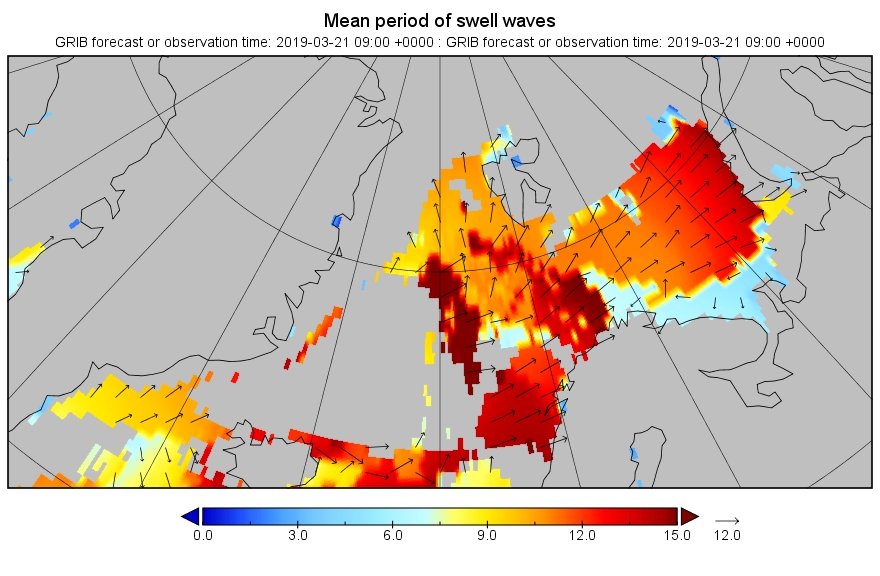
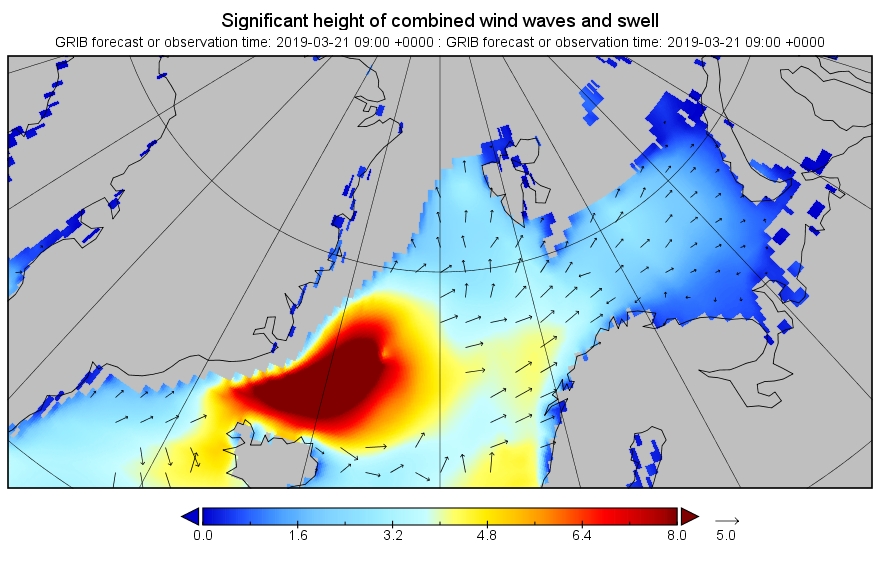
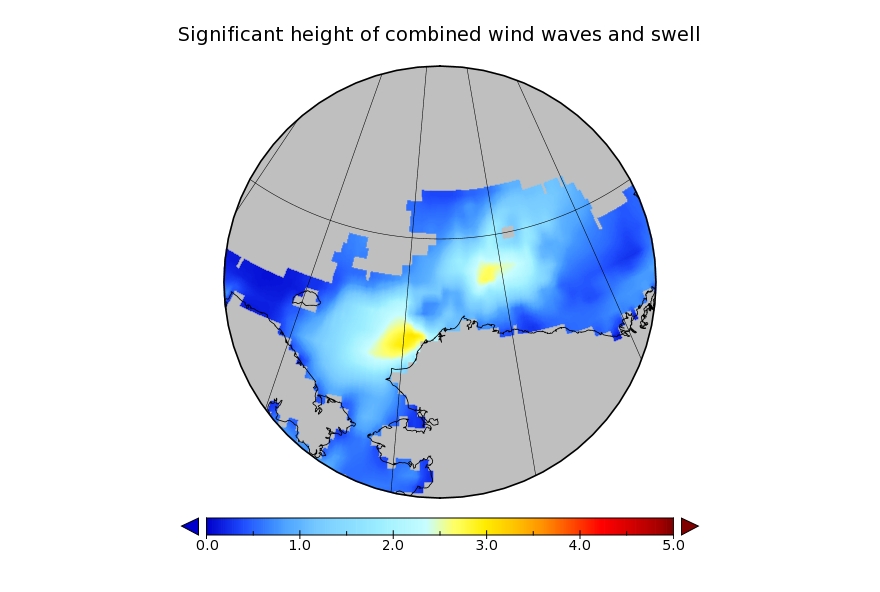
There’s an awful lot of thin ice in the region ripe for rapid melting now that the sun is shining down for a rapidly increasing number of hours per day. Over on the other side of the North Pole there’s also some significant swell forecast to hit the Atlantic edge of the Arctic ice pack. Here’s the current WaveWatch III forecast for 09:00 UTC tomorrow morning:
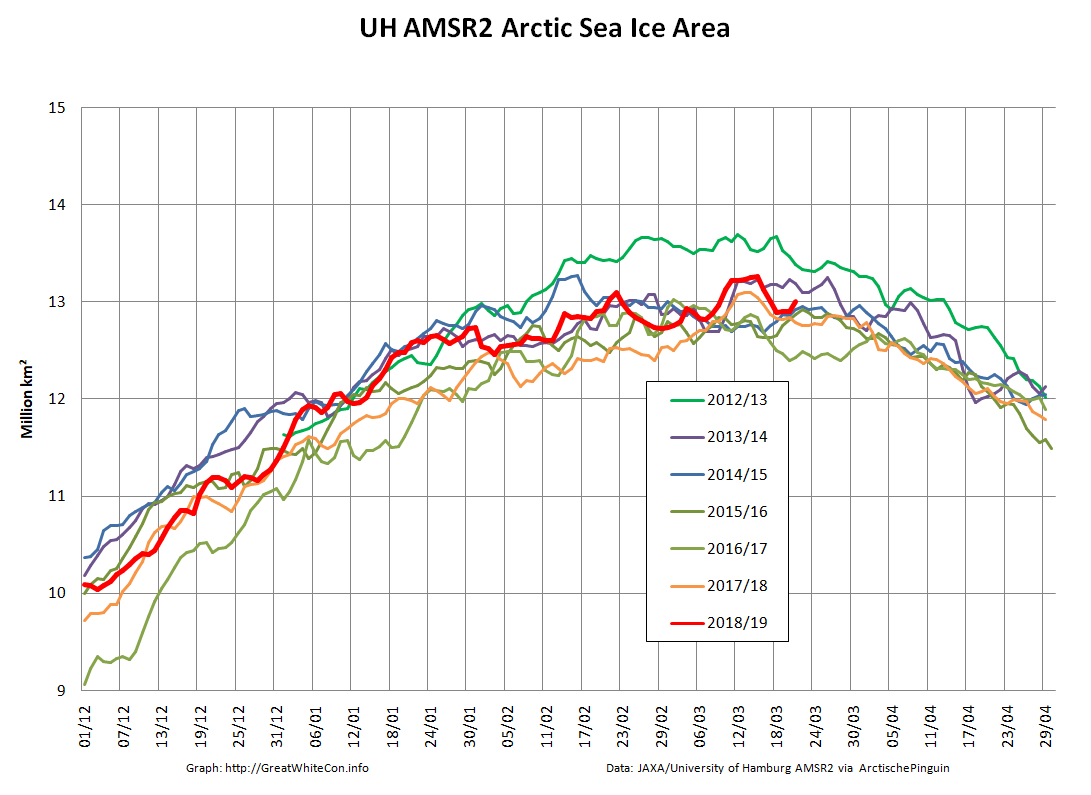
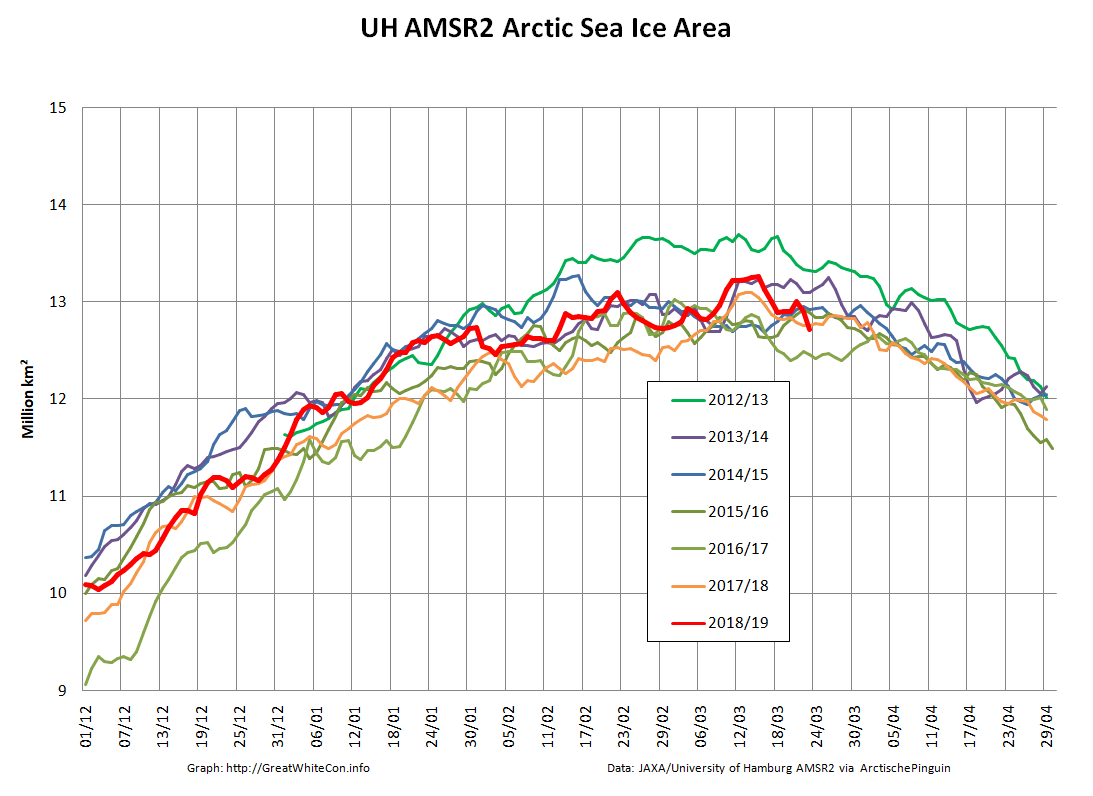
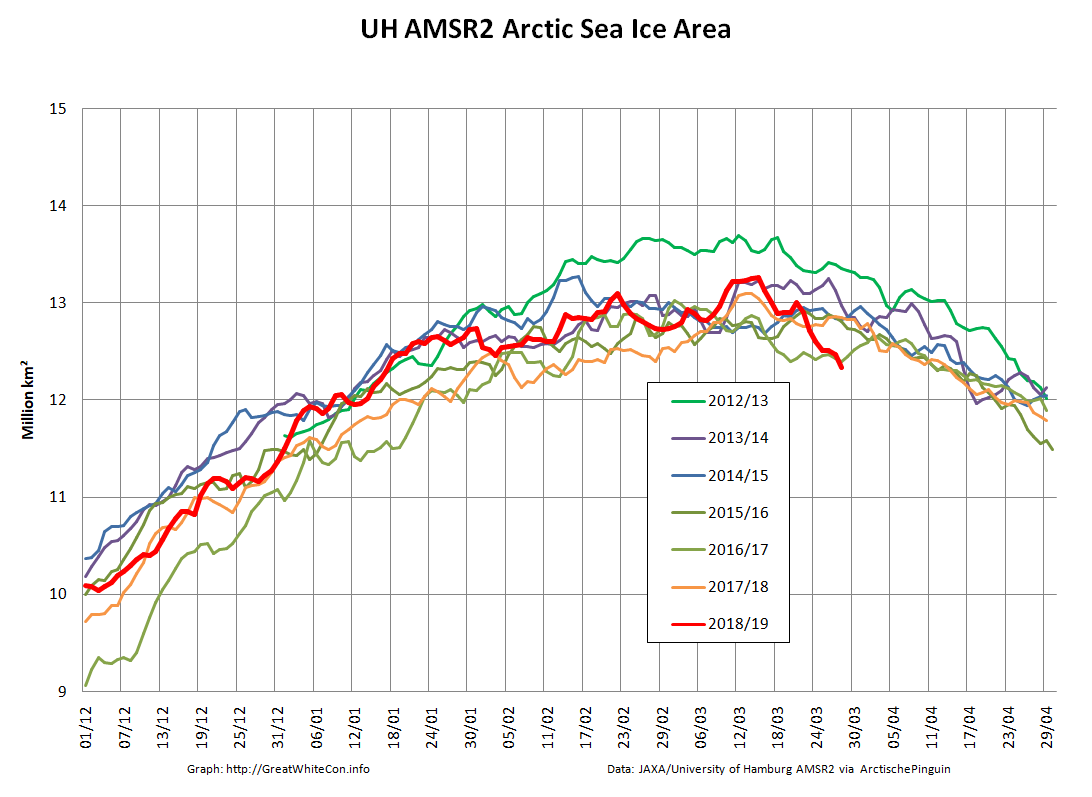
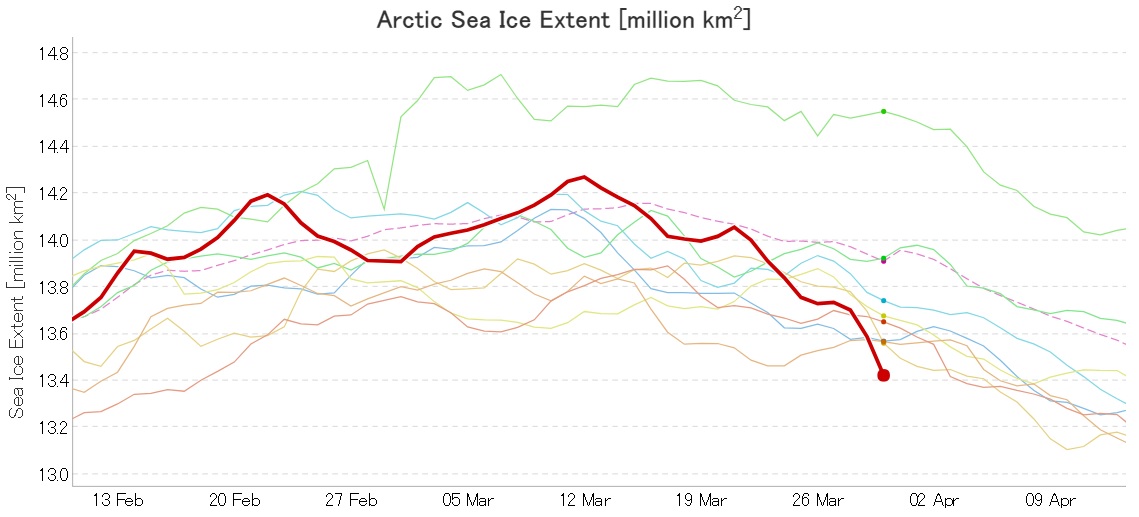
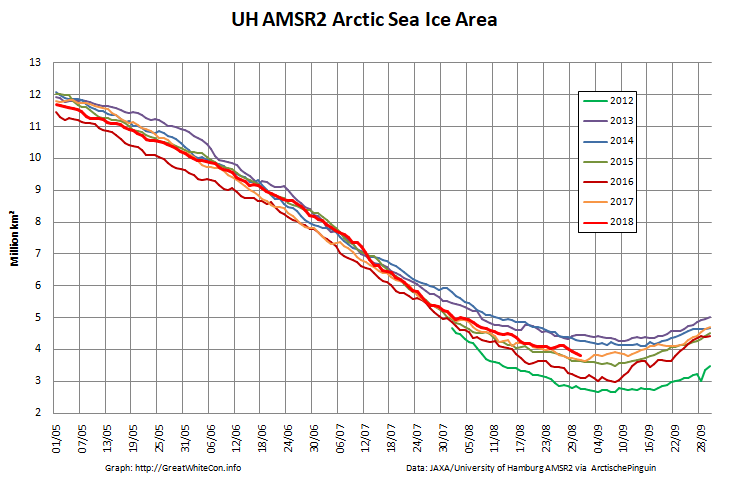
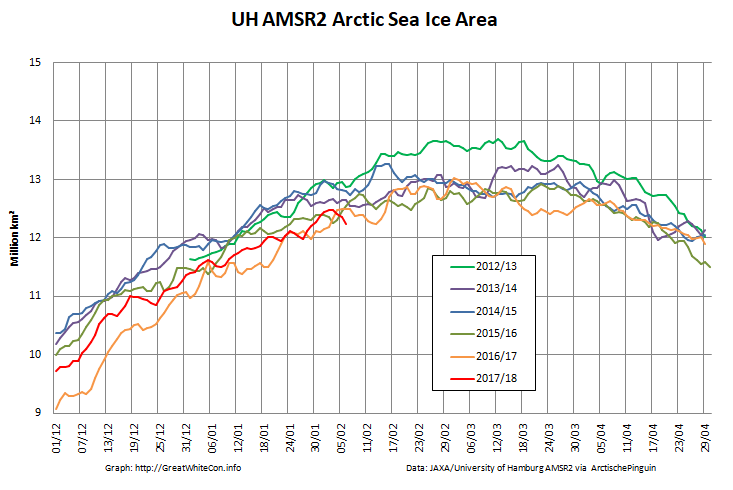
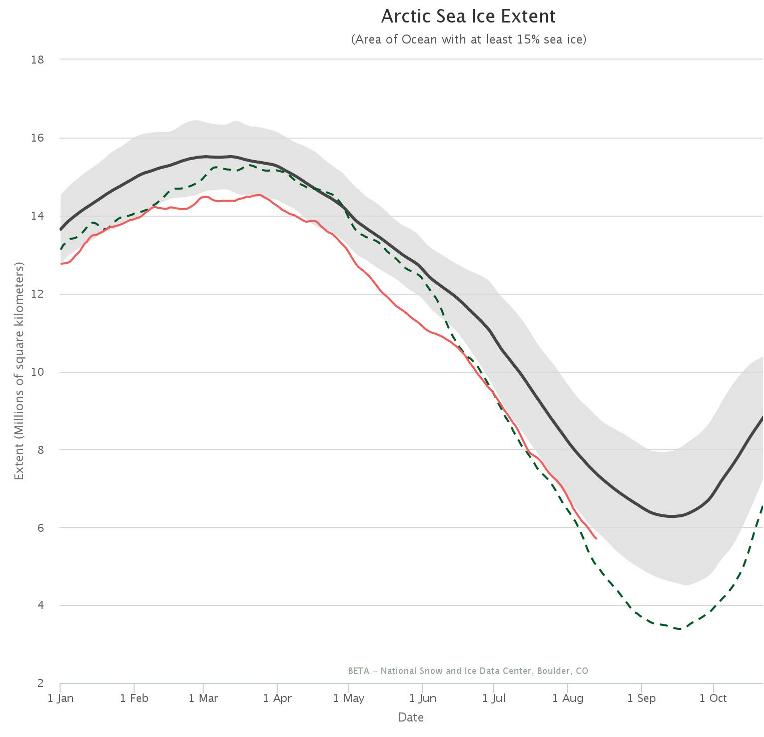
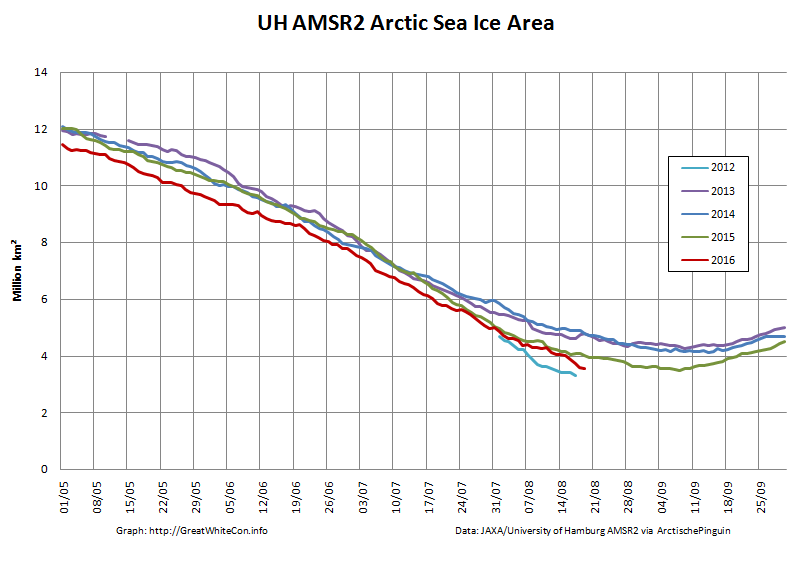
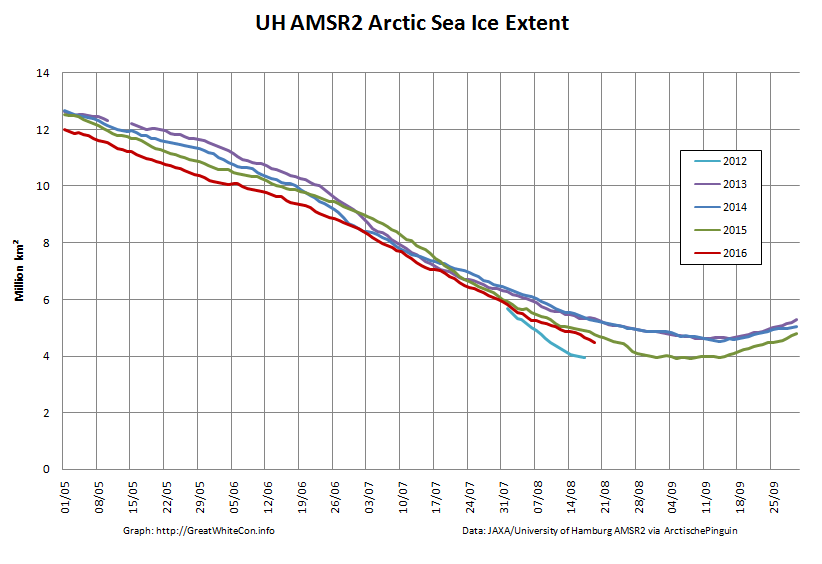
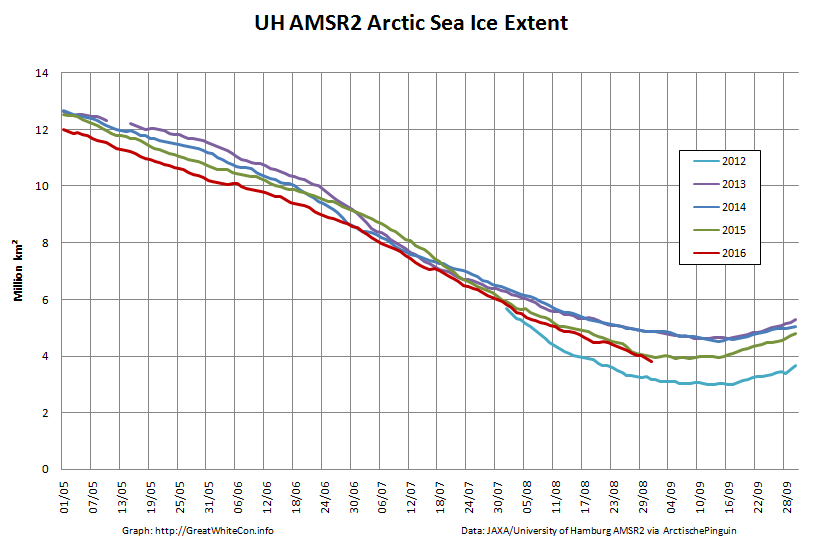
Finally, for the moment at least, here are the current Arctic wide high resolution AMSR2 sea ice area and extent graphs:
[Edit – March 22nd]
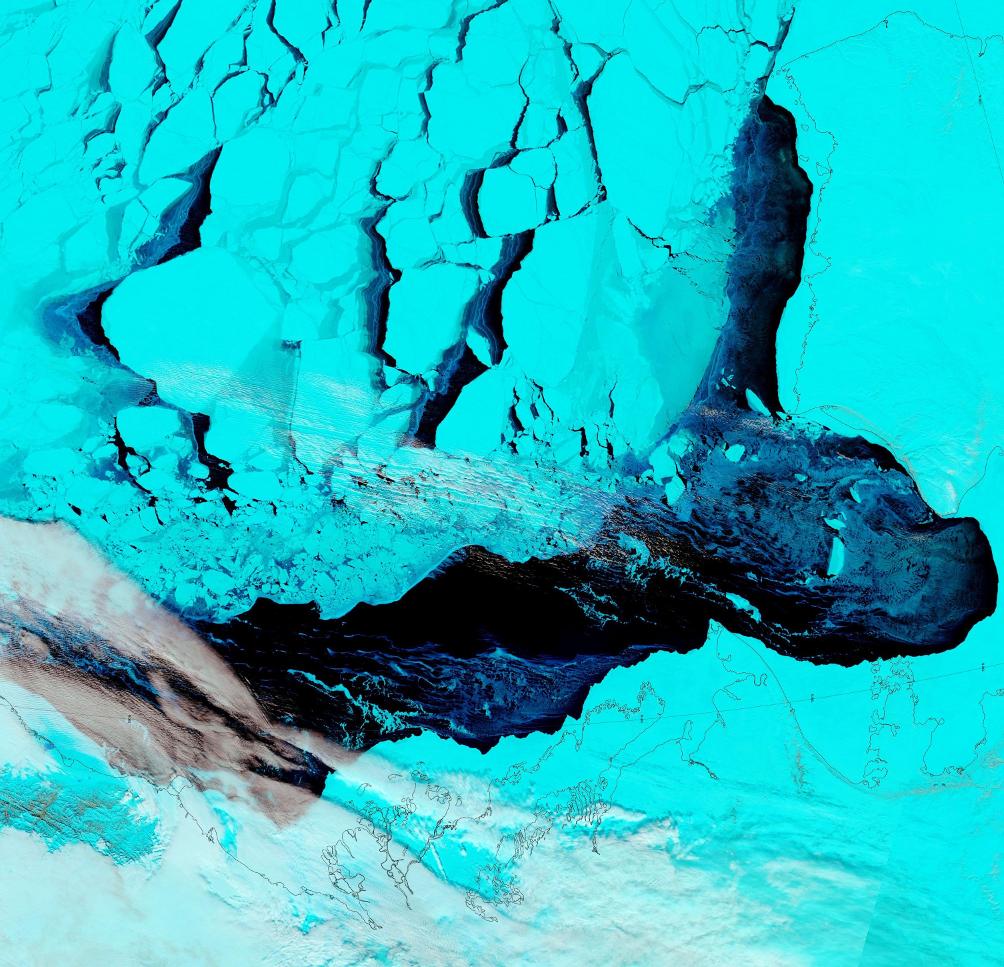
This Sentinel 1 SAR image of the Lincoln Sea from PolarView suggests that the northern arch of the Nares Strait is breaking up once again:
It is therefore conceivable that sea ice in the Lincoln Sea will continue to break up and flow south through the Nares Strait for the entire 2018/2019 winter.
[Edit – March 23rd]
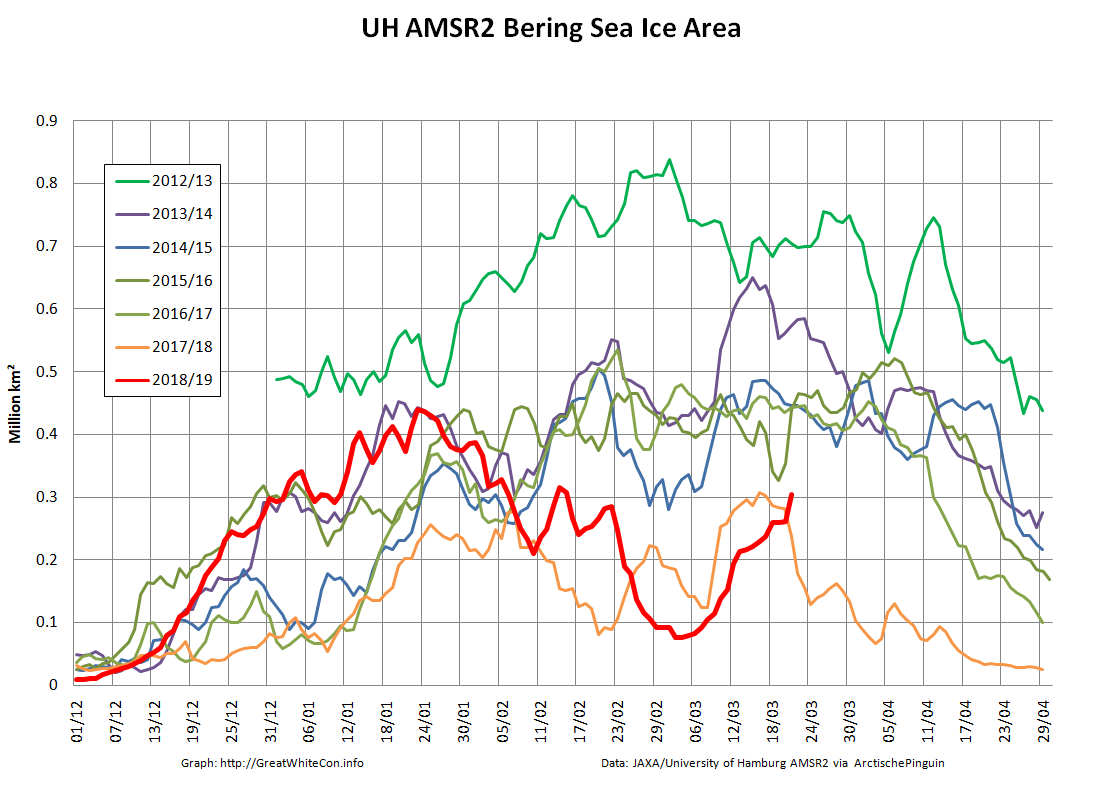
Bering Sea ice area has “rebounded” over the last few days:
and taken the Arctic wide metrics with it:
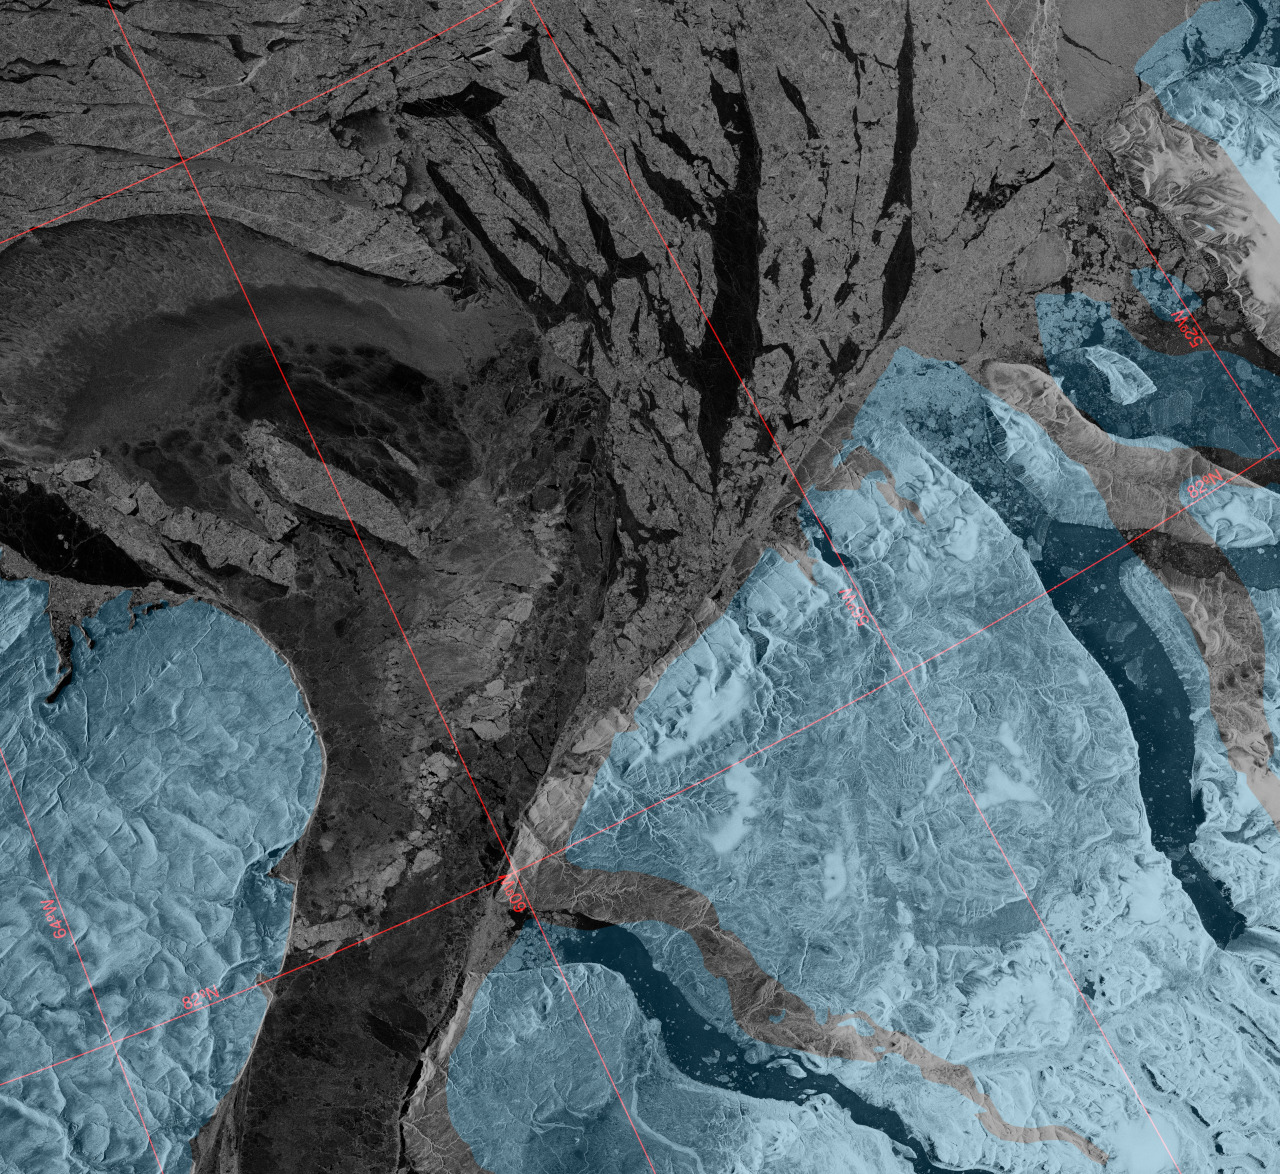
Here’s the latest Sentinel 1 SAR image of the Lincoln Sea and northern Nares Strait:
[Edit – March 24th]
The “rebound” has reversed:
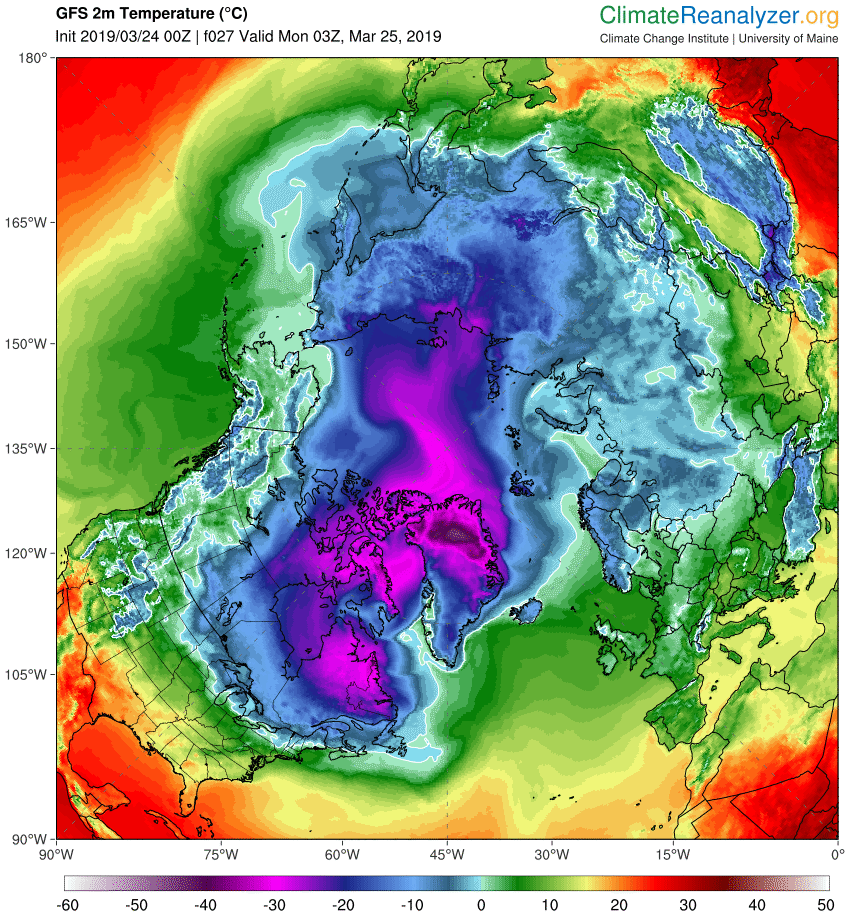
With temperatures above freezing point across the Bering and Chukchi Sea forecast for tomorrow morning expect the decline in Arctic sea ice extent to accelerate:
[Edit – March 25th]
There was a 162k decline in high resolution extent yesterday:
Here also is the current state of the thick sea ice exiting the Lincoln Sea via the Nares Strait:
[Edit – March 27th]
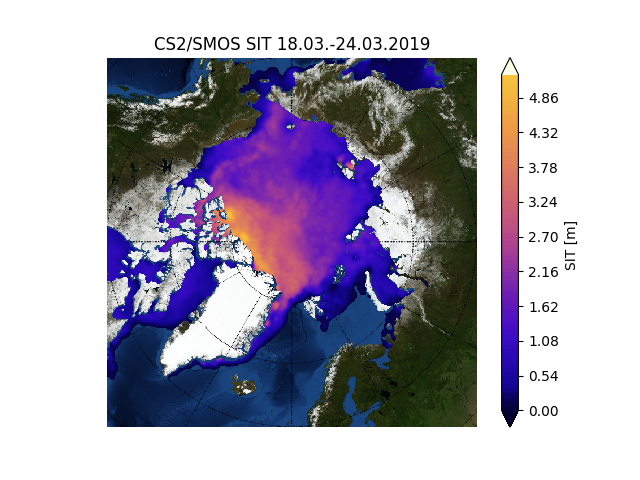
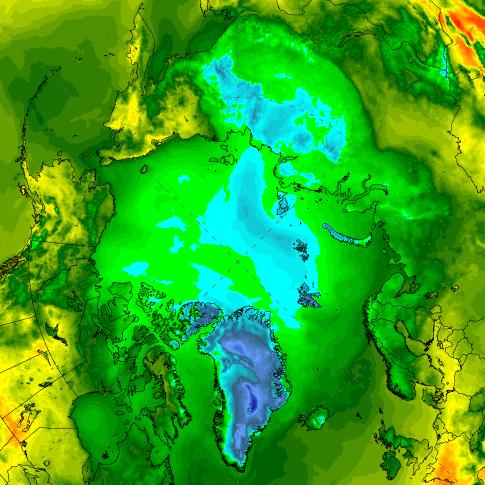
Here’s another week’s merged CryoSat-2/SMOS thickness data from the Finnish Meteorological Institute:
[Edit – March 30th]
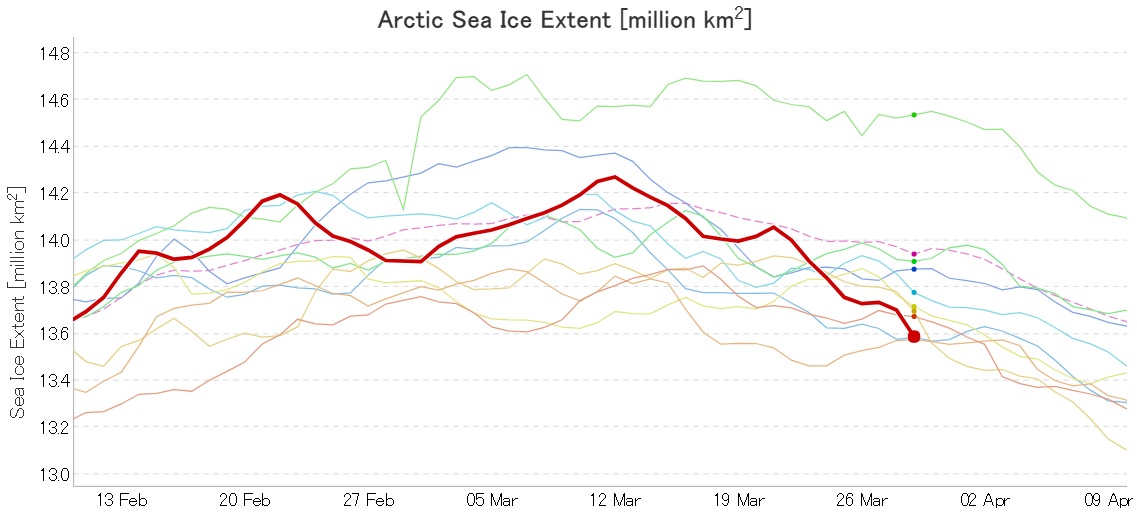
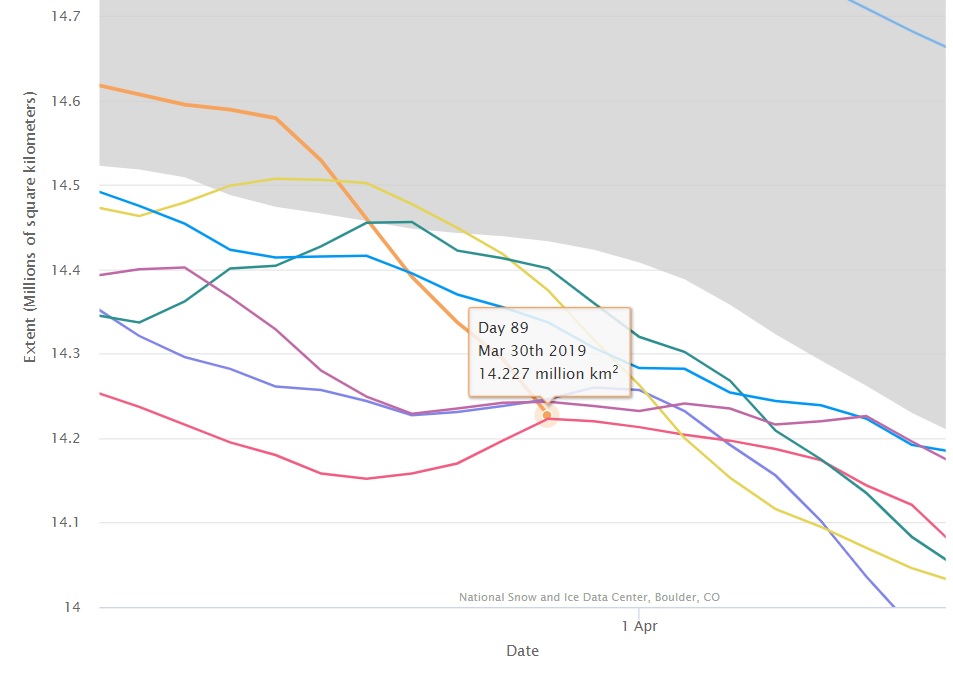
We’re still waiting for Wipneus’ Raspberry Pi to crunch the high resolution AMSR2 numbers, but here’s the latest from JAXA:
2019 currently in 3rd place by a whisker.
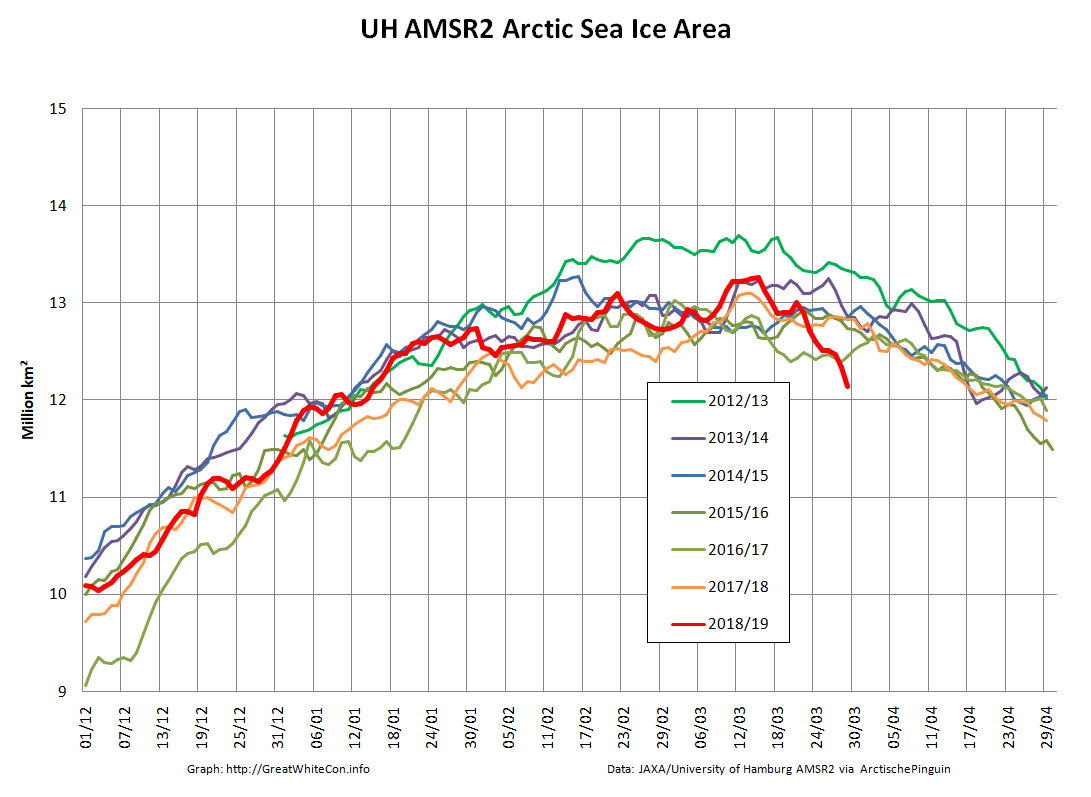
P.S. The high resolution AMSR2 numbers are out:
Area is certainly lowest for the date in the AMSR2 era. Extent will almost certainly achieve that status tomorrow. Excluding the two most peripheral seas reveals perhaps an even more worrying picture?
[Edit – March 31th]
Arctic sea ice coverage is now firmly in the “lowest extent for the date in the satellite record” category, whichever metric you care to choose:
The NSIDC 5 day average is in a “statistical tie” for first place with 2017:
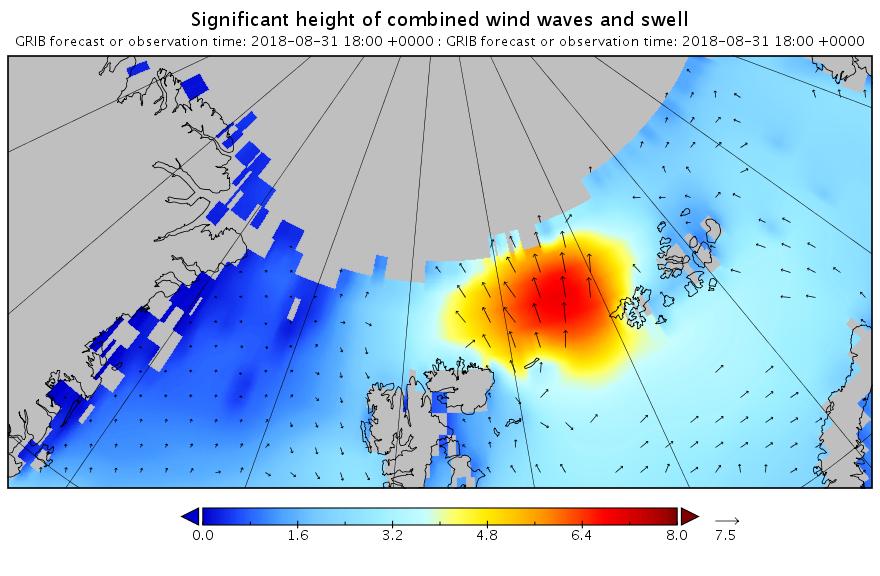
Our title for today refers back to the Great Arctic Cyclone of August 2012. There has been some speculation over on the Arctic Sea Ice Blog about whether a similar event is about to occur this year.
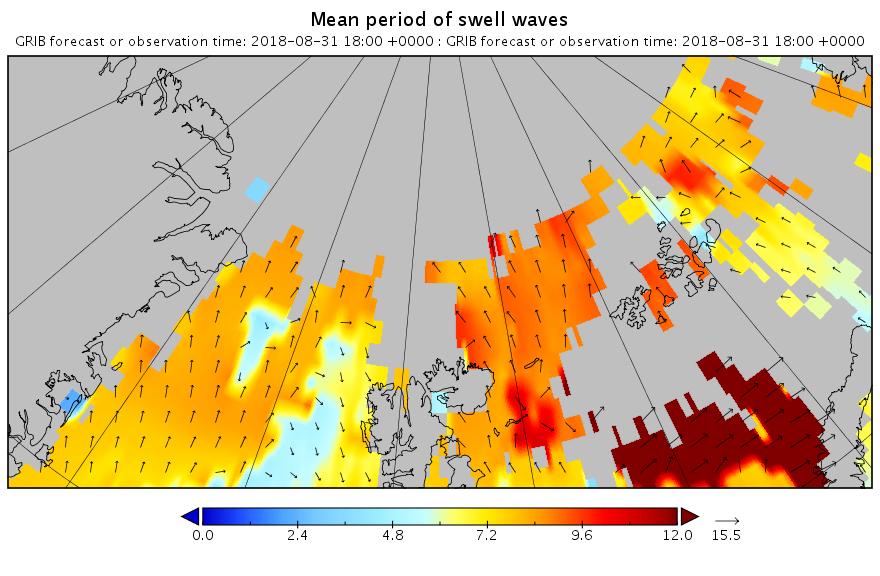
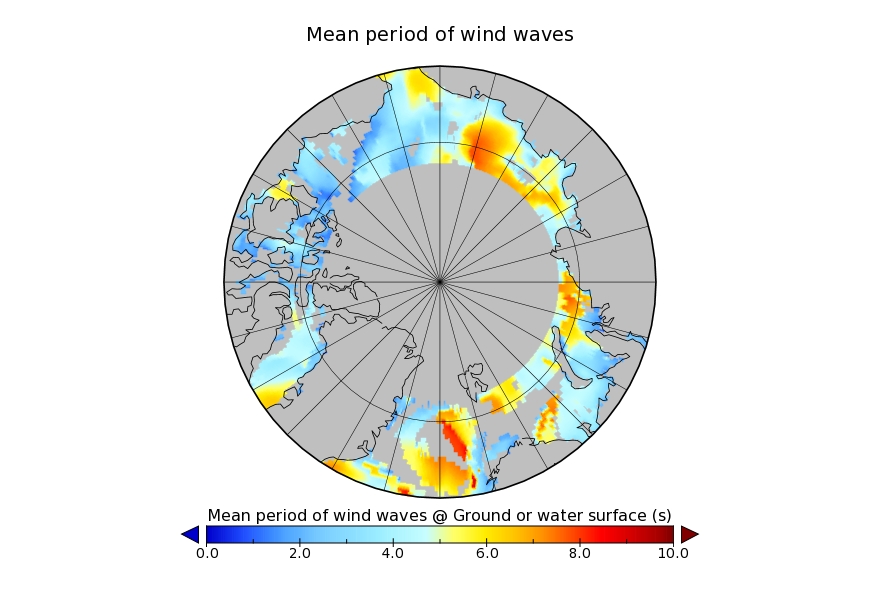
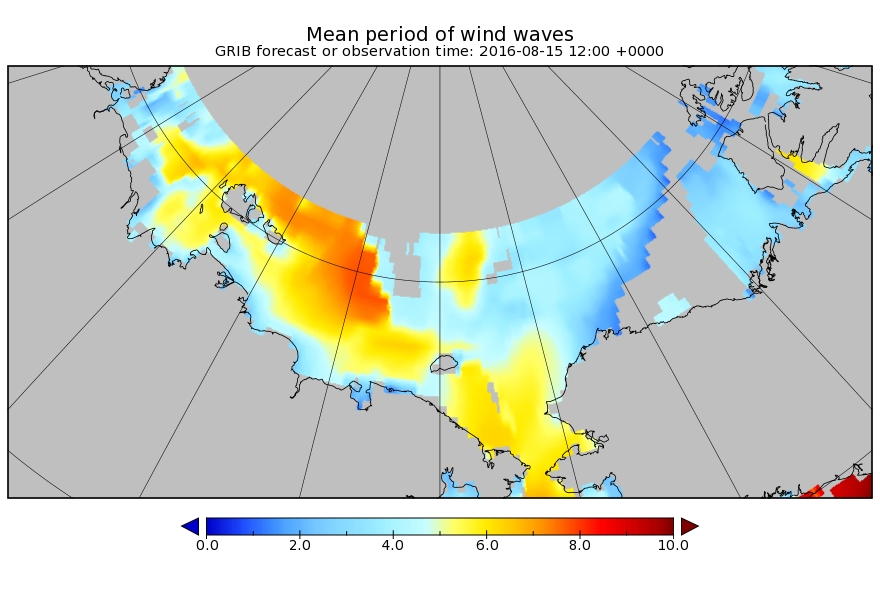
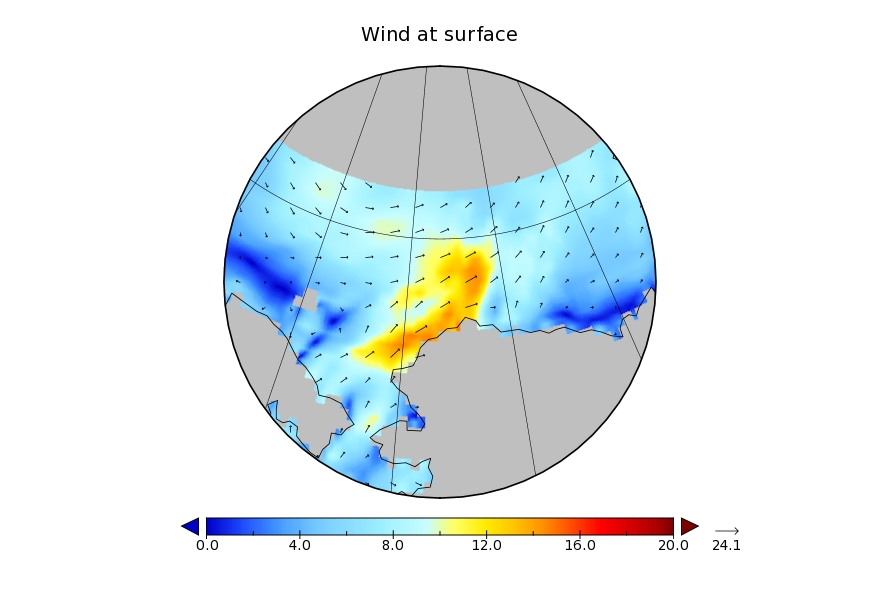
It’s later in the season of course, but as is our wont we always look at the waves first. Here is the current WaveWatch III forecast for the evening of August 31st UTC:
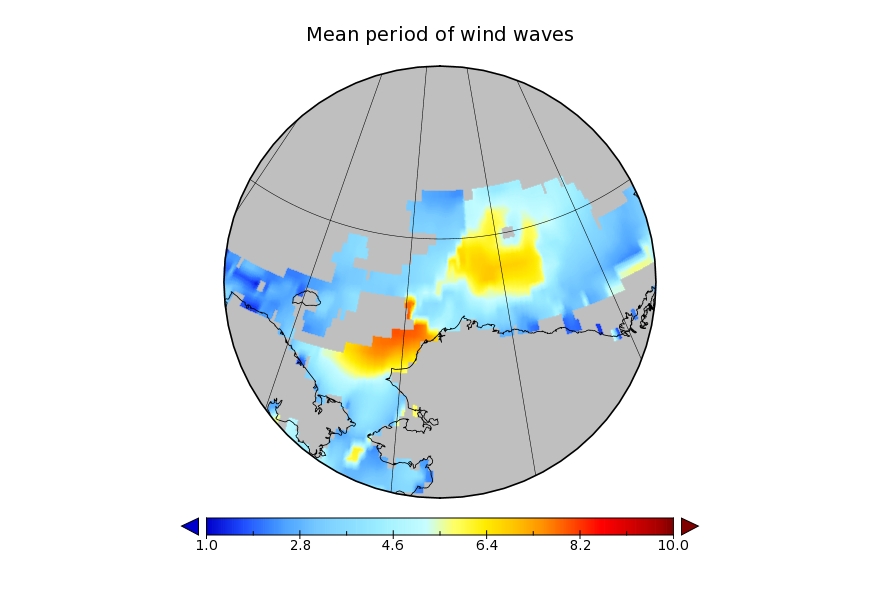
In summary the forecast shows some very large waves with a substantial period for inside the Arctic Circle directed straight at the ice edge. Let’s follow the forecast over the next few days carefully shall we?
[Edit – August 30th]
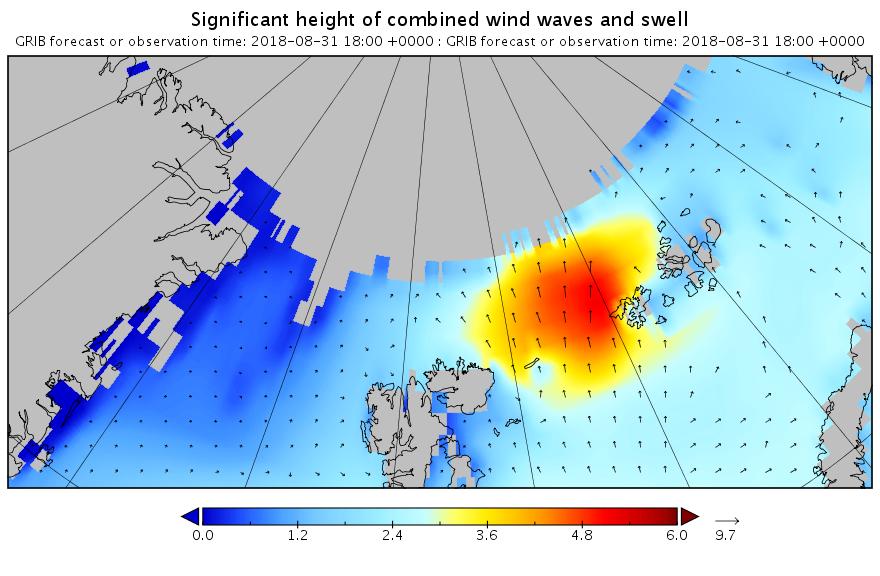
The latest wave forecast for tomorrow evening isn’t as extreme as 3 days ago. Note the change in the significant height scale:
Nonetheless the height and period are still very significant!
[Edit – August 31st]
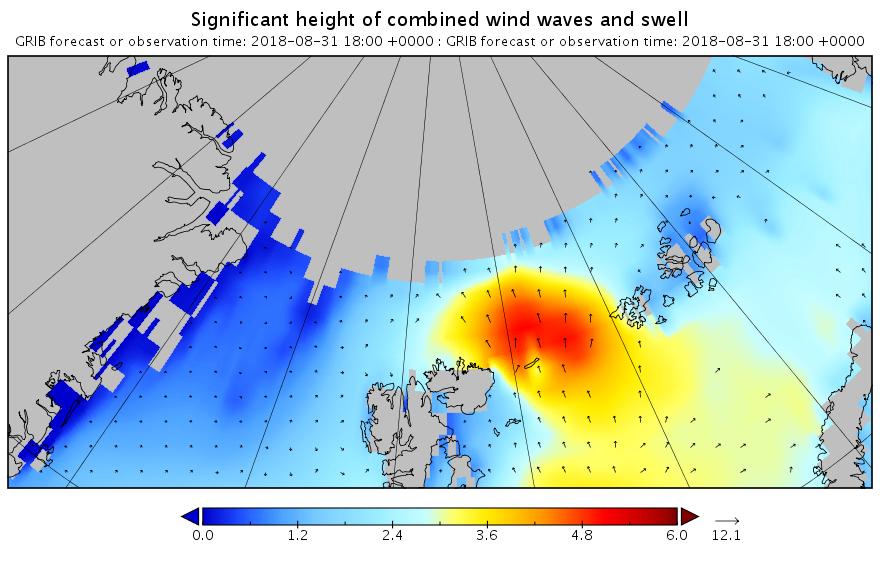
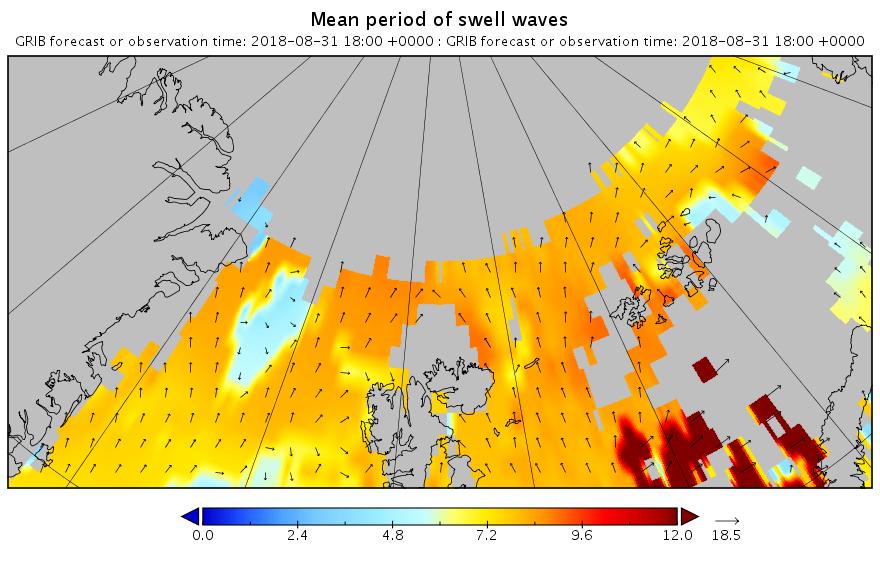
Here’s the latest forecast for 6 PM this evening (UTC):
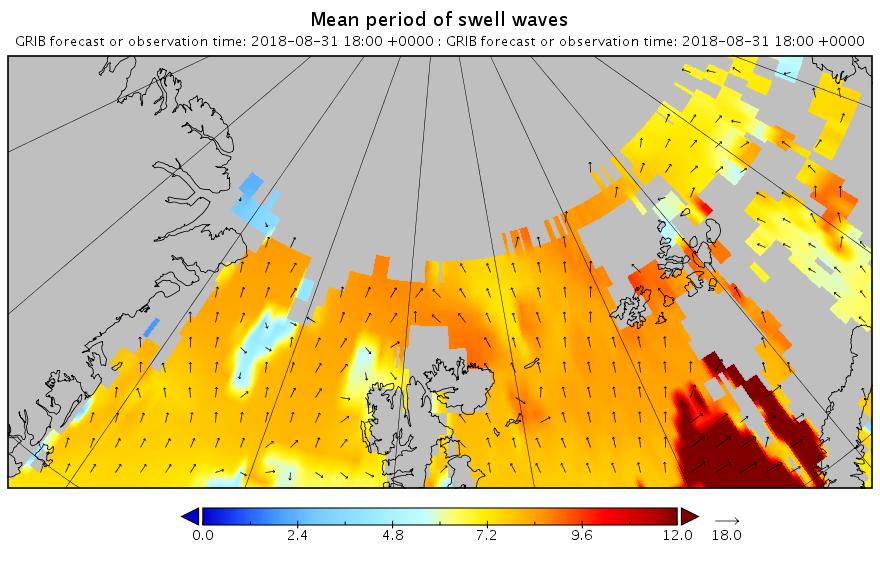
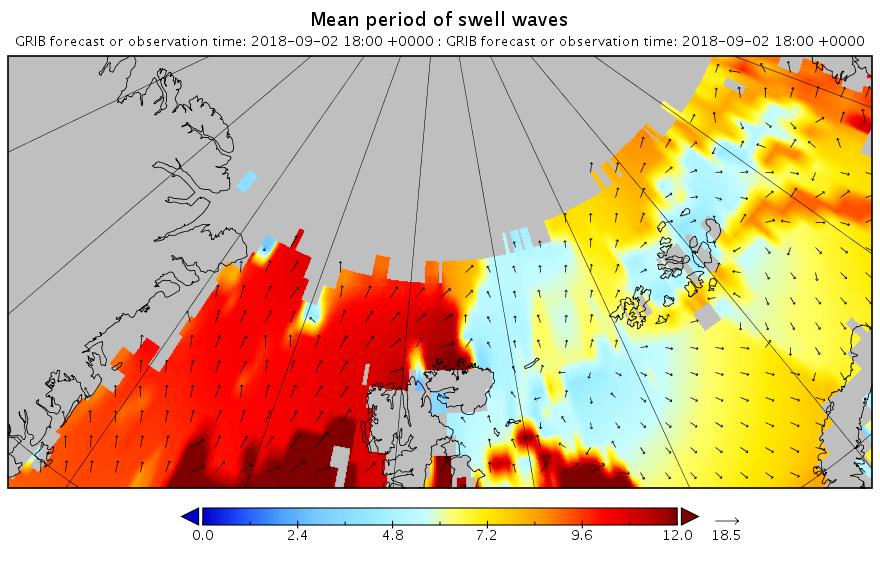
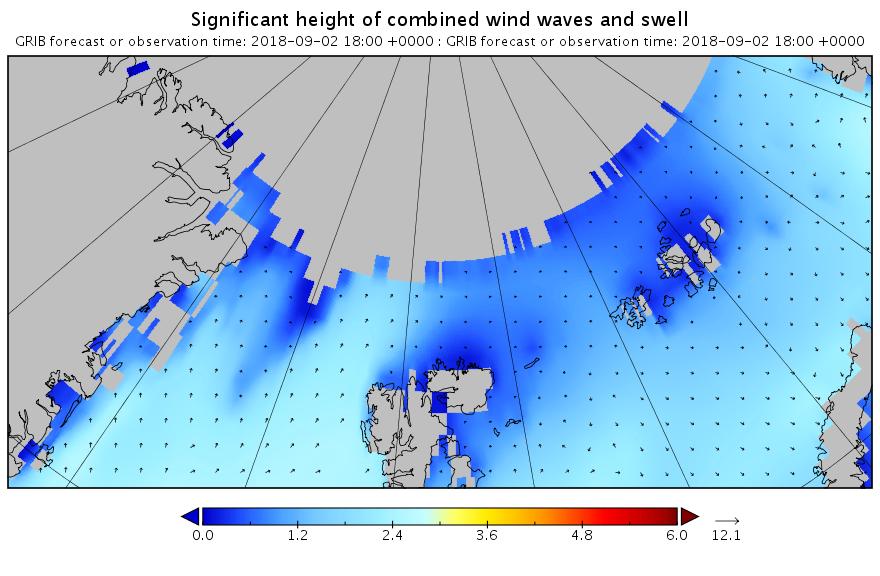
Note how the open water across almost the entire map is full of what in the Arctic counts as a long period swell. That means that the forecast for 2 days later looks like this:
Less height but with a longer period. All of which means that the sea ice north of the Atlantic Ocean isn’t about to receive a short sharp shock. It has a sustained battering lasting several days to look forward to.
[Edit – September 1st]
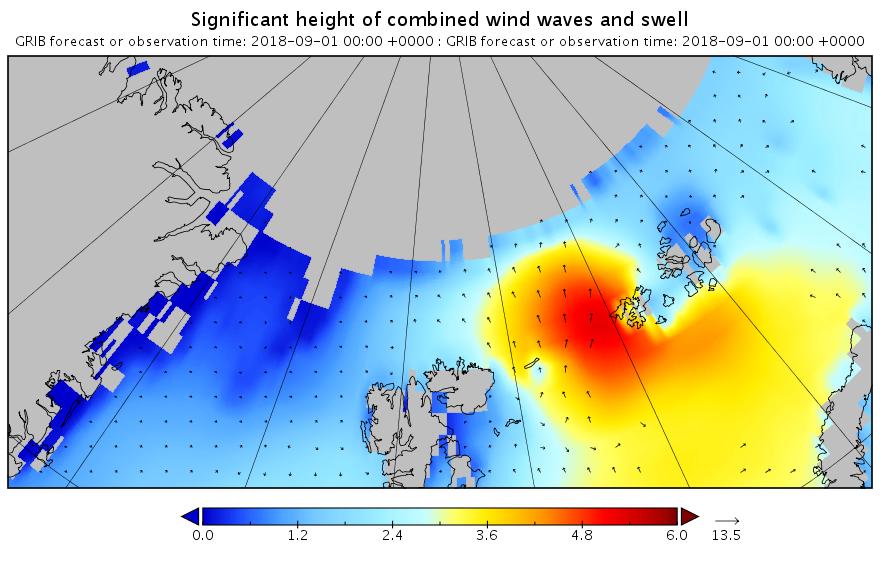
The barrage of assorted swells has begun. Here’s the “hindcast” from midnight last night UTC:
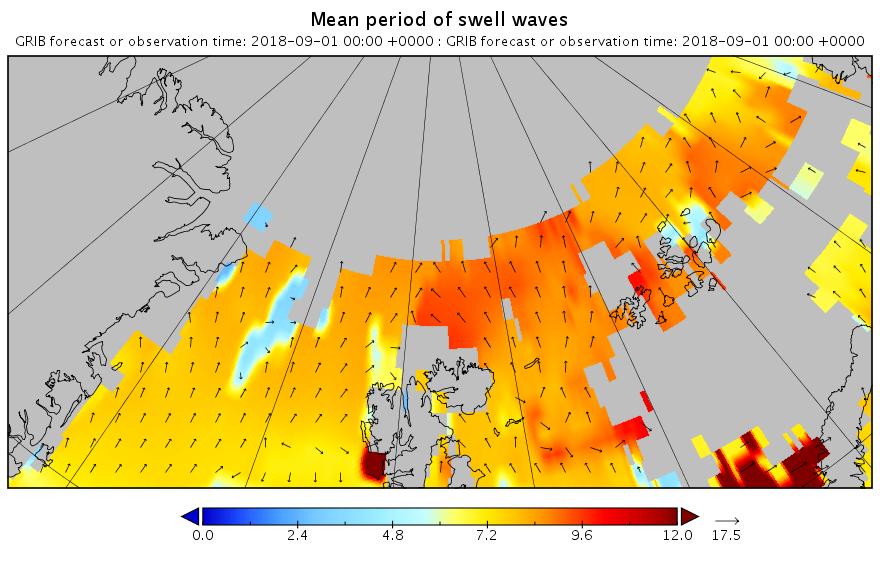
Now lets take a look at tomorrow’s forecast for the Laptev Sea. This is for 09:00 UTC:
Note once again the change of scale on the wave/swell height map. Nevertheless a 3+ meter swell heading over into the East Siberian Sea isn’t something you see every day.
Now were into September the 2018 annual minimum extent can’t be too far away. Extent decline appears to have stalled. However “high res” AMSR2 area is currently falling fast, for the time of year at least:
[Edit – September 2nd]
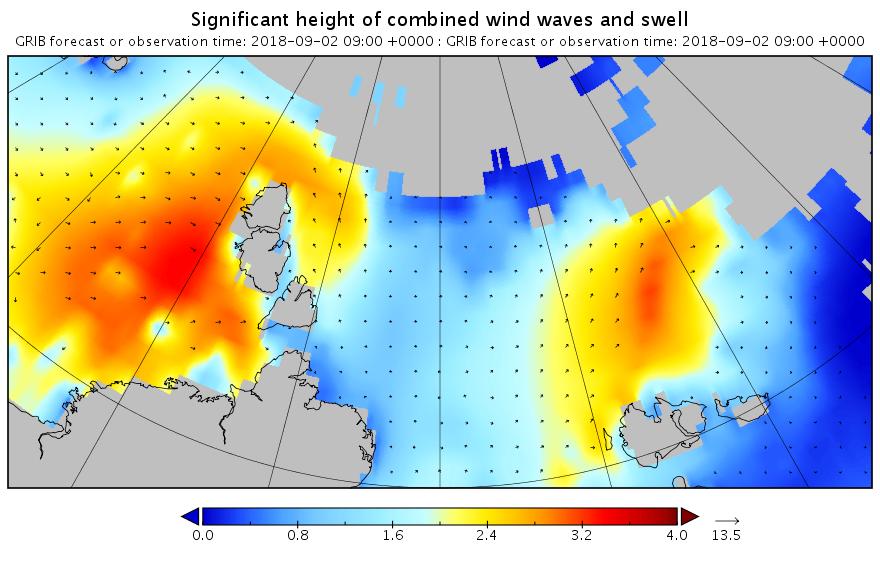
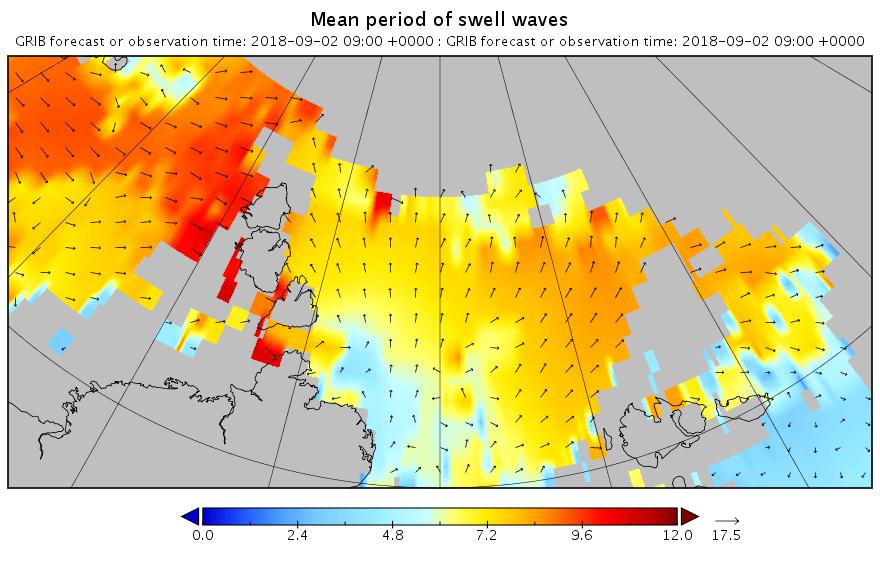
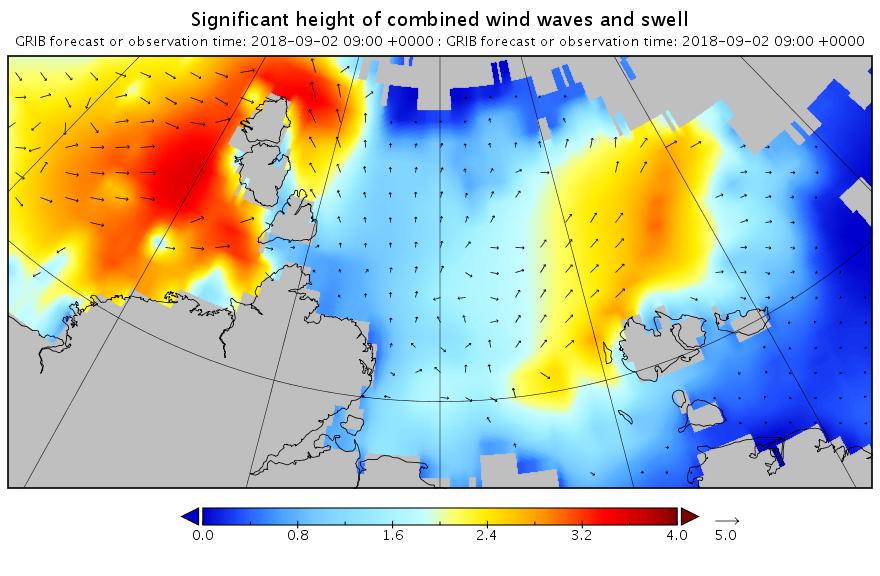
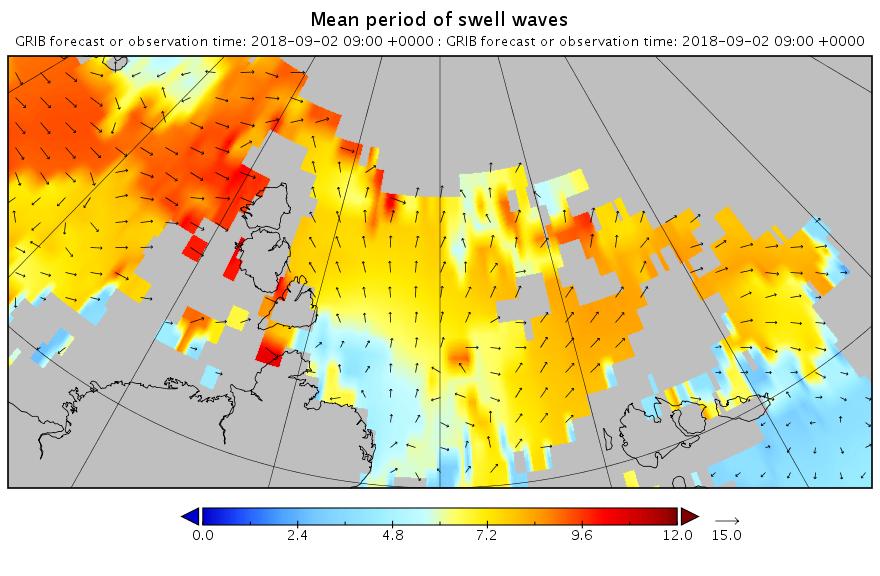
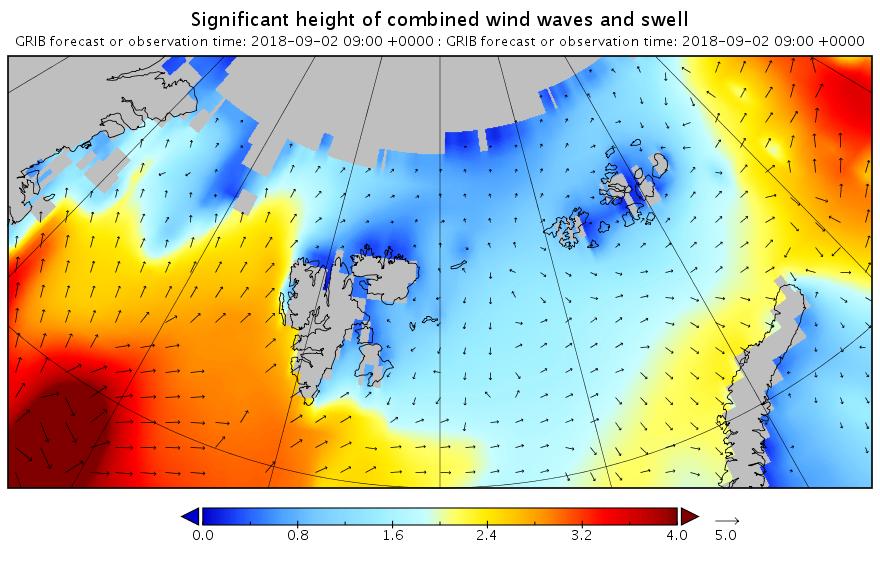
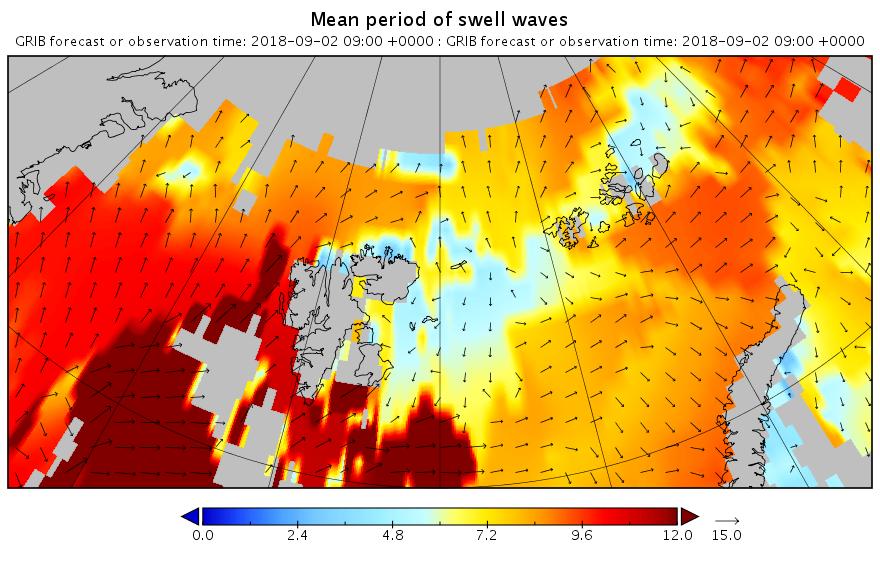
Here are the swell and period forecasts at midnight for round about now, 09:00 UTC:
All the seas between Greenland and the New Siberian Islands are awash with swells with a period of 8 second or greater. This is most unusual, to put it mildly!
[Edit – September 3rd]
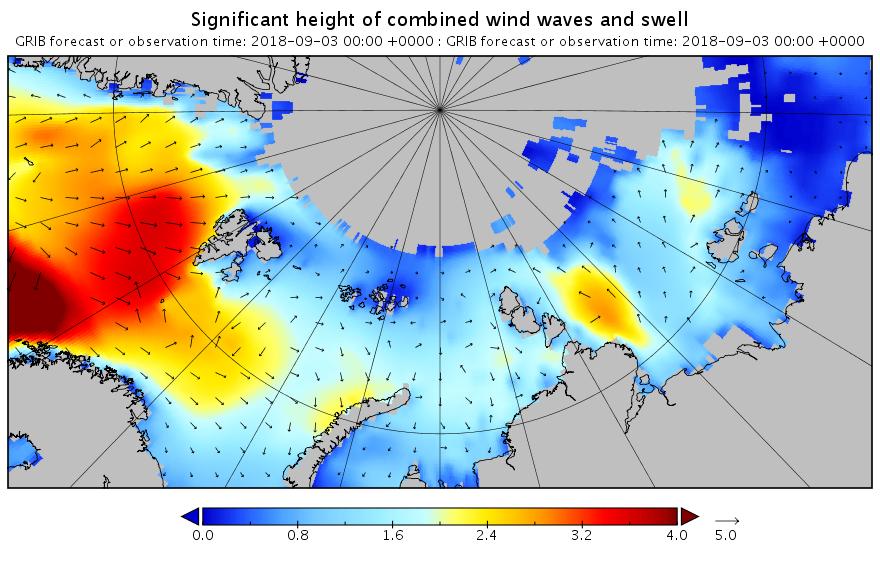
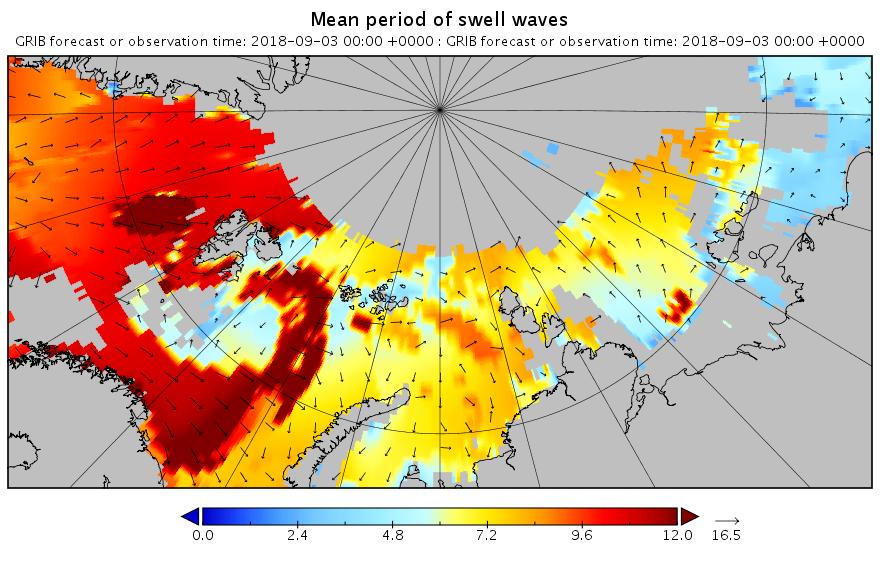
Here’s the WaveWatch III “hindcast” from midnight last night UTC for the Russian side of the Arctic Ocean:
There are still significant swells almost everywhere you look.
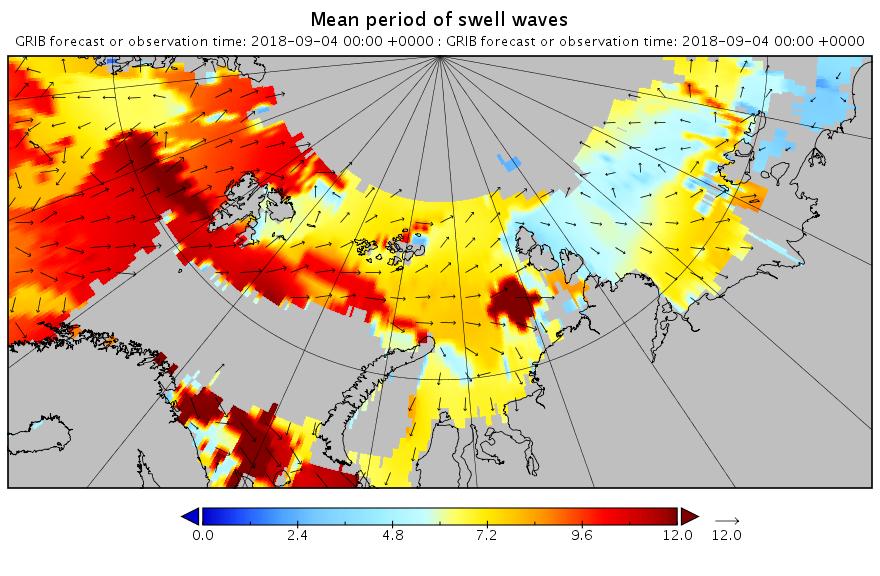
[Edit – September 4th]
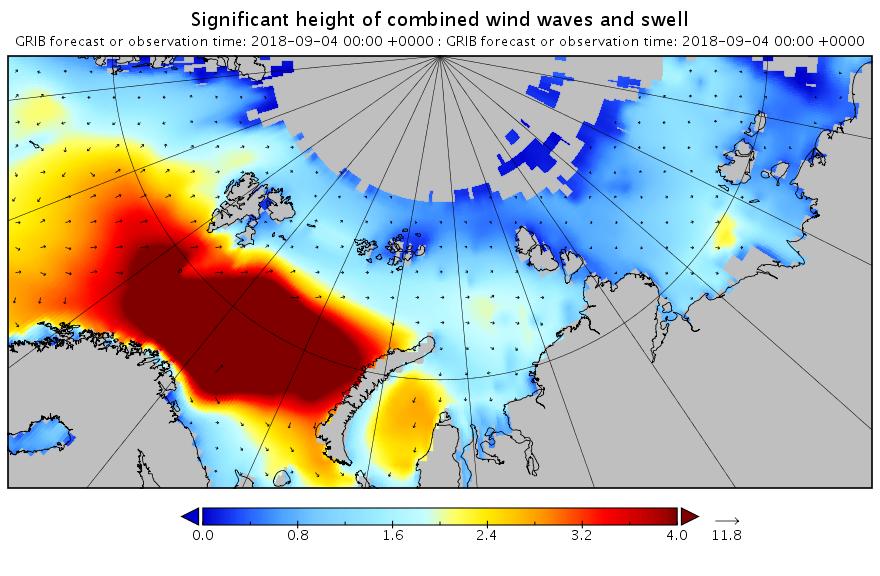
Using the same scales as yesterday, here’s today’s hindcast from midnight:
There’s still plenty of action in the Arctic Ocean!
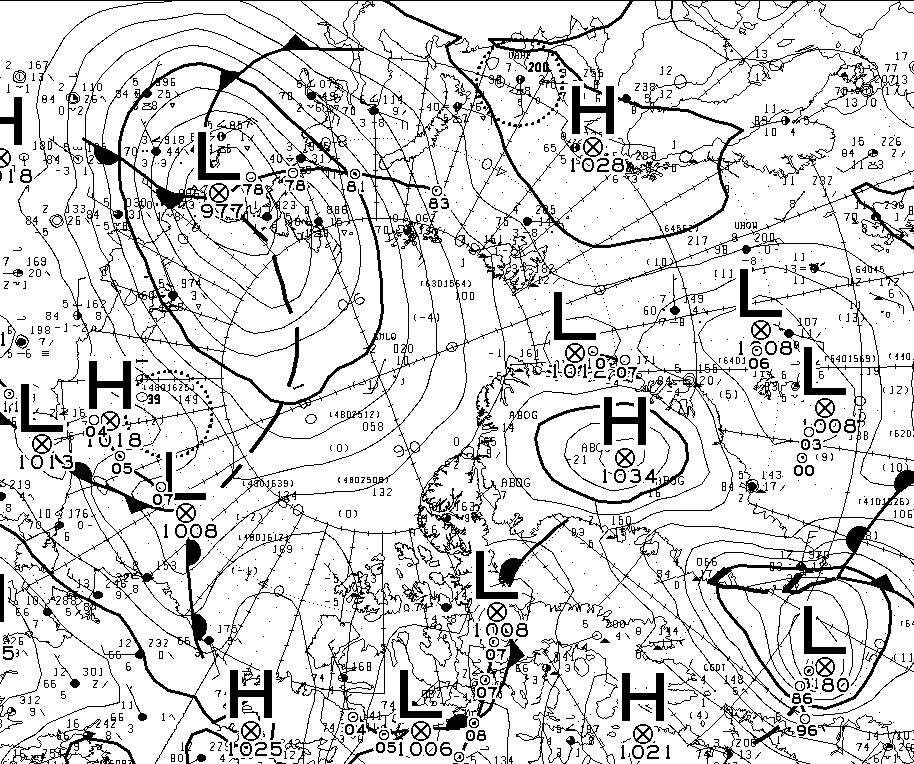
[Edit – September 5th]
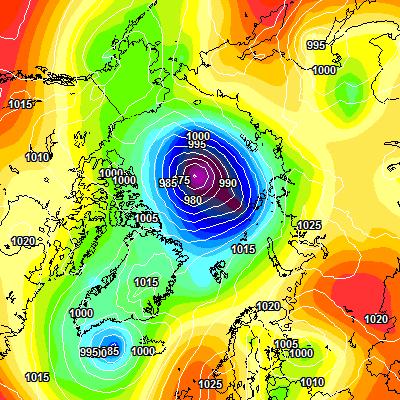
Feel free to debate whether it merits the “Great” prefix, but this is how the early September 2018 Arctic cyclone has panned out. According to this morning’s Environment Canada synopsis the cyclone is centred near the coast of the Laptev Sea and is down to a MSLP of 977 hPa:
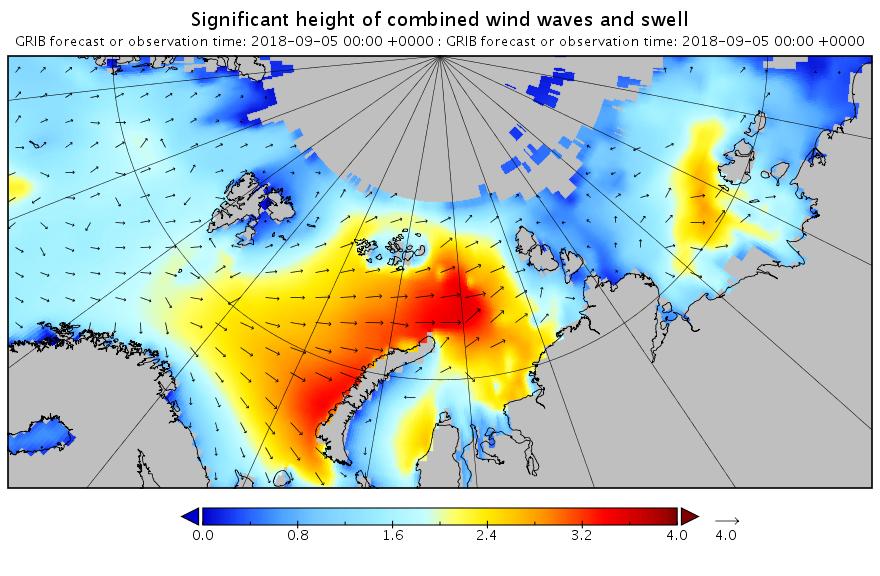
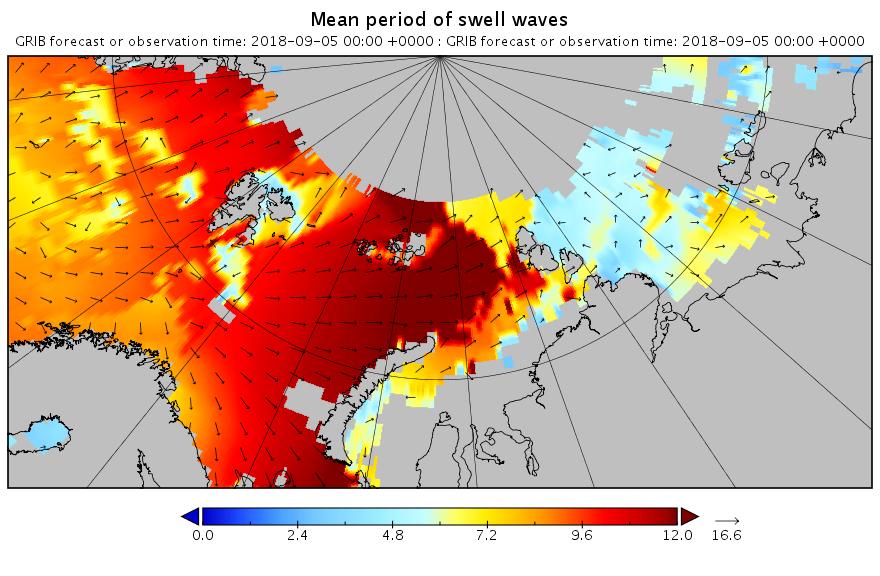
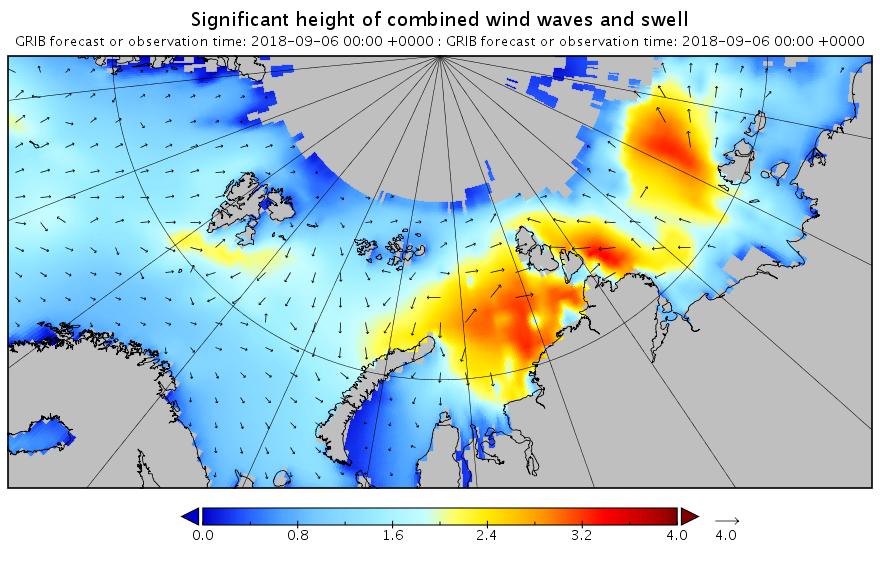
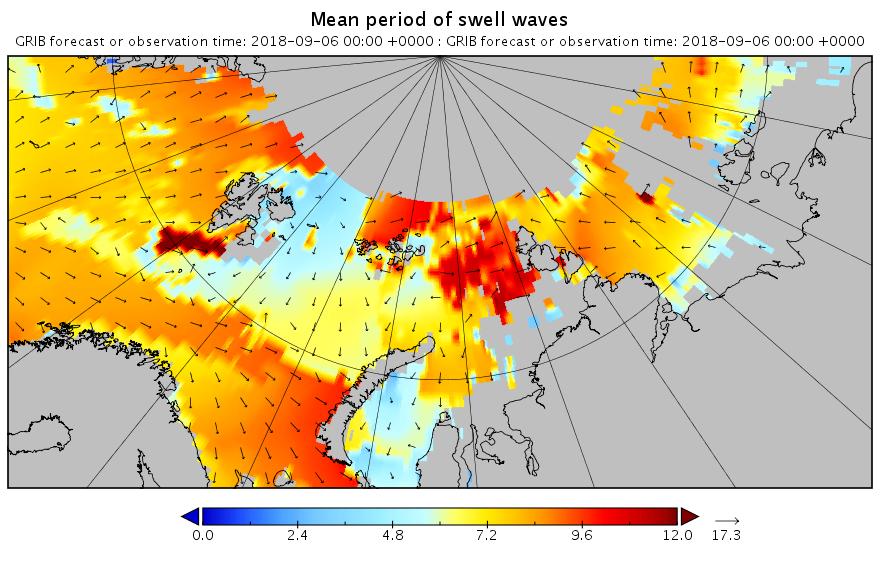
Here’s another WaveWatch III hindcast from midnight UTC:
[Edit – September 6th]
Need I say more?
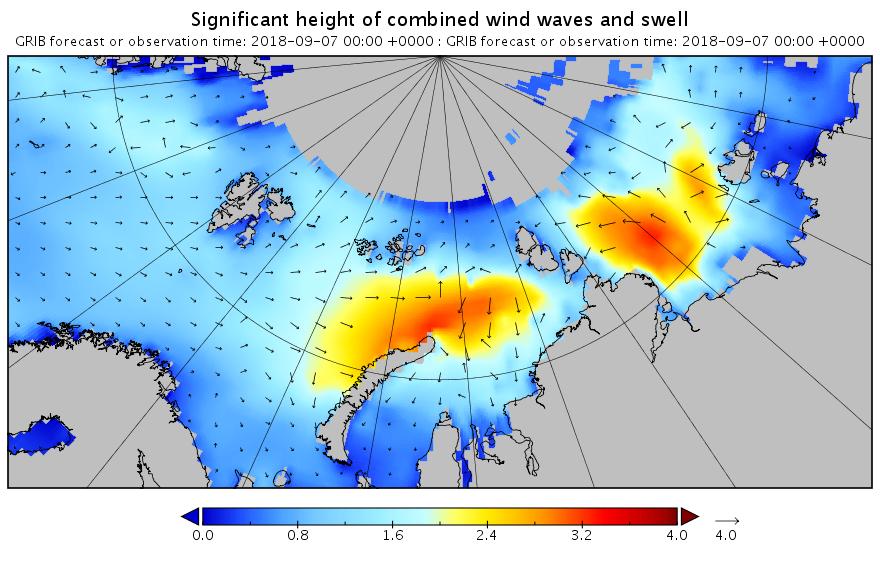
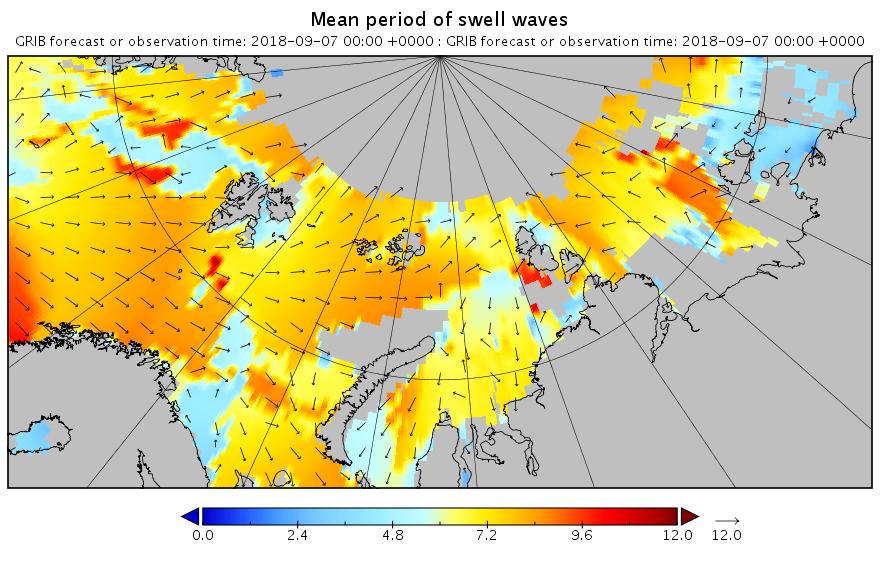
[Edit – September 7th]
The swell in the Fram Strait an Barents Sea is diminishing, but the period in the Laptev Sea is increasing now:
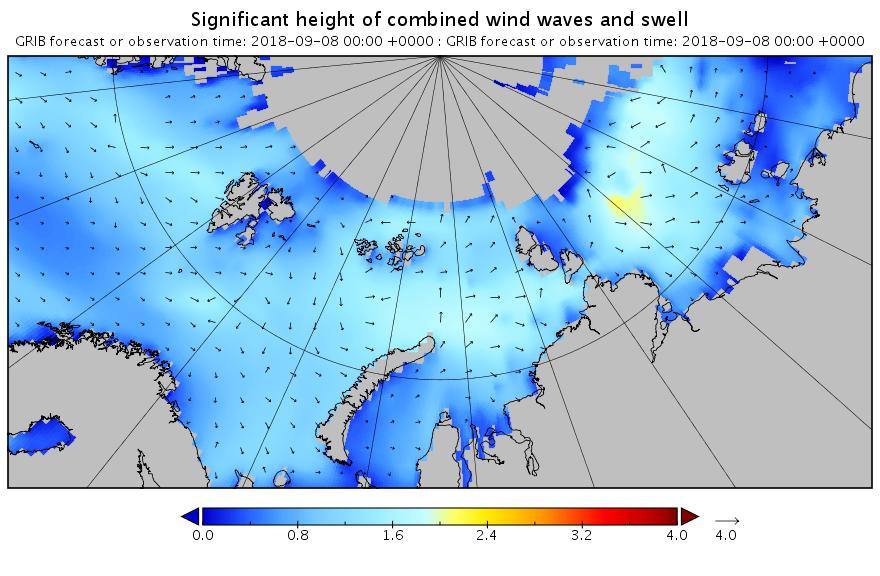
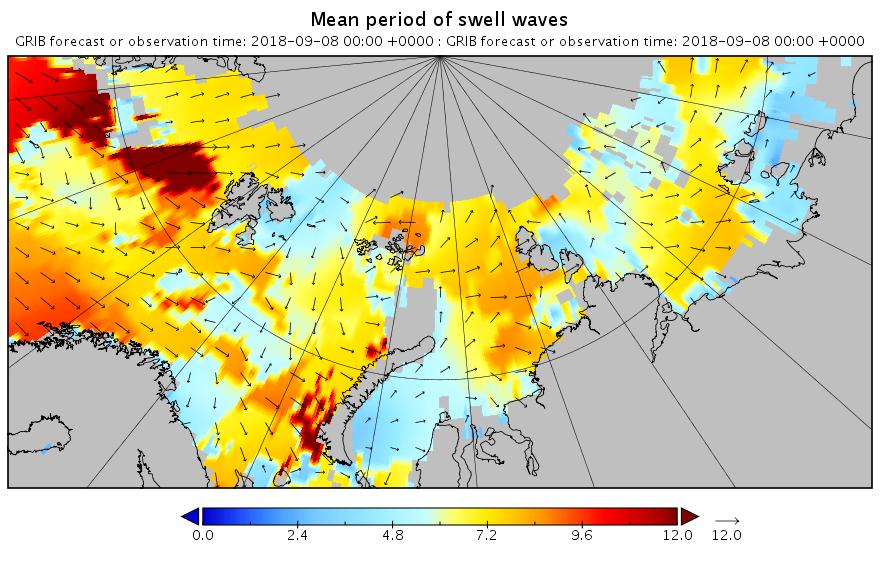
[Edit – September 8th]
All the wave activity in the Laptev Sea is diminishing. Here’s the hindcast from midnight:
Meanwhile things are warming up in the Chukchi and Beaufort Seas. Here’s the forecast for midnight tonight:
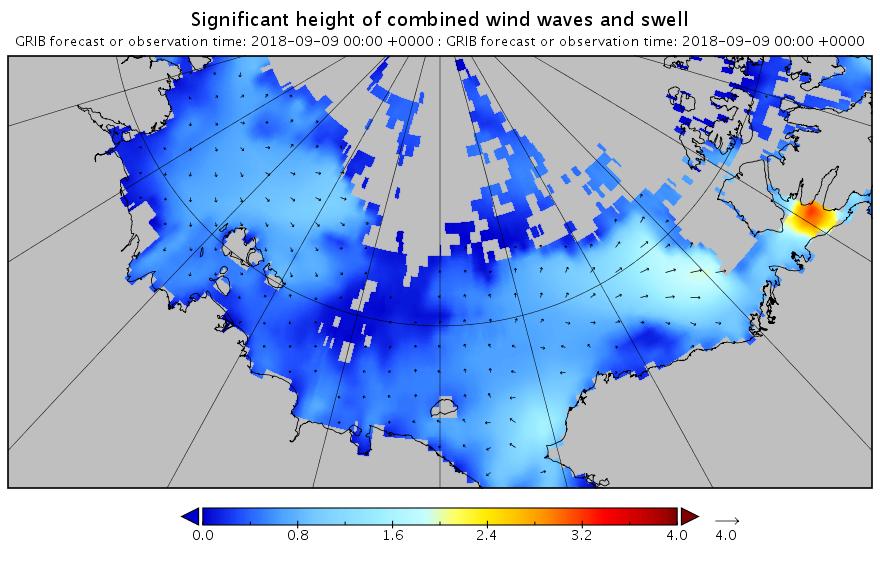
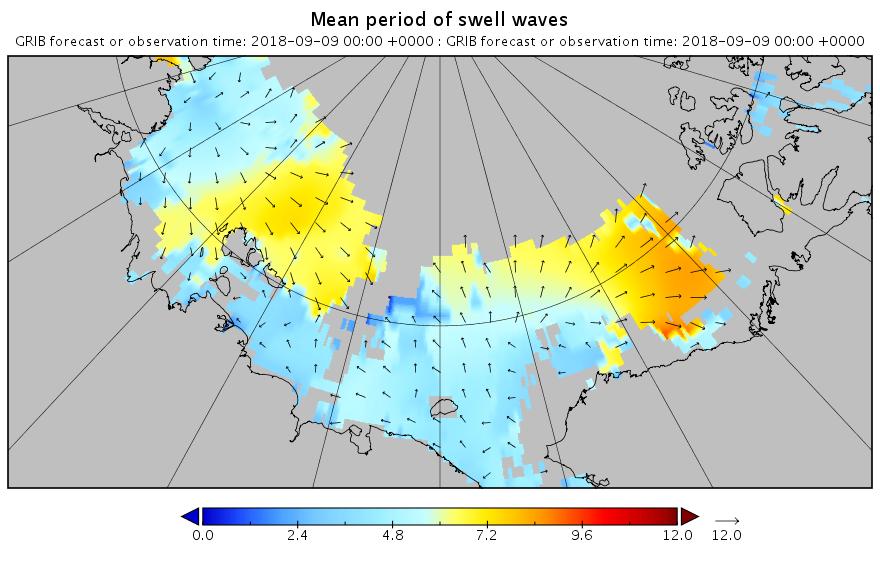
[Edit – September 9th]
Here’s the hindcast for this morning’s swell in the Beaufort Sea:
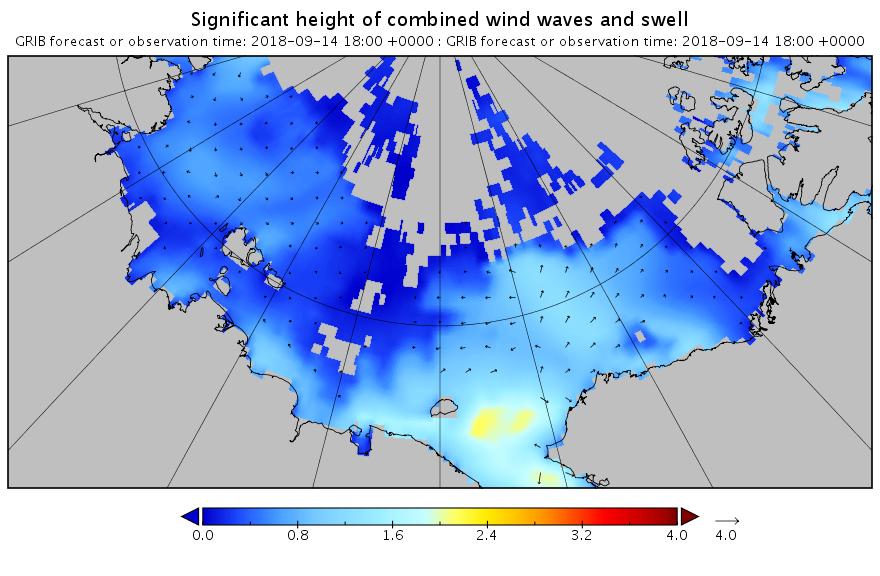
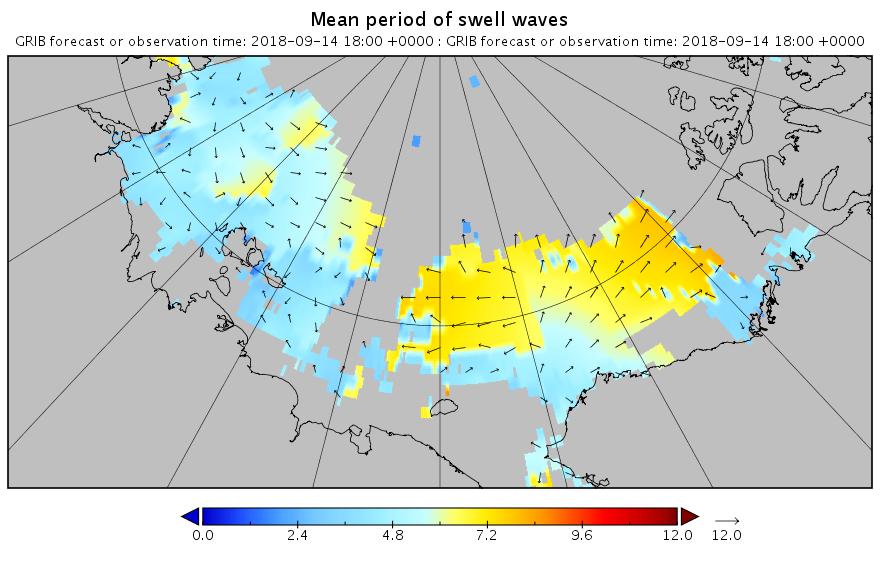
This is currently a long way into the future and hence may not verify in practice. However any pulse of swell is currently forecast for September 13th:
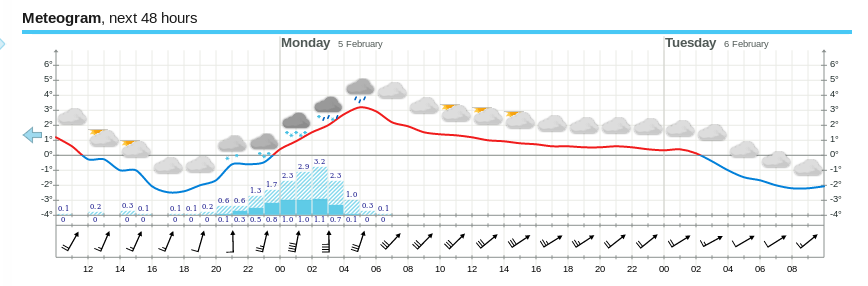
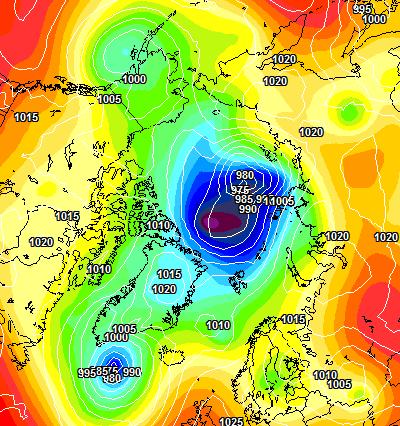
Much like last month, temperatures are above zero and rain is forecast. That’s because once again the current synoptic chart from Environment Canada shows a warm wet flow from way down south over Svalbard and on into the Central Arctic:
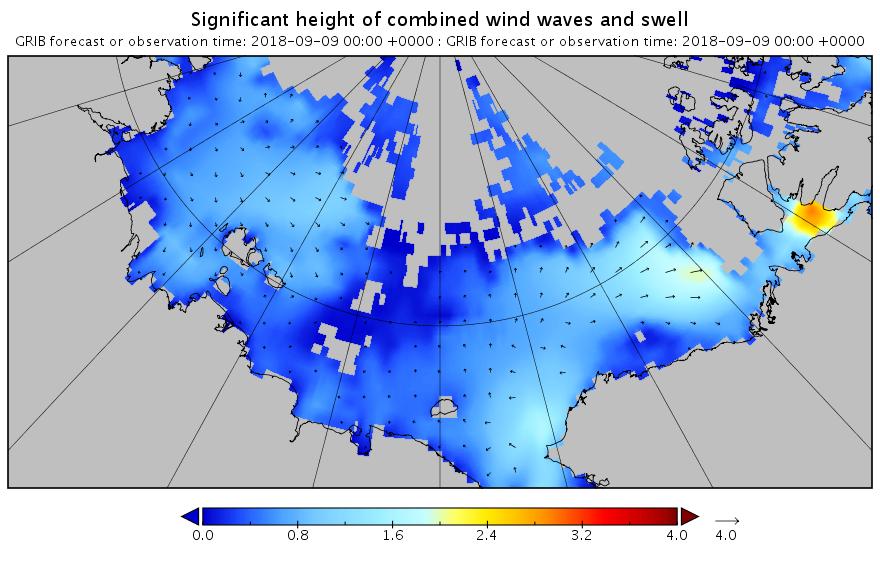
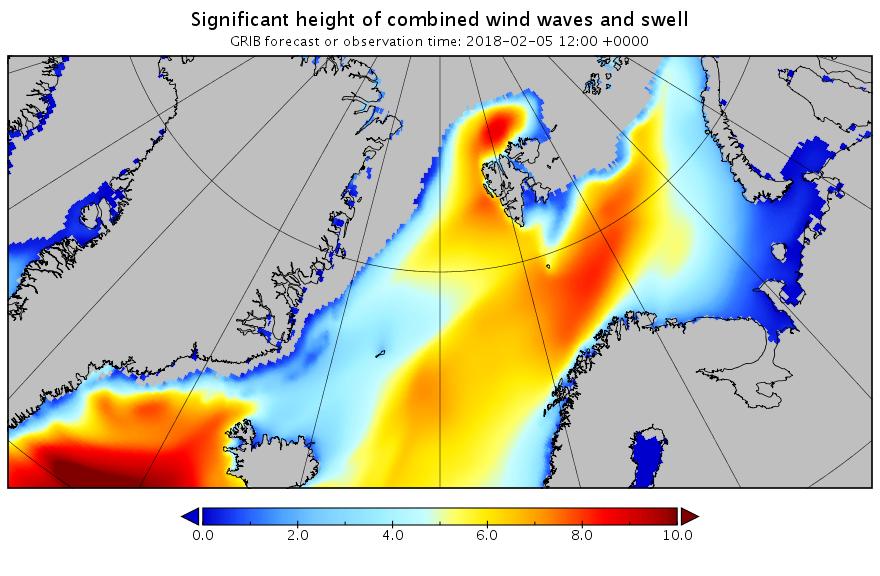
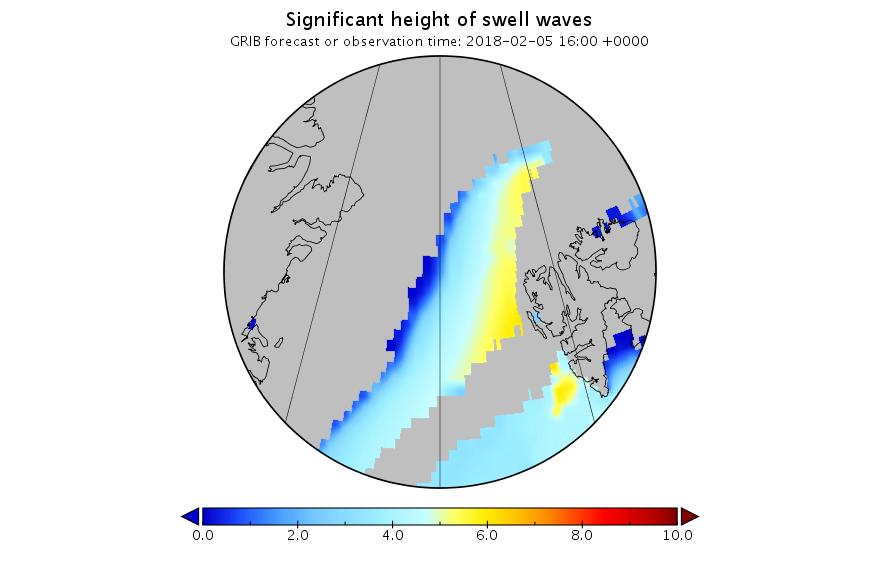
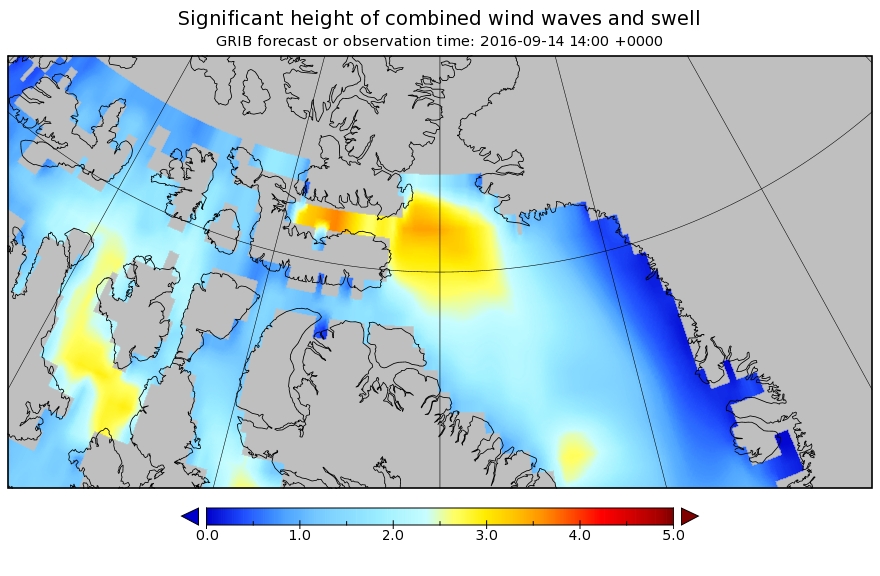
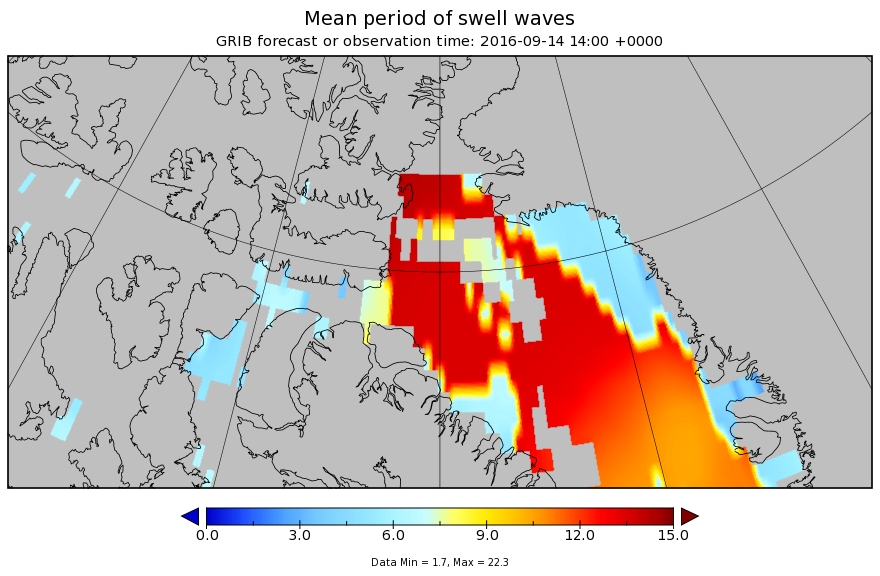
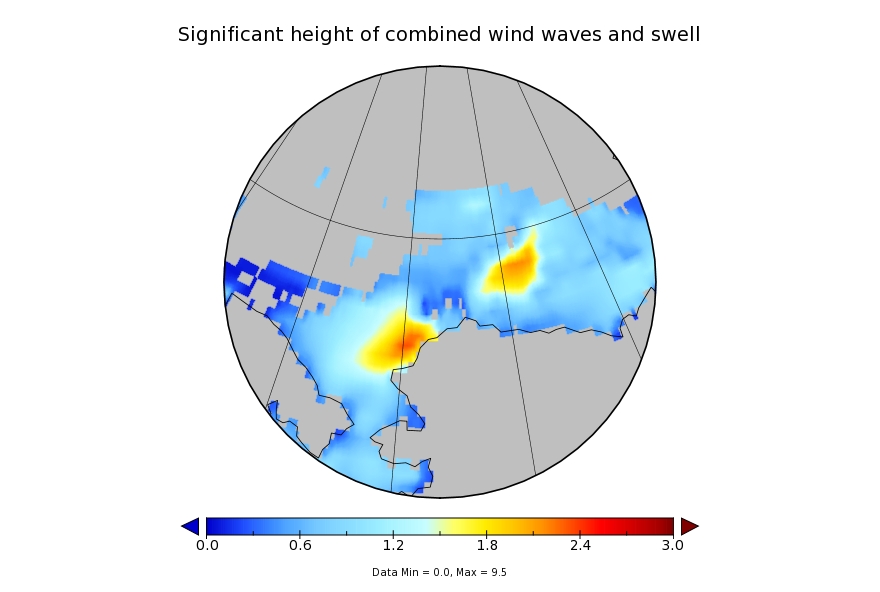
Next here’s the current combined wave and swell height forecast for the Svalbard area:
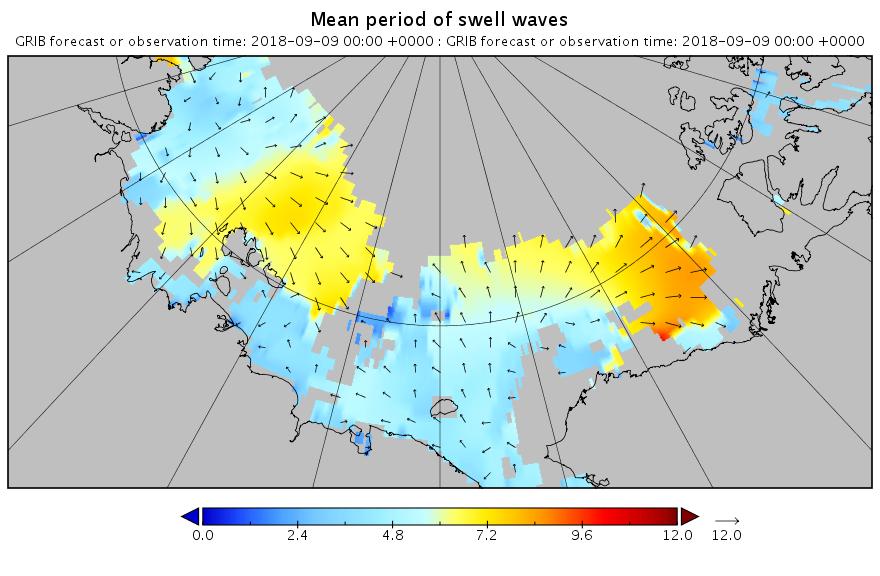
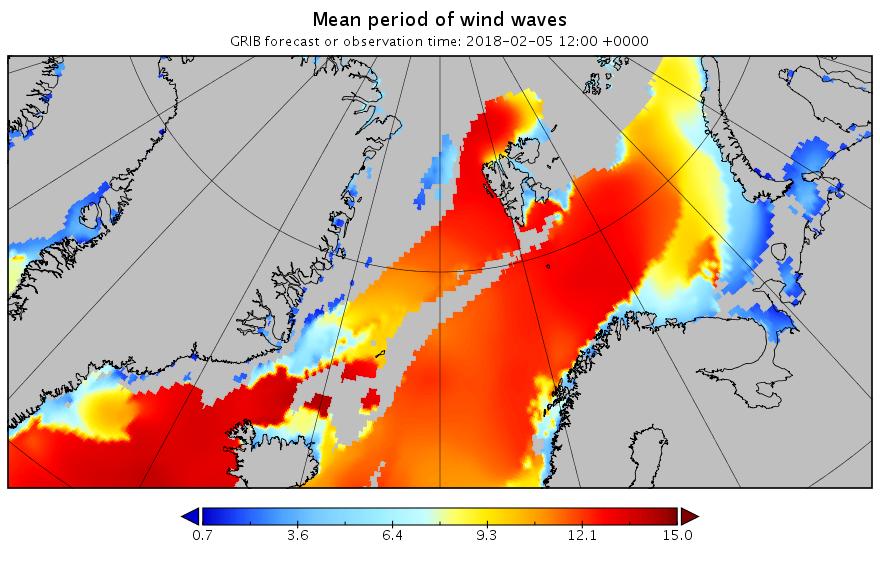
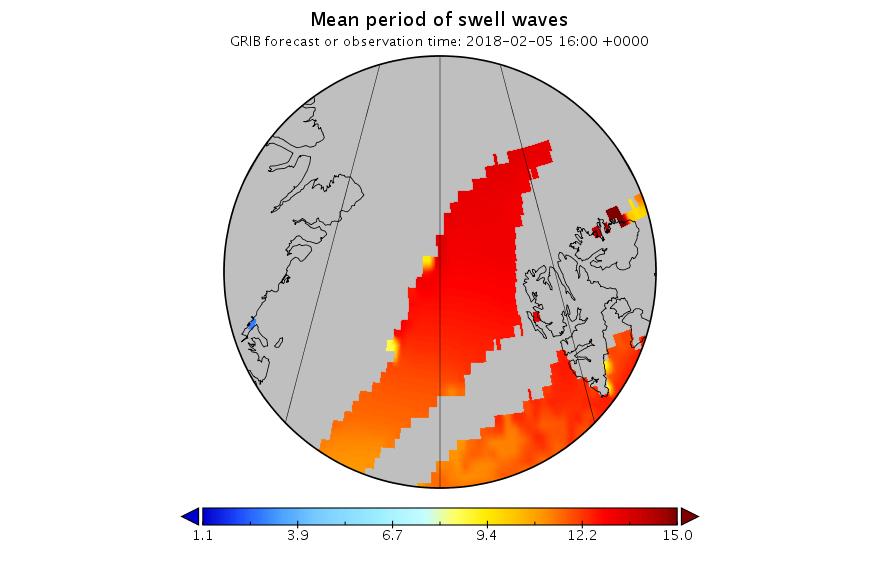
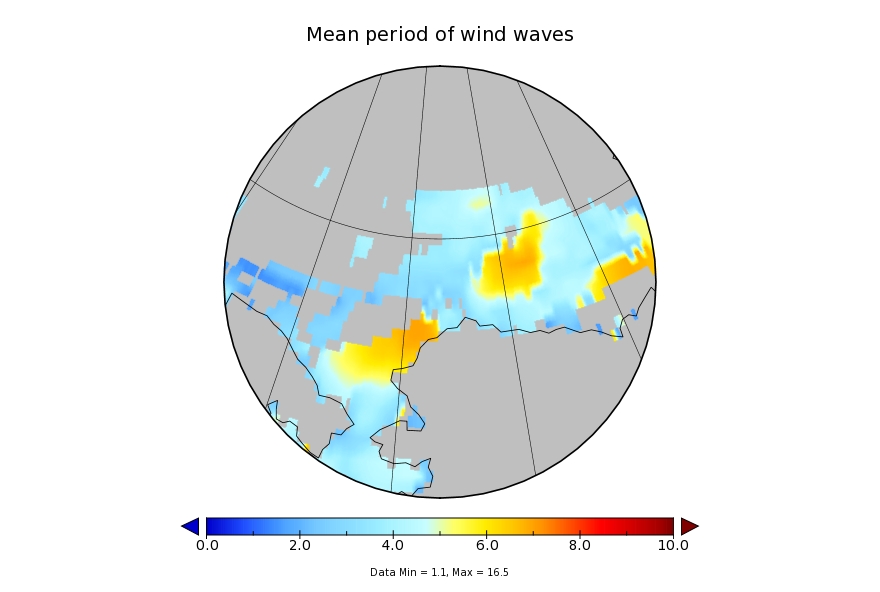
and here’s the associated wave period forecast:
It’s still showing 10 meter waves with a 15 second period north of Svalbard tomorrow lunchtime. Somewhat unusually for the Arctic these aren’t merely giant wind waves. Zooming in on the Fram Strait and breaking out the underlying primary swell reveals:
A long distance swell of that magnitude is going to cause some damage.
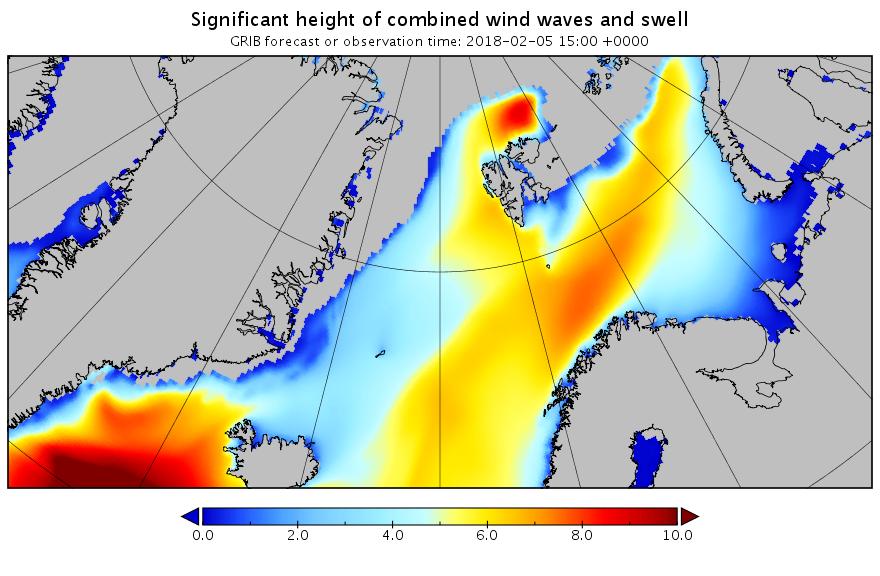
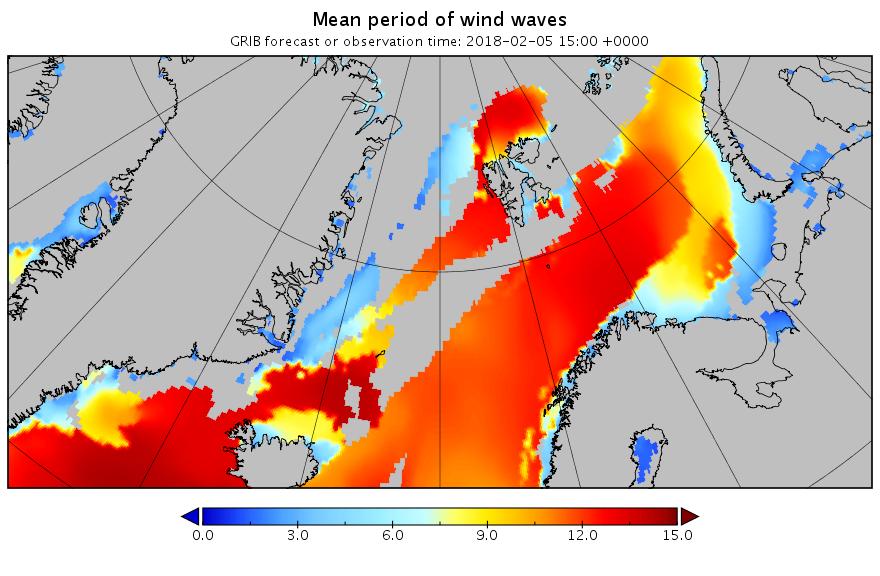
[Edit – February 5th]
The current ECMWF forecast for a split polar vortex, courtesy of Ice Shieldz on the Arctic Sea Ice Forum:
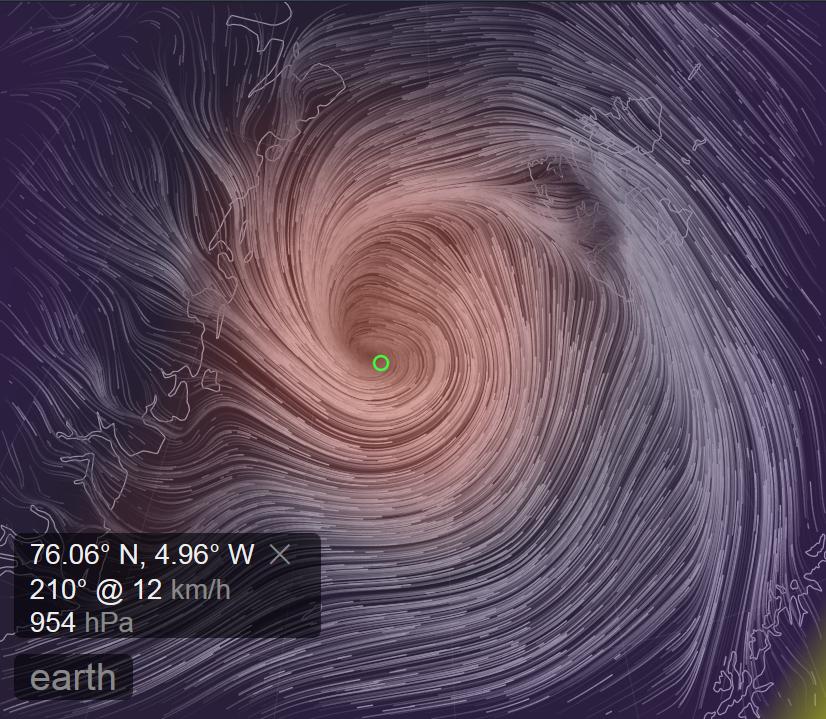
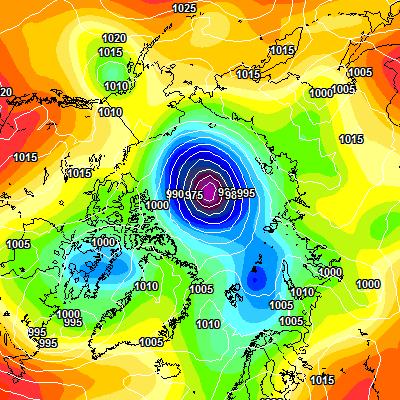
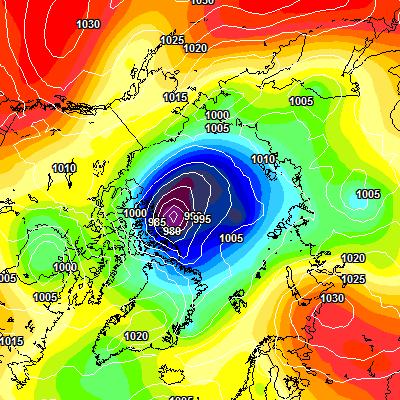
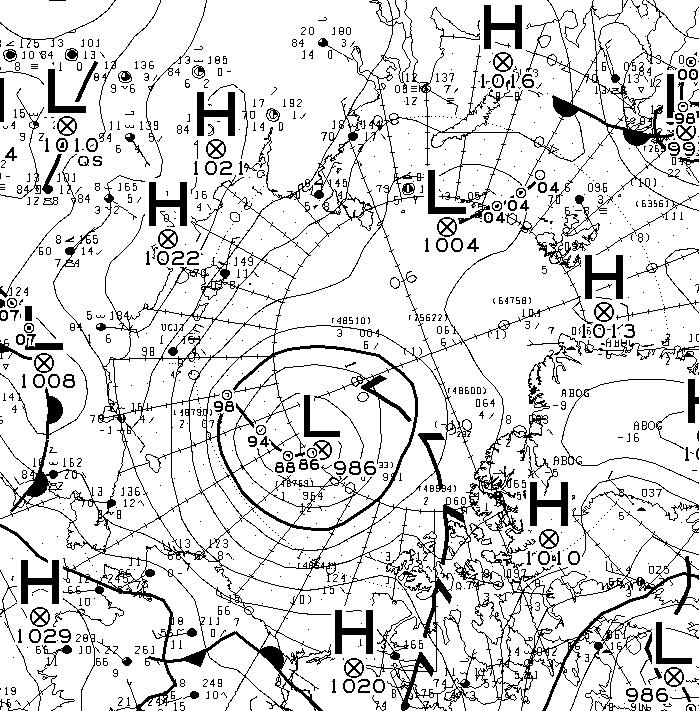
This is suggestive of more cyclones to come, but sticking with the current one for now, here is the MSLP chart at 00:00 UTC this morning showing the cyclone’s central pressure has dropped to 952 hPa:
Here too is the current WaveWatch III forecast for 15:00 UTC today:
The peak of the swell north of Svalbard is now slightly later than originally forecast, but it’s still enormous!
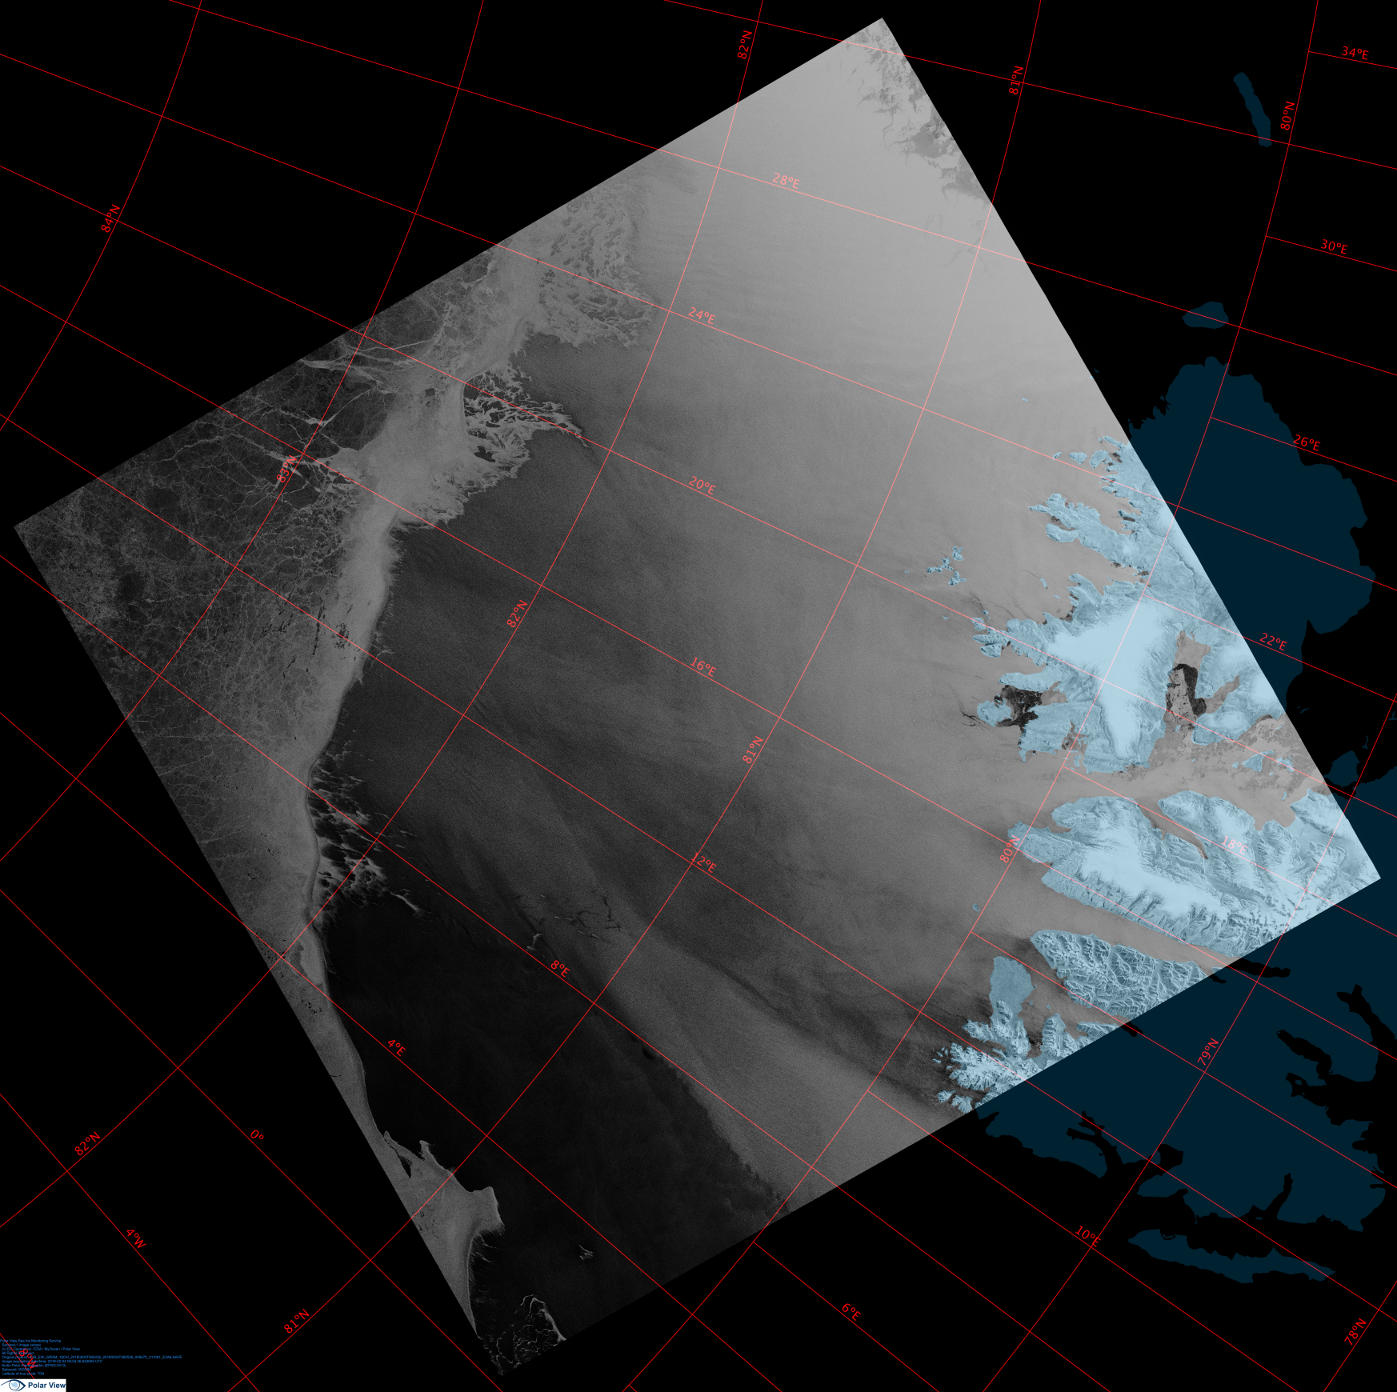
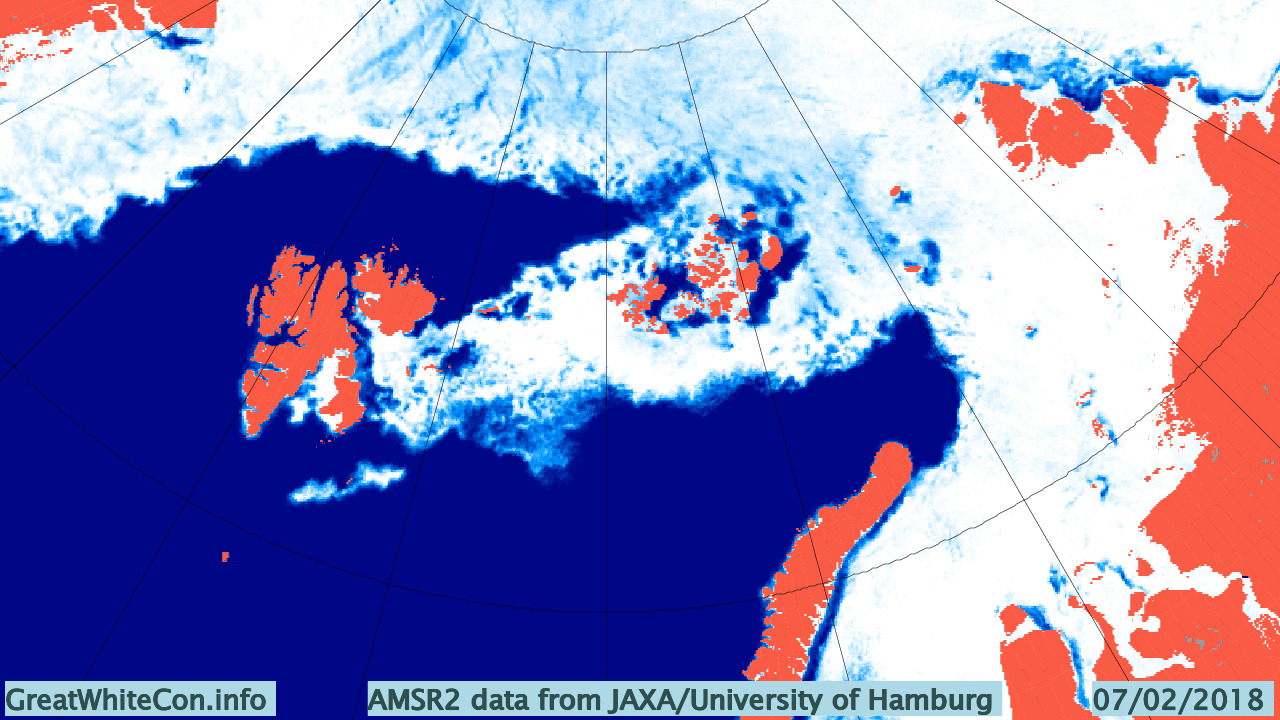
Here’s a single Sentinel 1B synthetic aperture radar image that captures the position of the ice edge north of Svalbard yesterday quite nicely:
[Edit – February 7th]
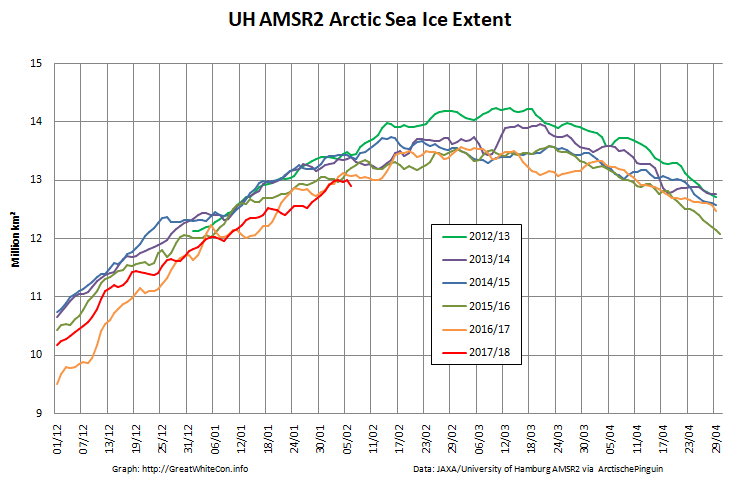
A brief overview of the effect of the recent cyclone on the sea ice in the Arctic via AMSR2:
Click the image to animate it.
[Edit – February 8th]
An Arctic wide take via Thomas Lavergne on Twitter:
Your daily update on the "big low entering #SeaIce". The "spin" in motion moves East towards Severnaya Zemlya. Some opening from land there, increased flushing through Fram Strait. pic.twitter.com/q4m1CRhmtS
An interesting insight into CryoSat-2 sea ice thickness measurements from Stefan Hendricks on Twitter:
Radar altimetry tells you how far the surface waves penetrate into the #seaice cover. Unfortunetaly via a bias in #Cryosat freeboard information. 😉 pic.twitter.com/OxUTcFH94h
GFS wants to keep major #PolarVortex (PV) center over Western Canada after the split and is consistent with predicted westward shift of troughing and #cold across North America but this is not typical following significant PV disruptions. pic.twitter.com/zX7n3rnMpo
Regular readers may recall that as 2016 began we pondered how “Storm Frank” might have affected the Arctic. Now NASA have published some research into that very topic, entitled ” The Impact of the Extreme Winter 2015/16 Arctic Cyclone on the Barents–Kara Seas”. The paper itself is paywalled, but according to an associated article on the NASA web site:
A large cyclone that crossed the Arctic in December 2015 brought so much heat and humidity to this otherwise frigid and dry environment that it thinned and shrunk the sea ice cover during a time of the year when the ice should have been growing thicker and stronger.
The cyclone formed on Dec. 28, 2015, in the middle of the North Atlantic, and traveled to the United Kingdom and Iceland before entering the Arctic on Dec. 30, lingering in the area for several days. During the height of the storm, the mean air temperatures in the Kara and Barents seas region, north of Russia and Norway, were 18 degrees Fahrenheit (10 degrees Celsius) warmer than what the average had been for this time of the year since 2003.
The extremely warm and humid air mass associated with the cyclone caused an amount of energy equivalent to the power used in one year by half a million American homes to be transferred from the atmosphere to the surface of the sea ice in the Kara-Barents region. As a result, the area’s sea ice thinned by almost 4 inches (10 centimeters) on average.
At the same time, the storm winds pushed the edges of the sea ice north, compacting the ice pack.
Here’s a video with commentary by Linette Boisvert, lead author of the paper:
From the commentary:
As a result of this cyclone, the concentration of the sea ice in the Barents and Kara Seas decreased by ten percent, and the sea ice edge moved northward. The loss in sea ice area during this time was equivalent to the size of Florida. Sea ice extent stayed low throughout the month of January with large parts of the Barents and Kara Seas remaining unseasonably ice-free, which probably helped contribute to a record low Arctic sea ice maximum.
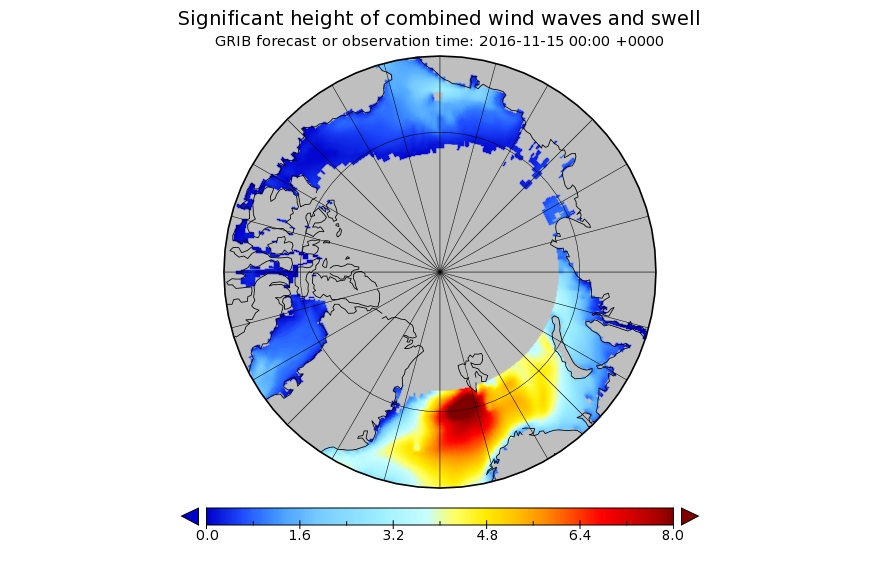
Somewhat earlier than last year another strong cyclone has been having a similar effect on the Arctic over the last week. A cyclone entered the Central Arctic via the Fram Strait, reaching a minimum central pressure of 954 hPa on November 14th:
Here is the Wavewatch III wave height forecast for November 15th 2016:
and here is NOAA’s temperature anomaly reanalysis for November 16th 2016:
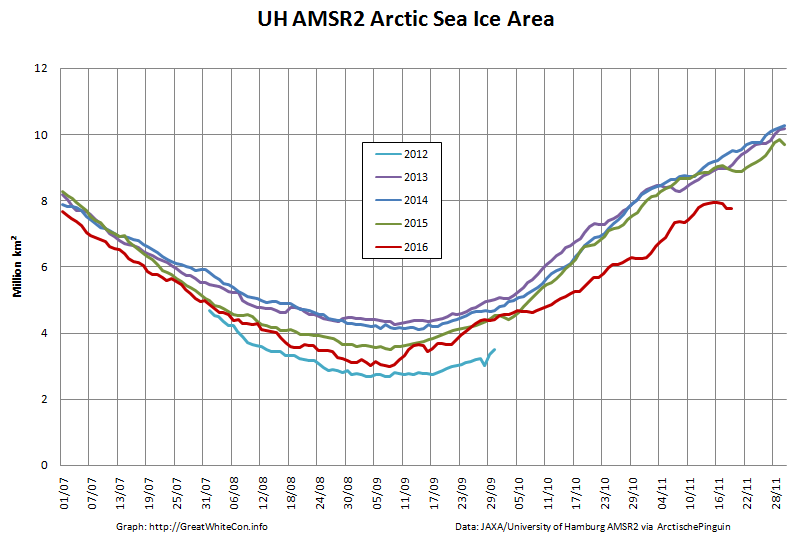
As a consequence of the strong winds, huge waves and 20 degrees Celsius temperature anomaly across much of the Arctic, sea ice area has been falling during a period when it is usually increasing rapidly:
The Central Arctic has of course already been battered by the Great Arctic Cyclone(s) of August 2016. The minimum sea ice extent has been called by the NSIDC, with a slight proviso:
Arctic sea ice appears to have reached its seasonal minimum extent for 2016 on September 10. A relatively rapid loss of sea ice in the first ten days of September has pushed the ice extent to a statistical tie with 2007 for the second lowest in the satellite record. September’s low extent followed a summer characterized by conditions generally unfavorable for sea ice loss.
Please note that this is a preliminary announcement. Changing winds or late-season melt could still reduce the Arctic ice extent, as happened in 2005 and 2010. NSIDC scientists will release a full analysis of the Arctic melt season, and discuss the Antarctic winter sea ice growth, in early October.
On September 10, Arctic sea ice extent stood at 4.14 million square kilometers (1.60 million square miles).
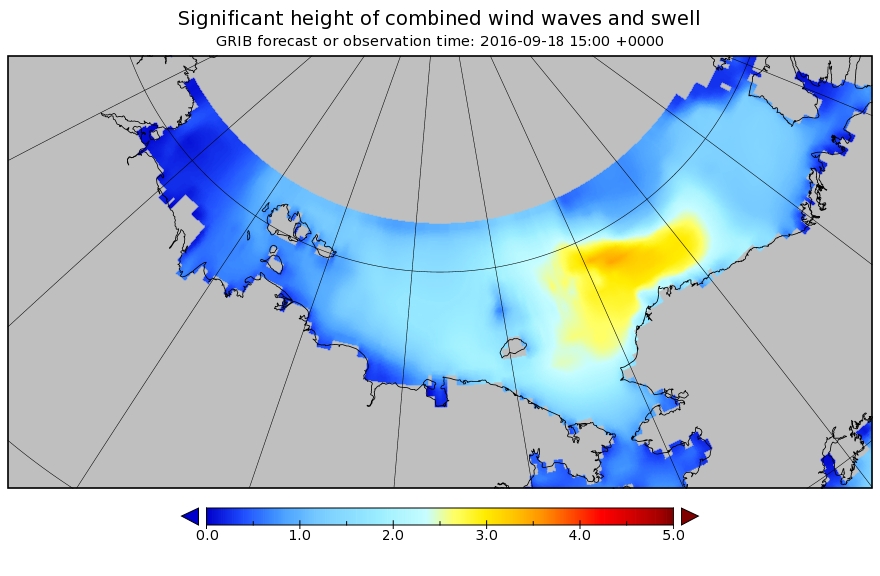
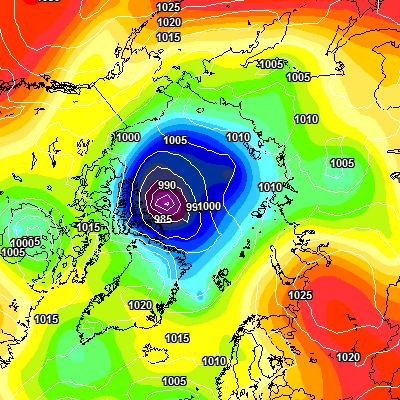
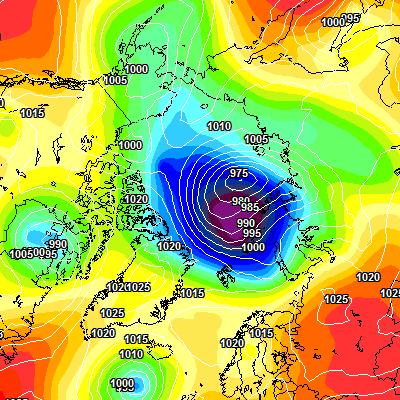
Now, however, yet another cyclone is raging in the Central Arctic. According to Environment Canada this one is already down to a mean sea level pressure of 975 hPa:
As our regular readers will be well aware, at this time of year strong winds beget large swells. On this occasion it looks as though Barrow will get another battering, as well as the remaining and refreezing sea ice. Here’s the current WaveWatch III significant wave height forecast for September 18th:
Such large swells on the surface of the Arctic Ocean don’t only physically break up the sea ice. Last September scientists aboard the University of Alaska’s research icebreaker Sikuliaq observed the effects of a similar storm in the Beaufort Sea. According to Jennifer MacKinnon, Chief Scientist on the ArcticMix voyage:
One of the funny things about the Arctic is that there’s a reservoir of heat beneath the surface here.
So the more the wind is blowing on the ocean, the more it’s mixing this heat upwards. Which is bringing warmer water to the surface at a pretty rapid rate, warming the surface and accelerating the rate at which this ice is melting.
And if storms like this continue, as there’s more open water, more storms mean more exposed surface. It will not only melt the ice in the summer, but delay the onset of fall ice formation and accelerate the onset of spring ice melting.
In October 2015 the Sikuliaq was back in the Beaufort Sea observing the effect of storm swells on refreezing sea ice. Here’s a report from Chief Scientist Jim Thomson:
A strong easterly wind event came through that built large waves — waves that got to almost five meters in height. And the winds were something like up to thirty knots. And these waves were coming into the newly forming ice and making pancake ice.
There was a very warm layer of water 20 meters down beneath the surface. And these waves coming in were enough to drive additional mixing and bring that warm water up from the subsurface and that warm water melted the ice and changed that balance happening at the surface.
As if all that wasn’t already enough to worry about look who’s waiting in the wings. Tropical Storm Ian is heading towards the Arctic Circle at a rate of knots, even as we speak:
SURF ZONE FORECAST
NATIONAL WEATHER SERVICE BARROW AK
0500 AM AKDT SAT SEP 17 2016
AKZ202-171230-
NORTHERN ARCTIC COAST
INCLUDING THE BEACHES OF BARROW…PITT POINT…NULAVIK
0500 AM AKDT SAT SEP 17 2016
.TODAY AND TONIGHT…
.WIND… WESTERLY 20 TO 35 MPH.
.SURF HEIGHT… 2 TO 5 FT.
.SURF TEMP… 36 DEGREES F.
.TIDES… LOW SAT 0826 AM -0.03
HIGH SAT 0230 PM 0.38
LOW SAT 0846 PM -0.02
HIGH SUN 0250 AM 0.38
…HIGH SURF ADVISORY REMAINS IN EFFECT UNTIL 6 AM AKDT MONDAY…
* WAVES AND SURF…WAVES TO 10 FEET BREAKING JUST OFFSHORE COMBINED WITH TIDES UP TO 1 FOOT ABOVE NORMAL WILL CAUSE HIGH SURF CONDITIONS.
* ICE…WITH ICE JUST OFF SHORE FROM BARROW…IT IS POSSIBLE THAT CHUNKS OF SEA ICE WILL WASH UP ON SHORE EVEN WITH WINDS PREDICTED TO BE AT NEARLY PARALLEL TO THE SHORE.
* WINDS…WEST 20 TO 30 MPH FROM THIS AFTERNOON THROUGH EARLY MONDAY MORNING.
* TIMING…HIGH SURF IS EXPECTED TO BEGIN LATE THIS AFTERNOON AND CONTINUE THROUGH EARLY MONDAY.
* IMPACTS…HIGH SURF WILL WASH TO THE TOP OF THE BEACH AND CAUSE BEACH EROSION. MINOR FLOODING OF LOW LYING AREAS IS POSSIBLE AND SURF COULD WASH ONTO LOW LYING ROADS NEAR THE BEACH.
PRECAUTIONARY/PREPAREDNESS ACTIONS…
A HIGH SURF ADVISORY MEANS THAT LOCALIZED BEACH EROSION IS EXPECTED. SURF COULD WASH ONTO LOW LYING ROADS NEAR THE BEACH LIMITING TRAVEL NEAR THE BEACH. PEOPLE SHOULD MOVE BOATS AND PERSONAL PROPERTY INLAND FROM THE BEACH.
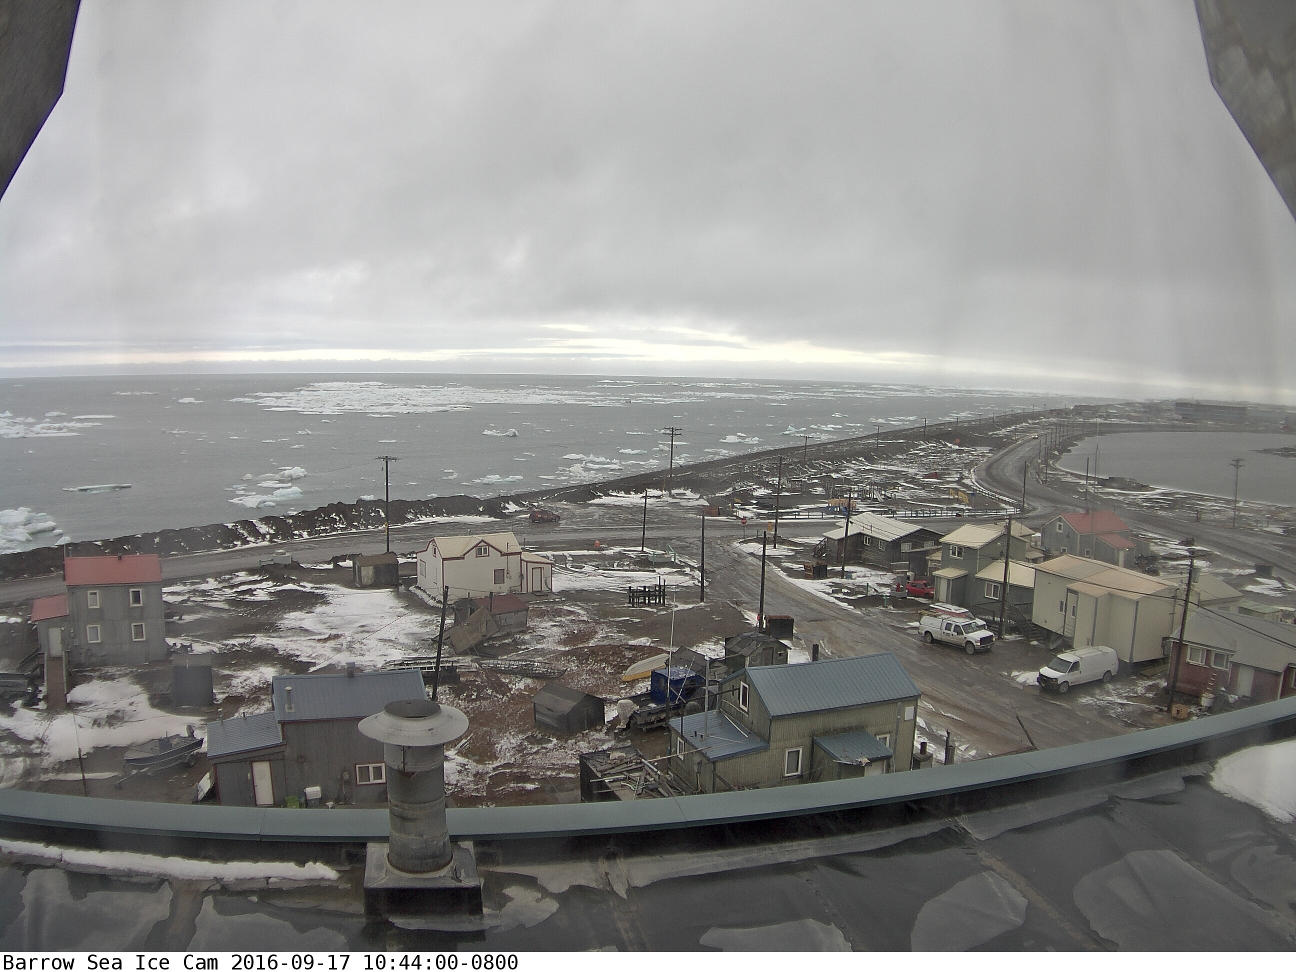
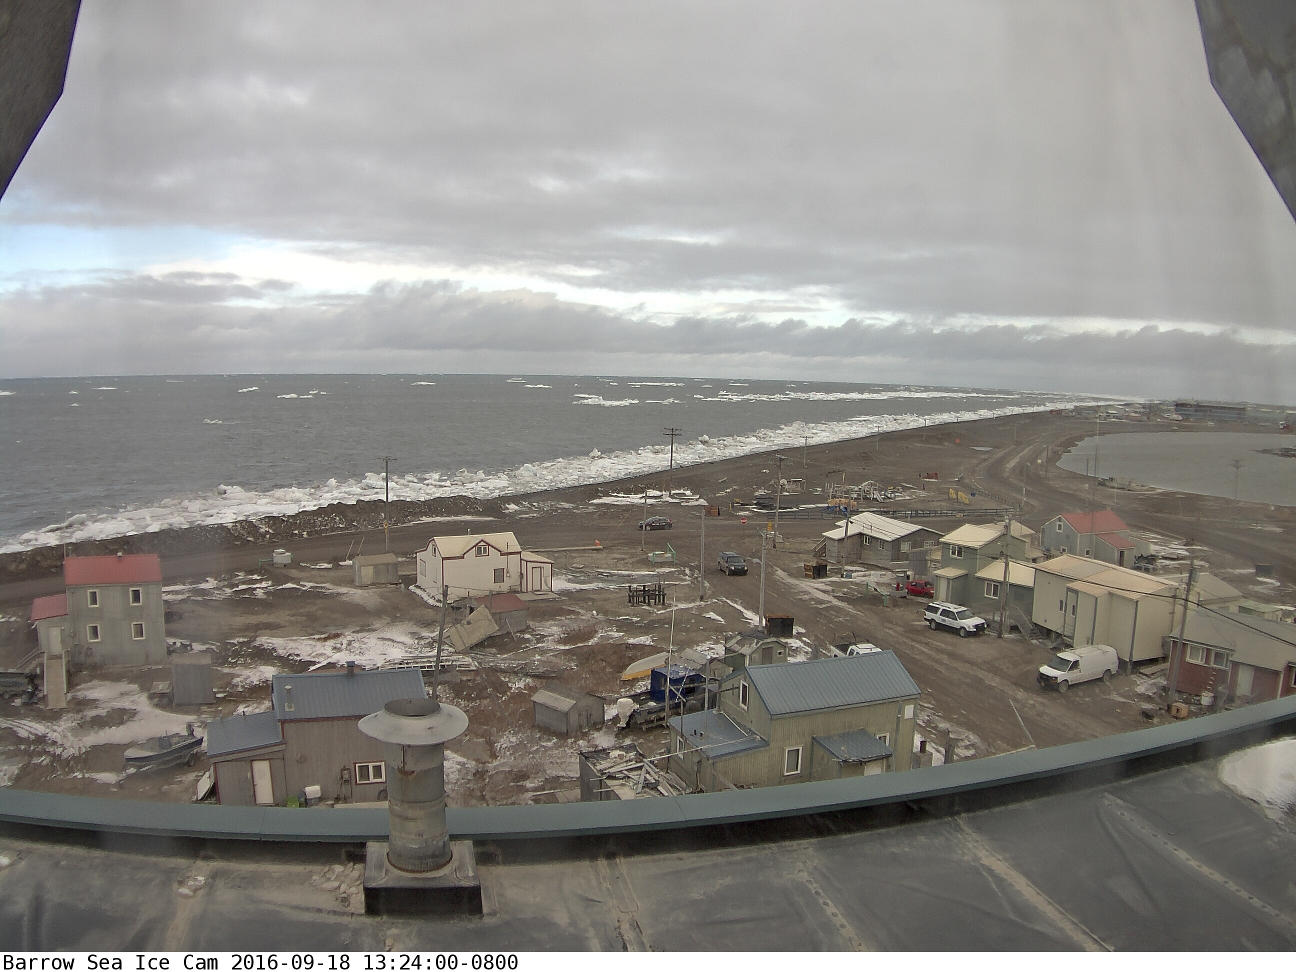
[Edit – September 19th]
Somewhat belatedly, before:
and after:
the storm images from the Barrow webcam, which has just burst back into life. Plus an image of the cyclone from on high:
NASA Worldview “true-color” image of the Beaufort Sea on September 18th 2016, derived from the VIIRS sensor on the Suomi satellite
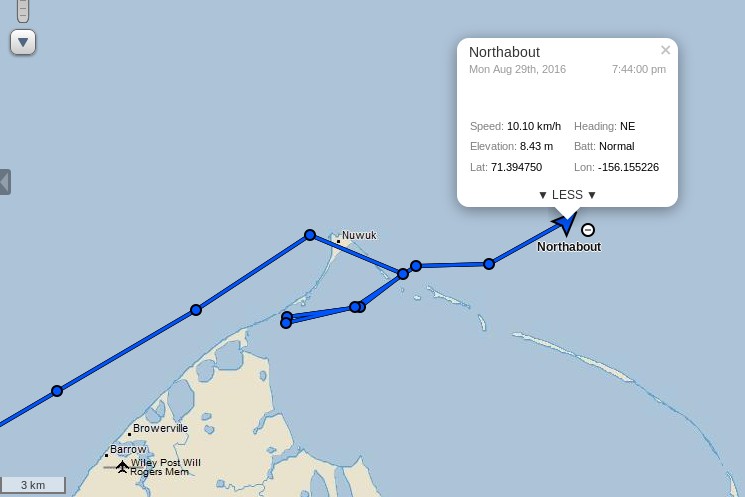
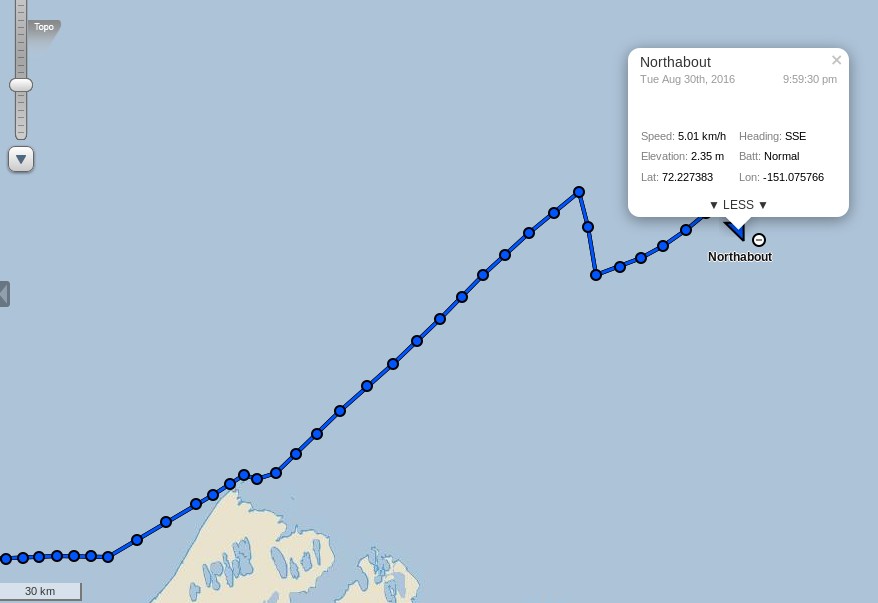
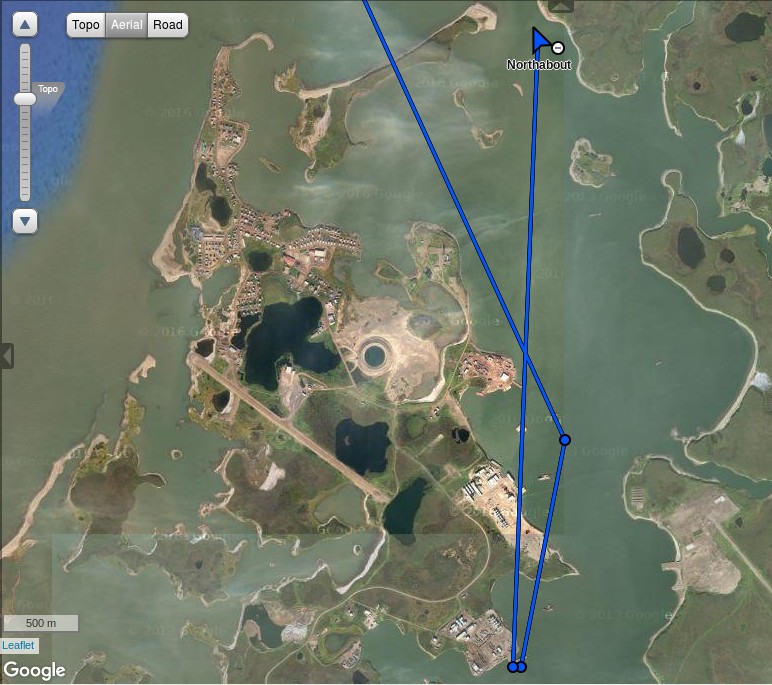
After the briefest of stops in Elson Lagoon behind Point Barrow Northabout is on the move once again:
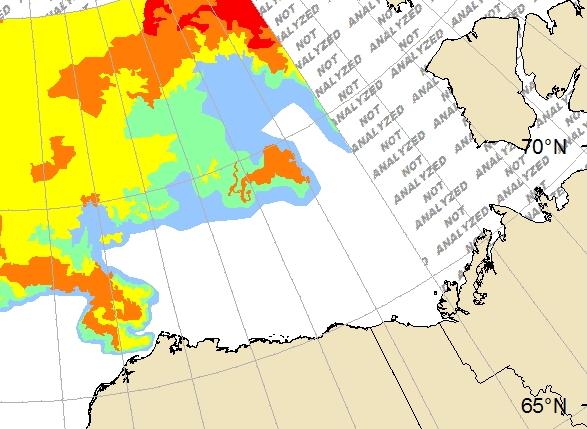
She’s currently heading out into the Beaufort Sea before following in the giant footsteps of the cruise liner Crystal Serenity in the direction of the Amundsen Gulf and the Canadian Arctic Archipelago. Here’s the United States National Weather Service’s current ice chart for Alaskan waters:
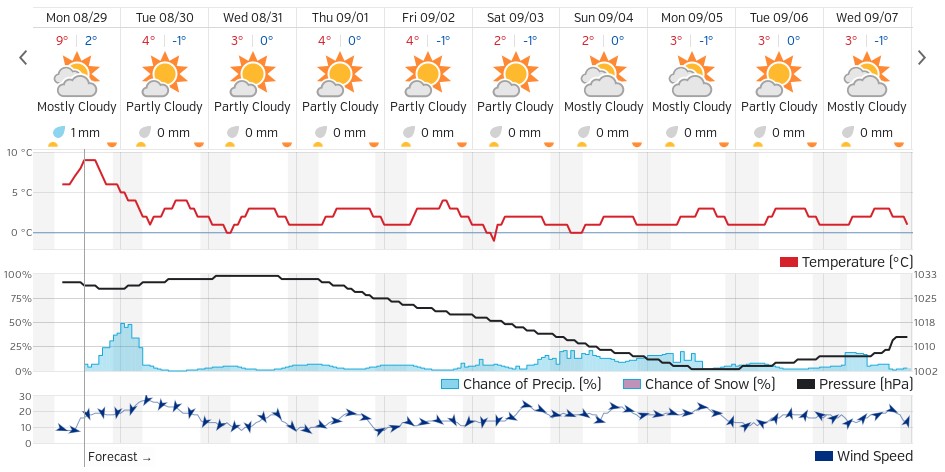
There looks to be far less to worry about ice wise on the next leg of the Polar Ocean Challenge than on the previous one! The weather forecast isn’t too bad either, with high pressure over the Beaufort Sea and a fair bit of sunshine. Here’s the Weather Underground forecast for Ulukhaktok, Crystal Serenity’s first port of call in the CAA:
There is currently a “small craft advisory” warning in effect for the Beaufort Sea coast:
CAPE HALKETT TO FLAXMAN ISLAND-
207 PM AKDT MON AUG 29 2016
…SMALL CRAFT ADVISORY IN EFFECT FROM TUESDAY MORNING THROUGH
TUESDAY AFTERNOON…
TONIGHT
E WINDS 20 KT. SEAS BUILDING TO 4 FT.
TUE
E WINDS 25 KT. SEAS 5 FT.
TUE NIGHT
E WINDS 20 KT. SEAS 6 FT.
WED
E WINDS 20 KT. SEAS 6 FT.
WED NIGHT
E WINDS 20 KT. SEAS 5 FT.
THU
NE WINDS 20 KT. SEAS 4 FT.
THU NIGHT
NE WINDS 15 KT. SEAS 4 FT.
FRI
N WINDS 10 KT. SEAS 2 FT.
SAT
N WINDS 15 KT. SEAS 3 FT.
All in all it looks like fairly plain sailing for the foreseeable future, with only occasional moderate headwinds to contend with.
[Edit – August 30th]
It seems my “fairly plain sailing” conclusion was overly hasty. According to the latest “Ship’s Log“:
The weather forecast is pants. A 30/35 knot headwind along the coast . No one has the appetite for it, so we are heading North, slacker winds, staysail out, still a choppy sea and uncomfortable, but not as bad as 30 knots. Hopefully no ice tonight on my watch.
This is the end result:
As Phil points out below:
Our next stop along the North West Passage is Tuktoyaktuk. That’s when we can use a pontoon, get rid of our rubbish, fill the tanks, do the laundry and have a shower. 500nm away.
[Edit – August 31st]
The Polar Ocean Challenge team report via Twitter:
They have some more to carry out in Tuk too. Despite the great “groove” displayed above Ben Edwards reports that:
Joy of joys, the auto-helm’s stopped working. Dad (Steve Edwards, crew), thinks he knows why so we’ll hopefully be able to fix it in Tuk. In the meantime we’re back to helming by hand. This is a mixed blessing, on the one hand it’s really irritating to have to helm in large swells and with a strong headwind because any movement you make is at first ignored, and then exaggerated by, the wind. So it’s hard to keep a decent track and it makes it harder to look out for ice. On the other hand, moving and putting effort into the steering keeps you warm which is nice and it means you don’t have to put as many clothes on which is also nice because when you go down stairs and it’s twenty four degrees it can get quite uncomfortable.
We all had our job lists, ice lights, bilge pumps, laundry, shopping but the man who gets the Vodka Salute is unquestionably Steve.
I dropped him off wth Willard. Two peas in a pod. They made a broken Pilot Spigot. That sounds quite easy but it took the whole day in a machine shop in a container, working to fine tolerances, and many modifications. Fitting it in the bowels of the Lazzerette in cold weather and driving rain. It worked first time. Brilliant effort.
Issued 07:00 AM MDT 04 September 2016
Today Tonight and Monday
Wind – Northwest 15 knots diminishing to light late this morning then becoming northwest 15 Monday morning.
Waves
Seas – 1 metre.
Weather & Visibility – Chance of showers changing to periods of rain near noon then to chance of showers tonight and Monday. Fog patches dissipating early this evening.
My famous last words? Plain sailing by the look of it!
[Edit – September 5th]
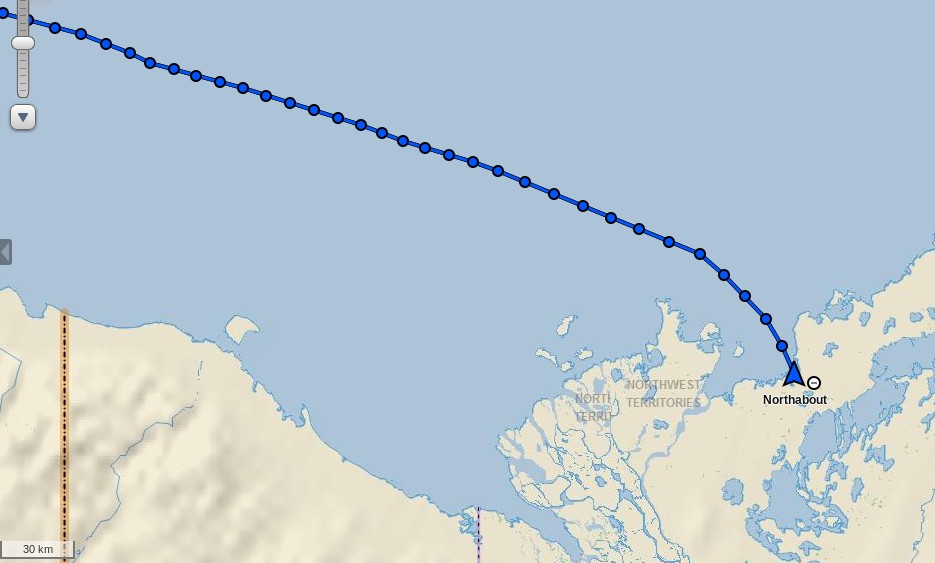
Northabout has just rounded Cape Bathurst, the northernmost point of mainland Northwest Territories:
I wonder if her crew will take a close look at the nearby Smoking Hills?
[Edit – September 6th]
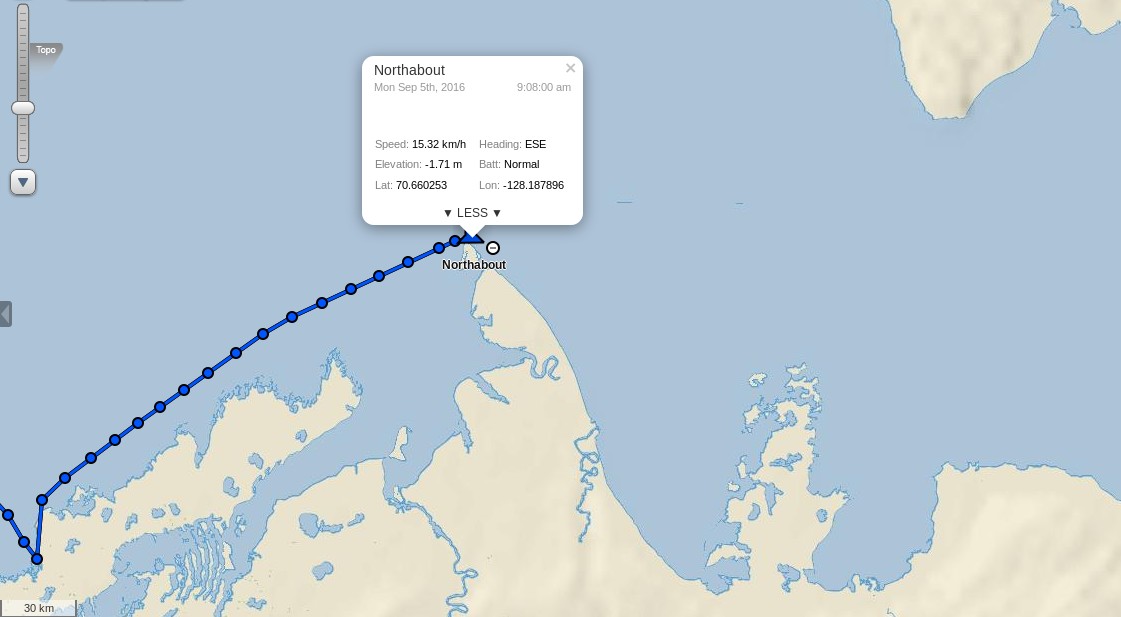
Northabout gave the Smoking Hills a miss and headed strait for Cape Parry. She has already crossed the Amundsen Gulf and is heading into the Dolphin & Union Strait:
In light of the lack of ice and in the spirit of saving time we’ve decided not to stop in Cambridge Bay or Pond Inlet and go straight on to Upernavik in Greenland before doing our crew change. Looking at the ice maps at the moment it seems we’ll be able to get through with little or no trouble, though this is almost bound to change, if it stays that way we’ll reach Upernavik in about fourteen days. I’m looking forward to it!
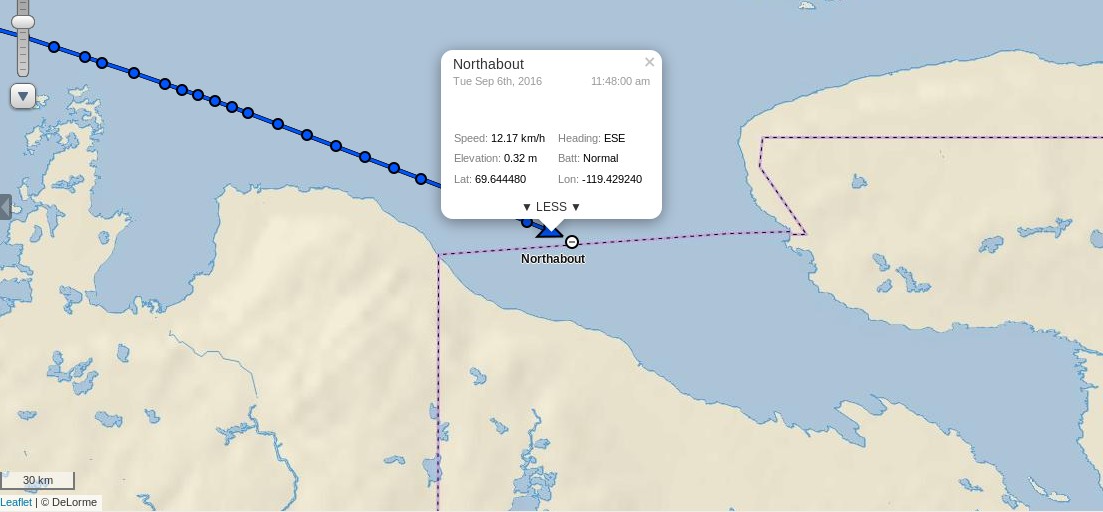
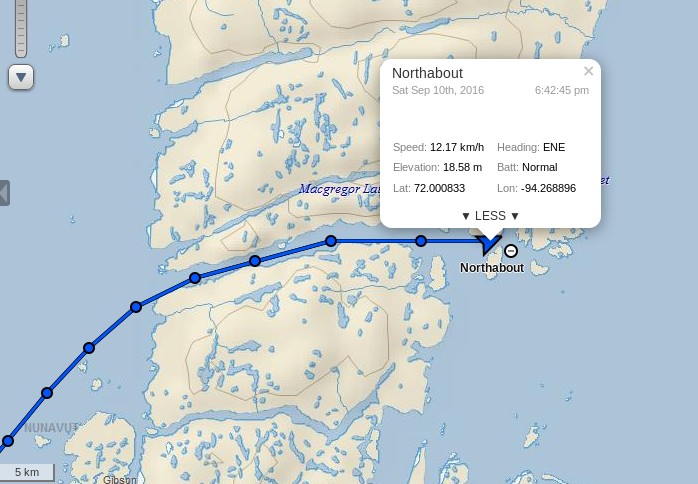
This morning Northabout is rapidly approaching the western entrance to Bellot Strait:
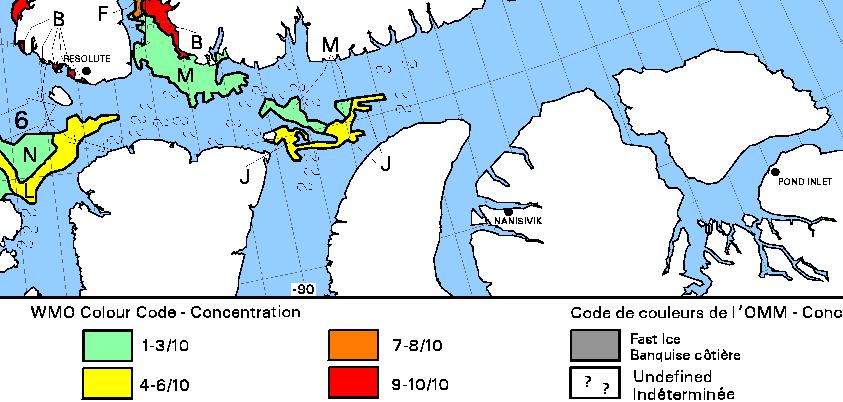
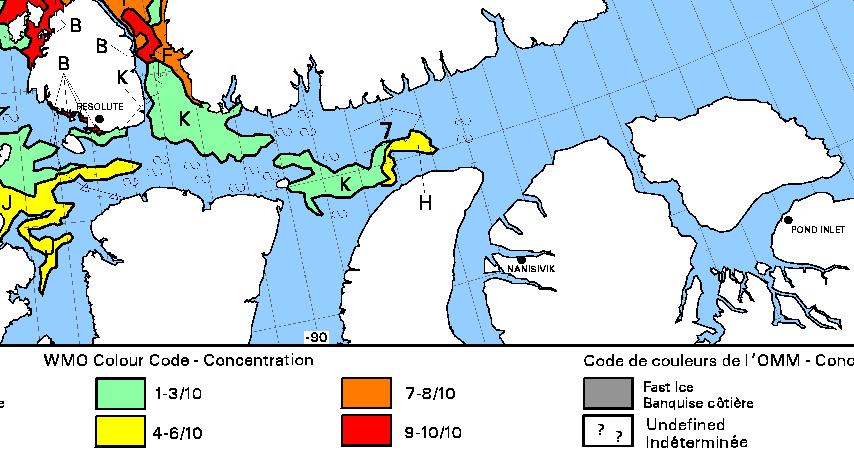
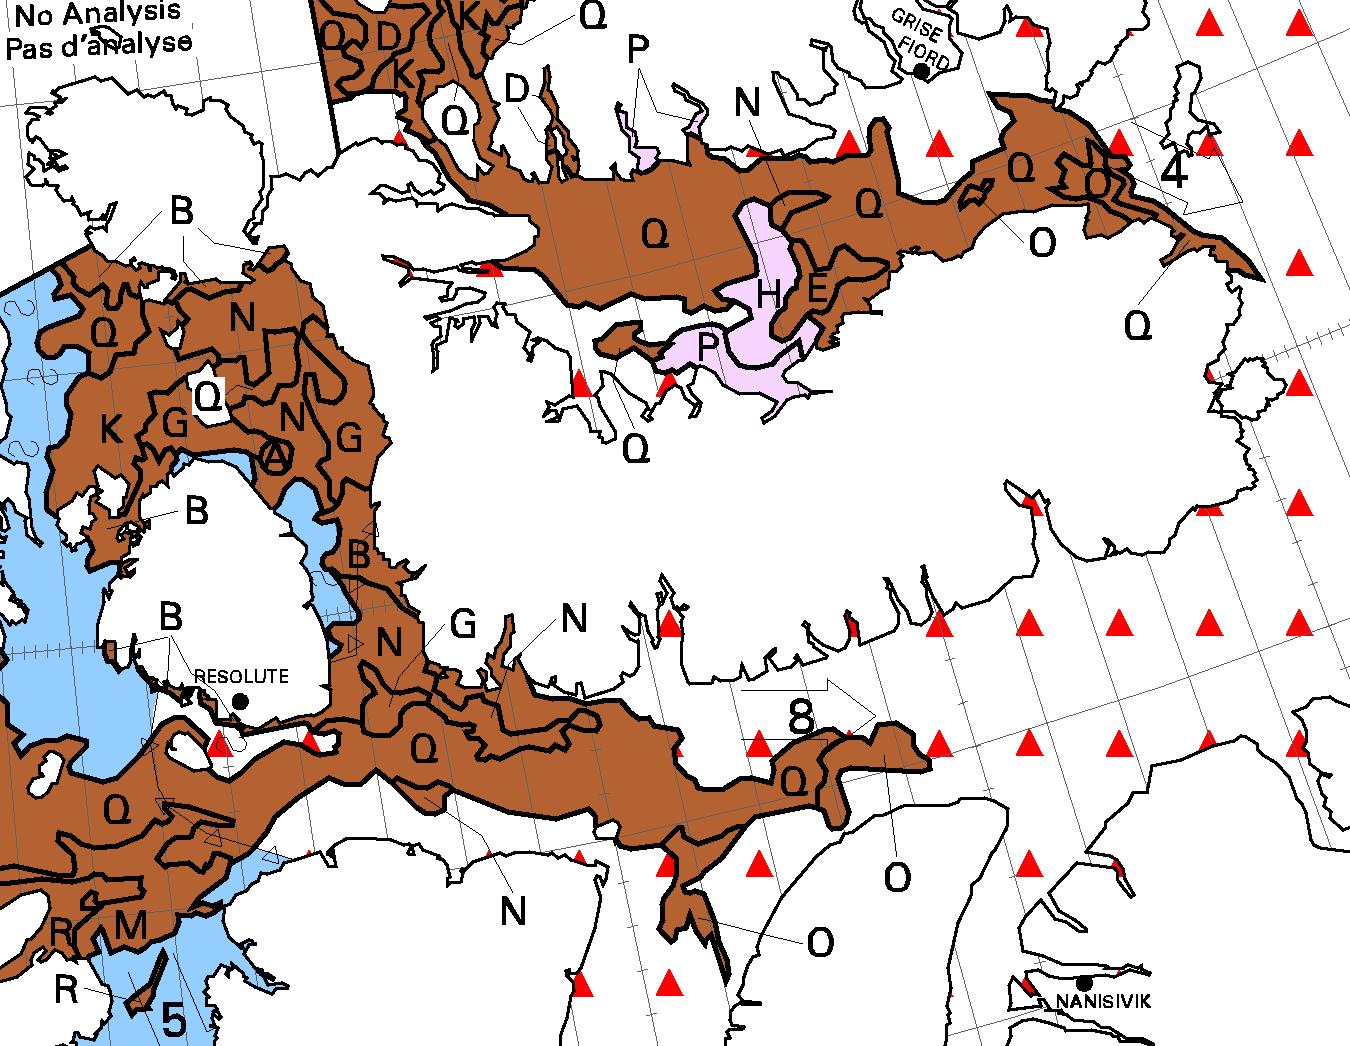
Their stated intentions are to head past Pond Inlet and across Baffin Bay to Upernavik in Greenland. Assuming they initially follow the same route as Crystal Serenity they will soon to need to pick their way past some bergy bits in Prince Regent Inlet before negotiating some currently “wispy” areas of sea ice as they enter Lancaster Sound. Here is the current Canadian Ice Service chart for the area:
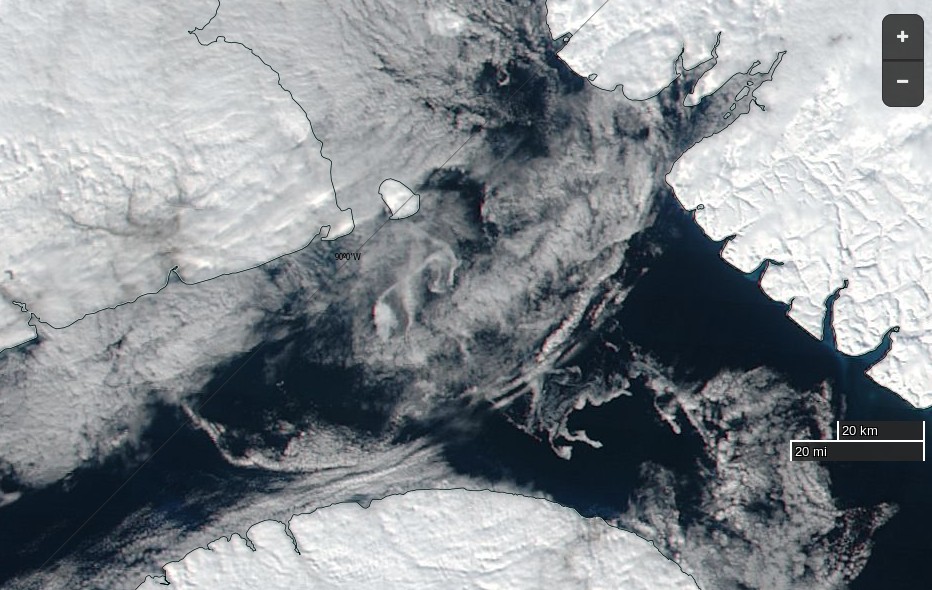
plus a rather cloudy “visual” image:
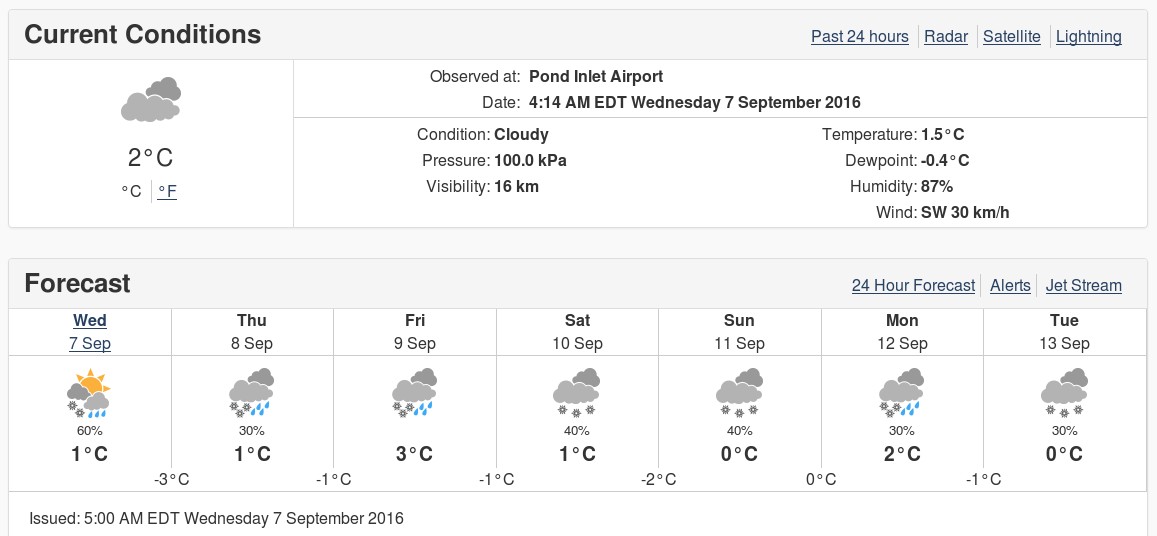
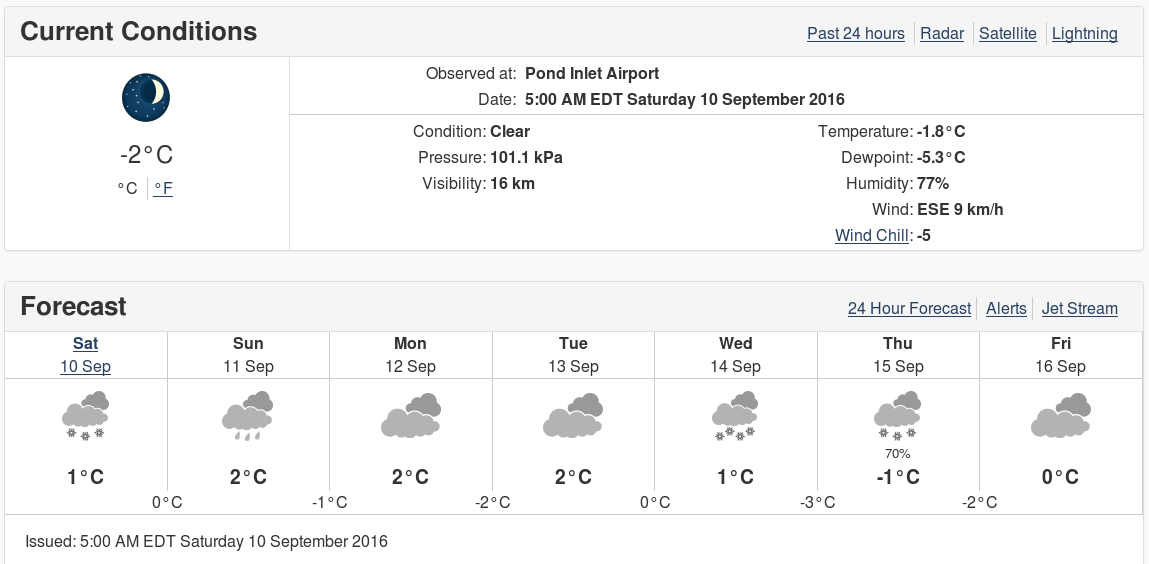
The current weather forecast for Pond Inlet doesn’t suggest the parts of the Northwest Passage still on Northabout’s route are going to start refreezing just yet:
Currently there is an obvious passage past the existing ice, but that may of course have changed by the time Northabout gets there.
[Edit – September 10th PM]
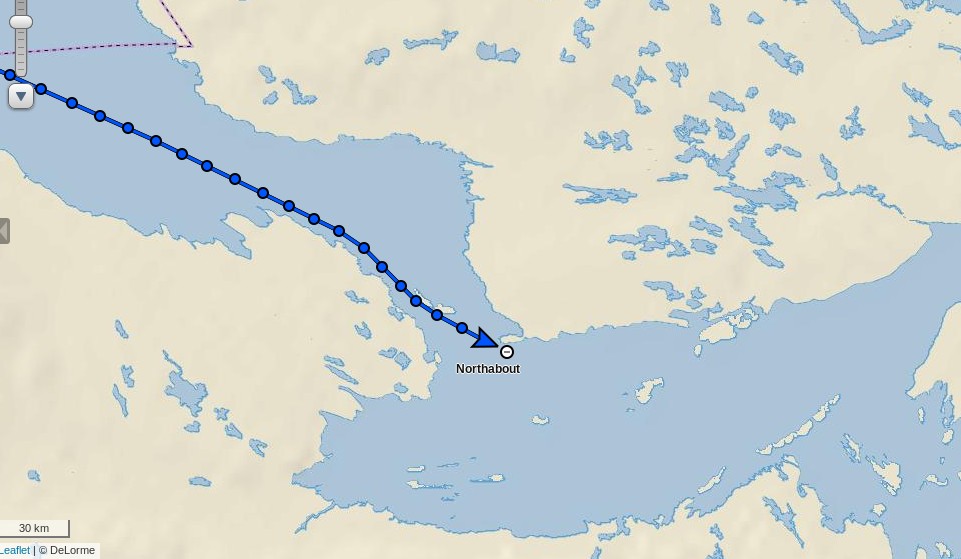
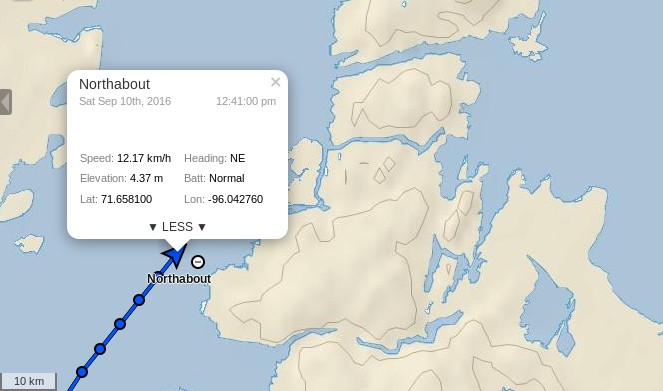
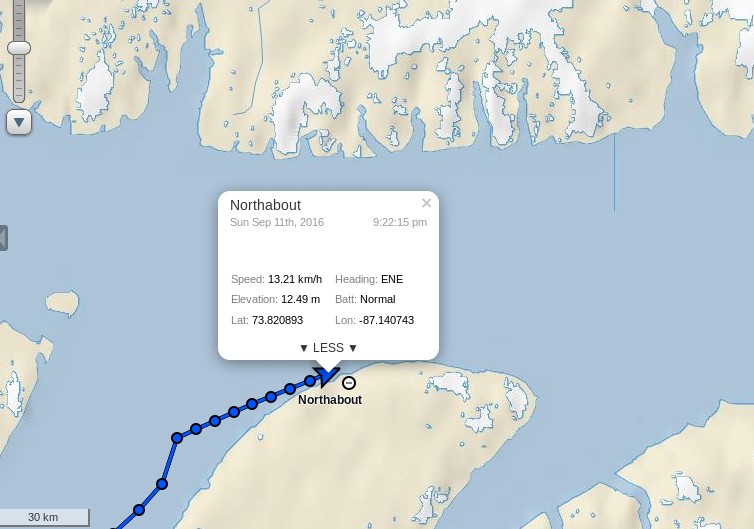
Northabout has just emerged safely from the eastern end of Bellot Strait:
I wonder if her crew will stop to make a new entry in the visitors book at Fort Ross?
[Edit – September 11th]
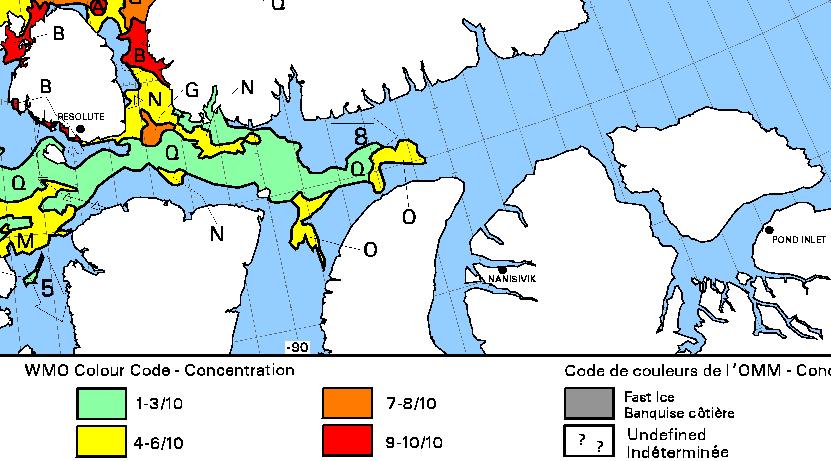
Here’s the latest CIS ice chart:
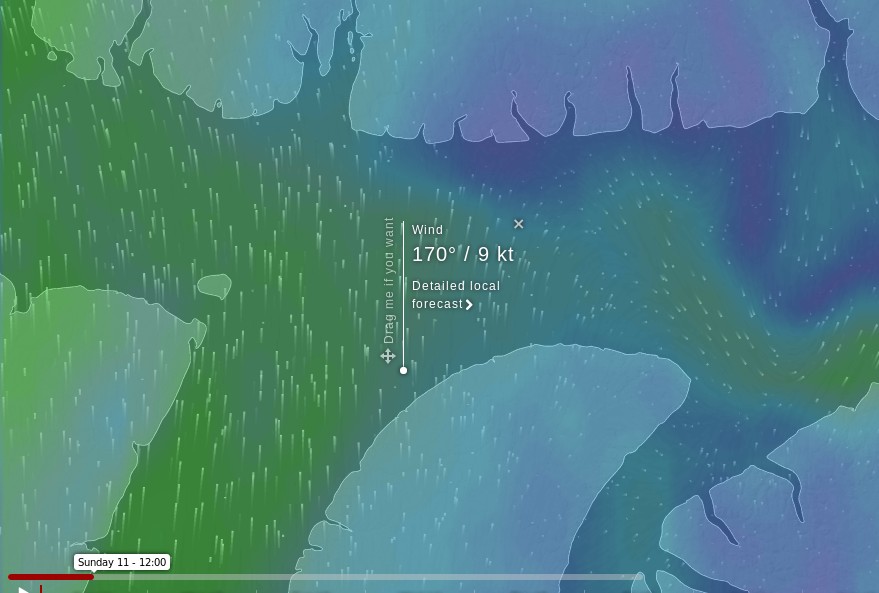
The gap between the coast and the yellow area of 4-6/10 concentration ice has closed considerably, and there’s now a broad expanse of 1-3/10 ice which Northabout may be forced to try and wend her way through. A change in wind direction would come in very handy, and that’s just what the ECMWF forecast at Windyty is suggesting for Sunday 11th:
Just what the doctor ordered?
[Edit – September 11th PM]
Video shot from Northabout’s drone of her ice-free passage through Bellot Strait:
However the passage from Prince Regent Inlet into Lancaster Sound has not proved to be ice-free!
Northabout is obviously endeavouring to skirt around the eastern edge of the 4-6/10 old ice in her path:
Today’s CIS ice concentration chart suggests there isn’t much room to spare:
The stage of development chart does reveal some new ice, but it’s well to the north of Northabout’s route through Lancaster Sound to Pond Inlet:
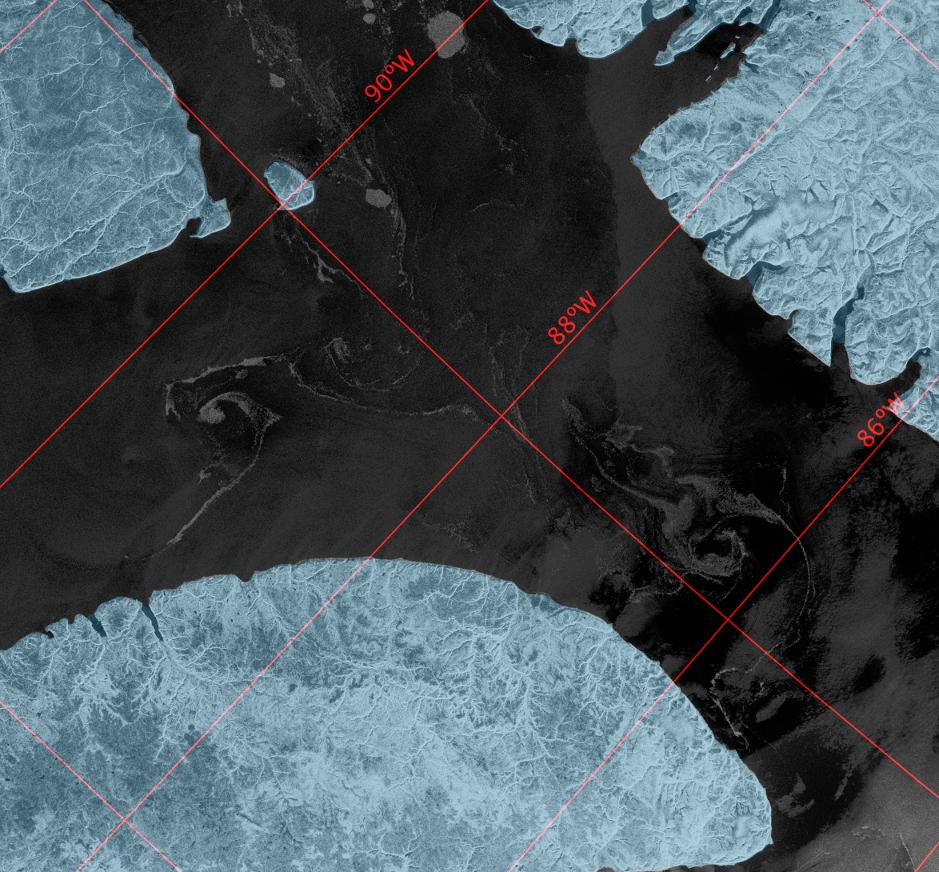
Somewhat belatedly, here’s a Sentinel 1A synthetic aperture radar image of the sea ice Northabout is squeezing past as we speak:
[Edit – September 12th]
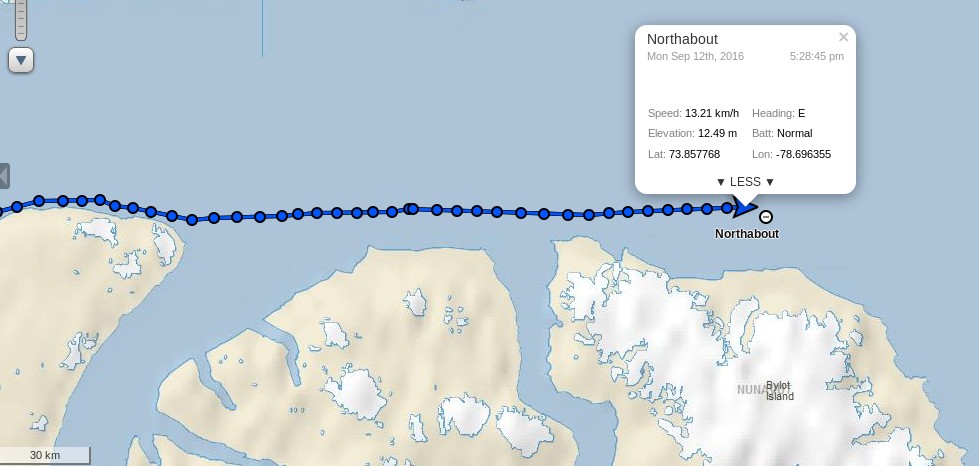
Northabout has emerged safely into Lancaster Sound, and is bypassing Pond Inlet in order to head strait across Baffin Bay:
Here are a couple of videos of some remnants of sea ice on her once again eastward travels:
There are several more on the Polar Ocean Challenge web site.
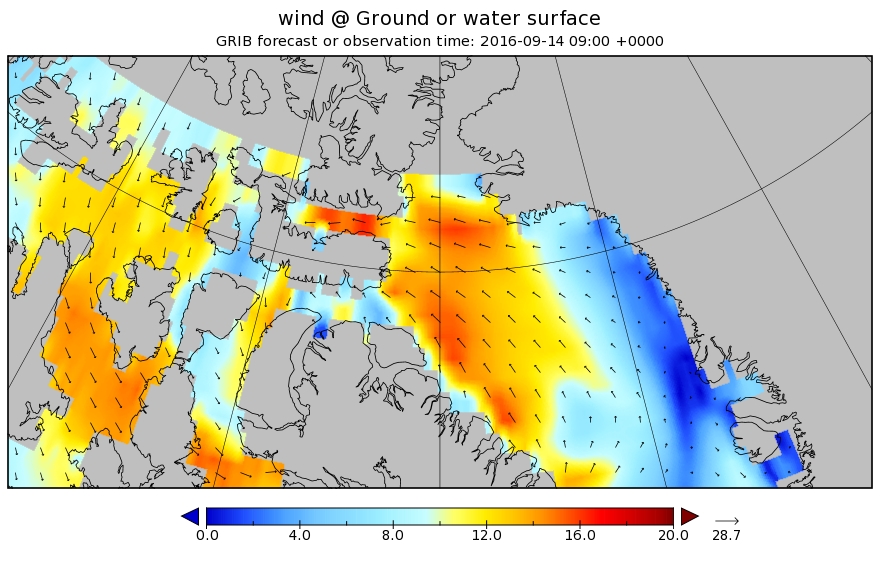
With all that ice now safely behind her Northabout has new dangers to face. Wind and waves! Let’s take a look at the WaveWatch III “surf forecast” for Baffin Bay over the next few days. A low pressure area is heading in Northabout’s direction from across the Canadian Arctic Archipelago. By Wednesday morning (UTC) the resultant wind field looks like this:
By Wednesday afternoon those winds of around 15 m/s will have produced waves in Baffin Bay that are forecast to have reached over 3 meters high:
and what’s more they won’t be just wind waves. A modest swell with a period of over 12 seconds is predicted too:
I’m sure the Polar Ocean Challenge team will be doing their level best to be safely on the opposite side of Baffin Bay by the time the worst of the weather arrives!
A storm is brewing in the Arctic. A big one! The crew of the yacht Northabout are currently sailing along the western shore of the Laptev Sea and reported earlier today that:
The sea is calm. Tomorrow a gale 8. But this moment is perfect.
That perfect moment will not last long. Here is the current ECMWF forecast for midnight tomorrow:
and here is the current Arctic surf forecast for 06:00 UTC on Monday:
A 975 hPa low pressure system will be creating 3 meter waves with a period of around 8 seconds heading across the East Siberian Sea in the direction of the ice edge. By midnight on Monday the cyclone is forecast to have deepened to a central pressure below 970 hPa:
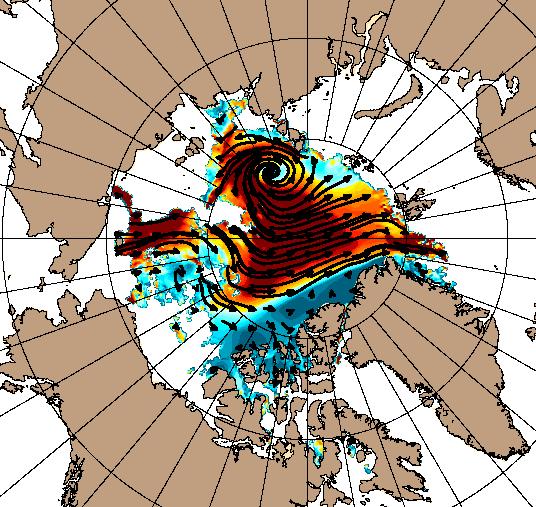
All of this is rather reminiscent of the “Great Arctic Cyclone” in the summer of 2012, which looked like this on August 7th:
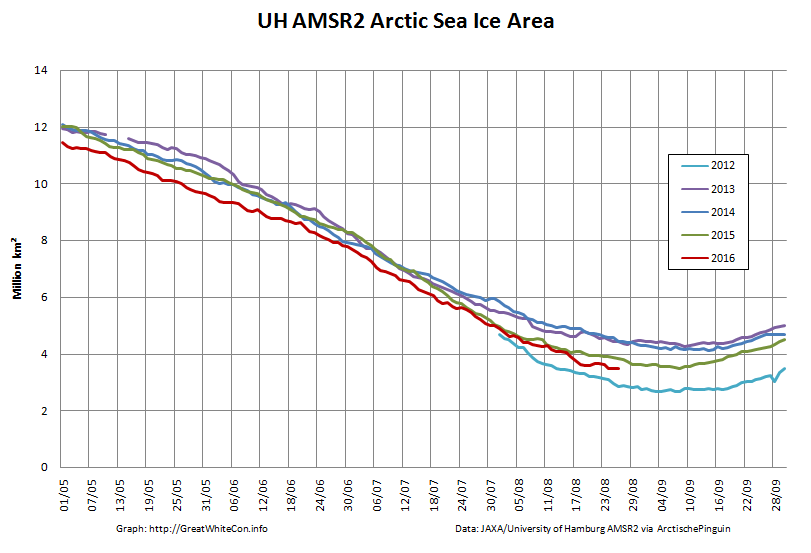
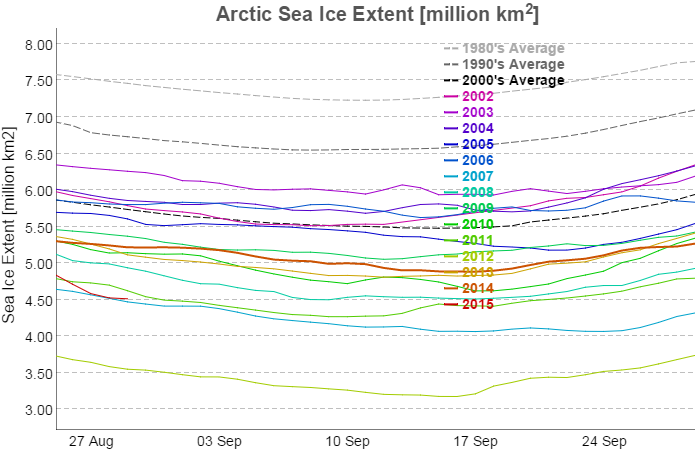
and which ultimately led to the lowest Arctic sea ice extent in the satellite record. Using the National Snow and Ice Data Center’s numbers that was 3.41 million square kilometers on September 16th 2012. Here’s the NSIDC’s current graph comparing 2012 with this year:
I wonder what the minimum for 2016 will be, and on what date?
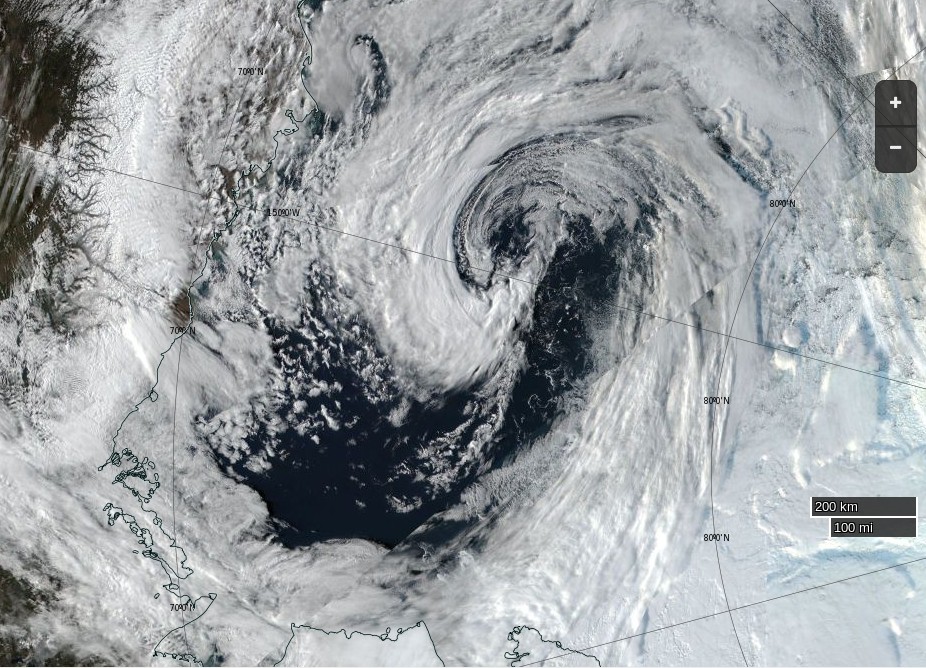
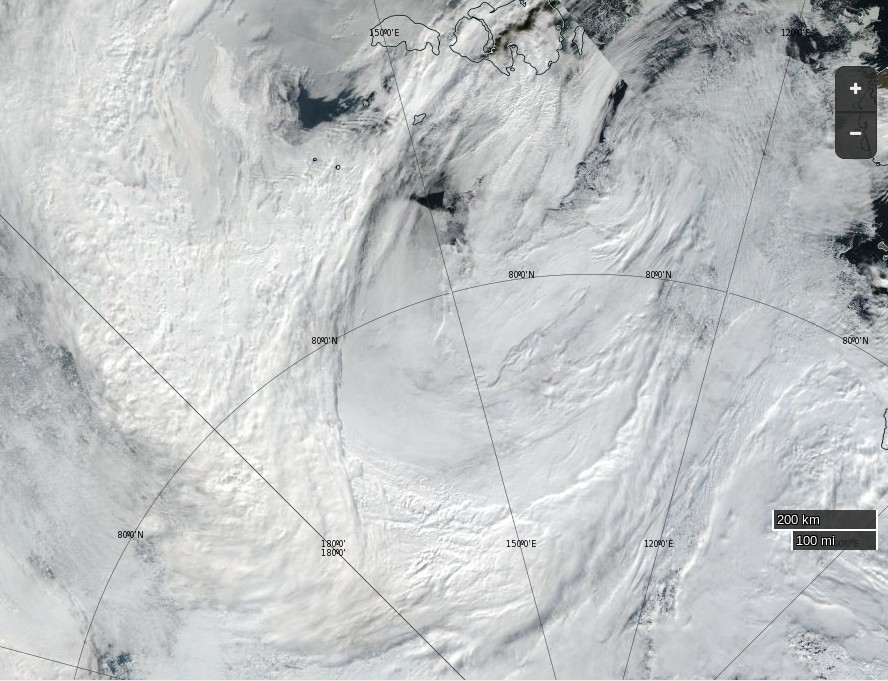
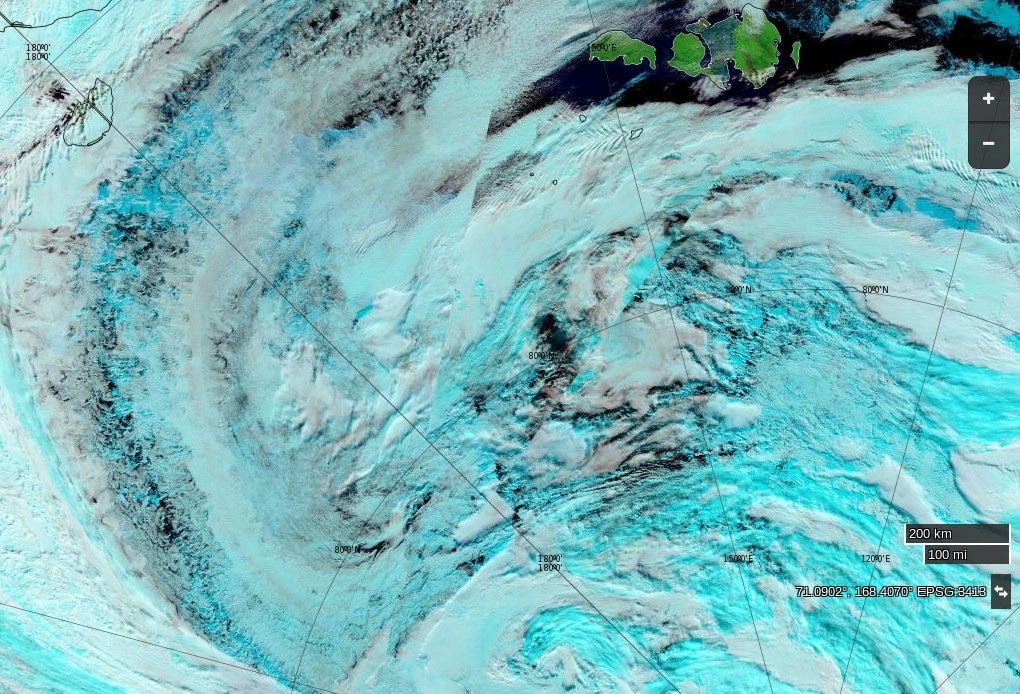
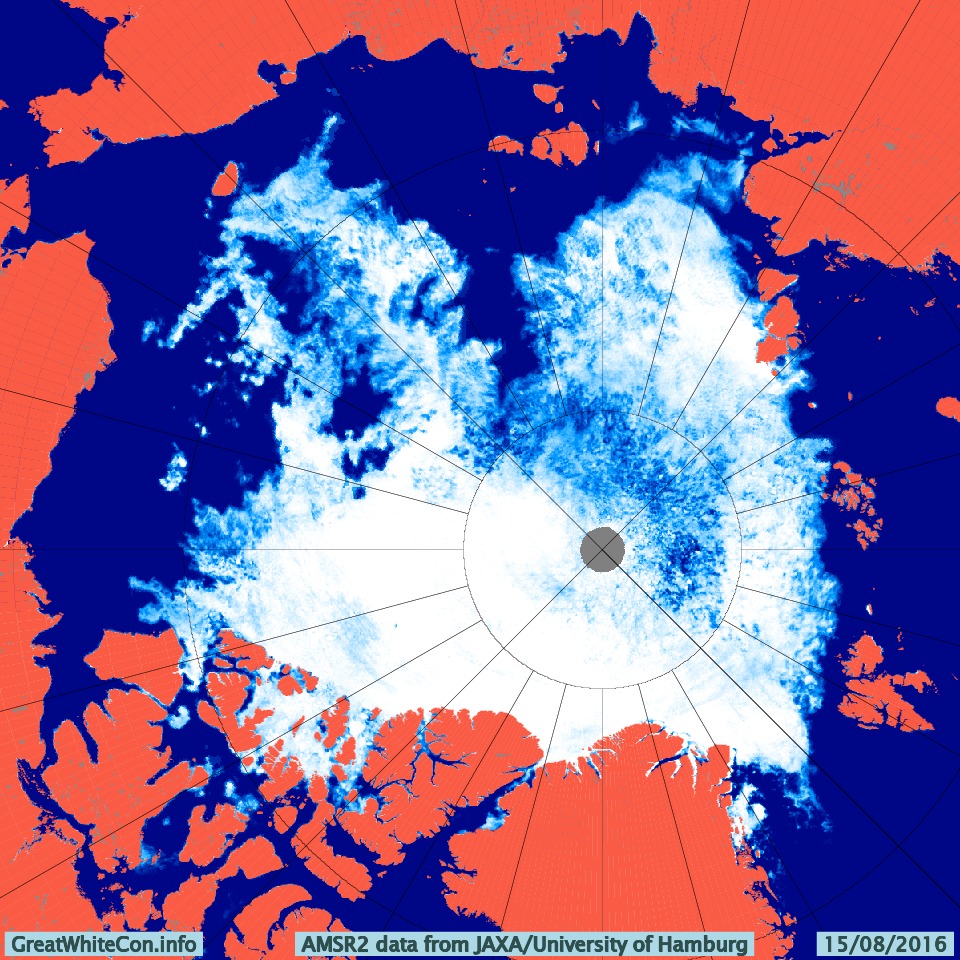
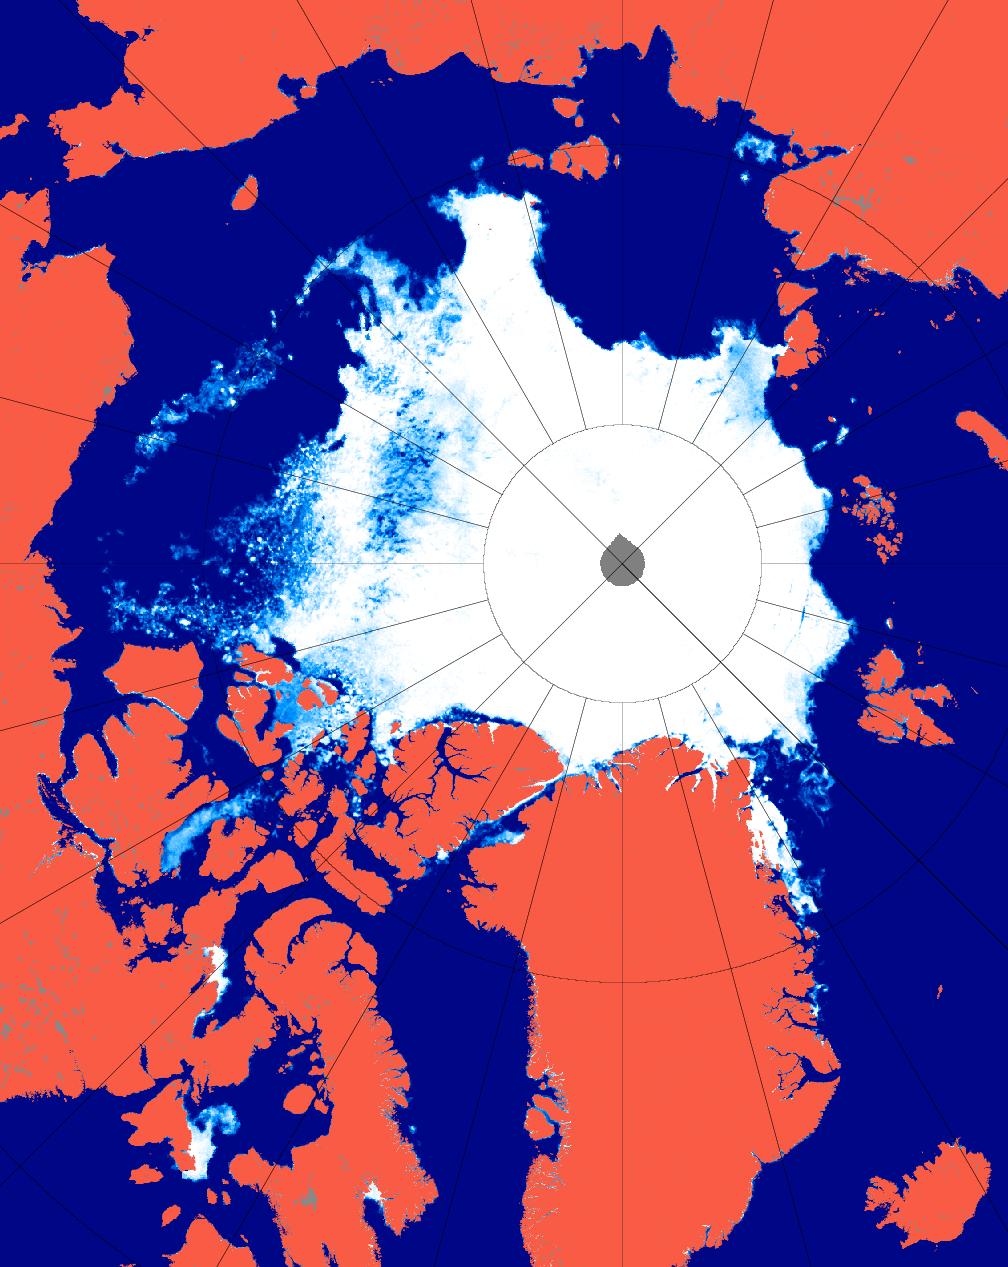
Here’s how the Great Arctic Cyclone of 2016 looks from on high this morning:
NASA Worldview “true-color” image of the ‘Great Arctic Cyclone’ on August 15th 2016, derived from the VIIRS sensor on the Suomi satellite
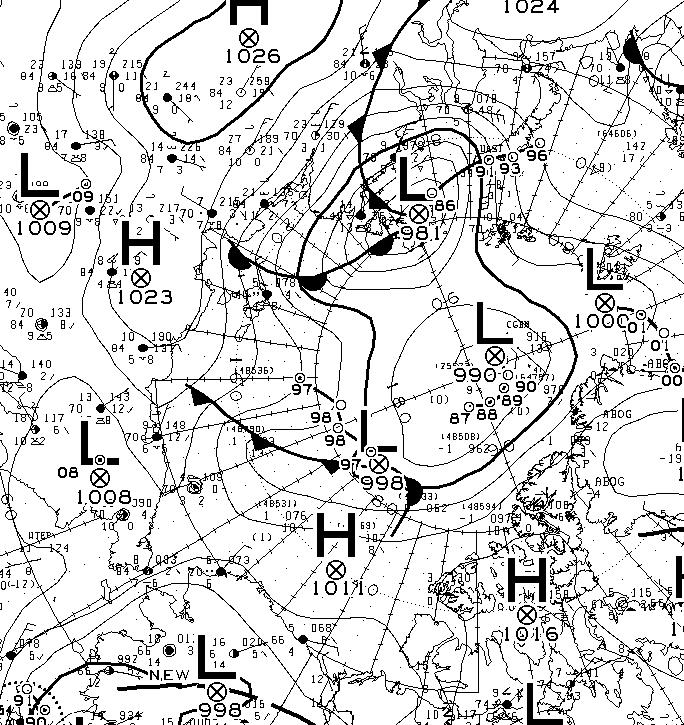
The latest synopsis from Environment Canada shows that the central pressure of the cyclone is now down to 974 hPa:
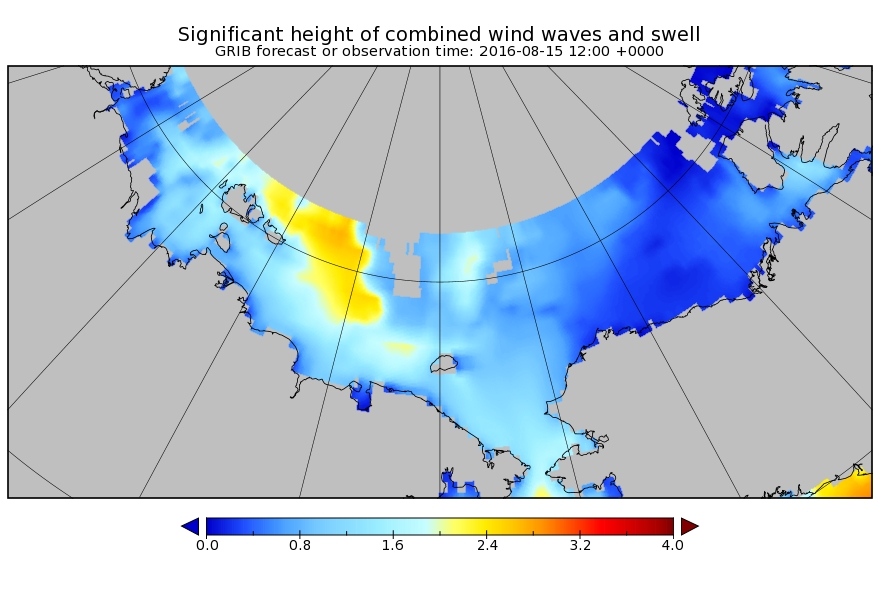
The WaveWatch III forecast for noon today UTC confirms the forecast of two days ago:
P.S. The Canadian 0600Z synopsis has the cyclone’s SLP down to 971 hPa:
[Edit – August 16th]
This morning the cyclone’s SLP is down to 969 hPa:
and the clouds over the Central Arctic are parting:
NASA Worldview “false-color” image of the Arctic Basin on August 16th 2016, derived from the MODIS sensor on the Terra satellite
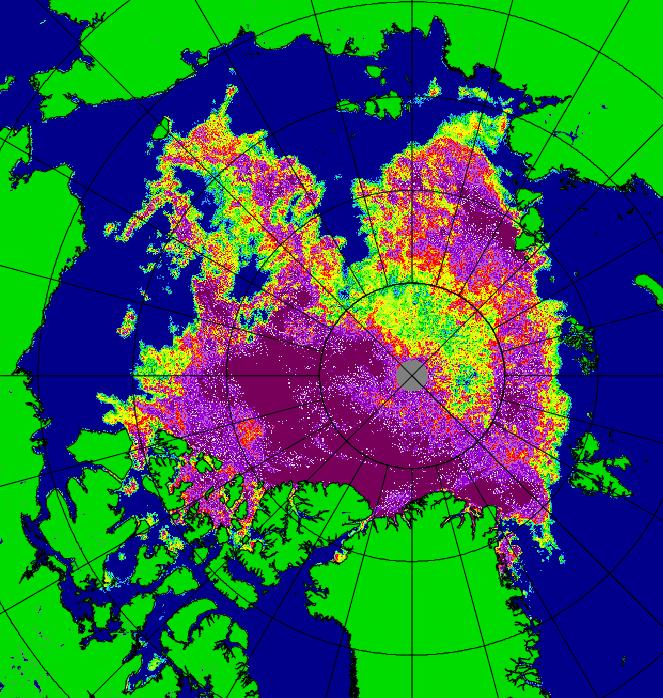
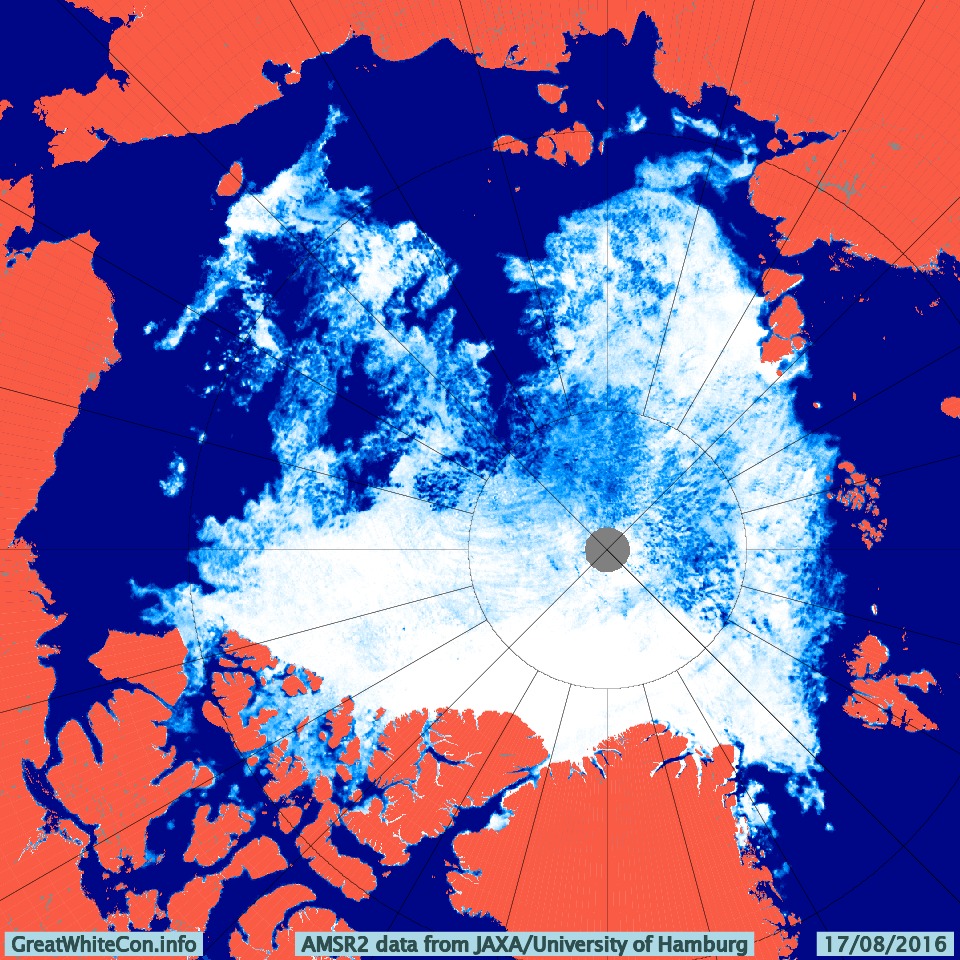
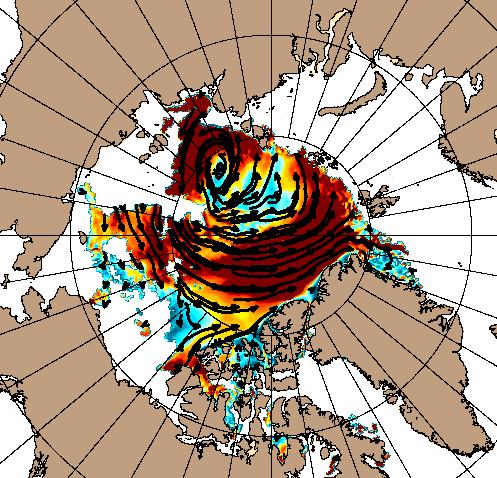
Our favourite method of seeing through the clouds using the AMSR2 maps from the University of Hamburg doesn’t seem to working at the moment, so here’s one from the University of Bremen instead:
The cyclone central pressure is now up to 983 hPa, and some indications of the effect it has had on the sea ice in the Arctic are being revealed:
[Edit – August 19th]
According to Environment Canada the cyclone’s central pressure rose to 985 hPa earlier today:
However the 987 hPa low near the Canadian Arctic Archipelago is currently forecast to deepen below 980 hPa over the next 24 hours. Here’s the ECMWF forecast for first thing tomorrow morning:
The high resolution AMSR2 Arctic sea ice area has reduced by another 133.5 thousand square kilometers since yesterday. A similar drop tomorrow will take us below the 2015 minimum.
[Edit – August 19th PM]
The MSLP of the rejuvenated cyclone had dropped to 976 hPa by 12:00 UTC today:
The ECMWF forecast for lunchtime tomorrow is for something similar:
[Edit – August 20th]
The current incarnation of the cyclone bottomed out at 971 hPa near the Canadian Arctic Archipelago:
The 72 hour forecast from ECMWF for the next phase of GAC 2016 is beginning to enter the realms of plausibility. Here’s what it reveals:
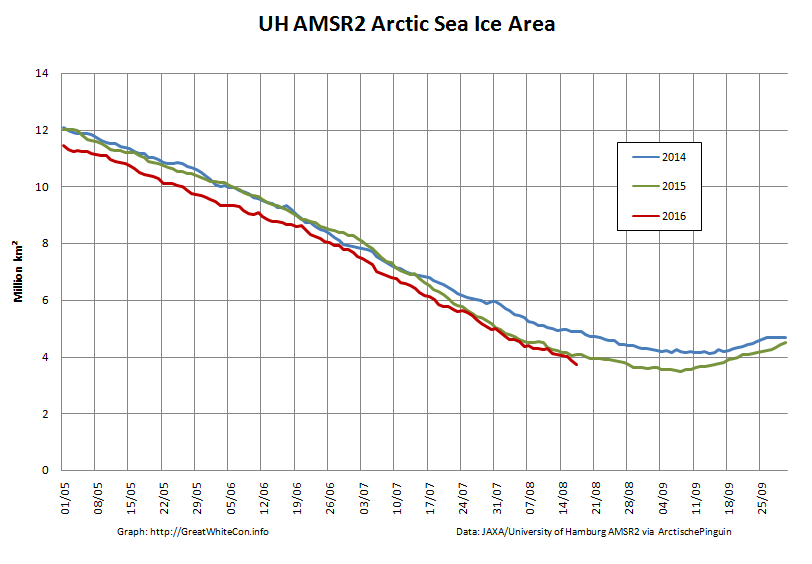
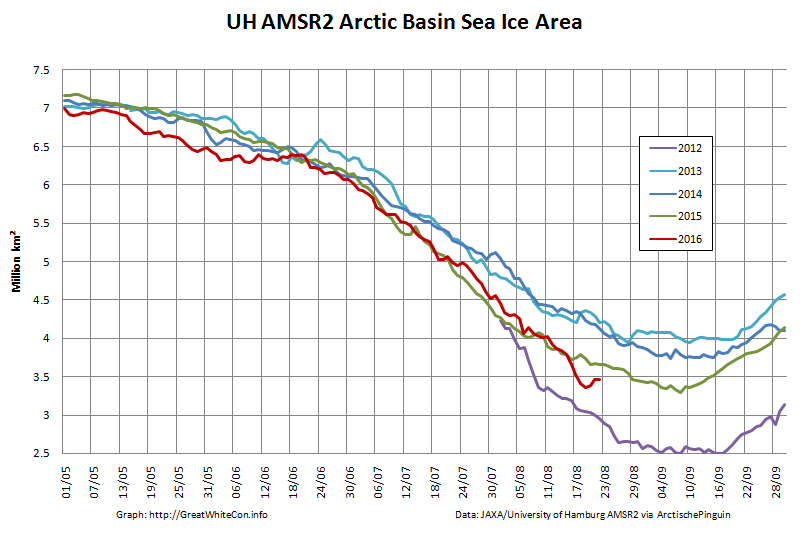
The University of Hamburg have been processing more AMSR2 data from 2012. You can argue until the cows come home about which is the best metric to peruse at this time of year, but try this one for size:
That’s the high resolution AMSR2 sea ice area for the Arctic Basin, comprising the CAB plus Beaufort, Chukchi, East Siberian and Laptev Seas.
[Edit – August 25th]
There’s a bit of a gap in the clouds over the Central Arctic today:
NASA Worldview “true-color” image of the Central Arctic Basin on August 25th 2016, derived from the MODIS sensor on the Terra satellite
This is merely the calm before the next storm. Here is the current ECMWF forecast for Saturday lunchtime (UTC):
Low pressure on the Siberian side of the Arctic and high pressure on the Canadian side producing an impressive dipole with lots of sea ice “drift” towards the Atlantic:
[Edit – August 27th]
Saturday morning has arrived, and so has the predicted storm. As the centre of the cyclone crossed the coast of the East Siberian Sea its central pressure had fallen to 967 hPa, whilst the high pressure over Alaska had risen to 1028 hPa:
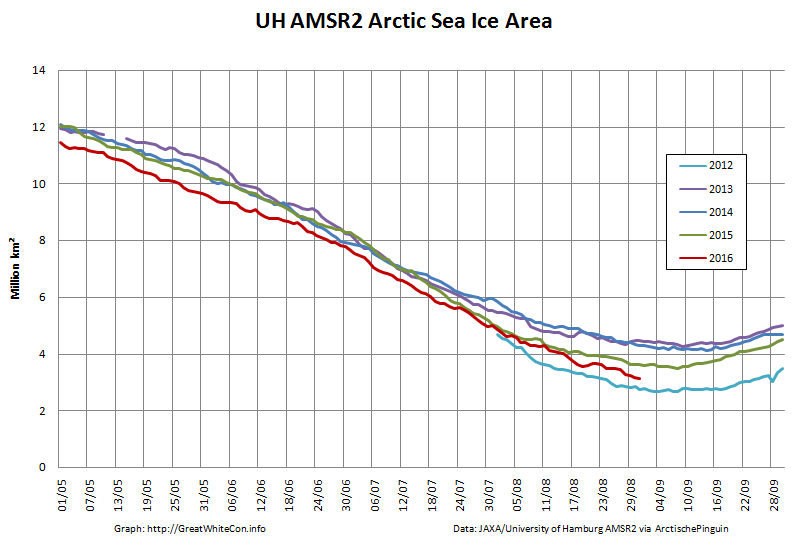
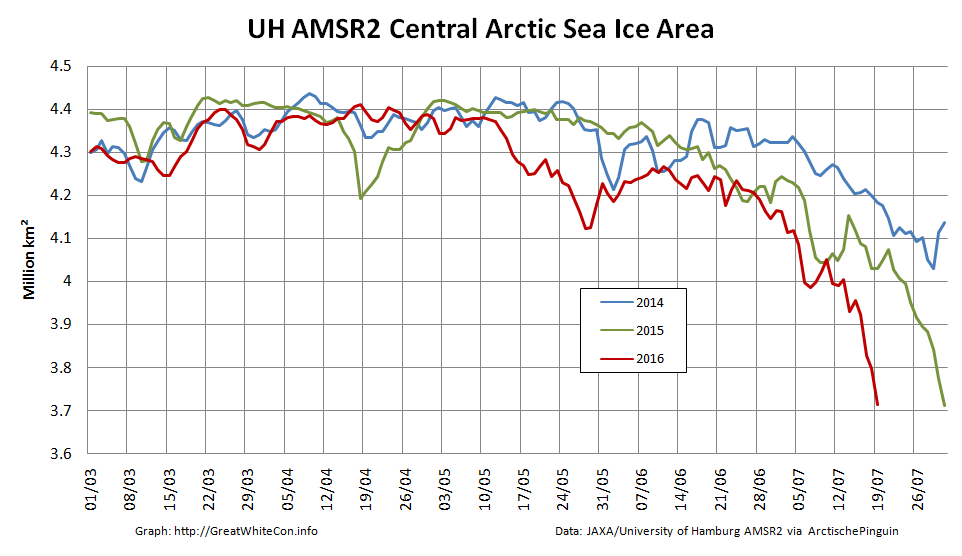
The effect of the earlier bursts of high wind is apparent in the high resolution AMSR2 sea ice area graph:
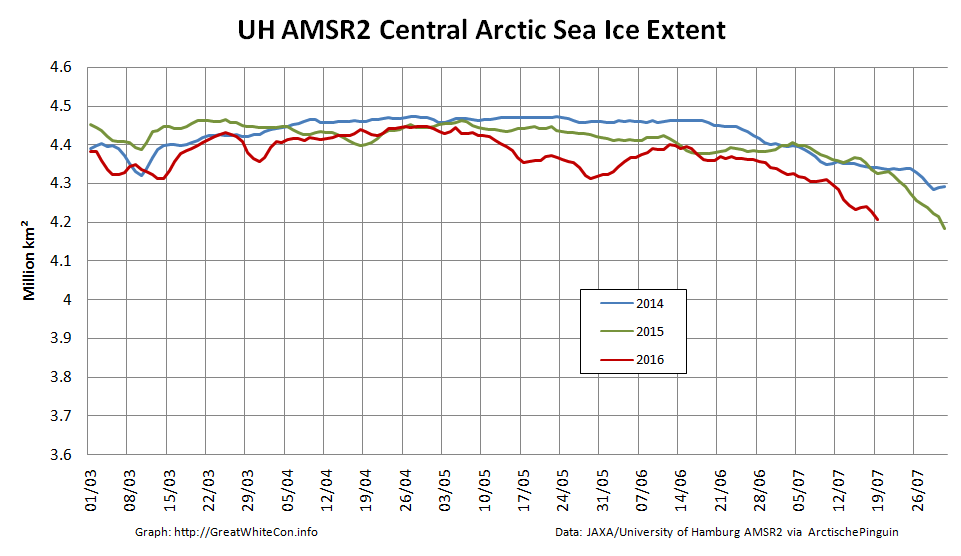
However they are not as apparent in the corresponding extent graph:
[Edit – August 28th]
As the centre of the cyclone heads for the North Pole the isobars are tightening across the last refuge of multi-year sea ice north of the Canadian Arctic Archipelago and Greenland:
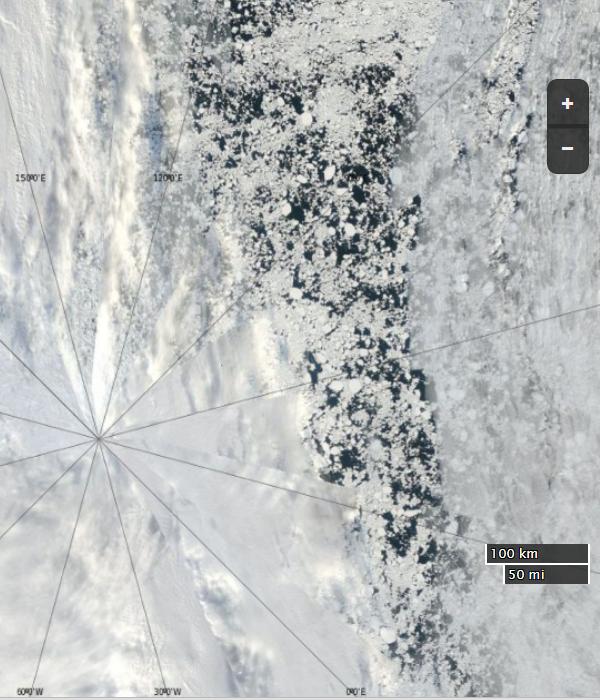
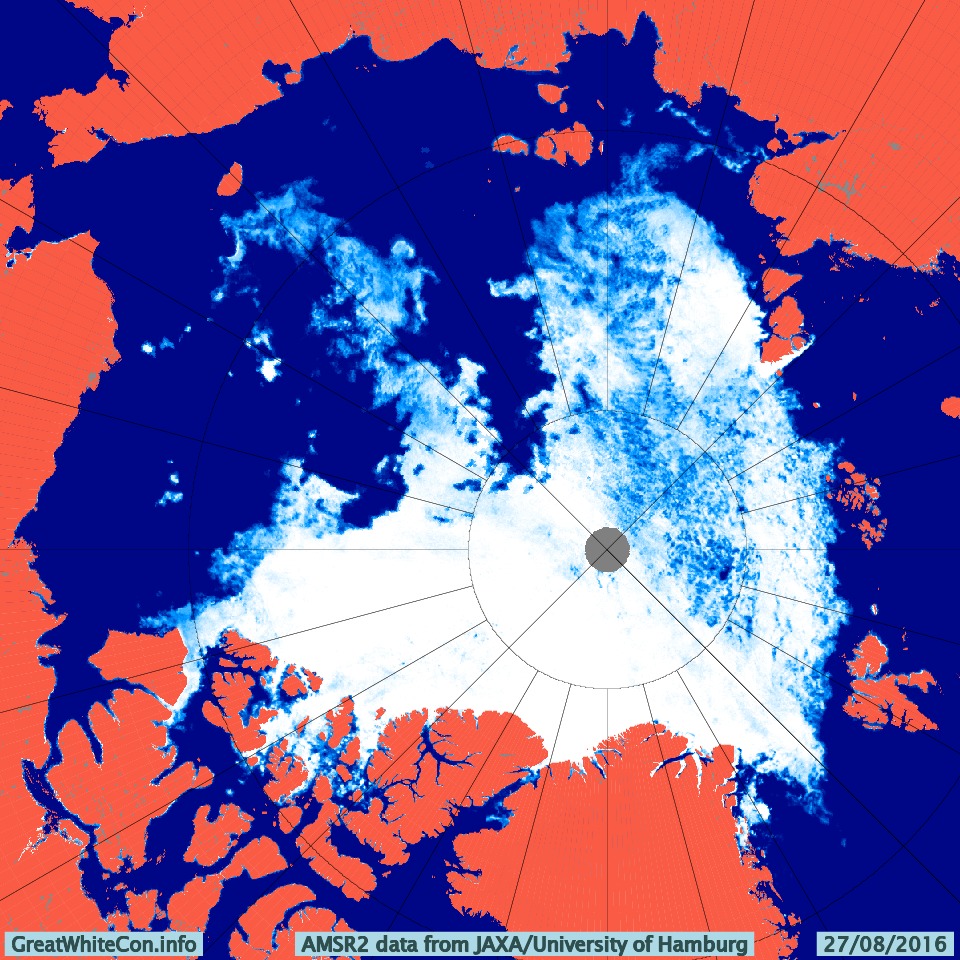
The area north of the East Siberian Sea that was predicted to bear the brunt of the wind and waves overnight is still covered in cloud. However the latest AMSR2 update from the University of Hamburg suggests that open water now stretches as far as 86 degrees north:
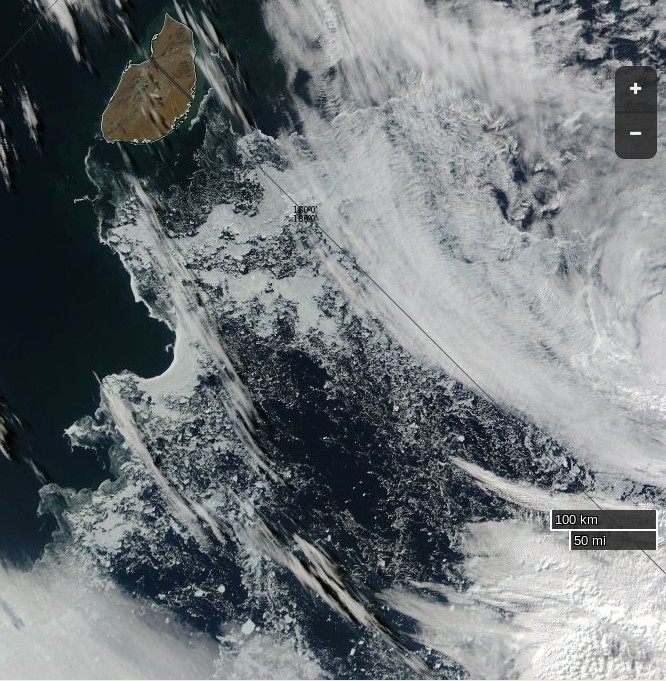
The skies over the northern Chukchi Sea have cleared to reveal this:
NASA Worldview “true-color” image of the northern Chukchi Sea on August 28th 2016, derived from the MODIS sensor on the Aqua satellite
[Edit – August 29th]
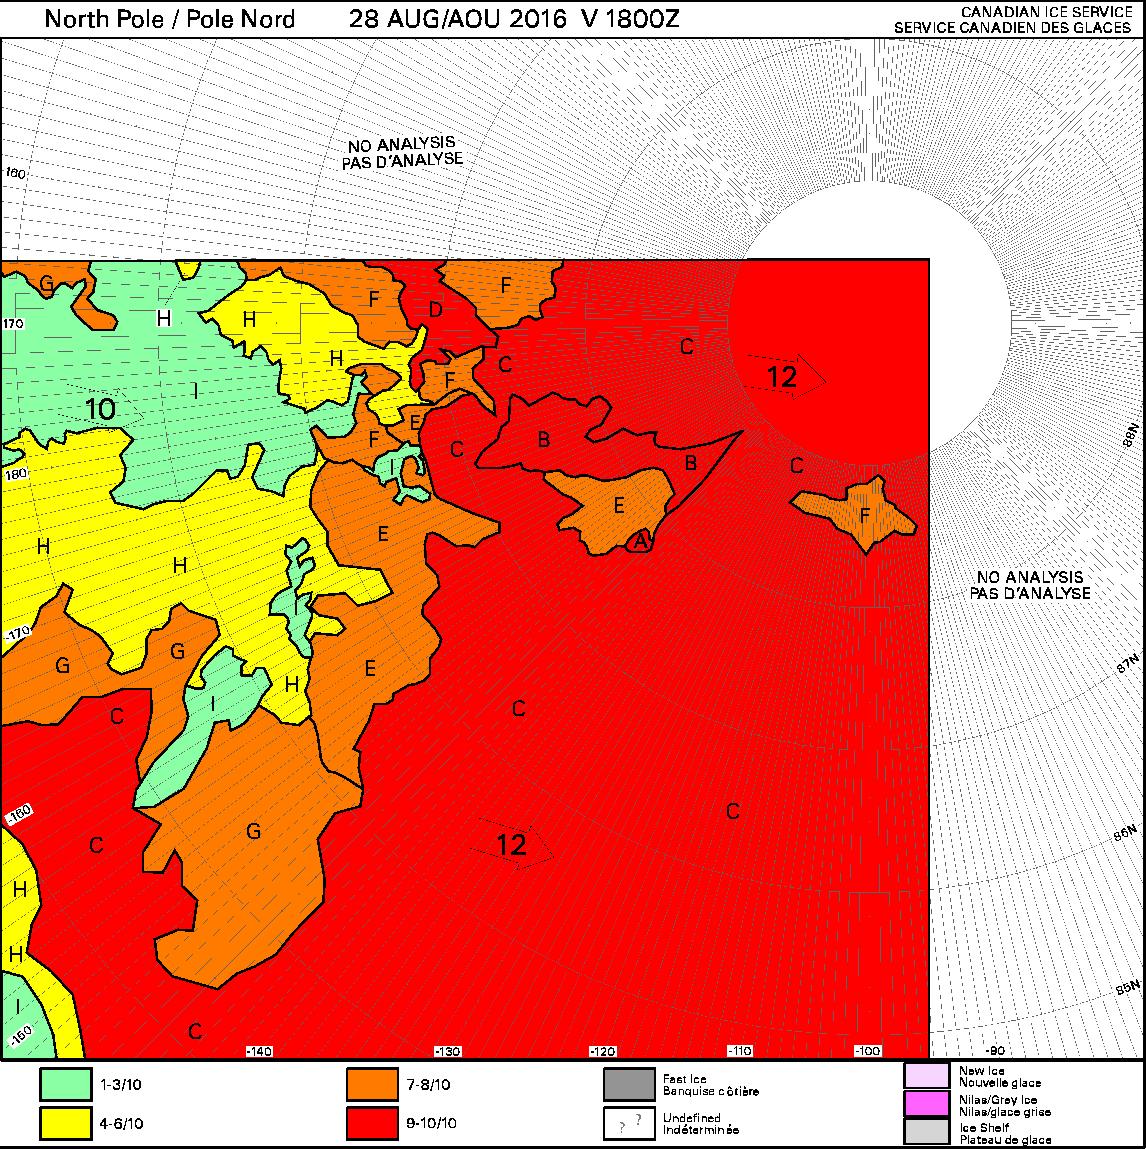
Some of the effects of the recent high winds can be judged by this Canadian Ice Service chart of ice concentration near the North Pole:
[Edit – September 1st]
Arctic sea ice area continues to fall quickly for the time of year:
The recent dipole has finally caused some compaction of the scattered sea ice. Hence the high resolution AMSR2 extent is following suit and is now below last year’s minimum:
It looks like a storm is brewing in the Arctic. The long range weather forecasts for the Arctic have been remarkably unreliable recently, but this one is for a mere three days from now. WaveWatch III suggests there will be some significant waves in the Chukchi and Beaufort Seas this coming weekend, travelling in the direction of the ice edge:
WaveWatch III wave height forecast for July 17thWaveWatch III wave period forecast for July 17thWaveWatch III wind forecast for July 17th
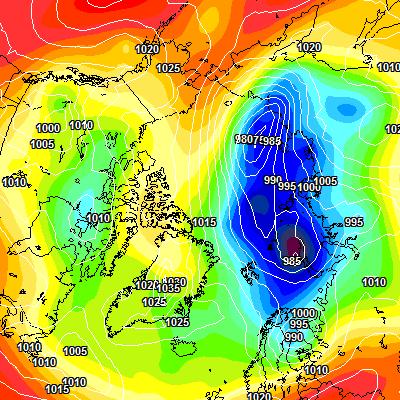
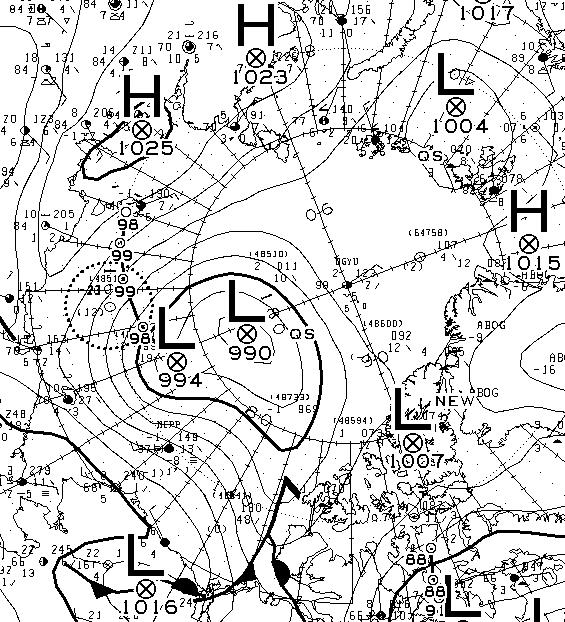
Another day has dawned, and the Environment Canada synoptic chart shows that the low pressure system currently over the Arctic has reached a central pressure of 990 hPa:
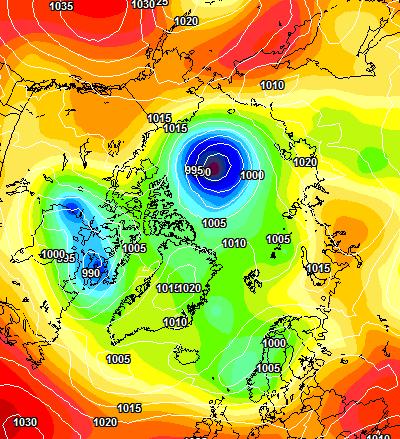
The latest ECMWF SLP forecast for tomorrow is firming up:
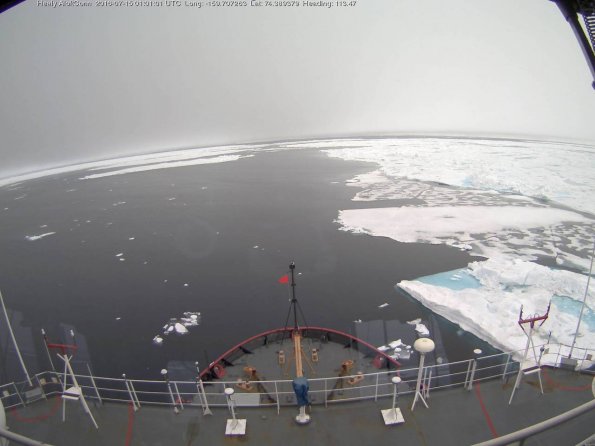
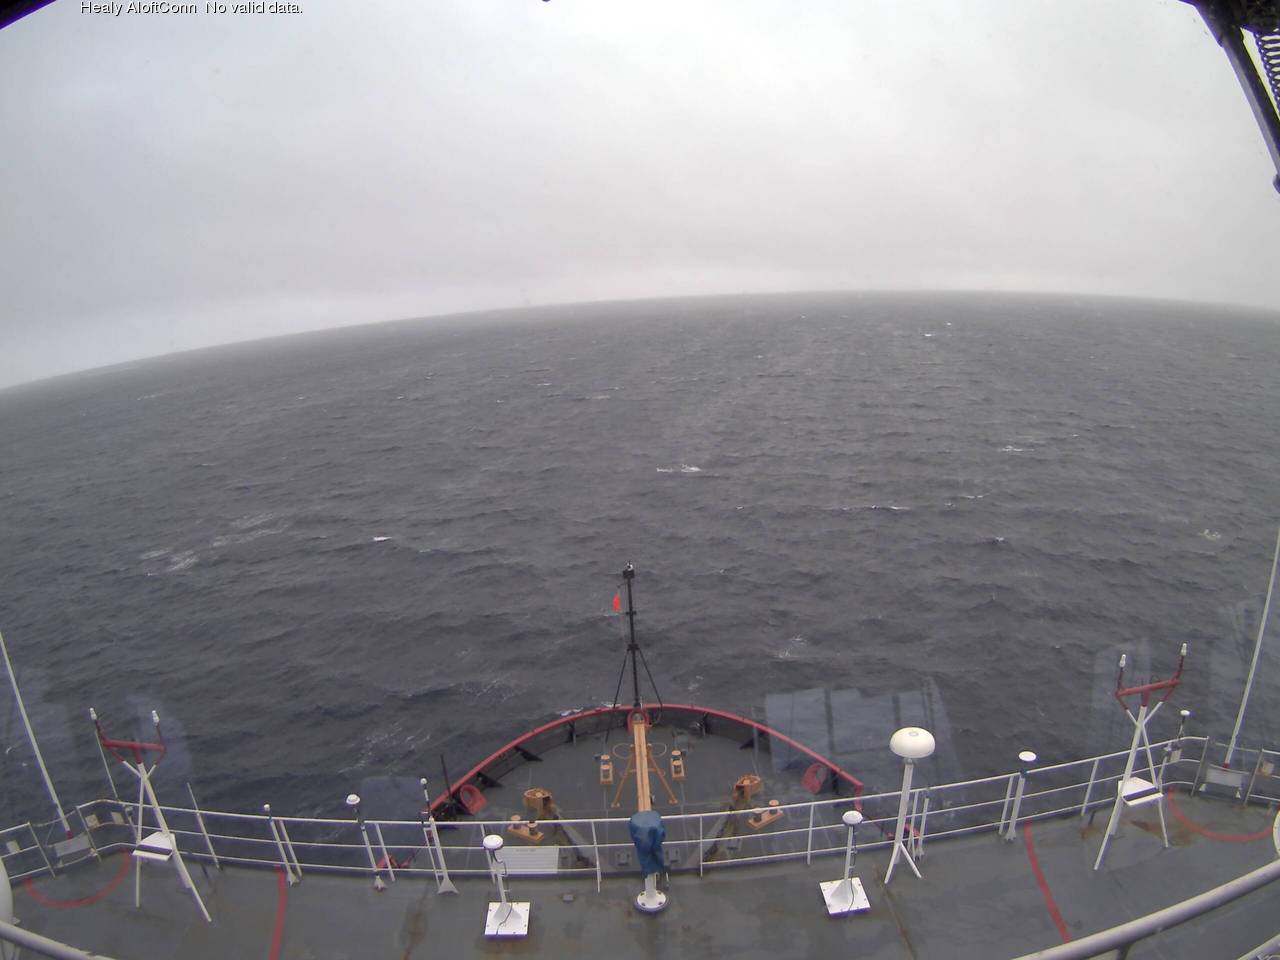
A modest swell is now visible from USCGC Healy’s “AloftCon” webcam:
whilst the WaveWatch III forecast for tomorrow has dropped off to a significant wave height of around 2 metres with an average period of 7 seconds:
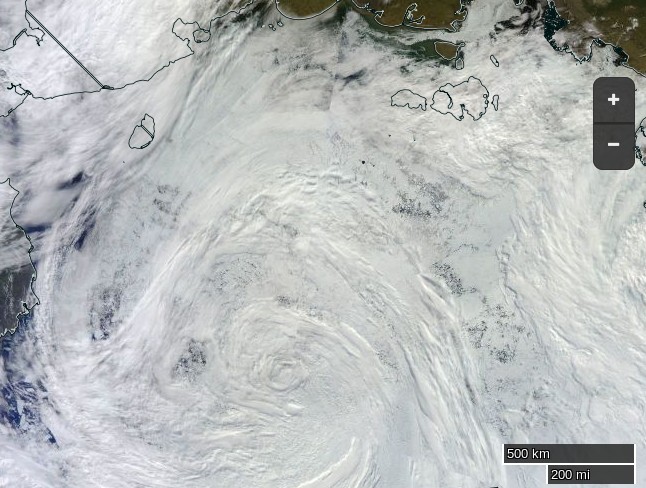
Meanwhile an image from the VIIRS instrument on the Suomi NPP satellite reveals the current storm in all its glory, together with confirmation that the “Big Block” multi-year ice floe north of Barrow has split asunder overnight:
[Edit July 17th 2016]
Sunday morning has now arrived. The storm in the Arctic looks to have bottomed out at 986 hPa central pressure. Here’s the Environment Canada synoptic chart for 00:00 this morning:
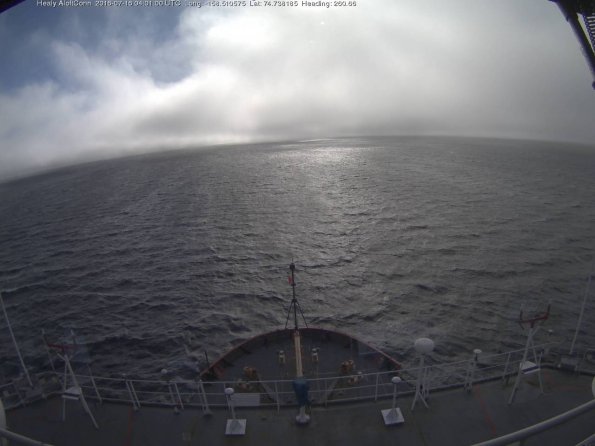
This is how the resultant swell looked from USCGC Healy at 06:00:
[Edit July 18th 2016]
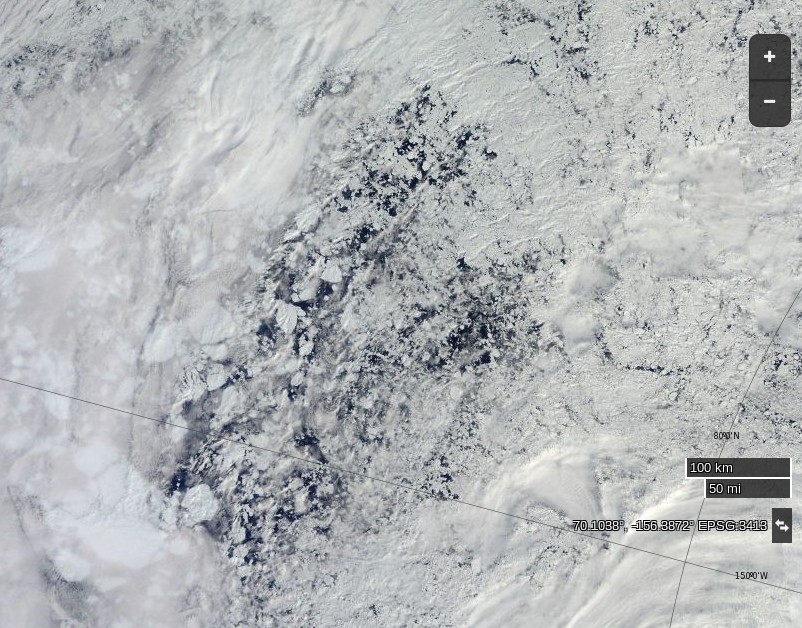
Here’s what the Beaufort and Chukchi Sea north of Barrow look like this morning through the clouds:
NASA Worldview “true-color” image of the Beaufort Sea on July 18th 2016, derived from the MODIS sensor on the Terra satellite
The remains of the now not so “Big Block” can just be made out in the bottom left. For a cloud free image here’s the latest AMSR2 passive microwave imagery of the area from the University of Hamburg:
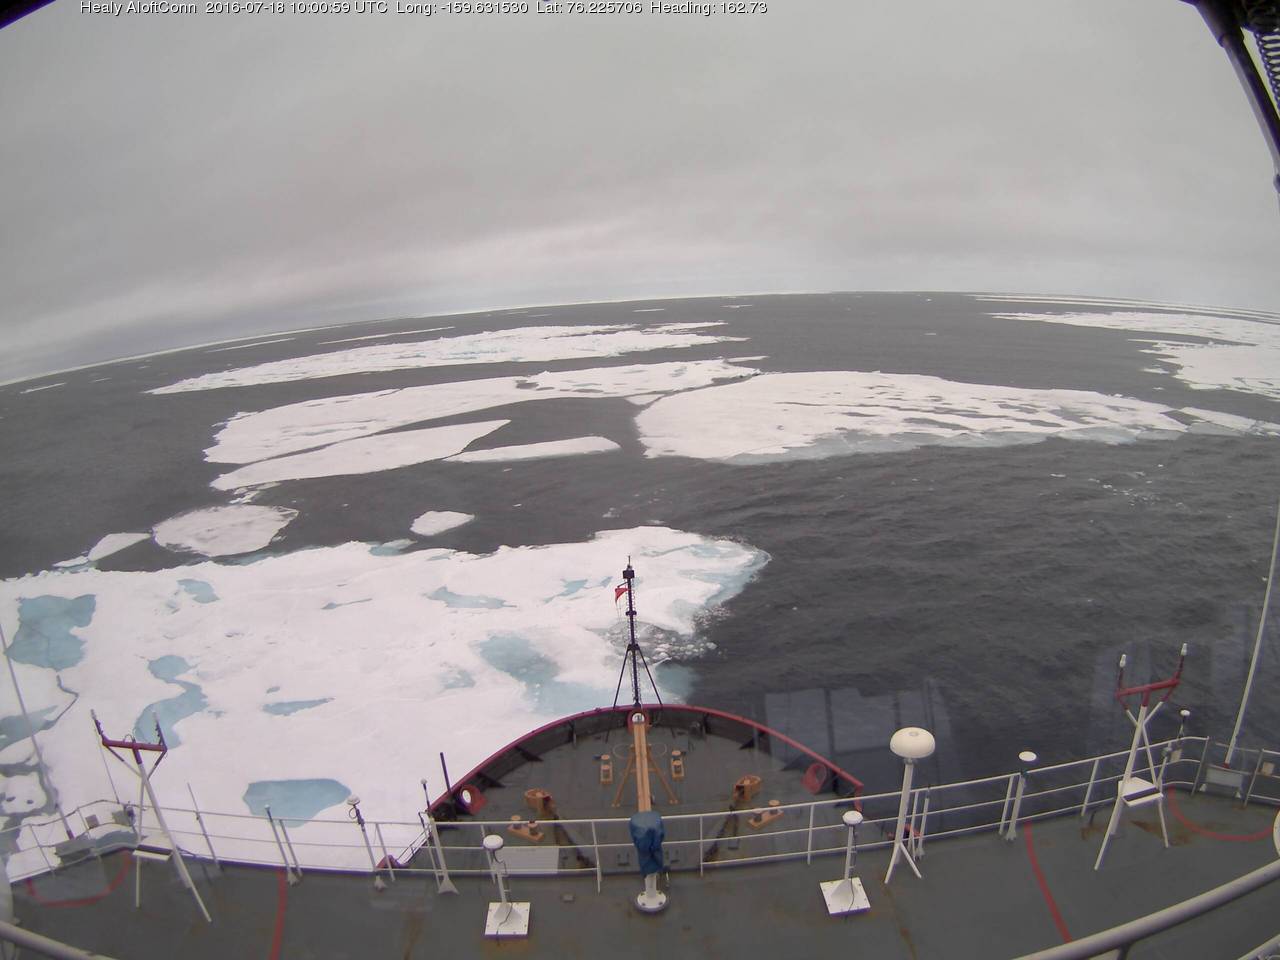
The USCGC Healy and the remnants of the swell are in amongst the ice:
[Edit July 20th 2016]
As the remnants of the storm head off across the Canadian Arctic Archipelago here is what it has left in its wake in the Central Arctic Basin:
NASA Worldview “false-color” image of the Central Arctic Basin on July 19th 2016, derived from the MODIS sensor on the Aqua satelliteUniversity of Hamburg AMSR2 concentration visualisation of the Central Arctic on July 19th 2016
[Edit July 21st 2016]
The storm has dispersed the remaining ice in the Beaufort Sea over the last few days:
However across the Arctic as a whole sea ice area continues its downward trend:
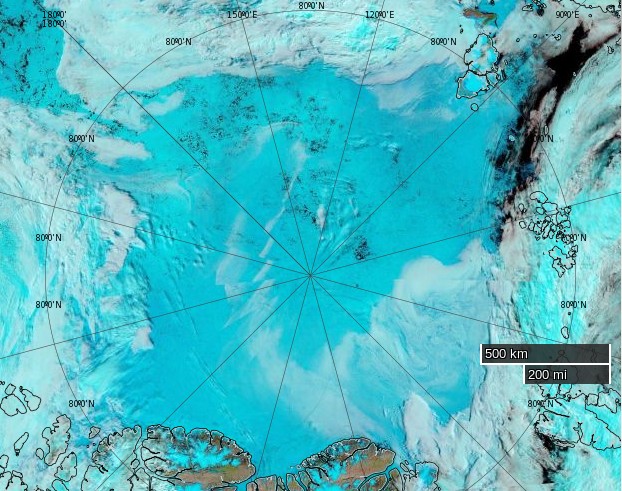
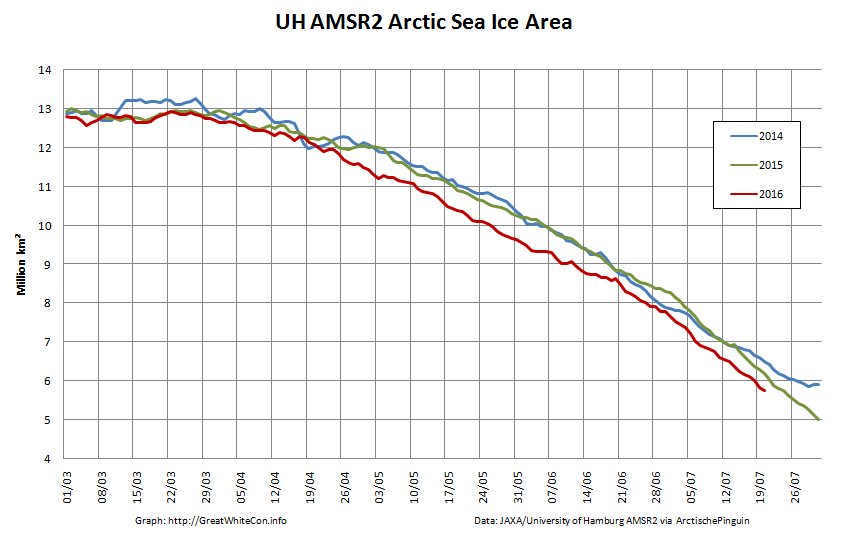
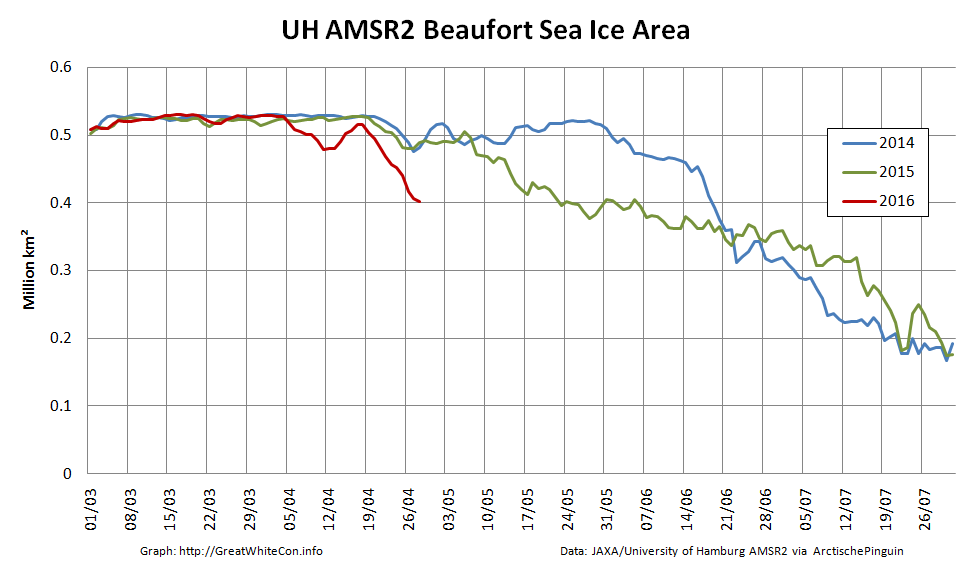
As regular readers will be aware we have been following the progress of the Great Arctic Anticyclone of 2016 for the last 3 weeks or so and the generation of increasingly large waves in the Beaufort Sea in August and September for the last 3 years or so. Today we combine the two to bring you news of anomalously large waves in the Beaufort Sea earlier this week. In actual fact any sort of waves in the Beaufort Sea at this time of year would be anomalous, since normally the Beaufort is still covered in sea ice in April!
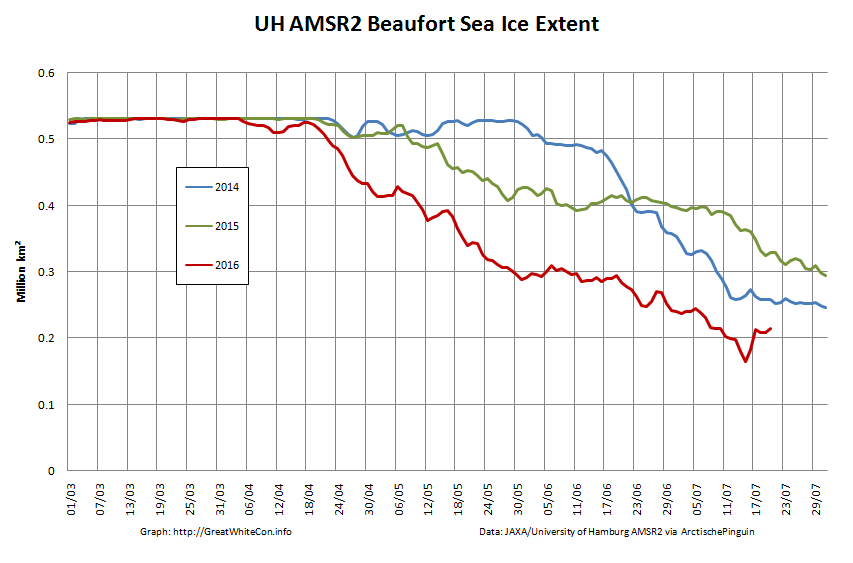
Firstly a bit of background information. In the continuing absence of the DMSP F-17 satellite data used by the NSIDC for their Arctic sea ice metrics, here’s a close up look at Arctische Pinguin’s current Beaufort Sea ice area data:
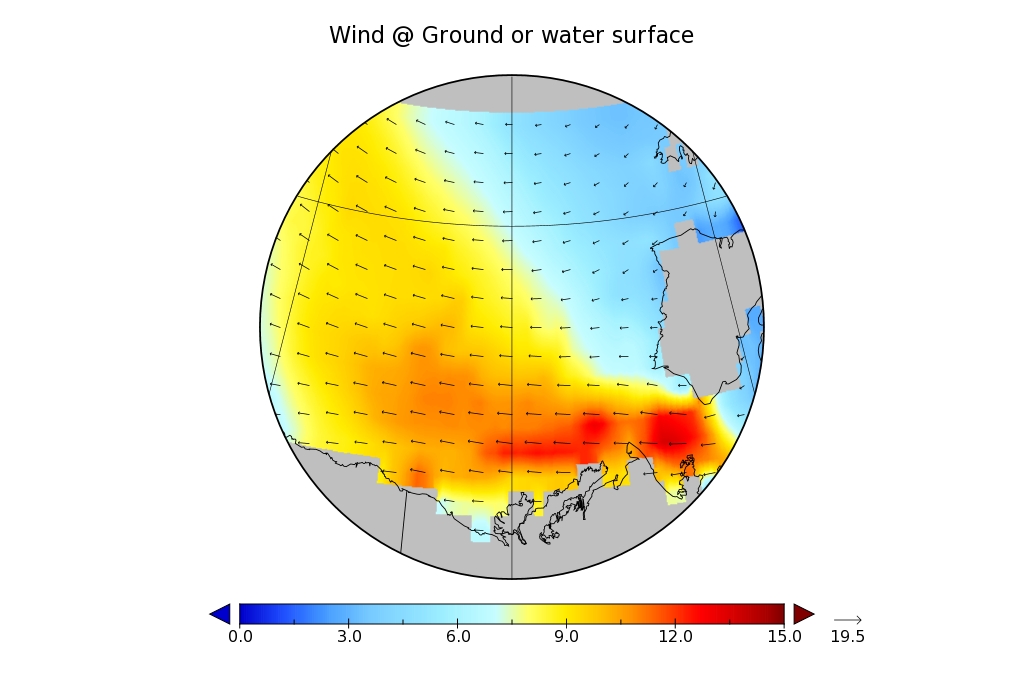
Now here’s NOAA’s WaveWatch III “hindcast” of the winds over the Beaufort Sea on April 26th 2016:
WaveWatch III wind hindcast for the Beaufort Sea on April 26th 2016
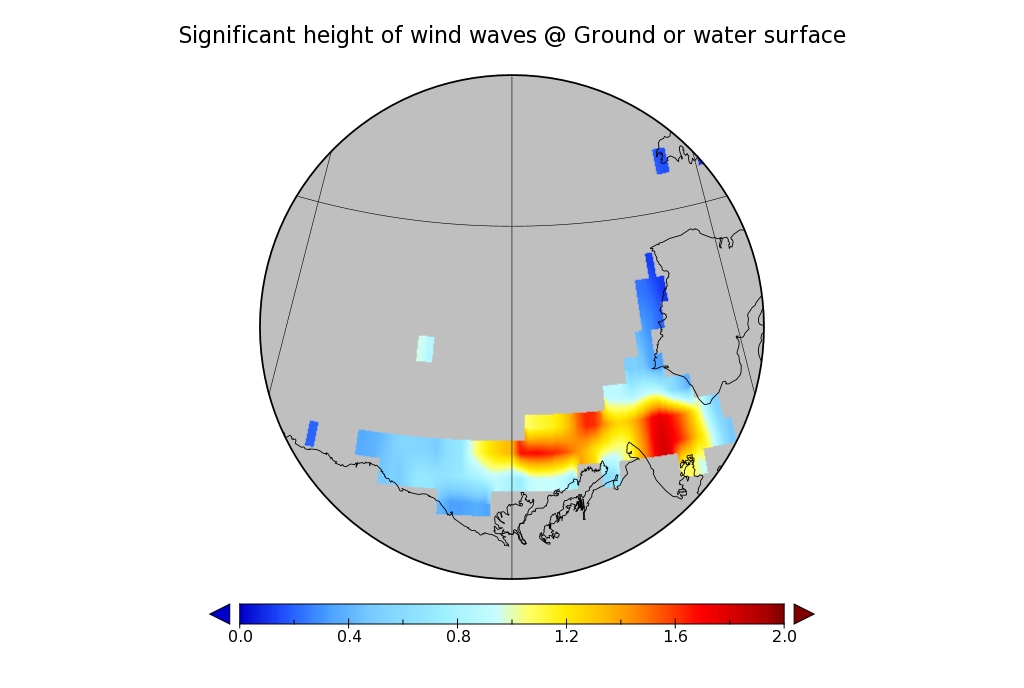
Notice the continuing easterly winds from the persistent high pressure system centred to the north of the Beaufort Sea. Next here’s the resultant wind wave height:
WaveWatch III wave height hindcast for the Beaufort Sea on April 26th 2016
and the associated wind wave period:
WaveWatch III wave period hindcast for the Beaufort Sea on April 26th 2016
Wind waves with a height of around 1.5 meters and a period of 6 seconds wouldn’t tempt me to go out on a surfing expedition, but they would certainly be enough to interfere with the sea ice formation process, as you can see from this “pseudo-color” image of the Beaufort Sea on April 26th from the MODIS instrument on the Terra satellite:
Unfortunately the Jason 2 and recently launched Jason 3 satellites don’t measure wave heights in bodies of water as far north as the Beaufort Sea, so we’ll have to content ourselves with the modelled data from WaveWatch III. However here’s a brief video explaining how Jason 3 measurements are now used to assist WaveWatch forecasts further south:
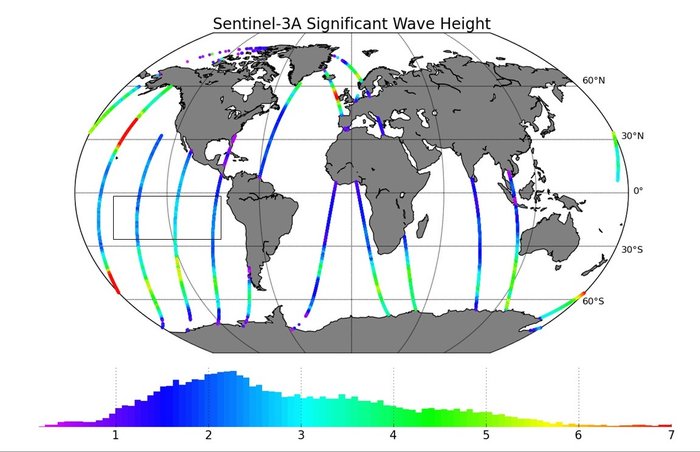
Whilst Jason 3 won’t be watching waves in the Arctic Ocean it looks as though the European Space Agency’s Sentinel 3A satellite will be providing wave height data for the Beaufort Sea in the not too distant future:
It also looks as though CryoSat-2 is already potentially providing such data, but as far as I can ascertain it’s not available in handy gridded format in the same way that the CS2 near real time ice thickness data is.
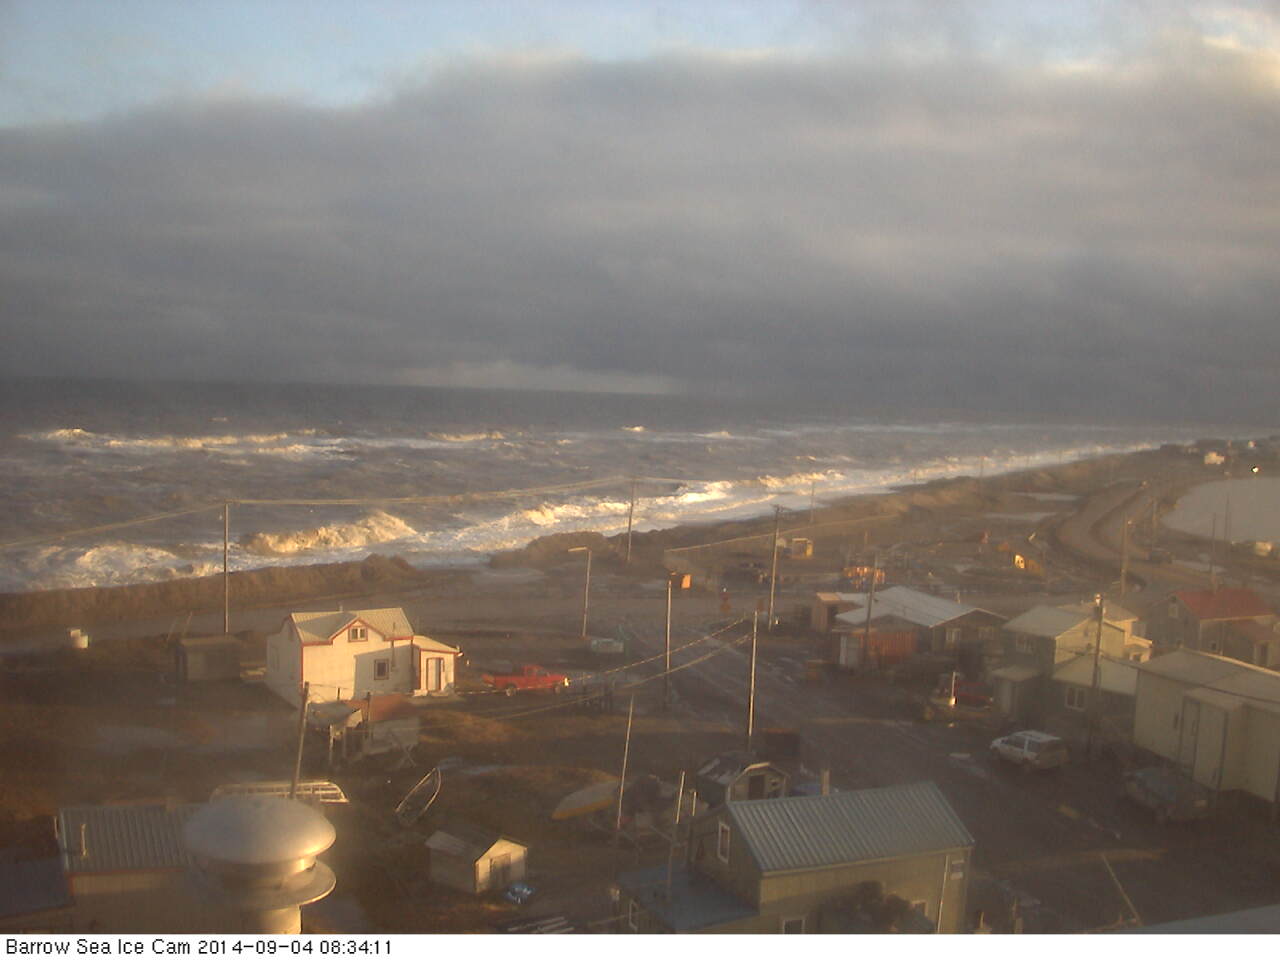
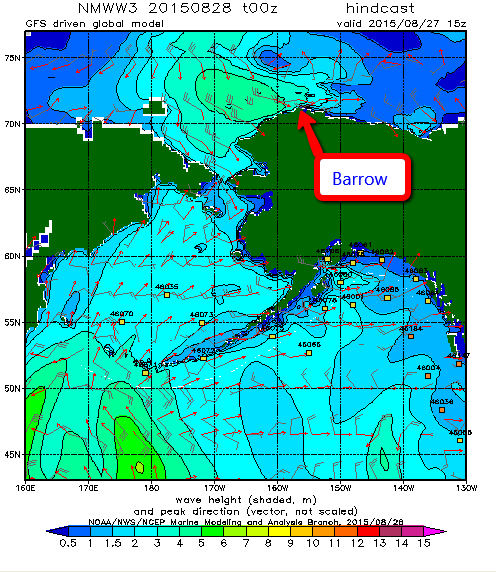
The first big waves of 2015 have been battering the town of Barrow, Alaska today and they’ve already broken through the coastal defences. Firstly take a look at the view from the Barrow webcam during a less damaging storm on September 4th last year:
Now take a look at the view from the same camera earlier today, and play “spot the difference” with me:
The cause of the flooding that is all too visible is a cyclone that’s been whirling around in the Chukchi Sea for a while, and here is a WaveWatch III “hindcast” of what the resultant winds have created in the way of waves. Firstly the “significant wave height”:
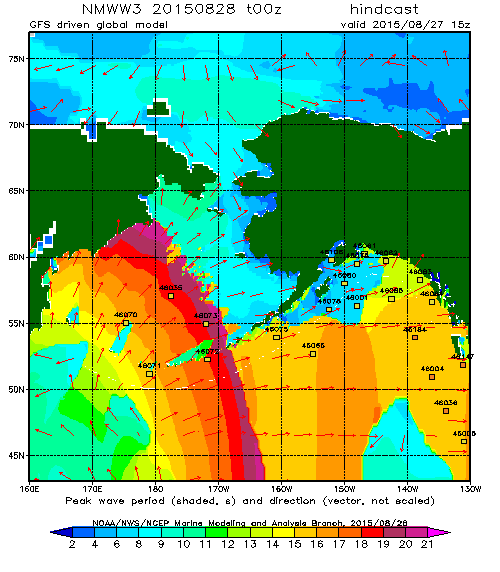
and now the “peak period”:
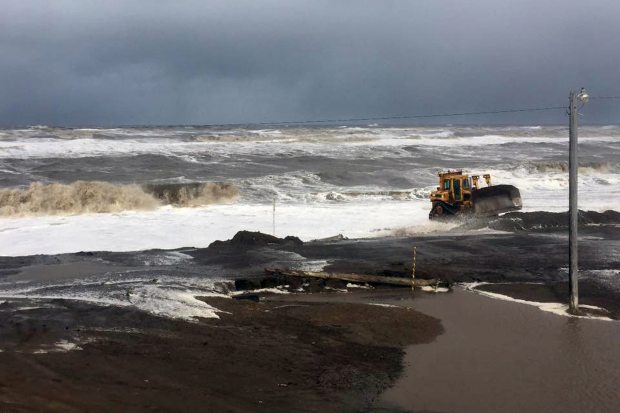
which reveal a swell 4 to 5 metres high with a period of 10 seconds heading directly towards Barrow Beach. According to the Alaska Dispatch News:
Huge, wind-whipped waves crashed onto the shore at Barrow on Thursday, forcing the closure of a nearby road. Westerly winds were gusting up to 50 miles an hour, pushing waves up to the top of the beach and causing some erosion, the National Weather Service said.
The service has issued a coastal flood warning for Barrow until Friday morning, along with a high surf advisory for the western part of the North Slope and a gale warning for much of the Beaufort and Chukchi Seas.
The big surf and flooding, which has covered a road that runs between the ocean and Barrow’s lagoon, is “not terribly unusual” at this time of the year, said Ryan Metzger, a National Weather Service meteorologist in Fairbanks. Fall is a stormy season, and the timing — right around the annual minimum sea ice extent — allows the surf to build and reach shore.
Photograph by Brittni Driver via Alaska Dispatch News
Just in case it’s not obvious from all the pictures, the respective advisory messages point out that:
A COASTAL FLOOD WARNING MEANS THAT RISING SEA WATER THAT CAUSES FLOODING IS EXPECTED. COASTAL RESIDENTS IN THE WARNED AREA SHOULD BE ALERT FOR RISING WATER…AND TAKE ACTIONS TO PROTECT LIFE AND PROPERTY.
A HIGH SURF ADVISORY MEANS THAT LOCALIZED BEACH EROSION IS EXPECTED. PRECAUTIONS SHOULD BE TAKEN TO PROTECT PROPERTY.
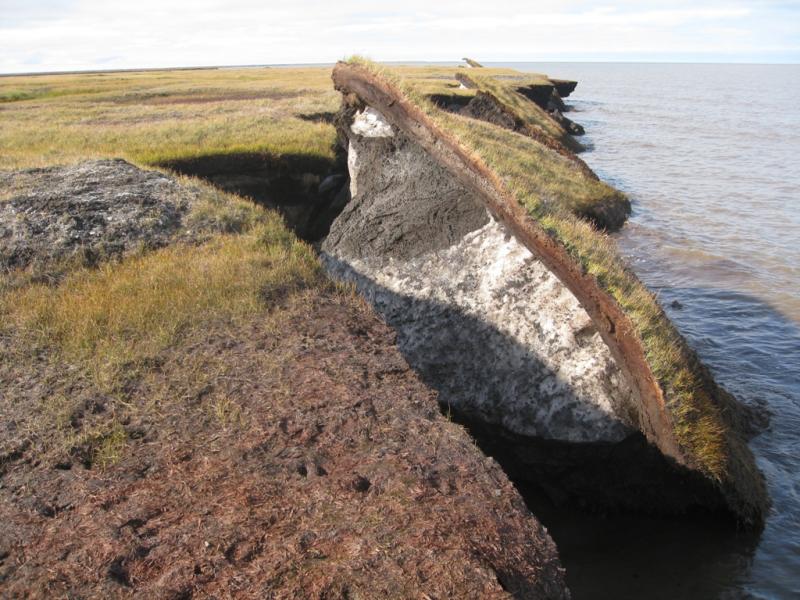
If you’re now wondering what might happen to other areas of the north coast of Alaska in similar circumstances, but with no bulldozer in attendance, here’s an example from Cape Halkett:
Thawing permafrost causes coastline collapse on Alaska’s North Slope, which is no longer kept frozen and protected from fall storms by sea ice—the ice now forms later in the season.
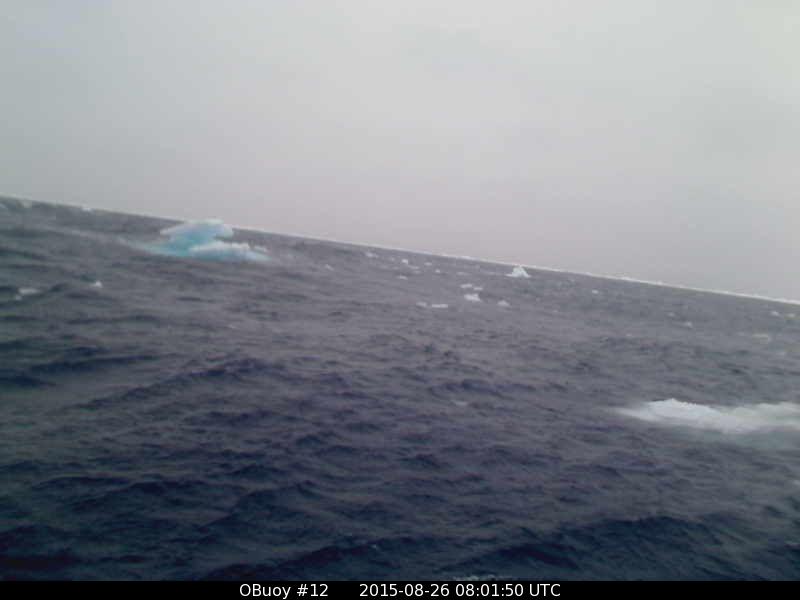
Away from the coast swell from the same cyclone has also been affecting the sea ice north of Barrow, and here’s what a webcam bobbing about on a buoy north of the Chukchi Sea showed as the winds started to build yesterday:
O-Buoy 12 image from August 26th 2015
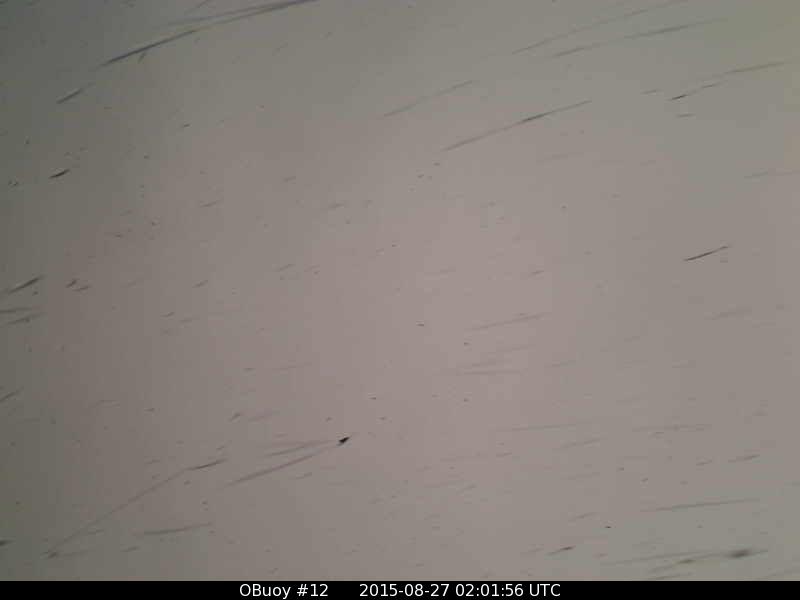
O-Buoy 12 has now tipped over and then ceased transmitting. This is the last picture received, in the early hours of August 27th when the wind speed had reached 13 m/s and the buoy had been moving at over 5 m/s:
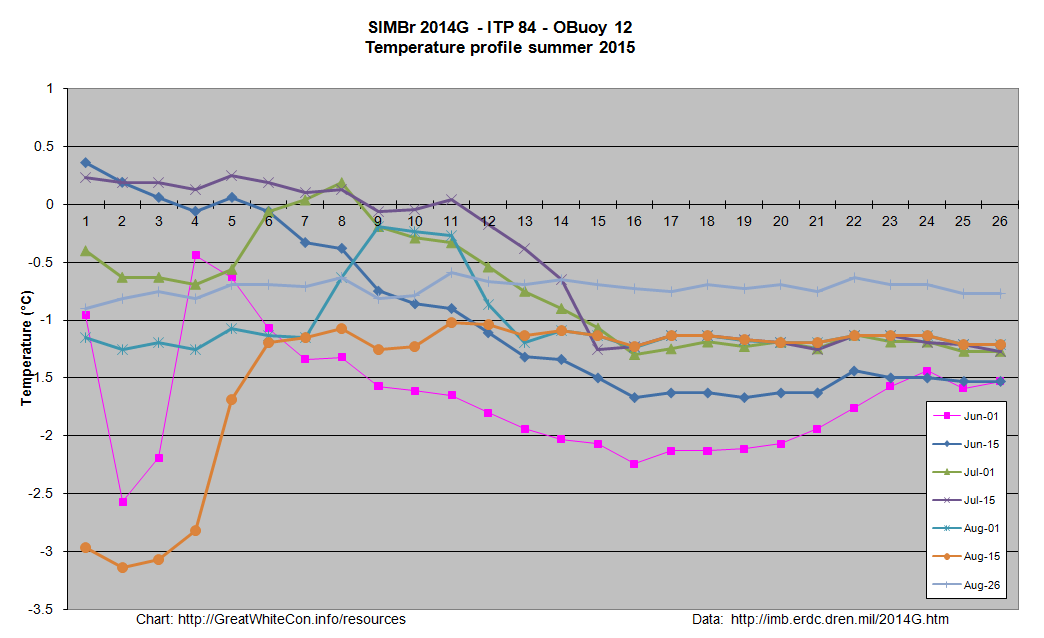
Once upon a time O-Buoy 12 was sat on the same ice floe as ice mass balance buoy 2014G, which has also been free floating for a while. Here’s what it reveals about the temperature of the sea water on August 26th 2015 at 77.56 N, 163.86 W:
Somewhere in the vicinity of -0.7 °C.
[Edit on 30/08/2015]
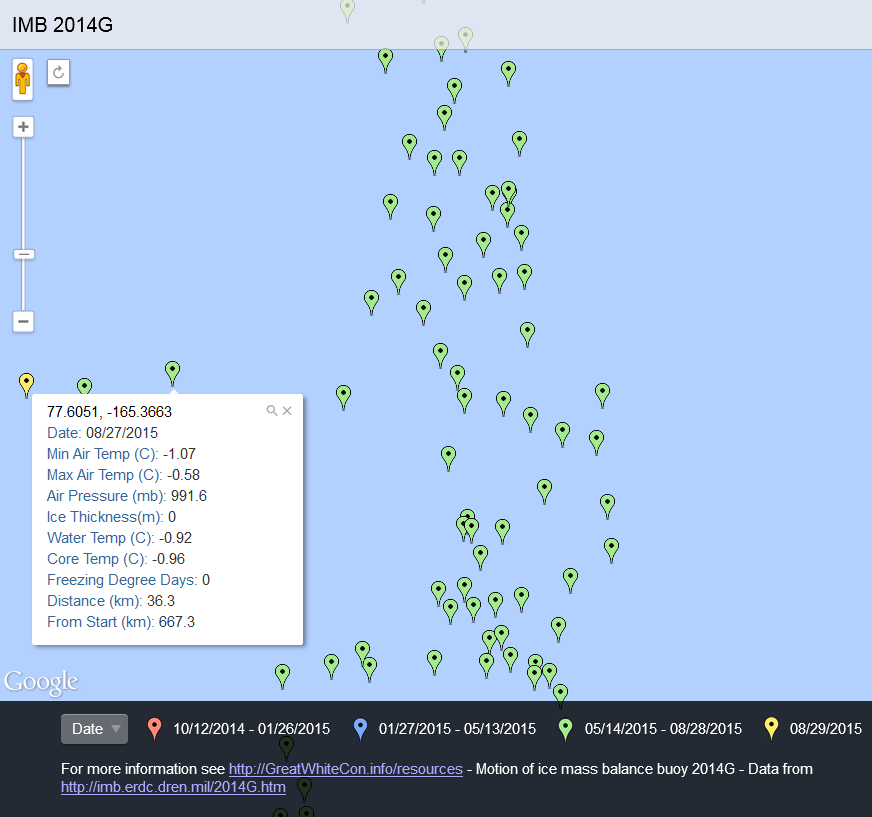
O-Buoy 12 has made no further transmissions, and therefore seems to have succumbed to the storm. In addition IMB buoys 2014F and 2013F stopped transmitting on the 26th and 27th of August respectively. Ice mass balance buoy 2014G has survived however, and reports two successive record daily distances travelled:
25.6 km on August 26th, followed by 36.3 km on the 27th. After a brief dip during the cyclone water temperature is still around -0.7 °C.
Presumably as a result of the cyclone JAXA Arctic sea ice extent has taken a tumble over the last few days. It has stabilised this morning slightly above 2007 levels:
Here is the current AMSR2 Arctic sea ice concentration map from the University of Hamburg, revealing a large potential fetch across the East Siberian, Chukchi and Beaufort Seas should any further cyclones occur in the area over the next few weeks:
AMSR2 Arctic sea ice concentration on August 29th from the University of Hamburg
Hence the conditions now exist for an even more damaging swell to be generated before the 2015 minimum Arctic sea ice extent is reached.
This website uses cookies to improve your experience. We'll assume you're ok with this, but you can opt-out if you wish. Cookie settingsACCEPT
Privacy & Cookies Policy
Privacy Overview
This website uses cookies to improve your experience while you navigate through the website. Out of these, the cookies that are categorized as necessary are stored on your browser as they are essential for the working of basic functionalities of the website. We also use third-party cookies that help us analyze and understand how you use this website. These cookies will be stored in your browser only with your consent. You also have the option to opt-out of these cookies. But opting out of some of these cookies may affect your browsing experience.
Necessary cookies are absolutely essential for the website to function properly. This category only includes cookies that ensures basic functionalities and security features of the website. These cookies do not store any personal information.
Any cookies that may not be particularly necessary for the website to function and is used specifically to collect user personal data via analytics, ads, other embedded contents are termed as non-necessary cookies. It is mandatory to procure user consent prior to running these cookies on your website.