It’s going to be more difficult to follow traffic on the Northern Sea Route this year, because the Russian authorities are no longer publishing daily position information for ships using the route.
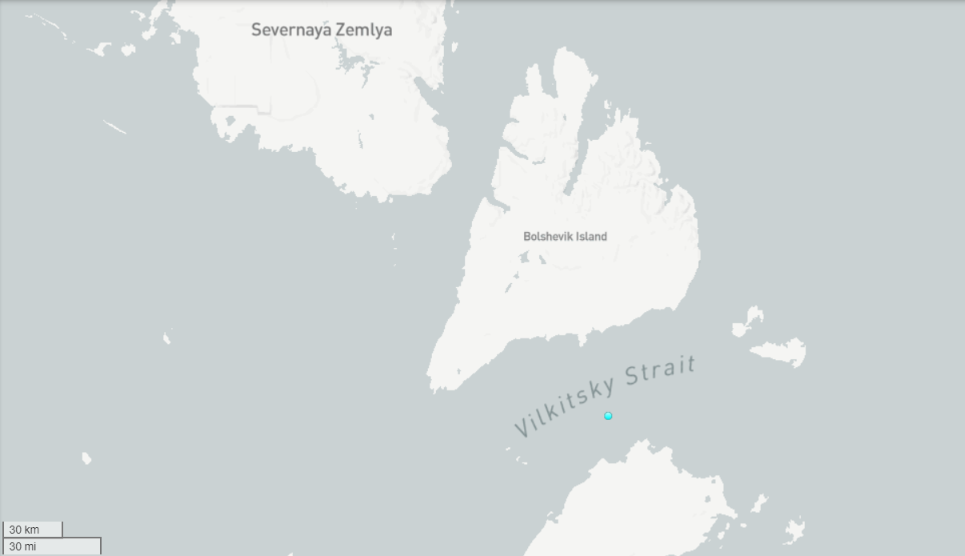
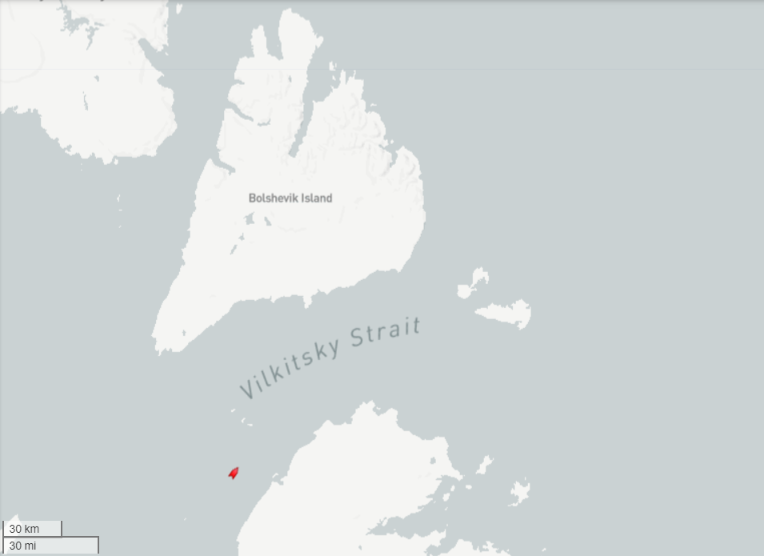
However other sources revealed that things got underway early this year. On May 29th the nuclear icebreaker Ural led LNG tanker Christophe de Margerie through the Vilkitsky Strait into the Laptev Sea:
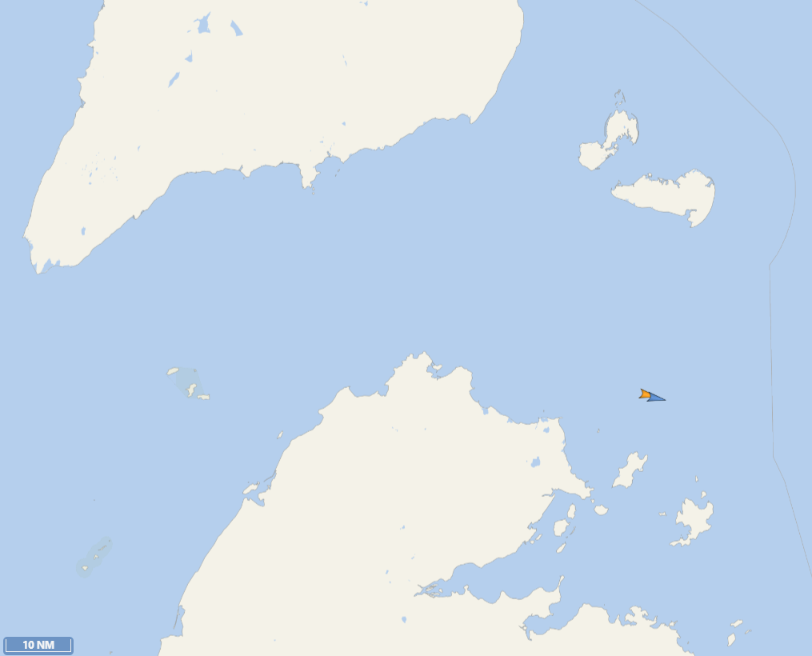
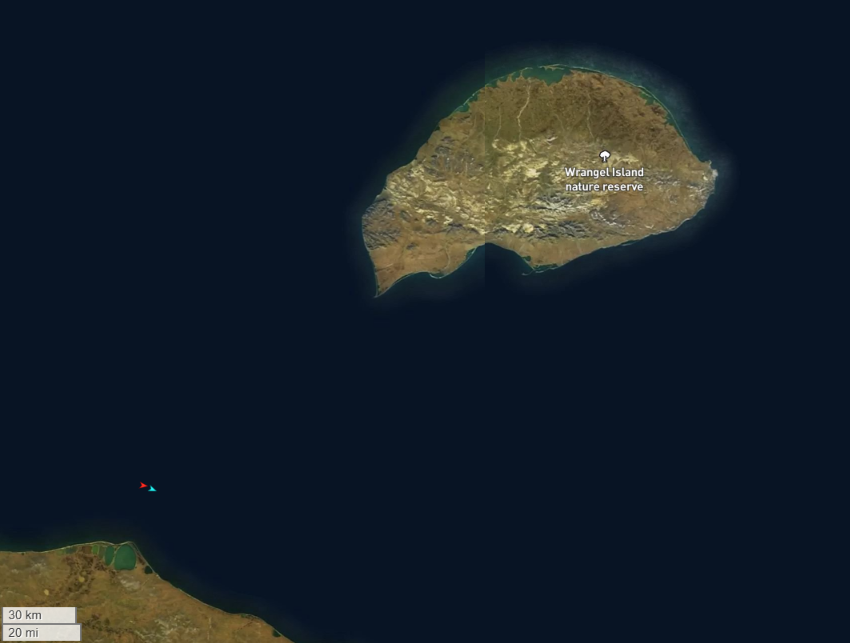
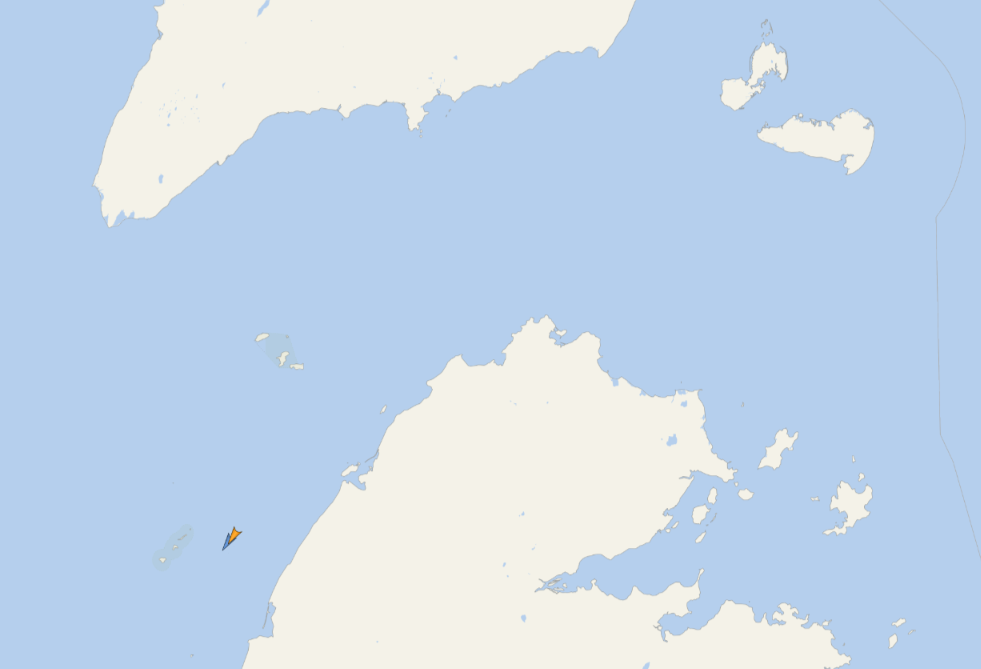
On June 5th the modest convoy is about to pass Wrangel Island into the Chukchi Sea:
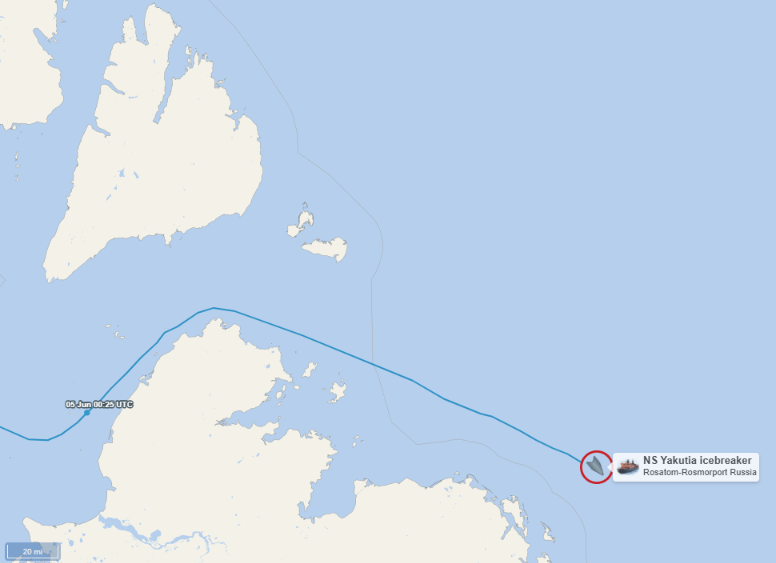
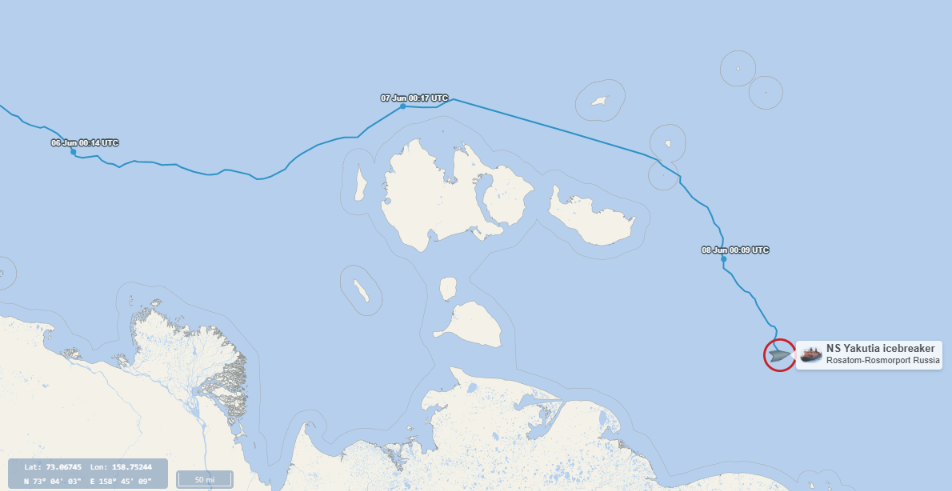
Another nuclear powered icebreaker, Yakutiya, has also just made its way through the Vilkitsky Strait heading east:
If Yakutiya is leading a convoy of one or more other vessels through the pack ice in the Laptev Sea they have all got satellite AIS turned off!
[Update – June 8th]
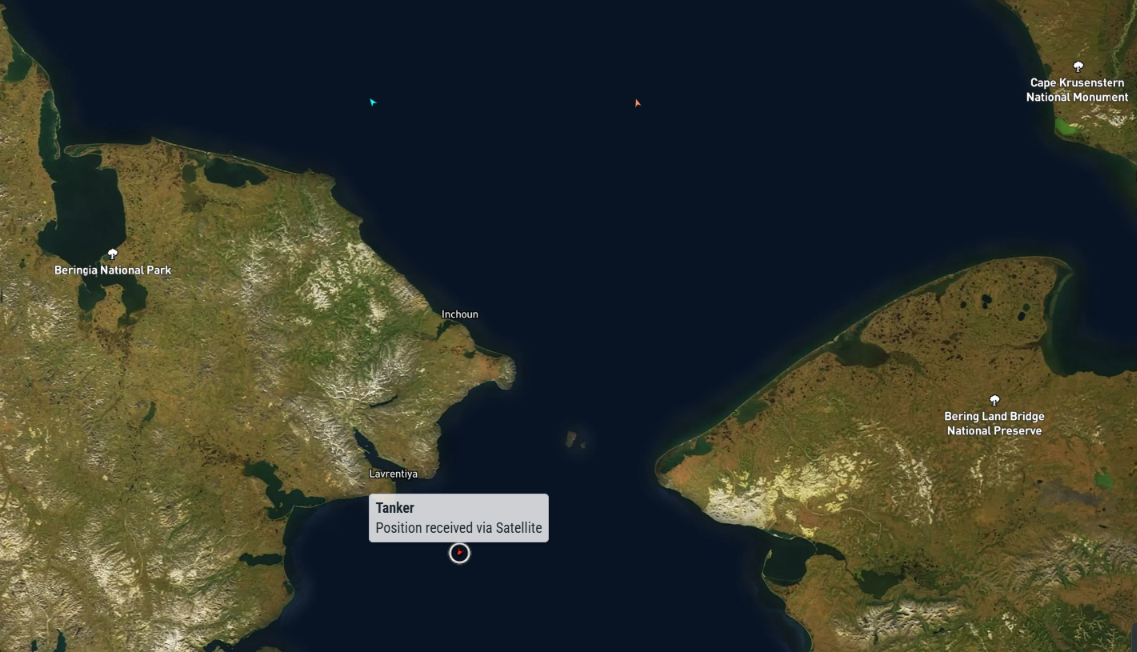
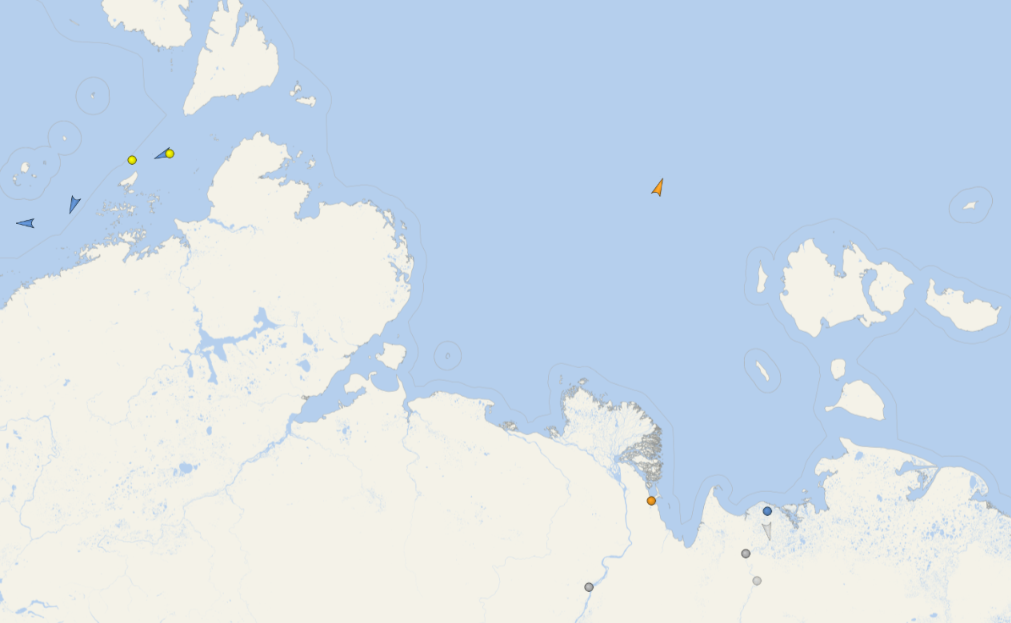
Christophe de Margerie has passed through the Bering Strait, and thus completed the first west to east voyage through the Northern Sea Route this year. Ural has been left behind in the Chukchi Sea:
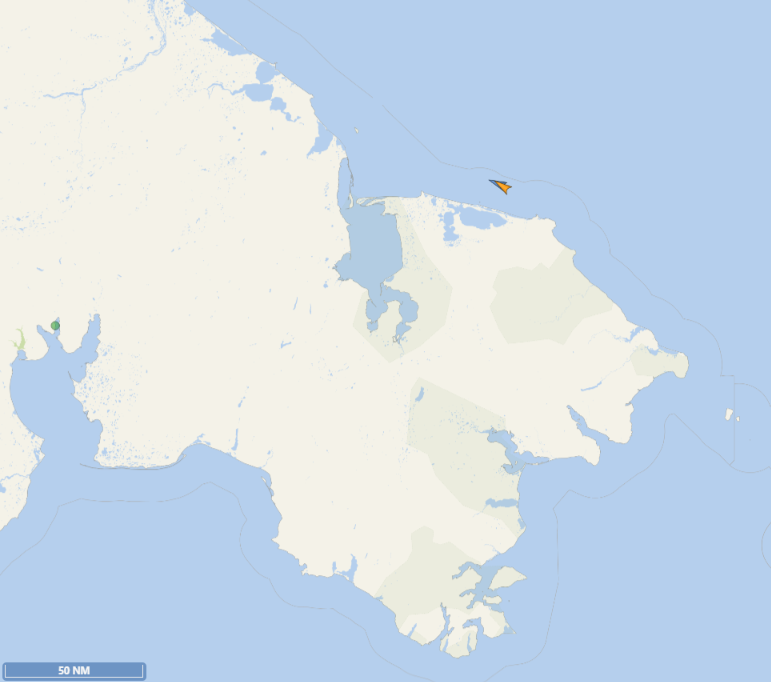
Yakutiya has travelled north of the New Siberian Islands and entered the East Siberian Sea:
[Update – June 15th]
Christophe de Margerie has just passed through the Bering Strait heading north on a return journey through the NSR. This time around Yakutiya is leading the way:
[Update – June 22nd]
Yakutiya and Christophe de Margerie have just passed through the Vilkitsky Strait heading west:
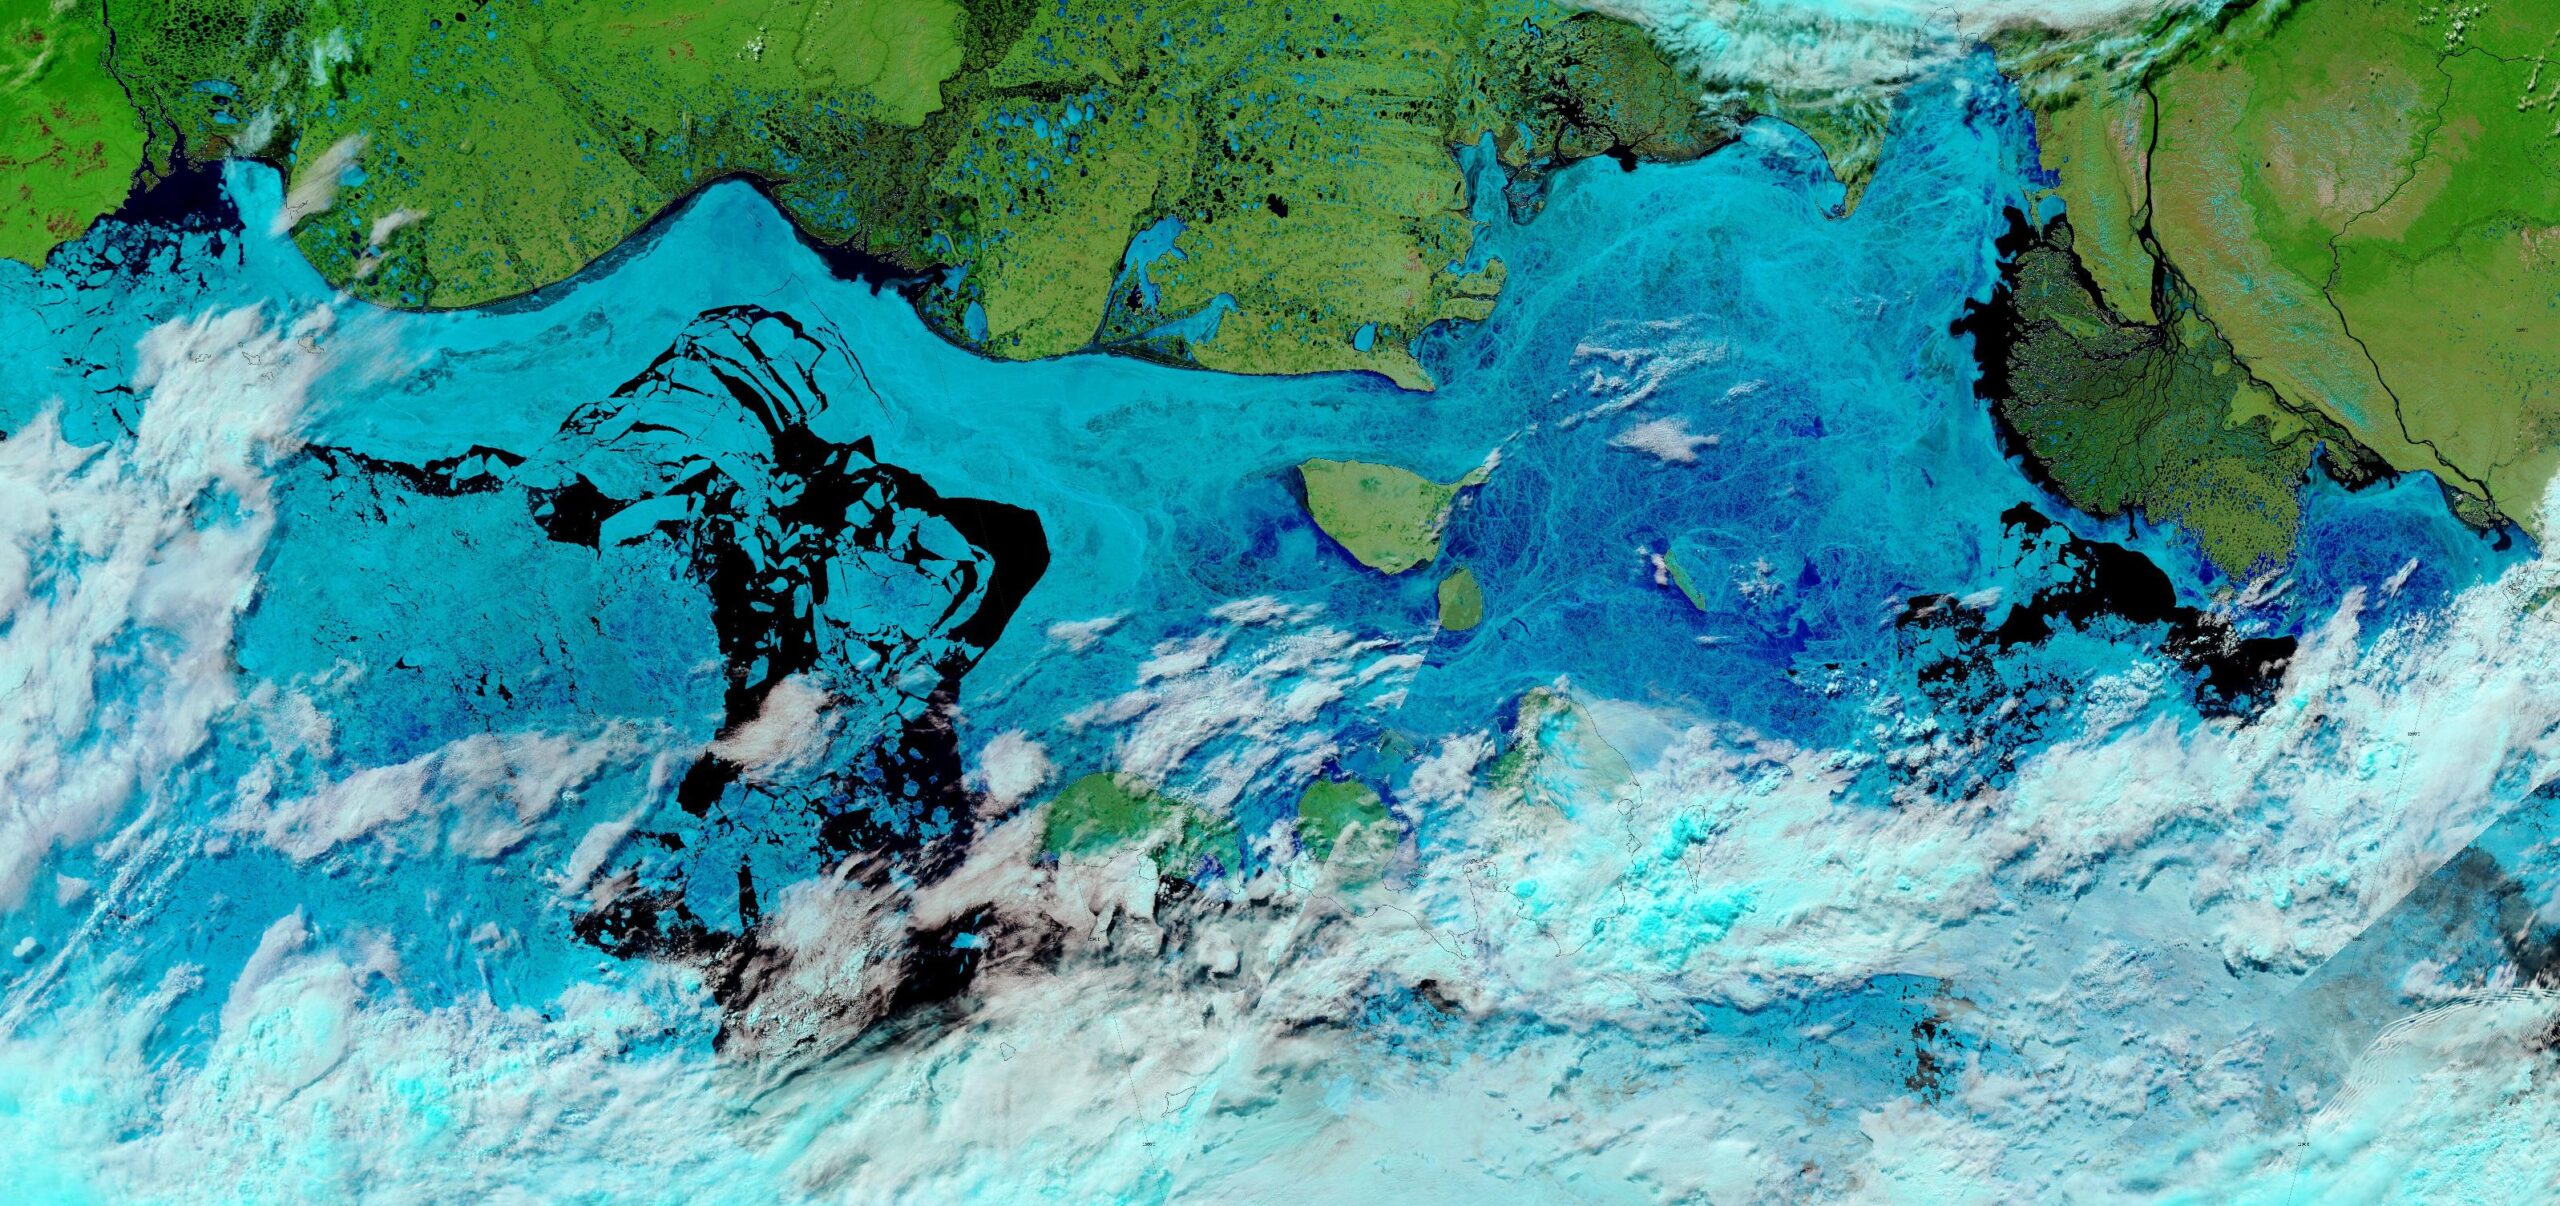
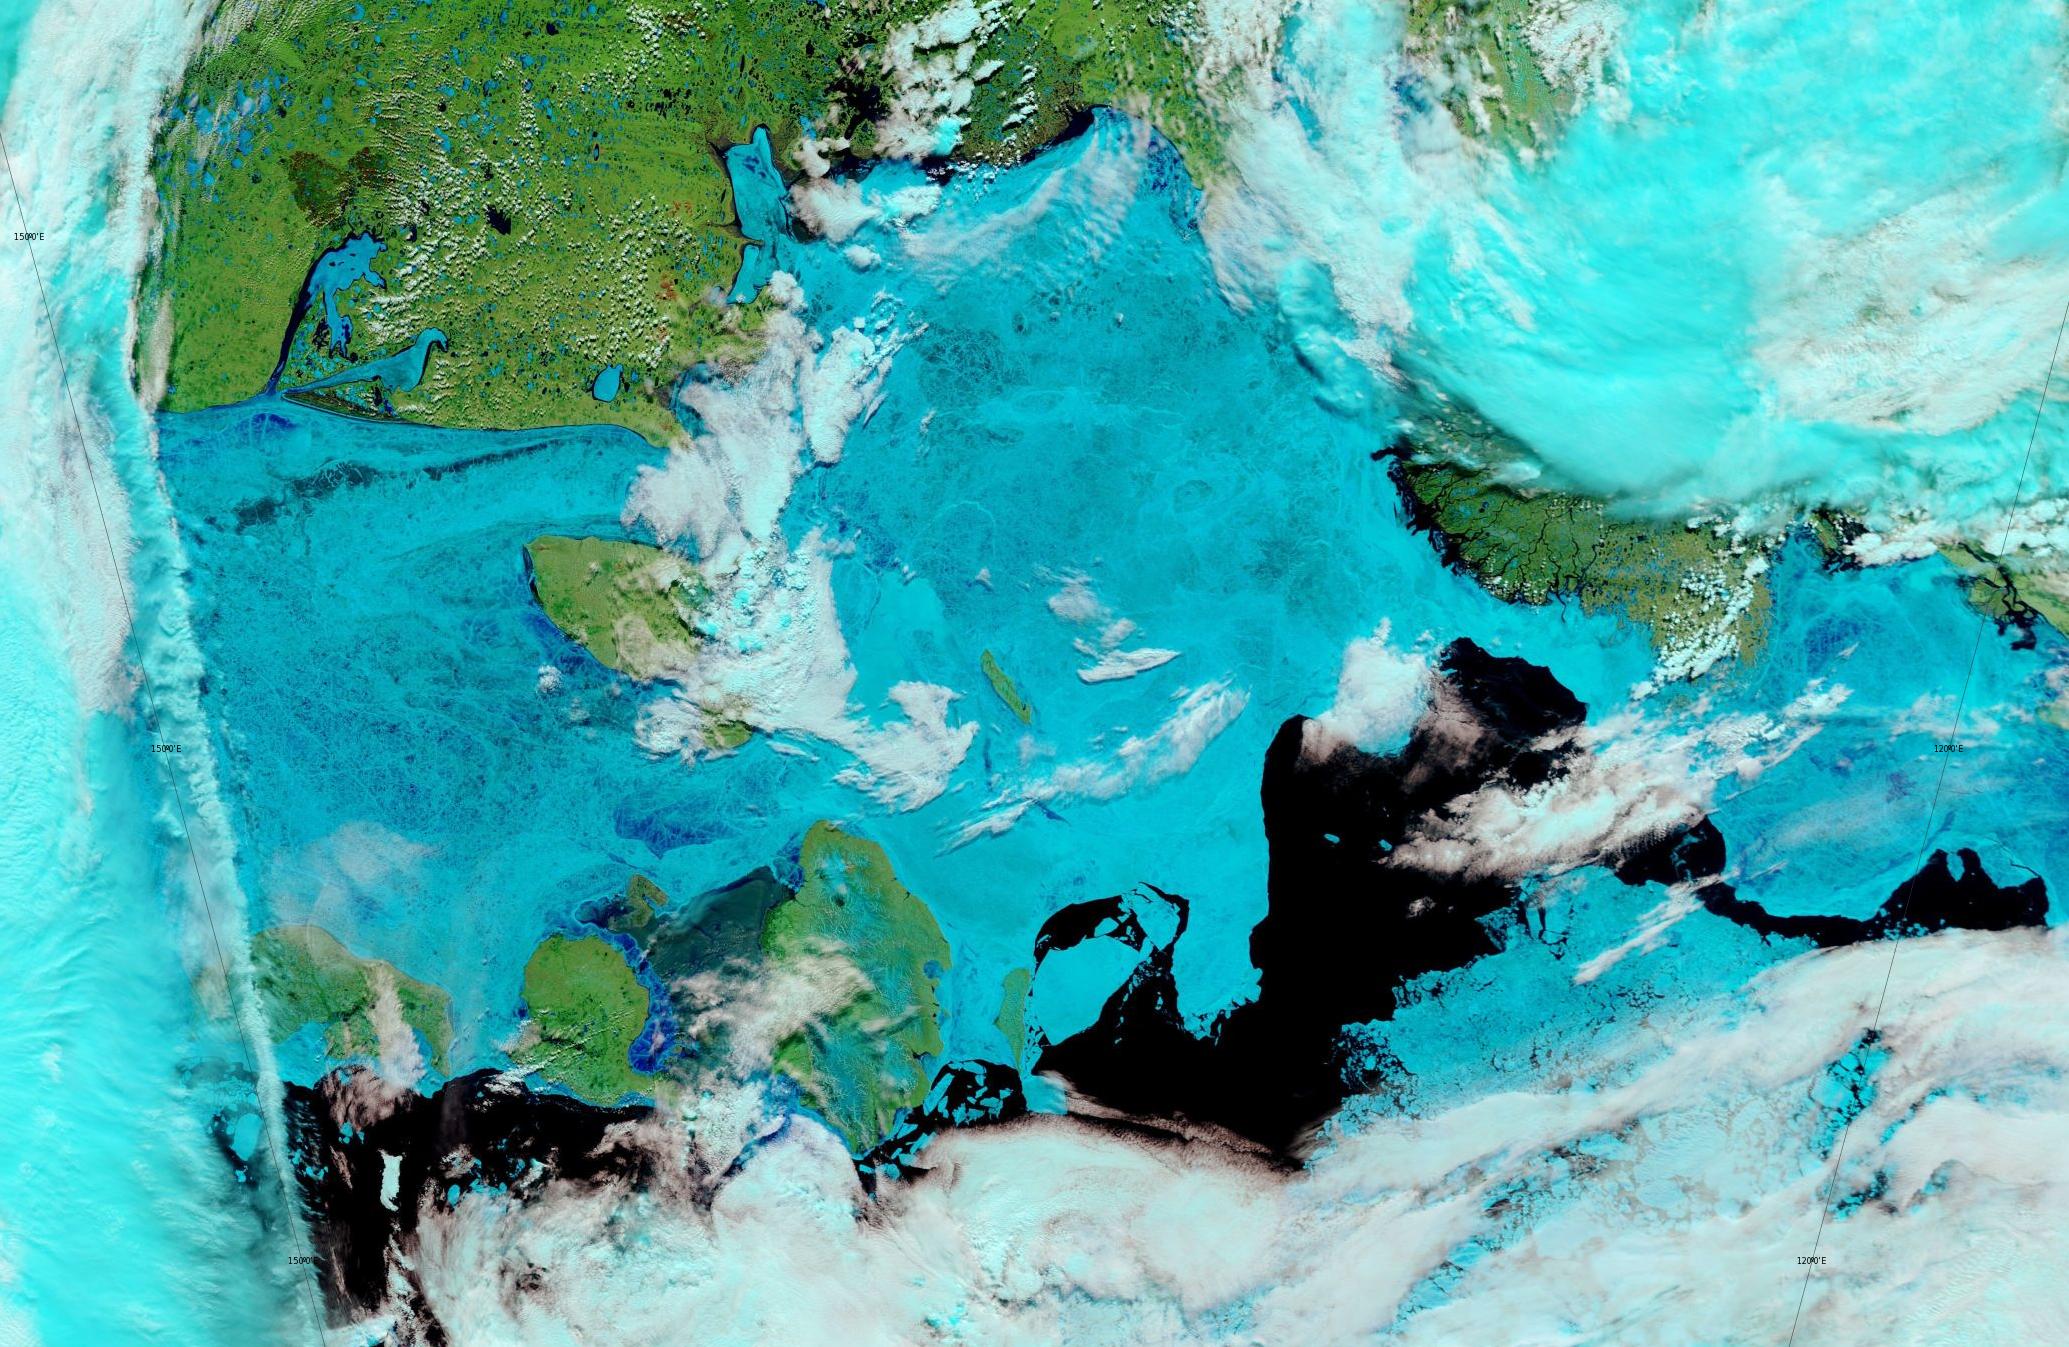
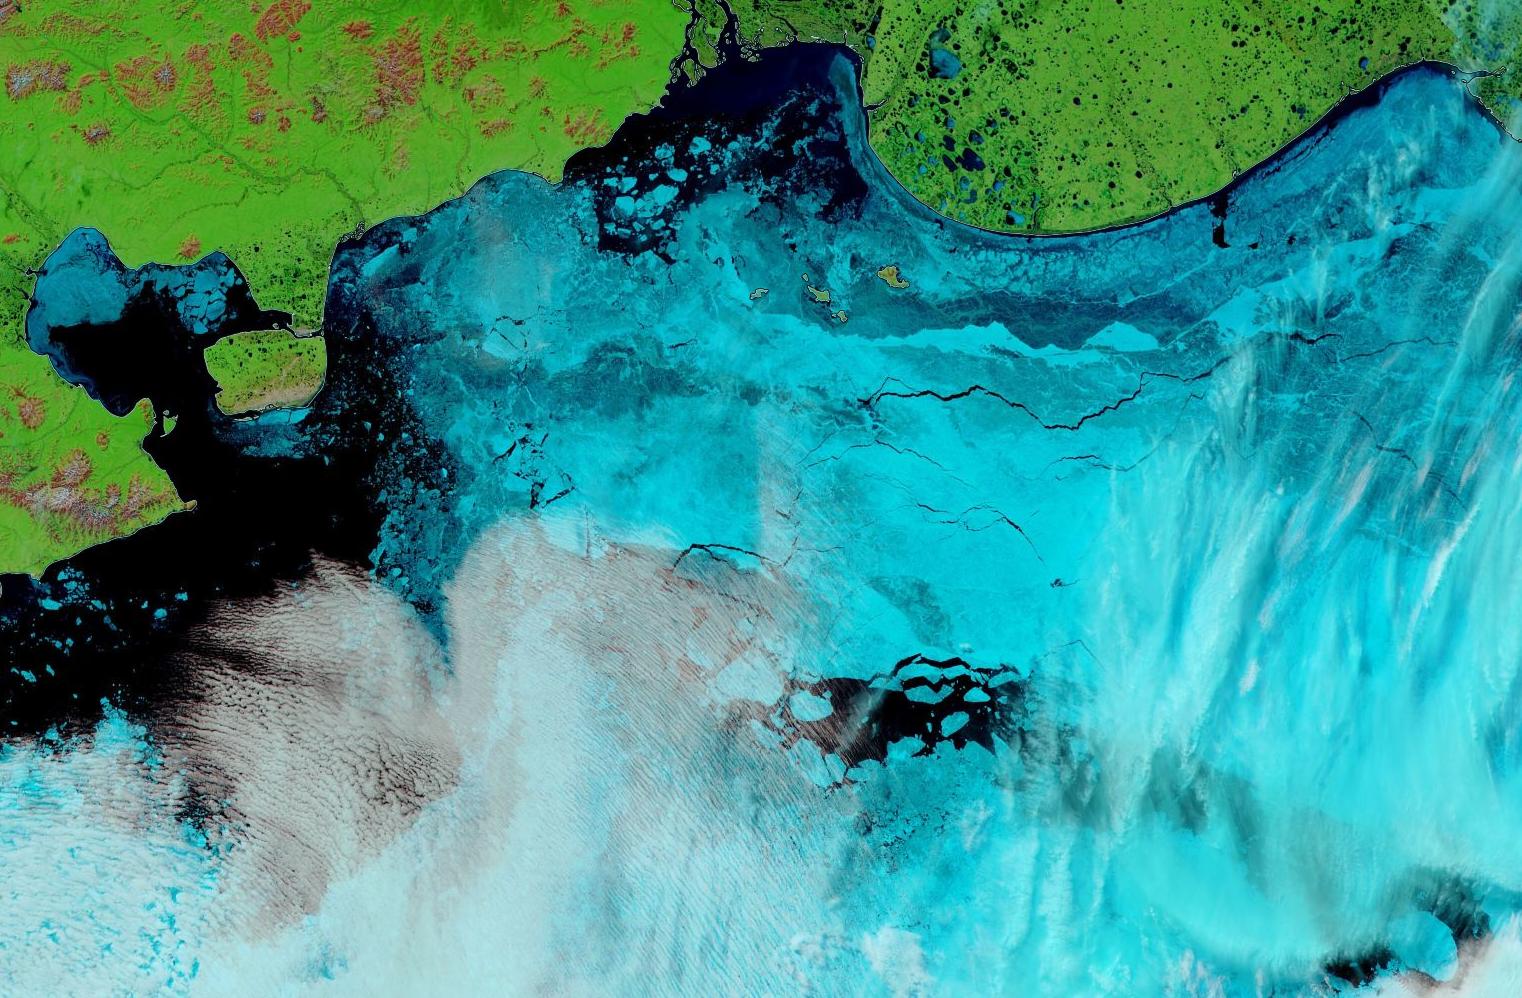
The skies were fairly clear over the central Northern Sea Route this morning, revealing the fast ice breaking up in the East Siberian Sea and plenty of melt ponds in the Laptev Sea:
“False colour” image of the Laptev and East Siberian Seas on June 22nd from the MODIS instrument on the Terra satellite
[Update – June 30th]
Christophe de Margerie is back in the Laptev Sea heading east, this time accompanied by Boris Davydov, another LNG tanker. The nuclear icebreakers are all in the Kara Sea, on the other side of the Vilkitsky Strait:
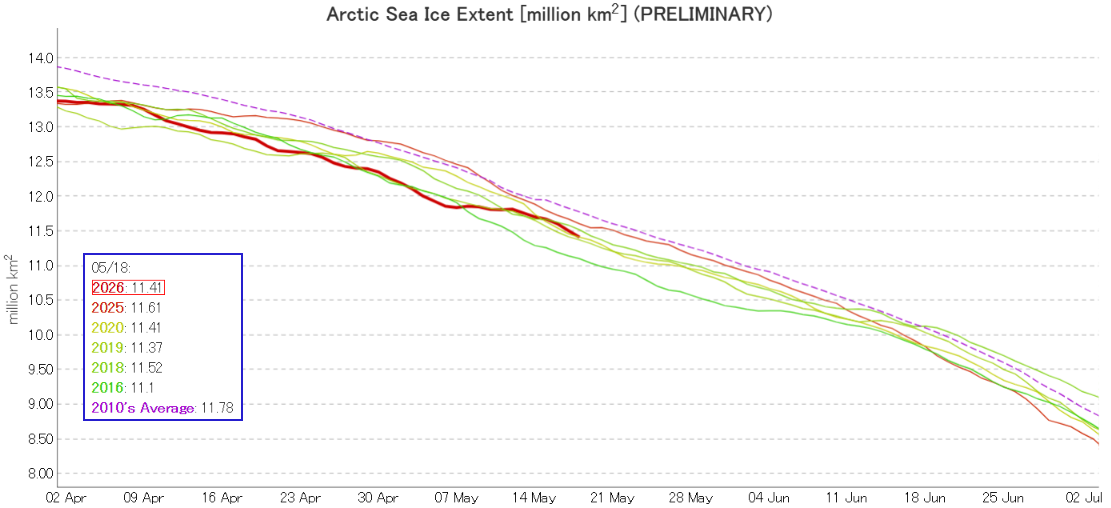
JAXA have updated their visualisations of Arctic sea ice extent data. The “traditional” 2 day average graph is now labelled “preliminary”, and currently shows 2026 in a tie with 2020 for third lowest for the date:
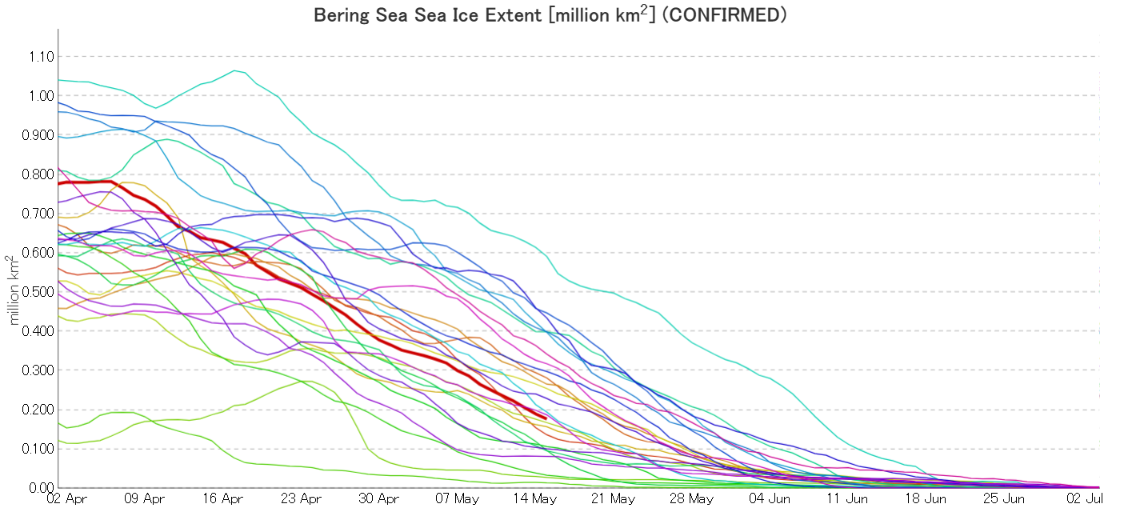
5 day averaged “confirmed” data is also available, including regional graphs. By way of example here’s JAXA’s latest extent graph for the Bering Sea, dated May 15th:
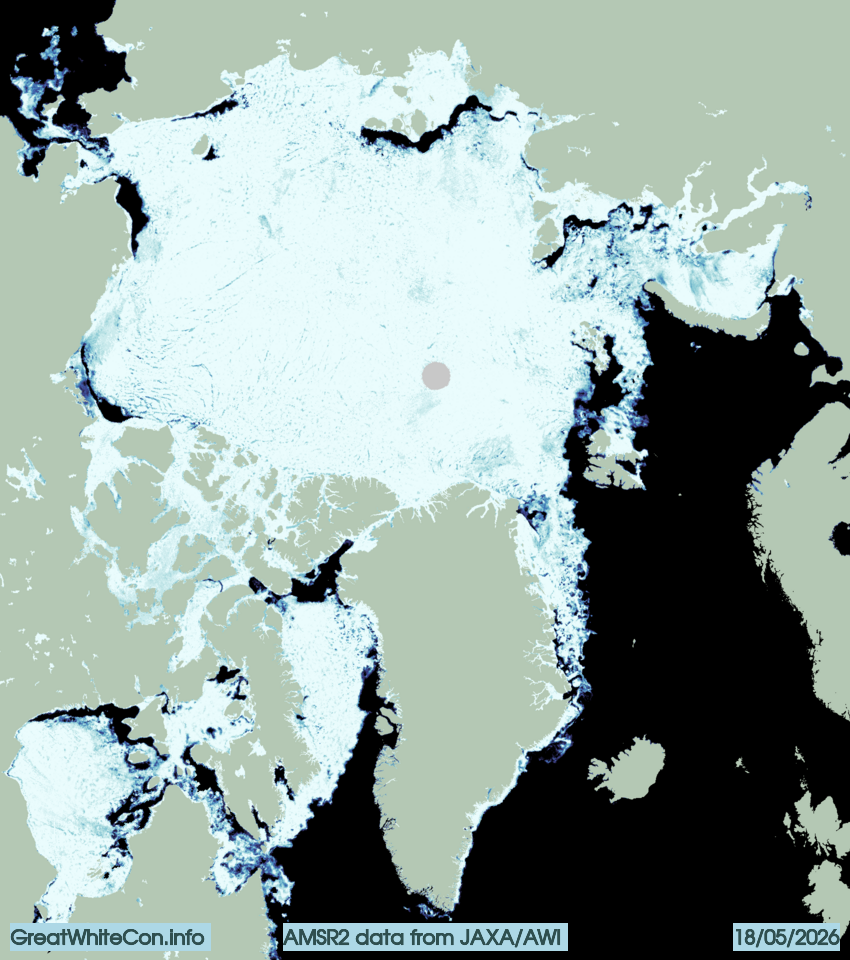
The Alfred Wegener Institute’s sea ice concentration data reveals open water in the Beaufort, Chukchi, East Siberian and Laptev Seas:
A change is perhaps even better than a rest? Let’s start February with a reminder that following close behind another recent Arctic cyclone, Storm Ingunn caused red weather warnings for high winds and avalanches in Norway two days ago:
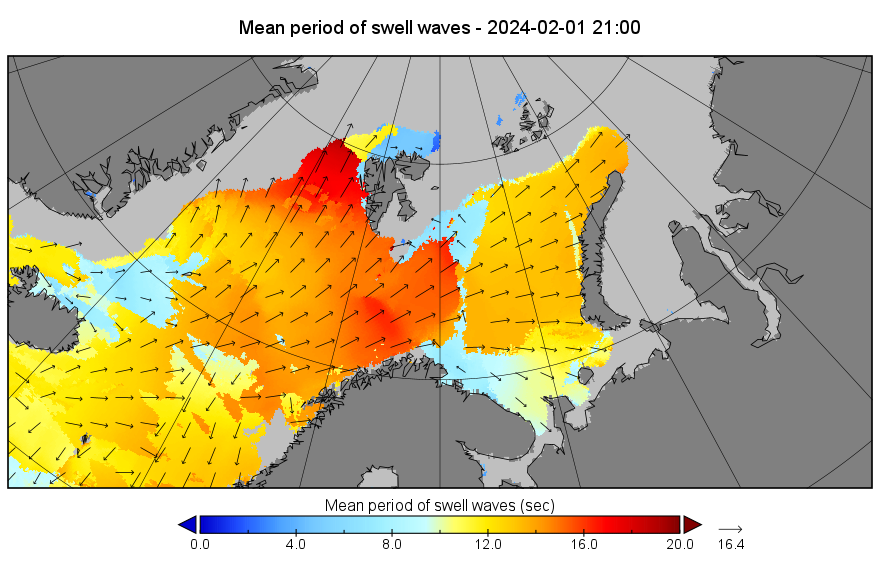
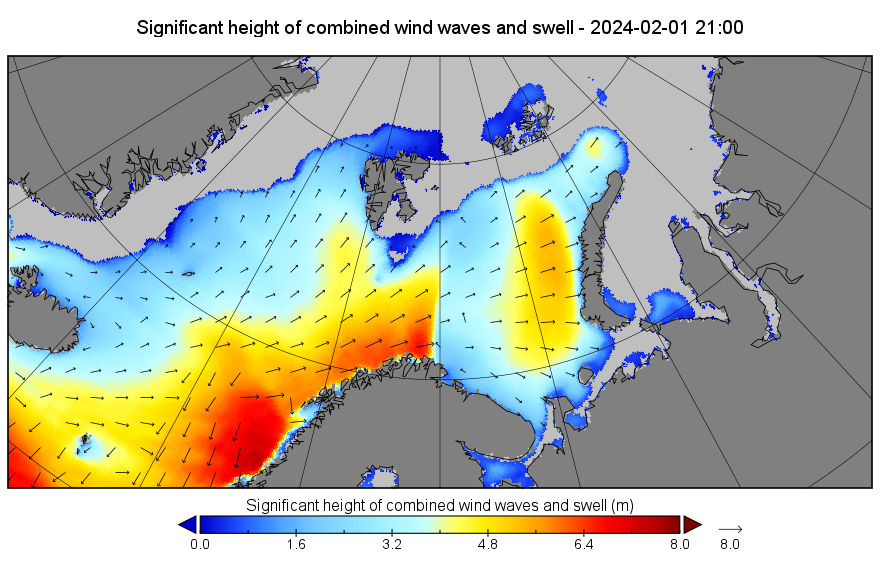
By yesterday evening another long period, storm driven swell was arriving at the sea ice edge in the Fram Strait, and to a lesser extent in the Barents Sea:
By this morning Ingunn had merged with the remnants of the prior cyclone, as revealed in Climate Reanalyzer’s visualisation of the latest GFS model run::
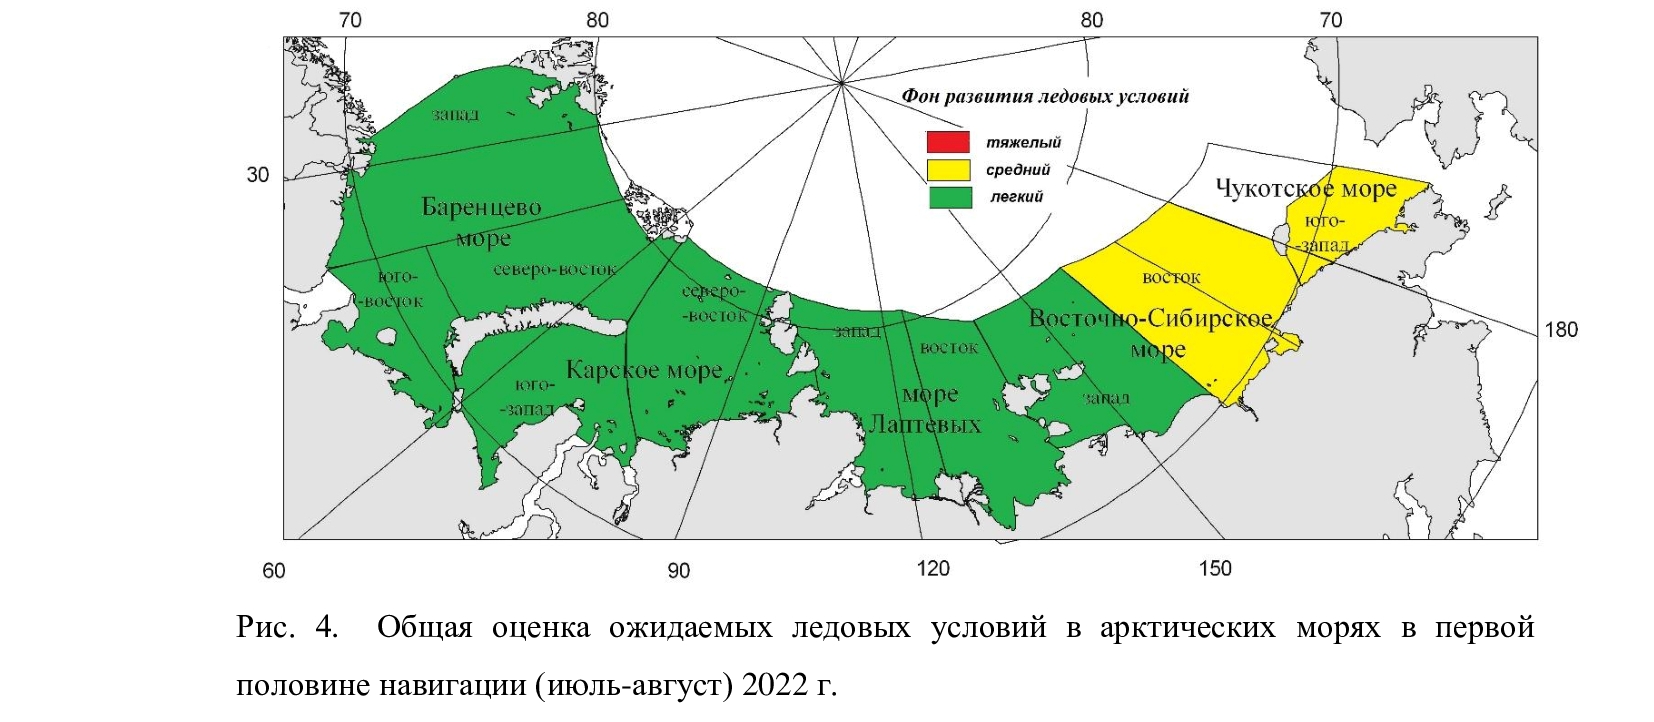
On June 17th the Northern Sea Route Administration published the Arctic and Antarctic Research Institute forecast of ice conditions for June to August 2022. Here’s the summary:
“Favorable” conditions in most areas, but “average” in the eastern East Siberian Sea and south west Chukchi Sea.
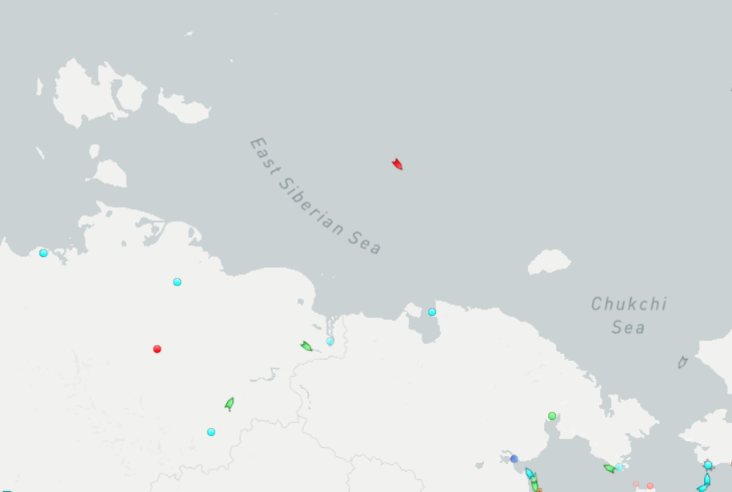
Traffic along the main Northern Sea Route has already begun. Marine Traffic reveals that the liquified natural gas carrier Nikolay Yevgenov is heading for the Bering Strait and has already sailed north of the New Siberian Islands. He is now entering the “average” ice area in the eastern ESS:
Meanwhile the recently commissioned nuclear powered icebreaker Sibir is patiently waiting in the Vilkitsky Strait:
The Northern Sea Route is evidently already “open” for ice hardened LNG tankers, but not yet for more conventional vessels. Here is the current AMSR2 sea ice concentration map:
Christmas is coming. Santa’s secret summer swimming pool has frozen over. The time has come for a new monthly Arctic update.
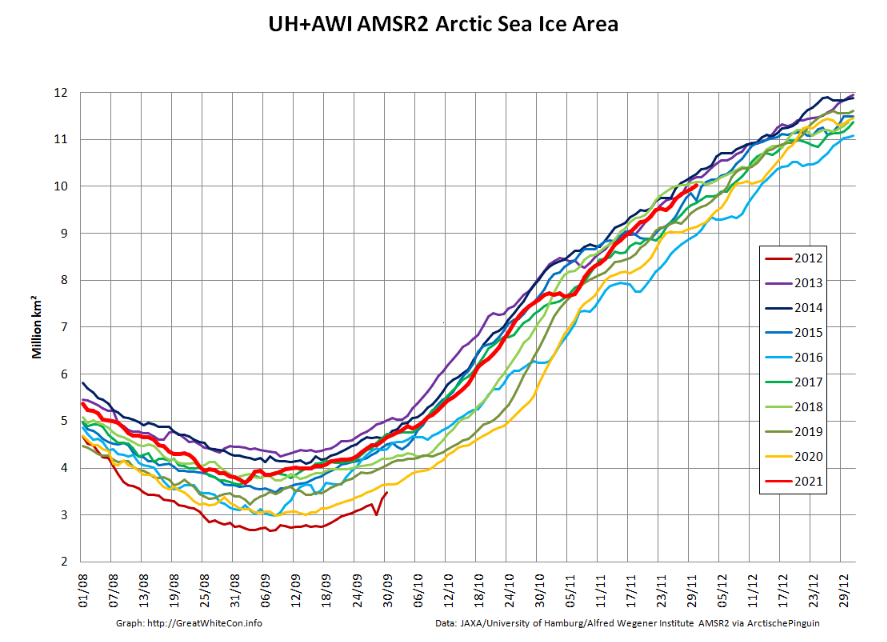
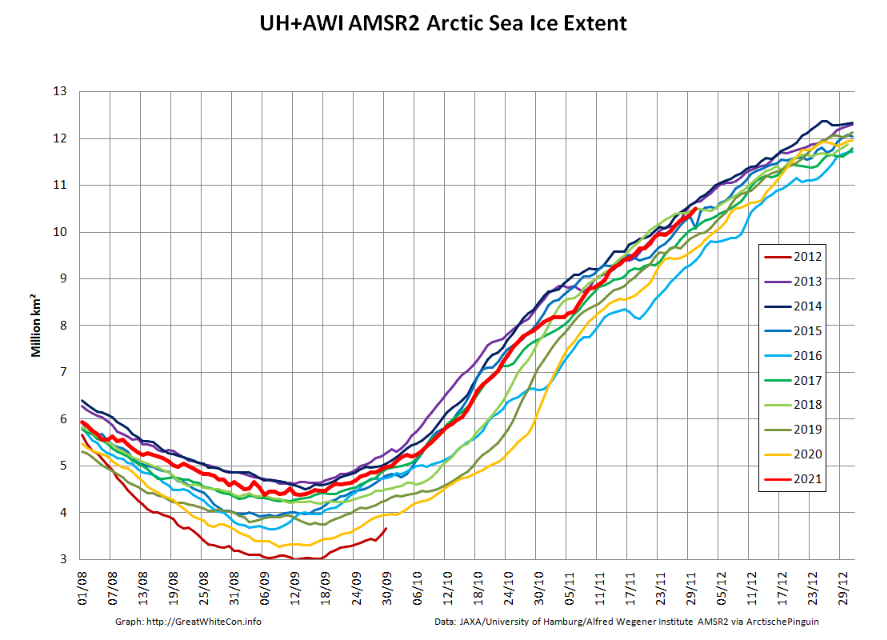
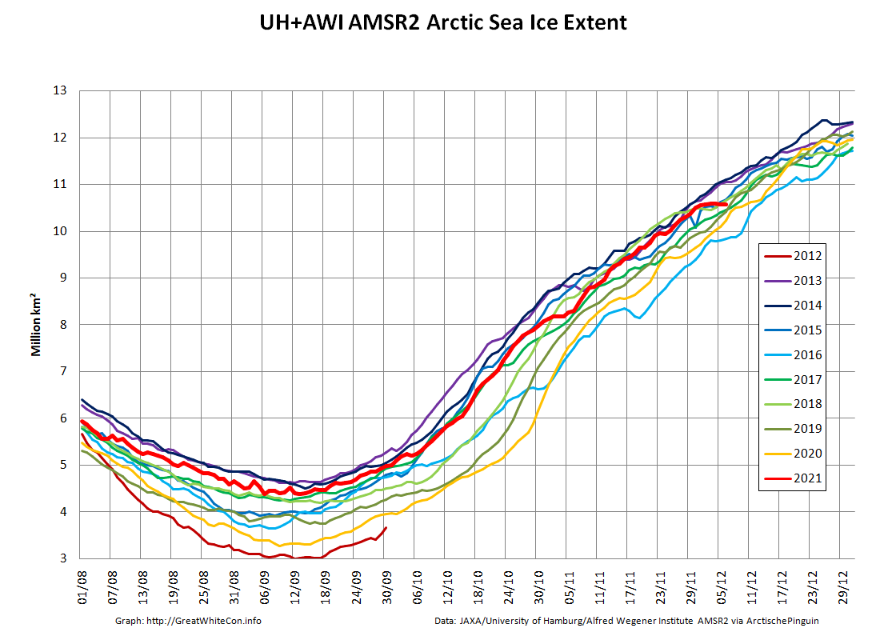
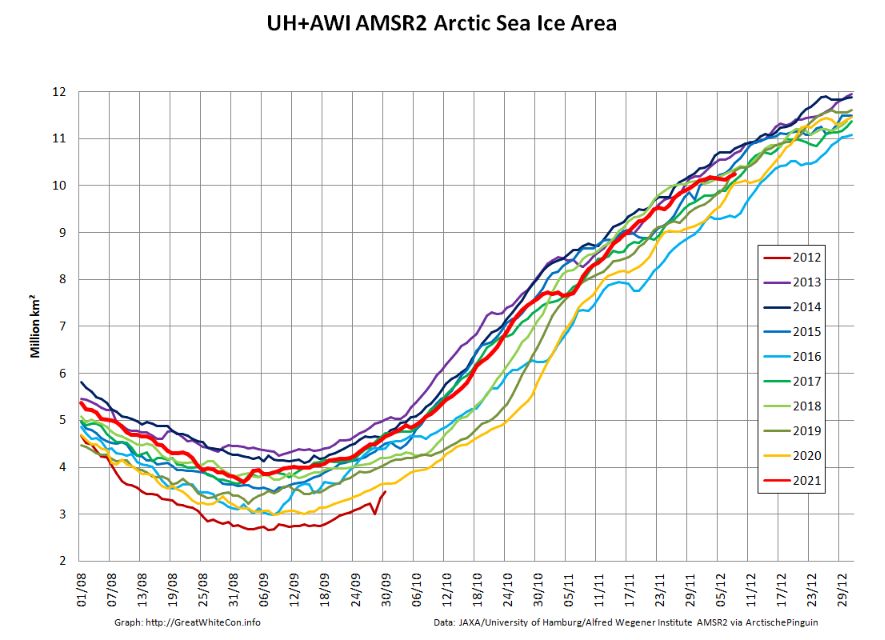
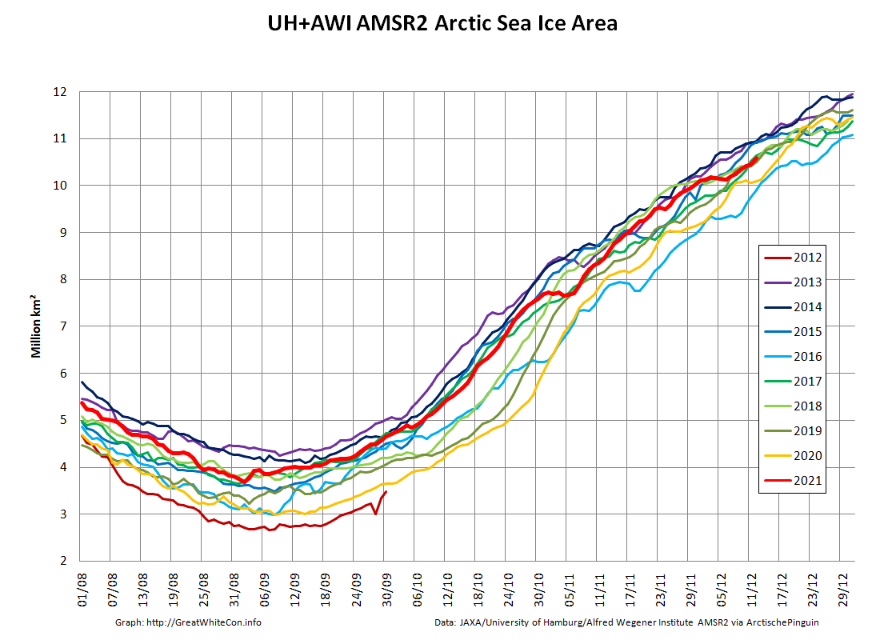
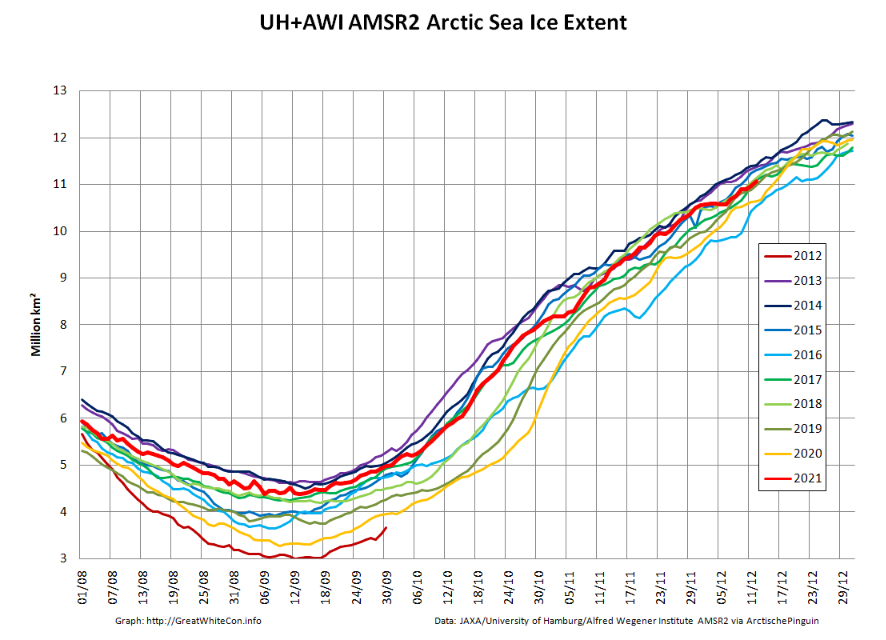
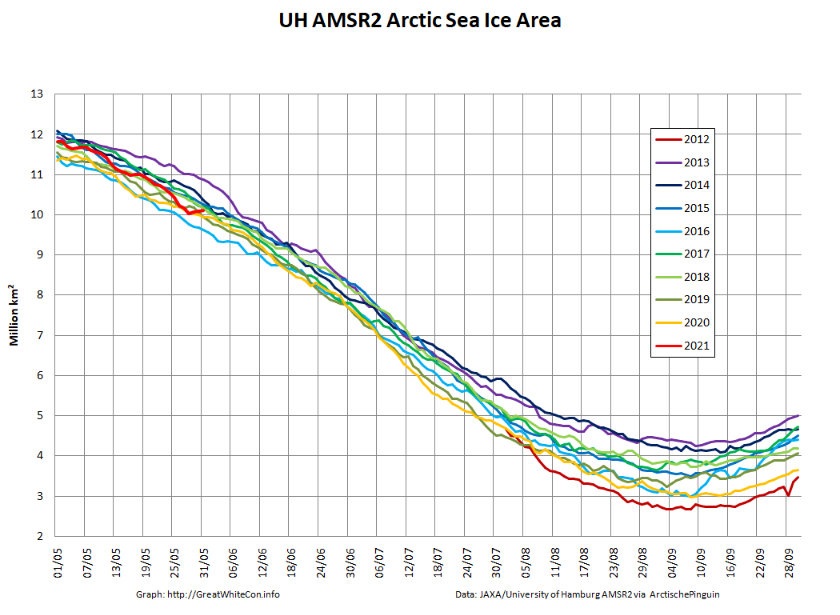
The JAXA/ADS/ViSHOP web site is undergoing maintenance for a week, so let’s start the festive season with a look at high resolution AMSR2 area and extent:
After a brief hiatus in early November both metrics are once again tracking within, but near the upper bound of the last 10 years.
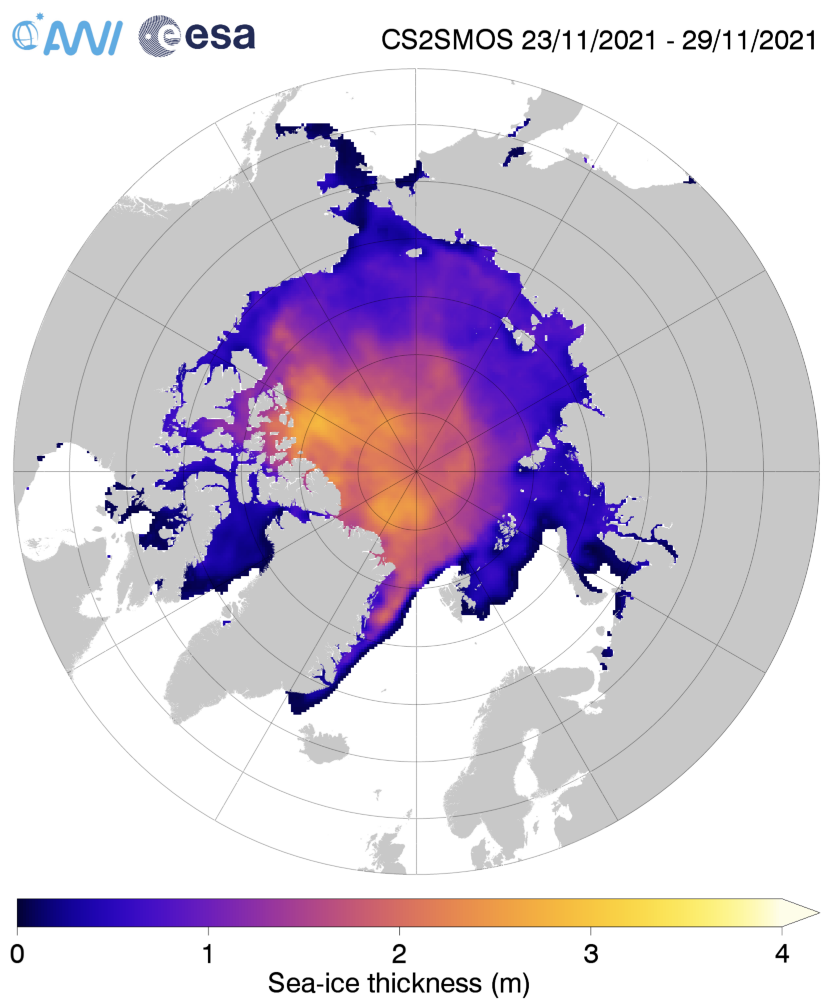
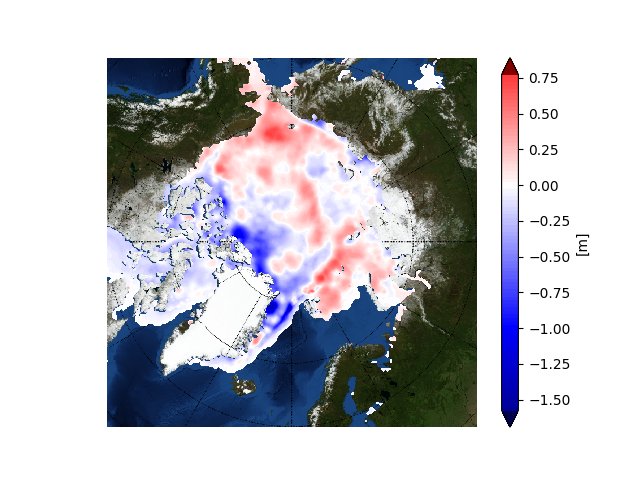
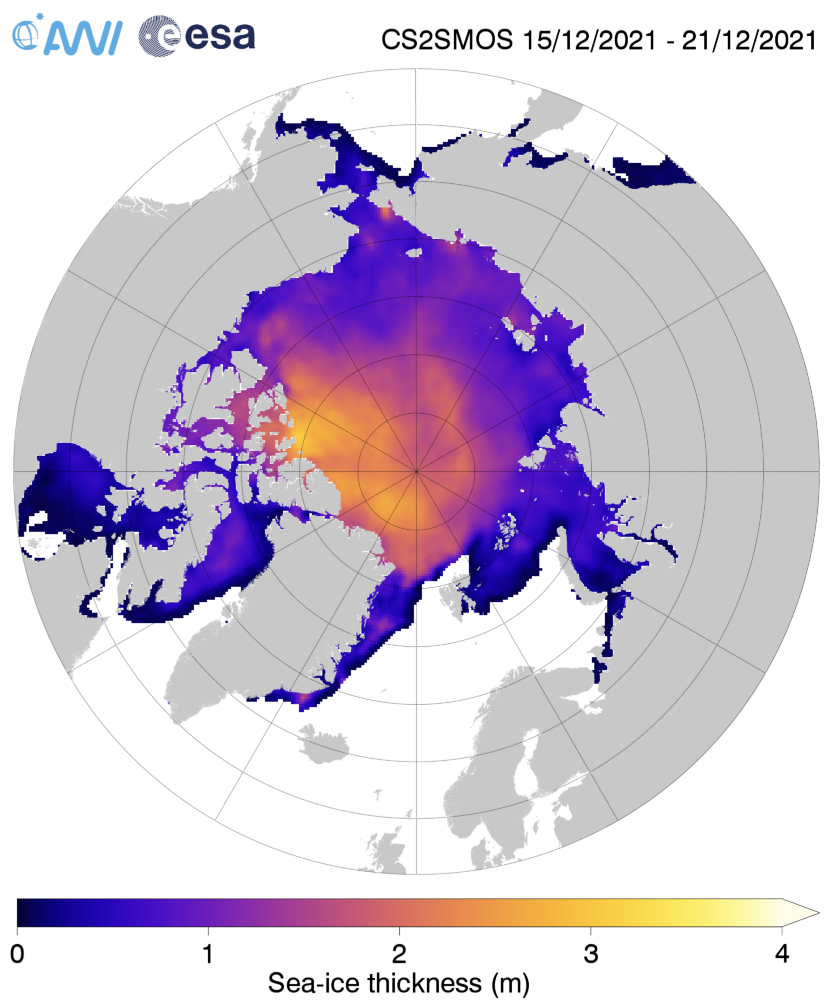
Next let’s take a look at the latest AWI CryoSat-2/SMOS thickness map:
together with the anomaly map from the Finnish Meteorological Institute:
Still thinner than usual in the so called “last ice area” north of Greenland and Ellesmere Island, and thicker than usual on the Siberian side of the Arctic, particularly in the Chukchi Sea.
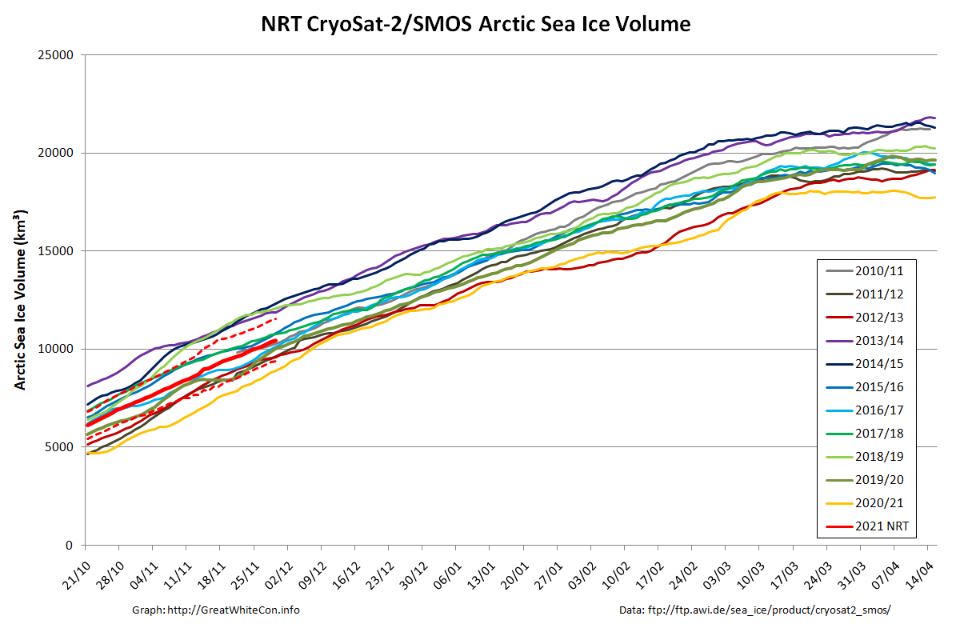
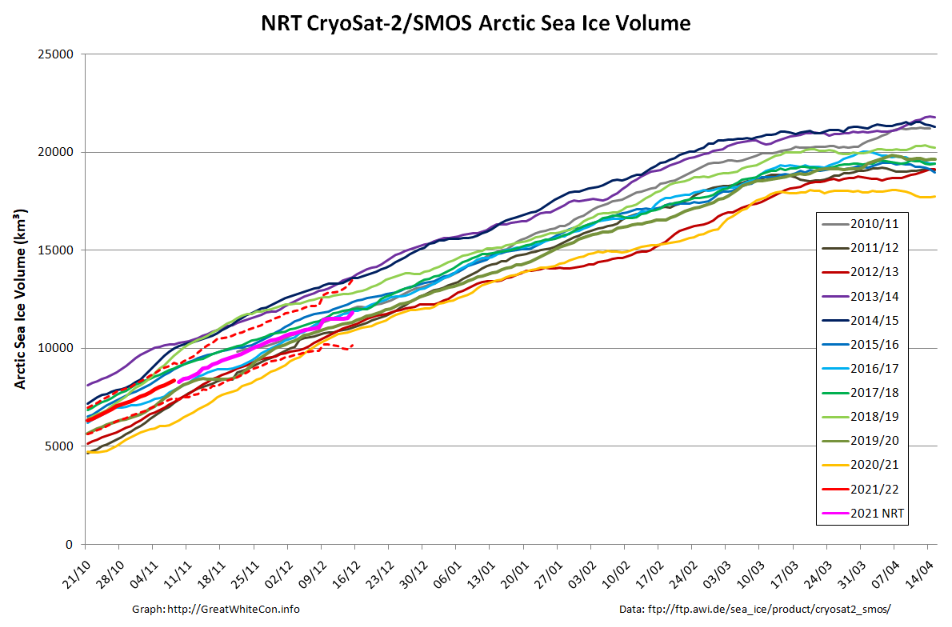
Finally, for the moment at least, here’s the latest CryoSat-2/SMOS volume graph:
Unlike the previous metrics, this particular one is close to the middle of the pack.
Sea ice extent increased at a faster than average pace through November and by the end of the month, extent was just within the interdecile range. Extent was above average in the Bering Sea, but Hudson Bay remained unusually ice free through the month.
The November 2021 monthly average extent was 9.77 million square kilometers (3.77 million square miles), which ranked tenth lowest in the satellite record. The 2021 extent was 930,000 million square kilometers (359,000 million square miles) below the 1981 to 2010 long-term average. Extent was higher than average in the Bering Sea, but is extremely low in Hudson Bay.
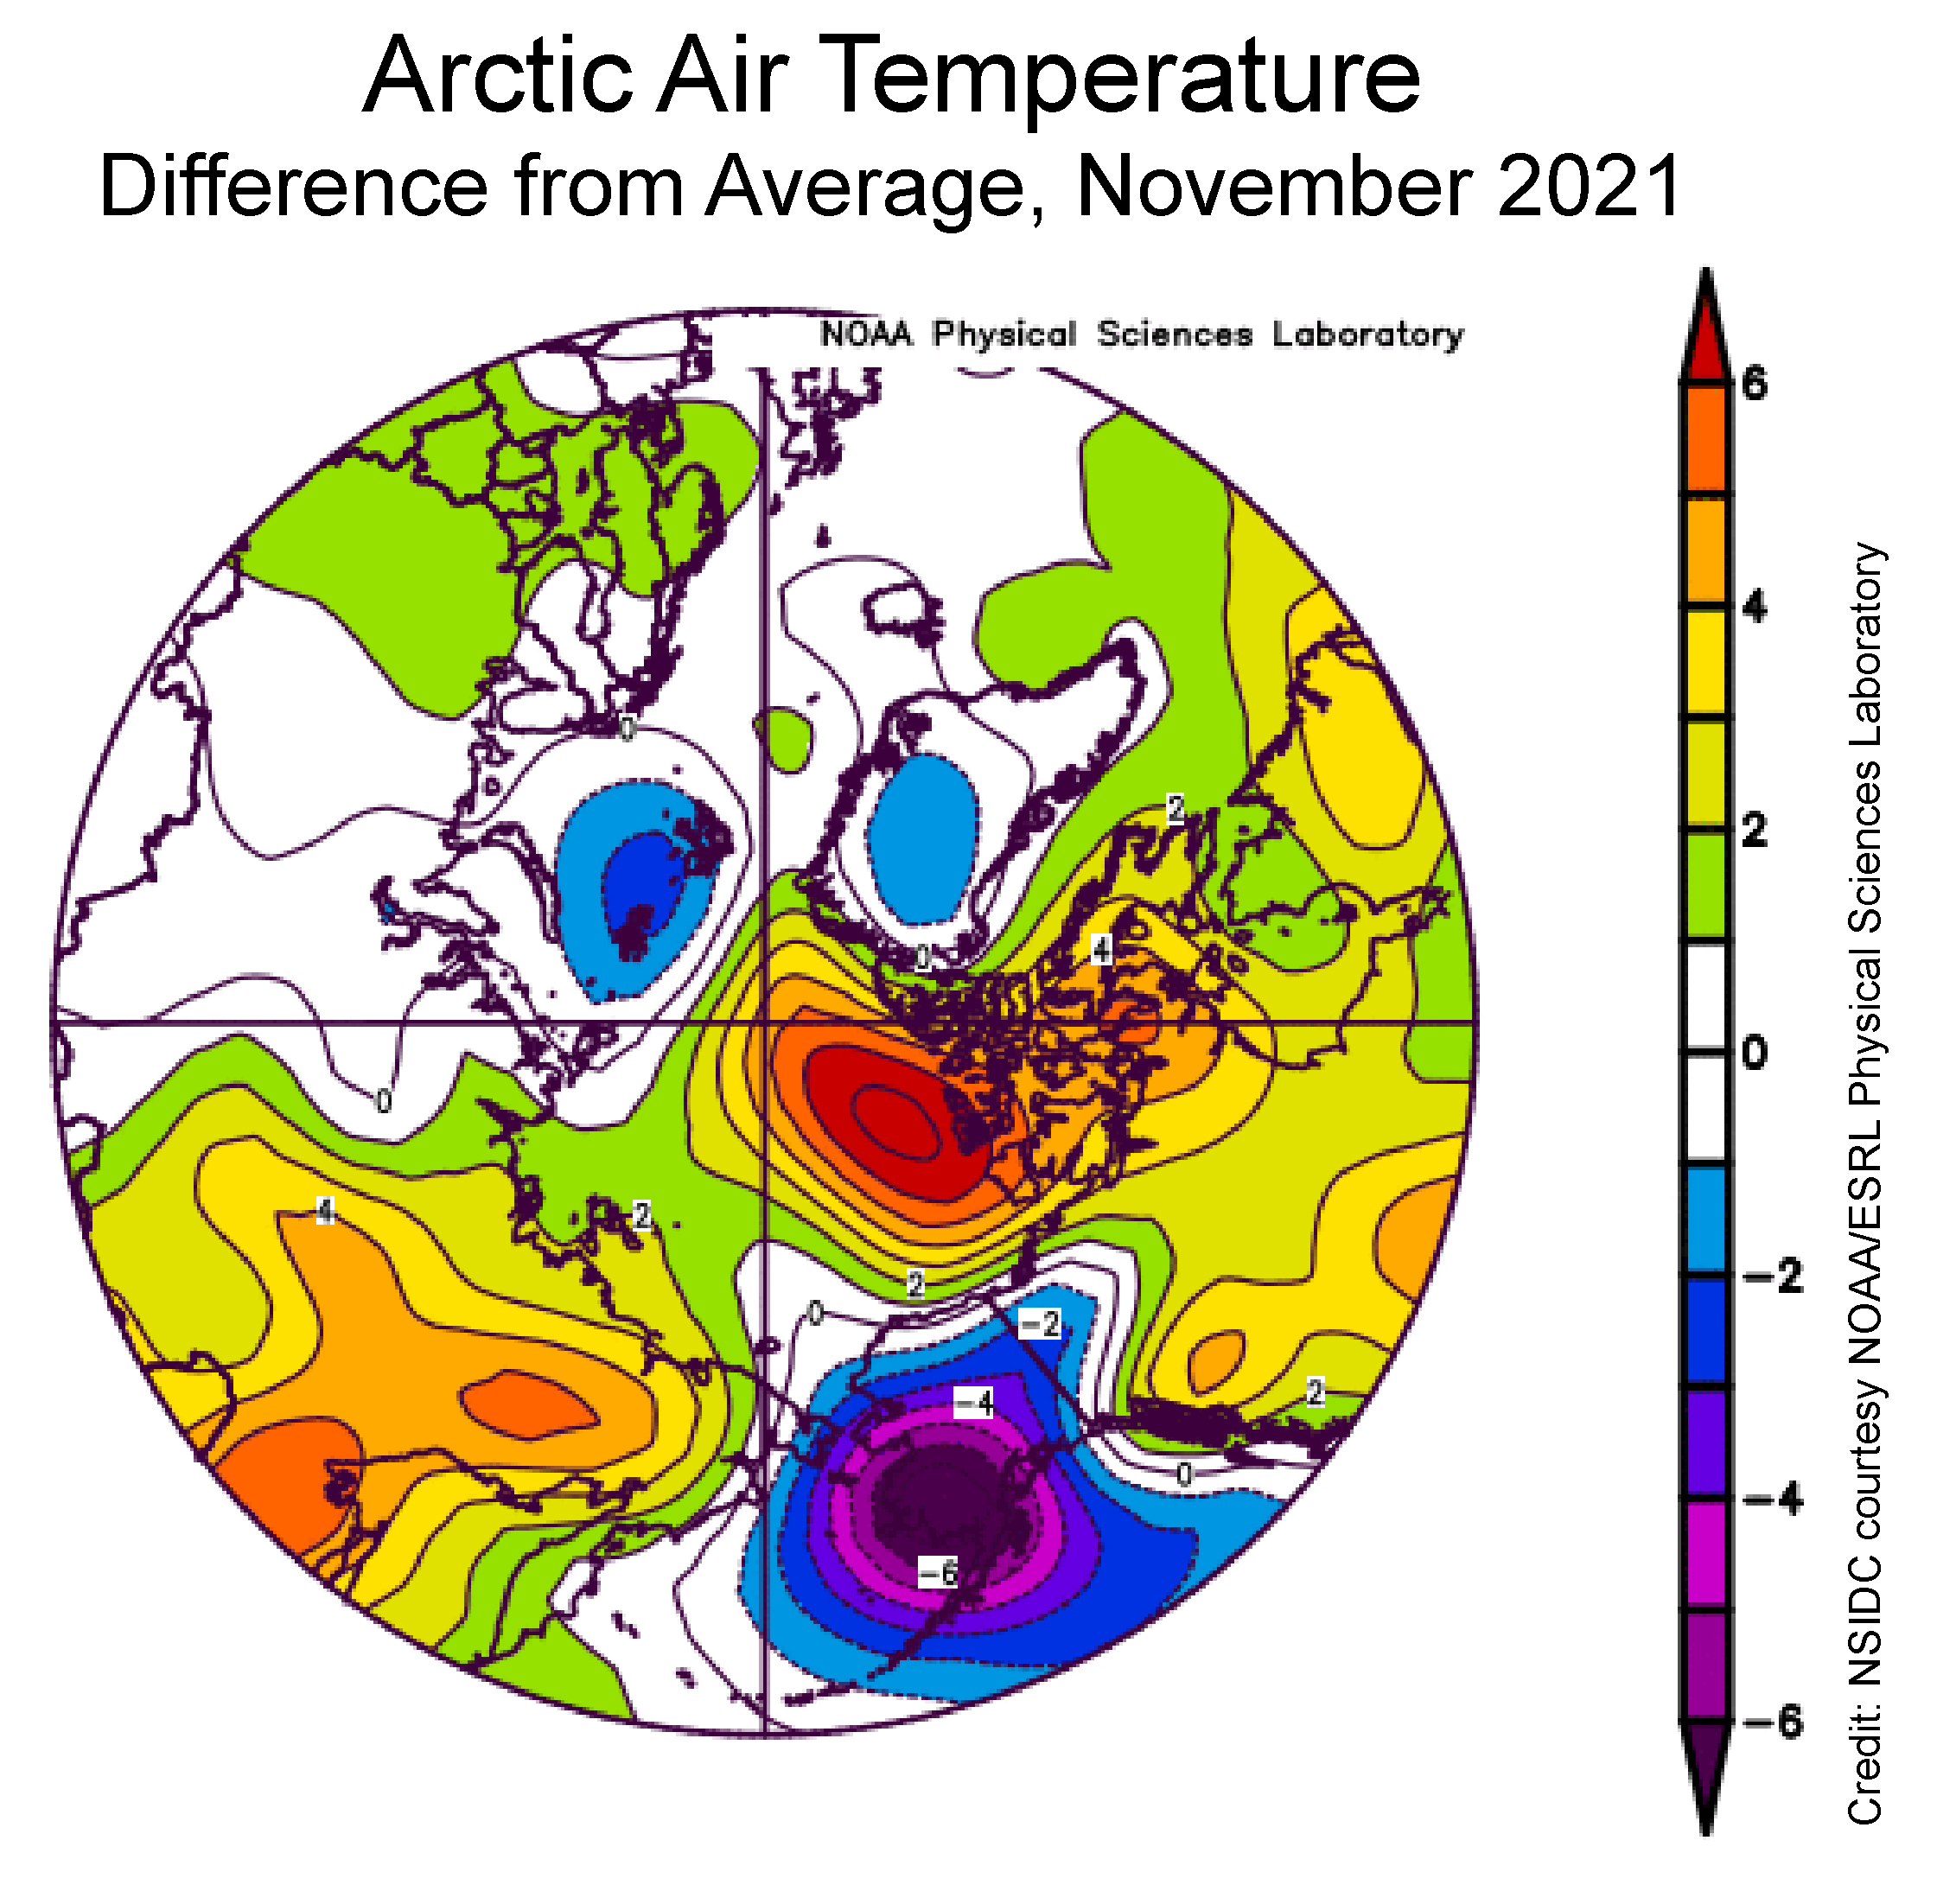
Air temperatures at the 925 millibar level (about 2,500 feet above the surface) were well above average north of the Canadian Archipelago, by as much as 6 degrees Celsius. Conversely, temperatures over southwest Alaska and the eastern sector of the Bering Sea were as much as 6 degrees Celsius below average:
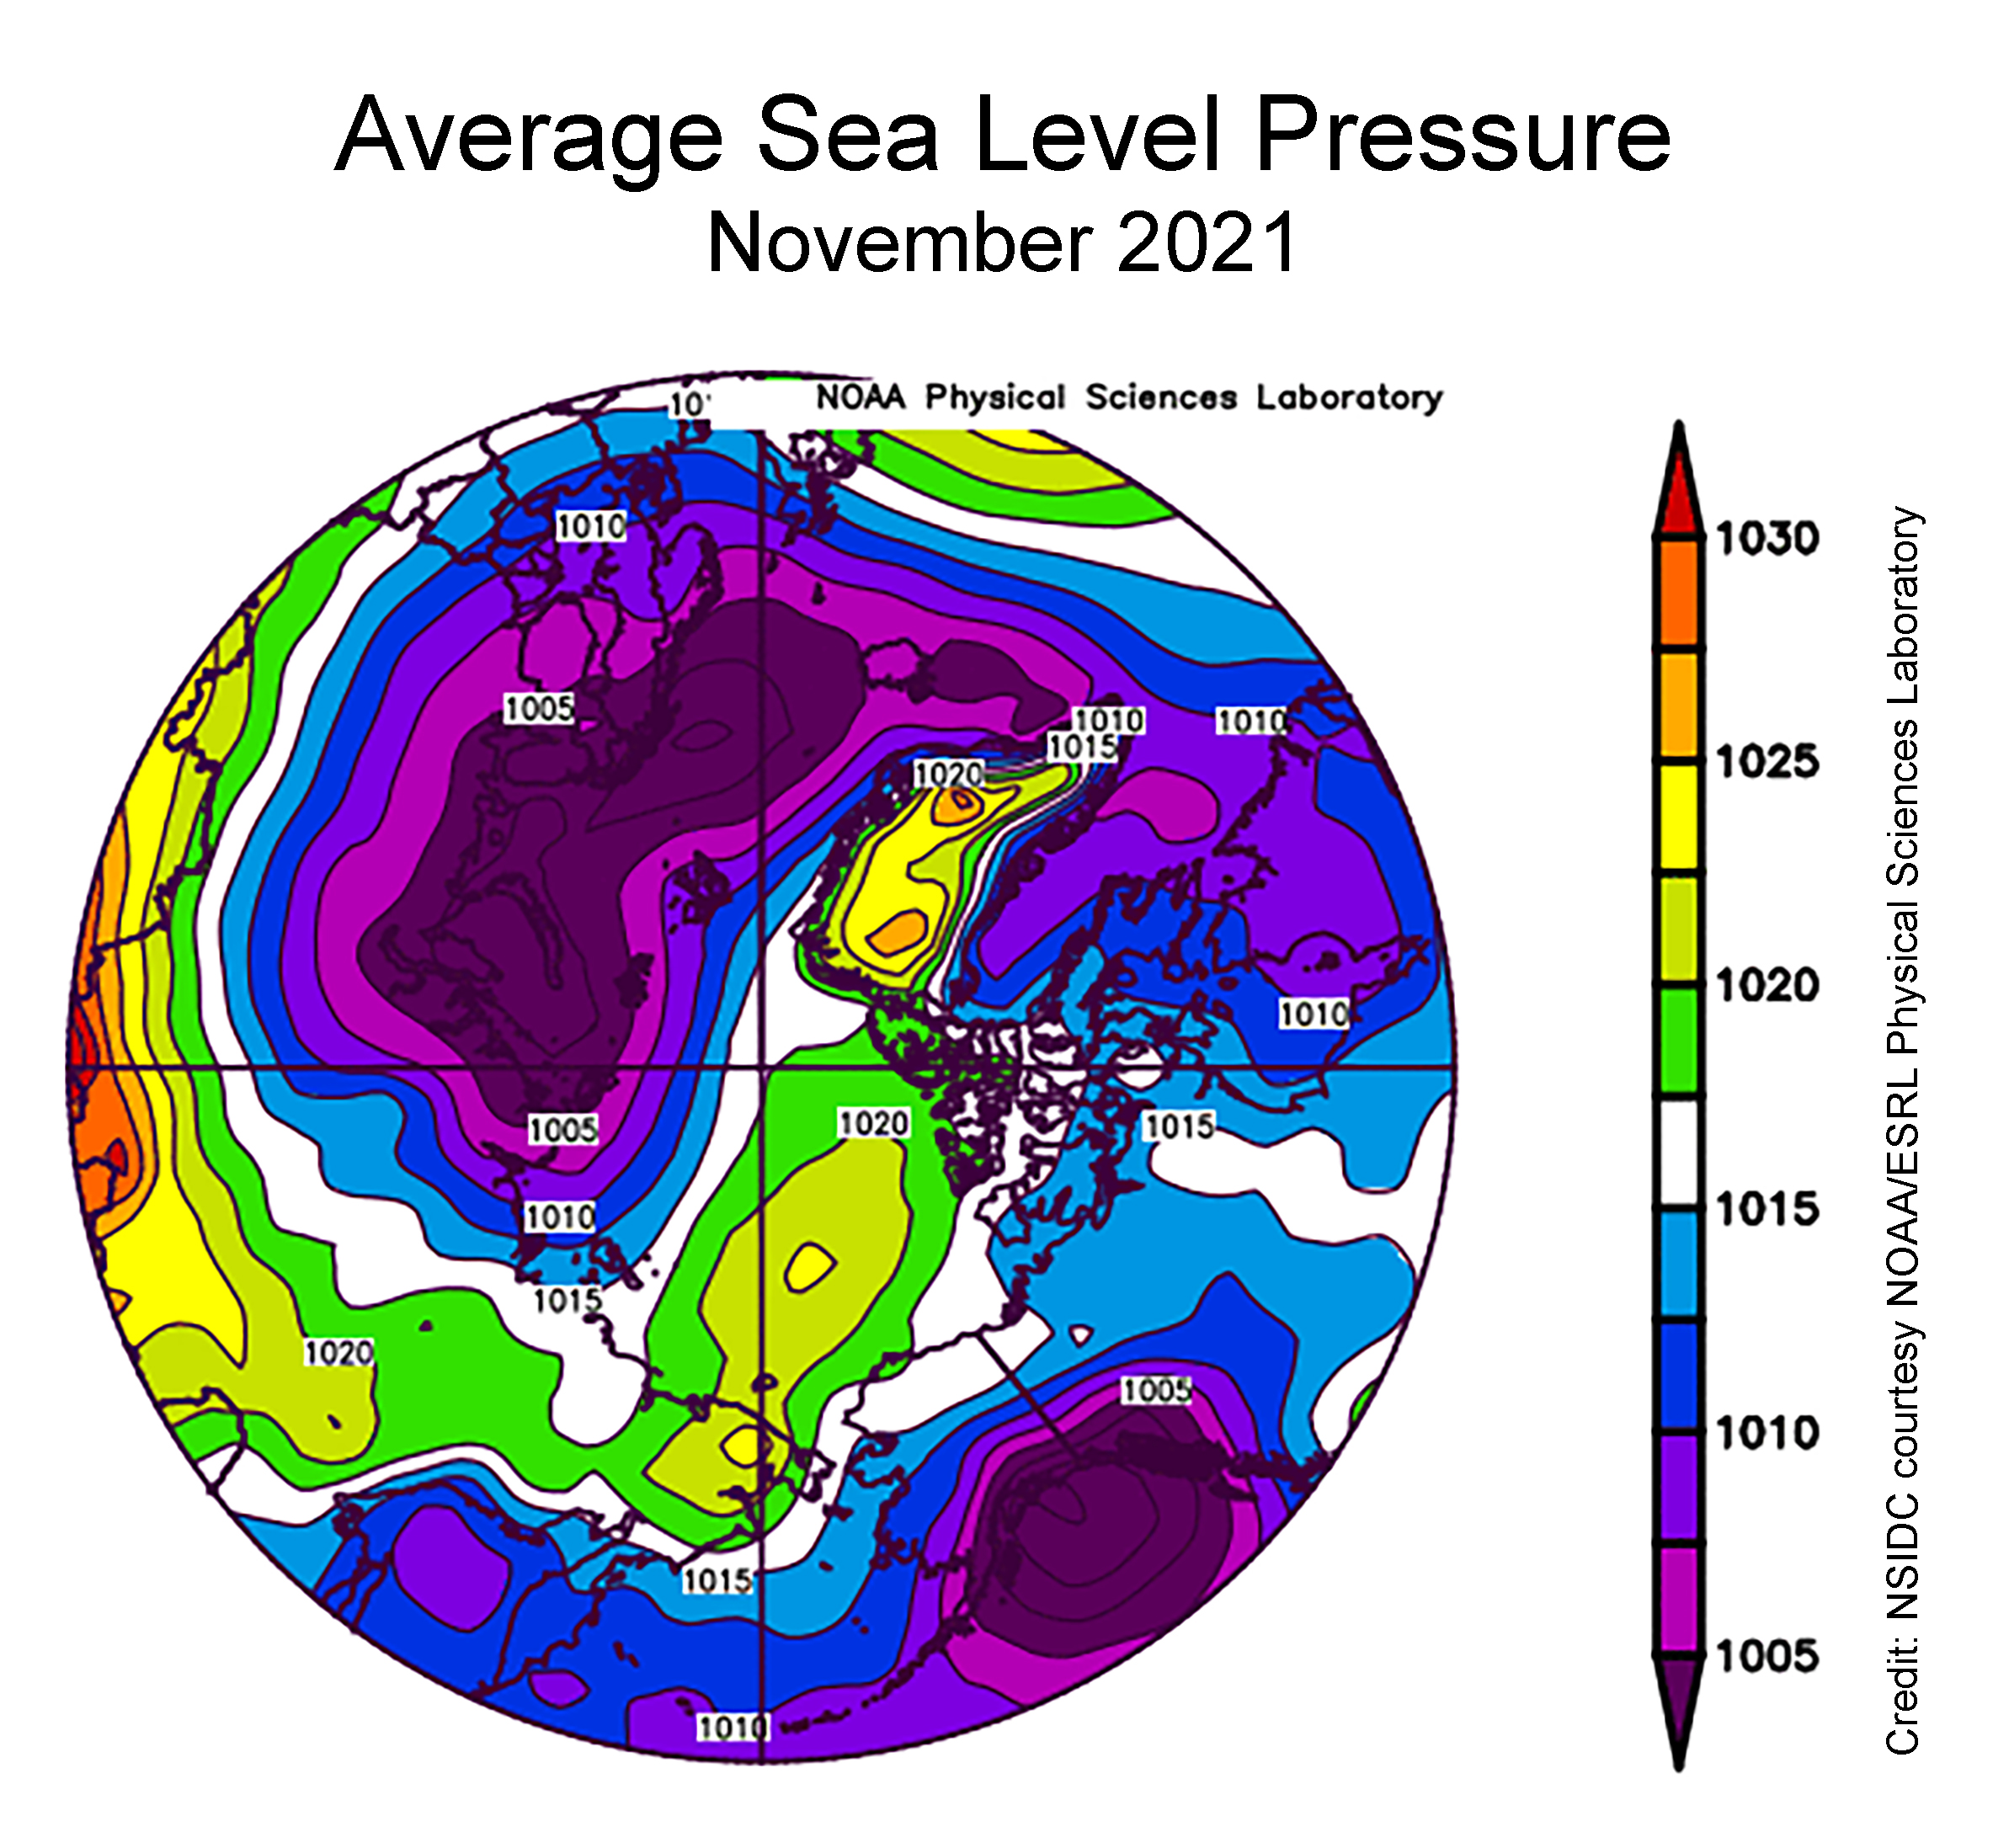
The sea level pressure pattern for November featured widespread low pressure over the Atlantic side of the Arctic and extending into the Barents and Kara Seas, paired with a moderately strong Beaufort Sea High. Strong low pressure over the Gulf of Alaska resulted in a circulation pattern in the eastern Bering Sea that brought cold air from the north. This pattern was favorable for sea ice growth, and can explain the above average ice extent in the region:
[Edit – December 7th]
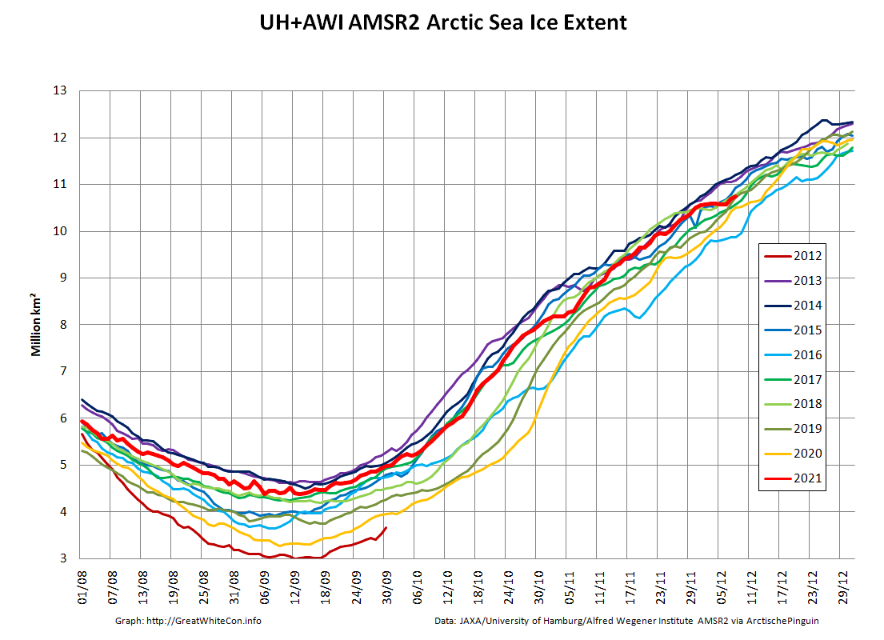
Since the start of December high resolution AMSR2 extent has been flatlining:
Sea ice area has even declined slightly over the past few days:
Here too is an animation created by Uniquorn on the Arctic Sea Ice Forum using AWI ASMR2 data to reveal ice movement through the Nares Strait during December:
[Edit – December 9th]
The JAXA/ADS/ViSHOP web site is down again, so let’s take another look at high resolution AMSR2 area and extent:
It seems that the “brief hiatus” is over, and extent is now in a “statistical tie” with 2018/19 at 4th lowest for the date amongst recent year.
[Edit – December 13th]
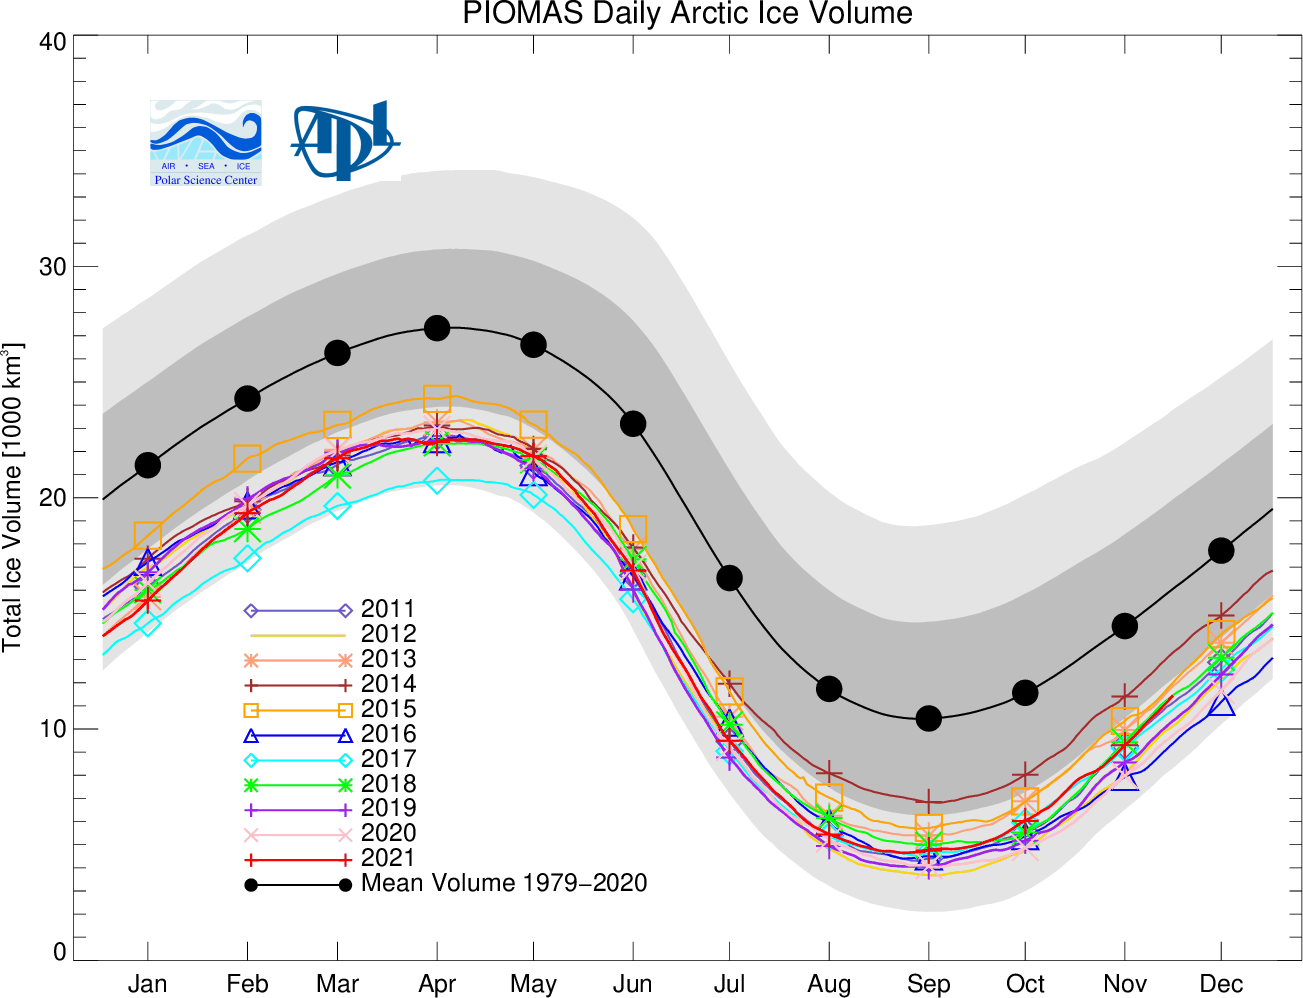
The PIOMAS Arctic sea ice volume data for November 2021 has been released:
Average Arctic sea ice volume in November 2021 was 7,830 km3. This value is the 7th lowest on record for November, about 1600 km3 above the record set in 2016. Monthly ice volume was 61% below the maximum in 1979 and 45% below the mean value for 1979-2020. Average November 2021 ice volume was about one sigma above the 1979-2020 trend line. October saw relative rapid ice growth for recent years bringing the mean ice thickness (above 15 cm thickness) above the recent low values:
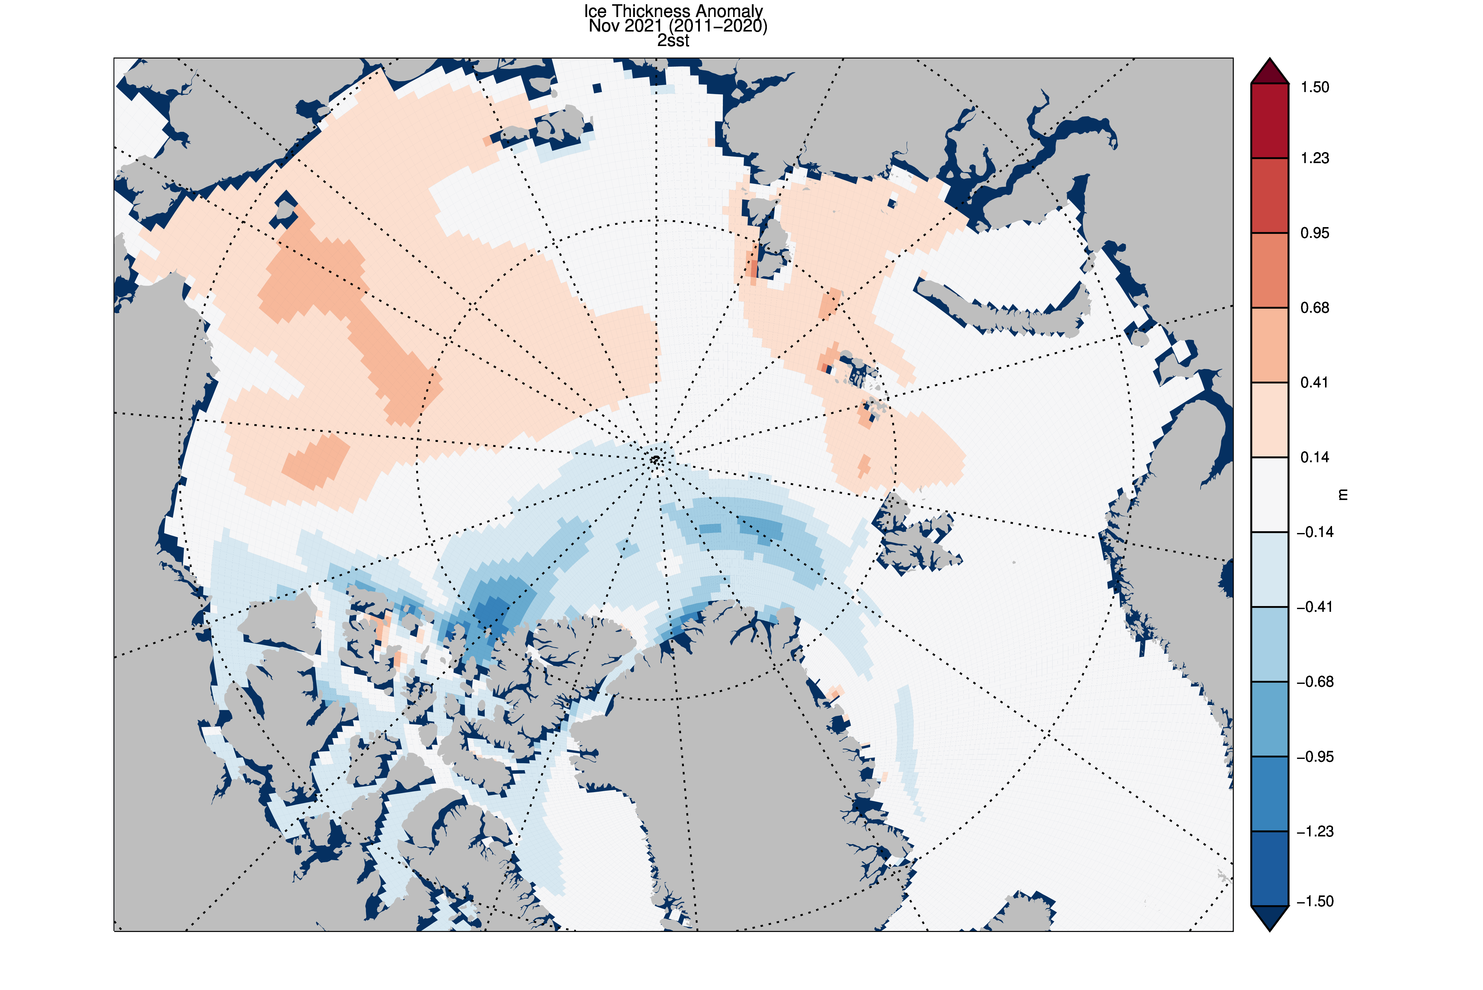
The ice thickness anomaly map for November 2021 relative to 2011-2020 continues to show anomalies divided into positive and a negative halves with areas of positive anomalies increasing since the two prior months. Negative anomalies stretching from North of Greenland and along the Canadian Archipelago across the Eastern Arctic into the Barents Sea. Areas North of Greenland again feature very low ice thickness as in prior years (see our recent paper). Positive anomalies are notable in the Beaufort and Chukchi seas due to advection of thicker older ice into the areas during the previous winter (See recent paper on this). The Alaskan summer has also been relatively cold contributing to unusually thick ice in this area:
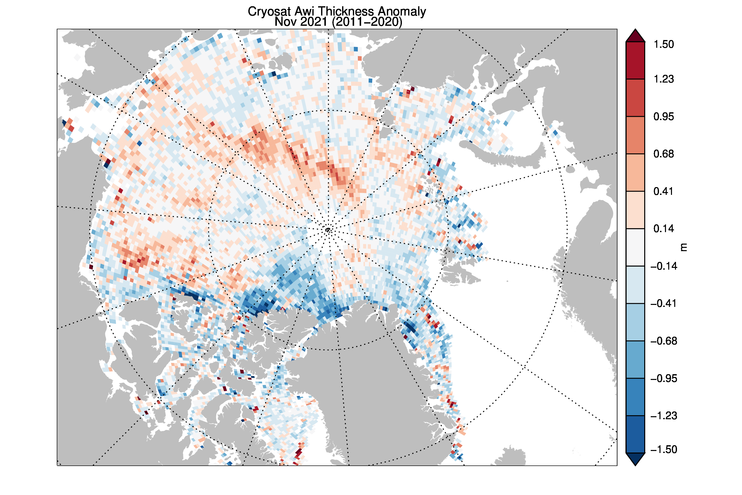
CryoSat-2 ice thickness shows a similar picture sea ice thickness anomalies but with the maxima slightly displaced which maybe due to temporal sampling of the composite:
The JAXA web site is still down, so here’s another set of high resolution AMSR2 graphs:
[Edit – December 14th]
NOAA have just released their 2021 Arctic Report Card. Here’s the introductory video:
“Everybody knows [the Arctic] is a canary when it comes to climate change,” says Peter Jacobs, a climate scientist at NASA’s Goddard Space Flight Center, who presented the work on 13 December at a meeting of the American Geophysical Union. “Yet we’re misreporting it by a factor of two. Which is just bananas.”
Jacob’s co-authors include researchers who oversee several influential global temperature records, and they noted the faster Arctic warming as they prepared to release the global temperature average for 2020. NASA’s internal peer reviewer challenged the higher figure, suggesting the scientific literature didn’t support it. But the researchers have found the four times ratio holds in record sets from both NASA (3.9) and the United Kingdom’s Met Office (4.1), and they hope to soon include the Berkeley Earth record. (Their work also has company: In July, a team at the Finnish Meteorological Institute posted a preprint also arguing for the four times figure.)
The researchers found Arctic warming has been underestimated for a couple of reasons. One is climate scientists’ tendency to chop each hemisphere into thirds and label the area above 60°N as the “Arctic”—an area that would include, for example, most of Scandinavia. But the true definition of the Arctic is defined by Earth’s tilt. And, as has been known for centuries, the Arctic Circle is a line starting at 66.6°N. When researchers lump in the lower latitudes, “you’re diluting the amount of Arctic warming you’re getting,” Jacobs says. “That is not a trivial thing.”
The other difference is the choice of time periods over which the warming rate is calculated. Jacobs and his colleagues focused on the past 30 years, when a linear warming trend emerged for the Arctic. Analyses that look at longer term trends see less divergence between the Arctic and the world.
[Edit – December 23rd]
Here is the latest CryoSat-2/SMOS volume graph, now including some reanalysed data which seems to have come in slightly higher than the earlier “near real time” numbers:
Plus the AWI thickness map:
Further discussion of the divergence between volume and extent continues in the new New Year 2022 thread:
It’s not November until tomorrow, but Andy Lee Robinson has just published the 2021 edition of his long running “Arctic ice cube” video series, based on the PIOMAS volume data. Here it is for your edification:
By way of a change we start this month’s look at all things Arctic with some sea ice statistical analysis. Anthony Watts’ Arctic porky pie production line has been speeding up recently, and I am not the only one who has noticed. As part of his takedown of the latest “skeptical” allegations against the United Kingdom Met Office Tamino has been looking at trends in Arctic sea ice extent over at his “Open Mind” blog:
First and foremost, the yearly minimum is only one day out of the year. We have sea ice extent data throughout the year, and what happens during the rest of the year counts. Instead of using the annual minimum, let’s use the annual average. To avoid losing the most recent data, I’ll compute the yearly average for October through the following September rather than the usual (but arbitrary) January through December. I’ll also omit October 1978 through September 1979 because that year is incomplete. I get this:
The annual averages show much less fluctuation than the annual minima, so we can estimate things like rates of change with greater precision. I find that there is statistical evidence that the rate changed over time. One model of such changes uses three straight-line segments with their changes chosen to best-fit the data, like this:
Back in 2013 I sat around a table with the Chinese delegation during lunch at the Economist’s Arctic Summitin Oslo. In the evening there was a reception with the British Ambassador to Norway, where amongst other people I met Kevin Vallely.
Fast forwarding to July 2021, the Chinese icebreaker Xue Long 2 (which translates to Snow Dragon 2) set sail from Shanghai to do some research in the Central Arctic Basin:
According to a report by the China Global Television Network (CGTN):
The expedition plans to monitor sea, marine ice, atmosphere, microplastics and ocean acidification in the high seas of the Arctic through navigation observation, cross-sectional survey and satellite remote sensing to obtain hydrological, meteorological and biological data of the region.
It will also conduct scientific surveys in the Gakkel Ridge in the Arctic Ocean to learn about the formation of rocks and magma and the geomorphic features there to further enhance knowledge of the natural environment in the North Pole.
The U.S. Coast Guard demonstrated its commitment to the Bering Sea and Arctic region with deployments of national security cutters Bertholf and Kimball, and a U.S. Arctic patrol by icebreaker Healy.
“Security in the Bering Sea and the Arctic is homeland security,” said Vice Adm. Michael McAllister, commander Coast Guard Pacific Area. “The U.S. Coast Guard is continuously present in this important region to uphold American interests and protect U.S. economic prosperity.”
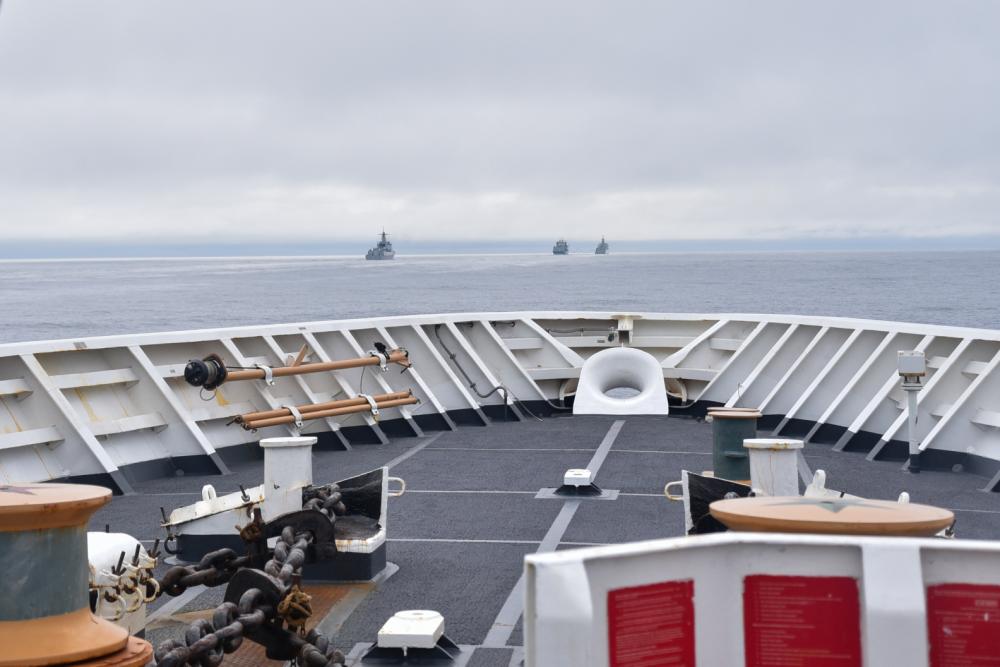
Crews interacted with local, national and international vessels throughout the Arctic. During the deployment, Bertholf and Kimball observed four ships from the People’s Liberation Army Navy (PLAN) operating as close as 46 miles off the Aleutian Island coast. While the ships were within the U.S. exclusive economic zone, they followed international laws and norms and at no point entered U.S. territorial waters.
The PLAN task force included a guided missile cruiser, a guided missile destroyer, a general intelligence vessel, and an auxiliary vessel. The Chinese vessels conducted military and surveillance operations during their deployment to the Bering Sea and North Pacific Ocean.
All interactions between the U.S. Coast Guard and PLAN were in accordance with international standards set forth in the Western Pacific Naval Symposium’s Code for Unplanned Encounters at Sea and Convention on the International Regulations for Preventing Collisions at Sea.
Now comes more news via CGTN, which according to YouTube “is funded in whole or in part by the Chinese government”, that:
Chinese captain Zhai Mo’s sailing boat is currently on the Northwest Passage of the Arctic Ocean.
According to the CGTN video it was “streamed live on Sep 15, 2021” from “Ilulissat, Denmark”. Then on September 16th CGTN reported that:
Canada has illegally stopped Chinese captain Zhai Mo and his crew while circumnavigating their sailboat in the Arctic Ocean near Lancaster Sound, a part of the northwest passage.
The United Nations defines the “right of innocent passage” as a vessel’s right to enter and pass through another’s territory as long as it is not prejudicial to the peace, good order or security of the other state.
Ilulissat is of course a long way from Denmark, and also a considerable distance from Lancaster Sound. Which perhaps explains why CBC reported on September 17th that:
Canadian officials are disputing reports in Chinese media that a famous sailor from that country attempting to circumnavigate the Arctic was turned back in the Northwest Passage…
Transport Canada told CBC News in an email on Friday that it was aware of Zhai’s vessel, but said “at this point, it has not entered Canada’s Arctic Waters.” The Northwest Passage has been off limits to foreign pleasure craft since March 2020 due to an interim order from the Canadian government intended to limit the risk of introducing COVID-19 in remote Arctic communities.
Transport Canada said it was in touch with Zhai via email to inform him of the rule.
“Transport Canada has since seen public reports that Captain Zhai Mo no longer plans to pass through Canadian Arctic waters and the department continues to monitor the situation,” the department said in a second statement to CBC News on Friday evening.
It seems to me that no longer planning to pass through Canadian Arctic waters is very prudent on Zhai Mo‘s part, since navigating the Northwest Passage without support from Xue Long 2 or a Canadian icebreaker is currently fraught with difficulty:
[Edit – September 21st]
By way of some additional background information, on January 26th 2018 China published a “white paper” on China’s Arctic Policy:
China is an important stakeholder in Arctic affairs. Geographically, China is a “Near-Arctic State”, one of the continental States that are closest to the Arctic Circle. The natural conditions of the Arctic and their changes have a direct impact on China’s climate system and ecological environment, and, in turn, on its economic interests in agriculture, forestry, fishery, marine industry and other sectors.
China is also closely involved in the trans-regional and global issues in the Arctic, especially in such areas as climate change, environment, scientific research, utilization of shipping routes, resource exploration and exploitation, security, and global governance. These issues are vital to the existence and development of all countries and humanity, and directly affect the interests of non-Arctic States including China. China enjoys the freedom or rights of scientific research, navigation, overflight, fishing, laying of submarine cables and pipelines, and resource exploration and exploitation in the high seas, the Area and other relevant sea areas, and certain special areas in the Arctic Ocean, as stipulated in treaties such as the UNCLOS and the Spitsbergen Treaty, and general international law. As a permanent member of the UN Security Council, China shoulders the important mission of jointly promoting peace and security in the Arctic. The utilization of sea routes and exploration and development of the resources in the Arctic may have a huge impact on the energy strategy and economic development of China, which is a major trading nation and energy consumer in the world. China’s capital, technology, market, knowledge and experience is expected to play a major role in expanding the network of shipping routes in the Arctic and facilitating the economic and social progress of the coastal States along the routes. China has shared interests with Arctic States and a shared future with the rest of the world in the Arctic.
Followed by:
The Arctic shipping routes comprise the Northeast Passage, Northwest Passage, and the Central Passage. As a result of global warming, the Arctic shipping routes are likely to become important transport routes for international trade. China respects the legislative, enforcement and adjudicatory powers of the Arctic States in the waters subject to their jurisdiction. China maintains that the management of the Arctic shipping routes should be conducted in accordance with treaties including the UNCLOS and general international law and that the freedom of navigation enjoyed by all countries in accordance with the law and their rights to use the Arctic shipping routes should be ensured. China maintains that disputes over the Arctic shipping routes should be properly settled in accordance with international law.
China hopes to work with all parties to build a “Polar Silk Road” through developing the Arctic shipping routes. It encourages its enterprises to participate in the infrastructure construction for these routes and conduct commercial trial voyages in accordance with the law to pave the way for their commercial and regularized operation.
Let’s begin the month with a “true colour” image from the Terra satellite of the Laptev Sea and thereabouts:
The blueish tinge indicates the appearance of melt ponds almost everywhere over the land-fast ice currently covering the majority of the Laptev Sea.
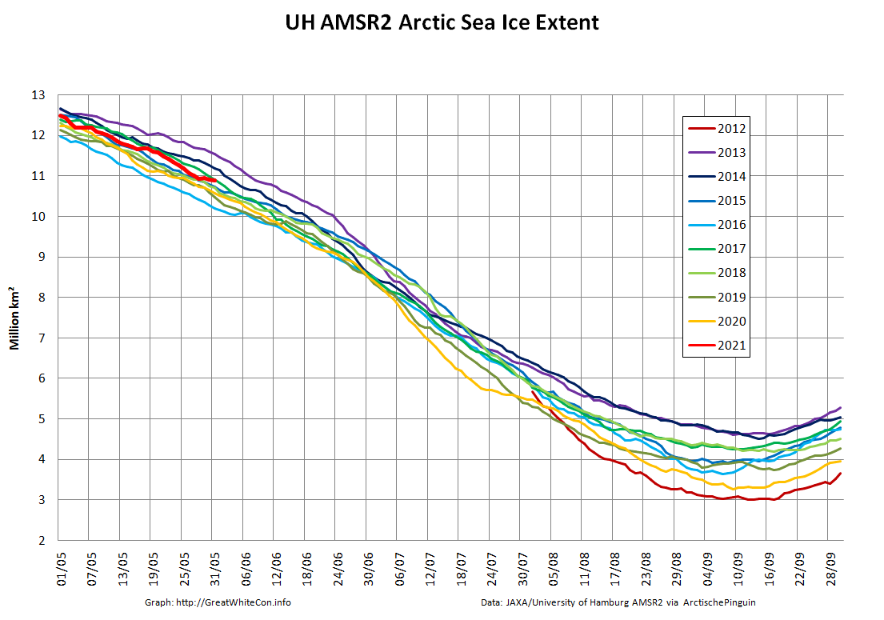
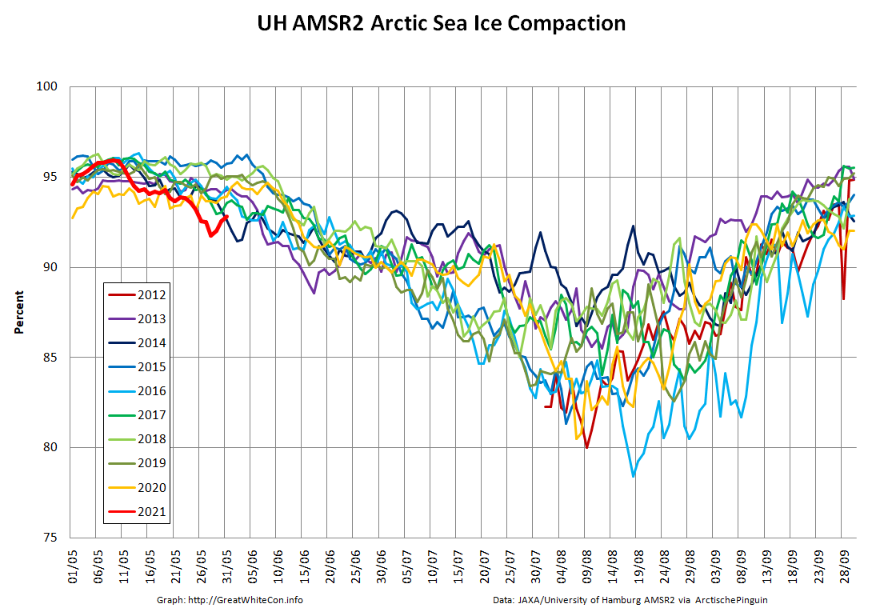
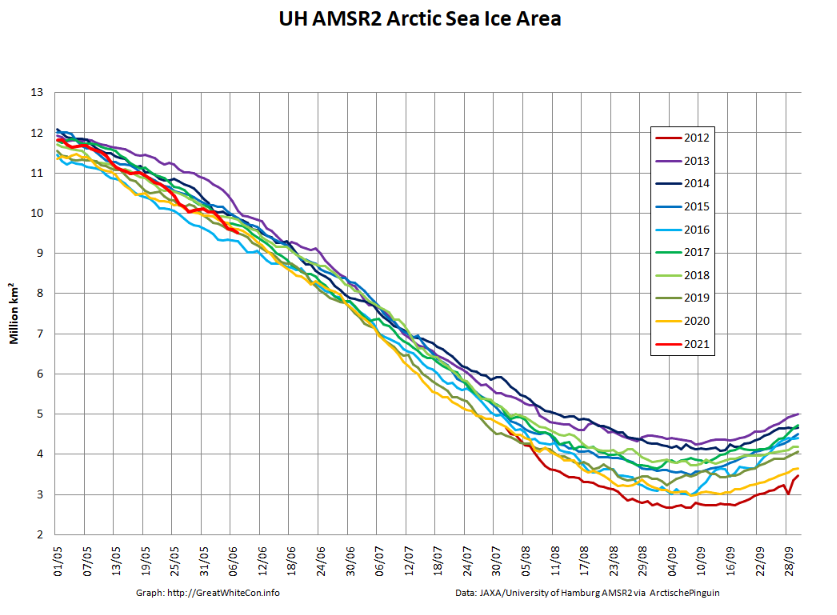
Let’s also take a look at the high resolution AMSR2 metrics for the end of May 2021:
Thanks to the recent “brief hiatus” in areal decline, Arctic wide compaction is no longer in record territory:
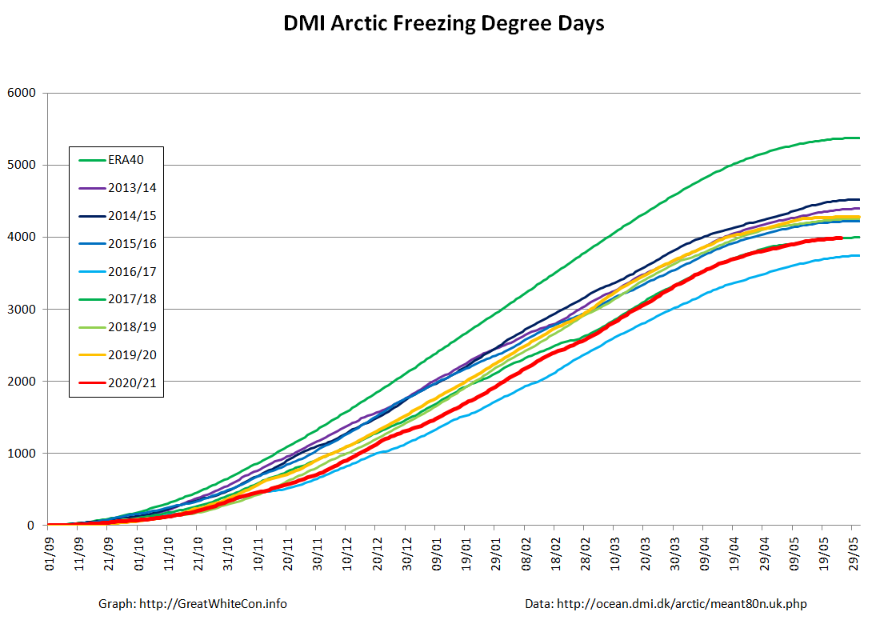
Finally, for the moment at least, here is the Danish Meteorological Institute’s high Arctic temperature data in the form of a graph of freezing degree days:
For some reason the data file still doesn’t include data to the end of May, but things won’t change much by then. Over the winter as a whole only 2016/17 was significantly warmer.
Let the 2021 Arctic sea ice summer melting season officially begin!
[Edit – June 4th]
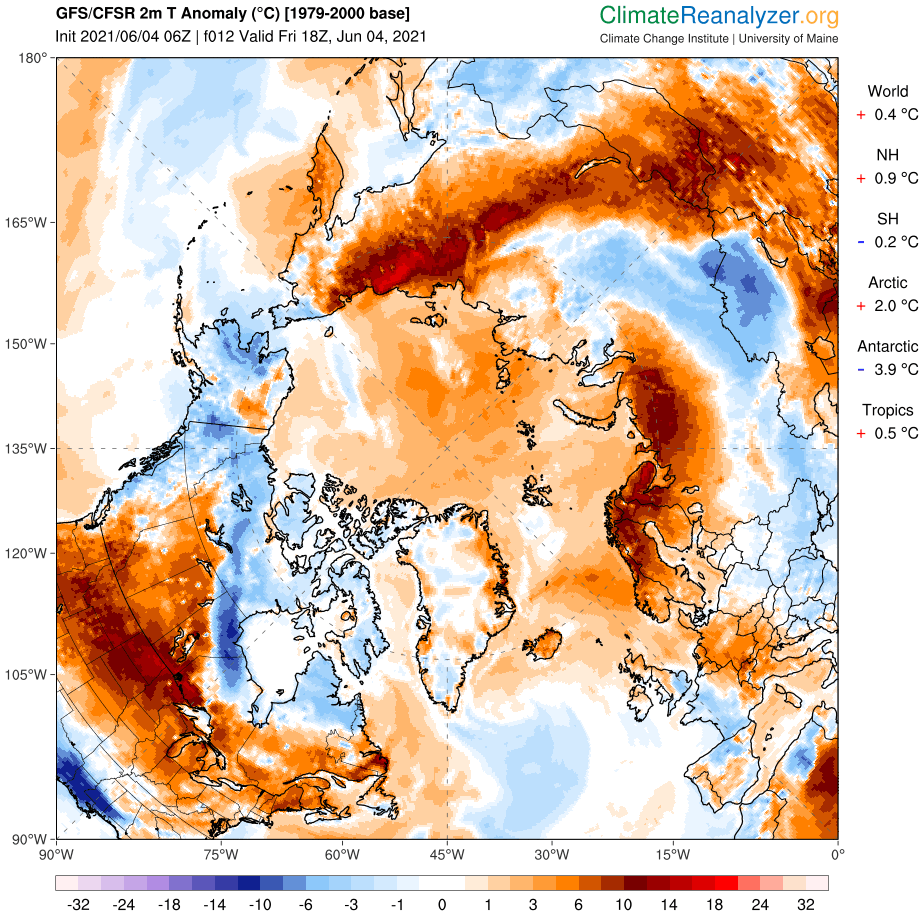
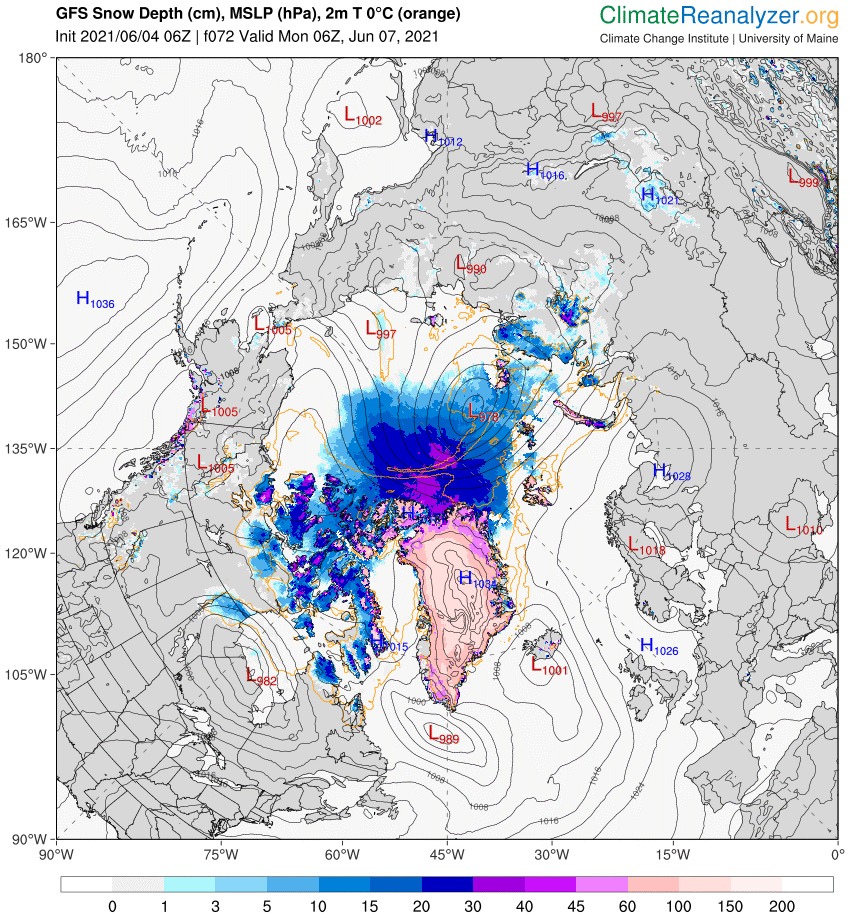
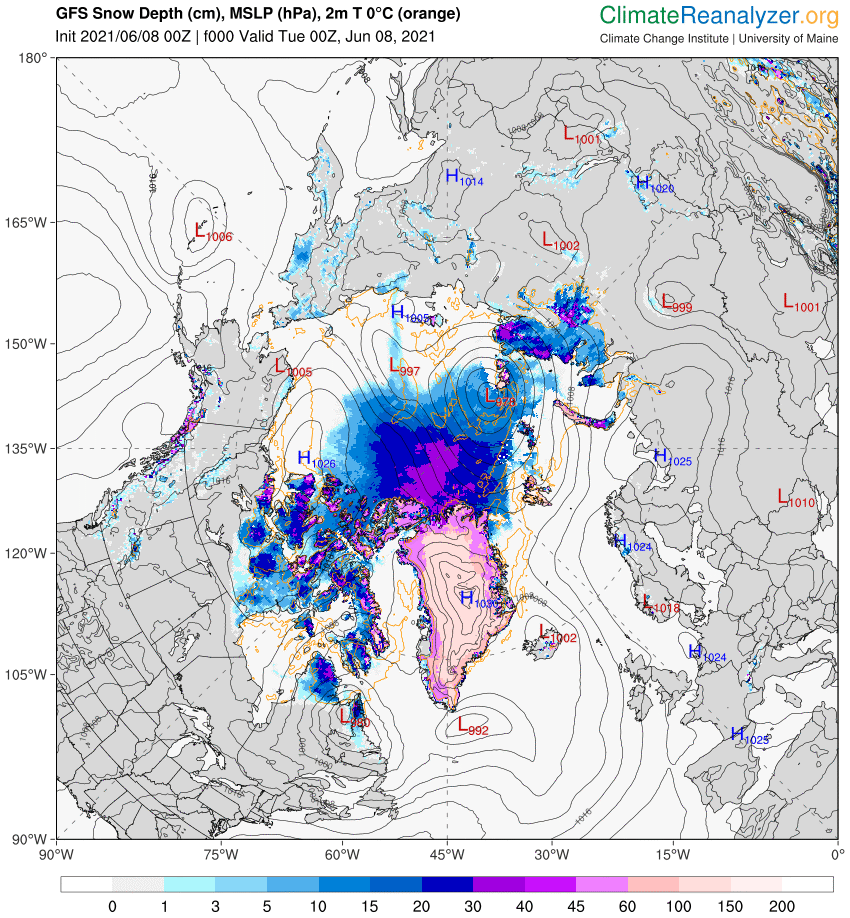
Perhaps unsurprisingly the GFS forecast from four days ago hasn’t quite worked out as predicted. The Arctic as a whole is certainly on the warm side, with a +2 C anomaly at this moment:
However the 966 hPa MSLP cyclone predicted for Monday is now forecast to be a mere 978 hPa:
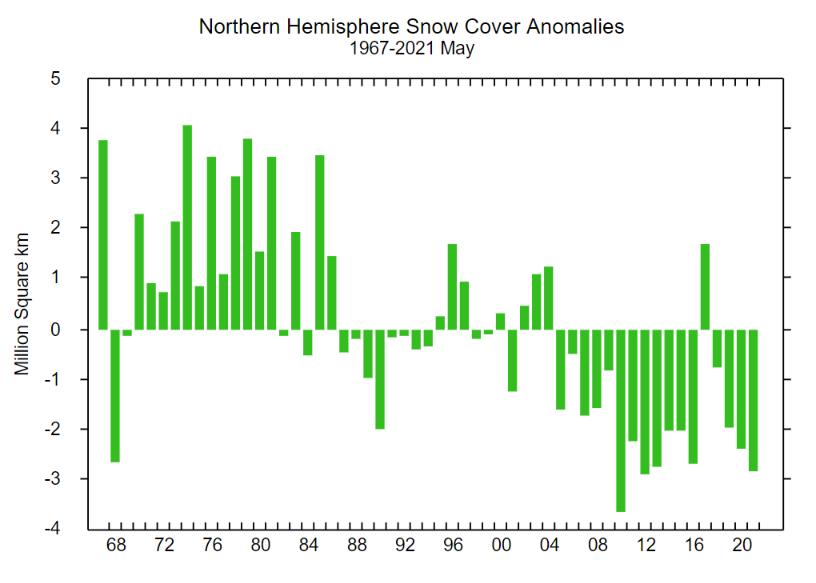
With 3 days to go there is a reasonable chance of it verifying in the “New Arctic” of 2021. As you can see from the map above a large area of the Central Arctic has now lost its snow cover. This is confirmed by the Rutgers Snow Lab northern hemisphere data for May:
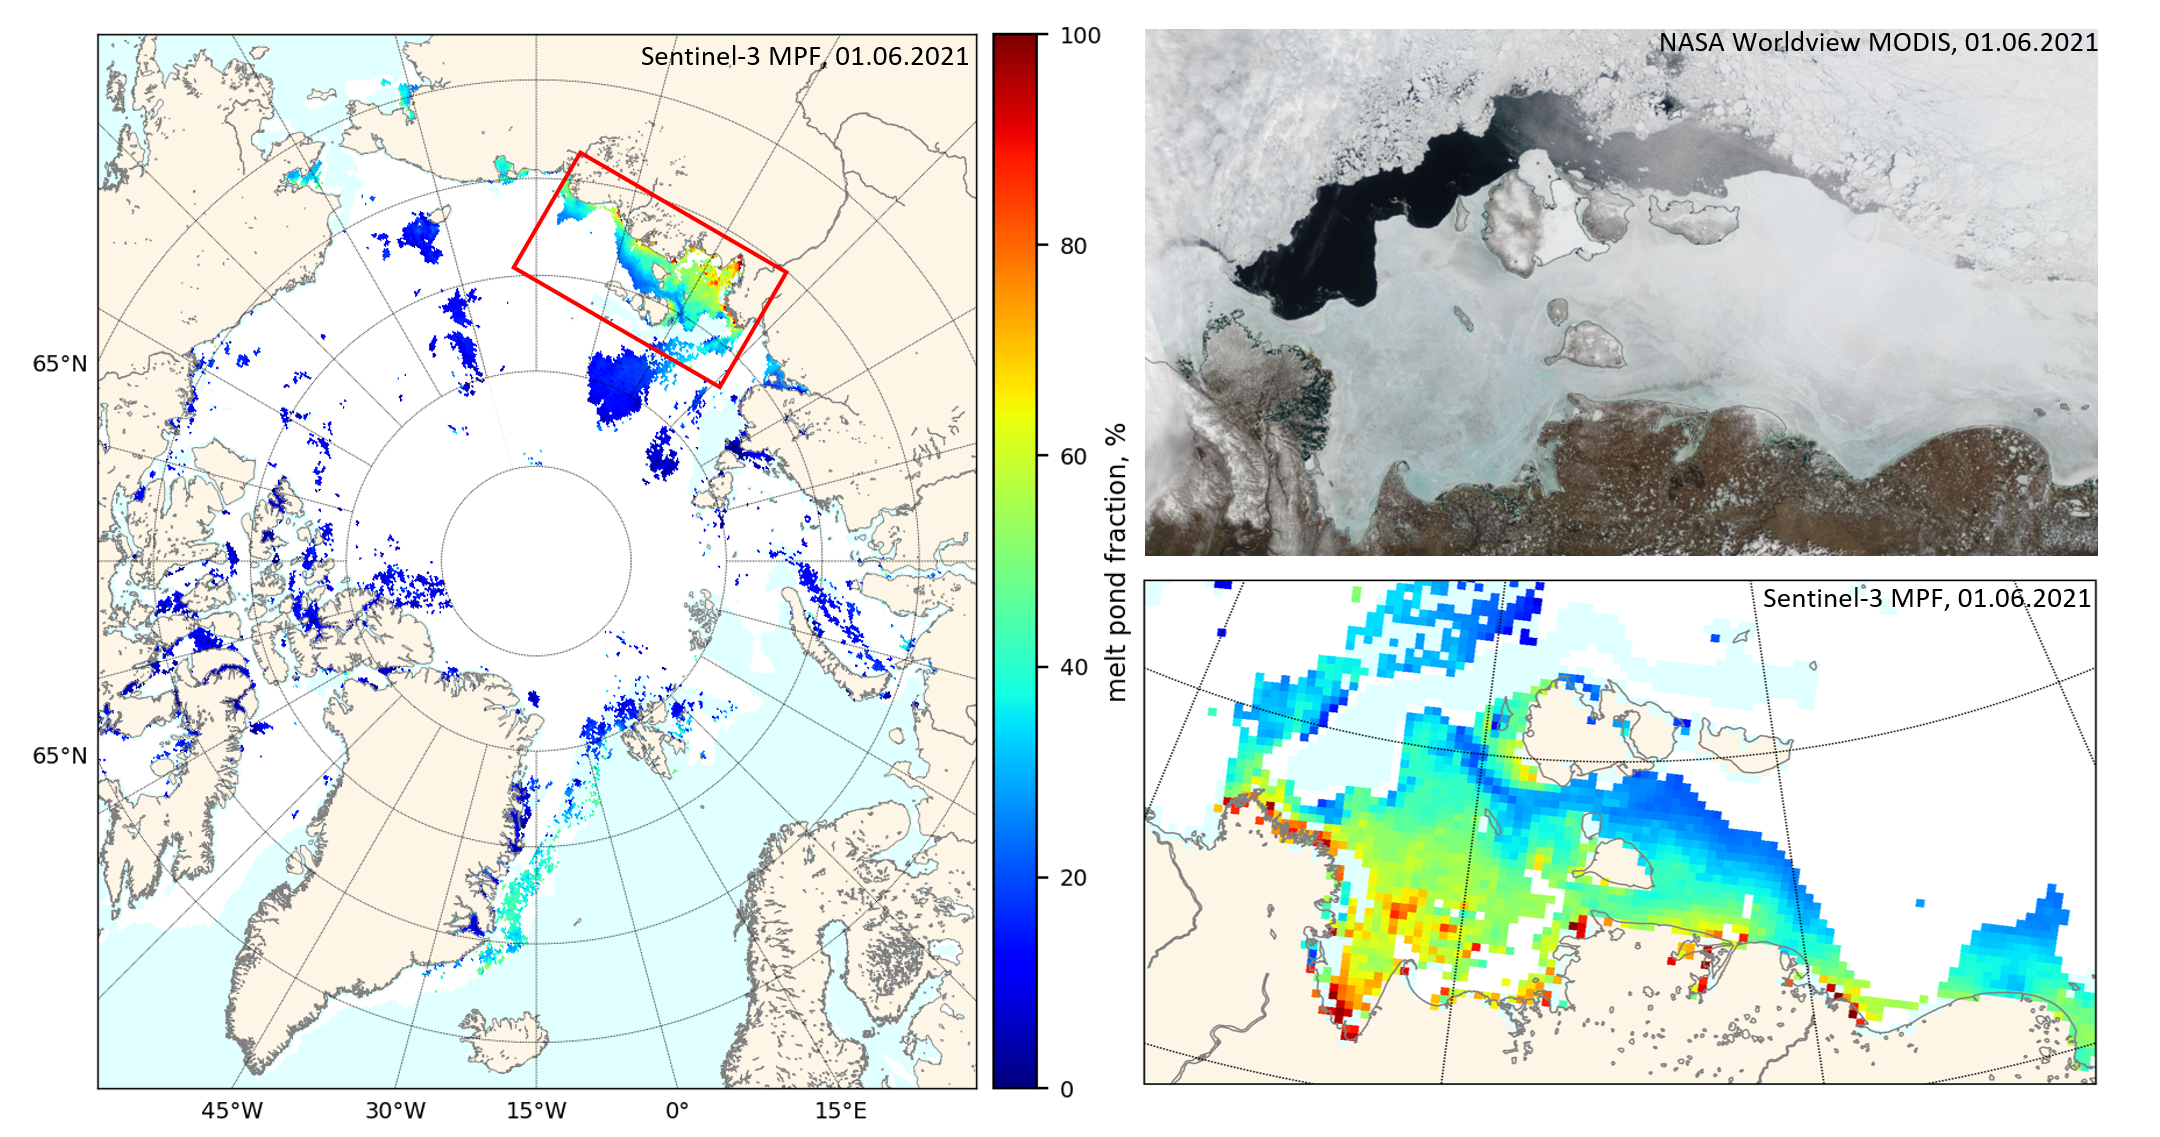
A new Sentinel 3 melt pond fraction product from the University of Bremen confirms that on the fast ice in the Laptev & East Siberian Seas snow cover has departed and melt ponds have arrived:
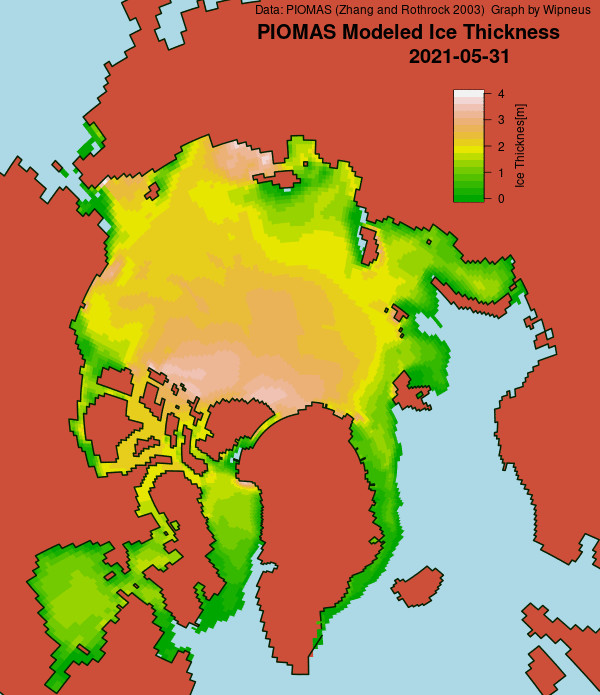
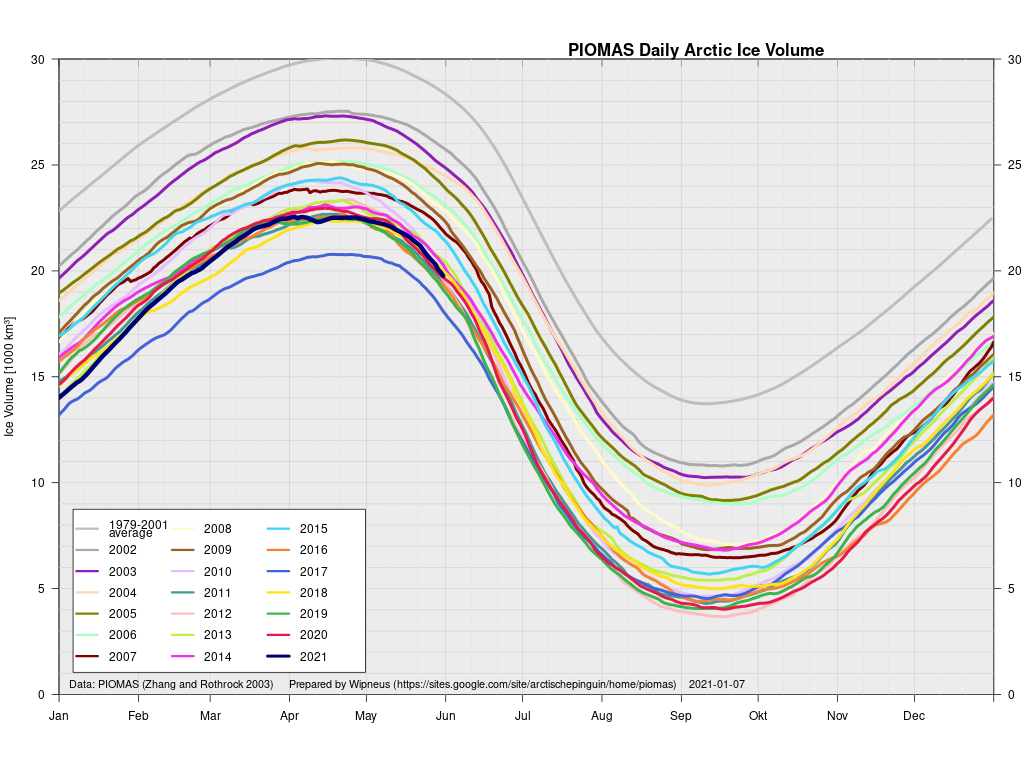
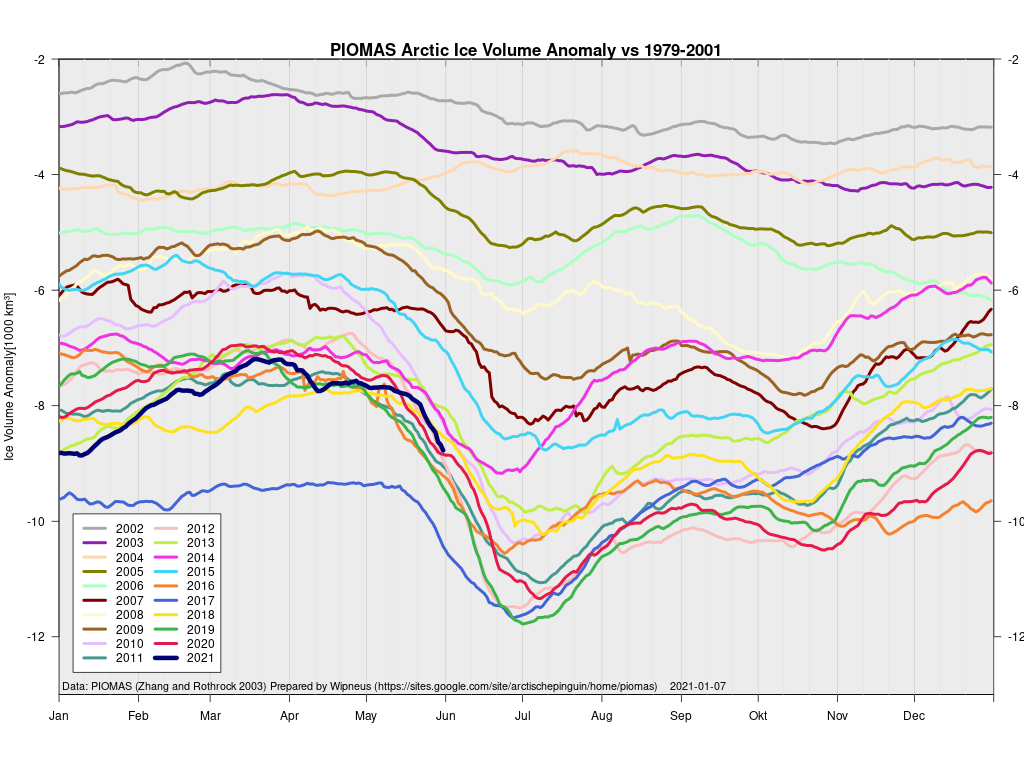
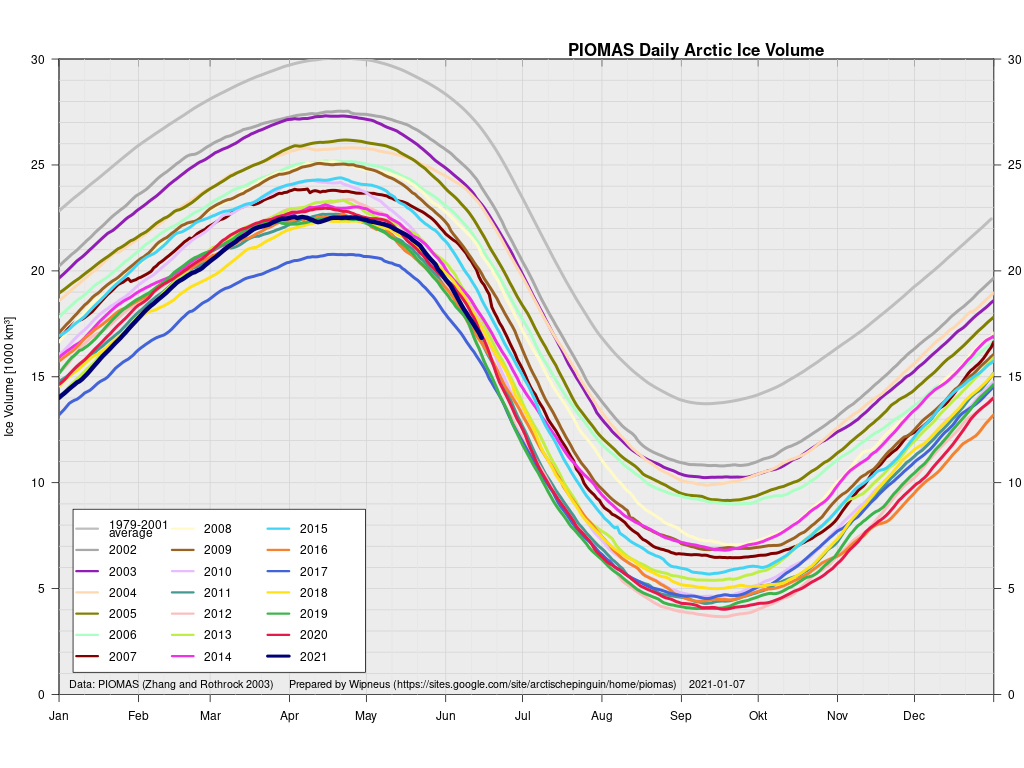
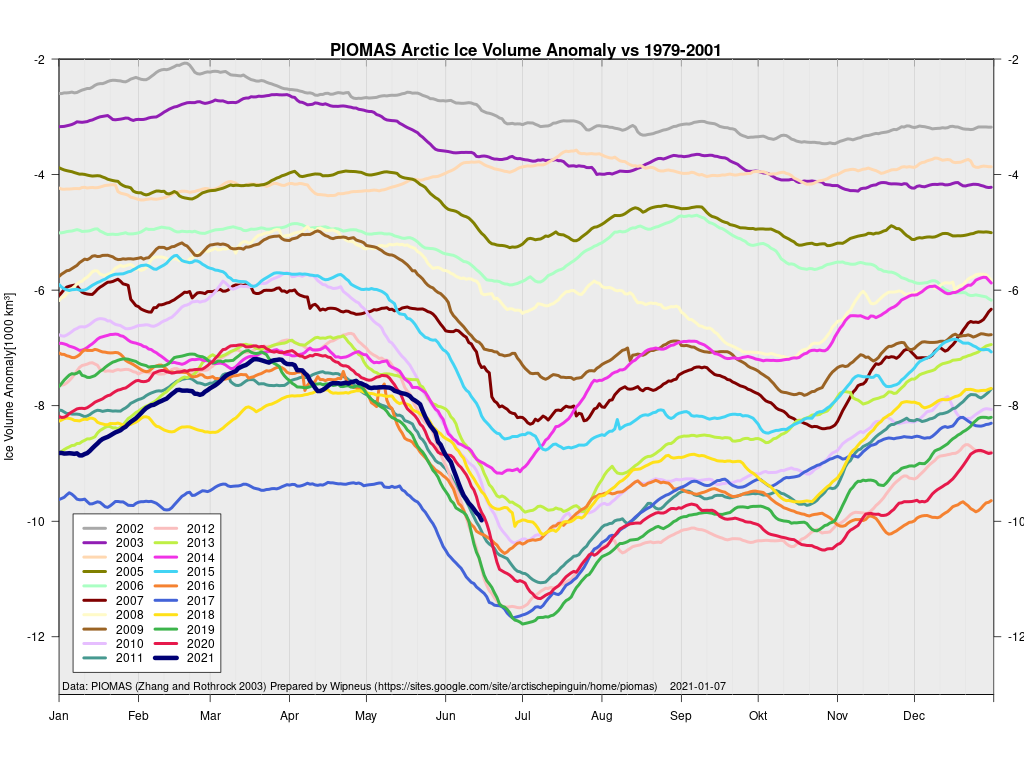
In other news Wipneus has released the latest PIOMAS gridded thickness and volume data on the Arctic Sea Ice Forum:
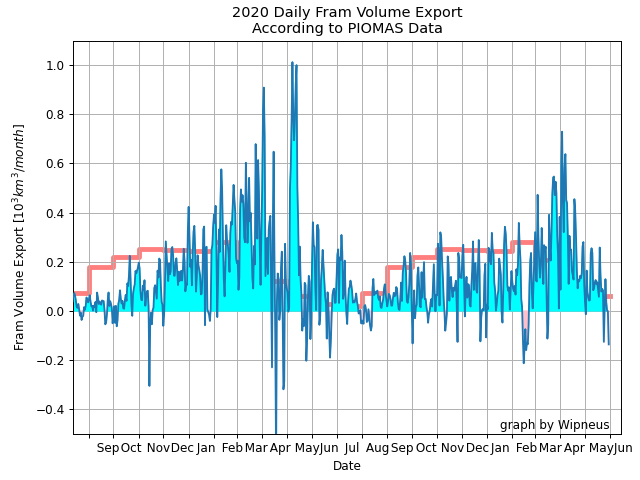
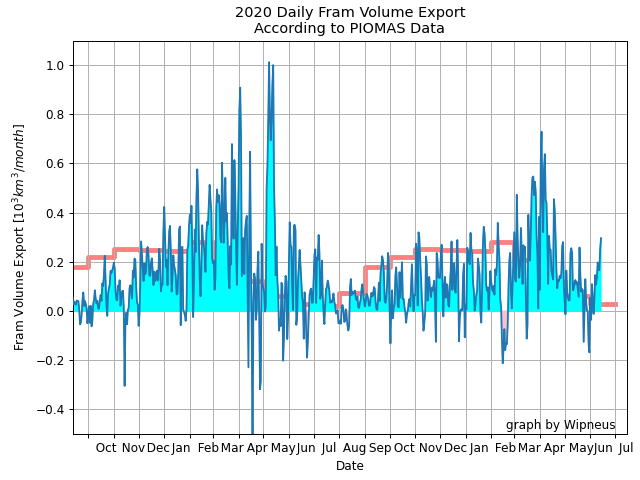
For some strange reason 2021 volume at the end of May is almost identical to 2012 and 2020! Plus of course there’s the modelled volume export from the Central Arctic via the Fram Strait:
[Edit – June 6th]
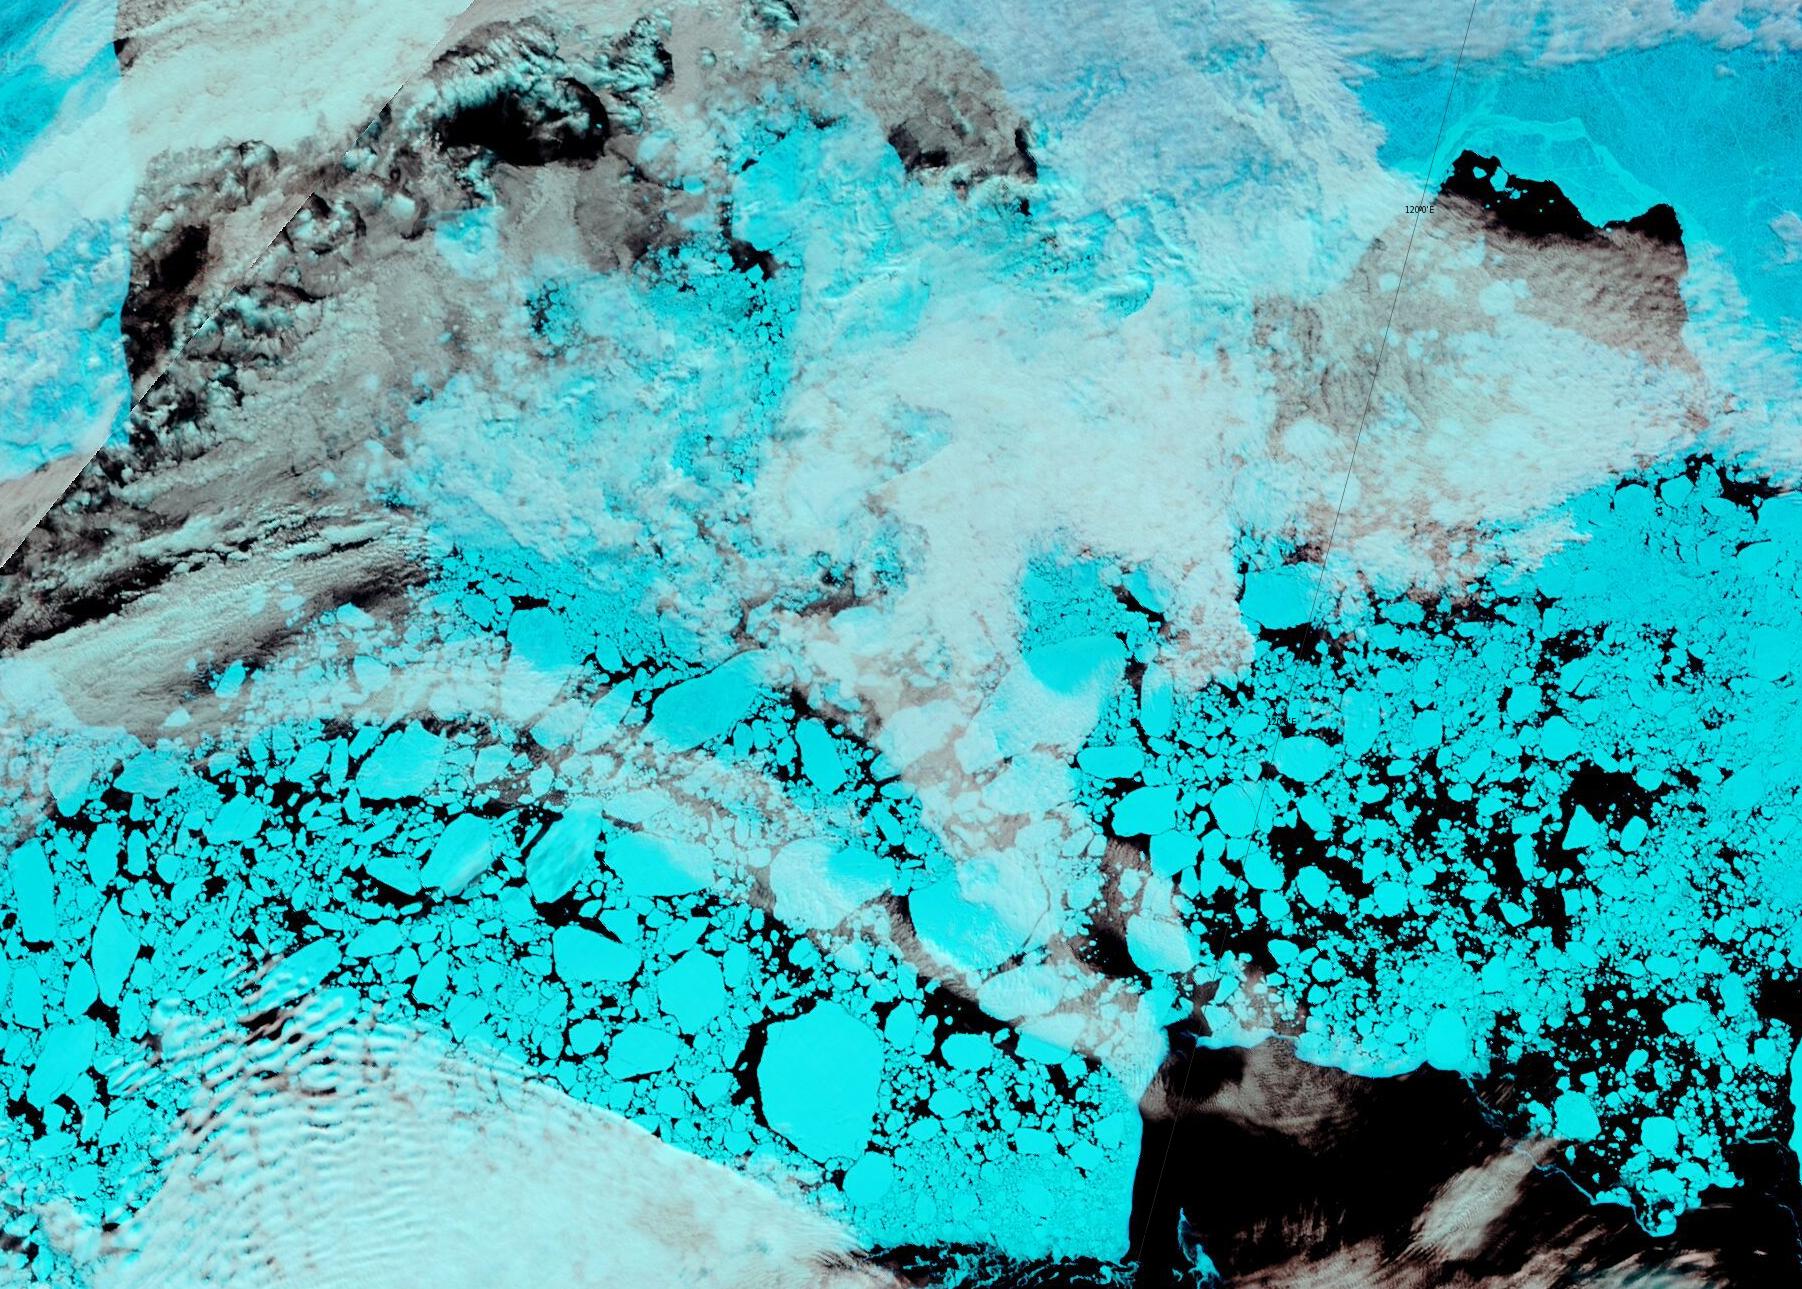
This “false colour” image reveals that there’s virtually no snow cover left on land, and this “false colour” image reveals that the land-fast ice in the East Siberian Sea is now awash with melt ponds:
[Edit – June 8th]
The forecast low pressure area appears to have bottomed out near the Severnaya Zemlya islands with a 978 hPa MSLP:
High resolution AMSR2 Arctic sea ice area is now 2nd lowest for the date after 2016:
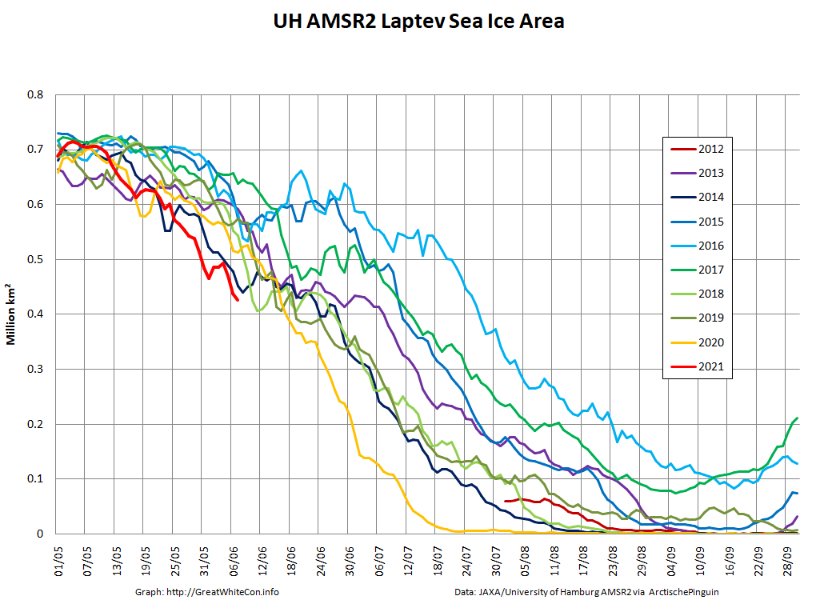
Laptev sea ice area is still lowest for the data, and looks as though it will retain that position for a while:
[Edit – June 9th]
The effect of the recent heat and wind on the remaining sea ice in the Laptev Sea is now all too apparent:
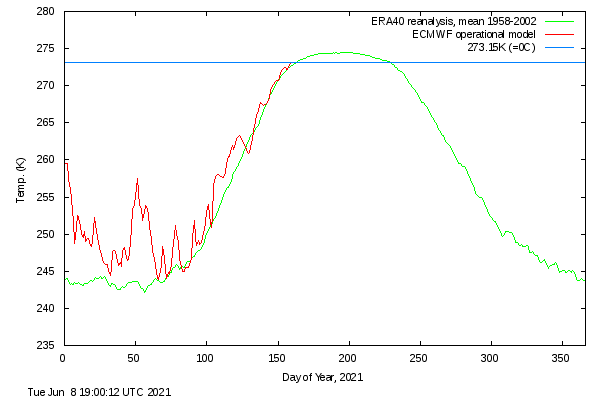
It’s also evident in the DMI >80N temperature graph, which has now reached sea ice “melting point” ahead of the climatology:
Note that the blue line is actually above the “freezing point” of salty Arctic sea water.
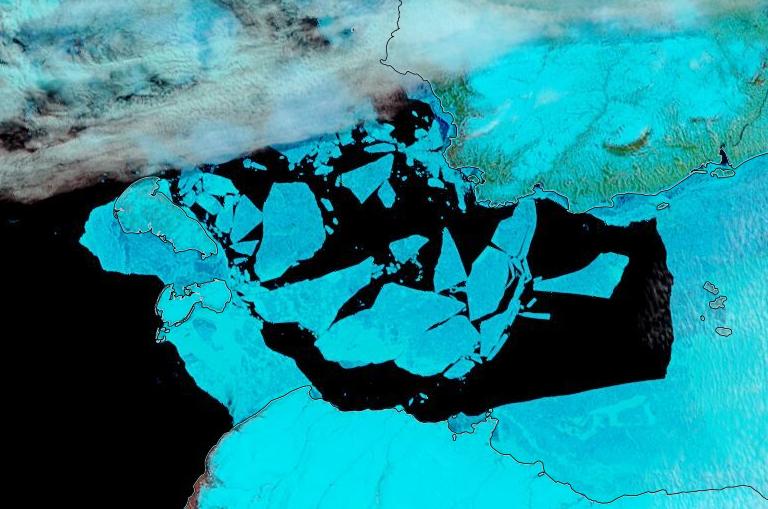
[Edit – June 13th]
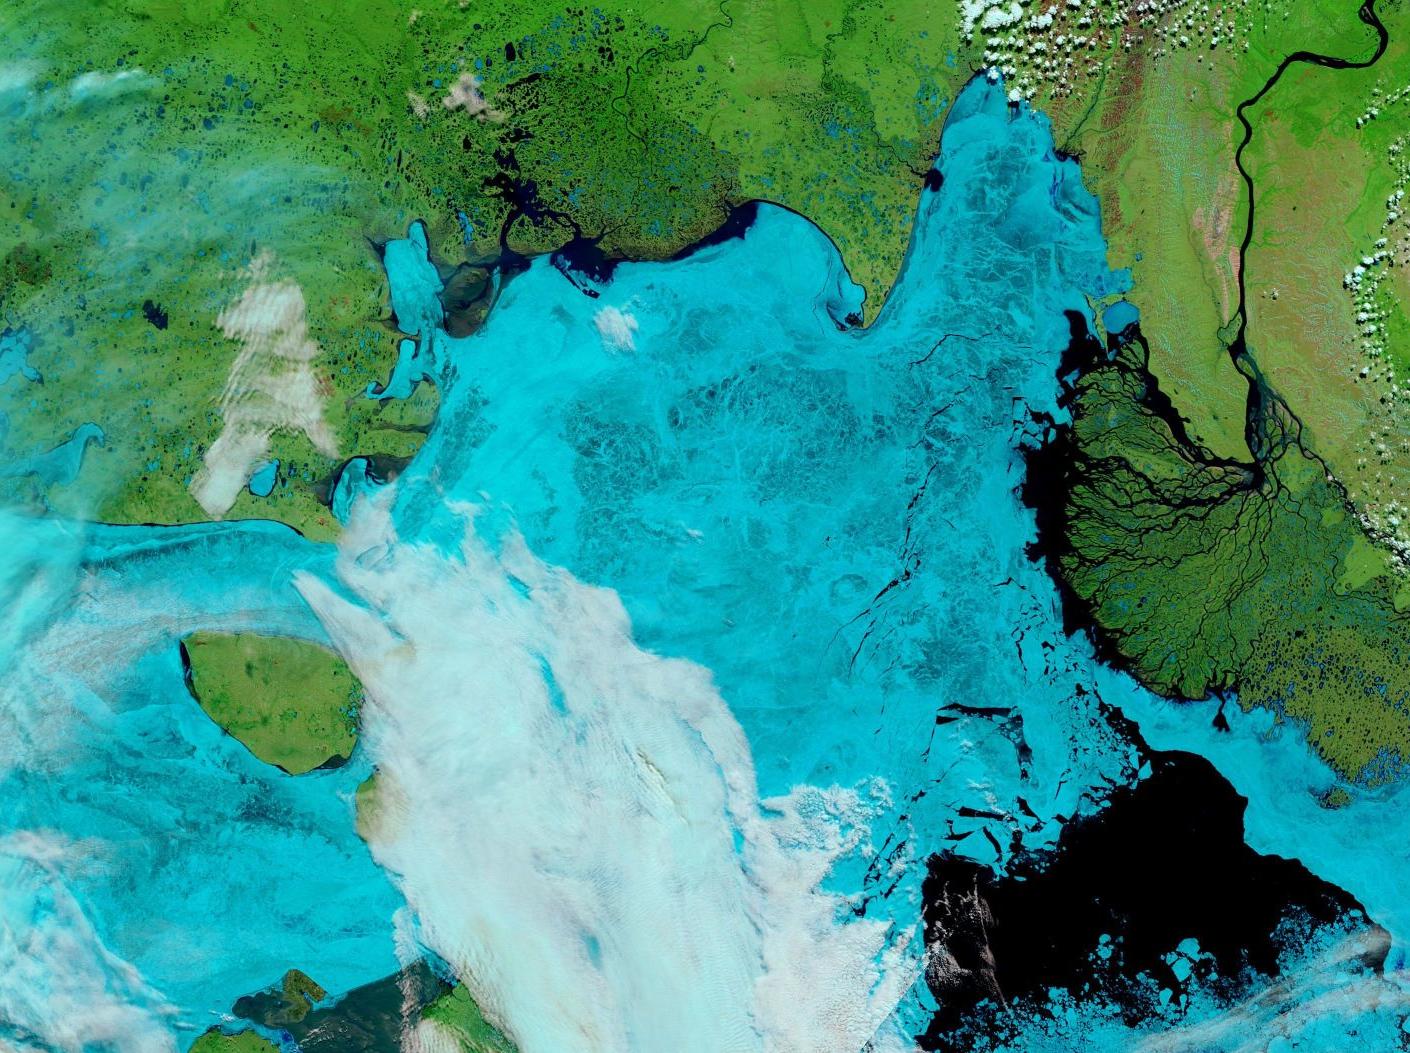
Fairly clear skies over the Laptev Sea and the western East Siberian Sea, revealing wall to wall melt ponds and the land-fast ice starting to break up near the coast as well as on the edge of the now open ocean:
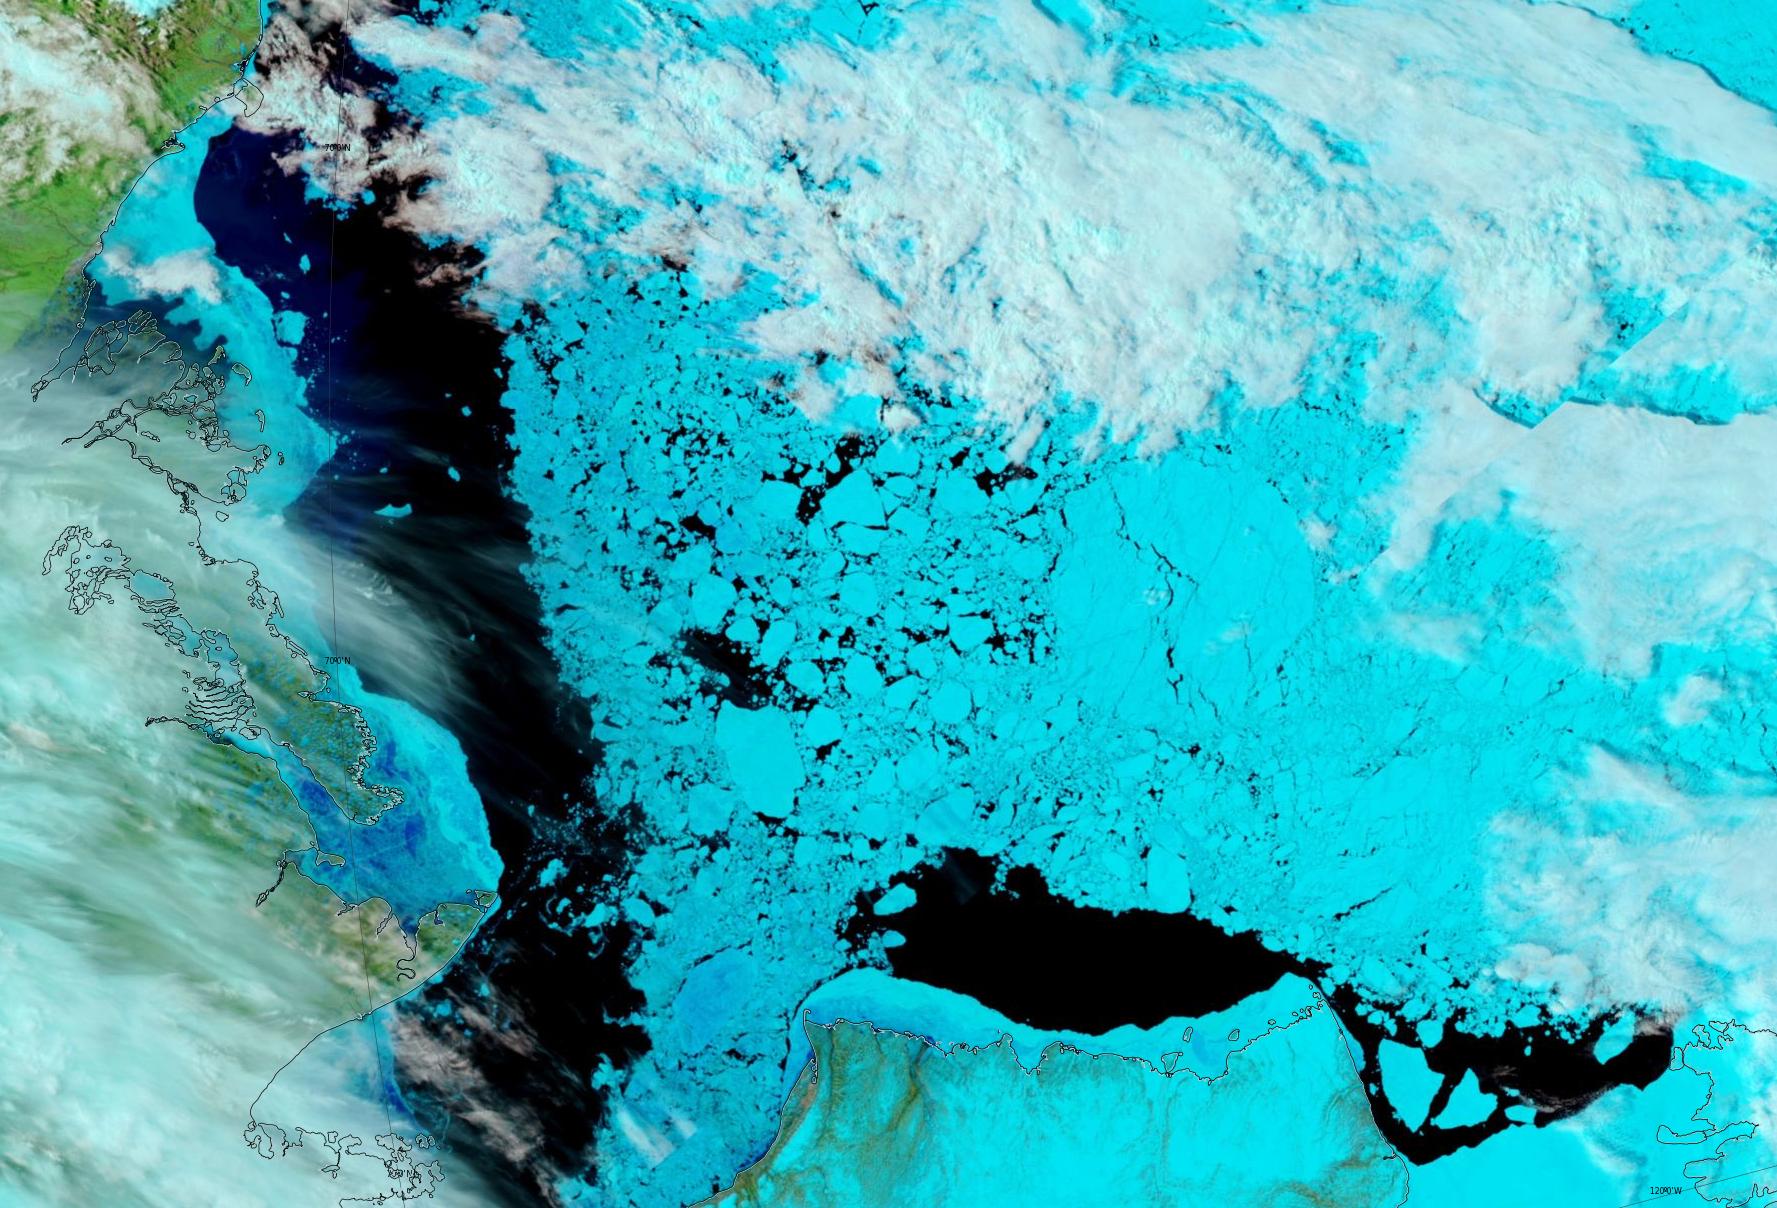
Plus yesterday’s view of the Beaufort Sea, revealing fast ice breaking up in the western entrance to the McClure Strait:
[Edit – June 18th]
A clearish view of the Laptev Sea today, revealing assorted cracks in a variety of locations:
[Edit – June 20th]
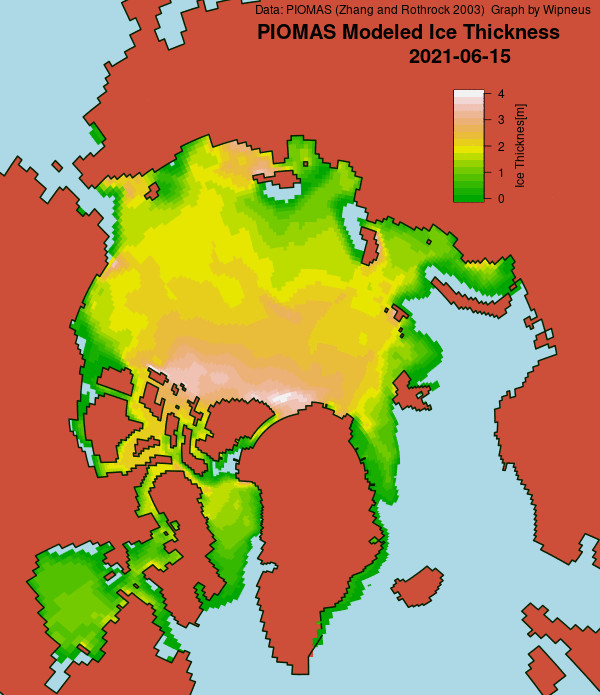
The latest mid-month PIOMAS thickness/volume numbers have been released:
[Edit – June 23rd]
The skies over the Vilkitsky Strait have been cloudy for a few days. However a fairly clear view yesterday reveals that breakup is well under way in what is usually one the last areas along the Northern Sea Route to become navigable:
[Edit – June 26th]
The land-fast ice in the East Siberian Sea has started to disintegrate en masse:
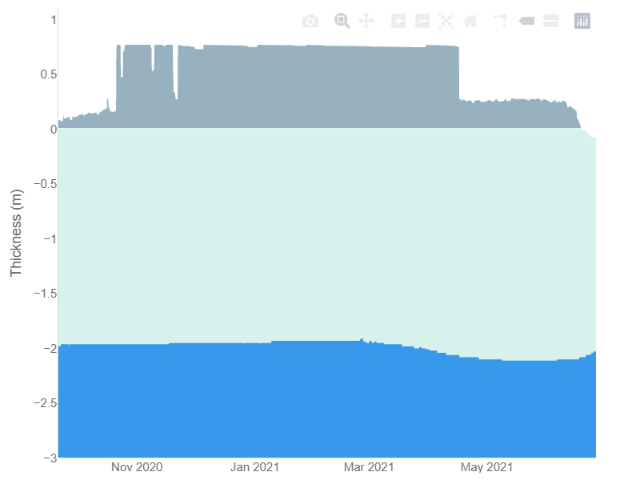
Data from ice mass balance buoy 441910, currently located at 76.1 N, 151.1 W in the Beaufort Sea, reveals the onset of both surface and bottom melt:
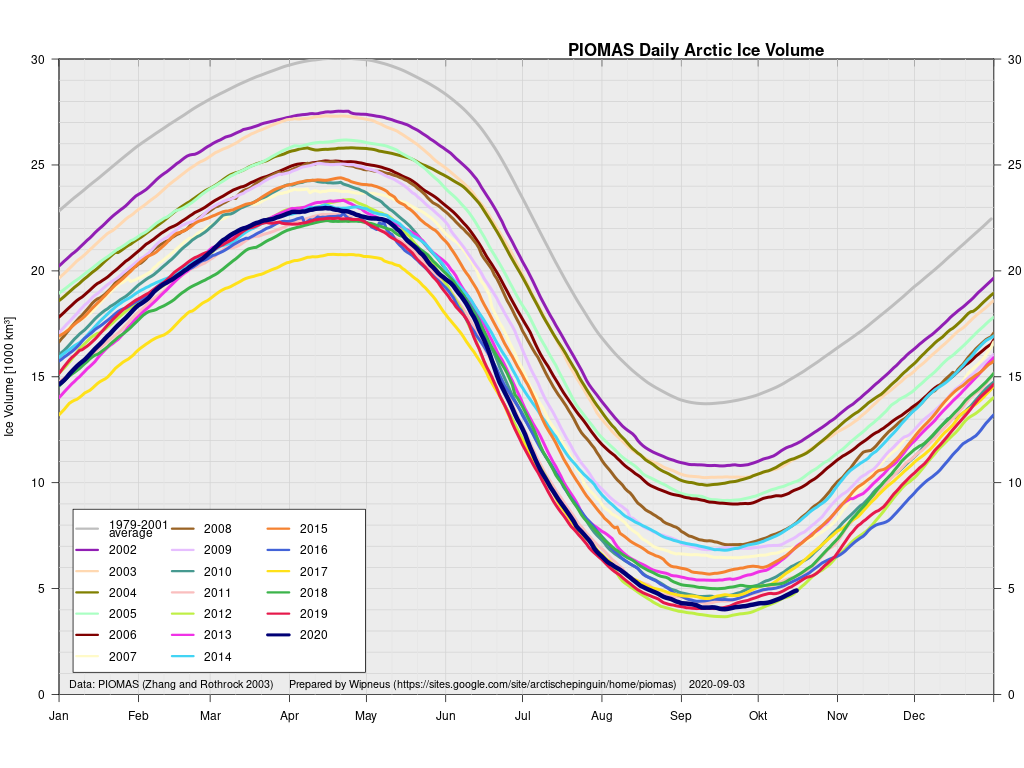
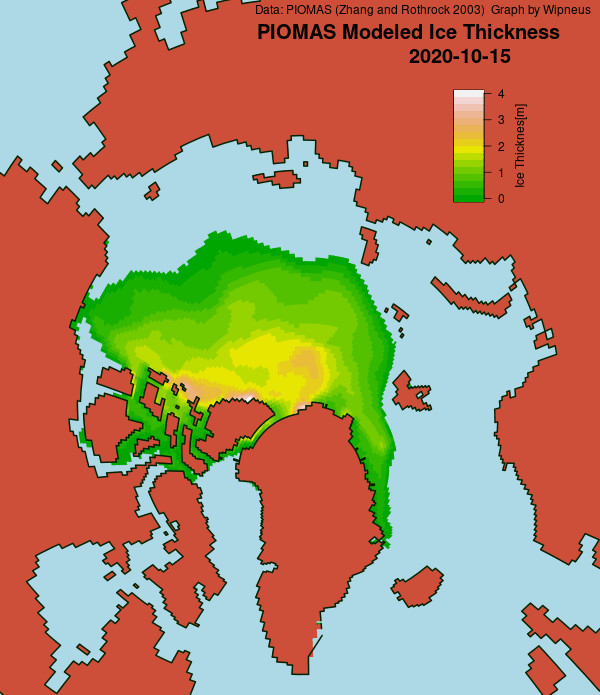
Let’s start this somewhat belated article by looking at Arctic sea ice volume. The mid month PIOMAS gridded thickness numbers have been released to reveal these volume graphs:
Minimum volume for 2021 was 4.03 thousand km3 on September 17th, 2nd lowest in the PSC record.
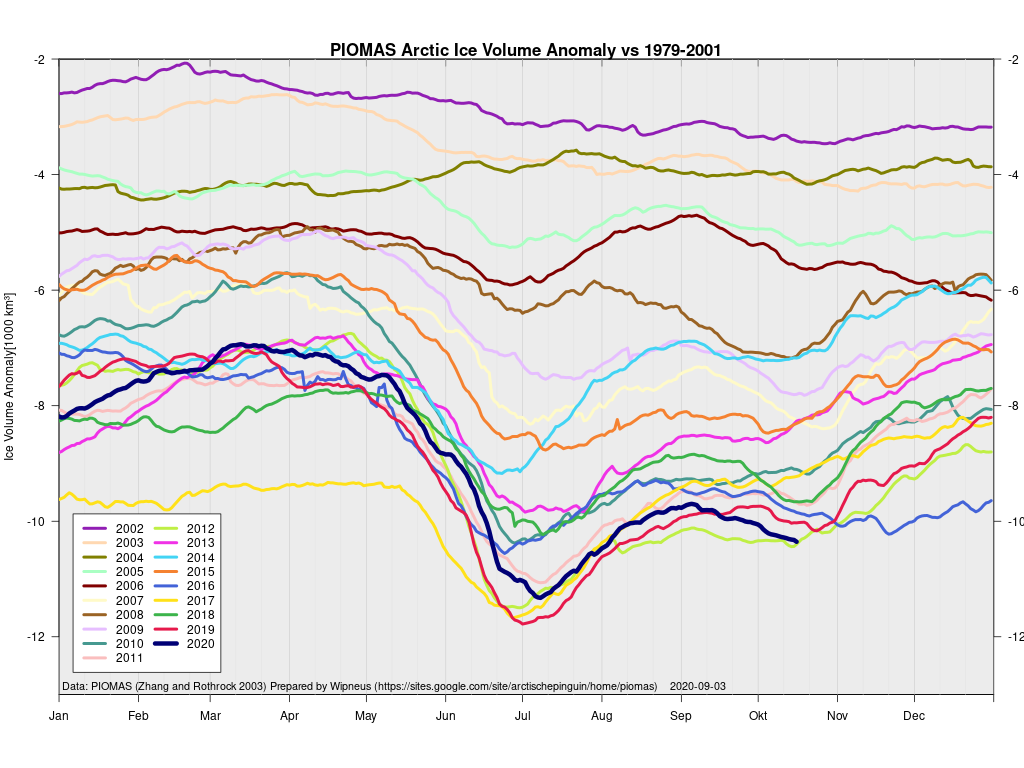
Modelled volume is now in a “statistical tie” with 2012 for lowest on record for mid October. Here too is the PIOMAS thickness map:
Meanwhile for comparison purposes here is the first merged Cryosat-2/SMOS thickness map of the 2020/21 freezing season, hot off the presses at the Alfred Wegener Institute:
This website uses cookies to improve your experience. We'll assume you're ok with this, but you can opt-out if you wish. Cookie settingsACCEPT
Privacy & Cookies Policy
Privacy Overview
This website uses cookies to improve your experience while you navigate through the website. Out of these, the cookies that are categorized as necessary are stored on your browser as they are essential for the working of basic functionalities of the website. We also use third-party cookies that help us analyze and understand how you use this website. These cookies will be stored in your browser only with your consent. You also have the option to opt-out of these cookies. But opting out of some of these cookies may affect your browsing experience.
Necessary cookies are absolutely essential for the website to function properly. This category only includes cookies that ensures basic functionalities and security features of the website. These cookies do not store any personal information.
Any cookies that may not be particularly necessary for the website to function and is used specifically to collect user personal data via analytics, ads, other embedded contents are termed as non-necessary cookies. It is mandatory to procure user consent prior to running these cookies on your website.