I’ve been waiting for the results of the ARCUS SIPN August call, but despite the timetable specifying “26 August 2020 (Wednesday)” they’ve still not been published and I can wait no longer!
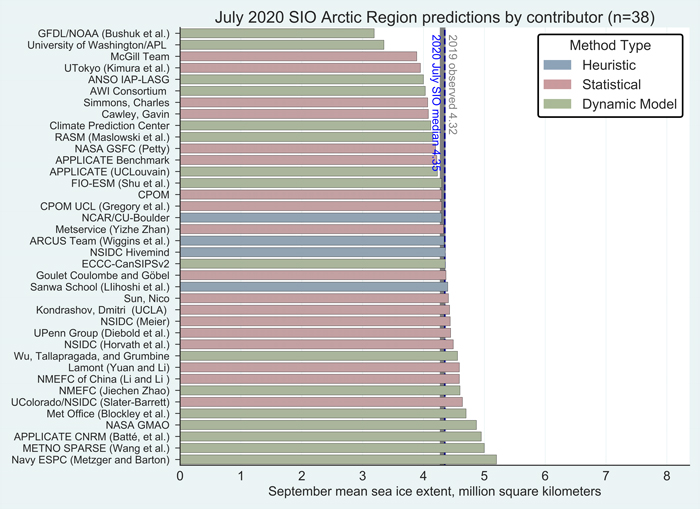
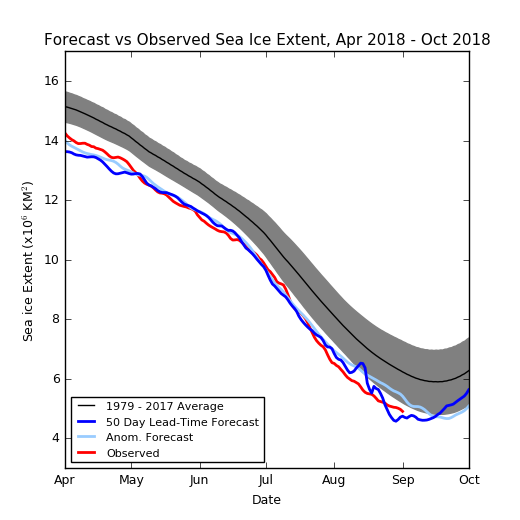
Hopefully the August “predictions” will be available soon, but for the moment let’s take a look at the July 2020 Sea Ice Outlook instead:
For the Arctic, the median July Outlook for September 2020 average sea-ice extent is 4.36 million square kilometers, essentially identical to the median prediction in the June report, with quartiles of 4.1 and 4.6 million square kilometers. For comparison, the historical record September low over the period of satellite observations was set in 2012 at 3.57 million square kilometers, and the second lowest record was 4.27 million square kilometers set in 2007. This year’s projection is close to the 2019 observed September sea-ice extent of 4.32 million square kilometers. As was also the case for the June report, only two of the outlooks project September sea-ice extent below the 2012 record. The consensus judgement against a new record low September sea-ice extent hence remains unchanged. Interestingly, as of this report, observed extent stands at a record low for this time of year.
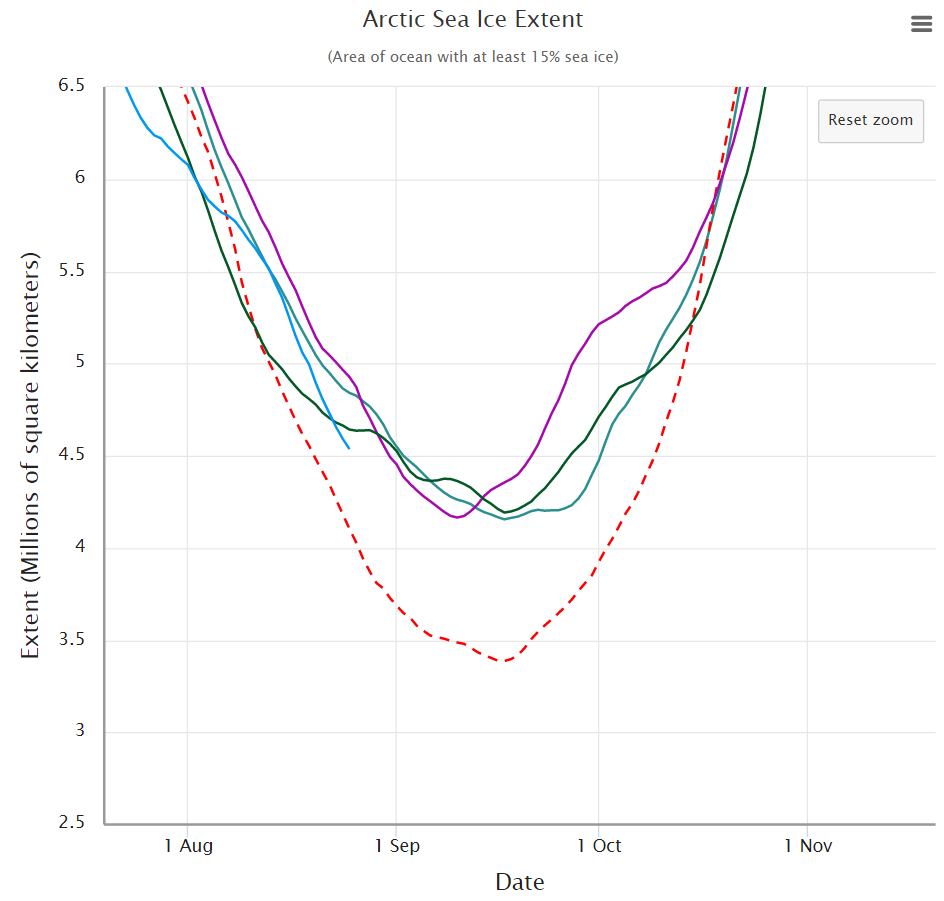
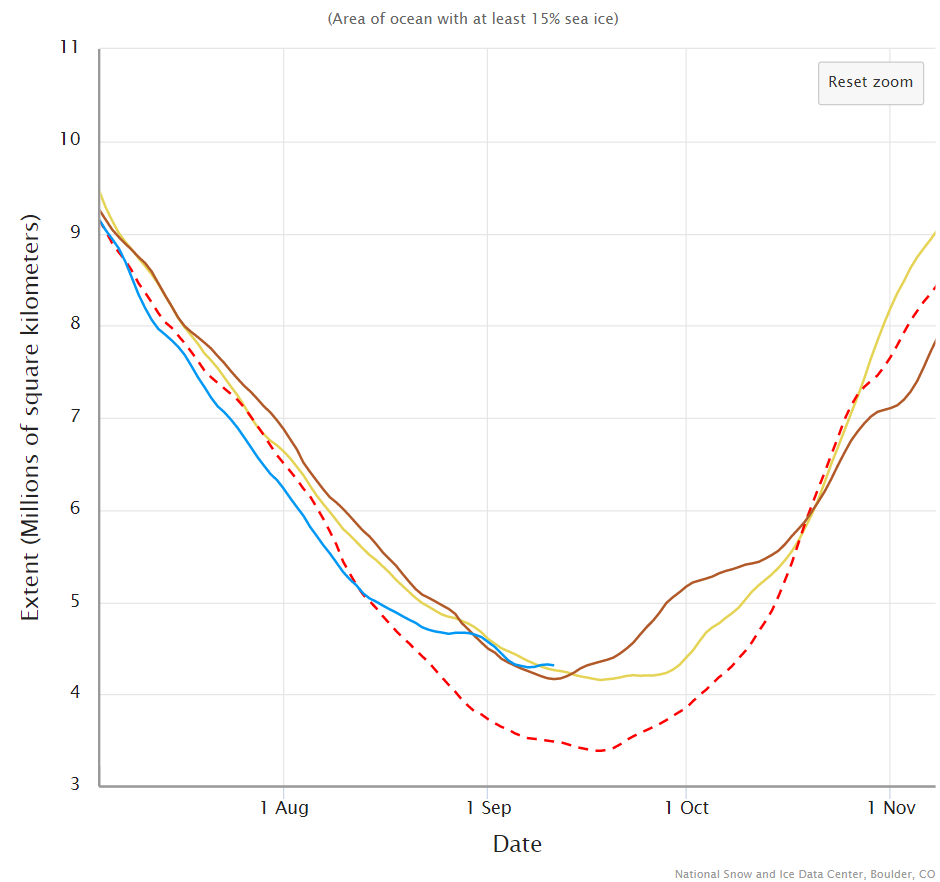
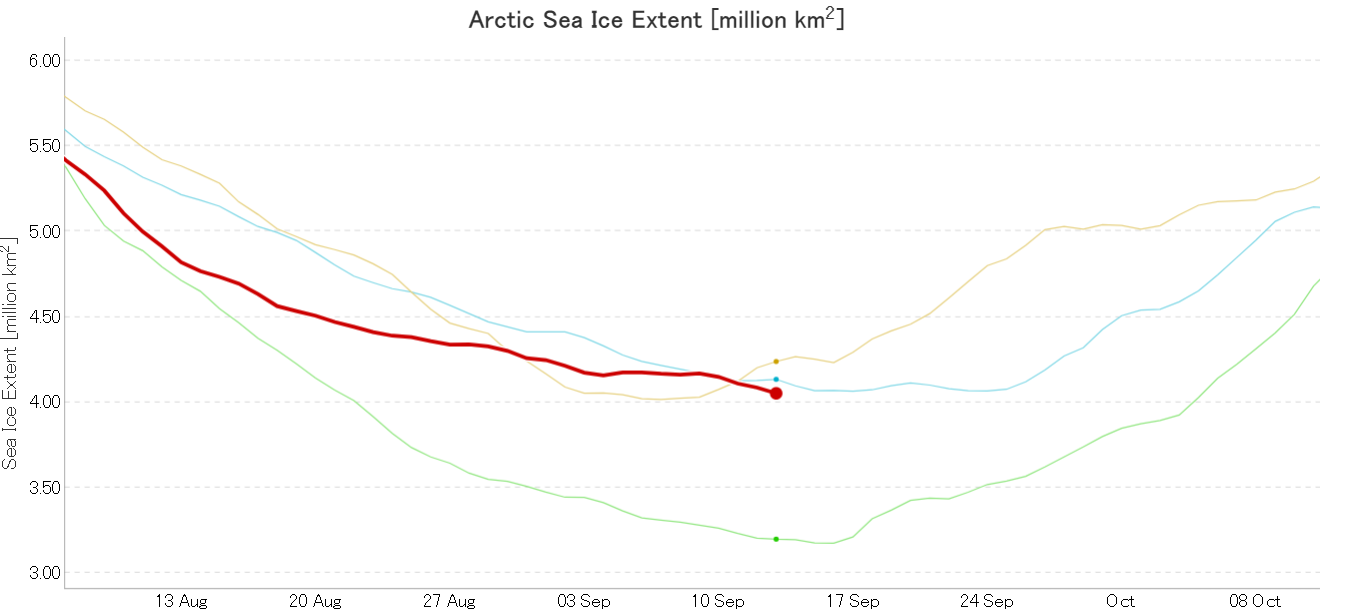
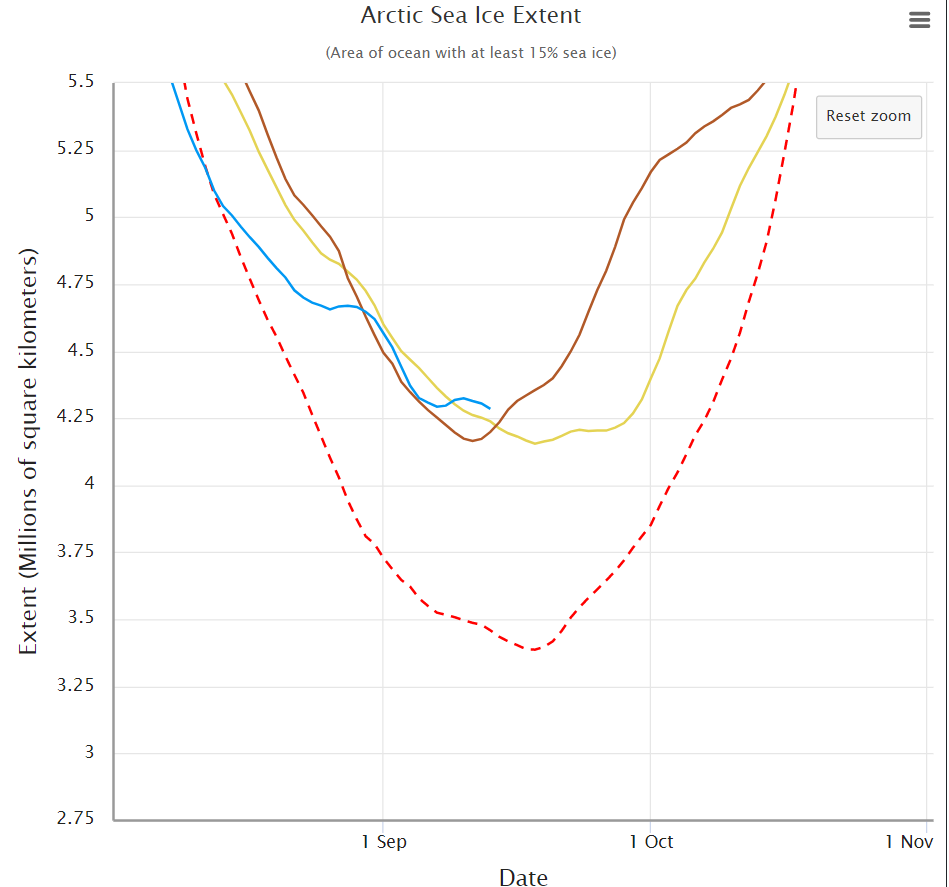
Note that those numbers represent “September 2020 average sea-ice extent” and not the daily minimum. Let’s now take a look at the assorted different flavours of “Arctic sea ice extent” metric. Firstly here’s the NSIDC’s “Charctic” 5 day average extent:
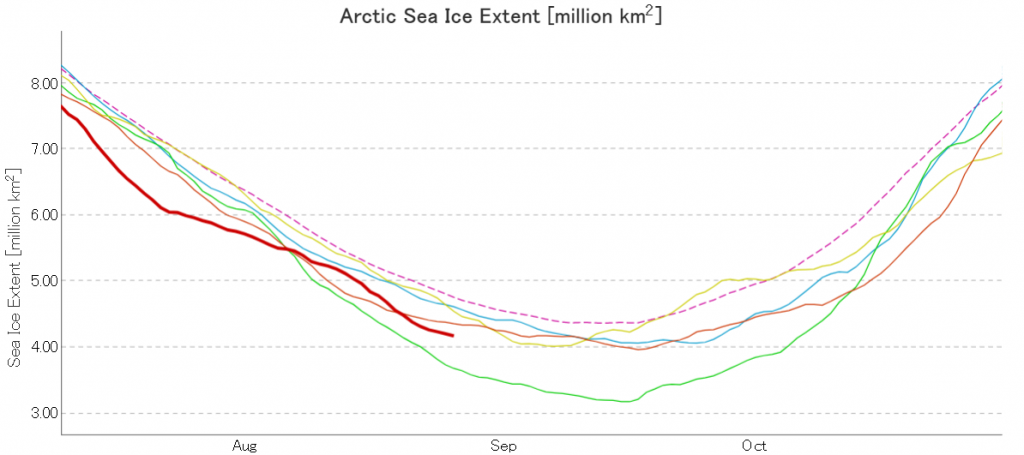
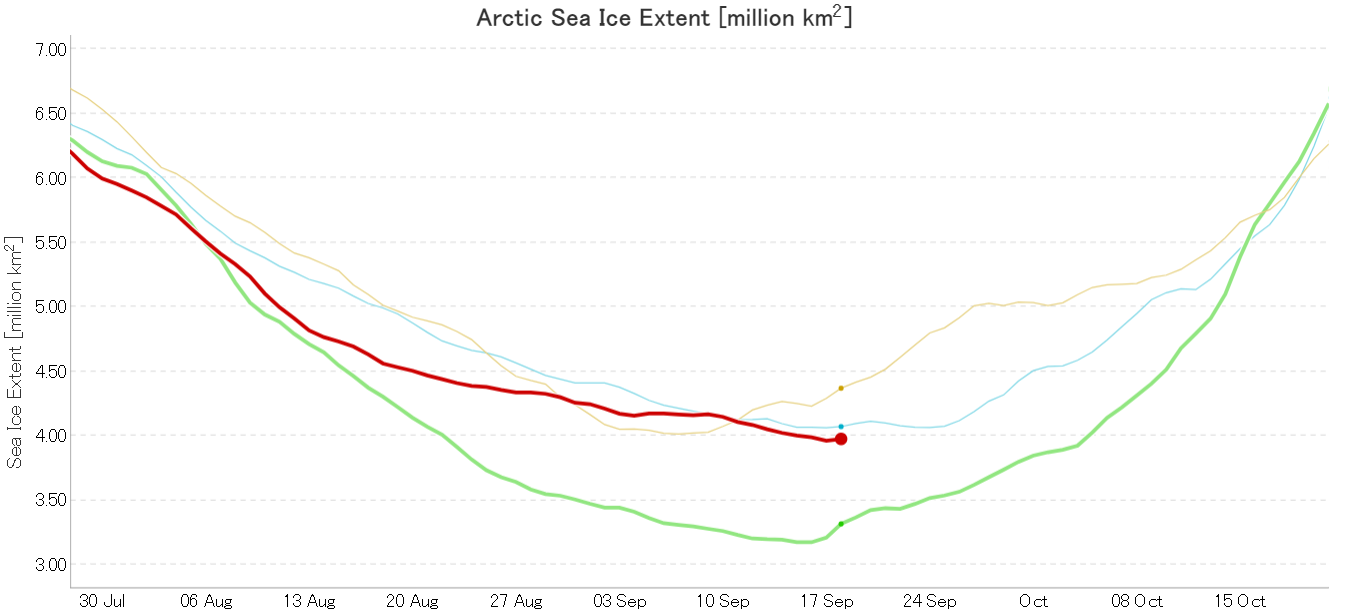
Next here’s JAXA/ViSHOP extent, generally assumed to be a “2 day average”:
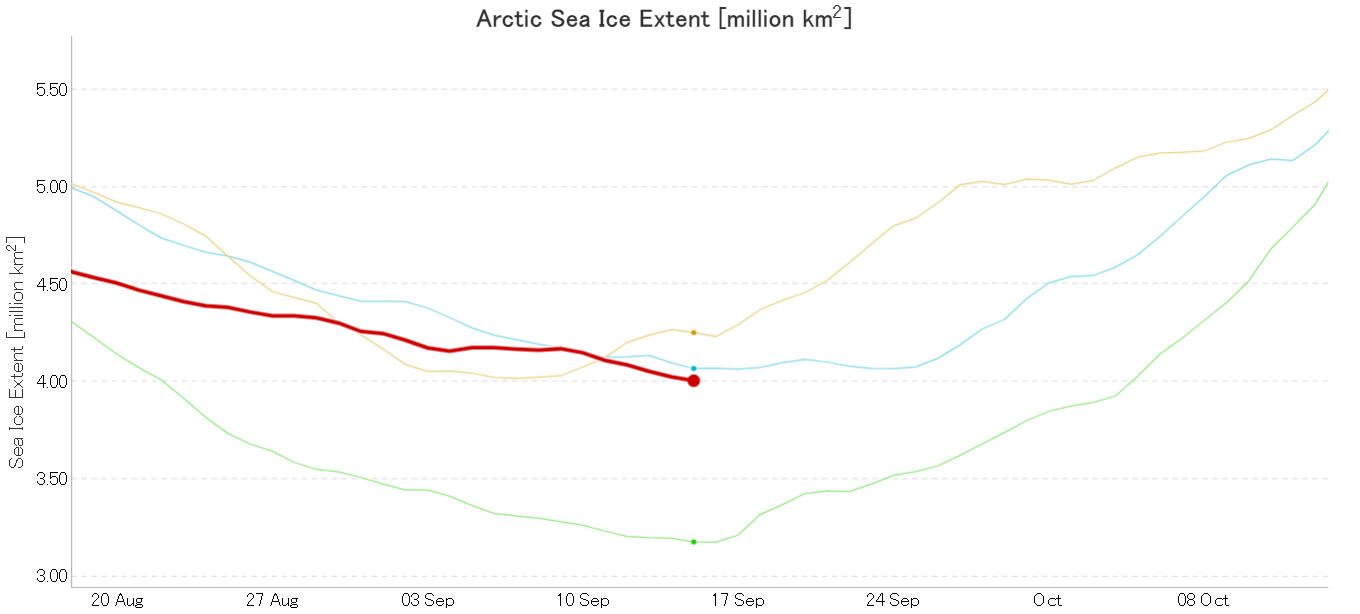
Next here’s the DMI version, which neglects to include 2012:
Our title today is shamelessly plagiarised from the “Watts Up With That” blog of our old friend Anthony Watts. However daring to be different we have redacted the initial word “Claim -“.
The Last Interglacial (LIG), a warmer period 130,000–116,000 years before present, is a potential analogue for future climate change. Stronger LIG summertime insolation at high northern latitudes drove Arctic land summer temperatures 4–5 °C higher than in the pre-industrial era. Climate model simulations have previously failed to capture these elevated temperatures, possibly because they were unable to correctly capture LIG sea-ice changes. Here, we show that the latest version of the fully coupled UK Hadley Center climate model (HadGEM3) simulates a more accurate Arctic LIG climate, including elevated temperatures. Improved model physics, including a sophisticated sea-ice melt-pond scheme, result in a complete simulated loss of Arctic sea ice in summer during the LIG, which has yet to be simulated in past generations of models. This ice-free Arctic yields a compelling solution to the long-standing puzzle of what drove LIG Arctic warmth and supports a fast retreat of future Arctic summer sea ice.
There’s no mention of “2035” in there, so let’s look instead at yesterday’s press release from the British Antarctic Survey:
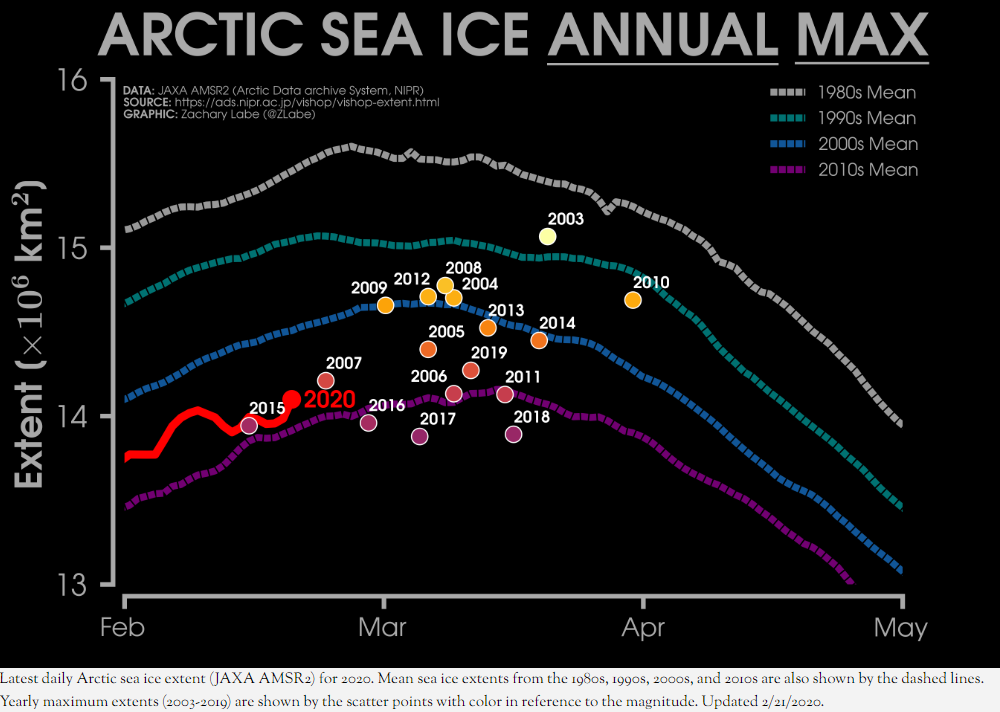
As Zack Labe has recently pointed out, in 2015 the Arctic sea ice maximum extent based on the JAXA numbers had already occurred on February 15th:
Perhaps it’s time we started paying attention this year! However the National Snow and Ice Data Center reported a significantly later date in 2015:
On February 25, 2015, Arctic sea ice extent appeared to have reached its annual maximum extent, marking the beginning of the sea ice melt season. This year’s maximum extent not only occurred early; it is also the lowest in the satellite record. However, a late season surge in ice growth is still possible.
Each year we keep track of the assorted Arctic sea ice metrics over the next month or so, and they rarely agree on the date of maximum extent, and never agree on the sea ice extent on that date! The reason for that is explained in a 2017 paper entitled “Variability and trends in the Arctic Sea ice cover: Results from different techniques“:
Reports on the sea ice cover have been provided by different institutions using basically the same set of satellite data but different techniques for estimating key parameters such as ice concentration, ice extent, and ice area. In this study, a comparison of results from four different techniques that are frequently used shows significant disagreements in the characterization of the distribution of the sea ice cover primarily in areas that have a large fraction of new ice cover or significant amount of surface melt.
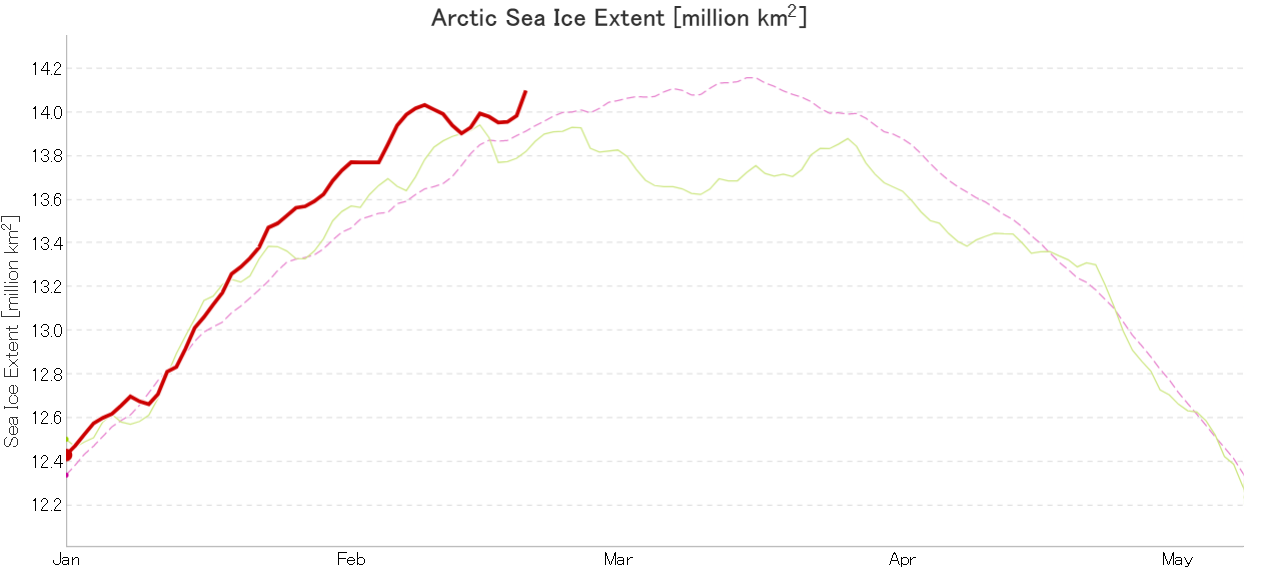
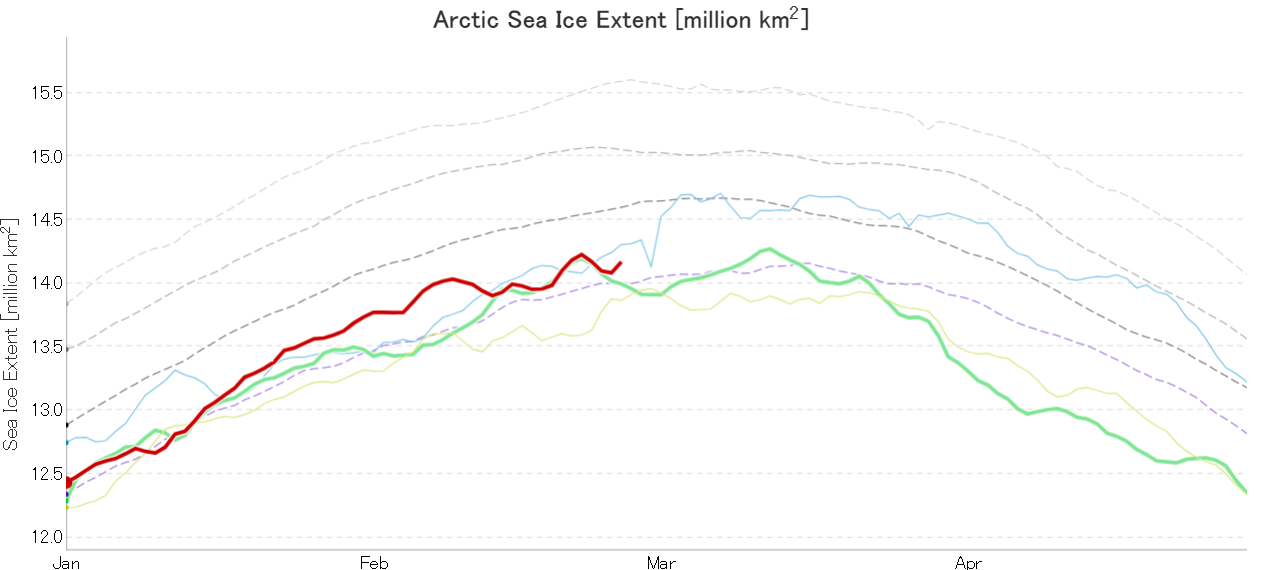
In due course we’ll look at the metrics from a variety of different institutions, but let’s start with JAXA, comparing 2020 with 2015 and the 2010s average:
Extent is clearly increasing just at the moment! Will the next peak prove to be the maximum for the year or will we have to wait another month or more to find out that value, as suggested by the average?
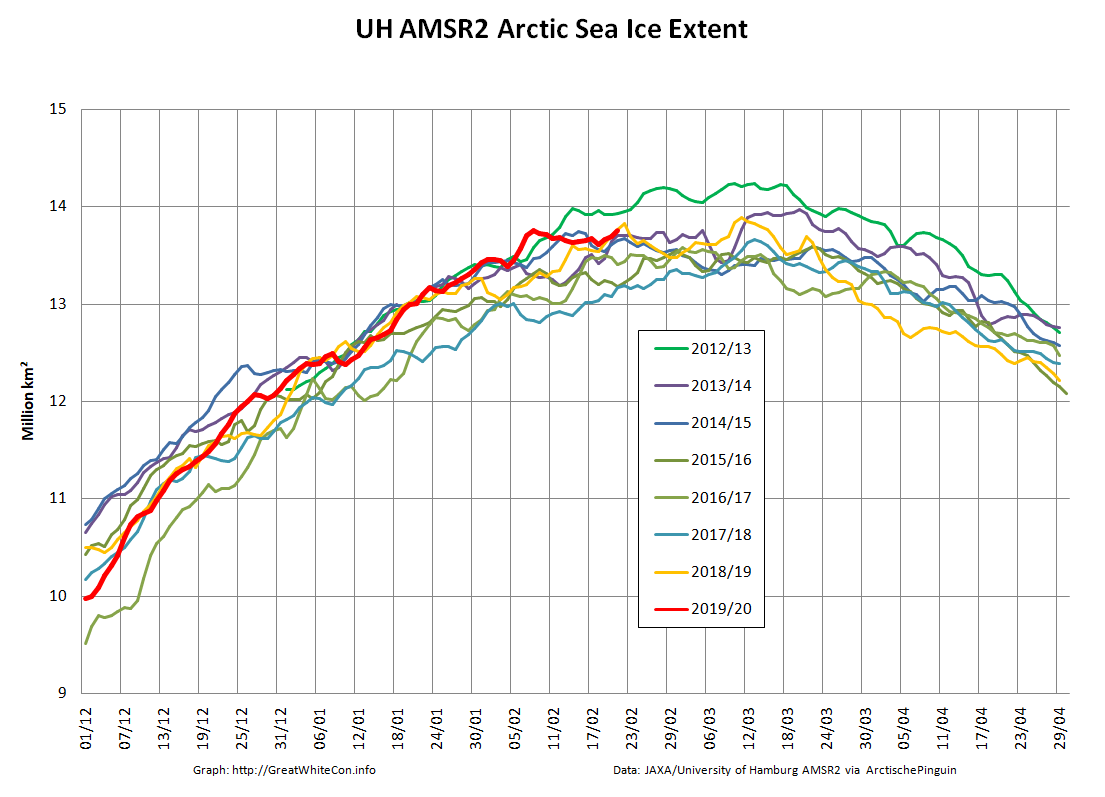
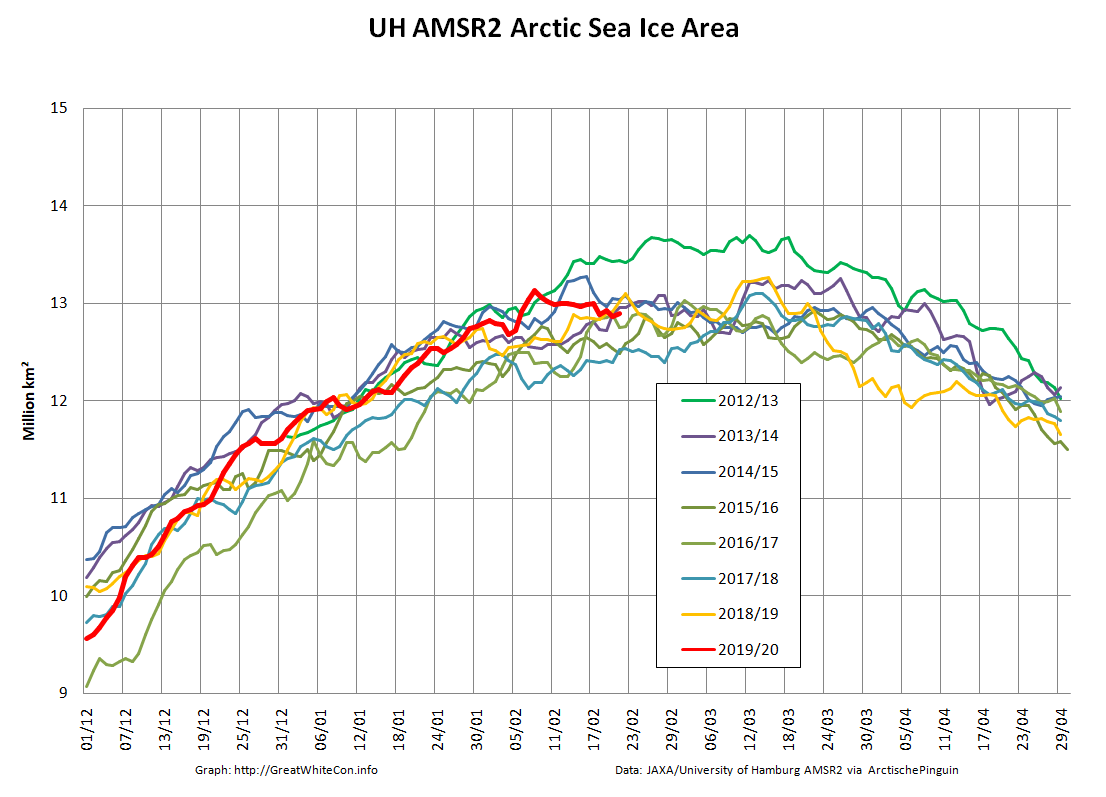
Compare and contrast JAXA extent with Wipneus’ high resolution AMSR2 extent and area:
Perhaps the 2020 maximum area has already been reached?
[Edit – February 25th]
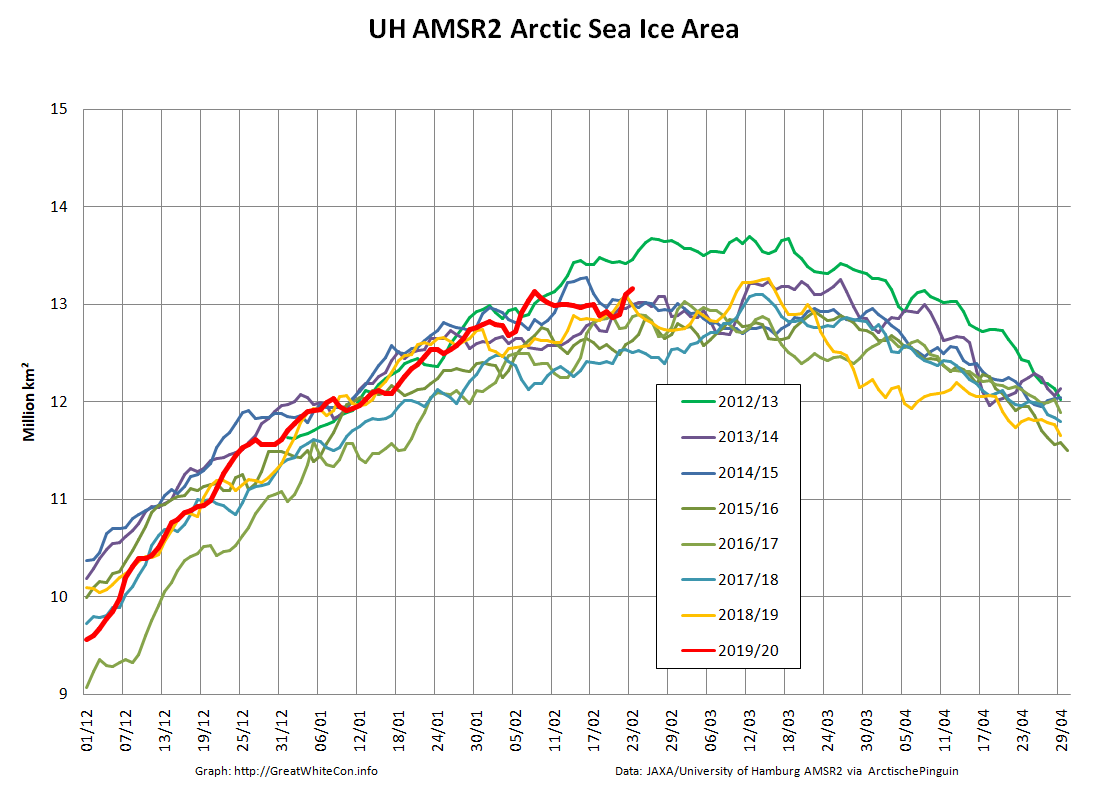
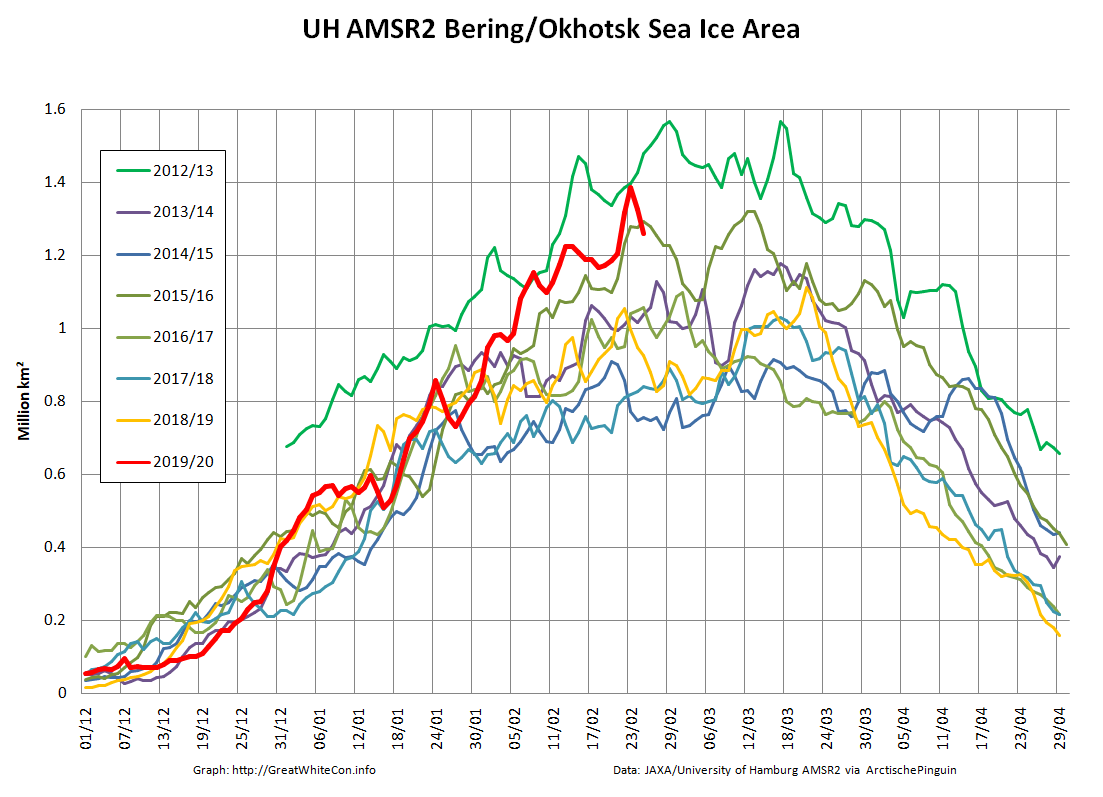
Or perhaps not! We’re playing mix and match this morning, since Wipneus’s new numbers haven’t been released yet. Here UH AMSR2 high resolution Arctic sea ice area from February 23rd:
Plus JAXA extent for the 24th:
[Edit – February 27th]
Tony Heller’s latest sea ice themed article claims “Normal Sea Ice Extent At Both Poles”. Hence today’s JAXA extent graph includes the averages for previous decades:
Extent is evidently increasing once again, and is even more evidently well below what passed for “normal” in the twentieth century!
Let’s also compare the Pacific periphery:
with the Atlantic side of the Arctic Ocean:
The Bering and Okhotsk Seas will be sea ice free by the time September 2020 arrives. How about the Kara, Barents and particularly Greenland Seas though?
[Edit – February 29th]
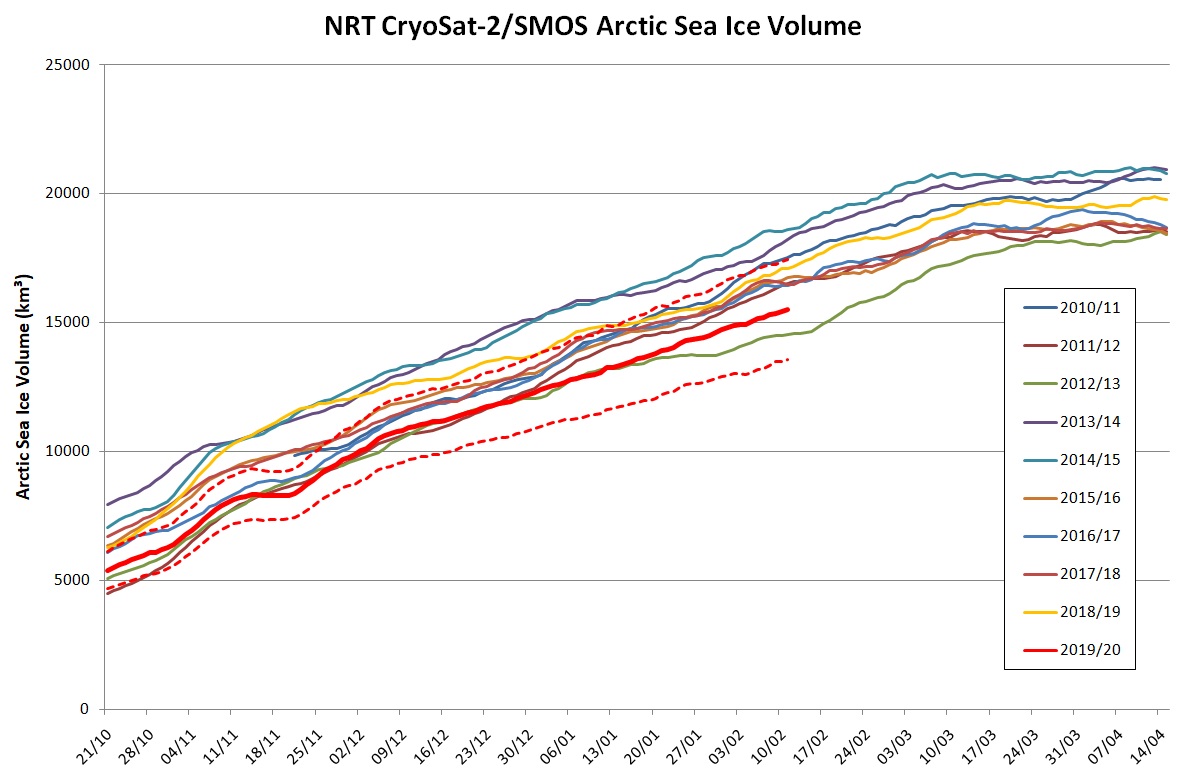
Arctic sea ice maximum volume usually occurs in April, but nonetheless let’s keep an eye on the metric that most nearly measure the “amount” of sea ice left in the Arctic in 2020. Here’s our “measured” CryoSat-2/SMOS volume metric, using reanalysed data up to February 12th:
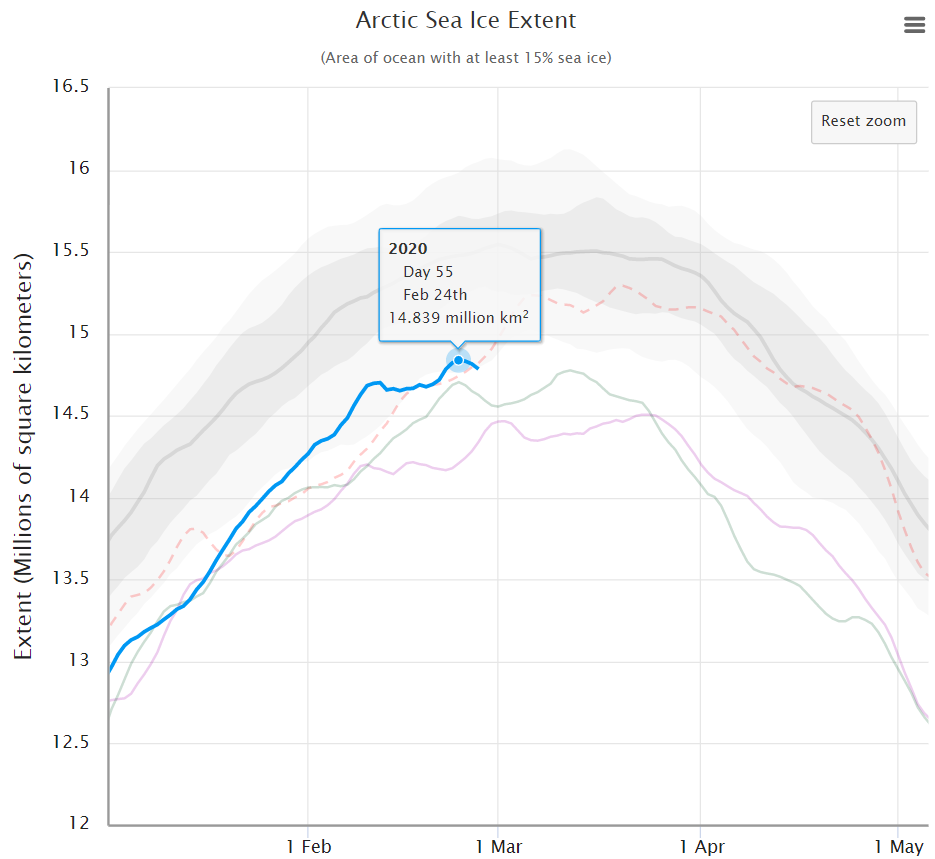
PIOMAS “modelled” volume for February should be released soon, but getting back to extent the JAXA flavour has been setting new highs over recent days:
whereas the NSIDC’s Charctic 5 day averaged extent has not!
[Edit – March 6th]
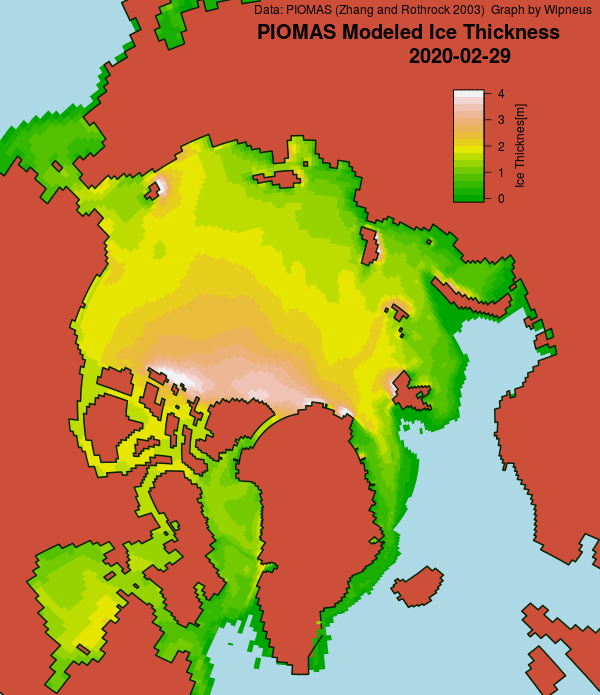
Here’s the February PIOMAS gridded Arctic sea ice thickness map, courtesy of Wipneus on the Arctic Sea Ice Forum:
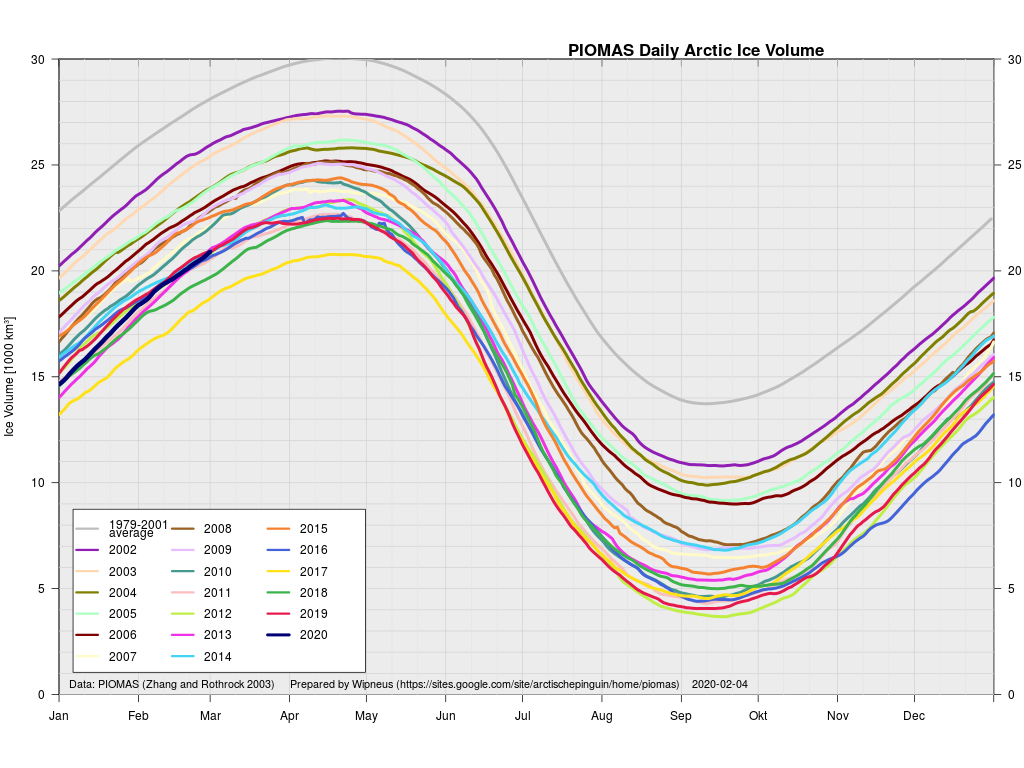
plus the traditional modelled volume graph:
As angech has pointed out elsewhere, according to the PIOMAS team:
CryoSat-2 data show total volume for February 2020 substantially lower than PIOMAS with 2020 Febuary near record low levels over the 2011-2020 period
[Edit – March 19th]
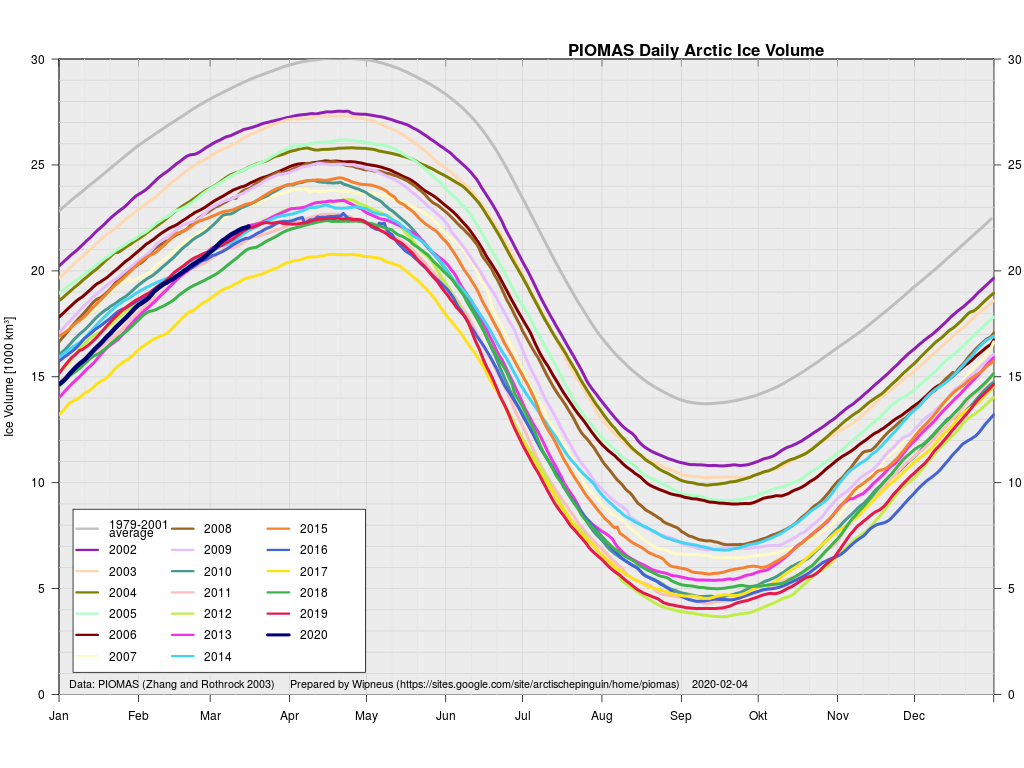
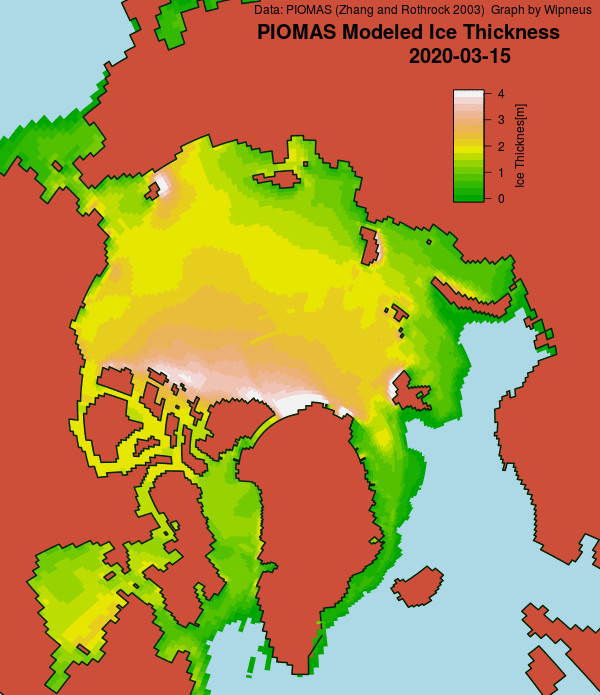
The March mid month PIOMAS numbers have been crunched by Wipneus. Here’s how things look at the moment:
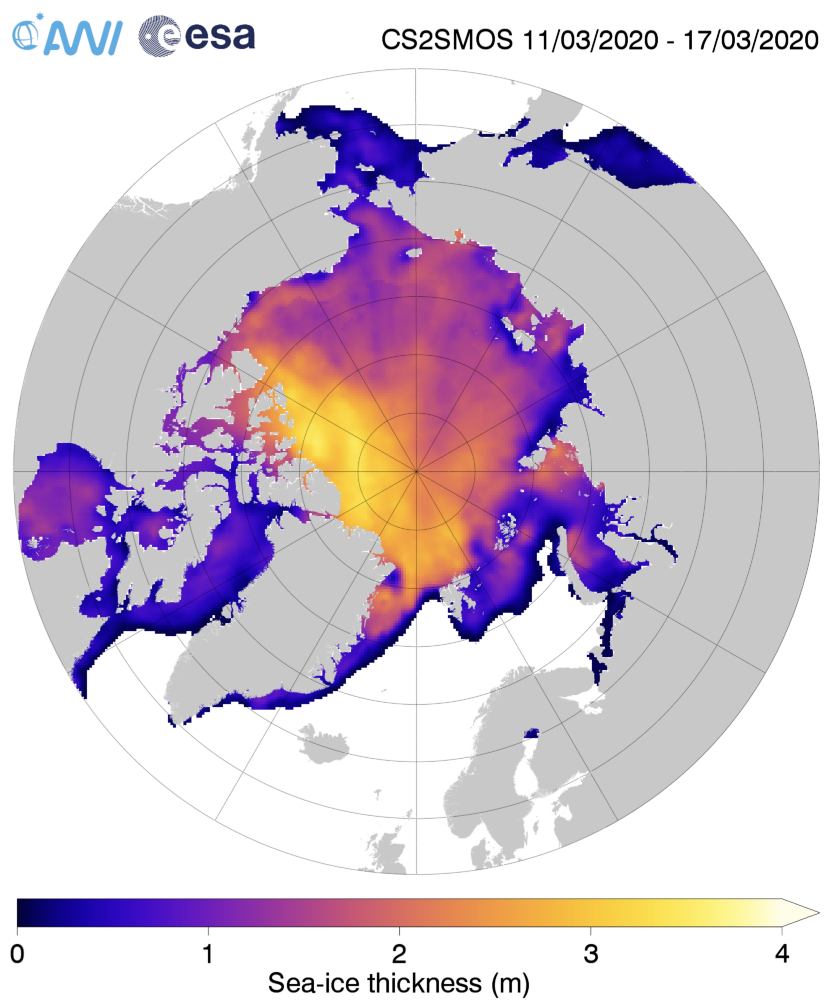
For comparison purposes here’s the current CryoSat-2/SMOS Arctic sea ice thickness map:
[Edit – March 20th]
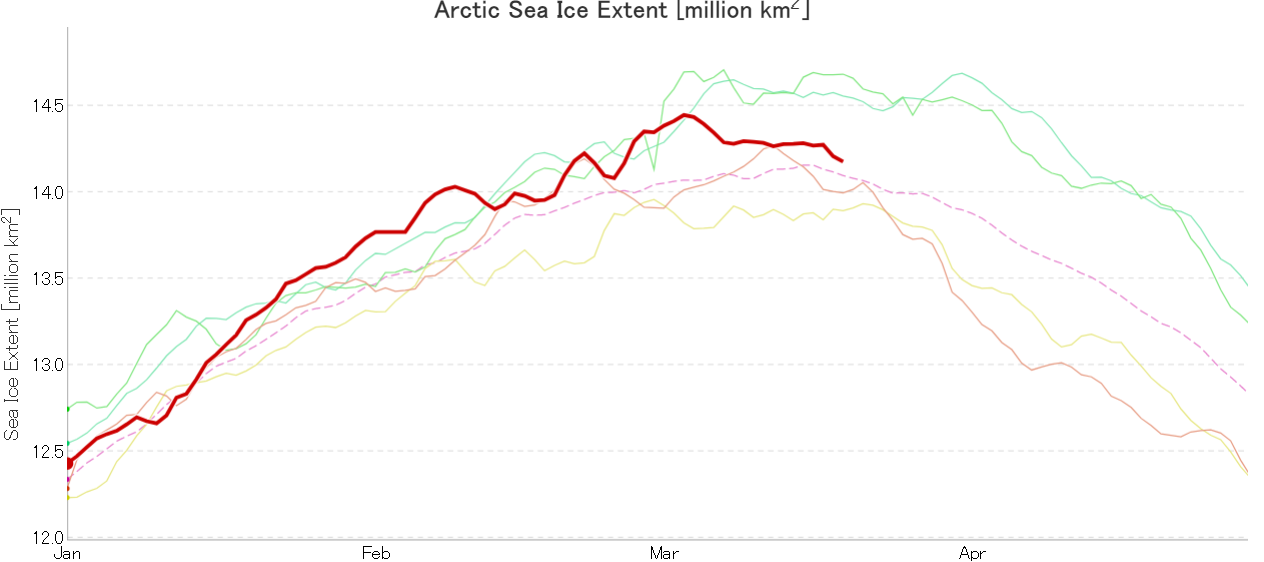
After flatlining for a long time JAXA extent has posted significant declines for two days running. There’s been no official announcement from the NSIDC as yet, but it now seems safe to conclude that there won’t be a late surge in extent similar to 2010. Here’s the current JAXA graph:
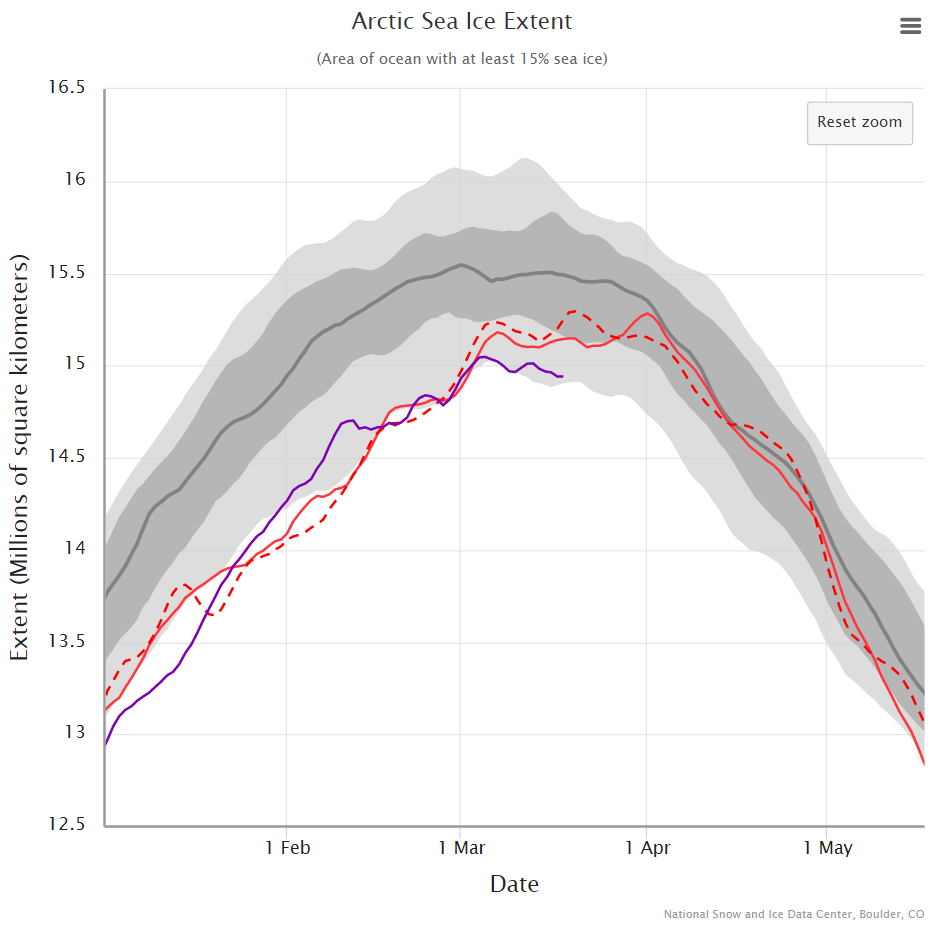
plus NSIDC’s 5 day averaged extent:
Hence the (still provisional!) maximum numbers for 2020 are:
JAXA/VISHOP AMSR2 – 14.45 million square kilometres on March 3rd
NSIDC 5 day SSMIS – 15.05 million square kilometres on March 5th
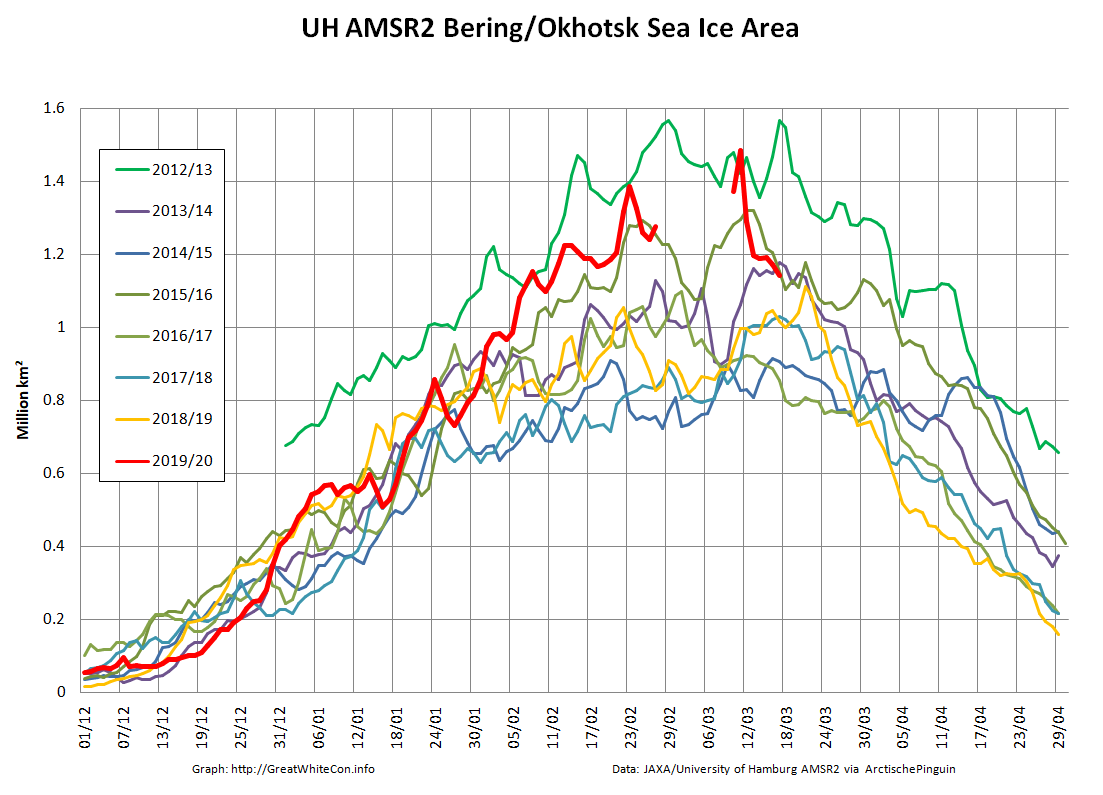
The University of Hamburg’s JAXA AMSR2 concentration data seems to have suffered an outage over the crucial period. Hopefully the gaps will be filled in due course. However more recent regional graphs reveal the following:
The recent declines in overall extent are evidently driven by declines on the Pacific periphery.
September is here once again, so the assorted minima of a variety of Arctic sea ice metrics will be reached soon, if they haven’t happened already!
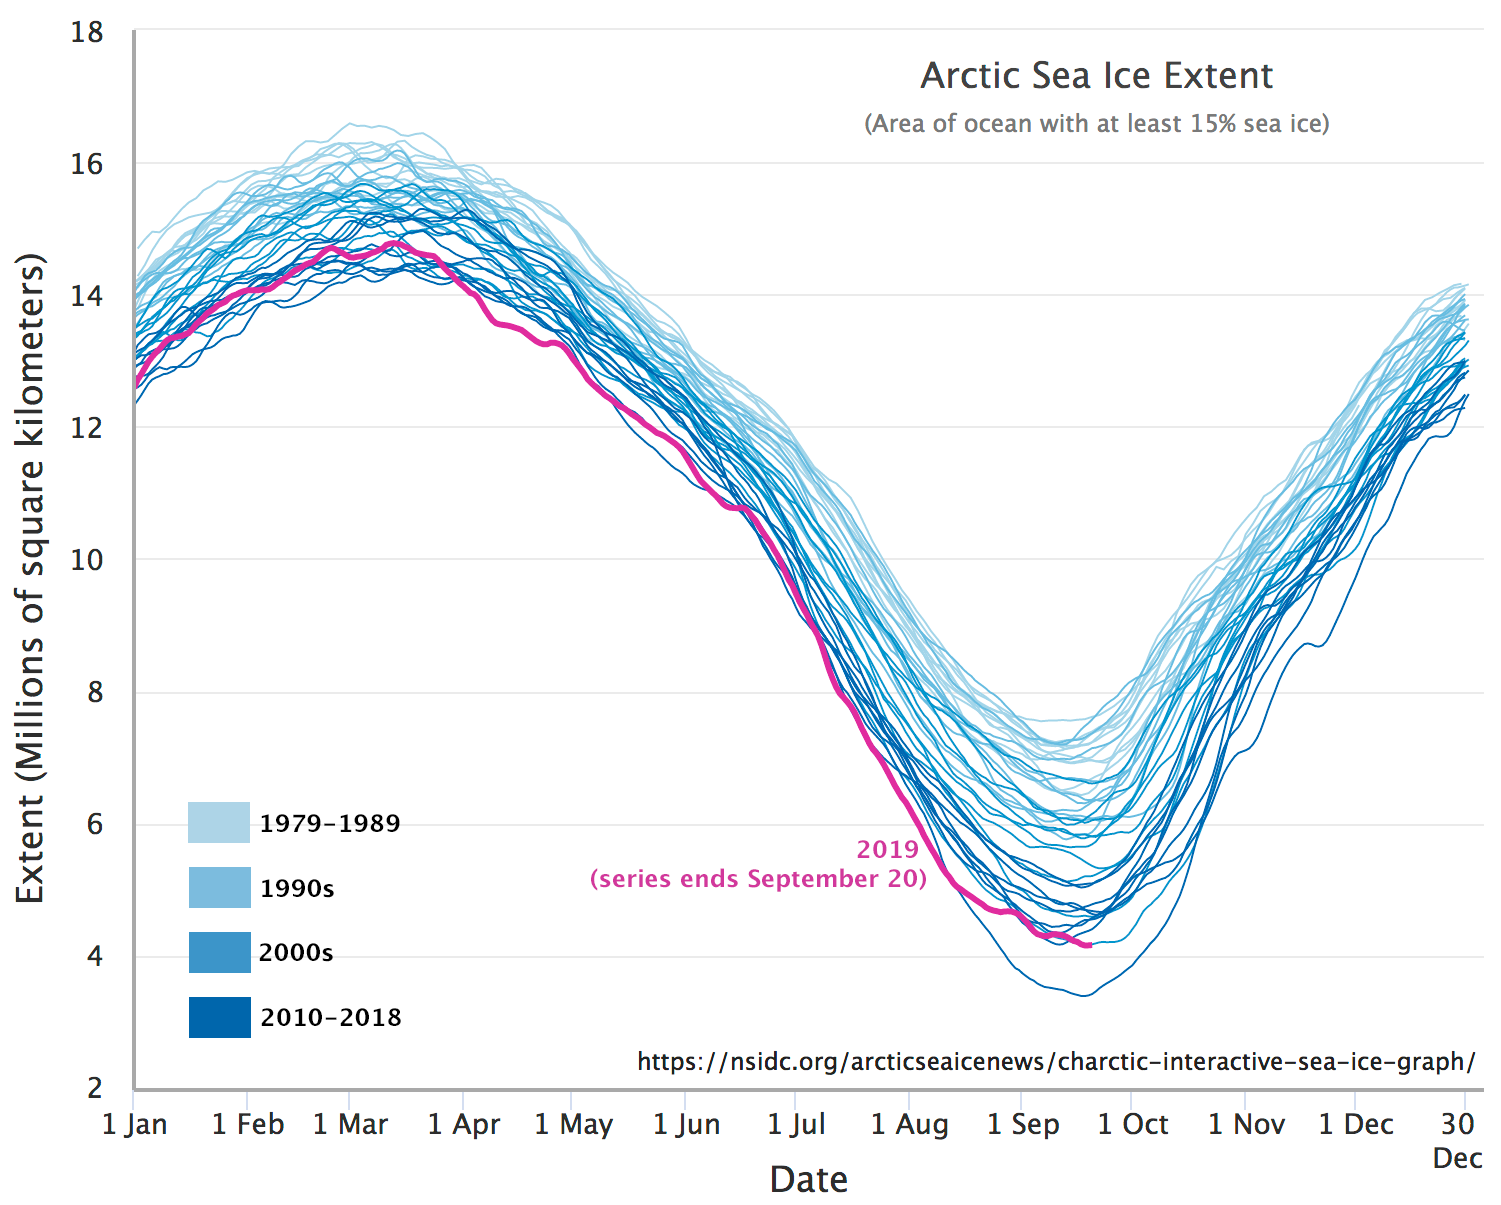
In the latter category let’s first take a look at the NSIDC’s 5 day averaged SSMIS based Arctic sea ice extent:
It looks entirely feasible that the current minimum of 4.29 million square kilometres on September 7th will hold for the rest of the calendar year. The daily NSIDC number is currently 4.24 million km² on September 4th.
By way of contrast the JAXA/ViSHOP AMSR2 based extent hit a new low of 4.11 million km² yesterday:
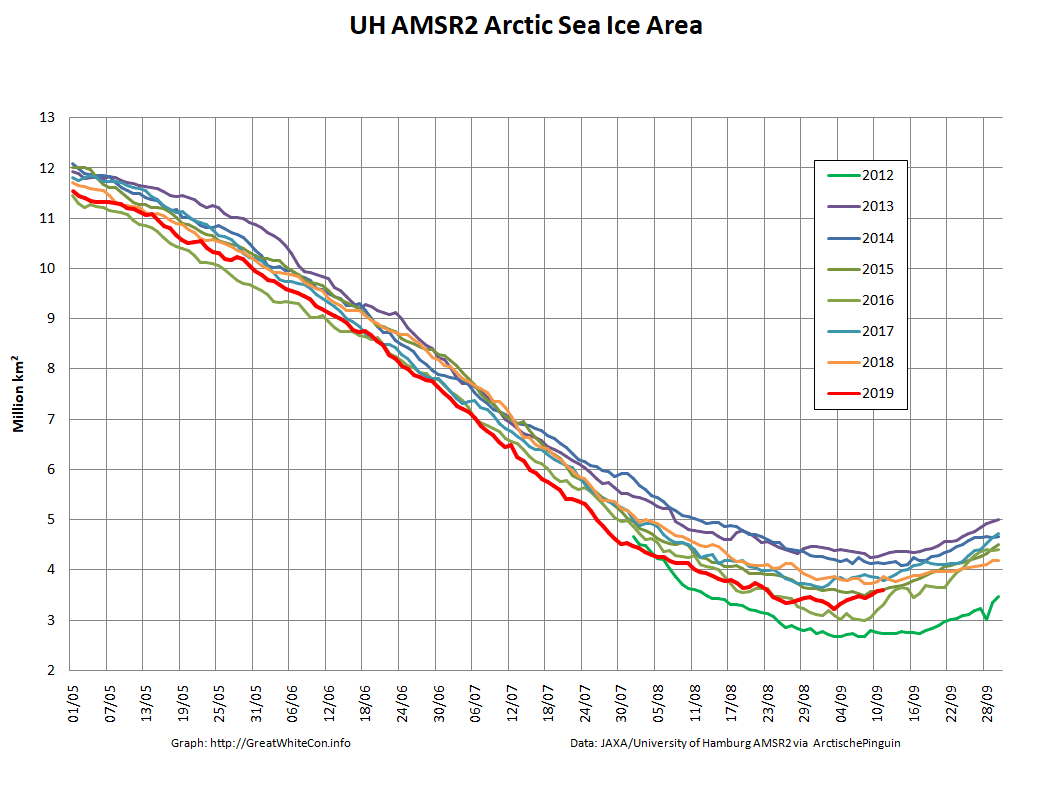
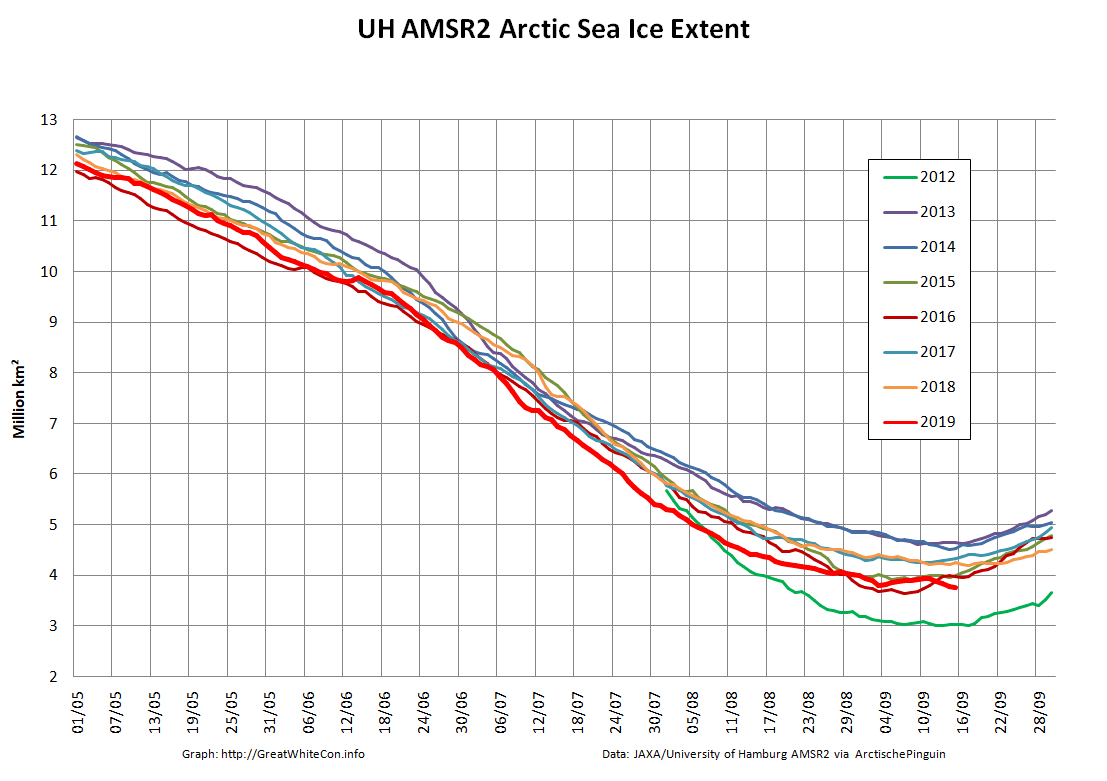
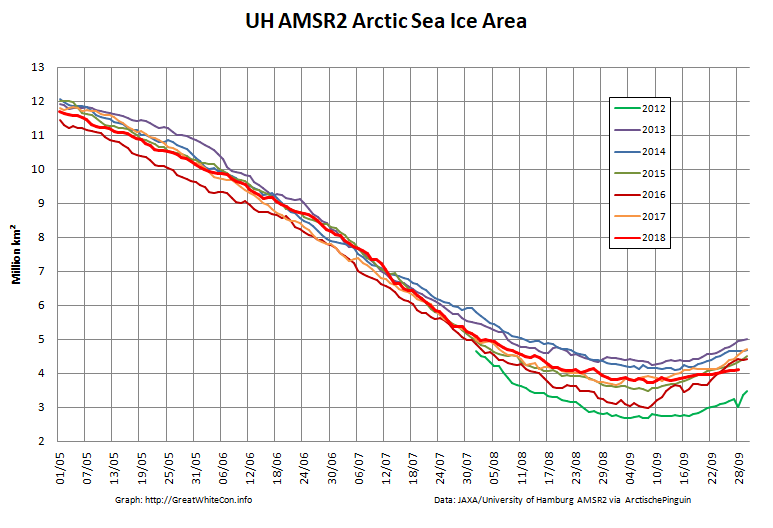
And what of our much beloved high resolution AMSR2 metrics derived by “Wipneus” from the University of Hamburg’s AMSR2 concentration data? Area certainly looks to be past the minimum for this year, whereas extent is still conceivably capable of another push lower:
The provisional minimum extent for 2019 is 3.80 million km² on September 3rd.
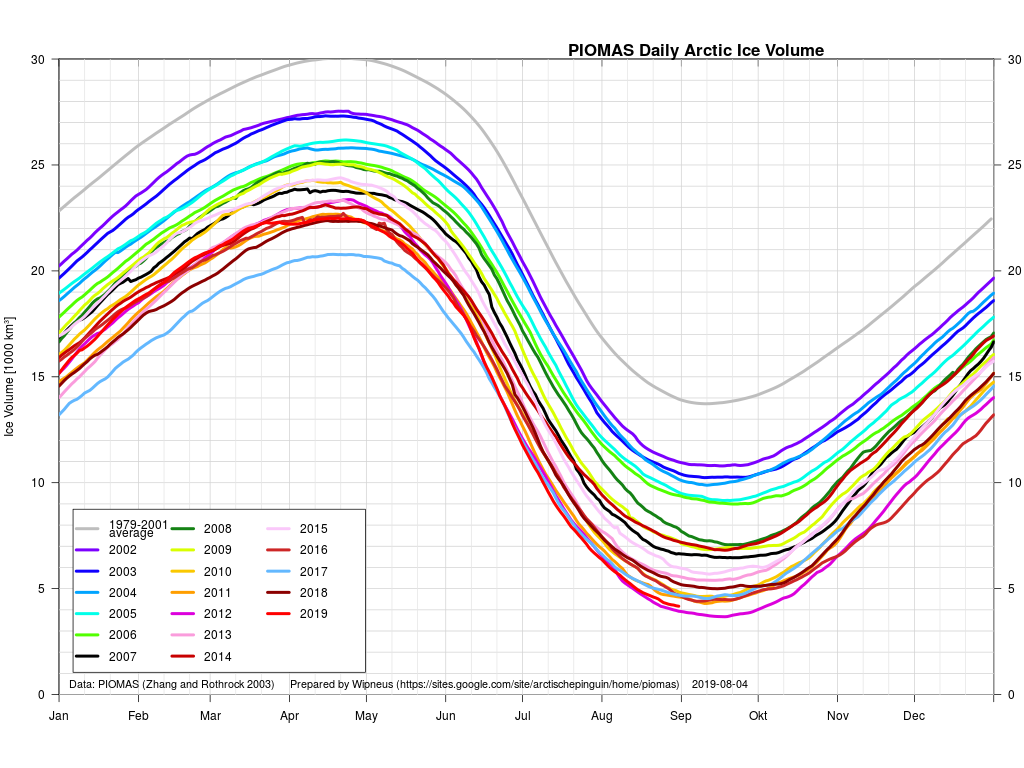
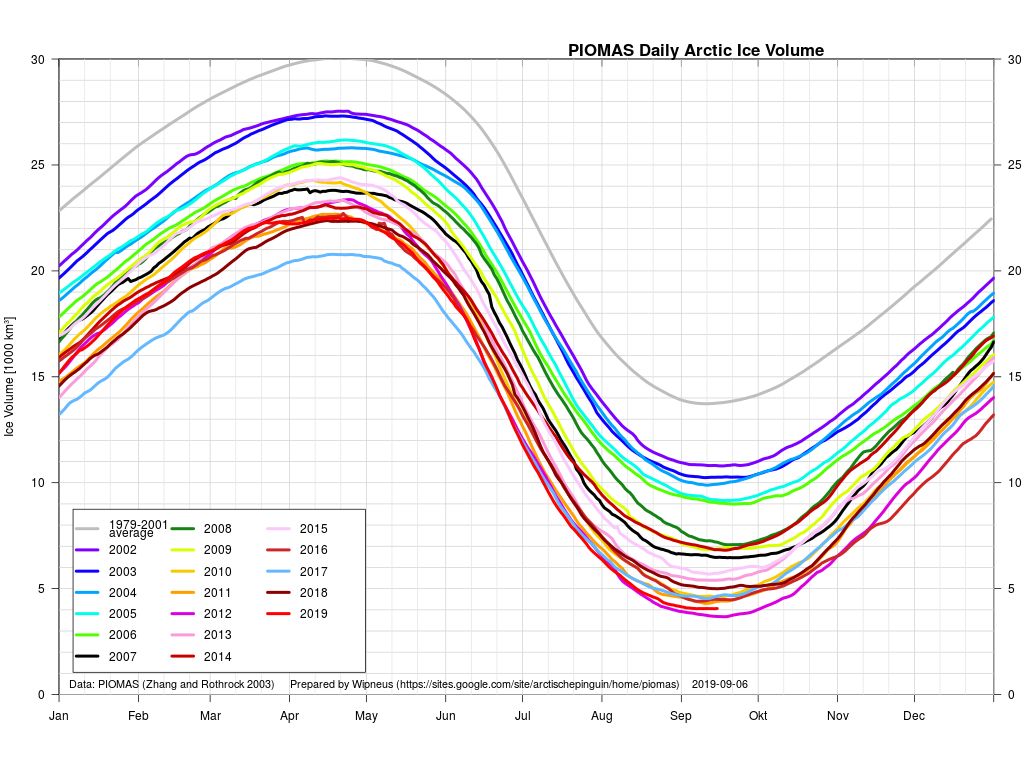
The minimum Arctic sea ice volume generally occurs slightly later than area or extent. The data certainly arrives later! Here’s the PIOMAS graph up to August 31st:
Note that Arctic wide modelled volume is only slightly higher than in 2012 at the same time of year, but there is a noticeably greater percentage gap in extent. That implies that average ice thickness across the Arctic is lower in 2019 than in 2012.
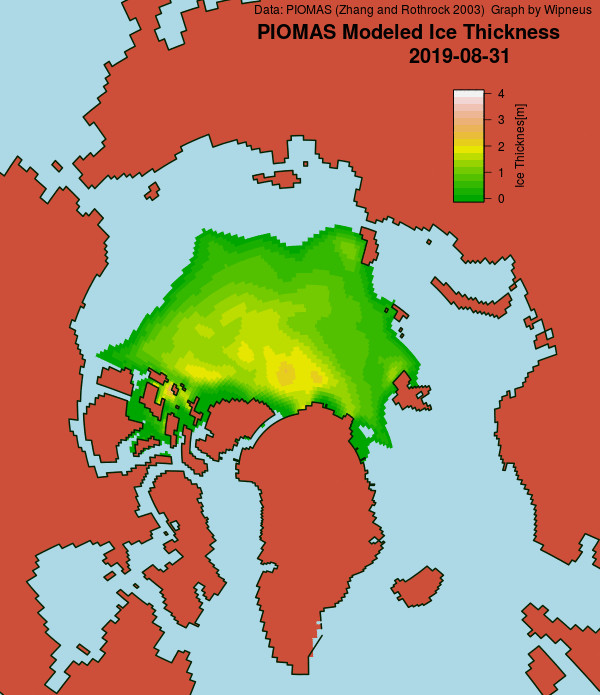
Note also that the thickest ice is no longer located along the north coasts of Greenland and the Canadian Arctic Archipelago. Here are the equivalent maps for previous years for comparison purposes:
Perhaps JAXA extent will head still lower over the next few days? Perhaps PIOMAS volume will sneak below 2012 before the peripheral refreeze begins?
[Edit – September 13th]
JAXA Arctic sea ice extent has reached a new minimum of 4.09 million km².
NSIDC daily extent is currently 4.28 million km², still just above the September 4th minimum.
[Edit – September 14th]
JAXA Arctic sea ice extent has reached a new minimum of 4.05 million km², which now puts it below the 2007 minimum that occurred somewhat later in September:
[Edit – September 14th PM]
NSIDC 5 day averaged extent has also (by a whisker!) reached a new minimum for the year of 4.285 million km²:
The daily number fell to 4.21 million km².
[Edit – September 15th]
I have somewhat belatedly discovered that in the build up to the forthcoming MOSAiC Expedition the Alfred Wegener Institute recently announced that:
The sea-ice extent in the Arctic is nearing its annual minimum at the end of the melt season in September. Only circa 3.9 million square kilometres of the Arctic Ocean are covered by sea ice any more, according to researchers from the Alfred Wegener Institute and the University of Bremen. This is only the second time that the annual minimum has dropped below four million square kilometres since satellite measurements began in 1979.
[Edit – September 16th]
JAXA/ViSHOP extent has dropped below the 2016 minimum, and now measures 4.01 million km²:
Only 2012 left to beat!
Wipneus’ high resolution AMSR2 extent has also posted a new low for the year, but still has a little way to go before passing 2016:
Area is also currently declining, but is still well away from a new minimum for 2019:
[Edit – September 19th]
After some more modest declines JAXA/ViSHOP extent has just increased marginally from the previous day, and now measures 3.98 million km²:
That puts the (very!) tentative minimum for 2019 at 3.96 million km² on September 17th.
[Edit – September 20th]
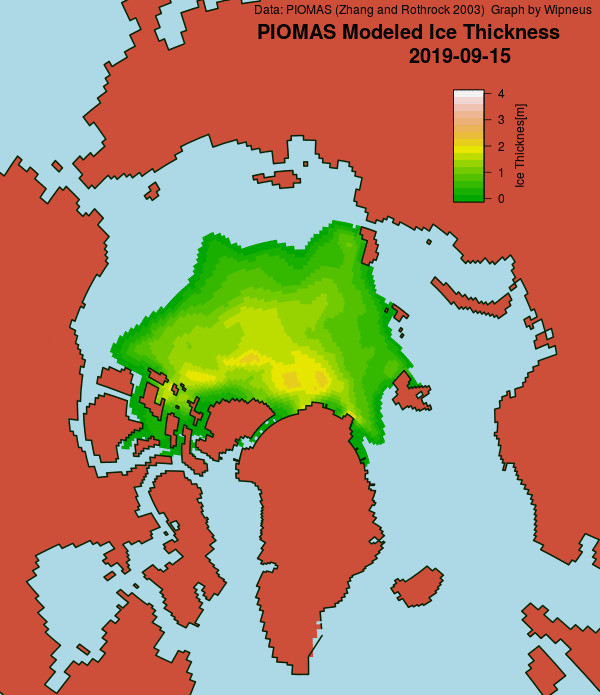
The mid month PIOMAS gridded thickness and volume numbers have been released:
As anticipated given recent extent values, the volume difference from 2012 has increased somewhat over the last two weeks.
[Edit – September 23rd]
The National Snow and Ice Data Center have called the 2019 minimum in their latest edition of Arctic Sea Ice News:
On September 18, 2019, sea ice extent dropped to 4.15 million square kilometers (1.60 million square miles), effectively tied for the second lowest minimum in the satellite record along with 2007 and 2016. This appears to be the lowest extent of the year. In response to the setting sun and falling temperatures, ice extent will begin increasing through autumn and winter. However, a shift in wind patterns or a period of late season melt could still push the ice extent lower.
[Edit – September 24th]
To summarise the assorted minimum extent metrics for 2019:
University of Bremen – 3.77 million km² on September 18th, 2nd lowest behind 2012. JAXA/ViSHOP – 3.96 million km² on September 17th, “Statistical tie” with 2016 for 2nd lowest. NSIDC 1 day – 4.10 million km² on September 17th, “Statistical tie” with 2016 for 2nd lowest. NSIDC 5 day – 4.15 million km² on September 18th, 2nd lowest behind 2012.
[Edit – October 1st]
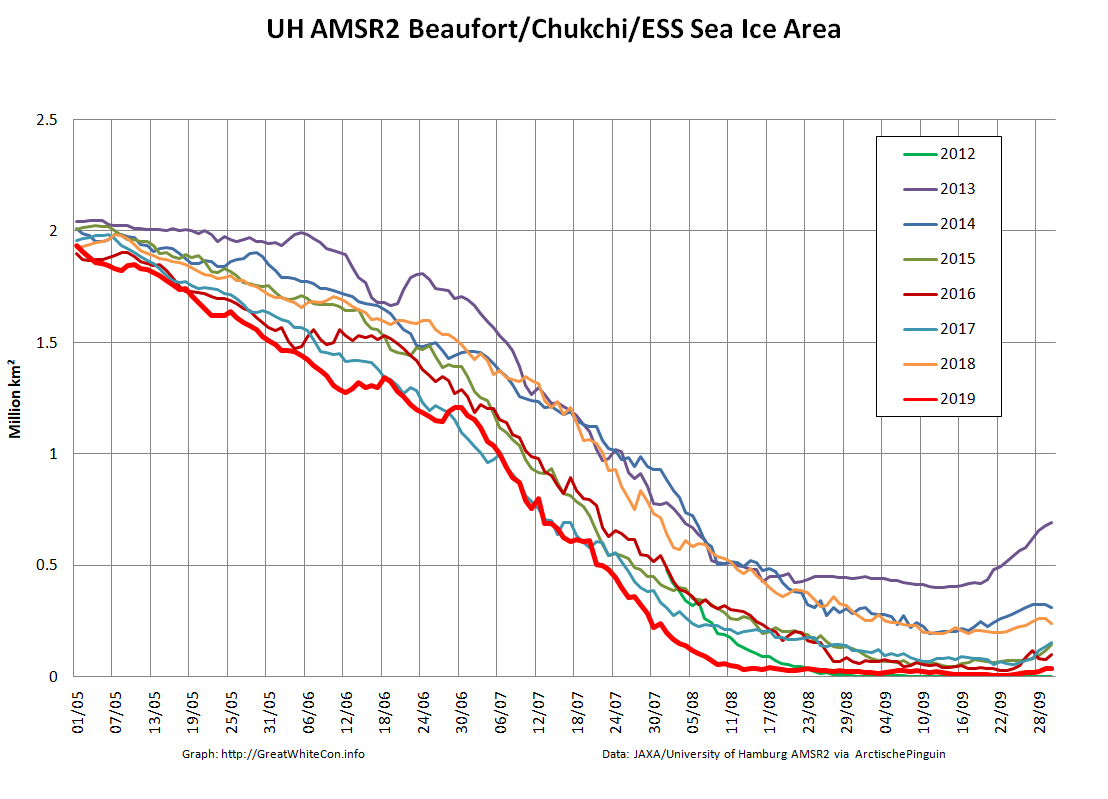
Two sides of the same coin? Sea ice area on the Pacific side of the Arctic has been at historic lows for most of the melting season:
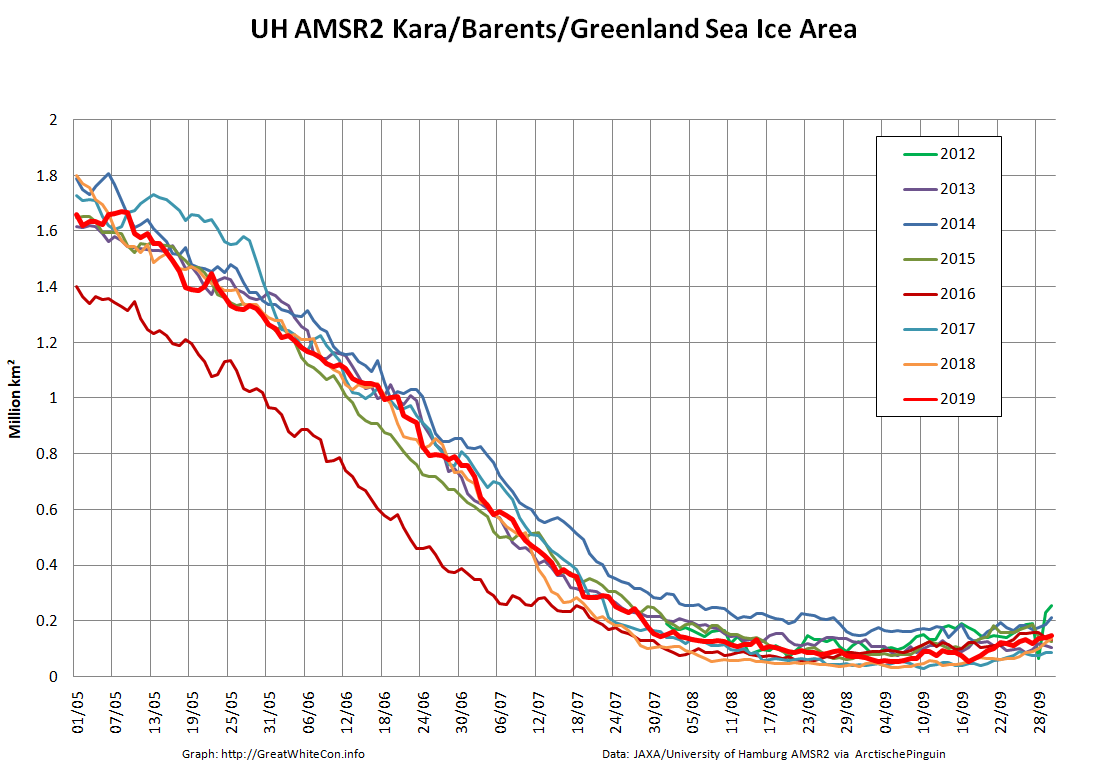
whereas on the Atlantic side:
[Edit – October 7th]
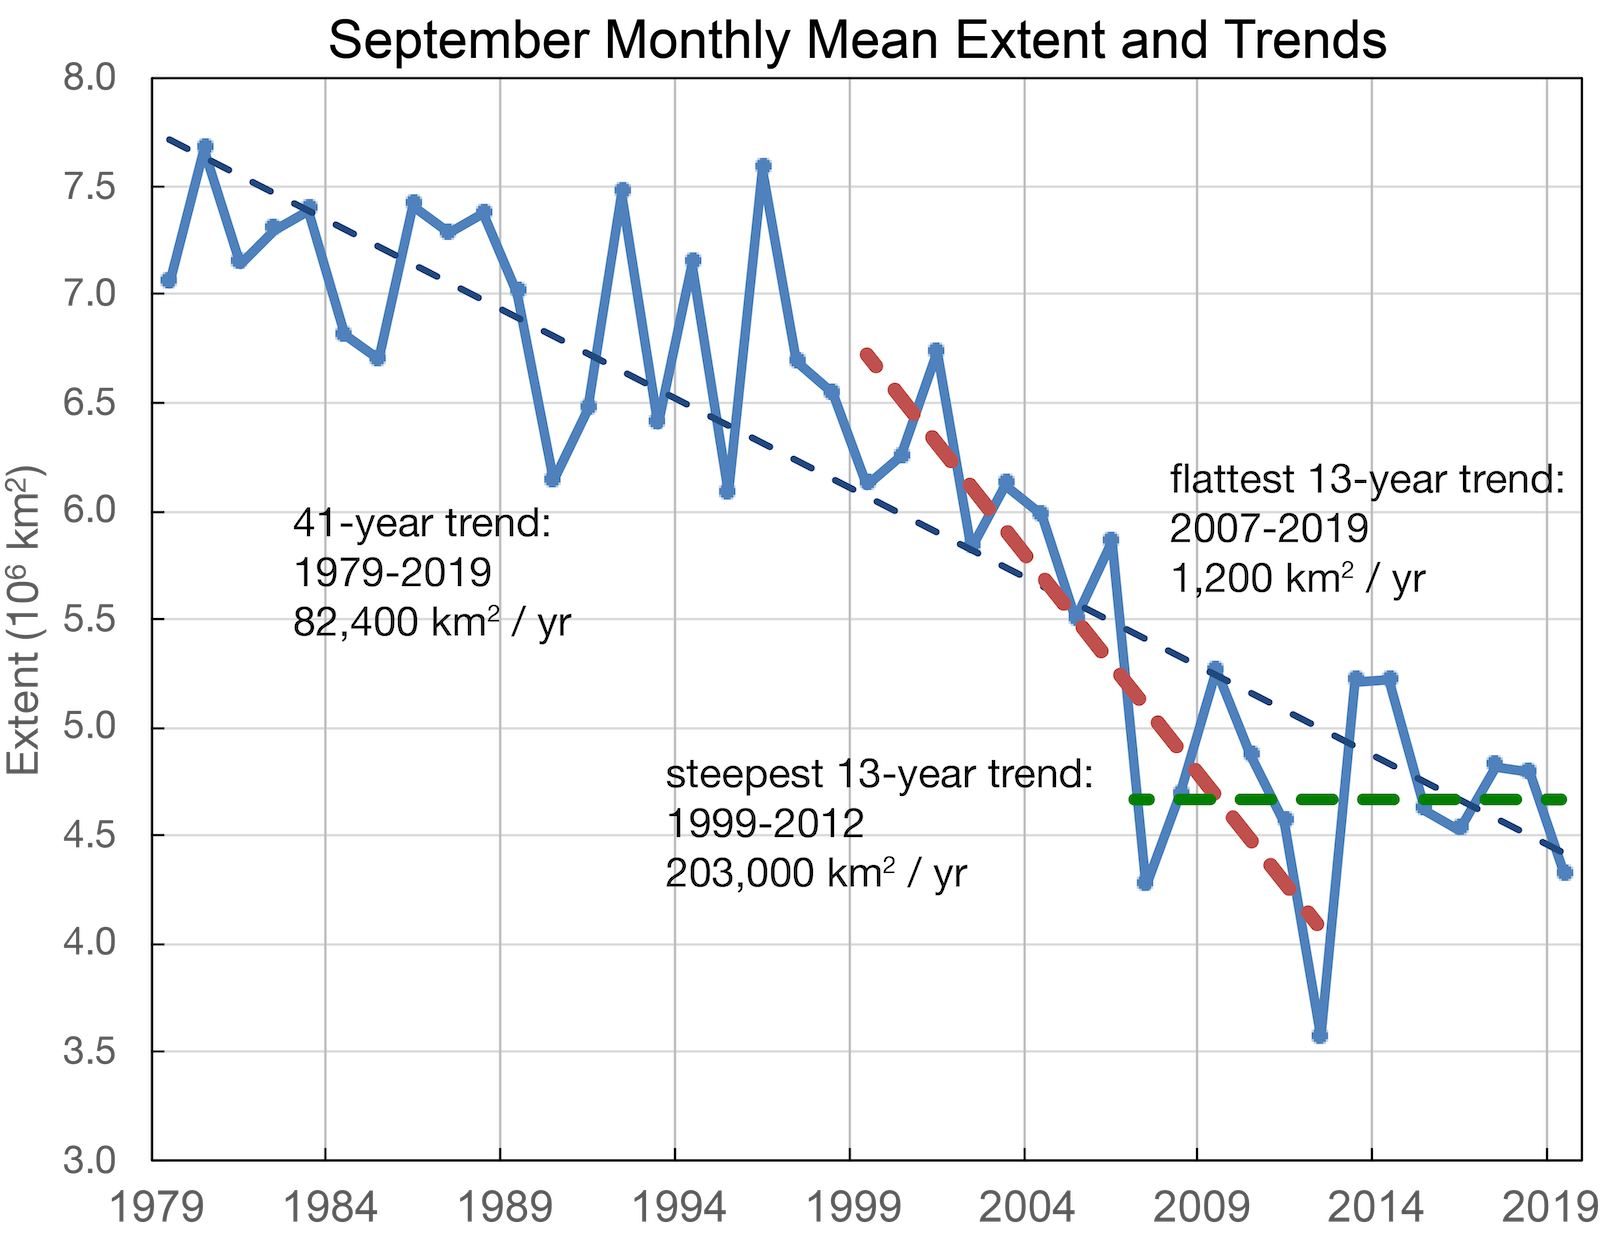
The September monthly numbers have arrived from the NSIDC, together with some intriguing annotations by Walt Meier:
A couple of years ago I was asked to provide “a handful of things [you] will be keeping an eye on over the next few months to judge how ‘good’ or ‘bad’ the melt is going?”
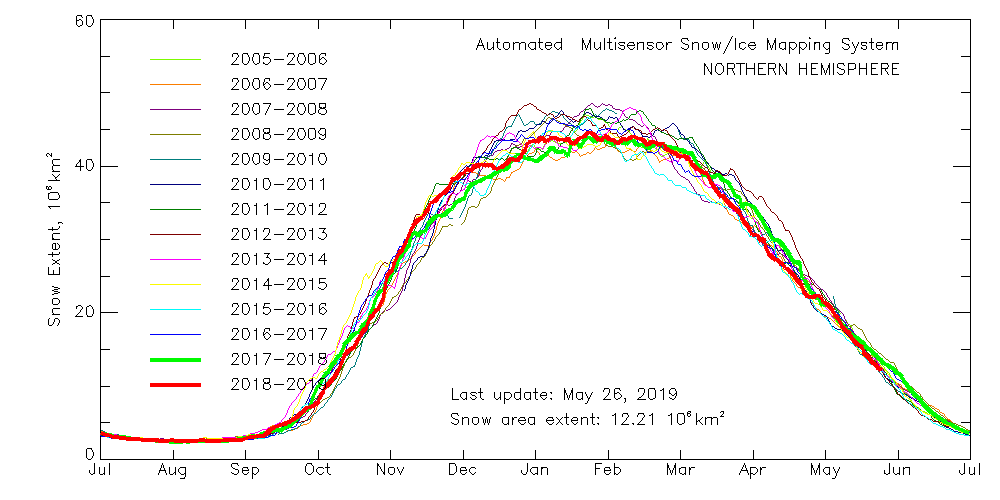
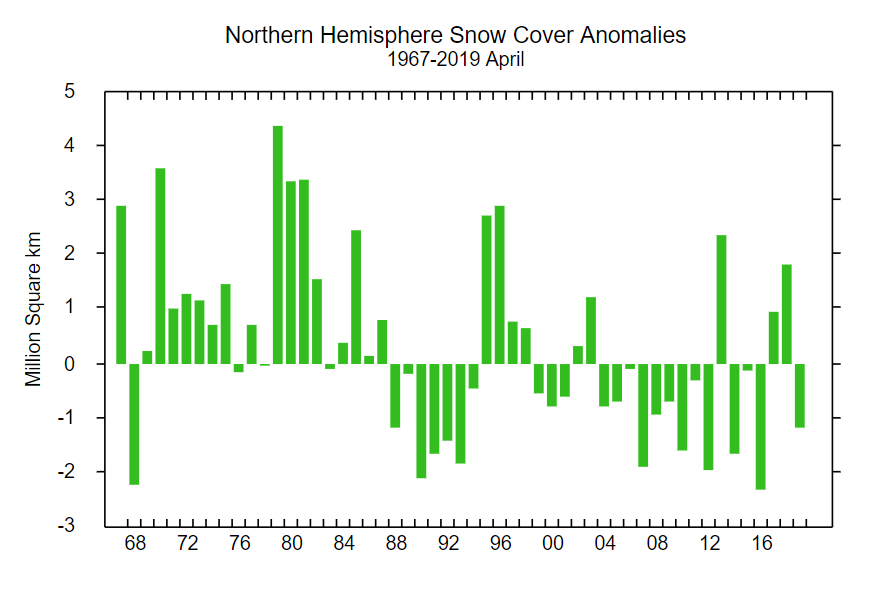
That suggests snow cover over land is close to recent lows, which is confirmed by the Rutgers University snow cover anomaly graph for April:
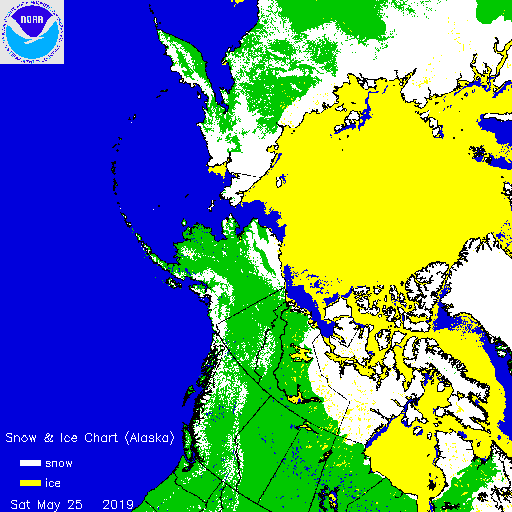
This year is anomalously low, but not by as much as 2012 and 2016. For completeness, here also is the current US National Ice Center snow cover map:
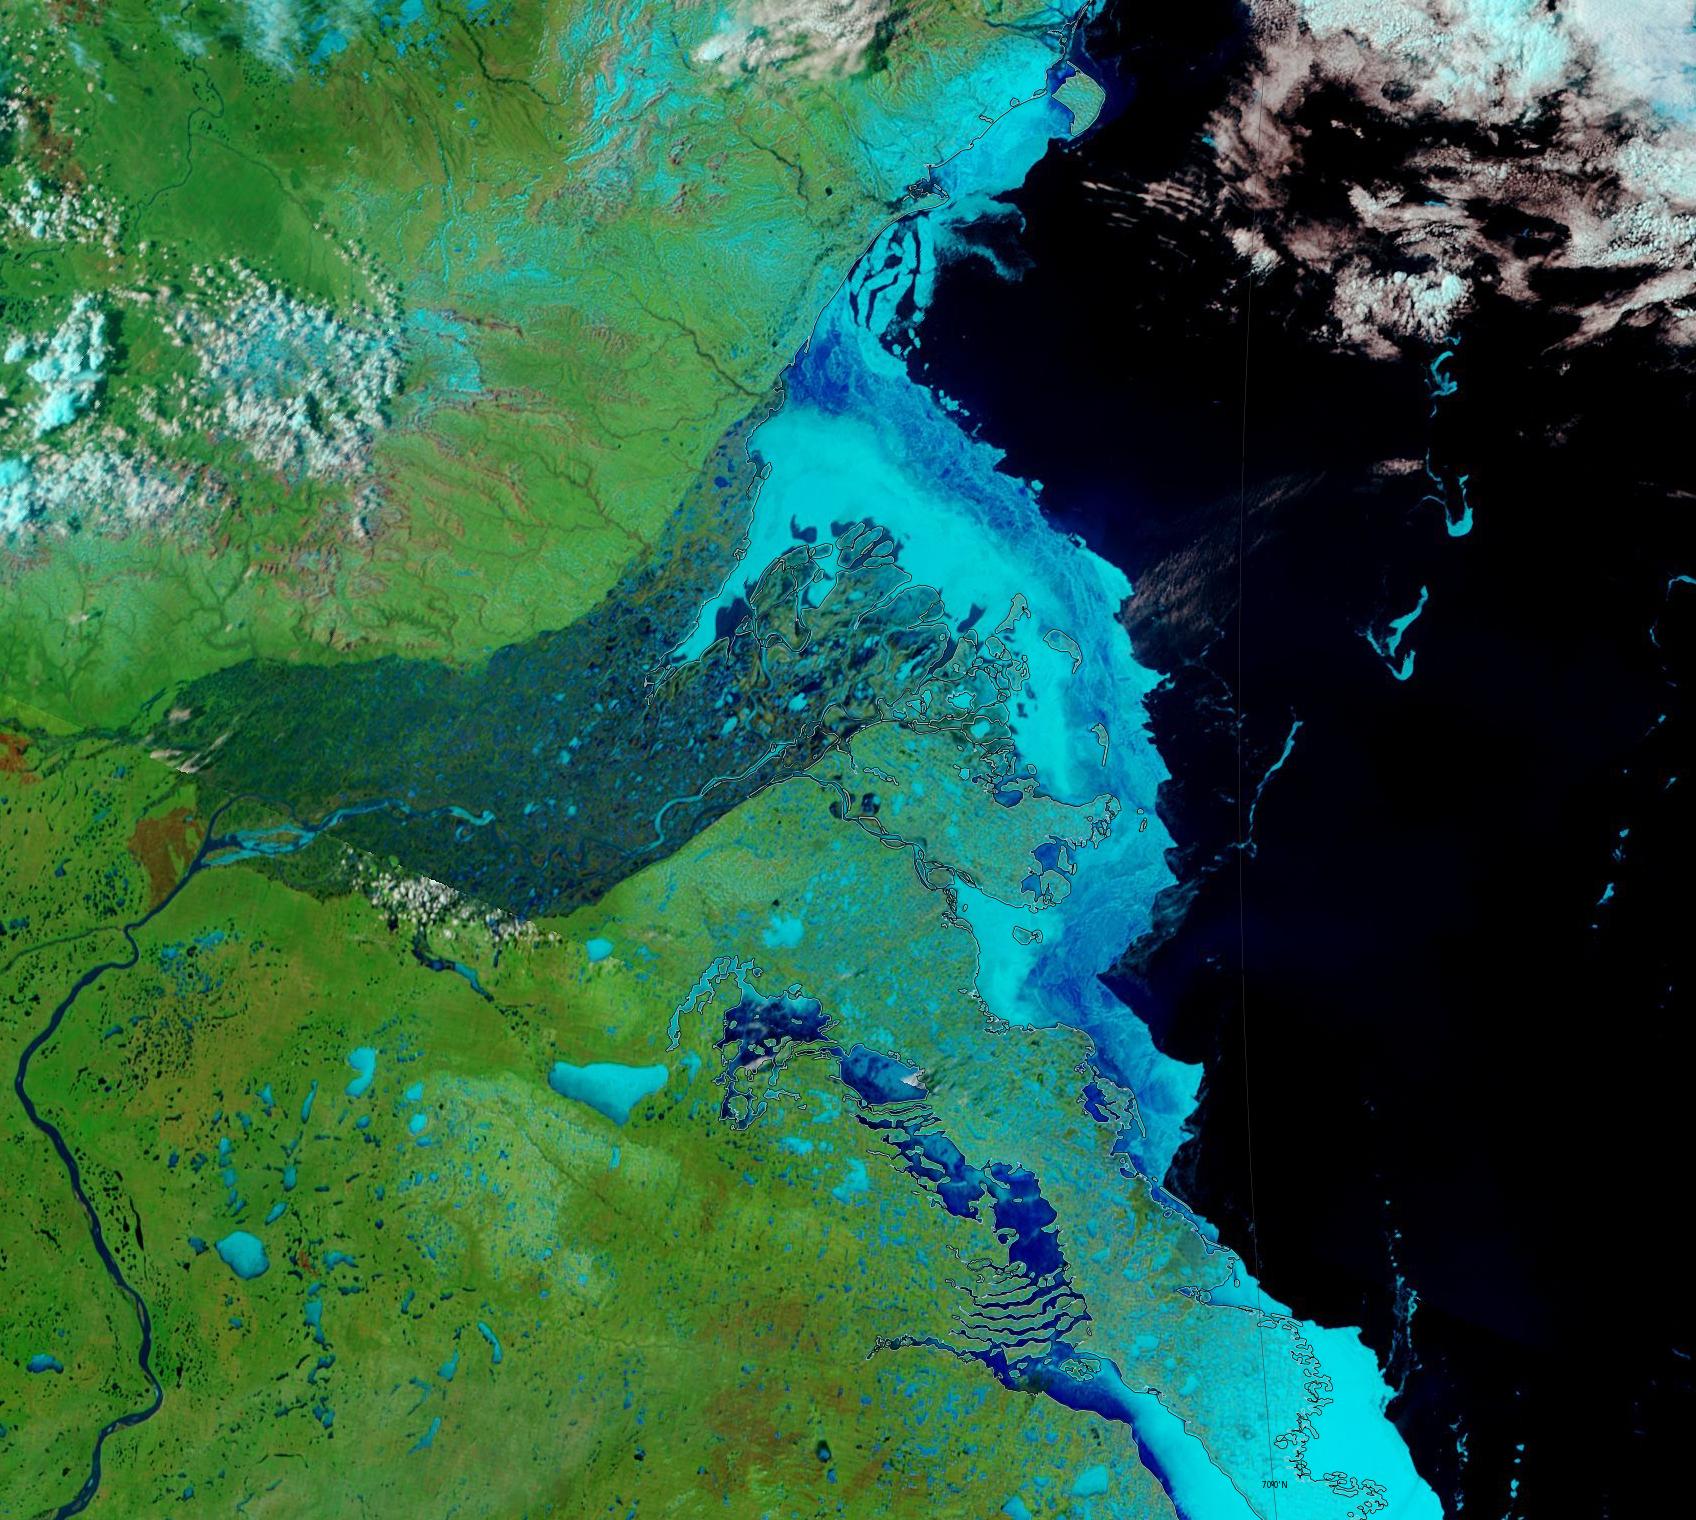
Moving on to melt ponds, there are plenty to be seen on the fast ice around the Mackenzie river delta:
NASA Worldview “false-color” image of the Mackenzie Delta on May 24th 2019, derived from the MODIS sensor on the Terra satellite
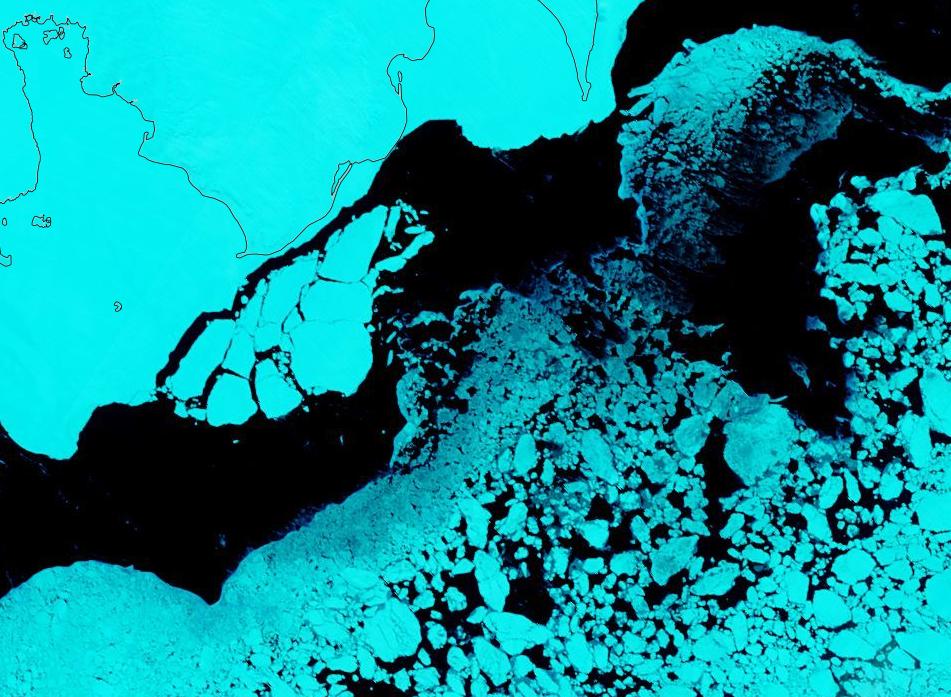
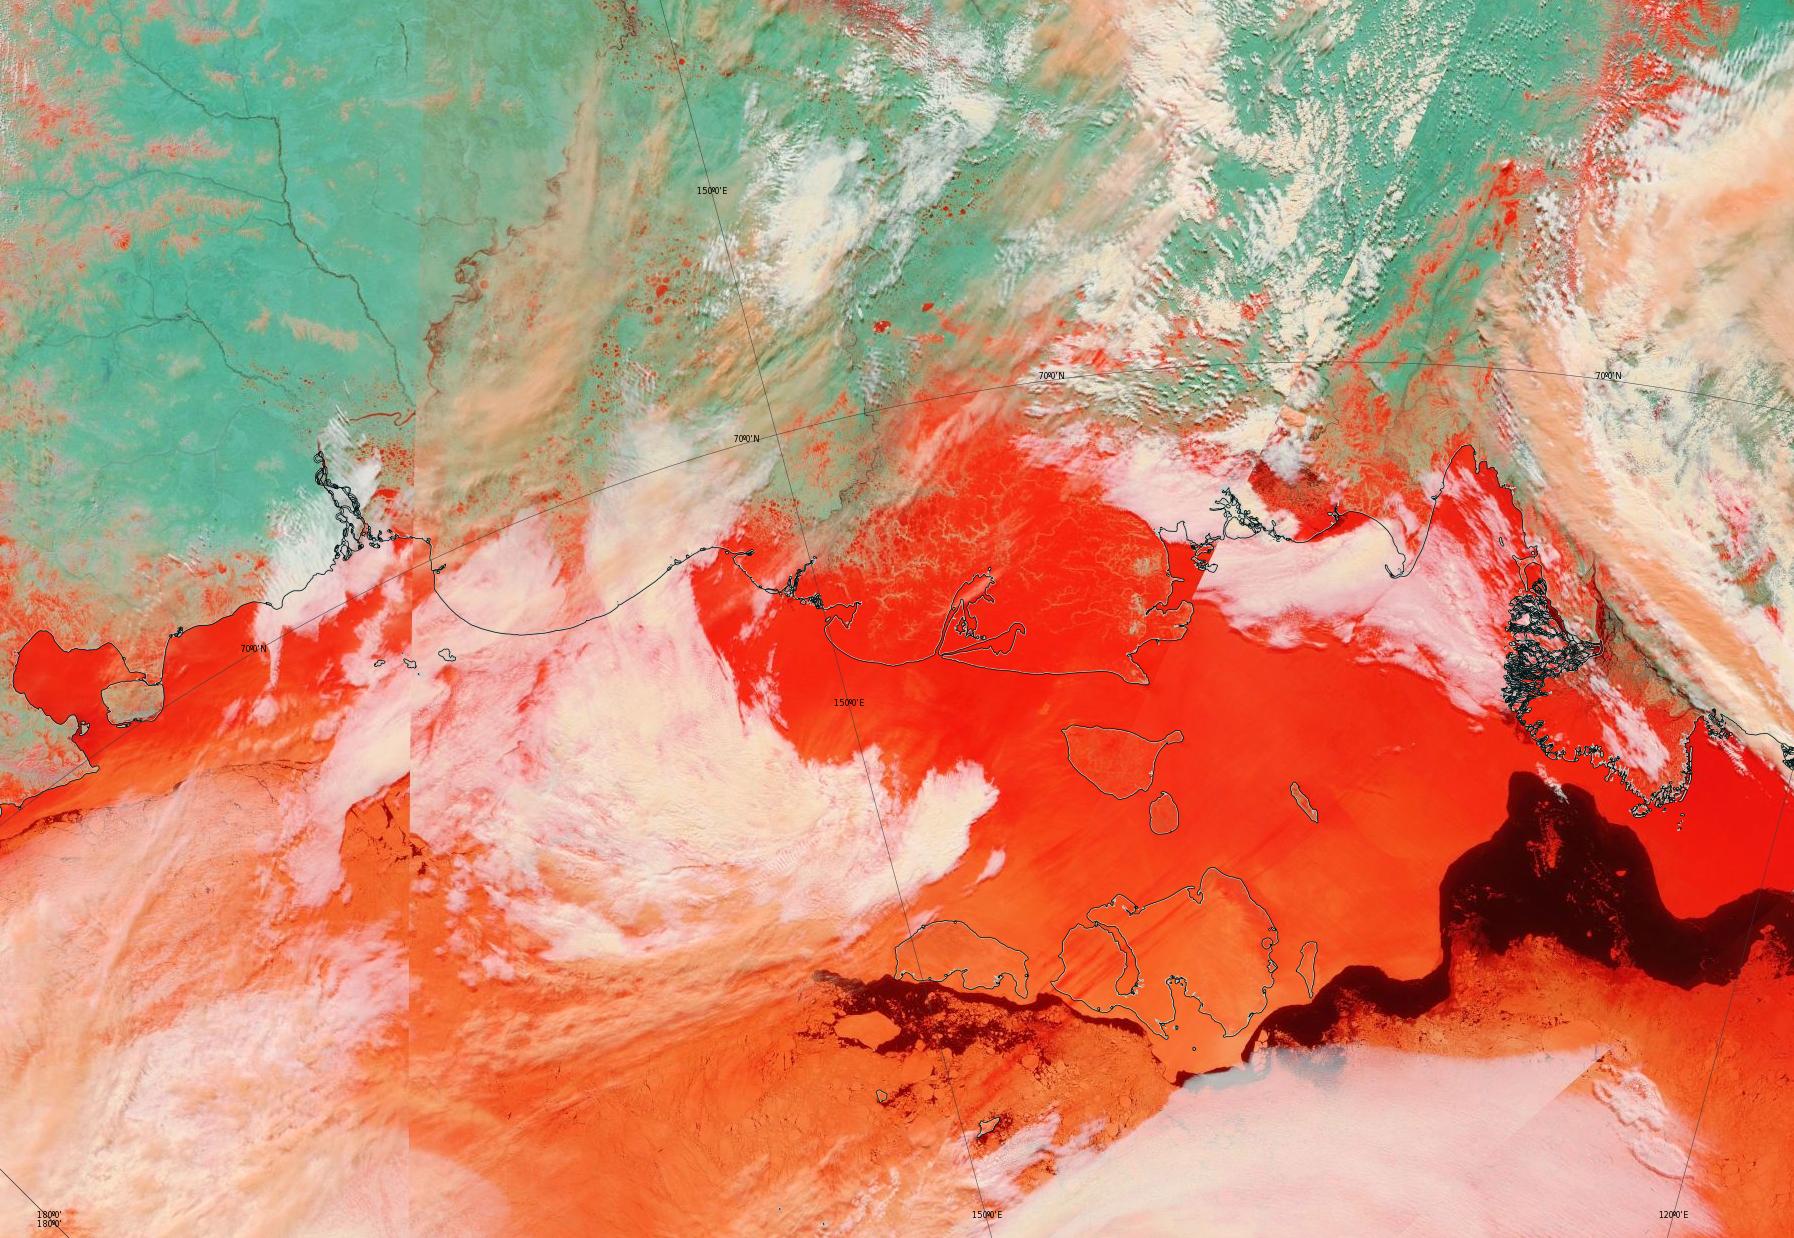
There also seem to be signs of some at a higher latitude off Ostrov Kotelny in the New Siberian Islands:
NASA Worldview “false-color” image of the Laptev Sea on May 23rd 2019, derived from the MODIS sensor on the Terra satellite
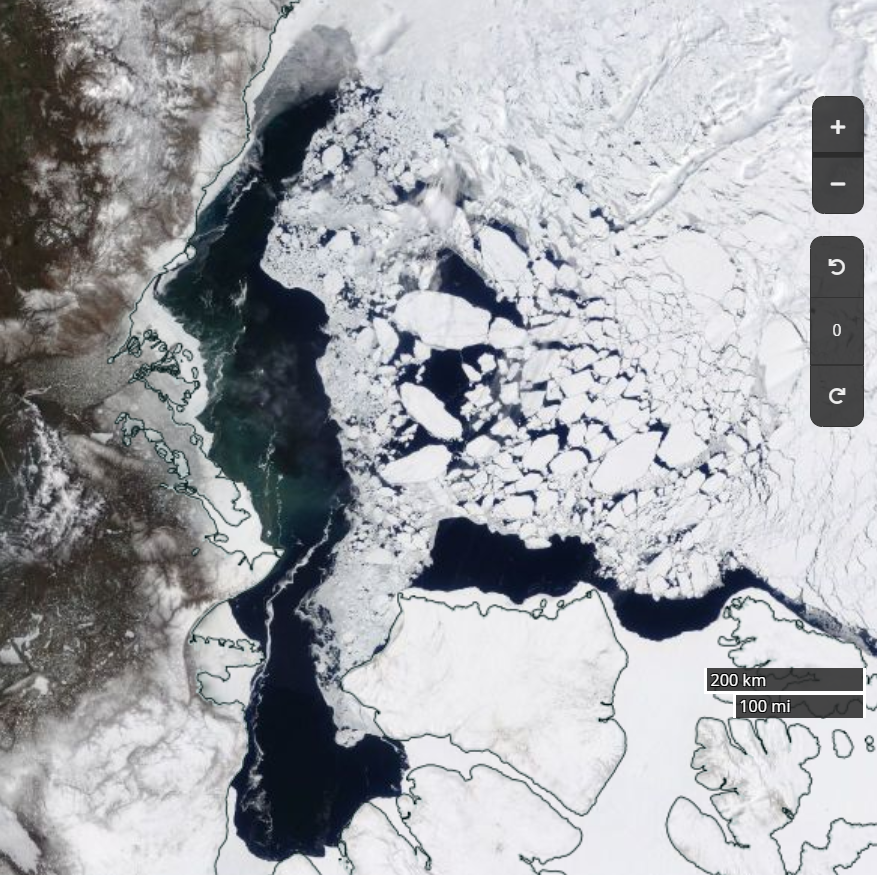
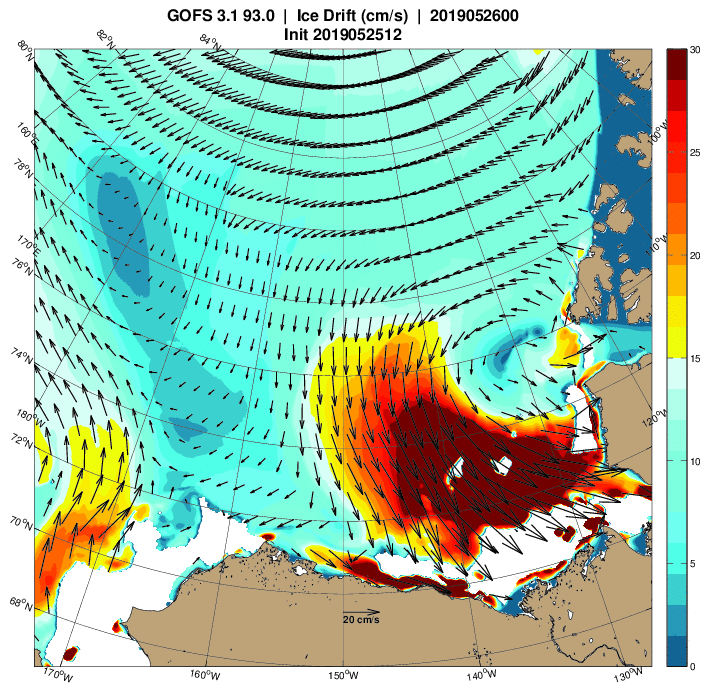
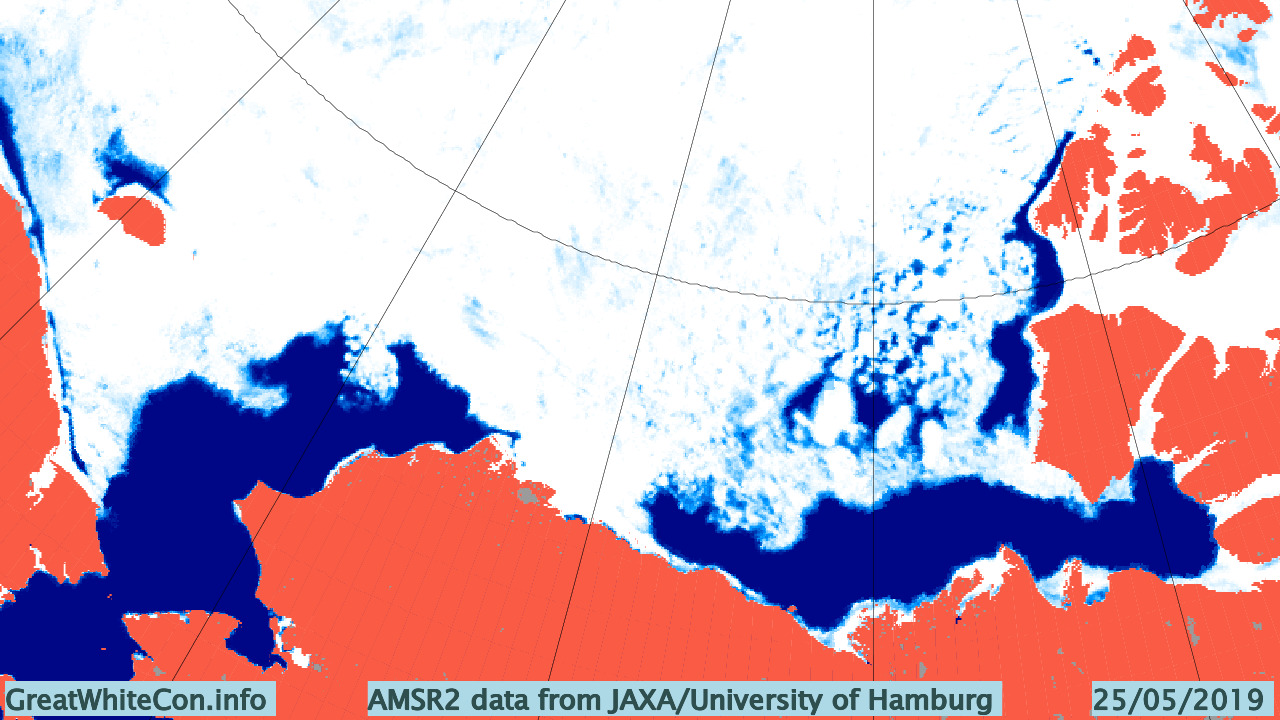
This year there is also a lot of open water in the Chukchi Sea, and almost no sea ice left in the Bering Sea:
Compared with 2016 at the same time of year I am compelled to say that with June 1st just around the corner the 2019 summer melting season is primed to progress more quickly.
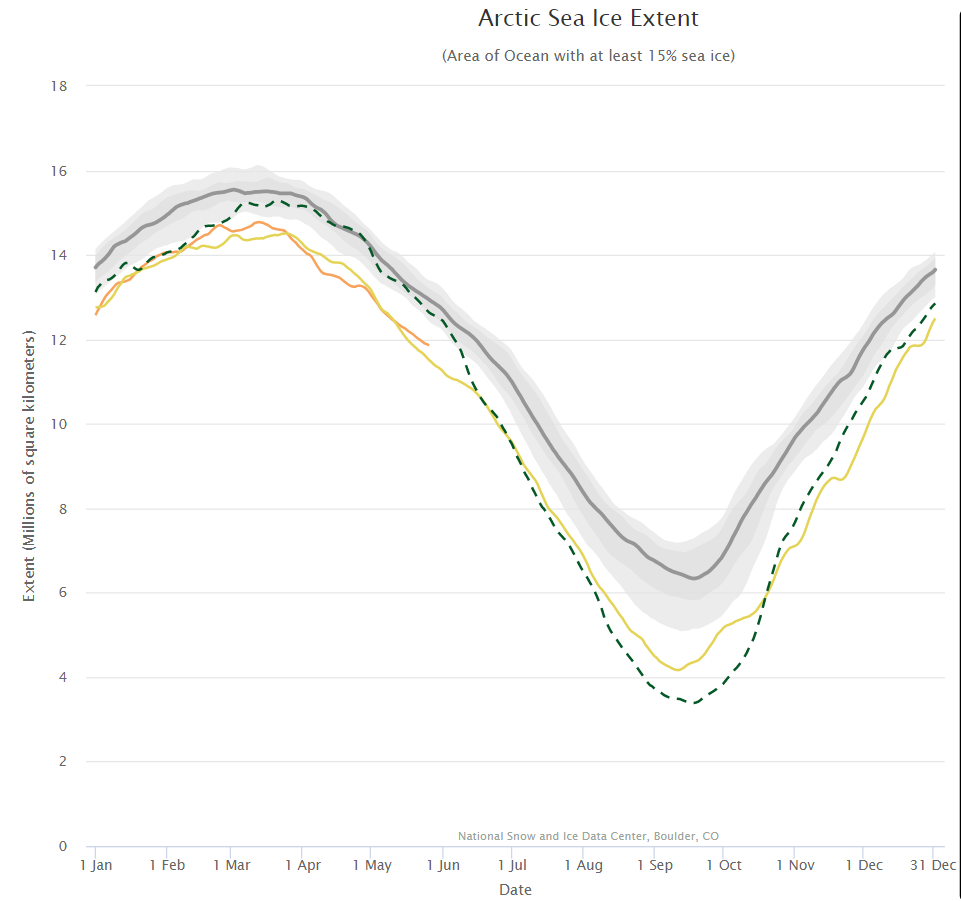
The next obvious comparison to make is with the (in)famous year of 2012, which resulted in the lowest ever minimum extent in the satellite record. Firstly let’s look at the National Snow and Ice Data Center’s graph of Arctic sea ice extent:
Currently extent is significantly below 2012, albeit somewhat above 2016 at the same time of year. And what of melt ponds? In 2012 there was evidence of less snow cover over land and more surface water on the ice on the Siberian side of the Arctic:
NASA Worldview “false-color” image of the Eastern Arctic on May 25th 2012, derived from the MODIS sensor on the Terra satellite
Other than that Arctic sea ice in 2019 looks to be in worse shape than in 2012.
[Edit – May 27th]
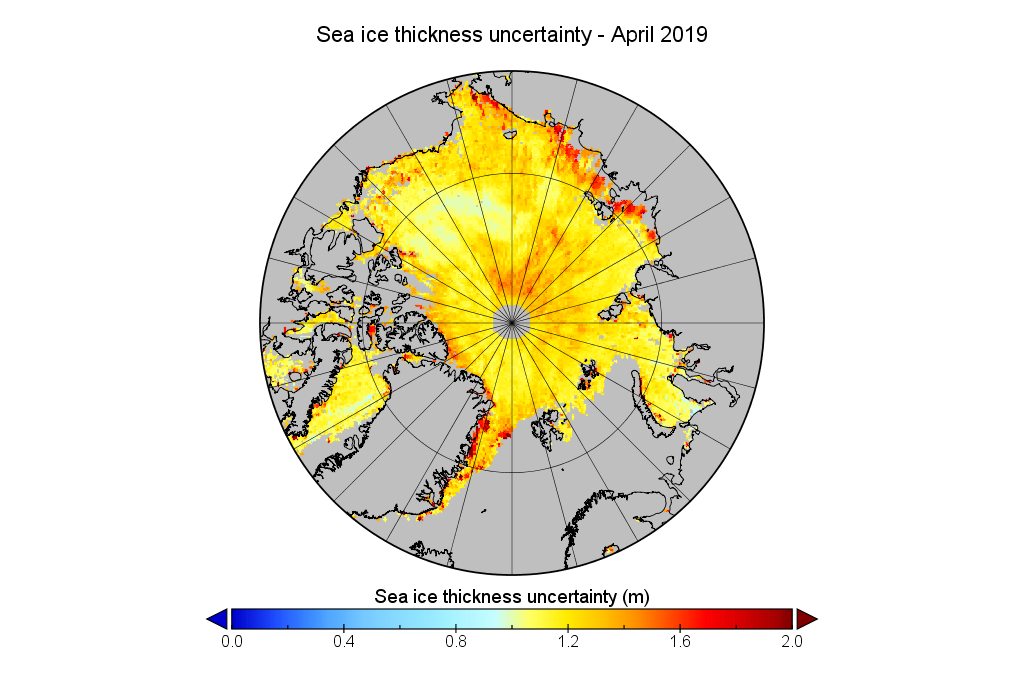
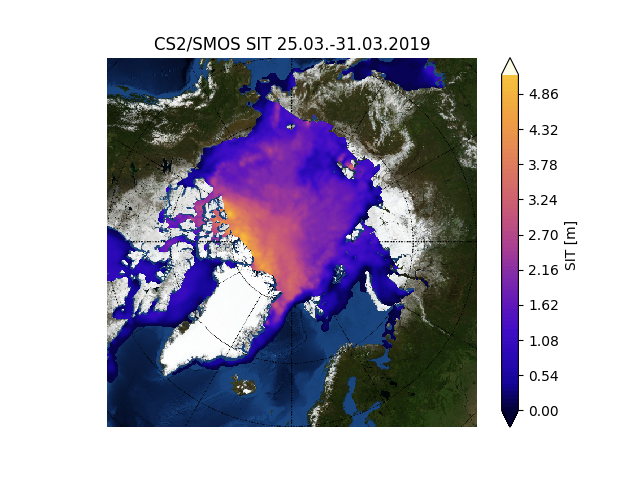
We’ve established that the extent of Arctic sea ice at the end of May 2019 is less than in 2012, but something else to consider is whether that ice is currently thicker than in 2012, or not. Satellites can have a reasonable stab at measuring the area of sea ice, but the third dimension is much trickier. The European Space Agency’s CryoSat-2 satellite has been attempting to measure sea ice thickness since 2010, so let’s take at the conclusions it has reached:
Don’t forget to take a good long look at the associated uncertainties too:
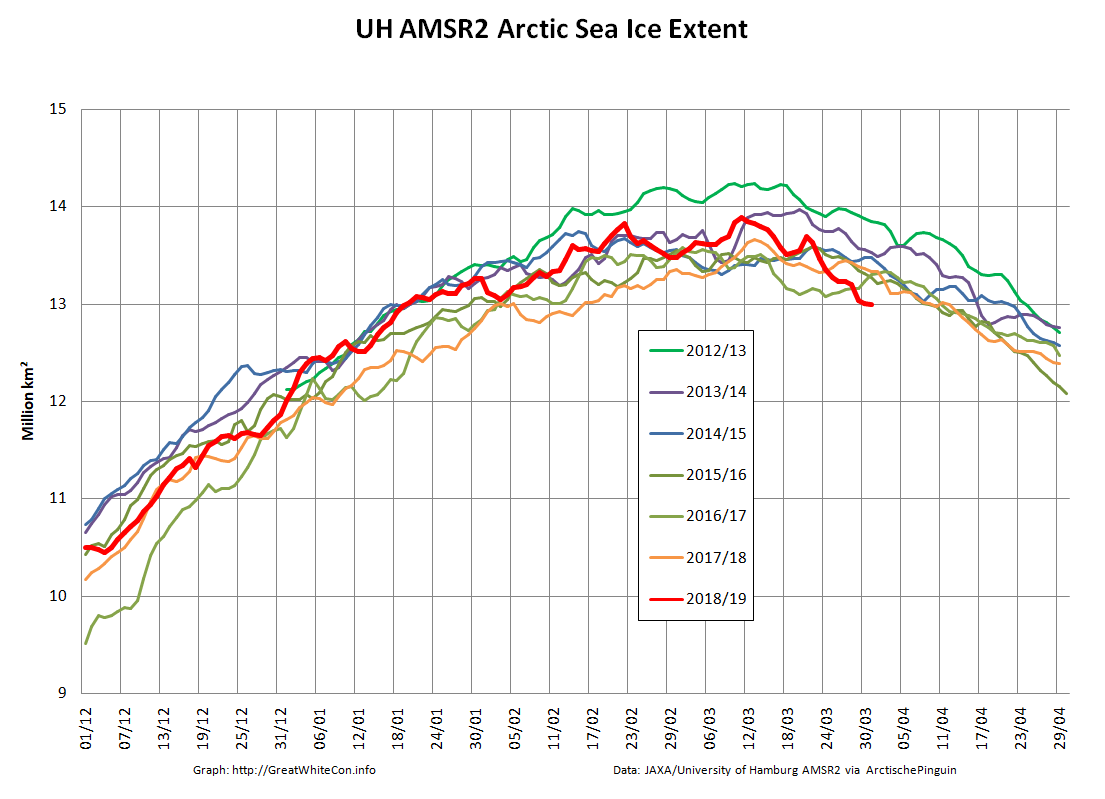
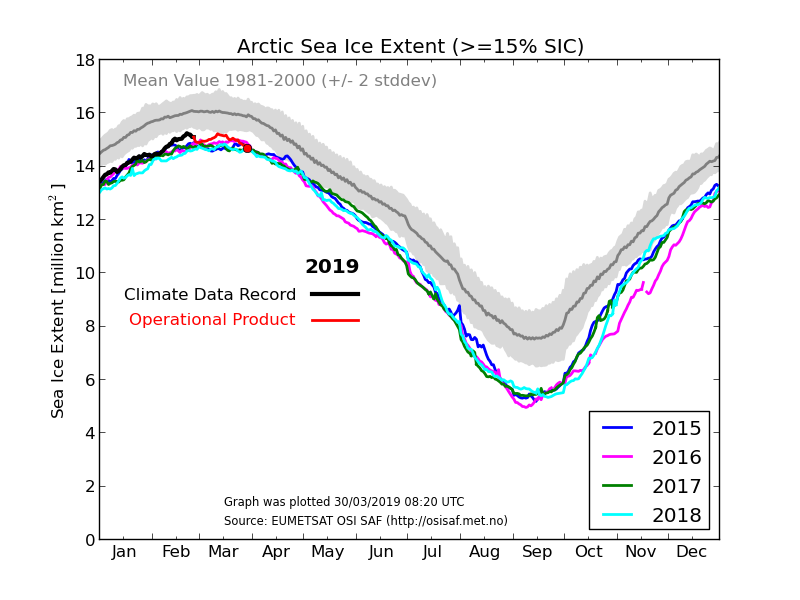
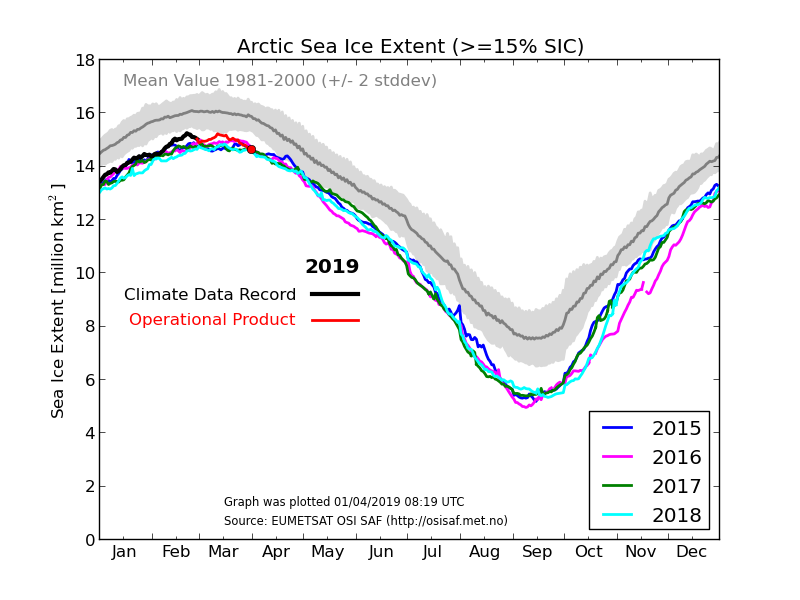
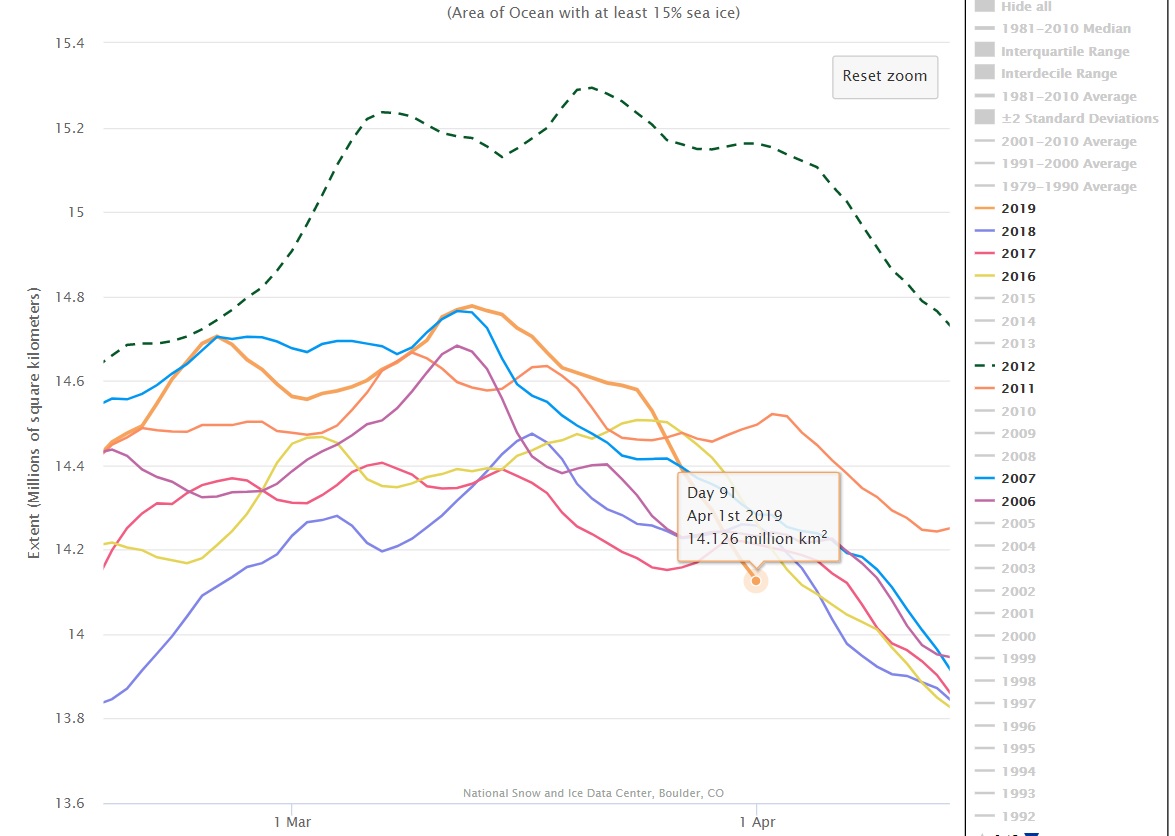
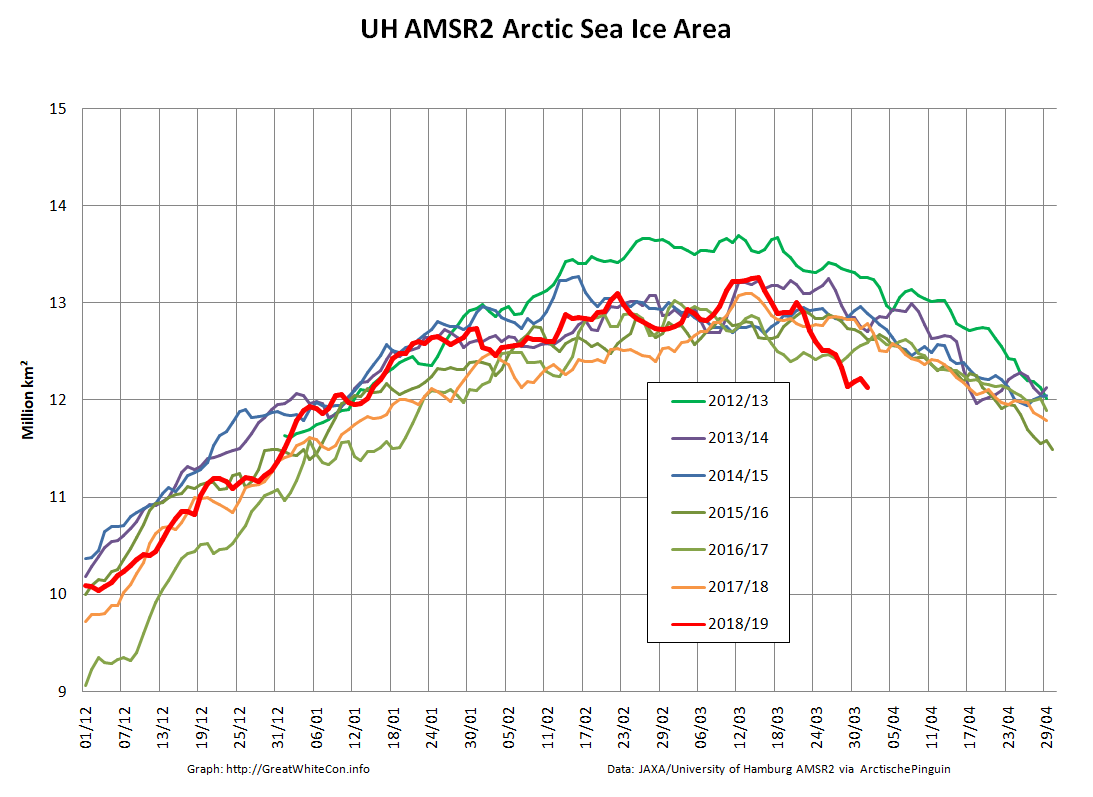
At the beginning of April 2019 all the assorted Arctic sea ice extent metrics are at their respective lowest levels for the date in the satellite record. Just for a change let’s start with the JAXA/ViSHOP graph for April 1st, based on AMSR2 data:
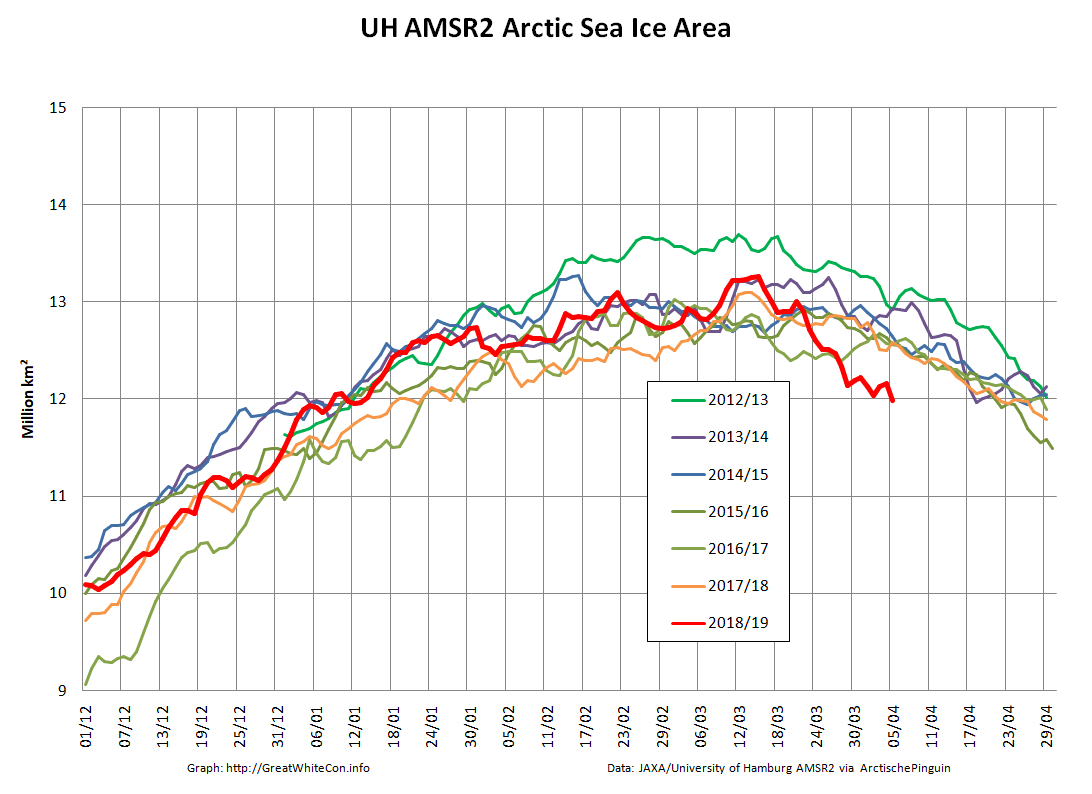
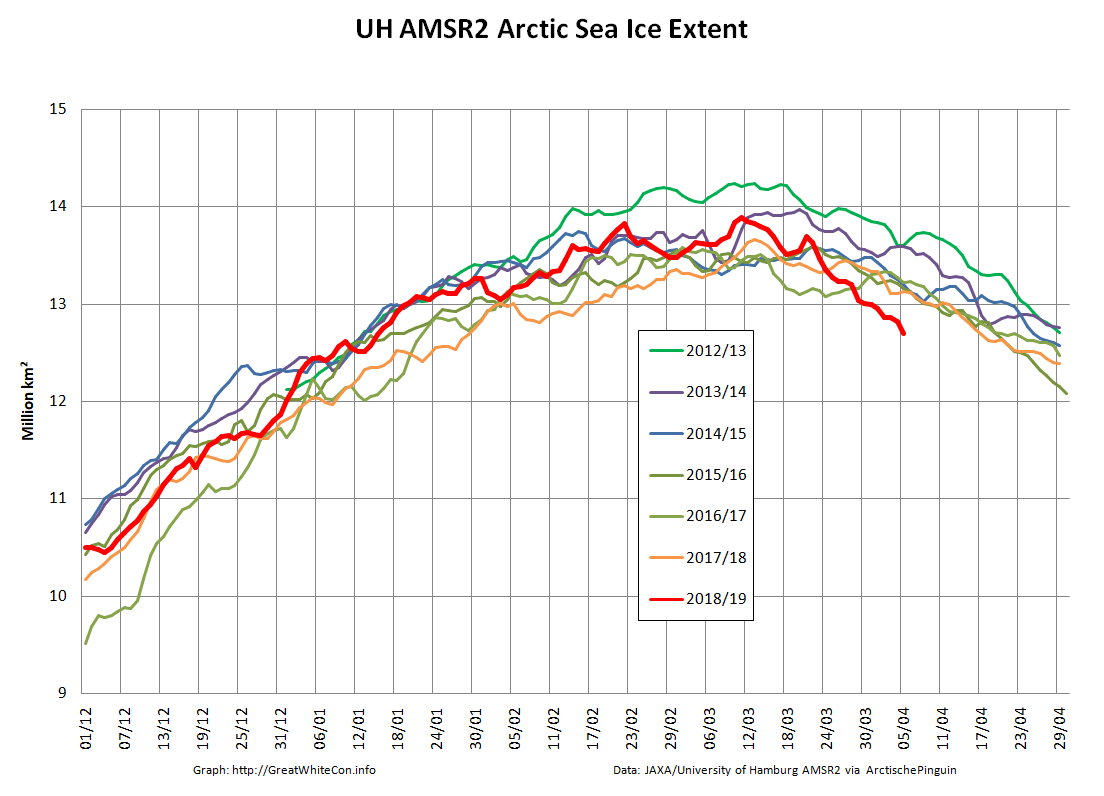
That shows extent apparently on an inexorable decline. However the higher resolution graphs derived by Wipneus from University of Hamburg AMSR2 concentration data reveal that Arctic sea ice extent has changed little over the last couple of days, and area has even increased somewhat:
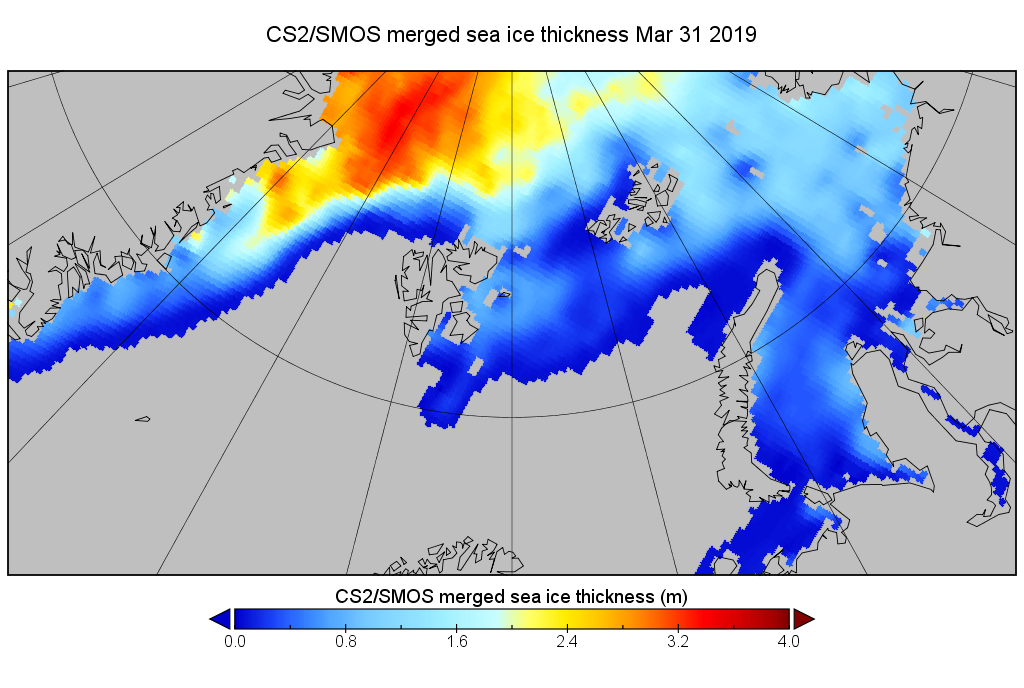
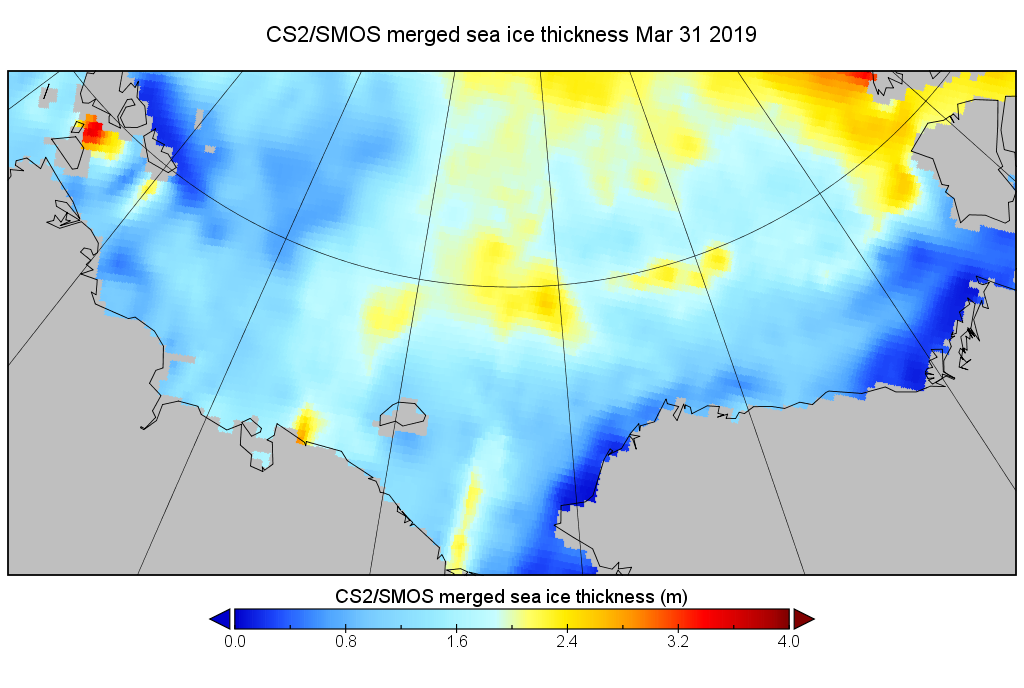
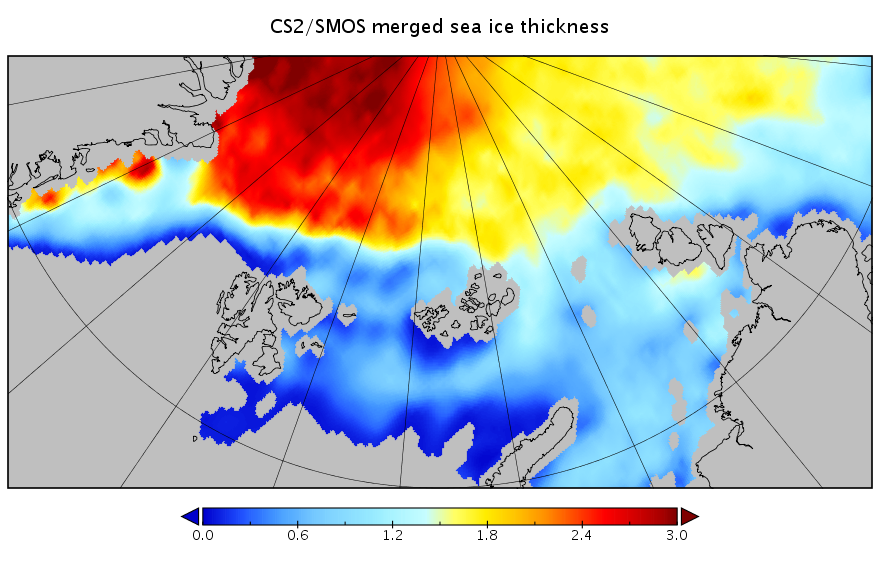
Whilst we wait for Wipneus’ latest PIOMAS thickness and volume update, here’s the gridded merged CryoSat-2/SMOS thickness data from the Finnish Meteorological Institute:
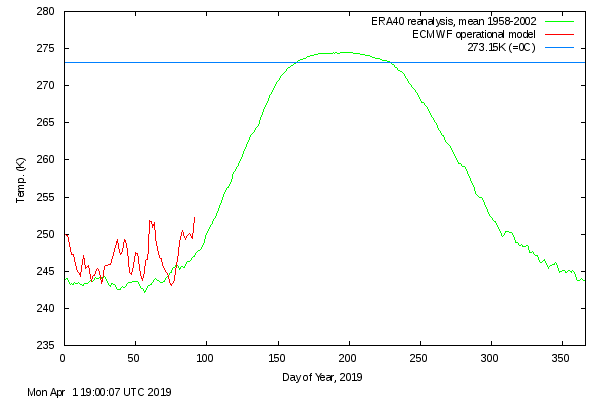
Watch this space for some other extent graphs once they’ve updated to April 1st. In particular the DMI’s version of events will be of great interest, since by way of a little All Fools Day fun I passed on the latest Arctic sea ice news to Tony Heller and the denizens of his “Deplorable Climate Science Blog” yesterday. They were not amused! By way of example, Rah solemnly informed me that:
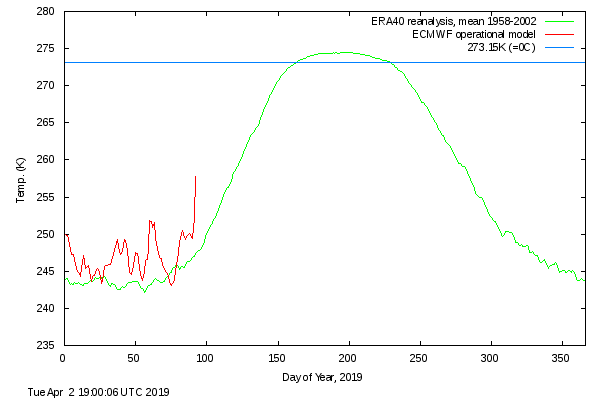
Tony consistently has used the DMI data as his primary source on the conditions in the Arctic, while you jump to whatever source you think justifies your bias. Get a life. Arctic air temps this year so far have been running below what they were at this time last year.
This is the graph that Steve/Tony used in an attempt to make his point:
Plus the April 2nd DMI “Arctic temperature” graph:
[Edit – April 3rd]
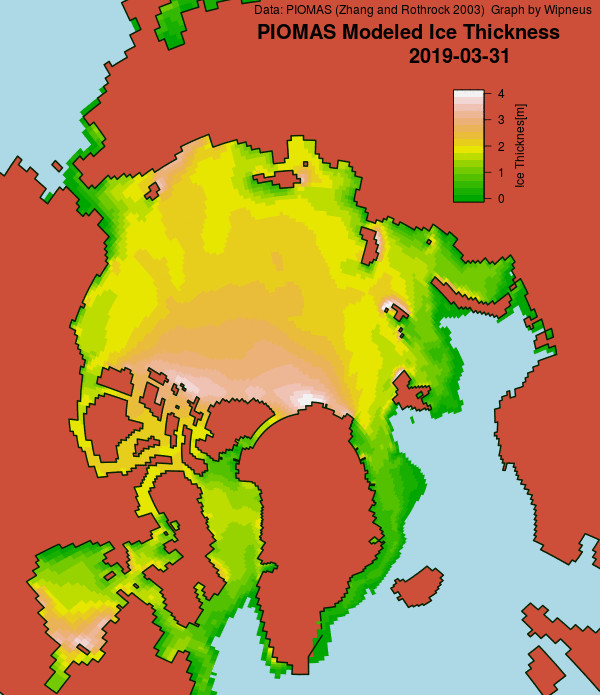
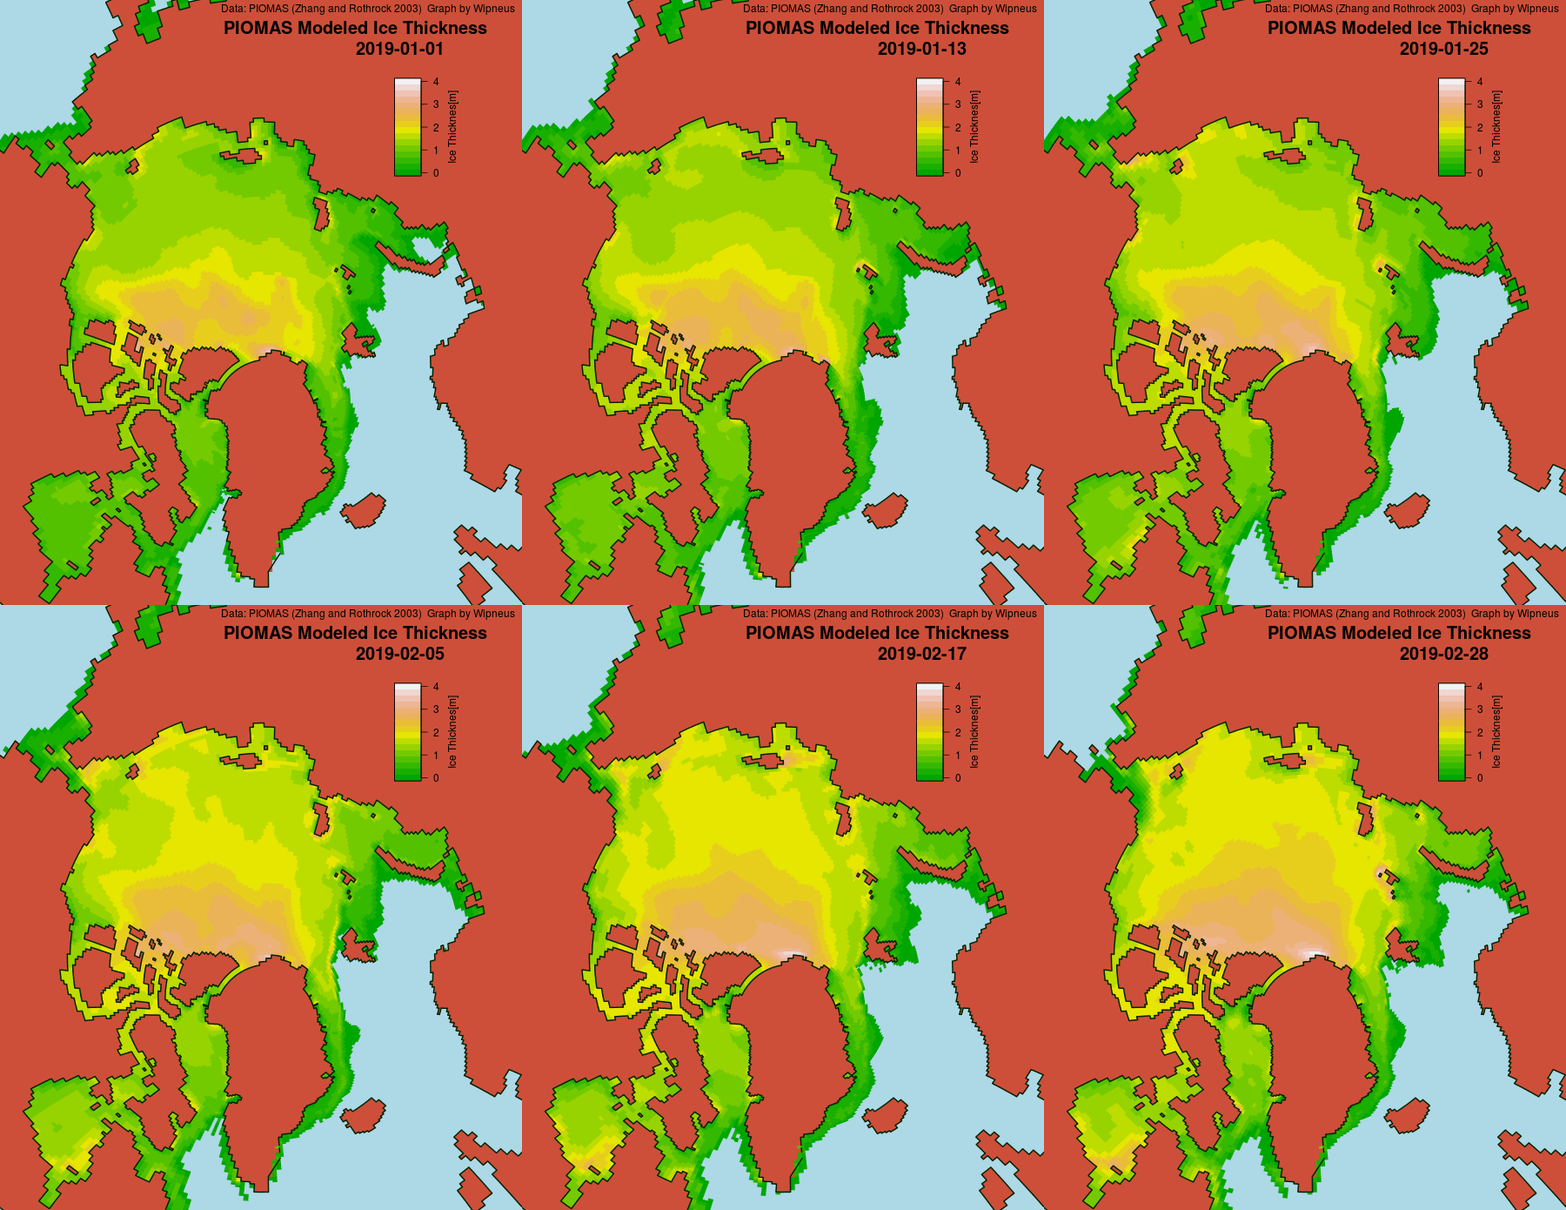
Snow White asked Axel Schweiger nicely on Twitter, and as if by magic the PIOMAS numbers for March have been released, including gridded thickness. Wipneus has crunched them to reveal the following end of March sea ice thickness map:
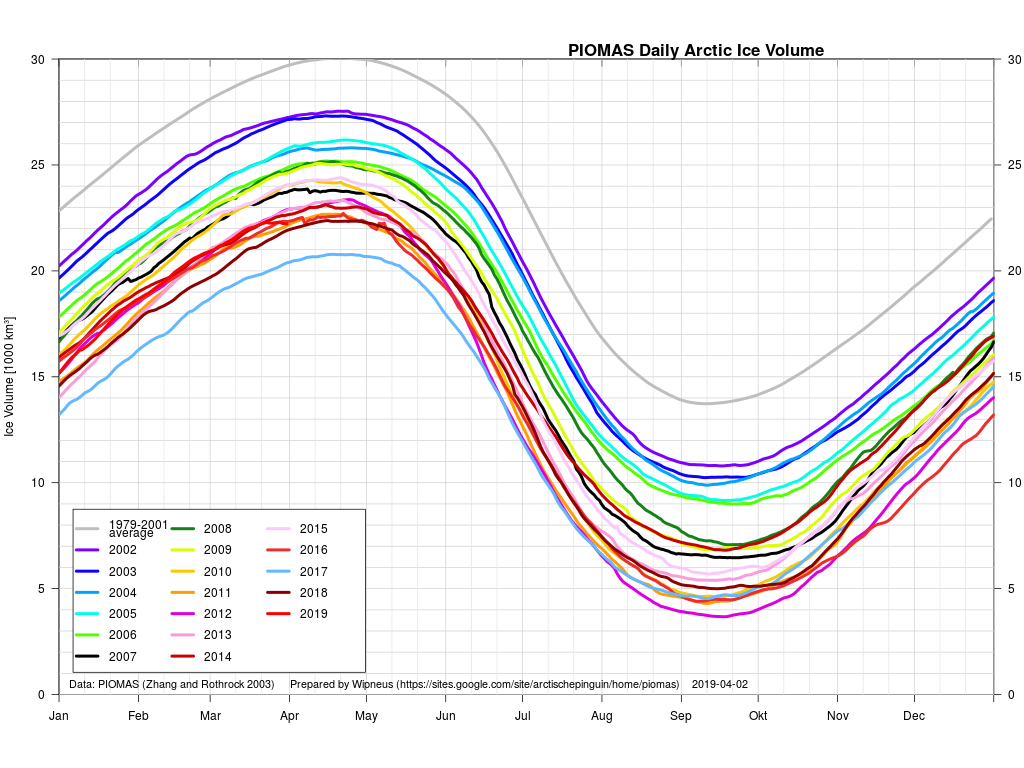
plus a rather unusual volume graph:
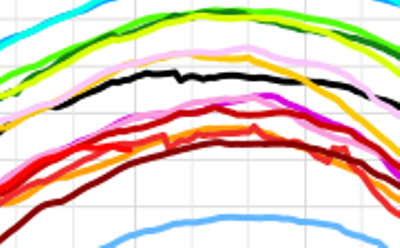
Here’s a closeup view:
According to the PIOMAS model Arctic sea ice volume has been flatlining for the last couple of weeks, and may even have peaked already!
Meanwhile returning to 2 dimensions the decline in area has resumed:
[Edit – April 7th]
Wipneus’ UH high resolution extent fell another 129k yesterday:
Plus a close up look at the FMI merged Cryosat-2/SMOS thickness for both the Atlantic and Pacific sides of the Arctic:
Apart from the usual thick ice queueing for the Fram Strait exit there’s not a lot to prevent the comparatively swift early melt from continuing apace.
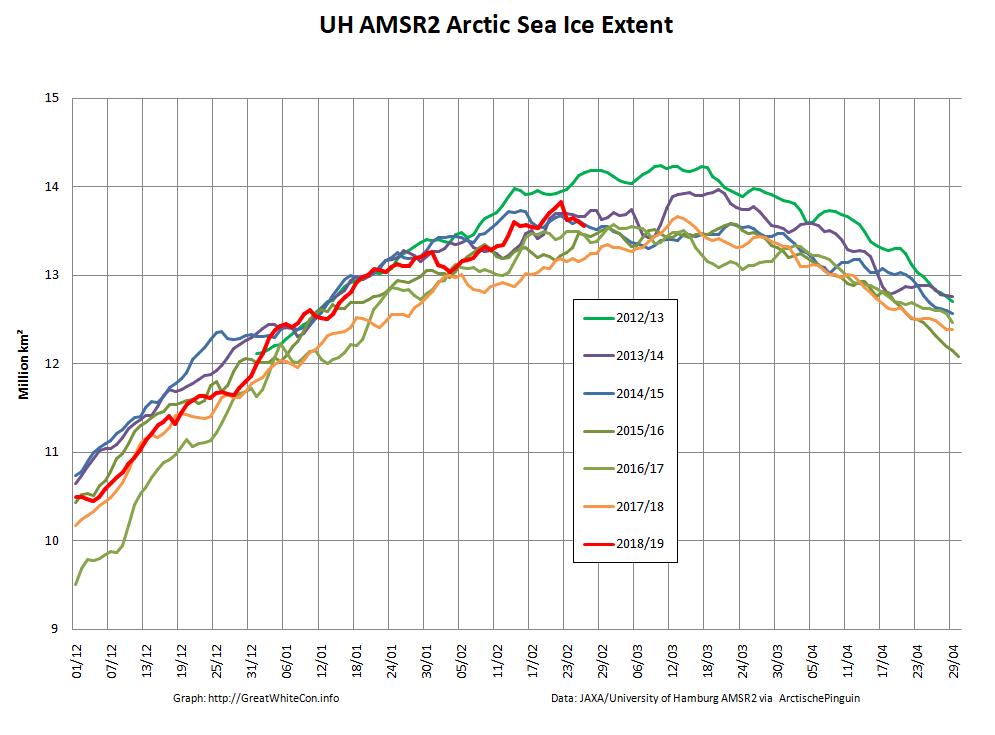
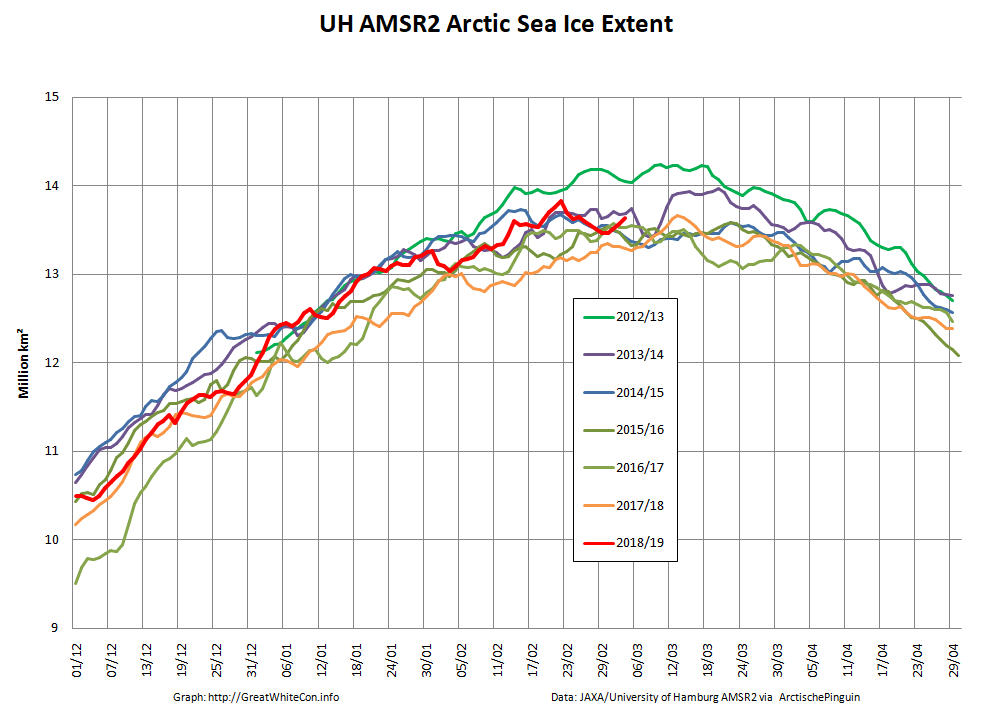
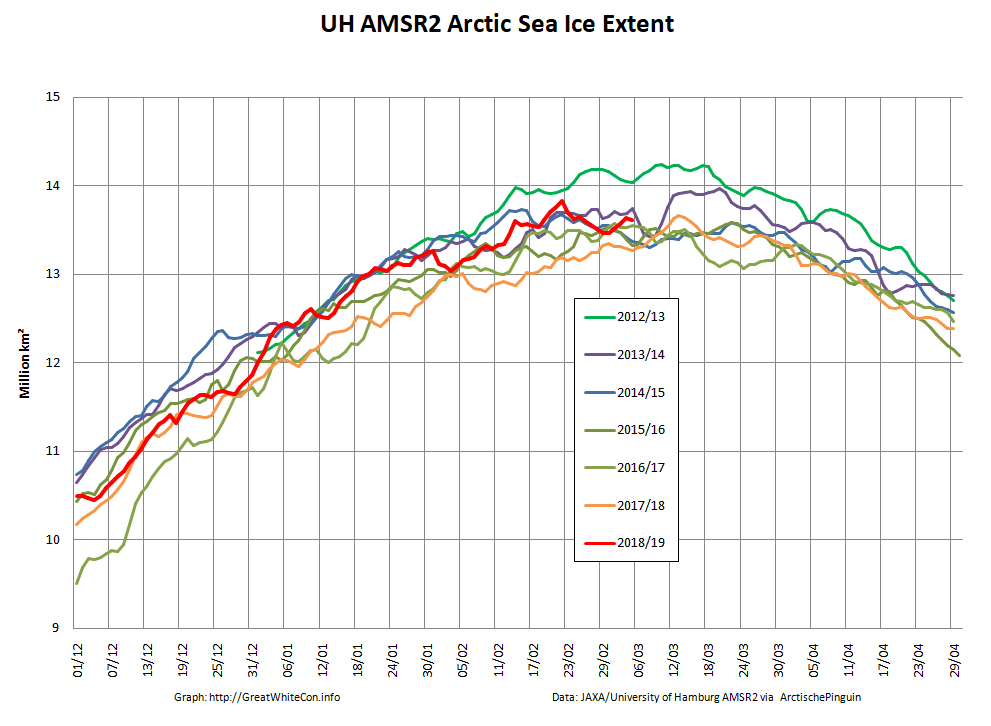
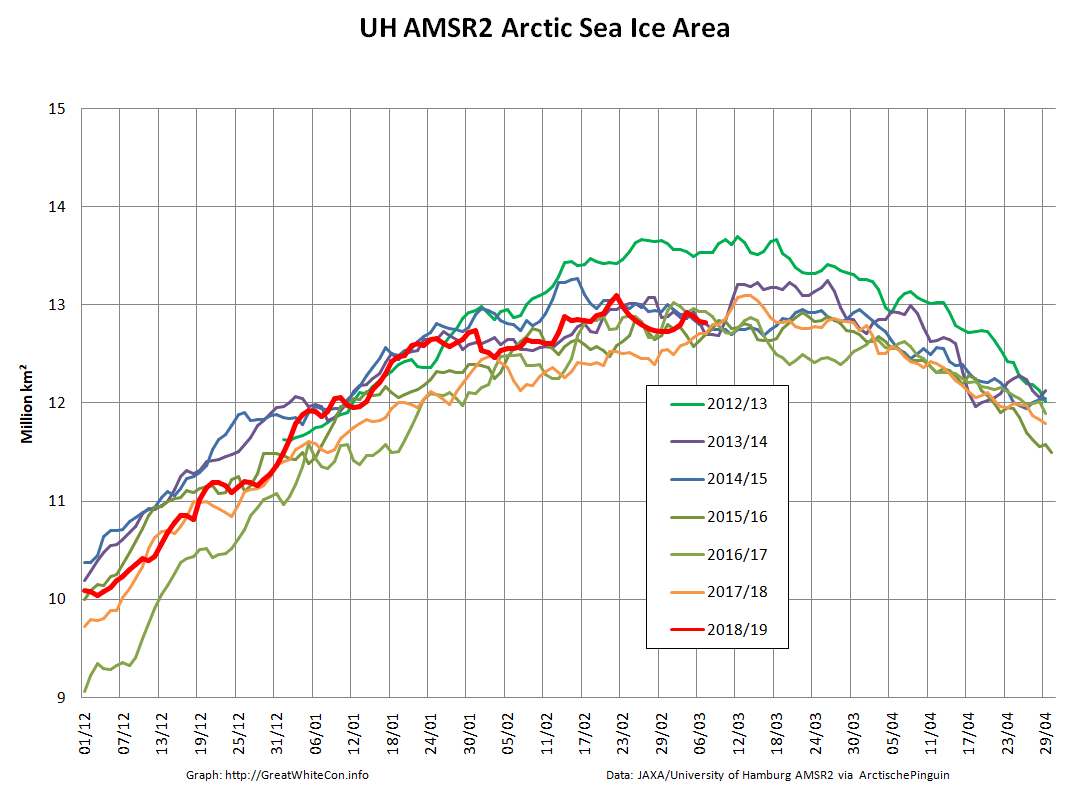
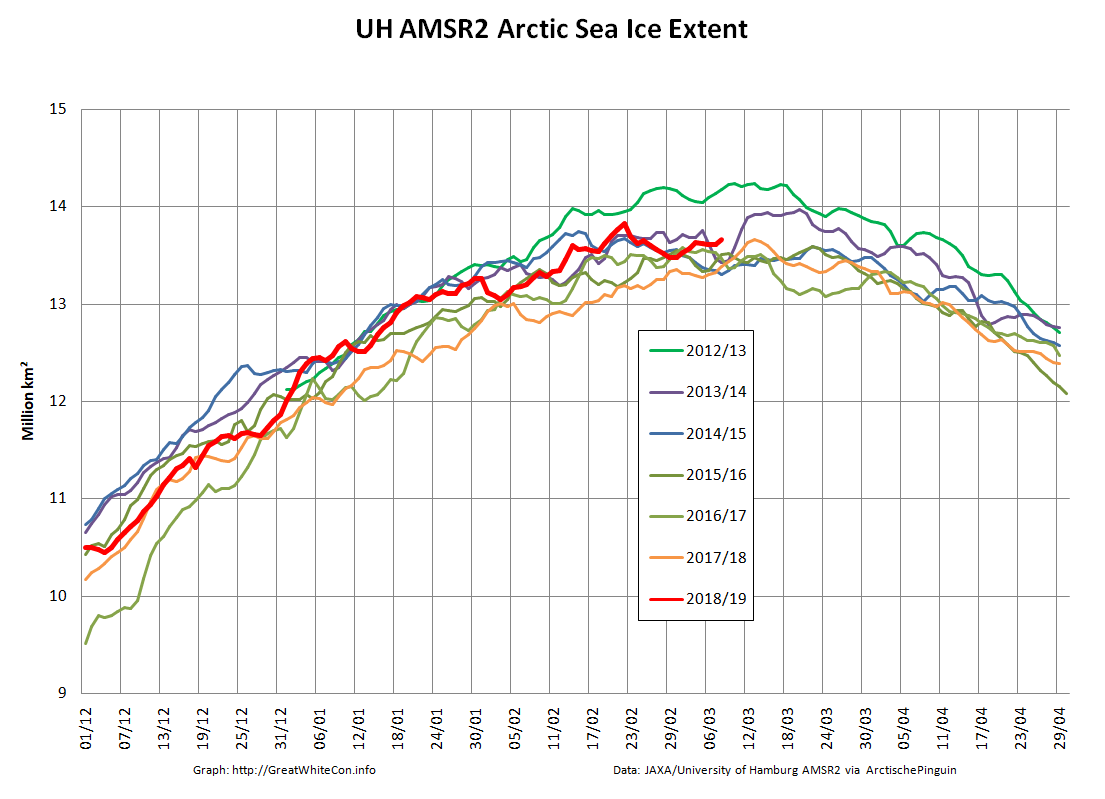
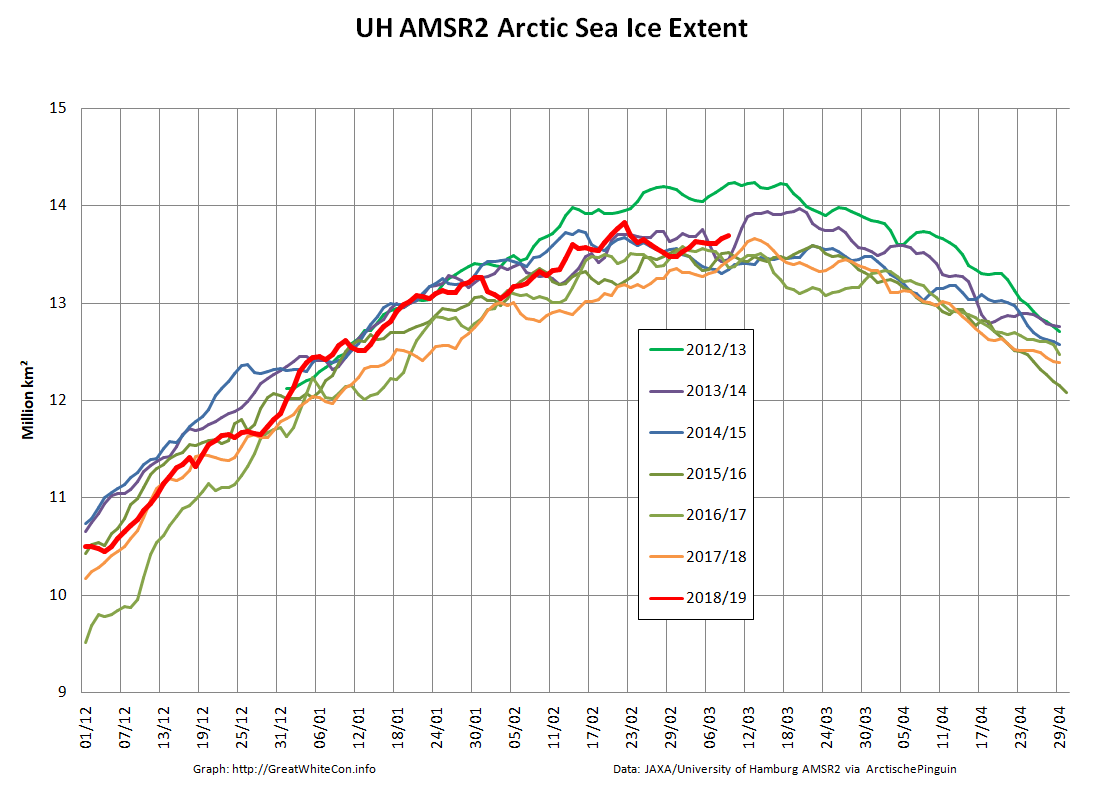
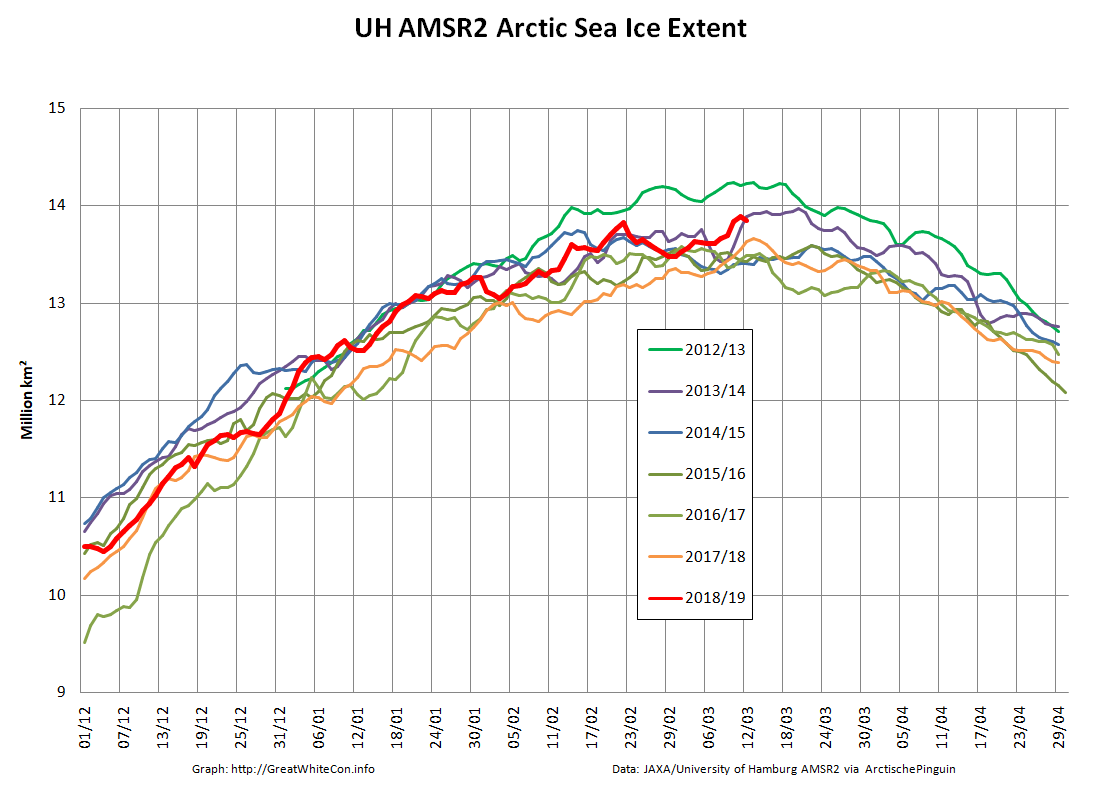
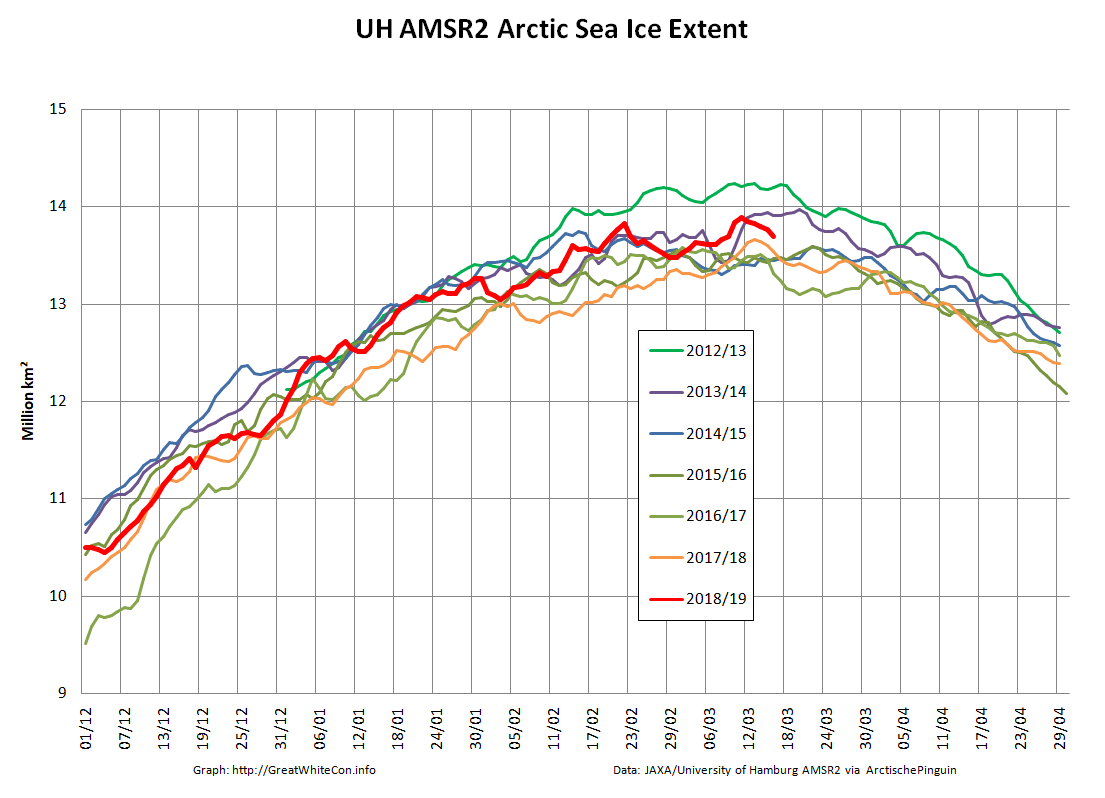
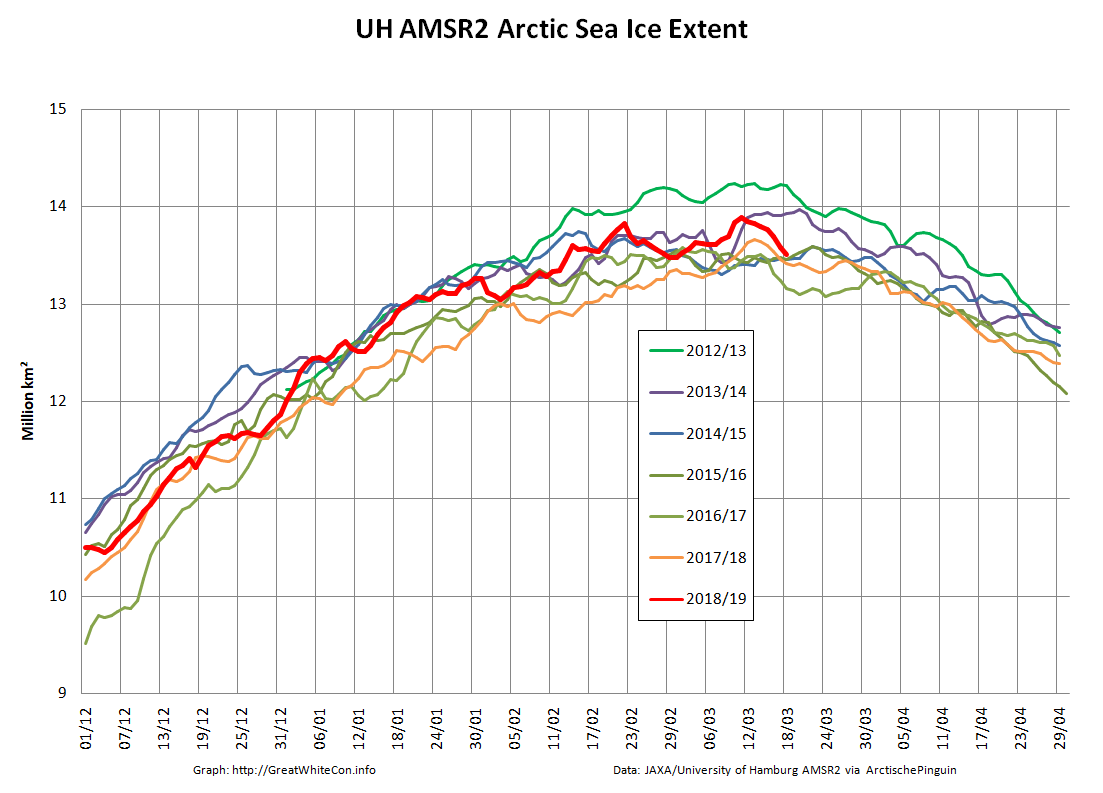
March 2019 has arrived, which in recent years has proved to be by far the likeliest month to contain the maximum extent of Arctic sea ice for the year. To begin with, here’s our favourite high resolution extent graph calculated by “Wipneus” from University of Hamburg/JAXA AMSR2 data:
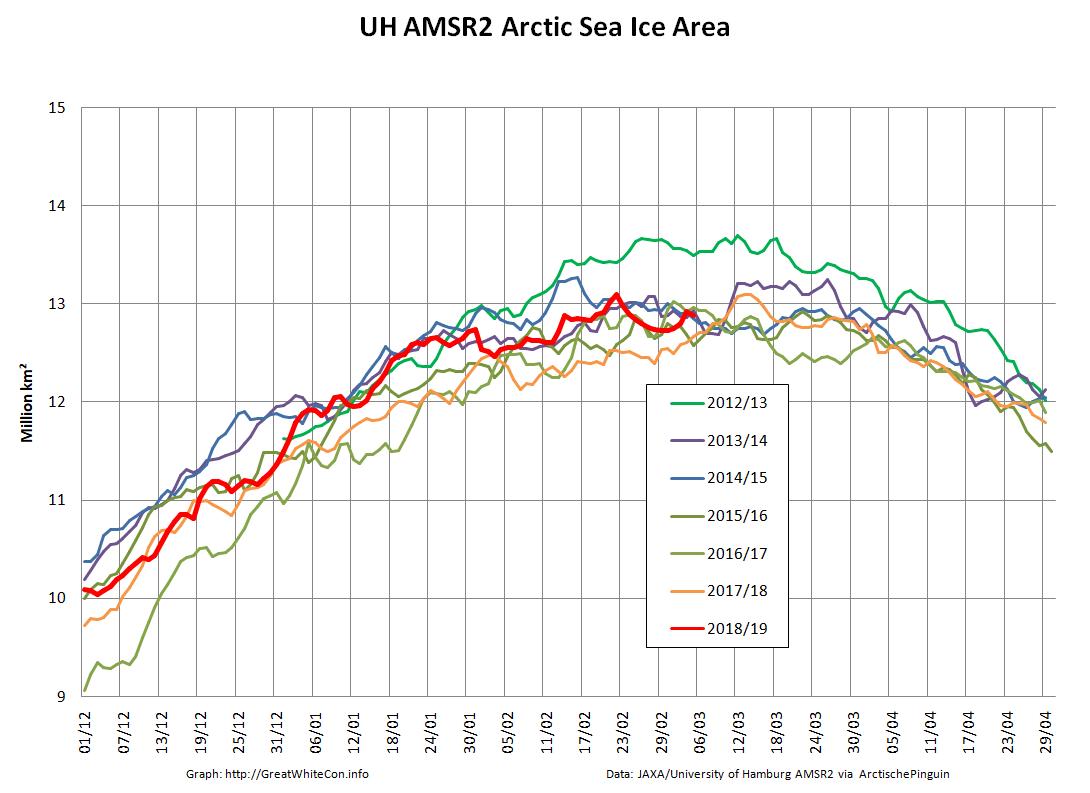
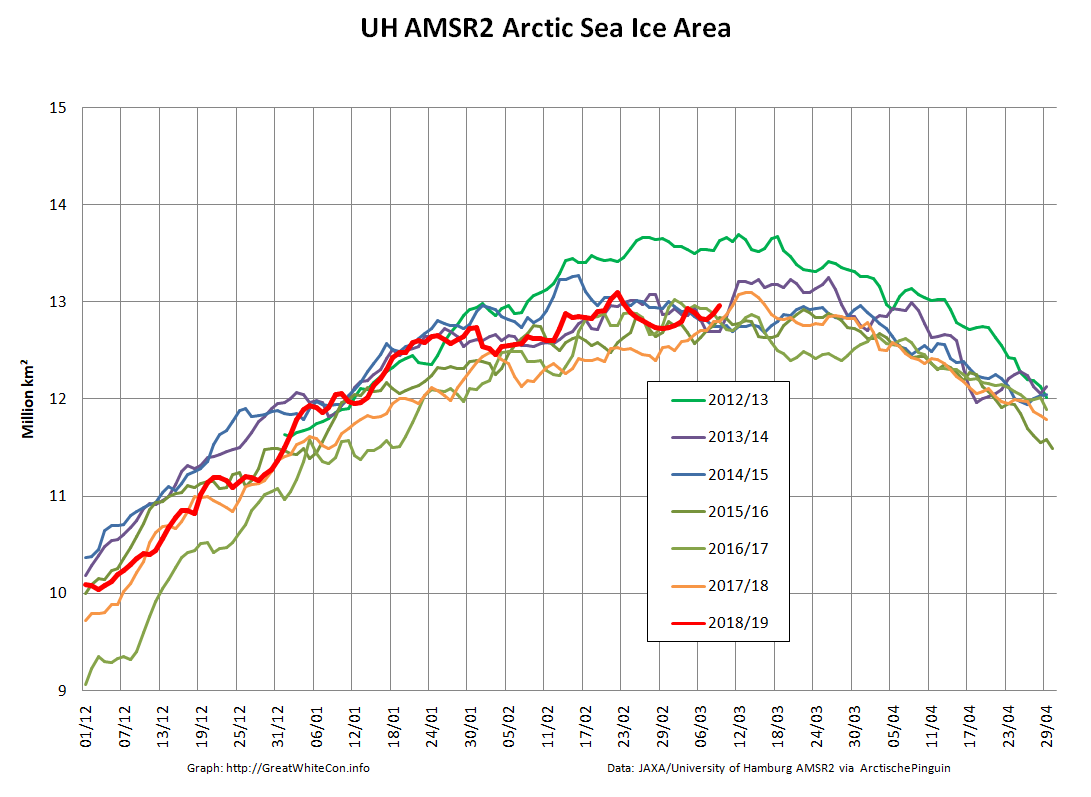
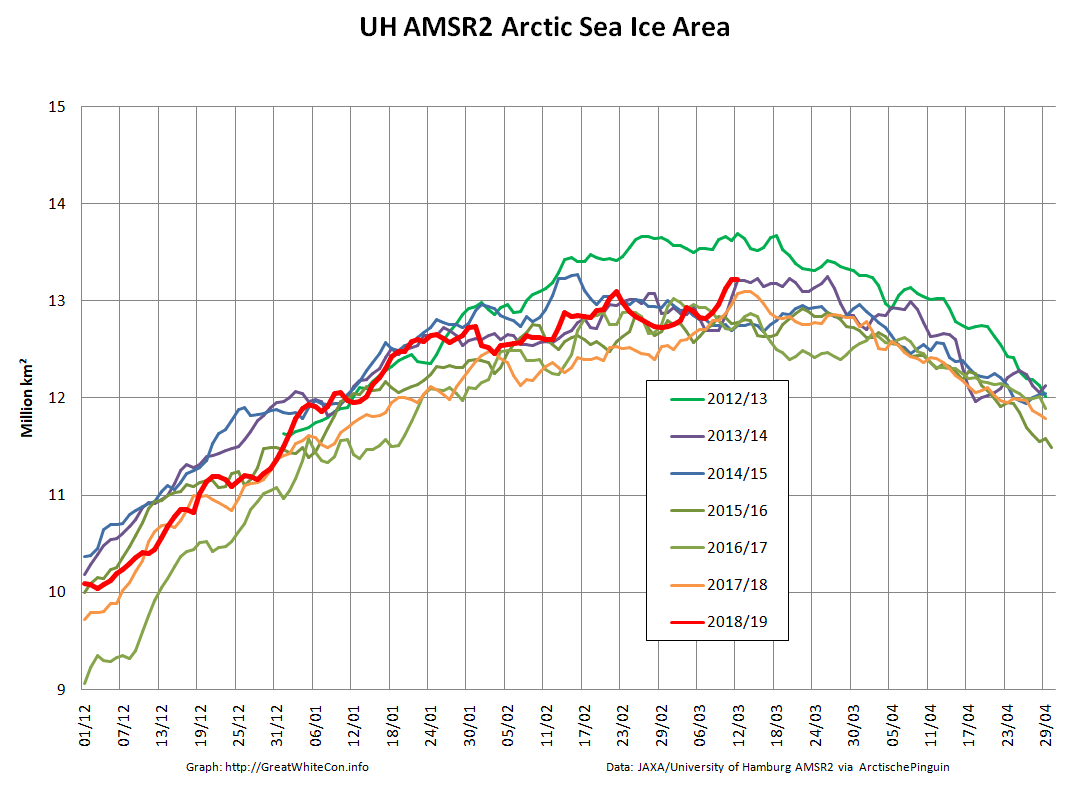
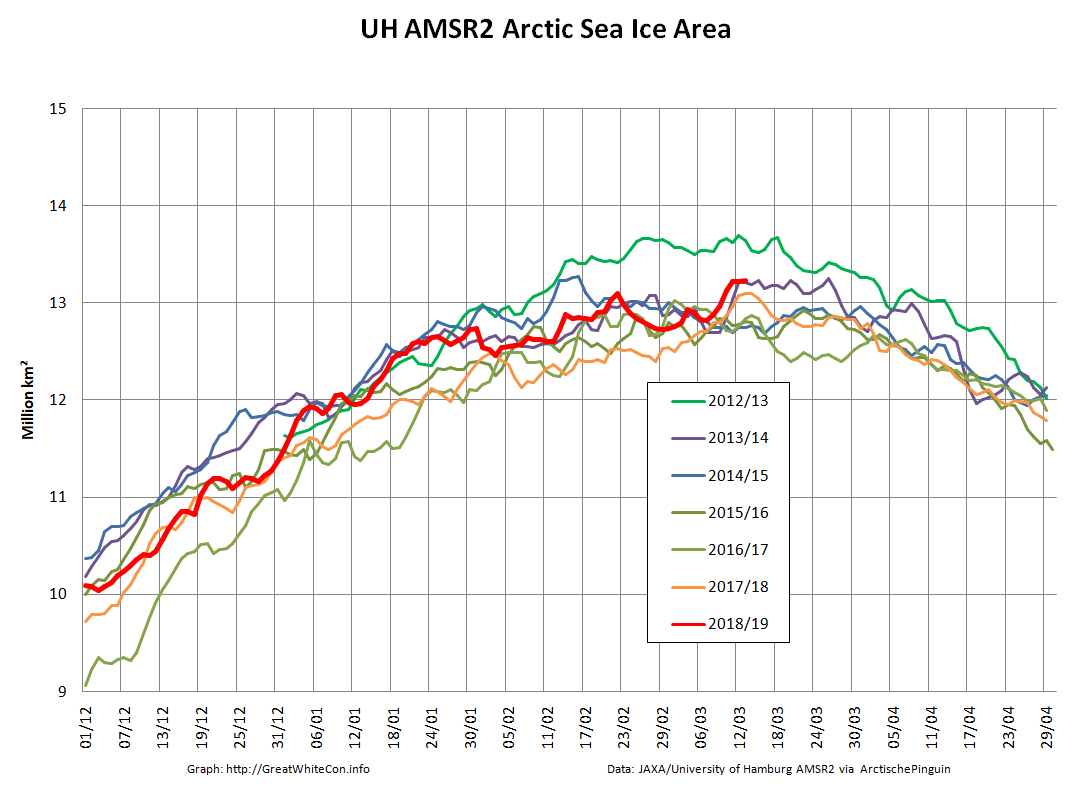
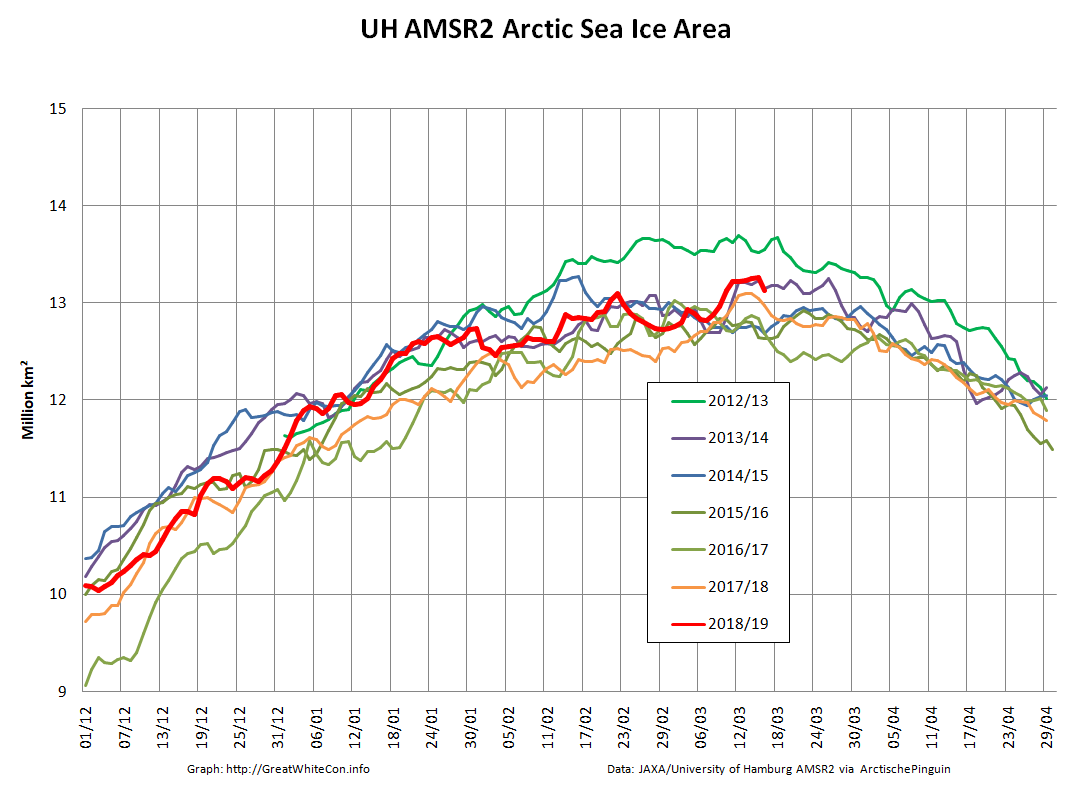
Hopefully you can plainly see the pronounced sharp peak towards the end of February 2019? The current maximum Arctic sea ice extent for 2019 is 13.83 million square kilometers on February 22nd. Here’s Arctic sea ice area for good measure:
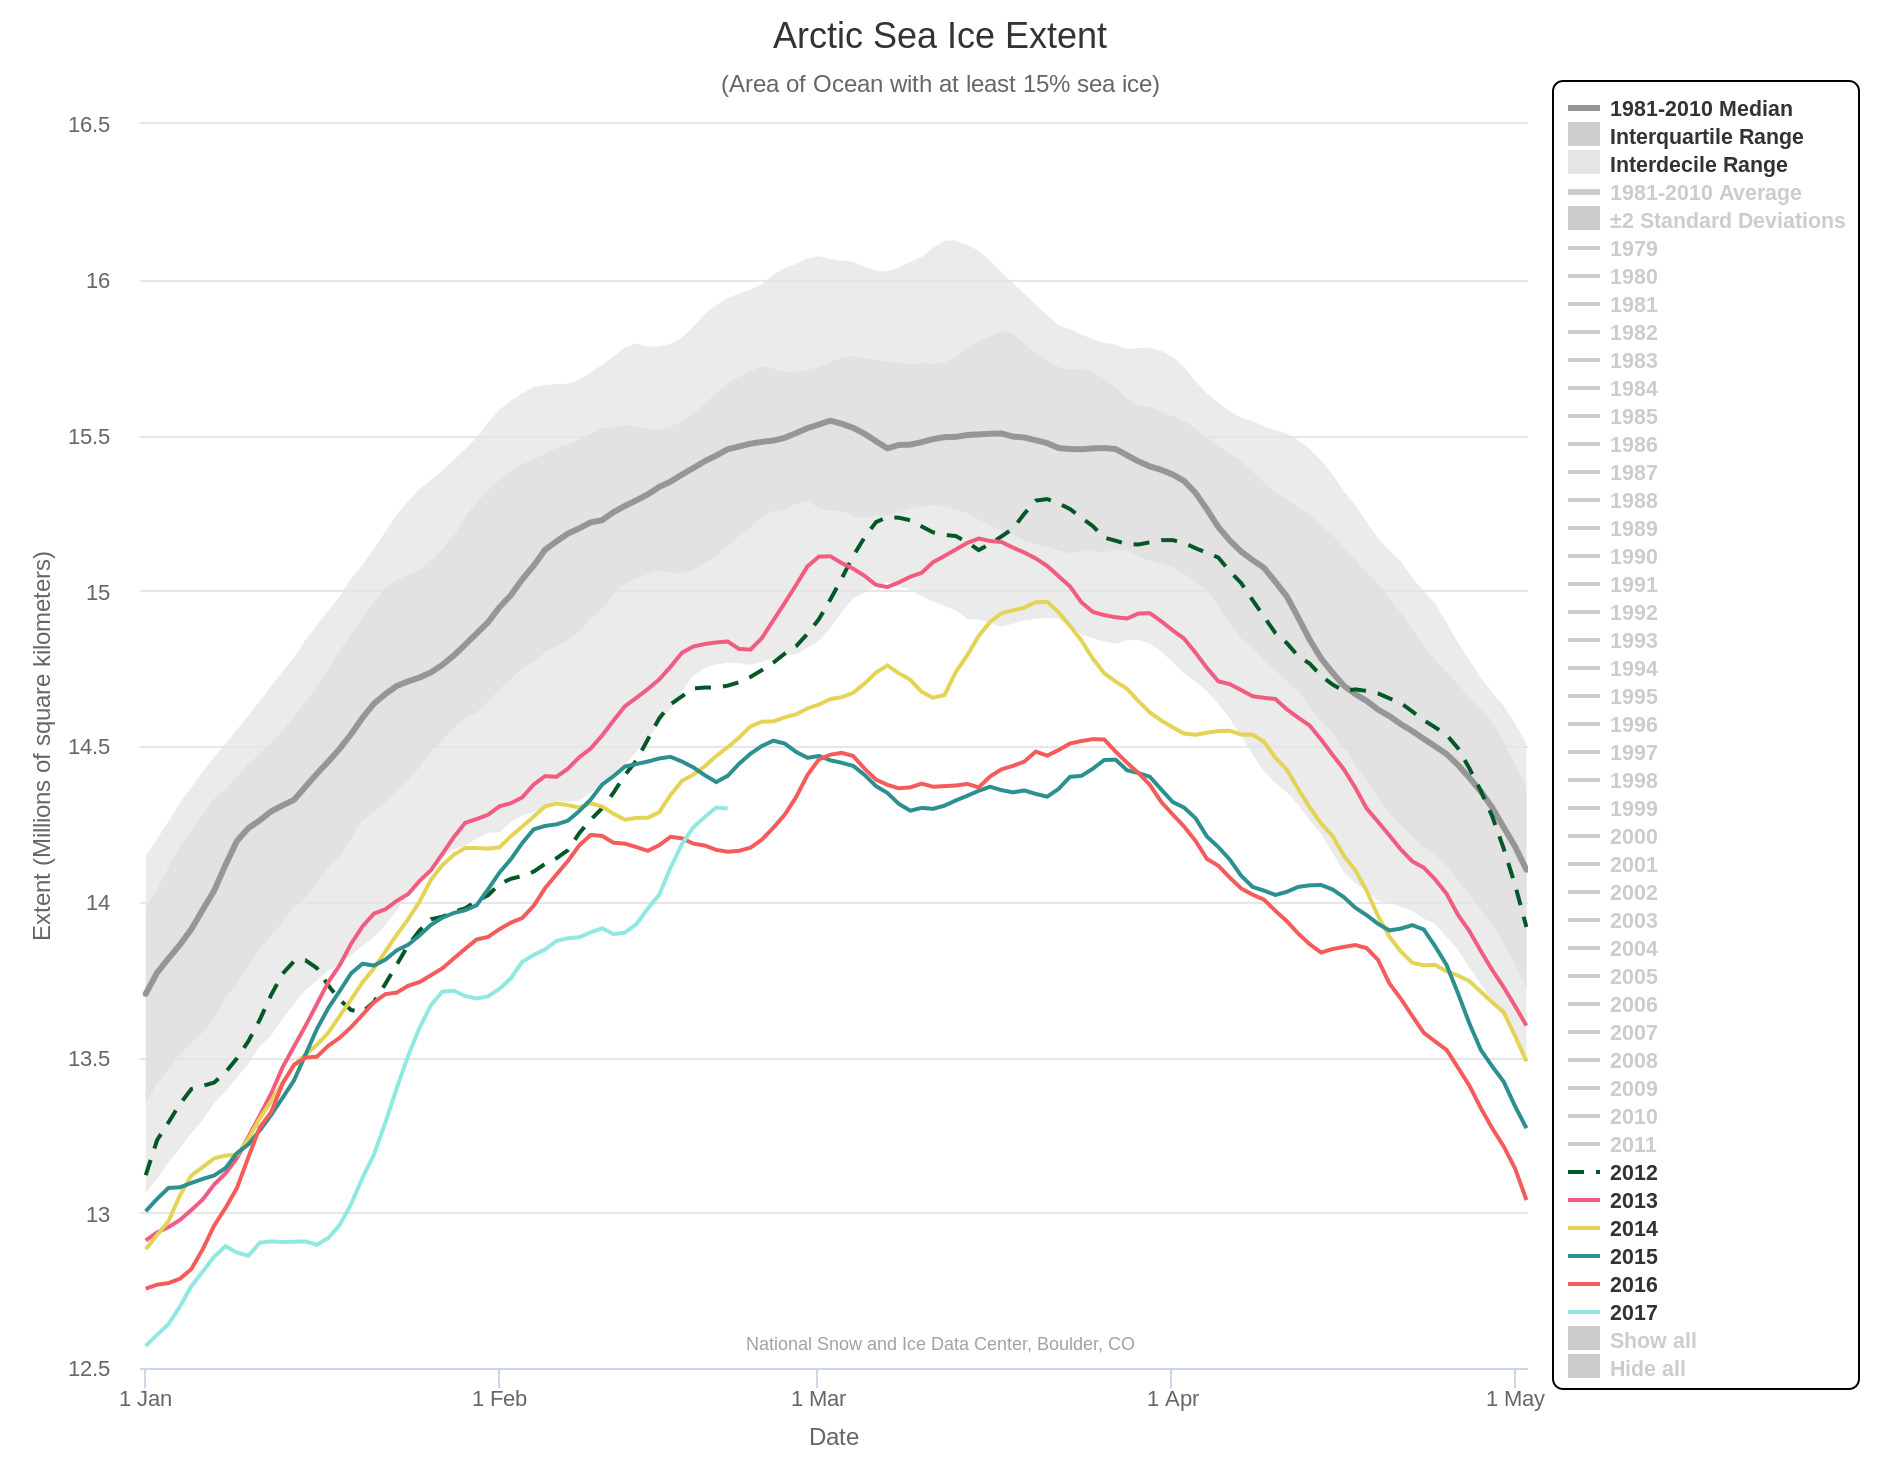
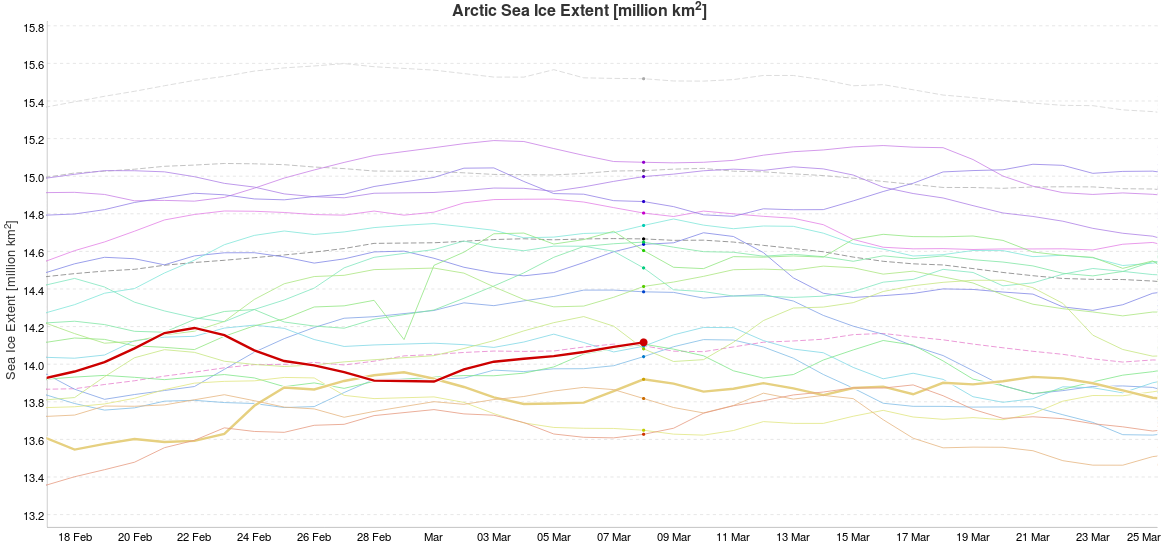
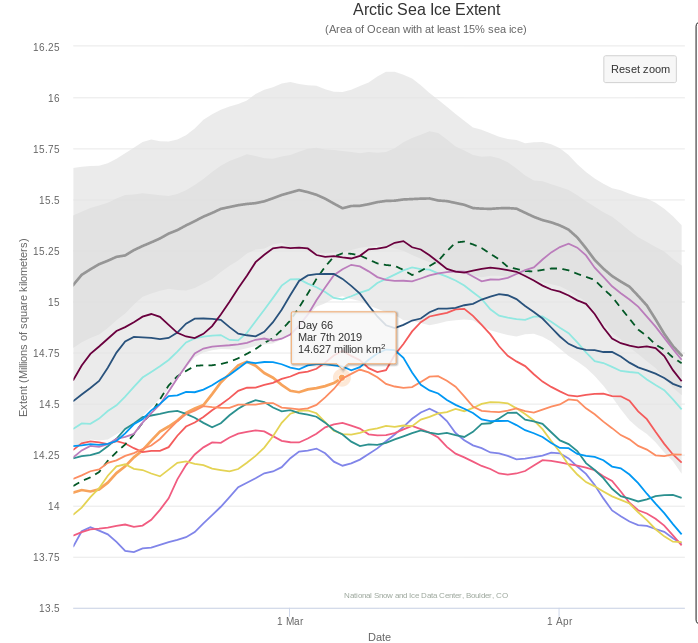
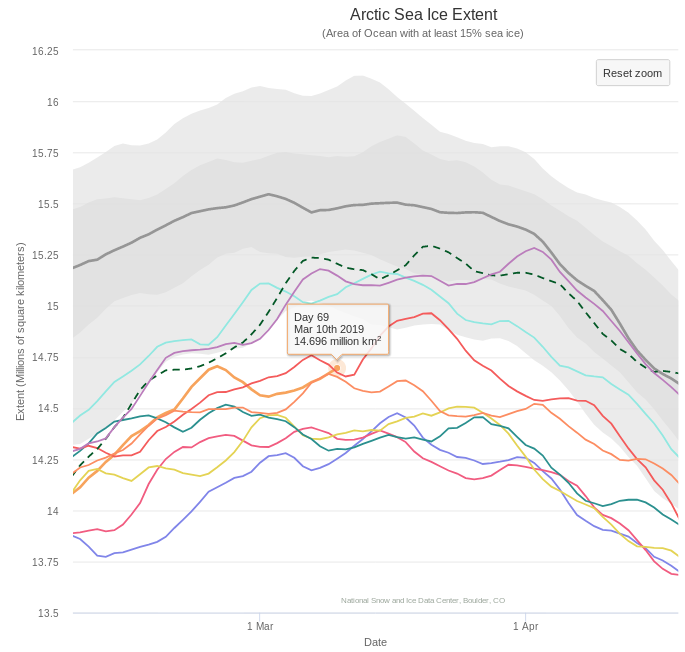
The current maximum area for 2019 is 13.10 million square kilometers, also on February 22nd. Here too is the NSIDC’s 5 day averaged extent:
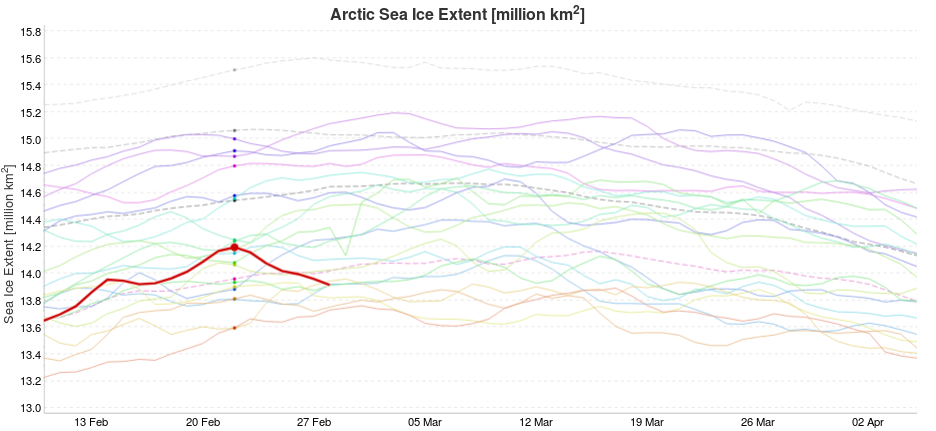
This reveals a current maximum extent for 2019 of 14.705 million square kilometers on February 24th.
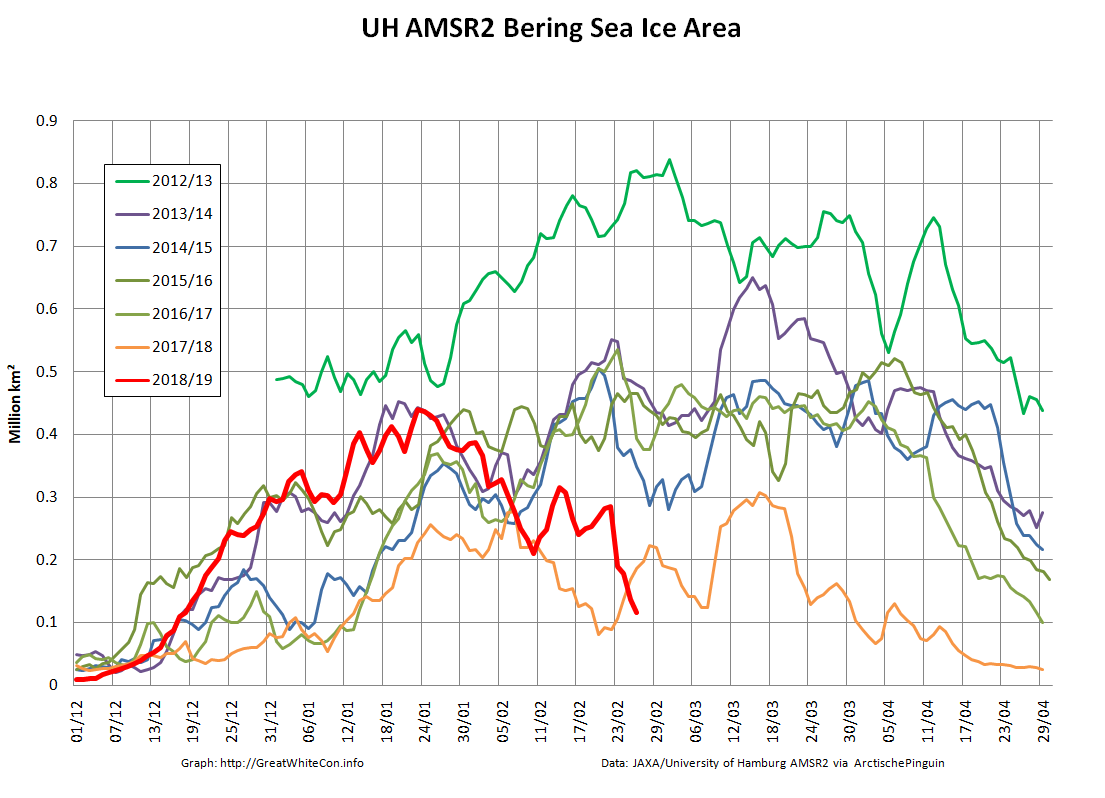
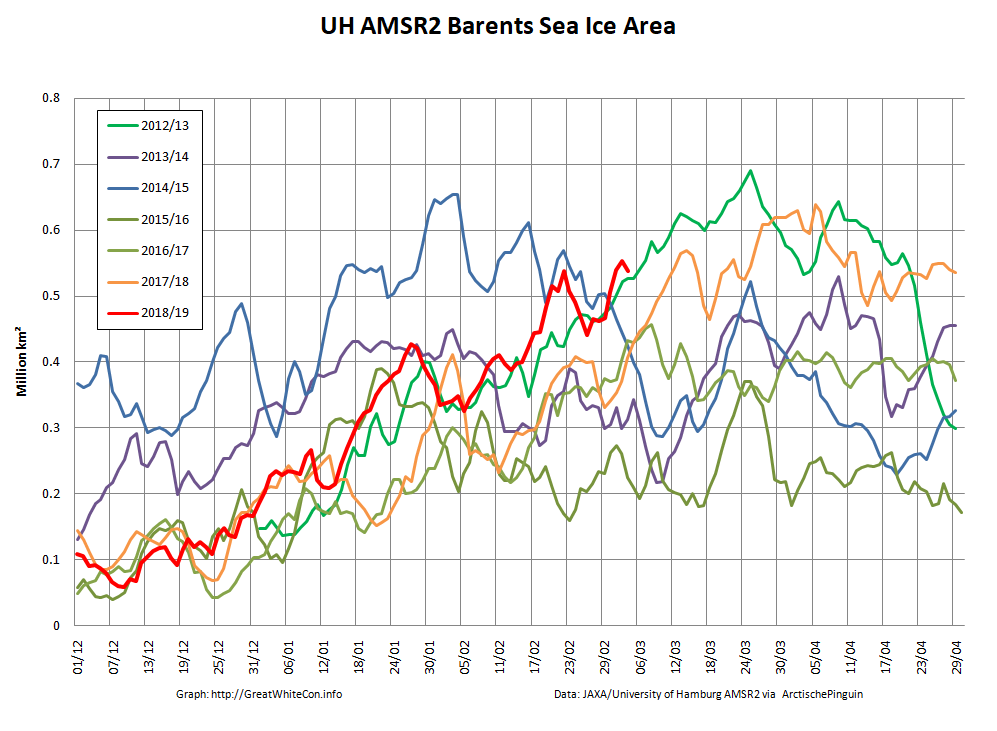
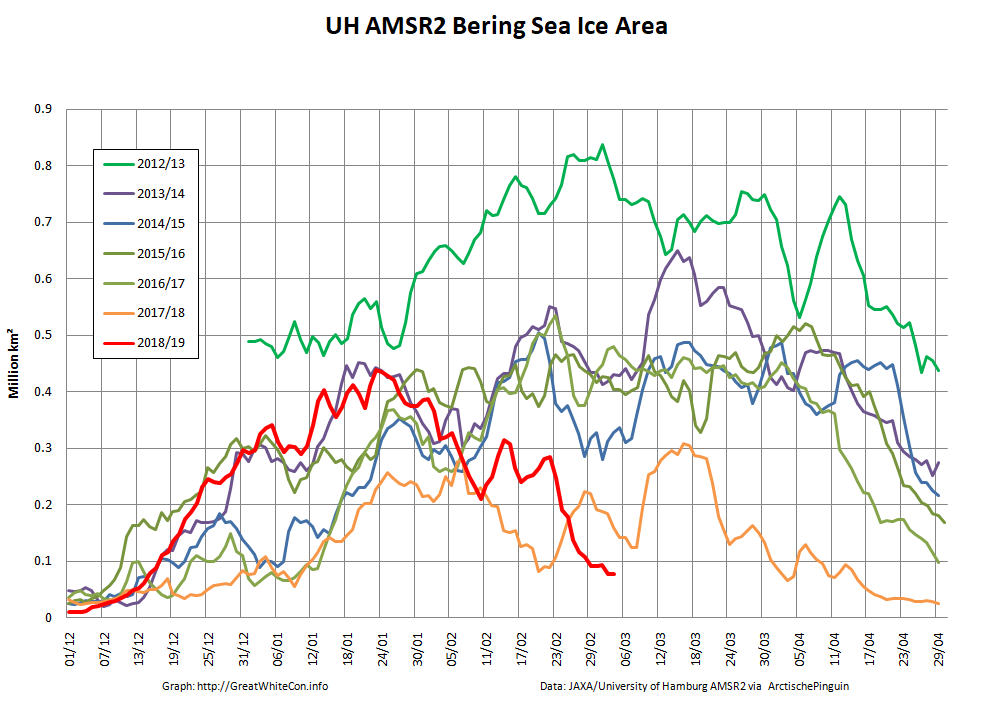
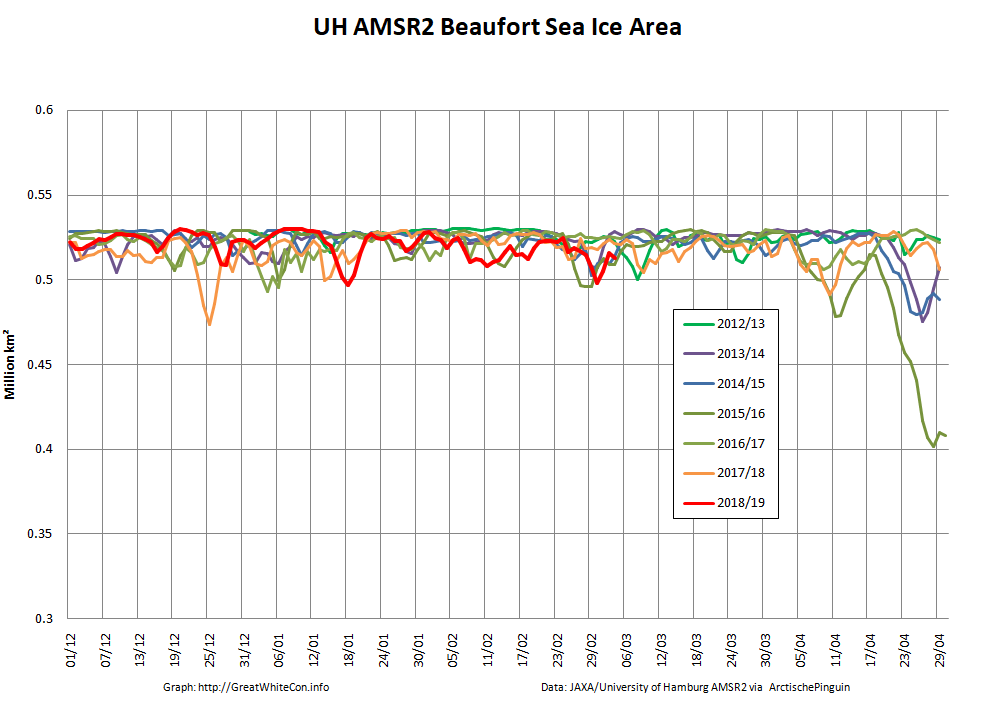
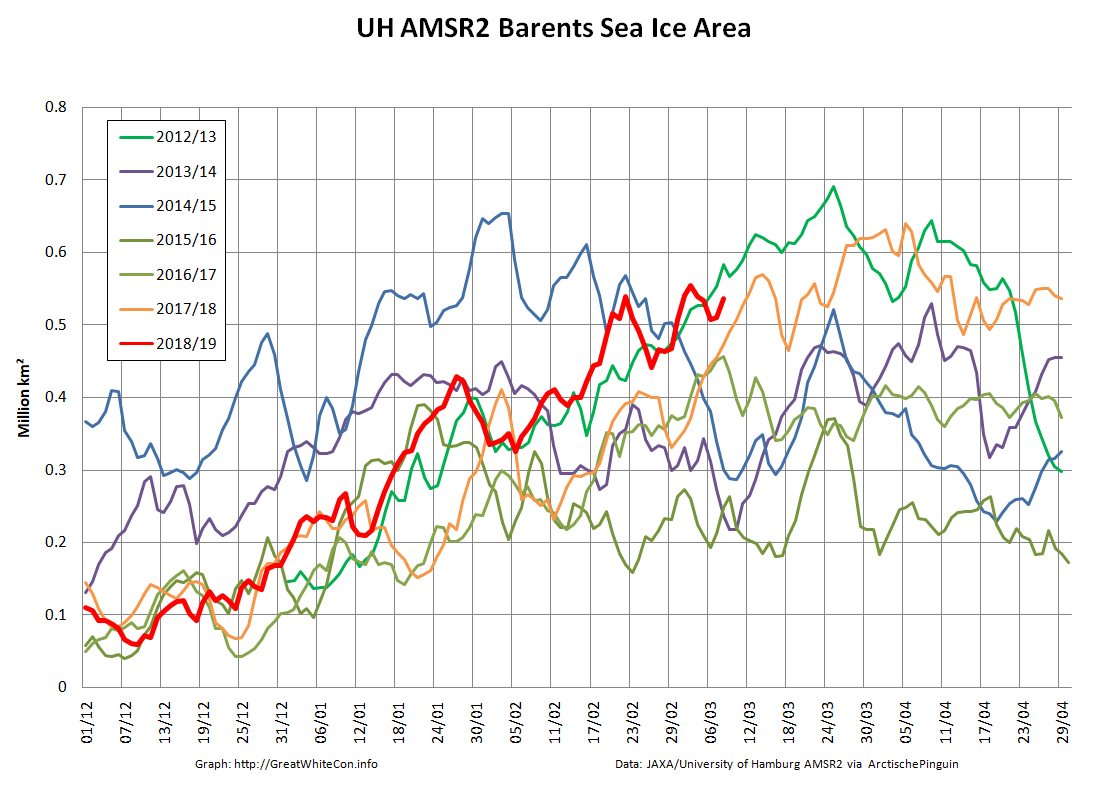
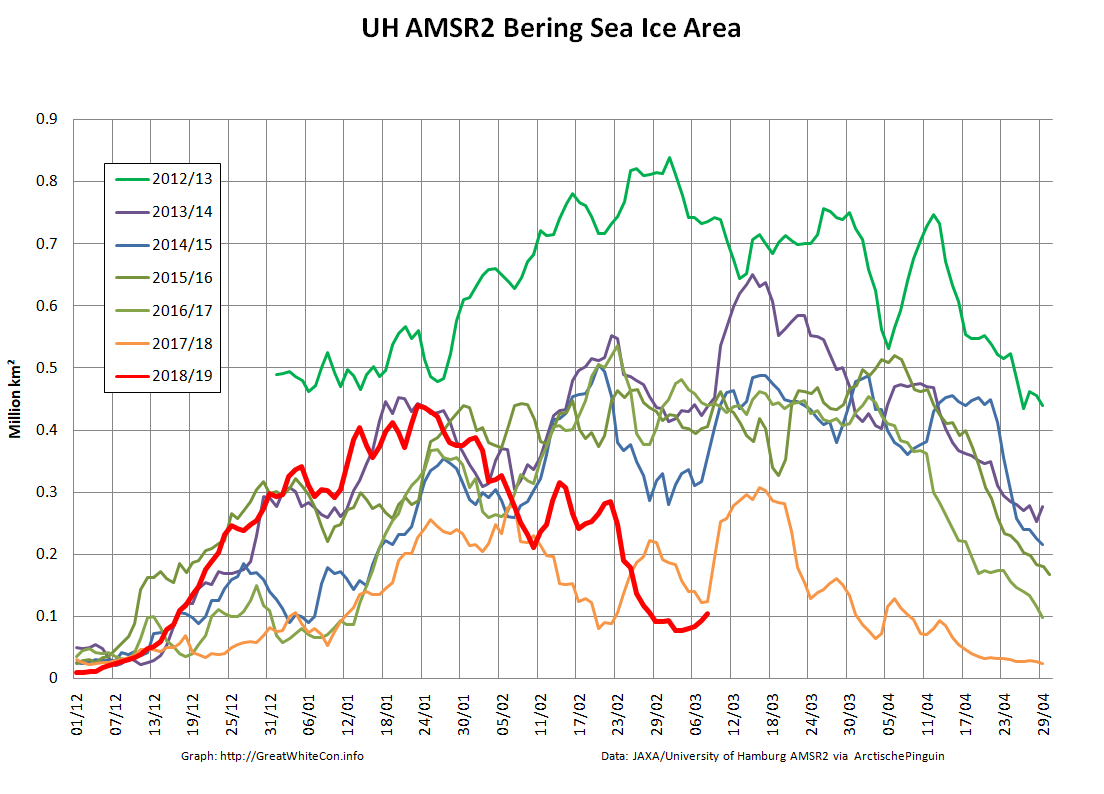
At this juncture you may well be wondering what the cause of that sudden sharp peak might be? Here’s your starter for ten:
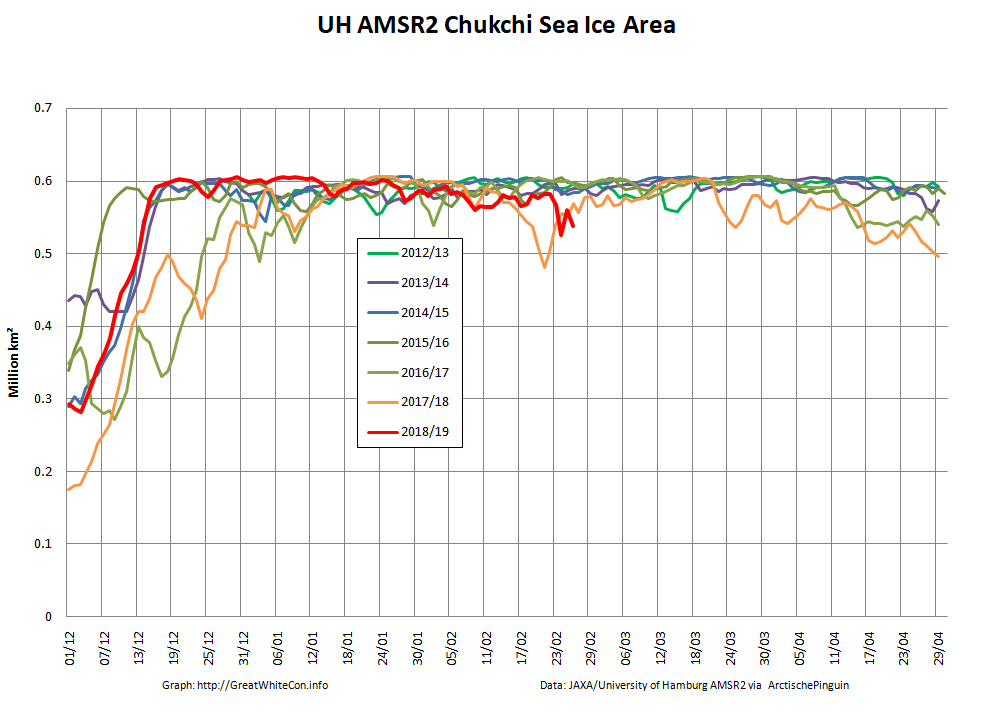
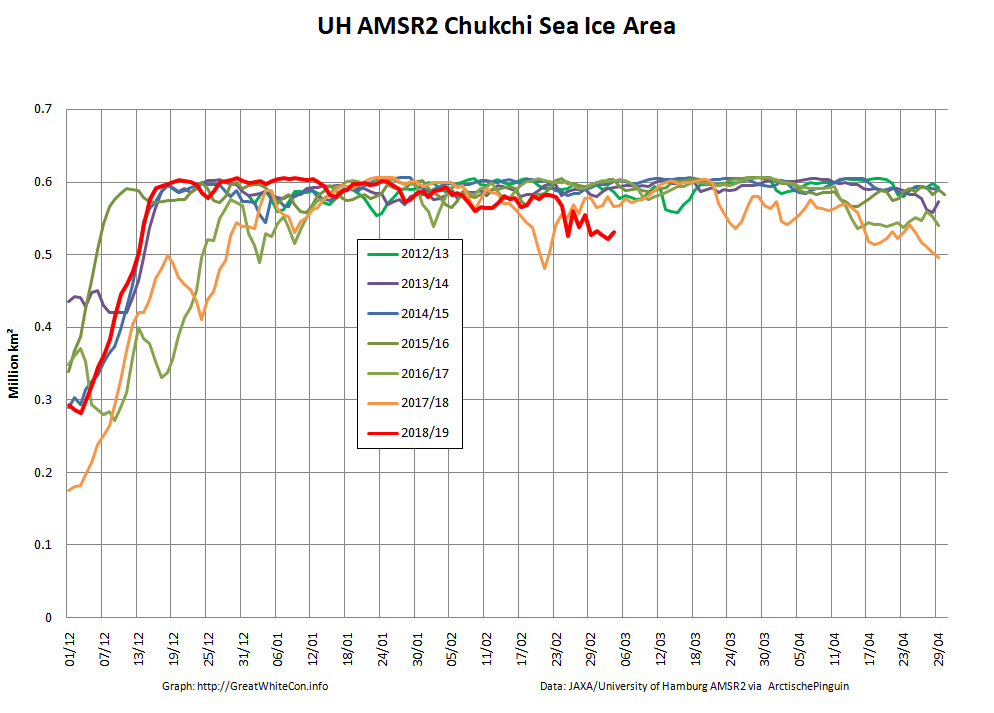
Whilst overall Arctic sea ice area is unremarkable for the current decade, sea ice area in the Bering Sea is remarkable low for the time of year! What’s more much like last year the Chukchi Sea is not currently full to overflowing with sea ice, and is also lowest for the date in the AMSR2 satellite records:
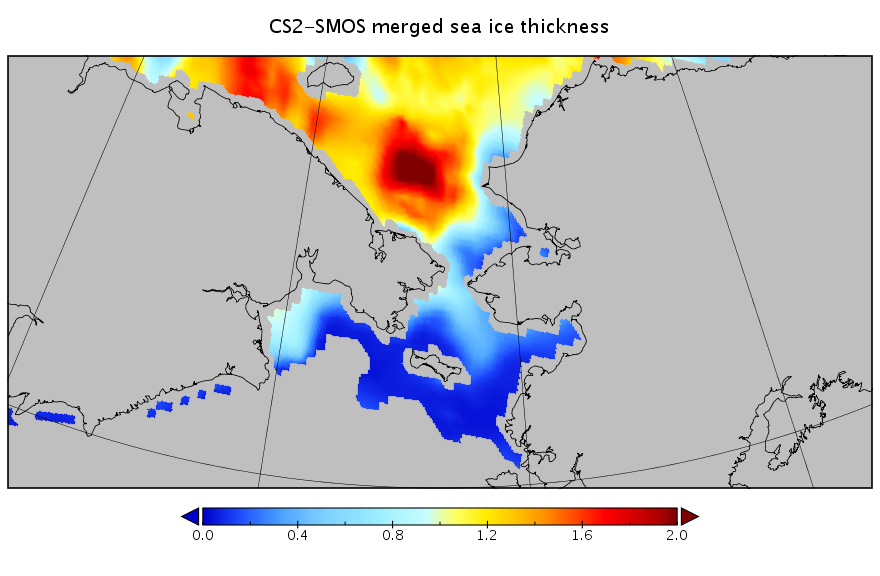
I’ve also been experimenting with the new gridded CryoSat-2/SMOS thickness data from the Finnish Meteorological Institute, which reveals this:
That’s a weekly overview dated February 24th, but it does perhaps explain how such a large area of sea ice could melt so swiftly?
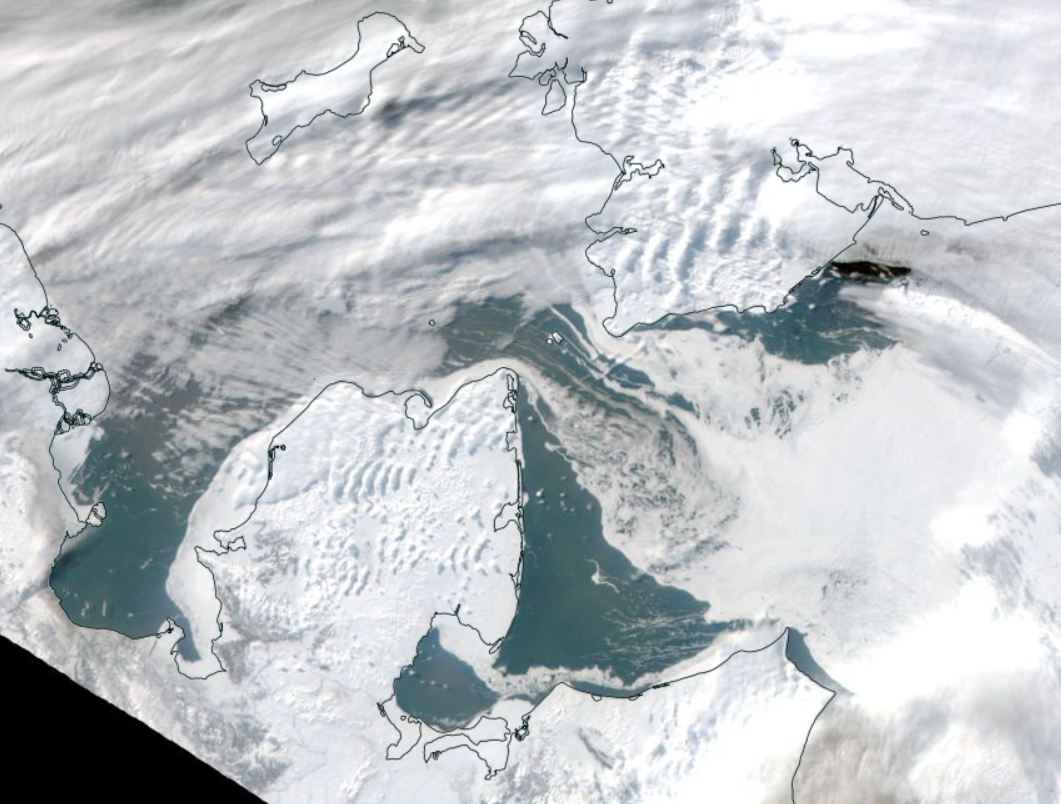
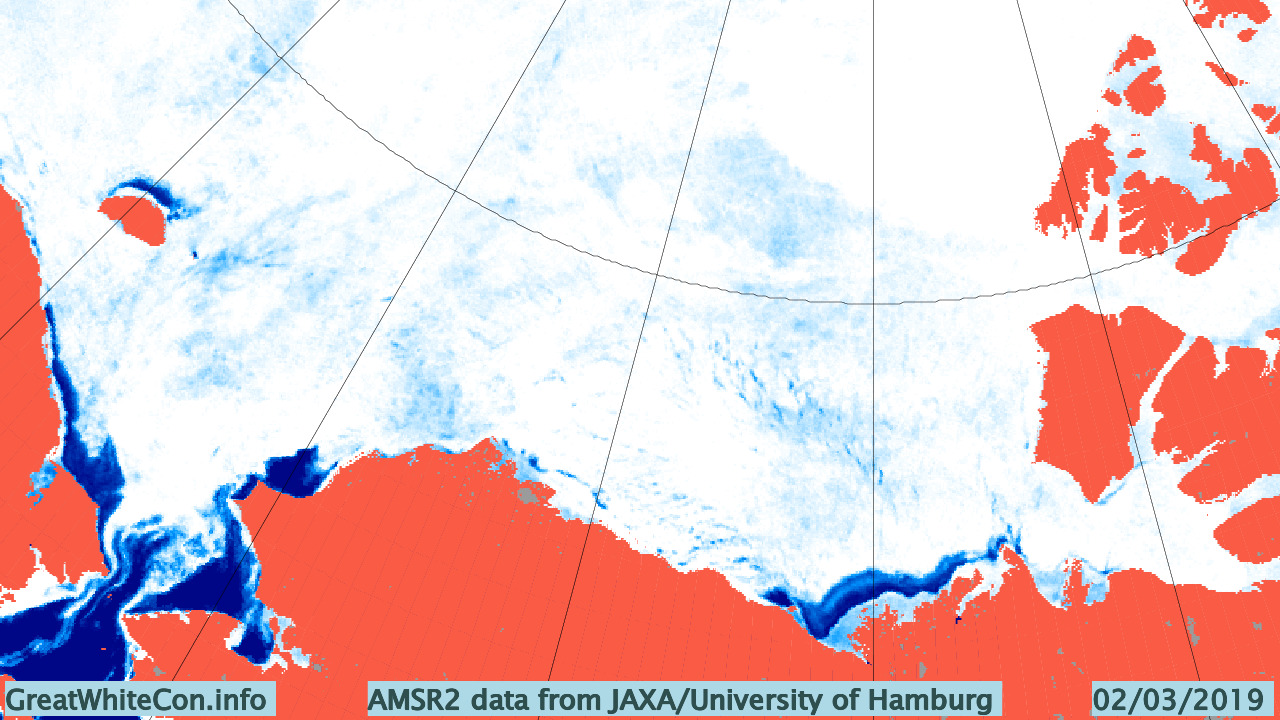
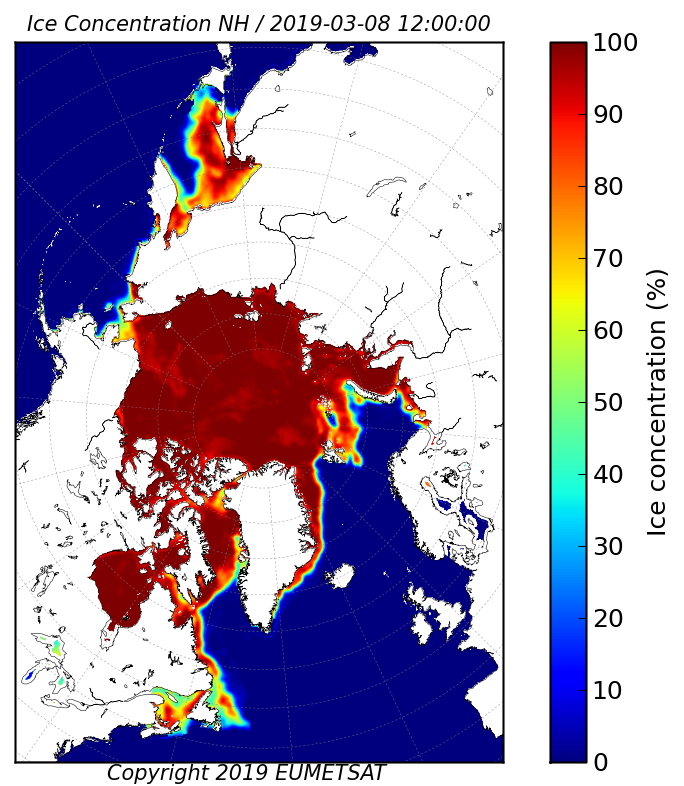
As luck would have it the skies are reasonably clear over the Bering Strait this morning (UTC). Here’s Terra’s view from on high of the current situation:
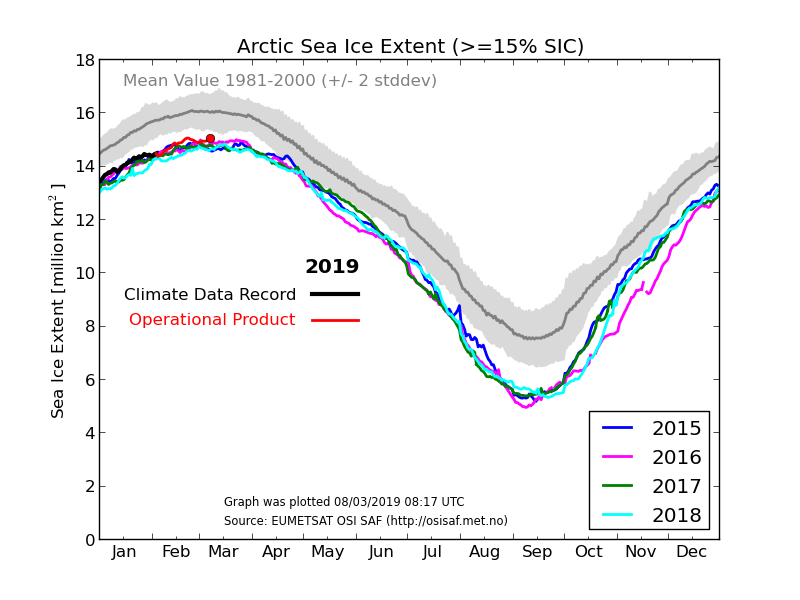
In addition, here is the underlying sea ice concentration data from the OSI-SAF:
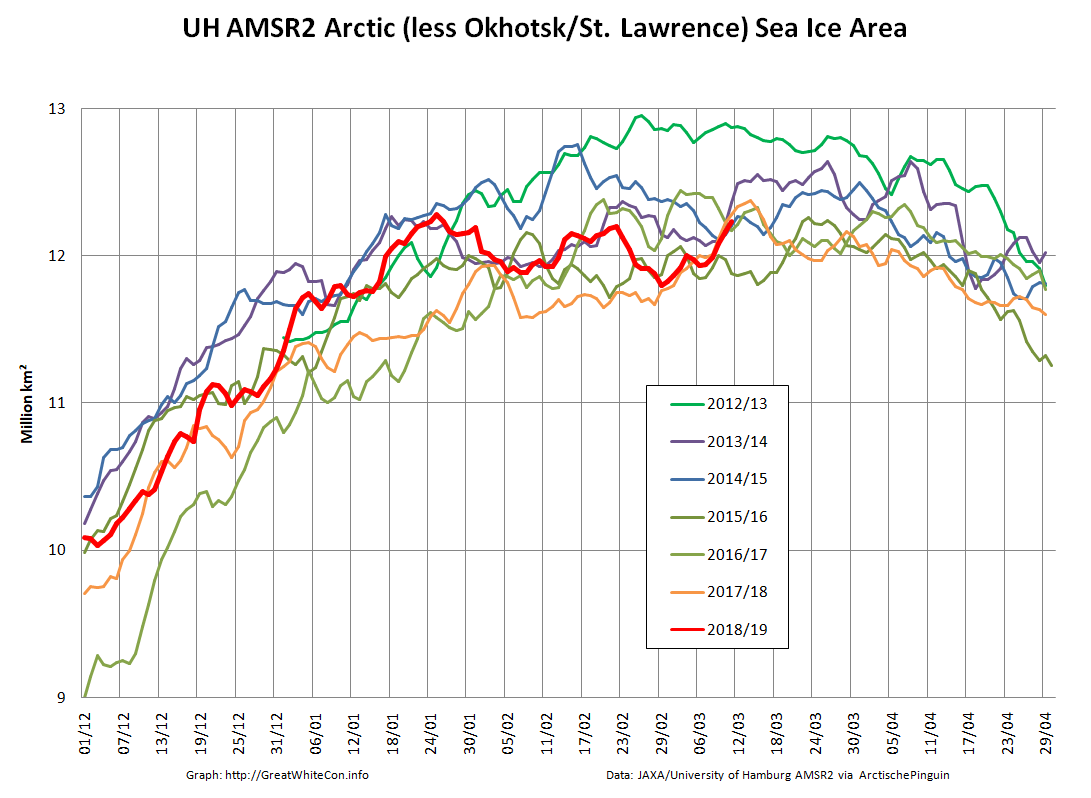
Since Michael is also asserting that there currently exists “the greatest February Arctic sea ice extent (according to DMI) in your blog’s history”, here’s Arctic sea ice area excluding the extremely peripheral Okhotsk and St. Lawrence regions:
P.S. Wipneus’ Pi has processed the AMSR2 data now, and area shows another, more modest, decline today:
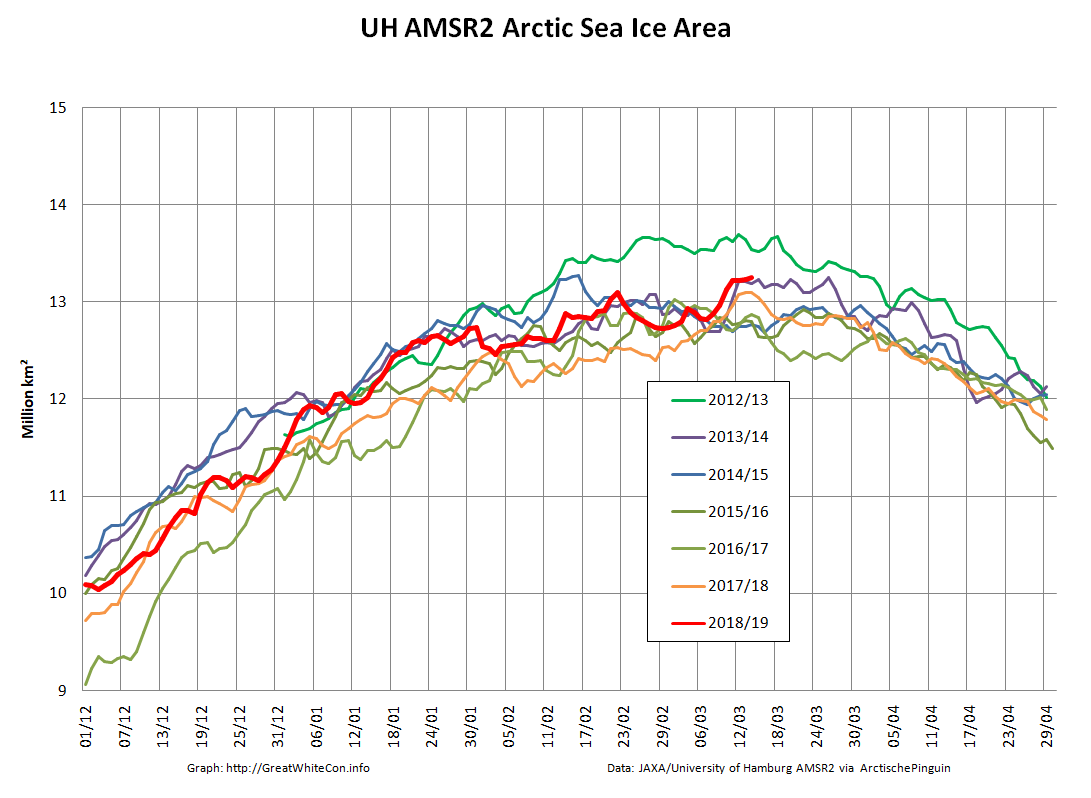
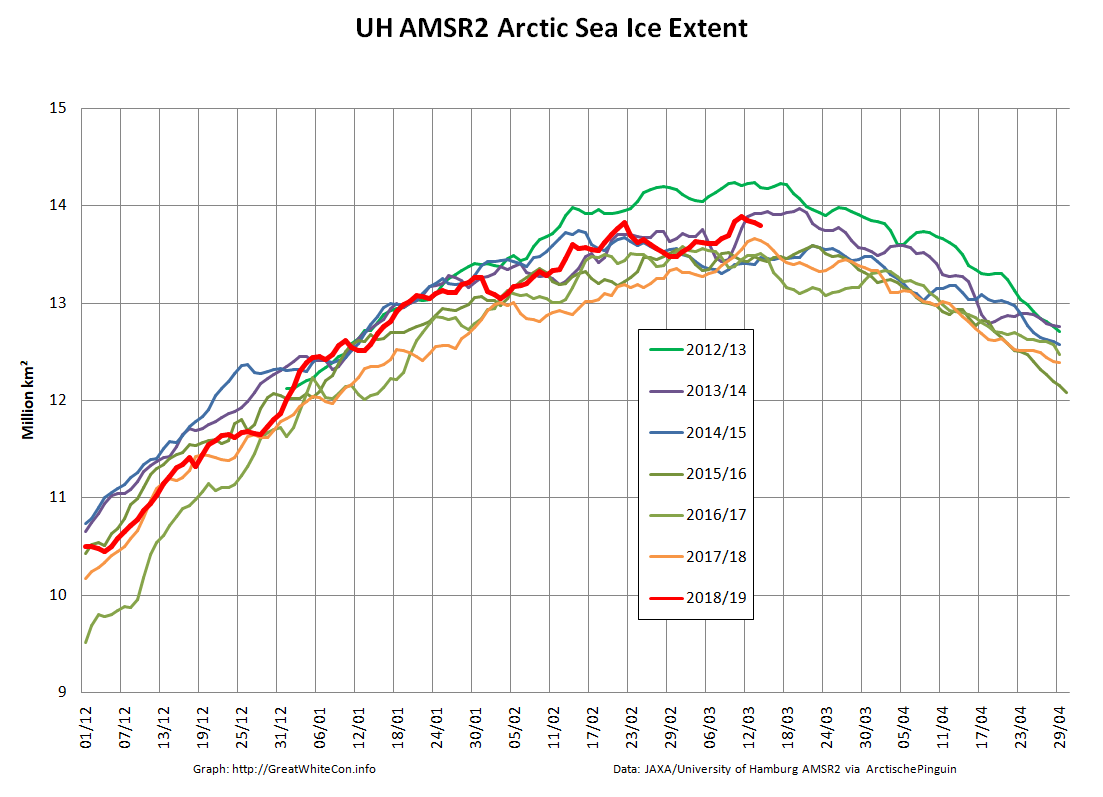
Both area and extent are still moving inexorably upwards:
The late February maximum still holds, on the high resolution numbers at least. The JAXA/VISHOP web site is down at the moment, so we’ll have to wait for an update to that particular metric, as well as a post weekend update to the NSIDC’s Charctic chart.
P.S. Jaxa is still down this afternoon, but here’s the latest from the NSIDC:
[Edit – March 13th]
Arctic wide area and extent have blasted past their respective late February maxima:
However Arctic sea ice area excluding the Okhotsk and St. Lawrence peripheral regions has still not exceeded the maximum formed on January 25th:
[Edit – March 14th]
This morning’s data reveal the first decline in extent for several days:
The (extremely!) tentative new maximum Arctic sea ice extent for 2019 is 13.89 million square kilometers on March 12th.
[Edit – March 15th]
JAXA is back!
UH AMSR2 confirms that extent is still declining:
[Edit – March 16th]
Arctic sea ice extent continues to decline, whilst area is still flatlining:
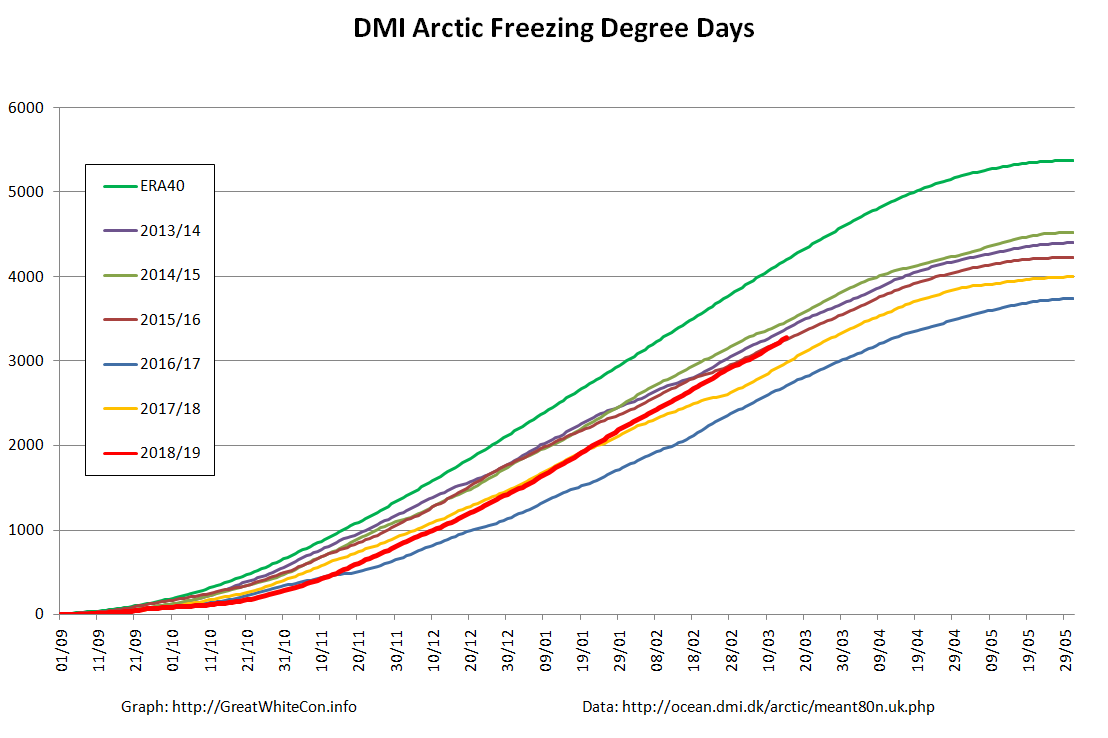
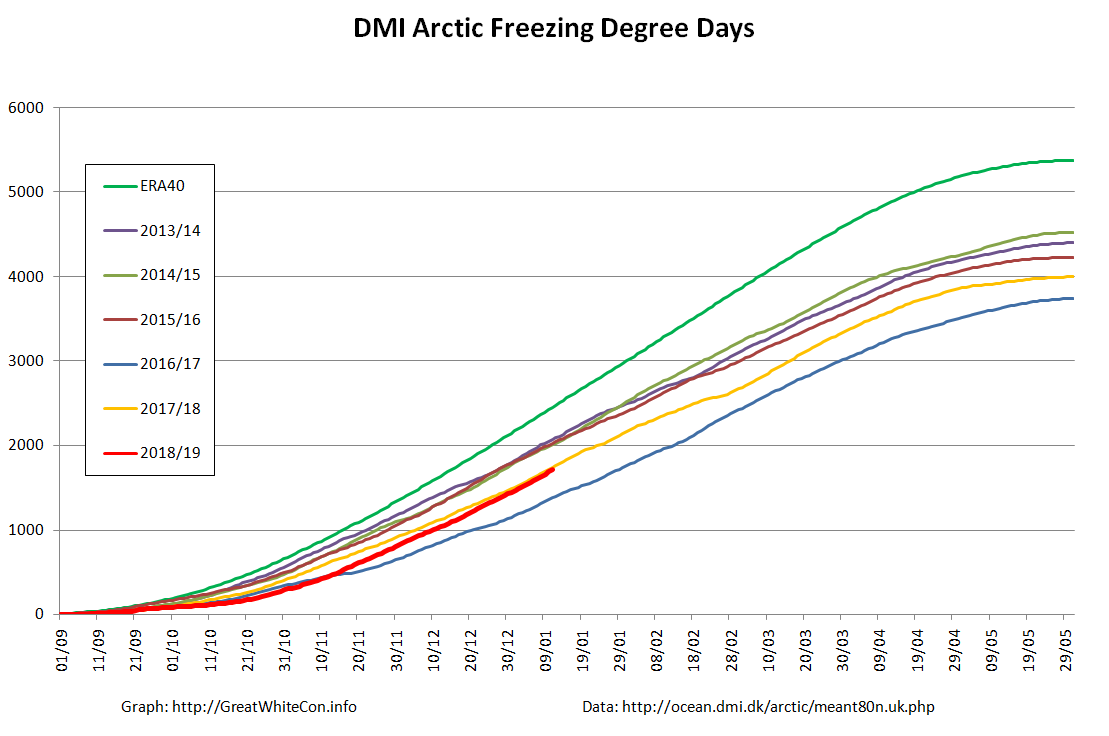
Meanwhile a look at freezing degree days based on the DMI’s dubiously weighted data for north of 80 degrees reveals the story of the freezing season. A historically warm start, but now back in amongst the pack of the 2010s:
[Edit – March 17th]
It looks as though there’ll be no going back from this. Arctic sea ice area is finally following extent’s decline in no uncertain terms:
Barring exceedingly unforeseen circumstances after this year’s “double top” that leaves the 2019 Arctic sea ice maximum extent numbers as follows:
UH/Wipneus AMSR2 – 13.89 million square kilometers on March 12th
JAXA/VISHOP AMSR2 – 14.27 million square kilometers on March 12th
NSIDC 5 day SSMIS – 14.78 million square kilometers on March 13th
[Edit – March 19th]
Arctic sea ice area has fallen off the proverbial cliff over the last few days. There can now be no doubt that the 2019 maximum extent has been reached:
That being the case, all other Arctic sea ice discussion for the month of March can now take place over at:
On March 13, 2019, Arctic sea ice likely reached its maximum extent for the year, at 14.78 million square kilometers (5.71 million square miles), the seventh lowest in the 40-year satellite record, tying with 2007. This year’s maximum extent is 860,000 square kilometers (332,000 square miles) below the 1981 to 2010 average maximum of 15.64 million square kilometers (6.04 million square miles) and 370,000 square kilometers (143,000 square miles) above the lowest maximum of 14.41 million square kilometers (5.56 million square miles) set on March 7, 2017. Prior to 2019, the four lowest maximum extents occurred from 2015 to 2018.
The date of the maximum this year, March 13, was very close to the 1981 to 2010 median date of March 12.
Please note this is a preliminary announcement of the sea ice maximum. At the beginning of April, NSIDC scientists will release a full analysis of winter conditions in the Arctic, along with monthly data for March.
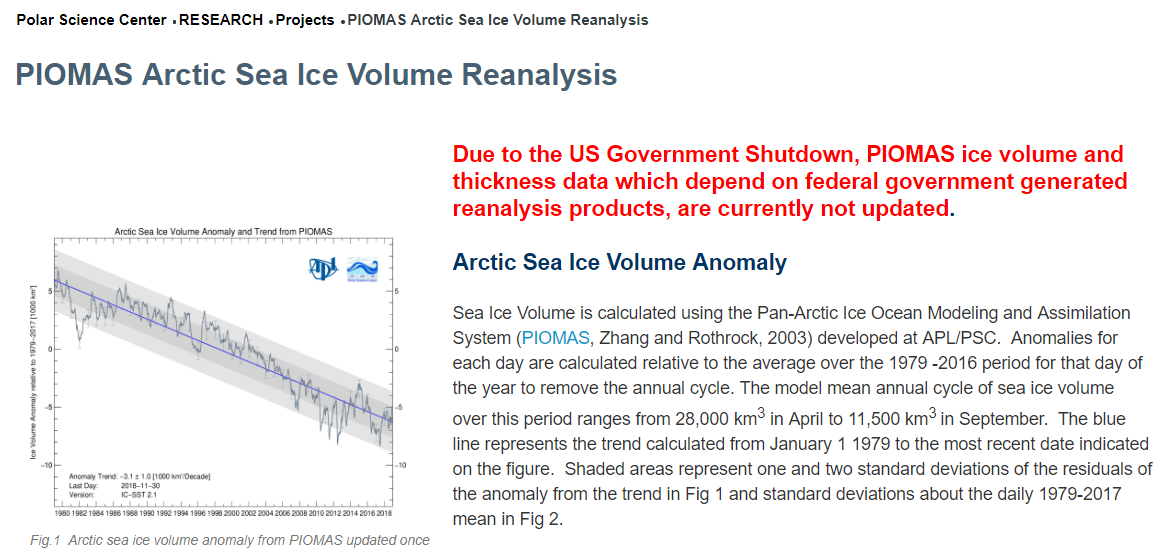
We generally write our periodic reports on the state of Arctic sea ice around the time the PIOMAS volume numbers are published. It seems as though we’ll have a long wait for that to happen at the moment though. According to The Economist today:
America’s government shutdown has become the longest in history. Hundreds of thousands of federal workers remain either stuck at home or forced to work without pay. To reopen the government President Donald Trump is demanding $5.7bn for his border wall. Nancy Pelosi, who presides over the most polarised House of Representatives in recent memory, does not want to give it to him.
Due to the US Government Shutdown, PIOMAS ice volume and thickness data which depend on federal government generated reanalysis products, are currently not updated.
Instead of PIOMAS, let’s start instead with the January 2019 edition of the National Snow and Ice Data Center’s Arctic Sea Ice News:
As 2018 came to a close, Arctic sea ice extent was tracking at its third lowest level in the satellite record, while sea ice in the Antarctic remained at historic lows. Slightly faster growth in the first few days of the new year, mostly in the Pacific sea ice areas, has the daily sea ice extent at fifth lowest as of this post.
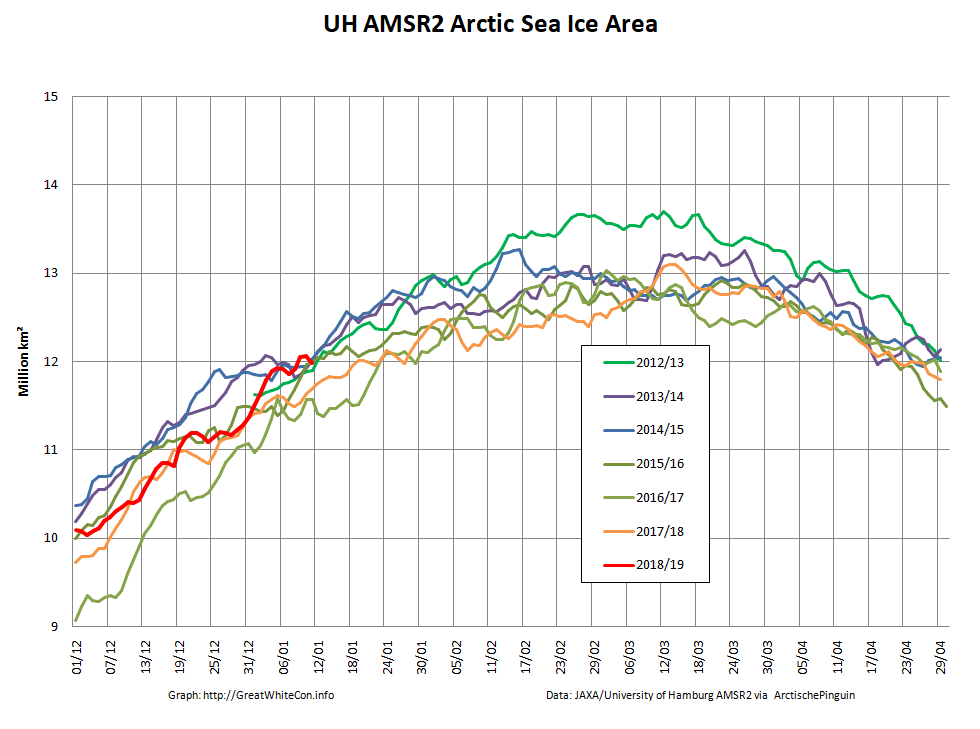
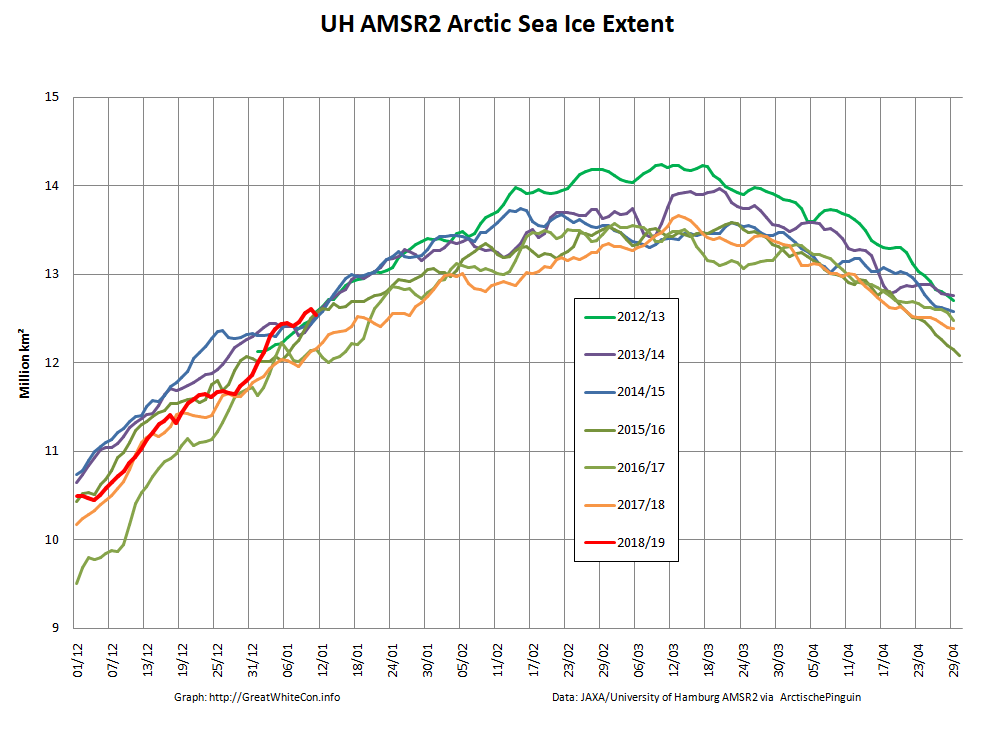
Now let’s take a look at our favourite high resolution AMSR2 area and extent metrics:
You can see that towards the end of December Arctic sea ice extent was verging on lowest for the date, since when it has risen quickly to reach highest for the date in the brief AMSR2 records a few days ago.
The NSIDC also mention the US Government shutdown:
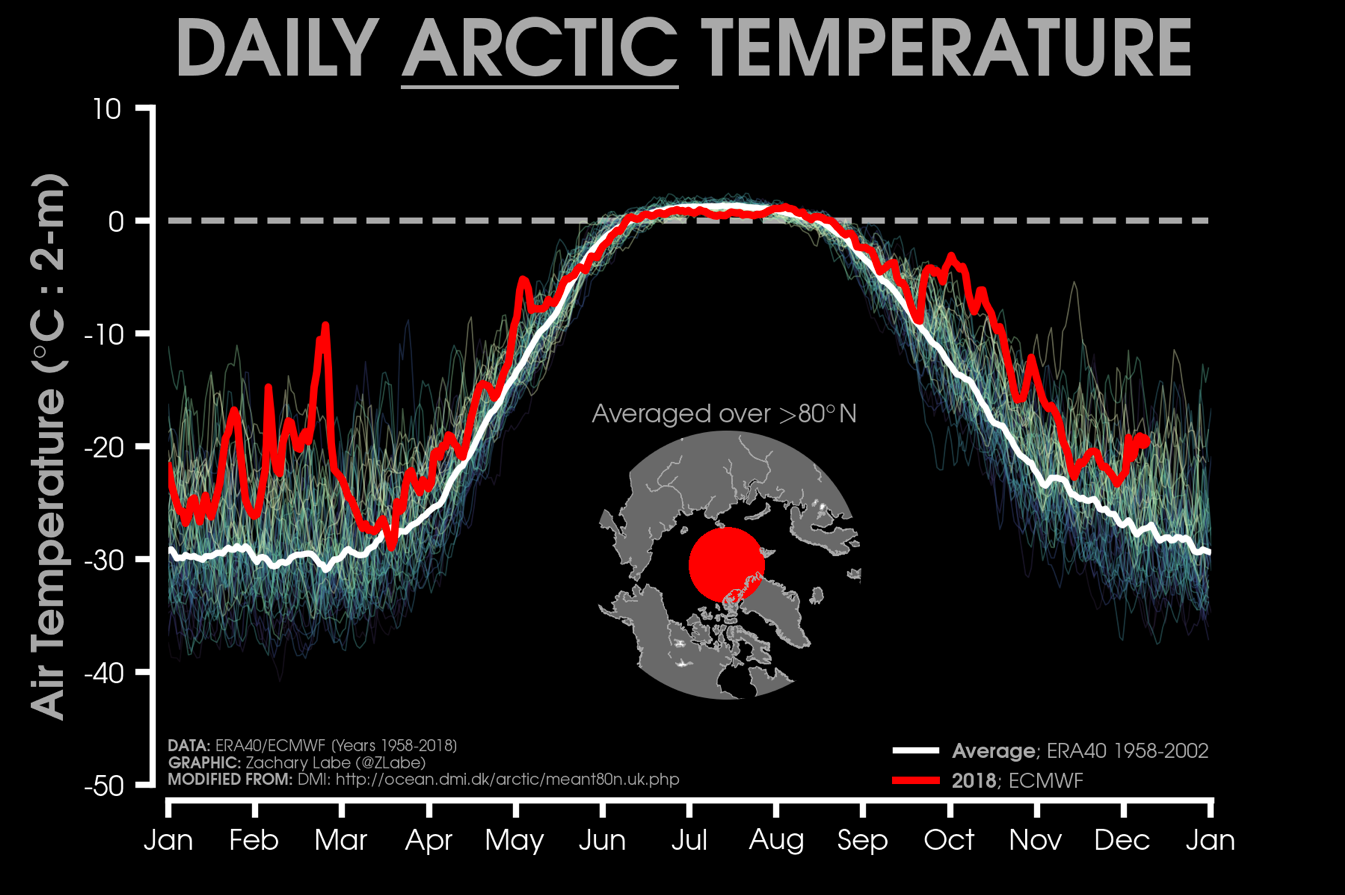
Unfortunately, as a result of the partial government shutdown, we are unable to access the National Oceanic and Atmospheric Administration (NOAA) pages to retrieve information on atmospheric air temperatures and sea level pressure patterns. Instead, we turn to daily (2 meters above the surface) mean air temperatures north of 80 degrees North from the European Centre for Medium-Range Weather Forecasts (ECMWF) operational model. This analysis shows that air temperatures remained above the 1958 to 2002 average for all of December.
That brings us on to our Arctic freezing degree days graph, based on DMI data:
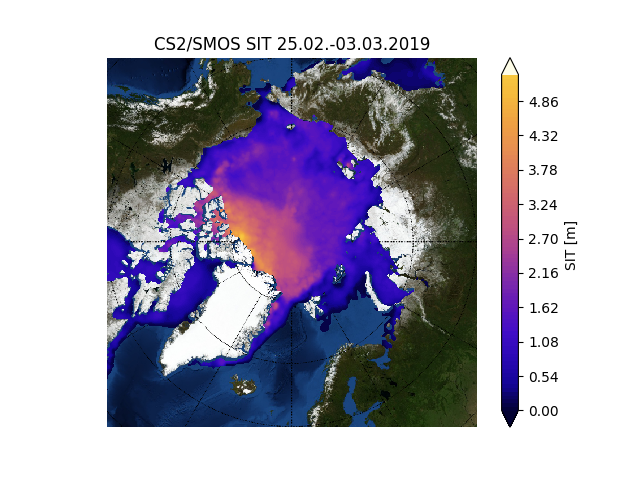
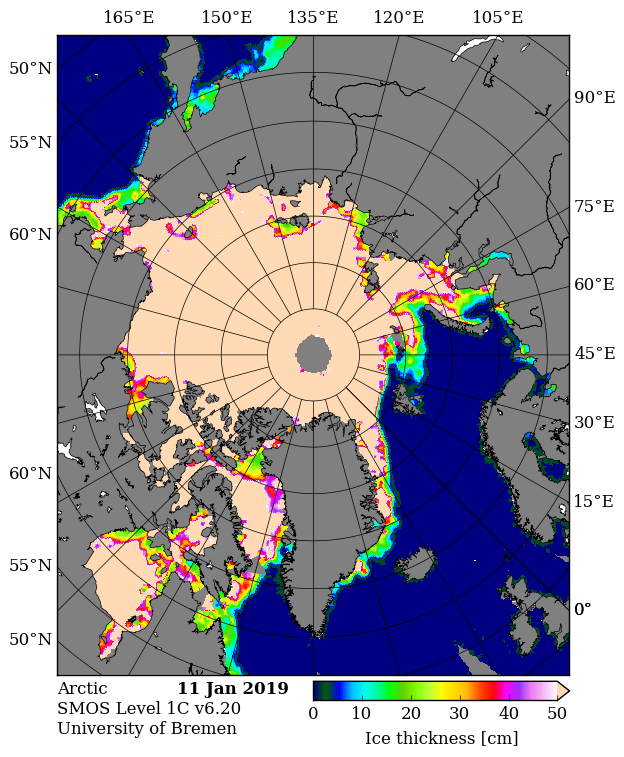
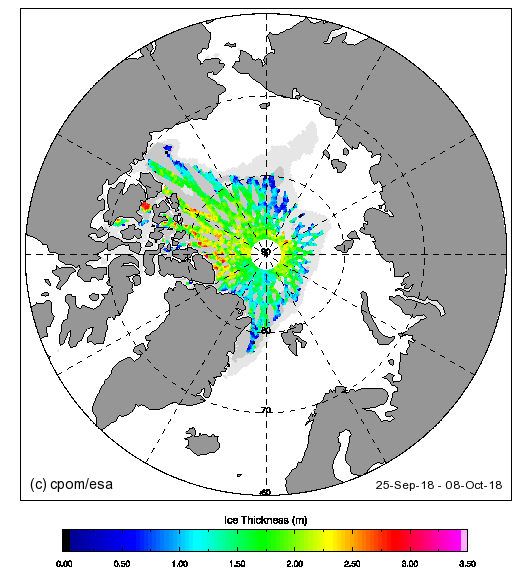
After a very slow start to the freezing season the FDD numbers are now vying for second place with last year, behind the astonishingly warm winter of 2016/17. In the absence of the PIOMAS volume numbers we can at least take a look at sea ice thickness. Here’s CryoSat-2:
All those sources seem to be agreed that large areas of both the Barents and Kara Seas are currently covered by young thin ice. Finally, for the moment at least, let’s take a look at some extracts from the NSIDC’s review of 2018:
January 2018 began the year with record low sea ice extents for the Arctic as a whole.
The seasonal maximum, reached on March 17, 2018, was the second lowest in the satellite record. While low extent persisted through April and May, sea ice loss during early summer was unremarkable despite above average 925 hPa air temperatures over the Arctic Ocean and Eurasia.
Air temperatures over the Arctic Ocean in July were below average, followed by above average temperatures in August. In fact, on average, August temperatures were higher than July temperatures in 2018. This is highly unusual in the Arctic and something not seen in at least 40 years.
The September 2018 seasonal minimum extent ended up slightly above the long-term linear trend line, tying with 2008 for the sixth lowest in the satellite record. After the minimum, the ocean was slow to freeze up, and October sea ice extent ended up as the third lowest. However, ice growth was very rapid in November, such that November 2018 extent approached the interquartile range of the 1981 to 2010 median. Nevertheless, large amounts of open water remained in the Barents and Chukchi Seas. By the end of December, ice conditions in the Chukchi Sea were back to average, while extent remained unusually low in the Barents Sea.
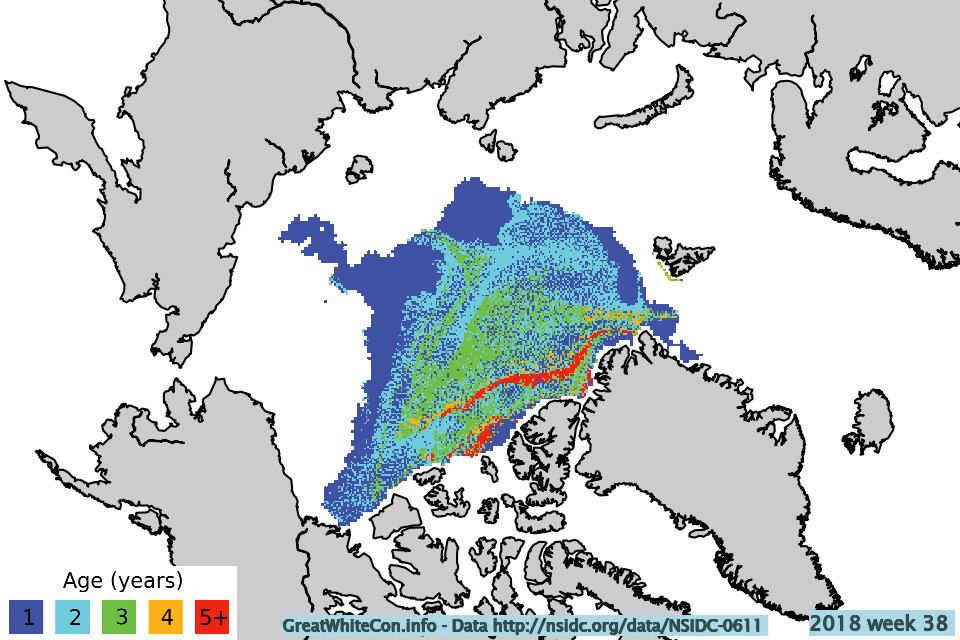
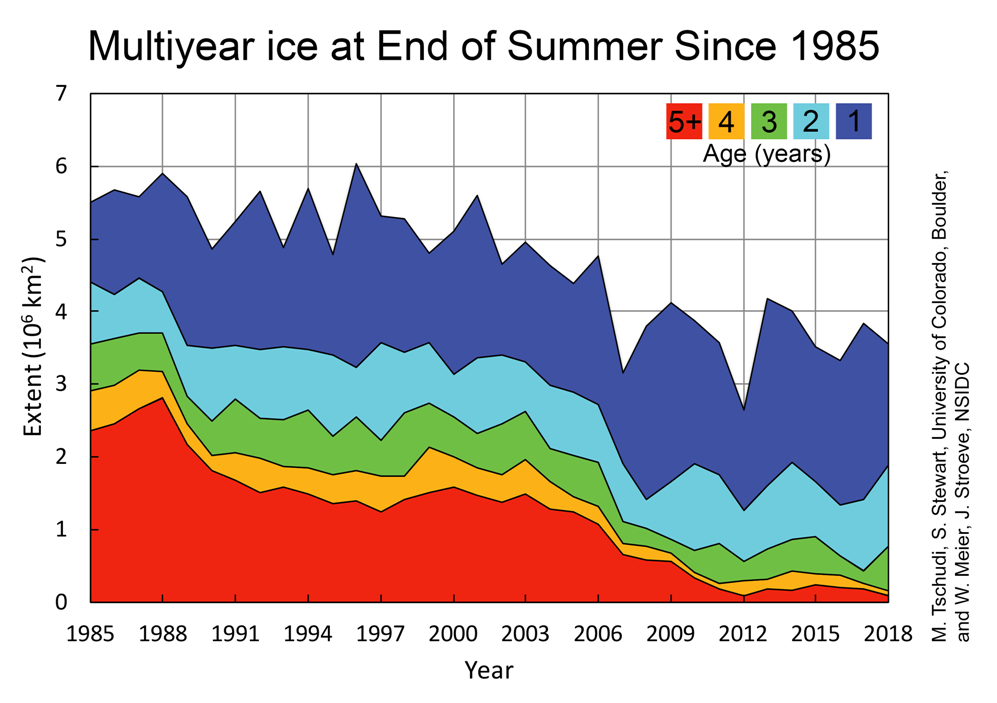
Coverage of old ice (greater than 4 years old) over the Arctic continued to decline. Such old ice covers only 5 percent of the area it used to in 1980s.
[Edit – January 13th]
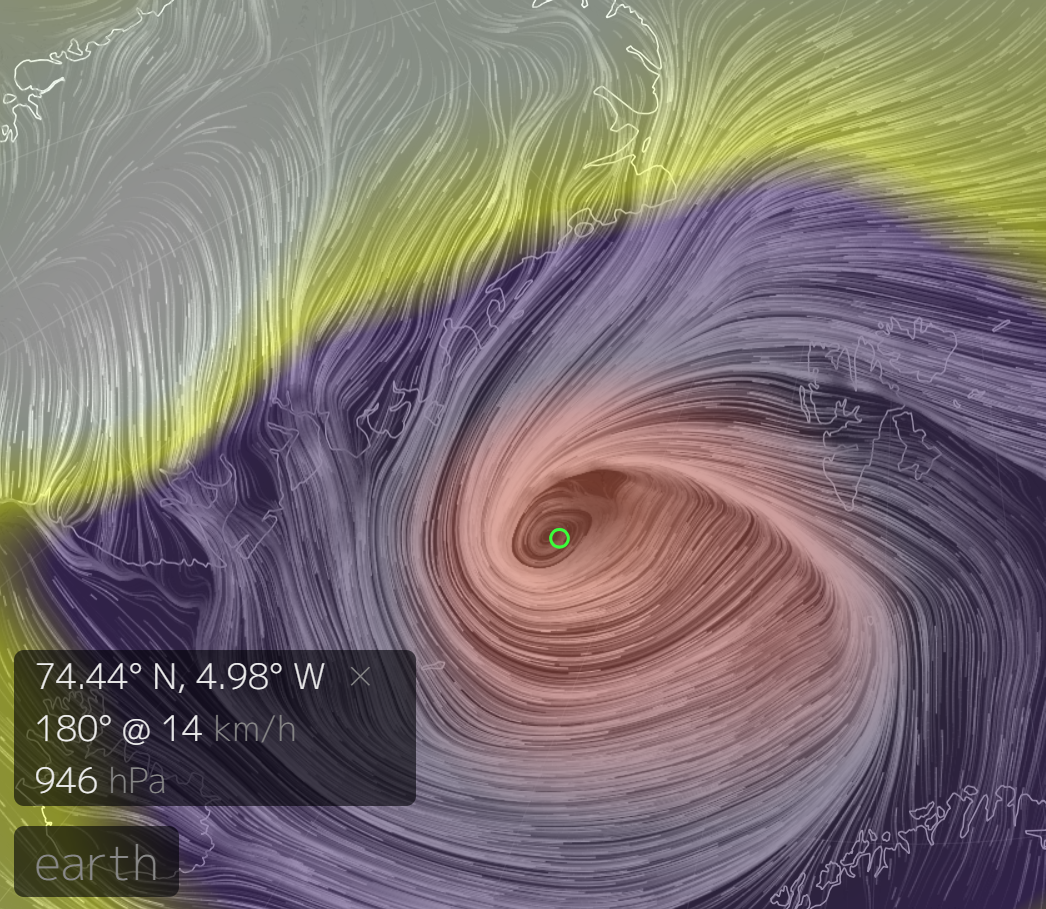
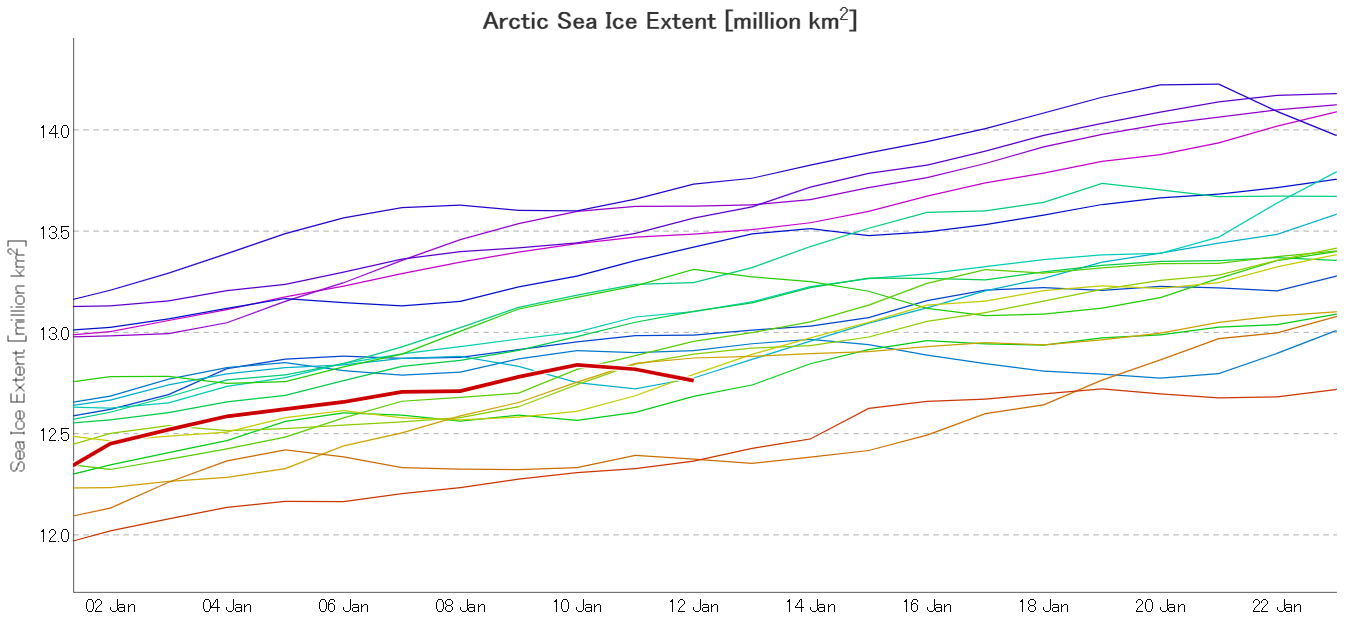
Arctic sea ice area and extent have both been falling over the last few days, possibly as a result of the recent cyclone which created strong northerly winds in the Fram Strait. This is from Earth at 09:00 UTC on January 10th, showing a MSLP of 946 hPa:
Here’s what used to be referred to as JAXA extent:
Please note the abnormally thin sea ice to the north of Greenland.
Finally, for the moment at least, here’s the latest Arctic sea ice age information extracted from the October 2018 edition of the NSIDC’s Arctic Sea Ice News:
The “oldest, thickest sea ice in the Arctic” seems to be vanishing before our very eyes.
September is upon us once again, the month in which the assorted Arctic sea ice area and extent metrics (almost) always reach their respective annual minima. Now we are free to start speculating about what the assorted minima will be, and on what date.
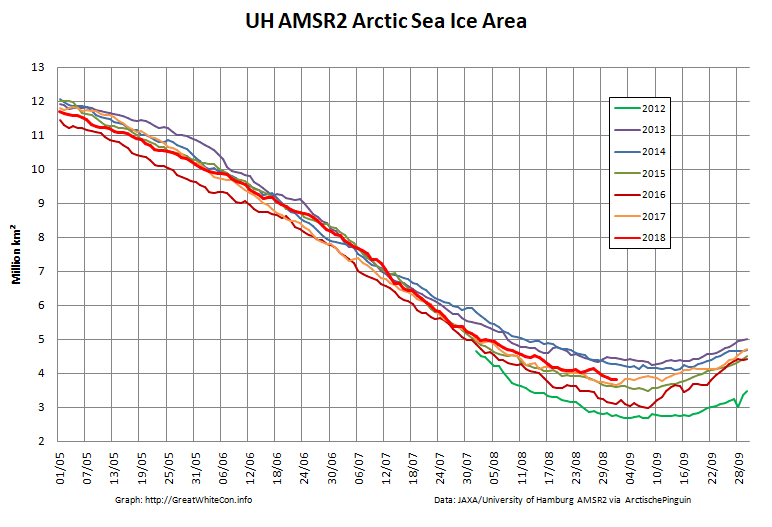
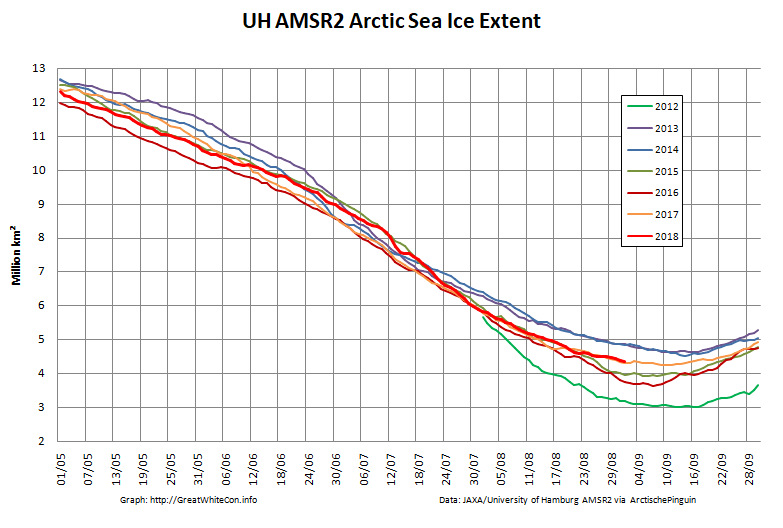
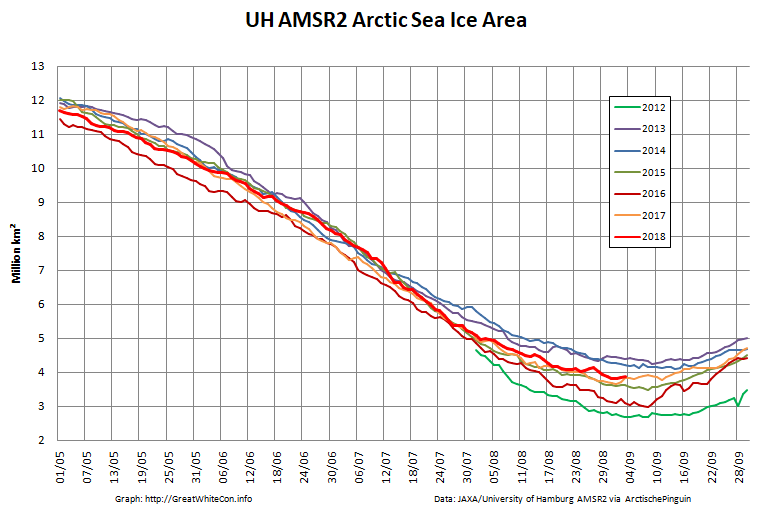
To begin with let’s take a look at our much beloved high resolution AMSR2 metrics derived by “Wipneus” from the University of Hamburg’s AMSR2 concentration data:
There’s currently some divergence between the area and extent graphs. Area is declining rapidly for the time of year, whilst extent seems to almost have come to a standstill!
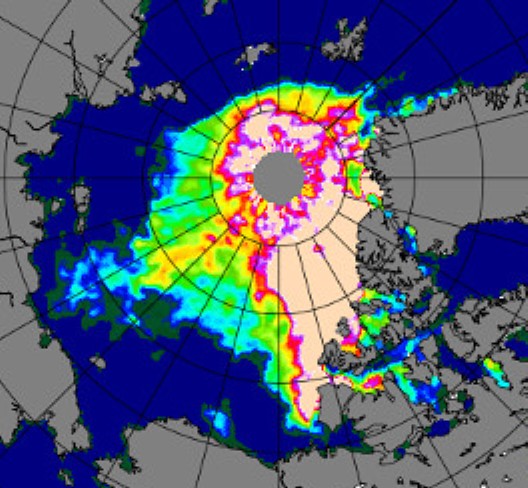
Before looking at some of the other metrics we’ll wait for the effect of the assorted storms currently circling the Arctic to play out. Here’s how the AMSR2 concentration map looks at the moment:
whilst here’s the University of Bremen’s summer SMOS sea ice “thinness” map:
[Edit – September 3rd]
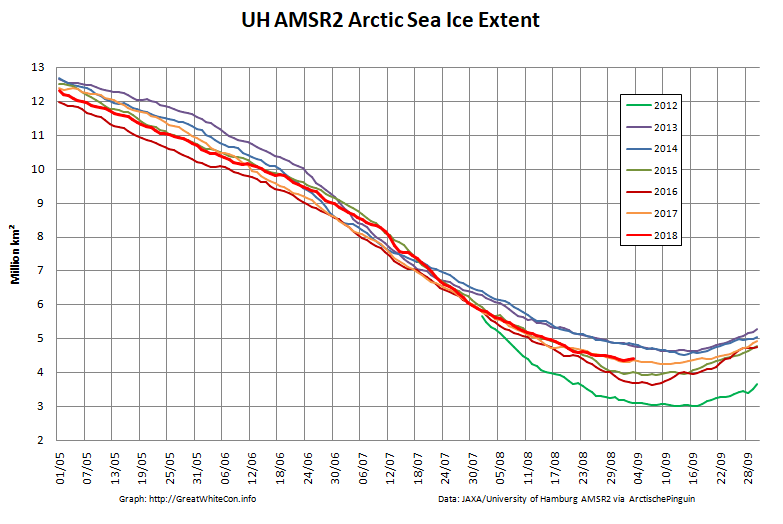
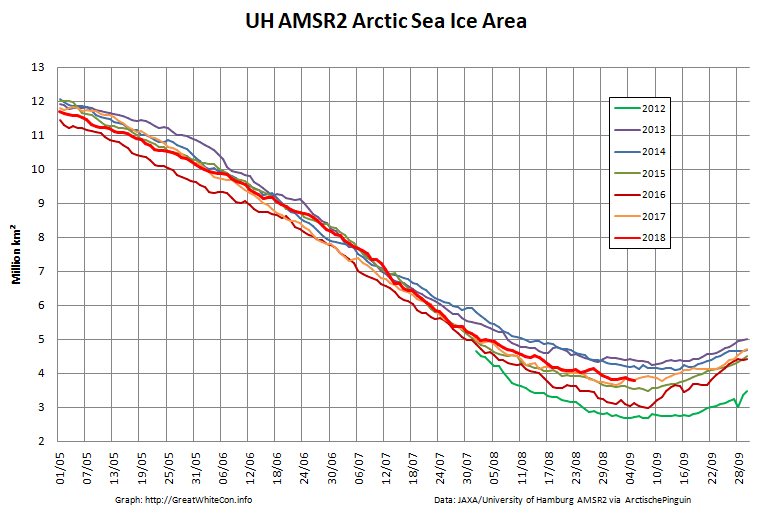
UH AMSR2 area and extent both increased yesterday, so we have a (very!) provisional minimum extent of 4.35 million square kilometres on September 1st.
[Edit – September 4th]
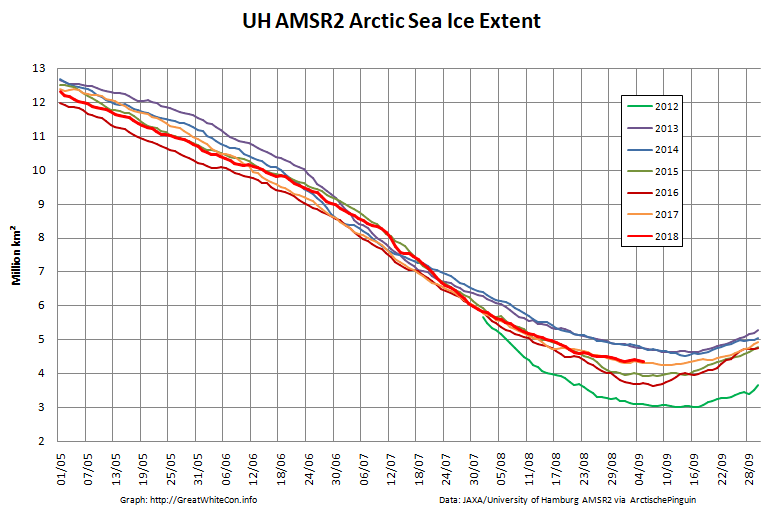
Area and extent have both increased again:
Is the minimum already in, or will the storms still circulating around the Arctic Ocean reverse that trend over the next few days?
[Edit – September 6th]
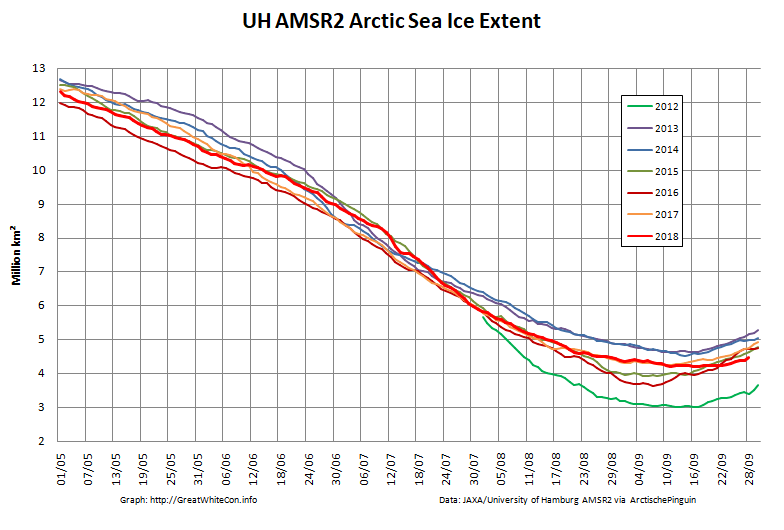
High resolution area and extent both posted marginal new lows for the year yesterday:
On September 19 and 23, Arctic sea ice appeared to have reached its seasonal minimum extent for the year, at 4.59 million square kilometers (1.77 million square miles). This ties 2018 with 2008 and 2010 for the sixth lowest minimum extent in the nearly 40-year satellite record.
Please note that this is a preliminary announcement. Changing winds or late-season melt could still reduce the Arctic ice extent, as happened in 2005 and 2010. NSIDC scientists will release a full analysis of the Arctic melt season, and discuss the Antarctic winter sea ice growth, in early October.
The NSIDC numbers are based on a 5 day average, whereas the one day high resolution AMSR2 extent reached a minimum of 4.195 million square kilometers on September 17th:
The AMSR2 area minimum occurred significantly earlier. 3.737 million square kilometers on September 9th:
This website uses cookies to improve your experience. We'll assume you're ok with this, but you can opt-out if you wish. Cookie settingsACCEPT
Privacy & Cookies Policy
Privacy Overview
This website uses cookies to improve your experience while you navigate through the website. Out of these, the cookies that are categorized as necessary are stored on your browser as they are essential for the working of basic functionalities of the website. We also use third-party cookies that help us analyze and understand how you use this website. These cookies will be stored in your browser only with your consent. You also have the option to opt-out of these cookies. But opting out of some of these cookies may affect your browsing experience.
Necessary cookies are absolutely essential for the website to function properly. This category only includes cookies that ensures basic functionalities and security features of the website. These cookies do not store any personal information.
Any cookies that may not be particularly necessary for the website to function and is used specifically to collect user personal data via analytics, ads, other embedded contents are termed as non-necessary cookies. It is mandatory to procure user consent prior to running these cookies on your website.