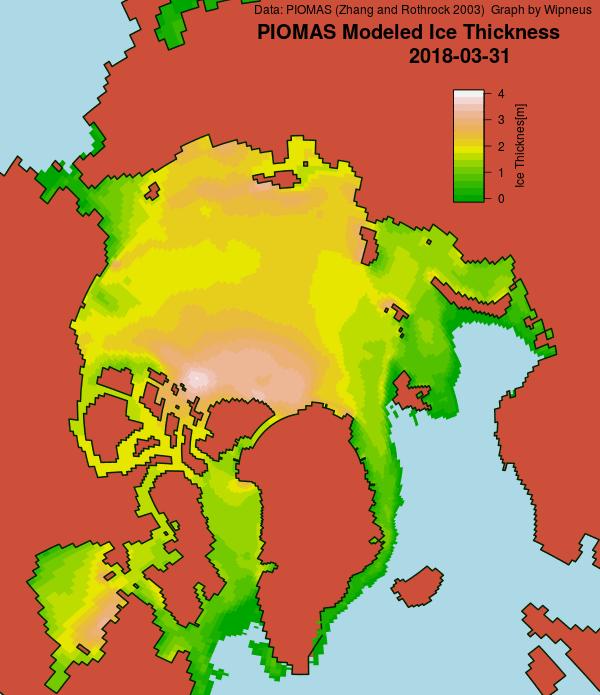
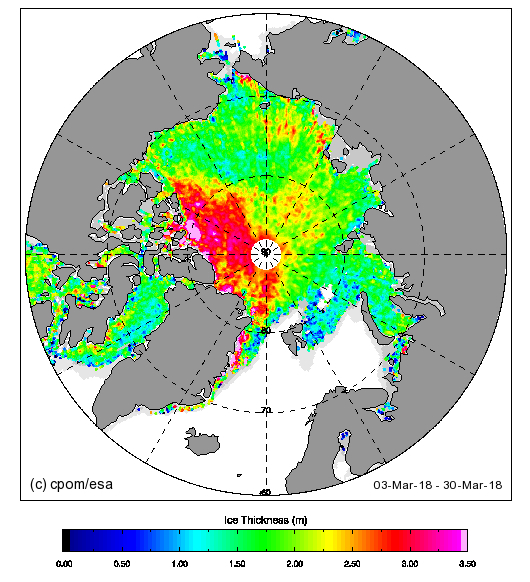
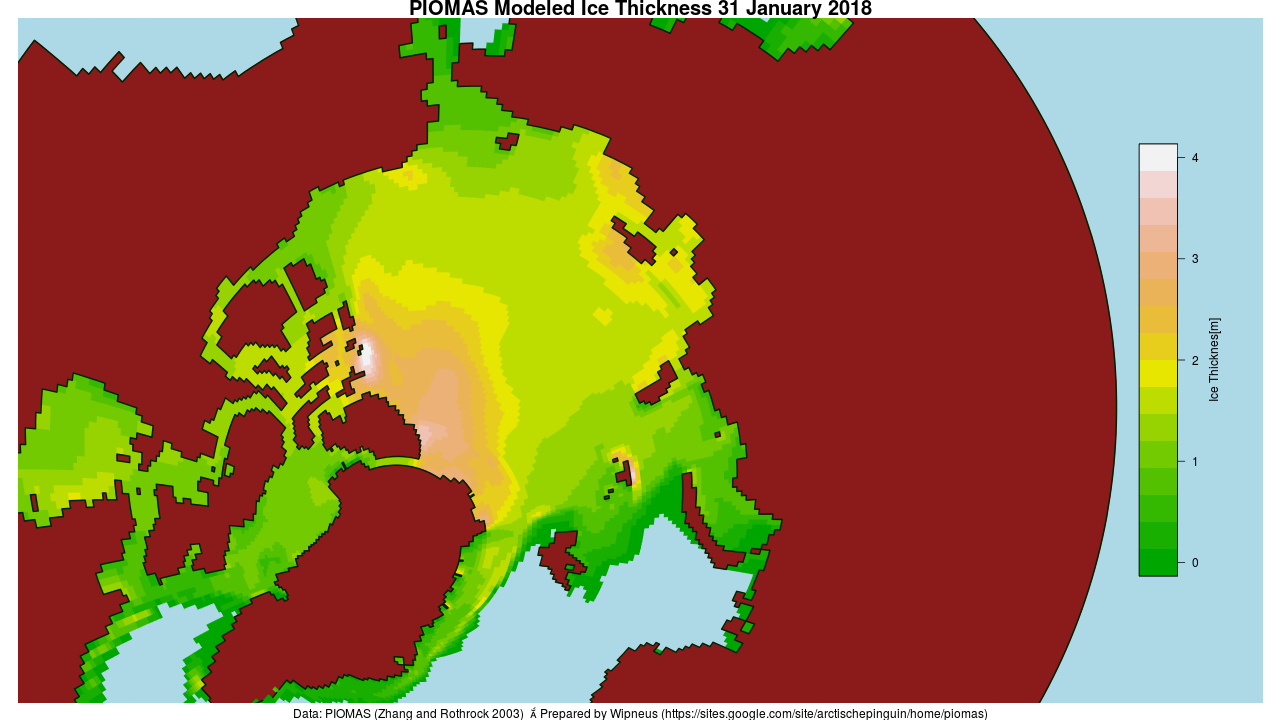
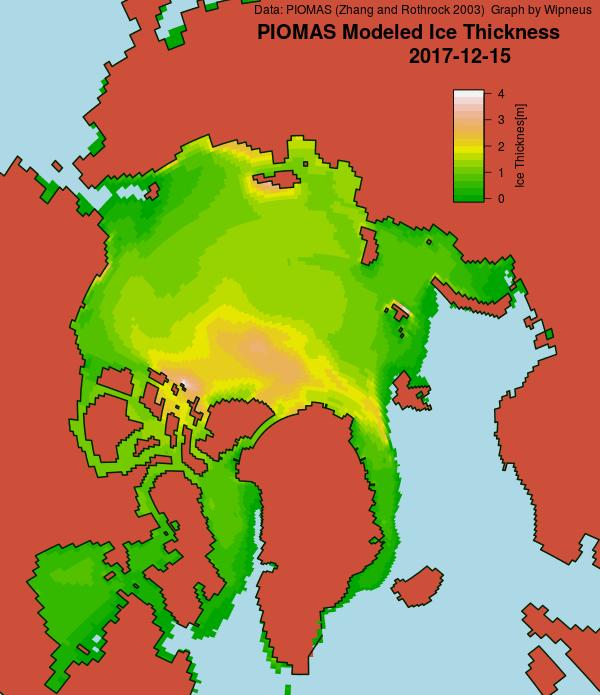
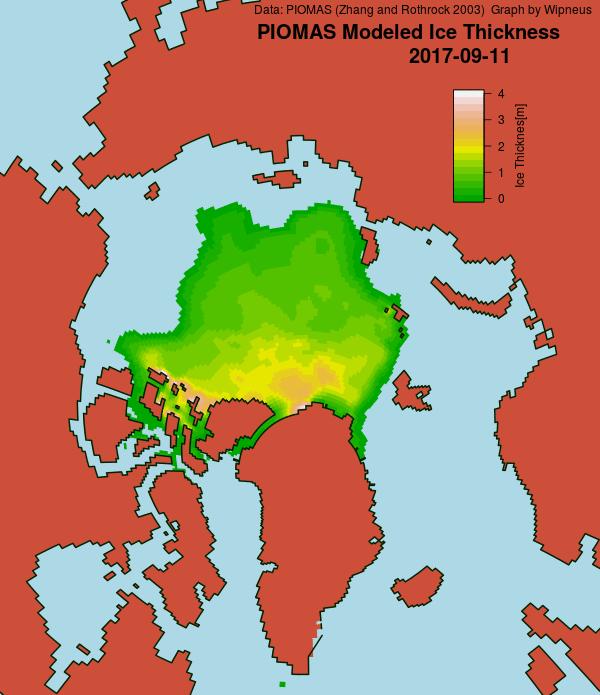
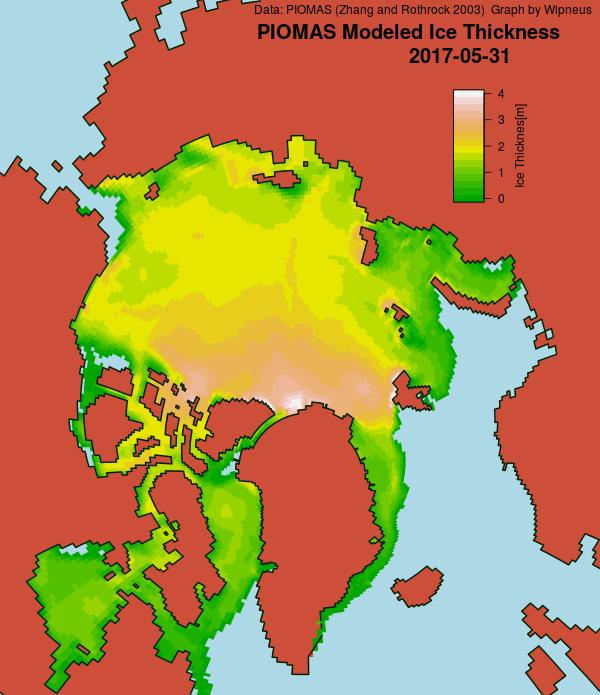
First of all Wipneus has been very quick off the mark this month with his PIOMAS gridded thickness map. Here is what it reveals for the last day of March:
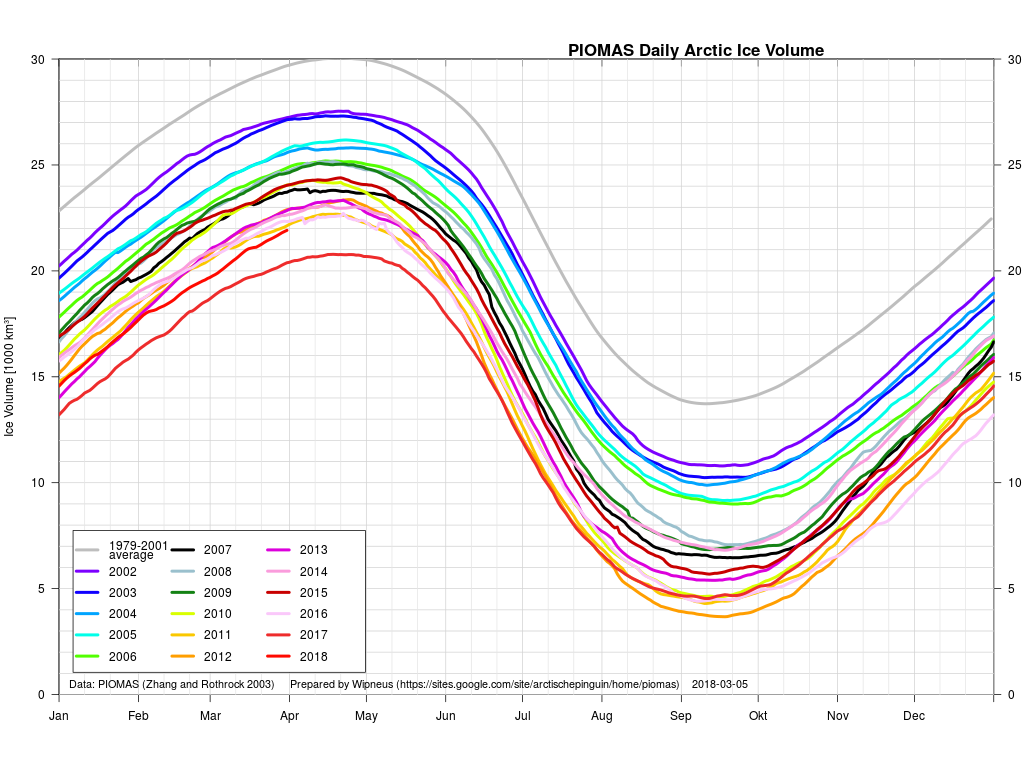
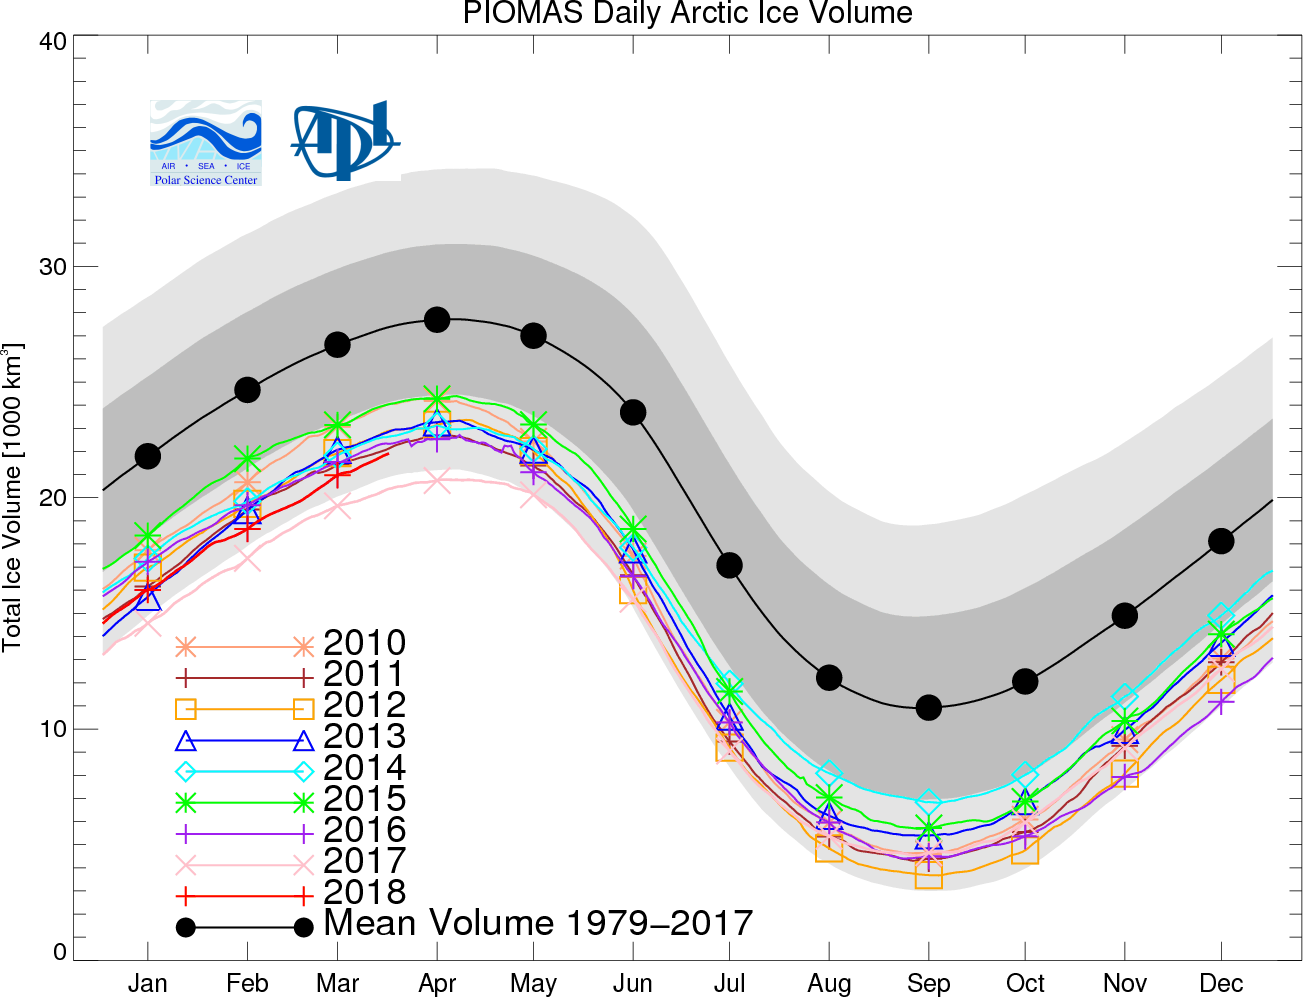
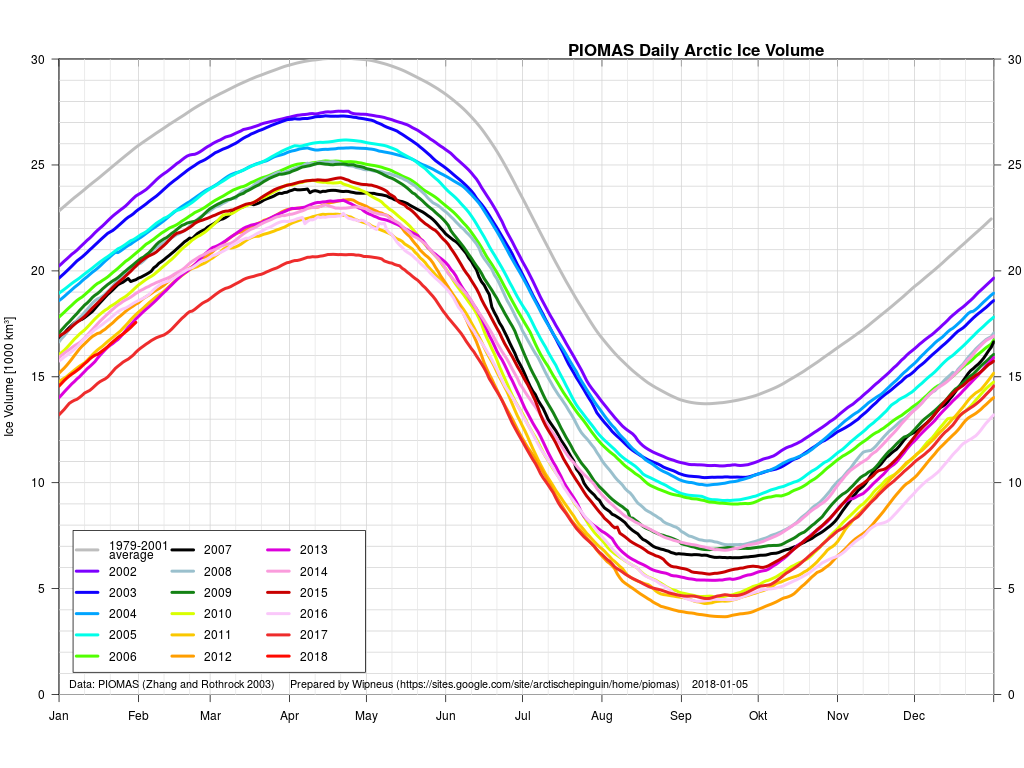
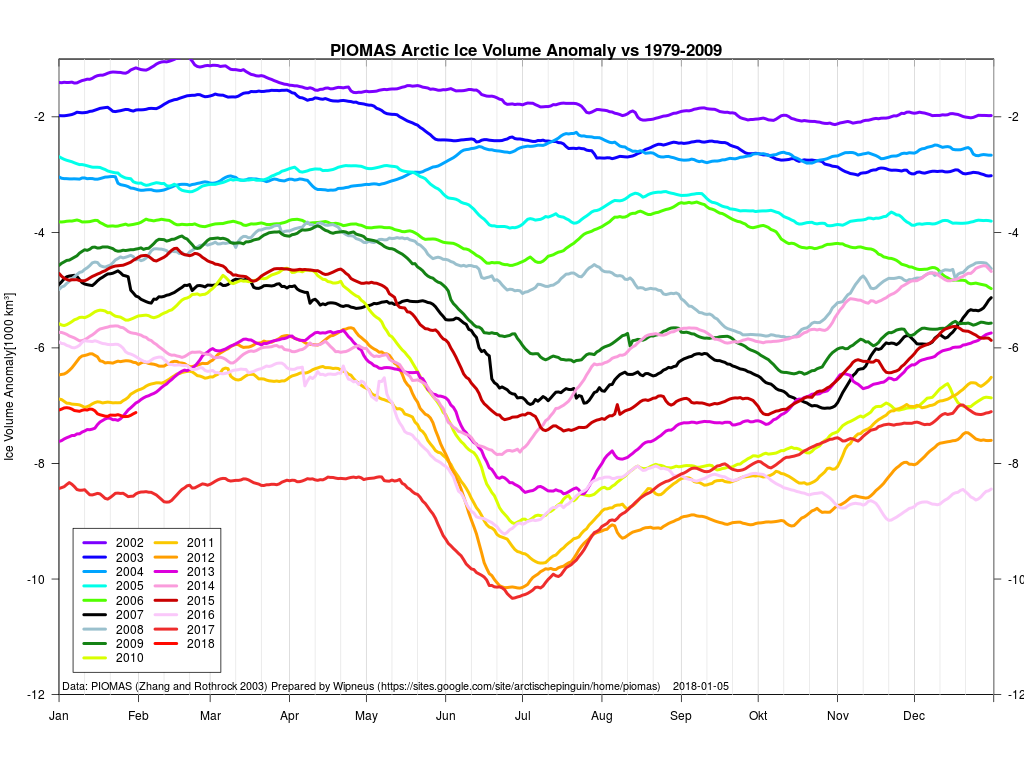
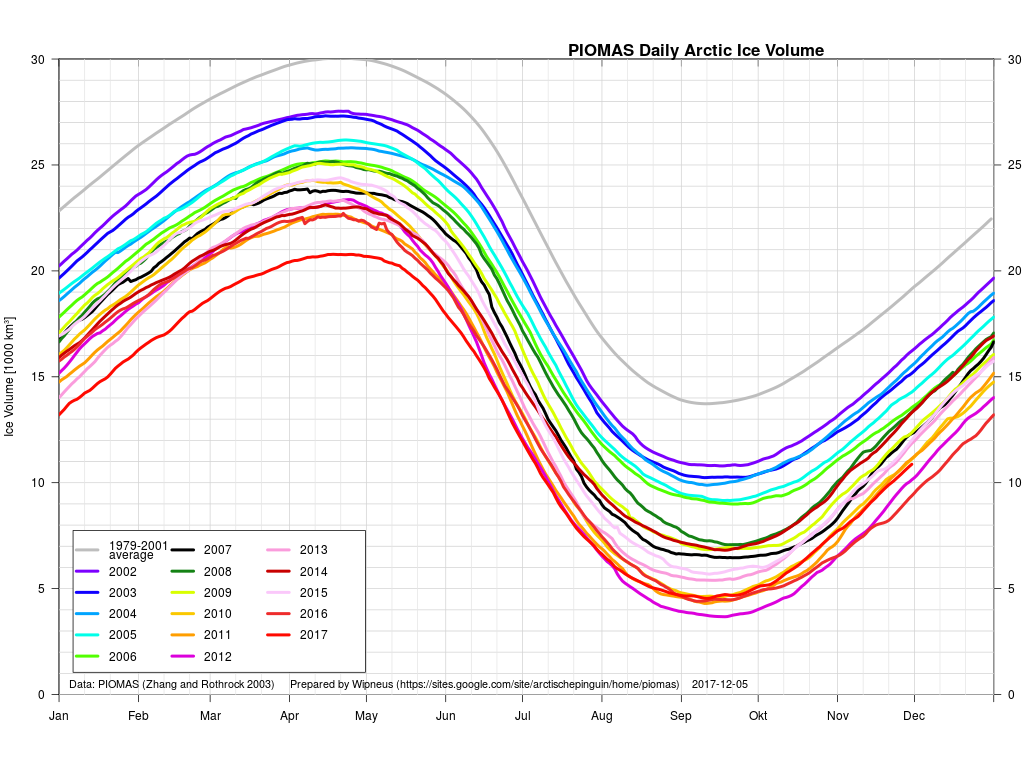
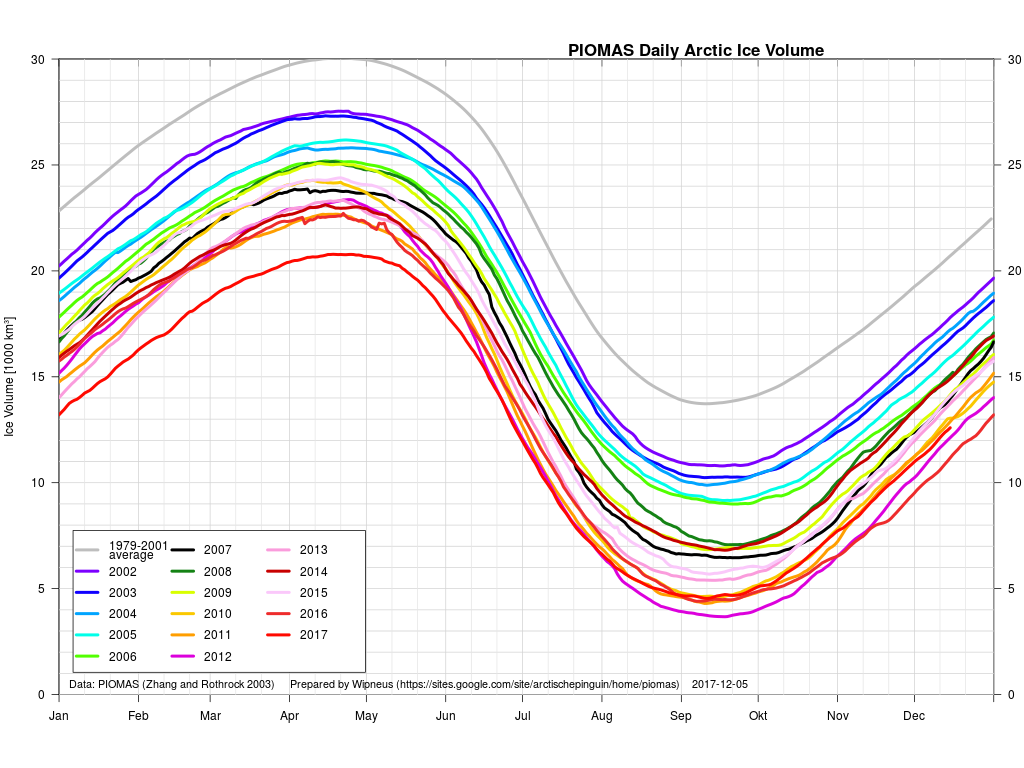
Here too is the latest PIOMAS volume graph:
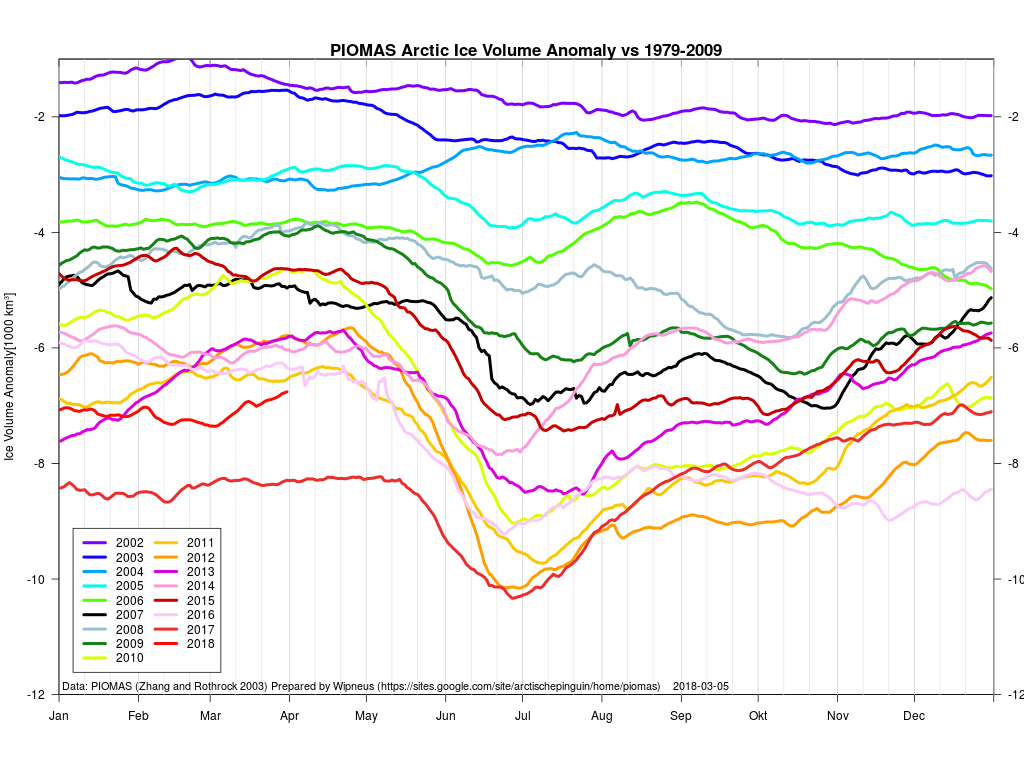
together with the associated anomaly graph:
They show 2018 still in second lowest position, albeit much closer to third place than last year’s line, which is currently leading the pack by a considerable margin.
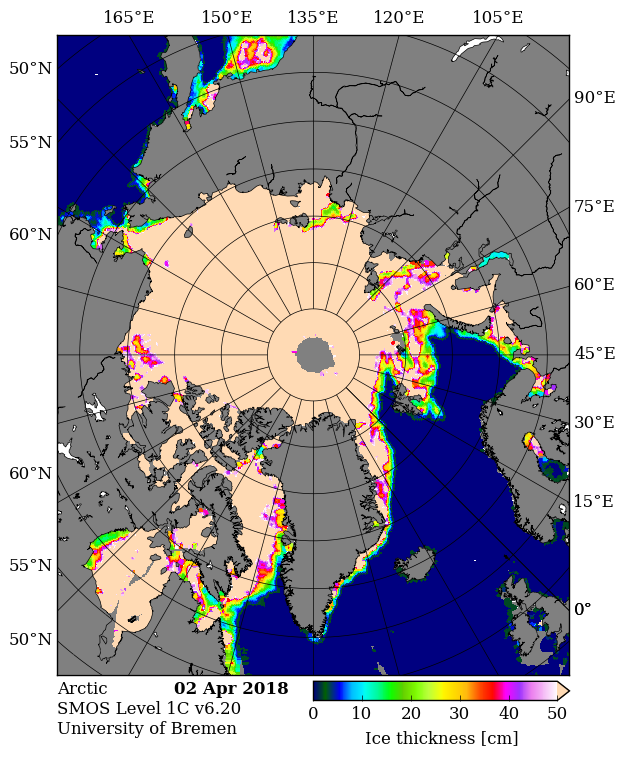
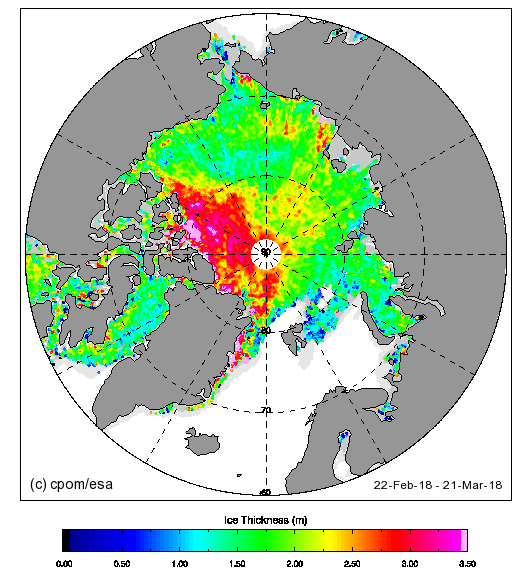
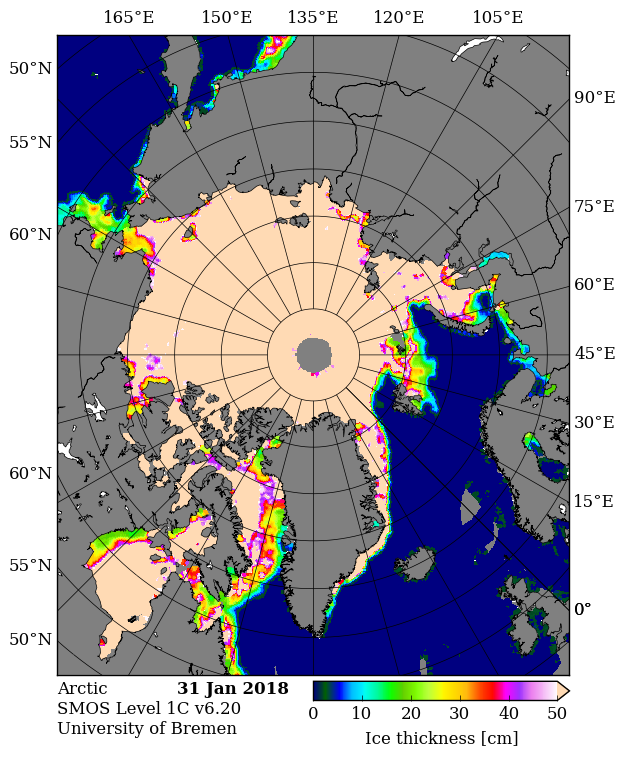
By way of comparison here are the current Arctic sea ice thickness maps from SMOS:
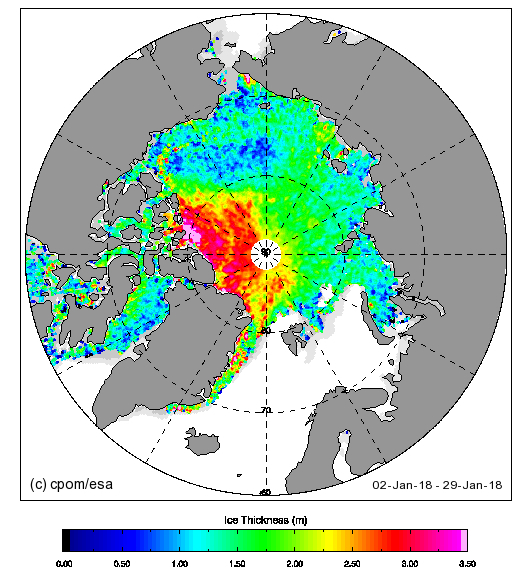
and CryoSat-2:
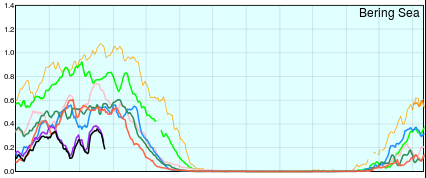
All eyes are still on the Bering and Chukchi Seas, where significant extent declines look likely over the coming days.
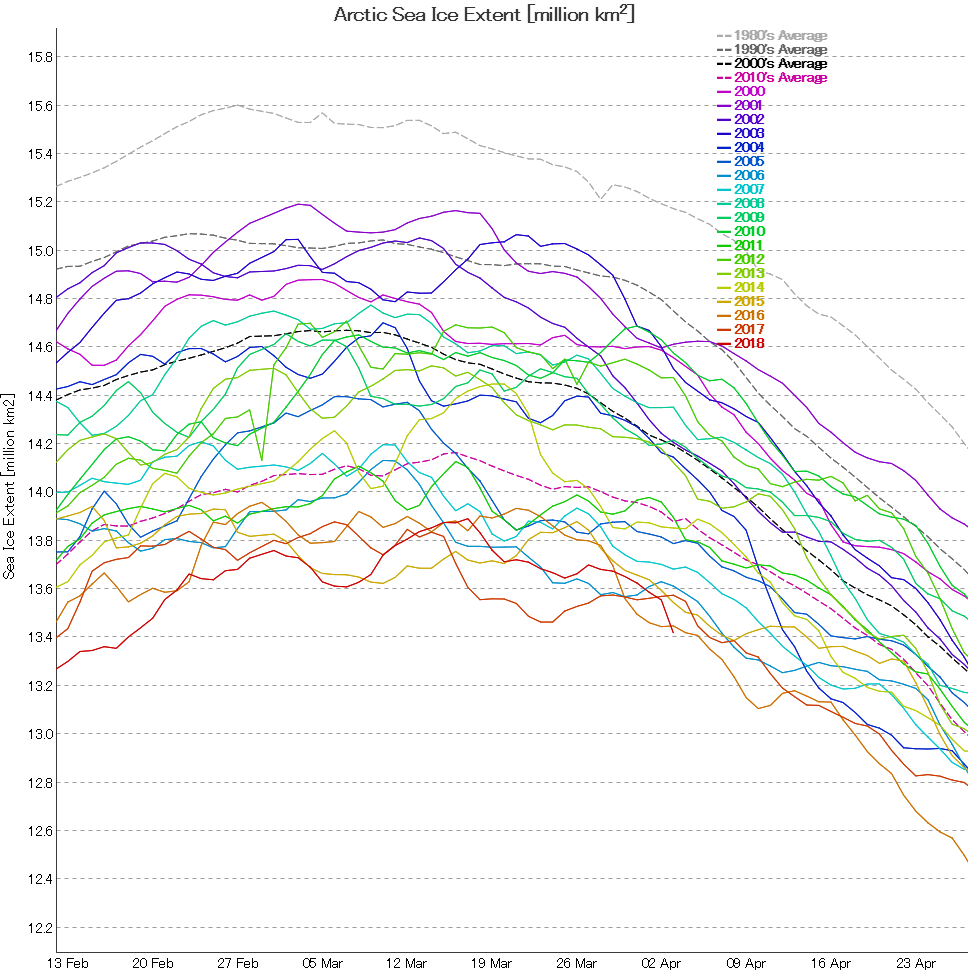
Meanwhile “JAXA” extent has just edged above 2016!
[Edit – April 11th]
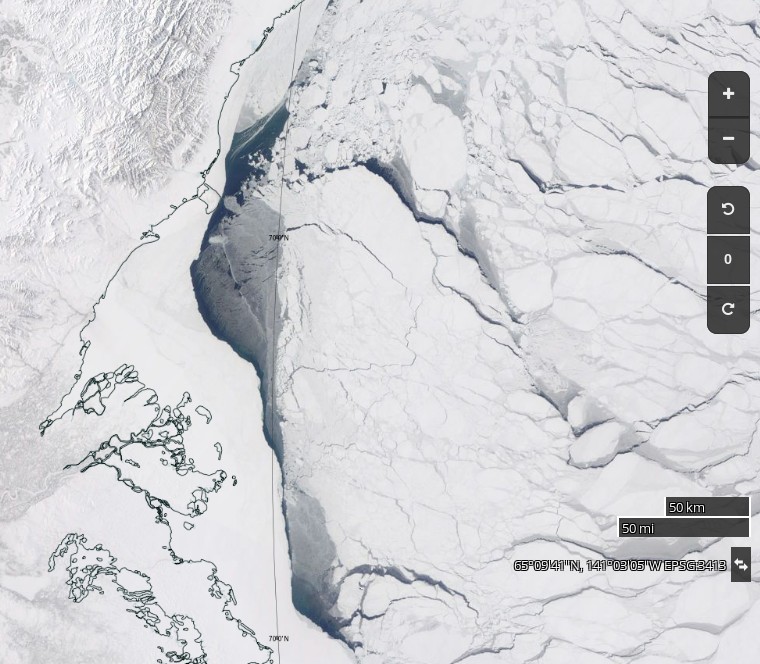
The focus has been on the Bering and Chukchi Seas until now. However there were clear skies over the Mackenzie Delta yesterday, revealing some open(ish) areas in the Beaufort Sea:
NASA Worldview “true-color” image of the Beaufort Sea on April 10th 2018, derived from the MODIS sensor on the Terra satellite
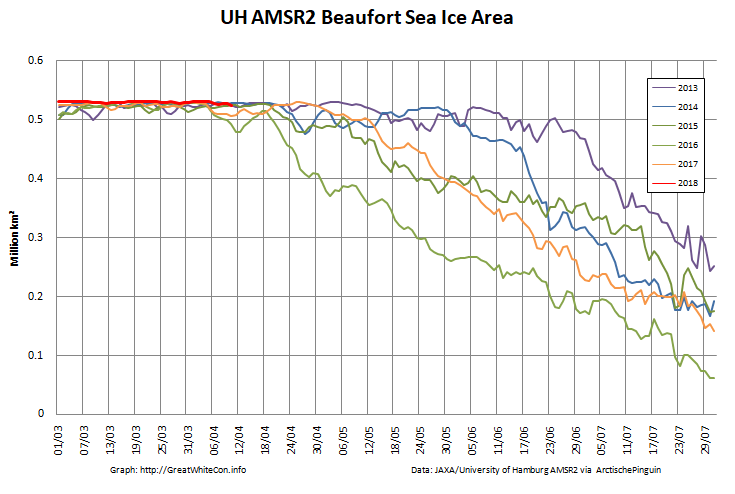
There’s only the merest hint of a blip on the area graph so far though:
It will be interesting to see if the decline in Beaufort Sea area continues from here, or whether this year’s “flatline” resumes and continues for a while longer.
[Edit – April 19th]
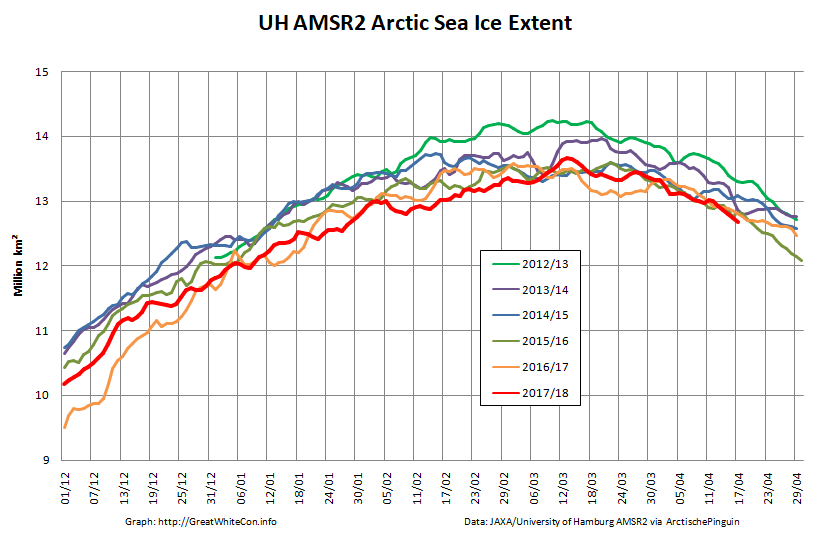
It’s not so apparent on the other extent metrics, but as the periphery melts the high resolution AMSR2 version looks to be heading into virgin territory on the downside:
According to the latest edition of the National Snow and Ice Data Center’s “Arctic Sea Ice News”
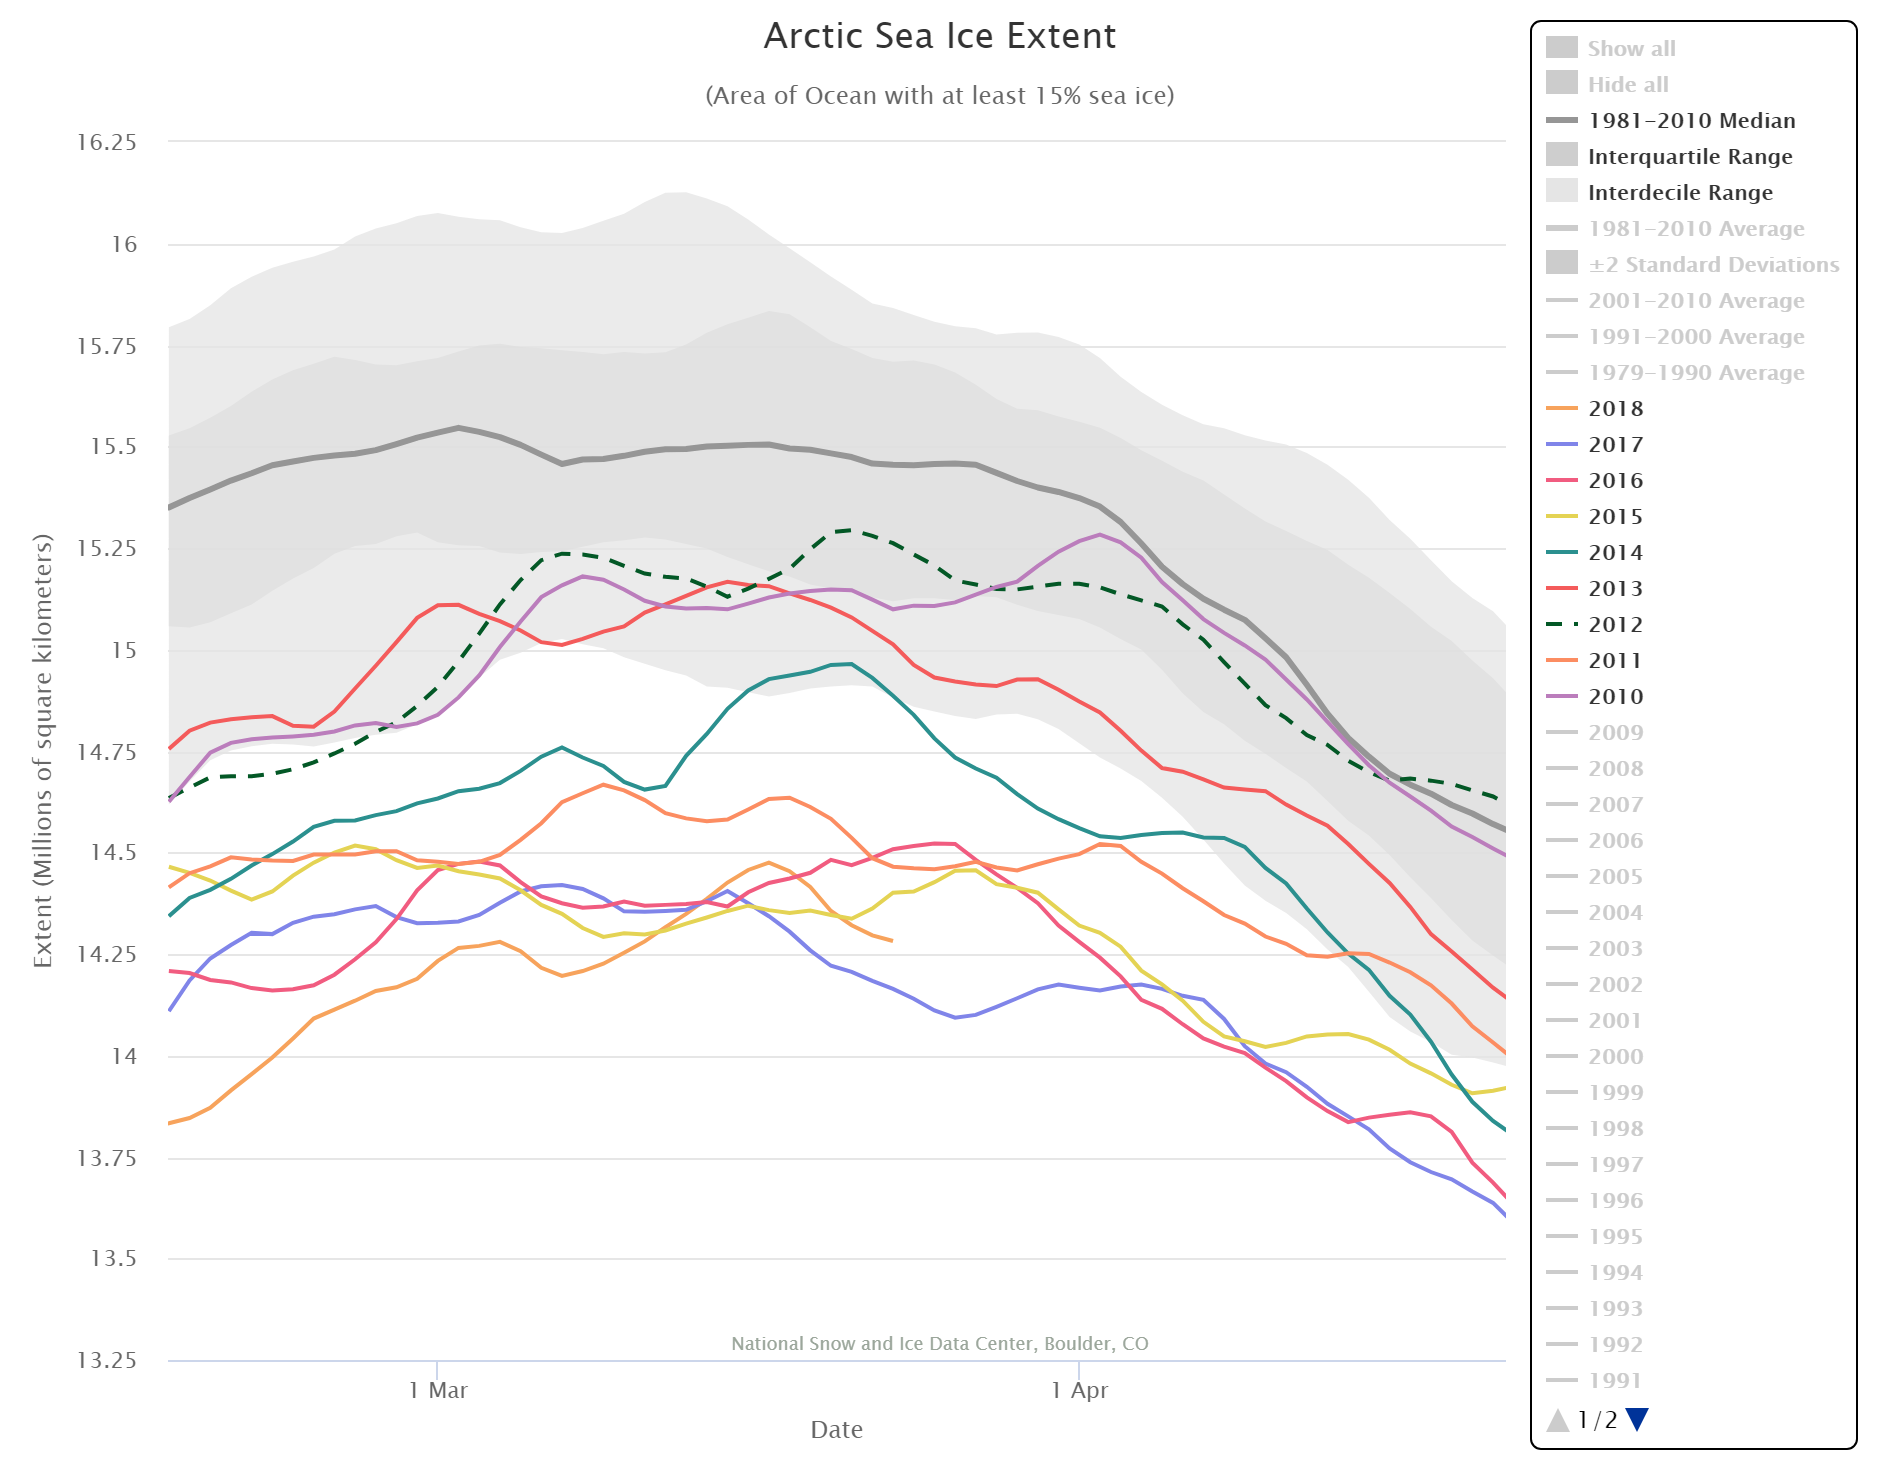
On March 17, 2018, Arctic sea ice likely reached its maximum extent for the year, at 14.48 million square kilometers (5.59 million square miles), the second lowest in the 39-year satellite record, falling just behind 2017. This year’s maximum extent is 1.16 million square kilometers (448,000 square miles) below the 1981 to 2010 average maximum of 15.64 million square kilometers (6.04 million square miles).
The four lowest seasonal maxima have all occurred during the last four years. The 2018 maximum is 60,000 square kilometers (23,200 square miles) above the record low maximum that occurred on March 7, 2017.
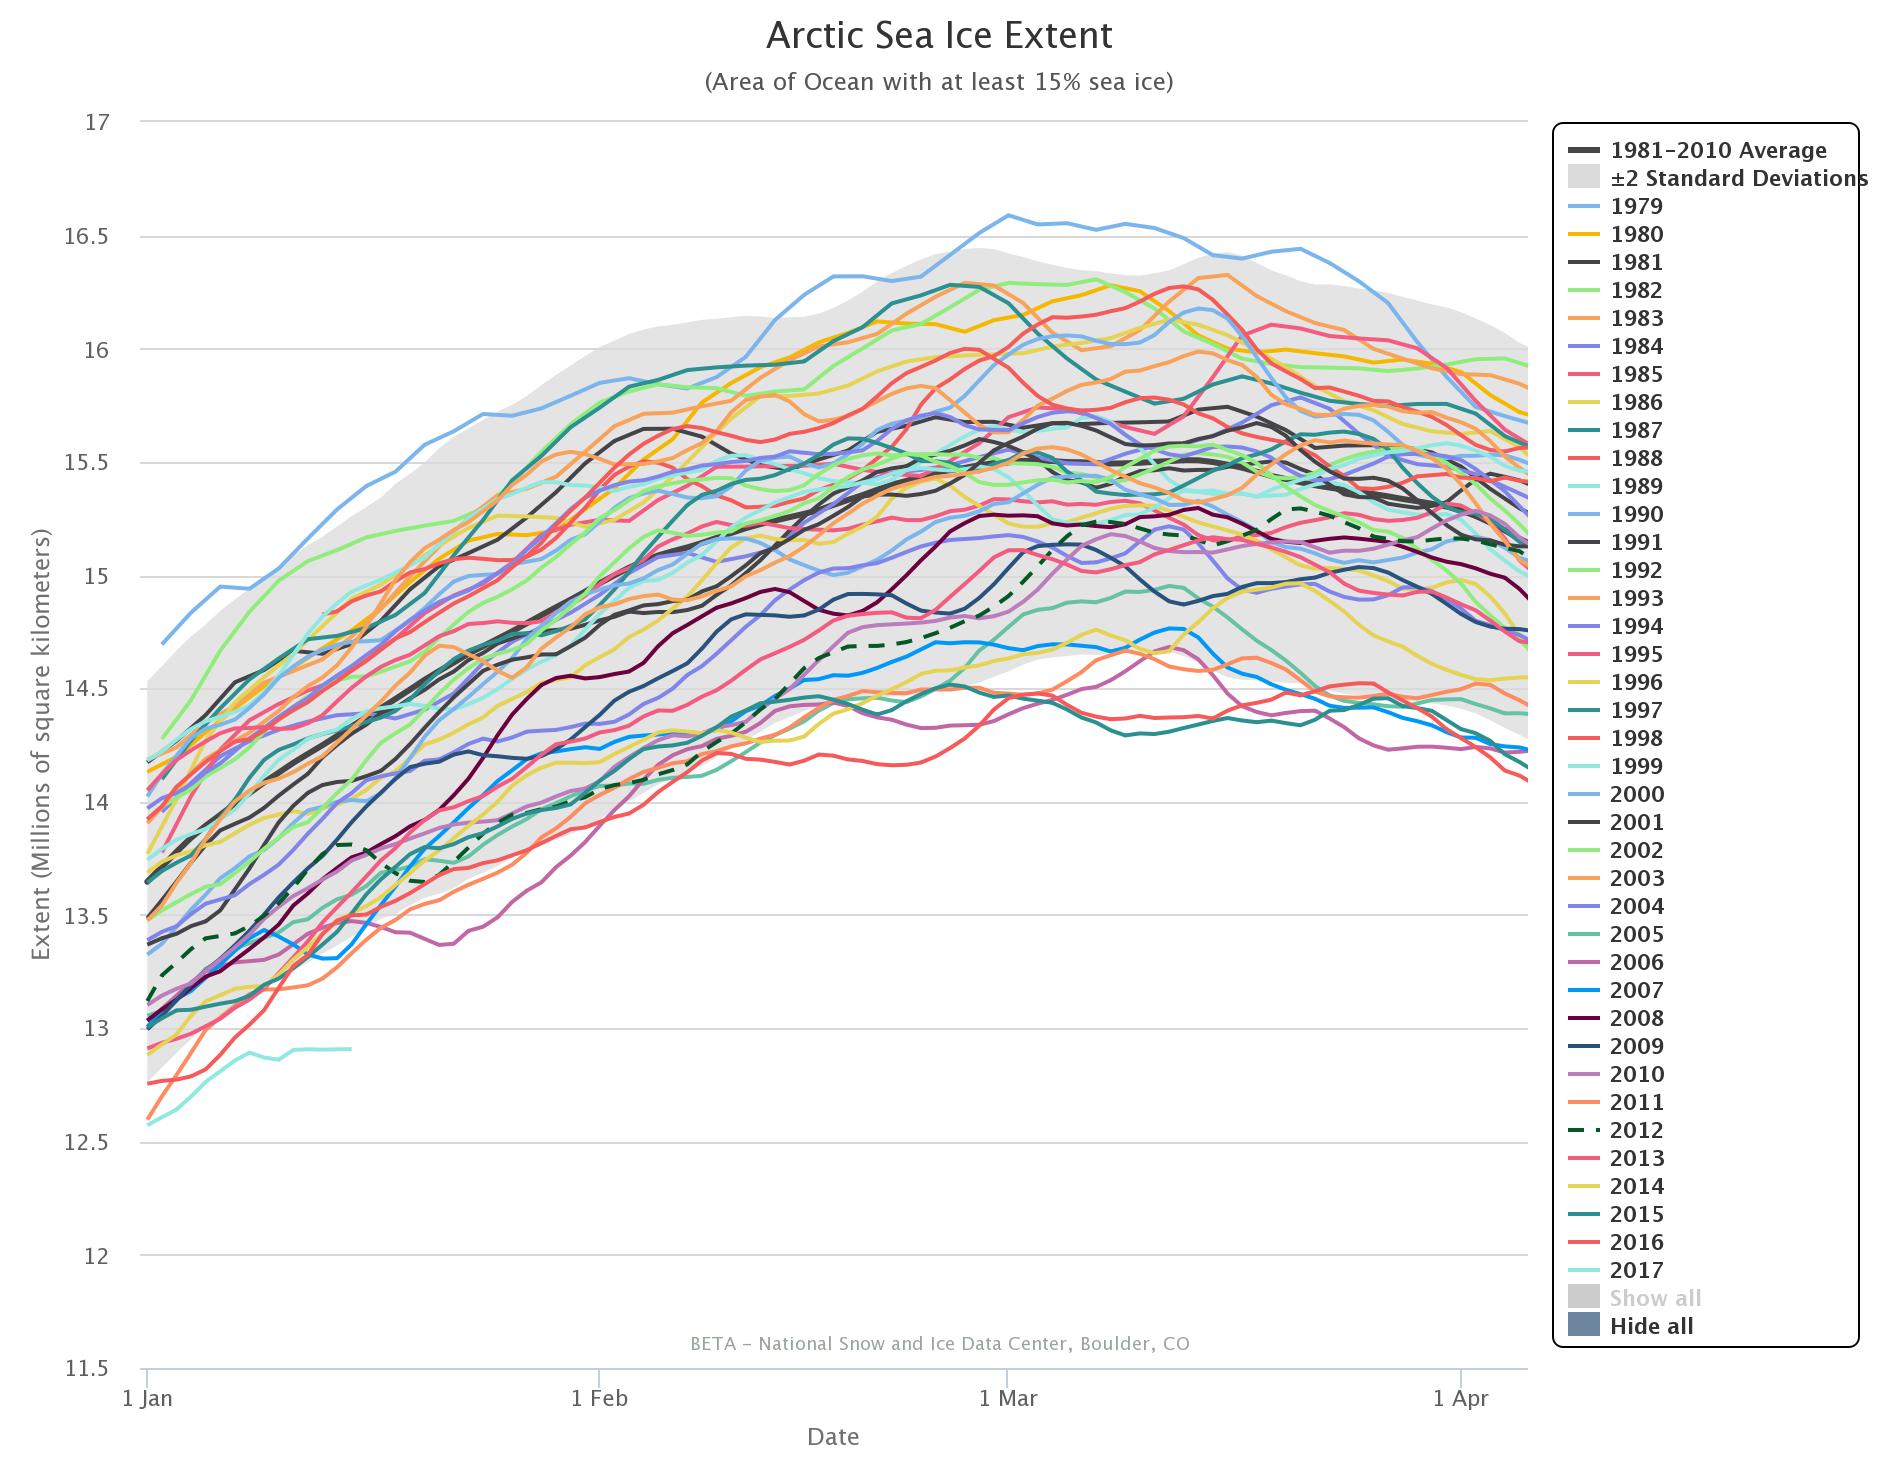
Here’s a close up view of recent maxima via the NSIDC’s Charctic interactive sea ice graph:
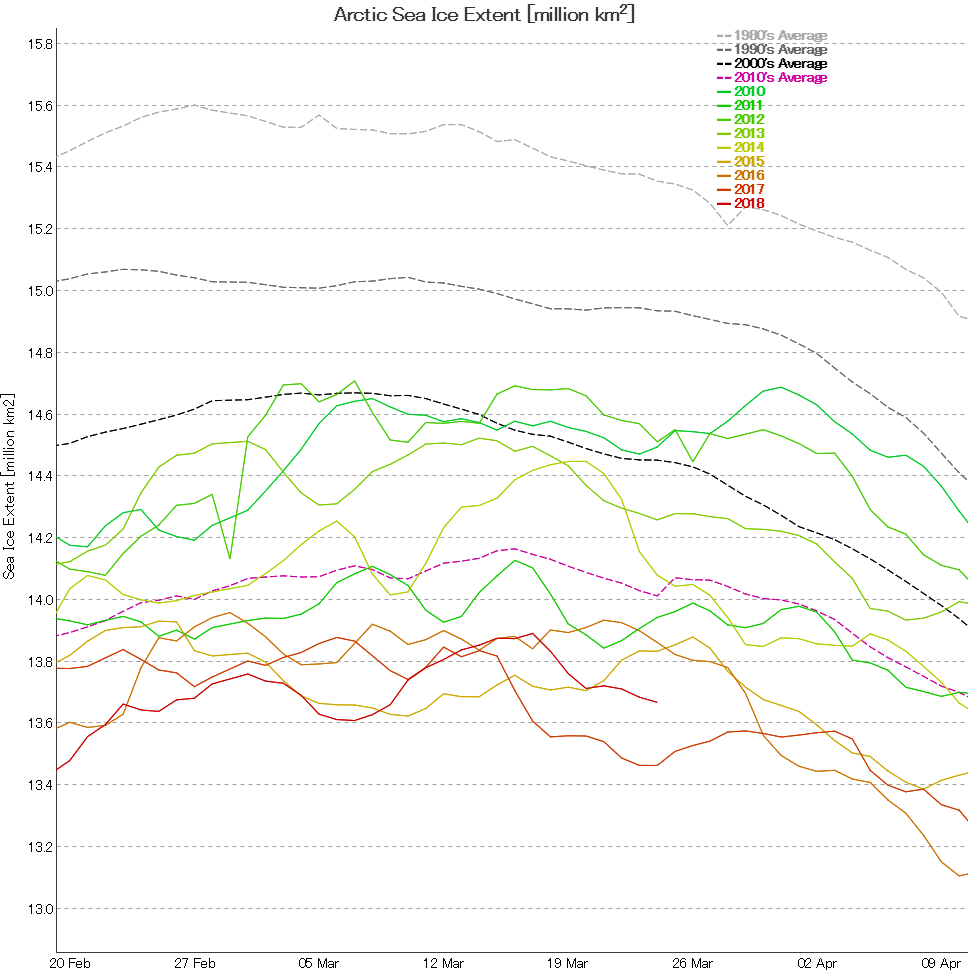
Next let’s take a look at extent data from the Japanese National Institute of Polar Research, colloquially referred to as “JAXA extent”
In this case the maximum was 13.89 million square kilometers, also on March 17th.
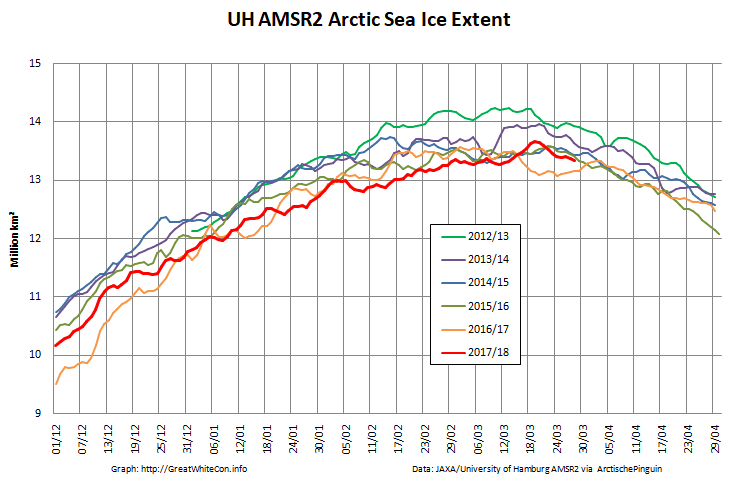
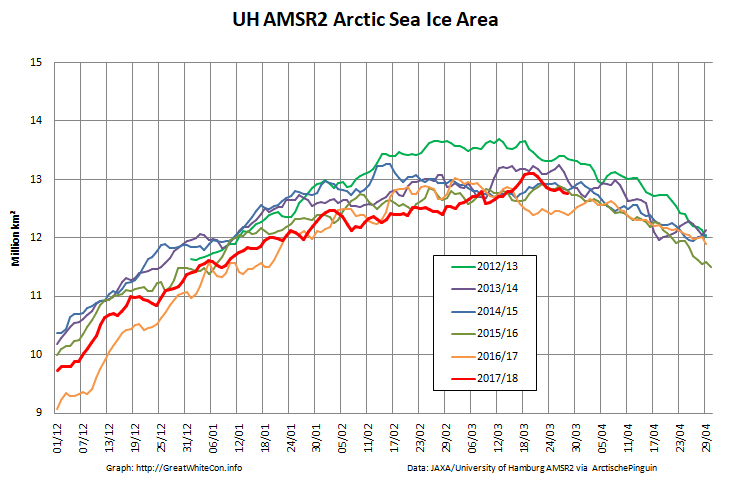
Here too are the extent and area graphs based on Wipneus’ processing of the University of Hamburg’s AMSR2 based concentration data:
They highlight the surge in Arctic sea ice area in the middle of March due to the sudden “cold snap”:
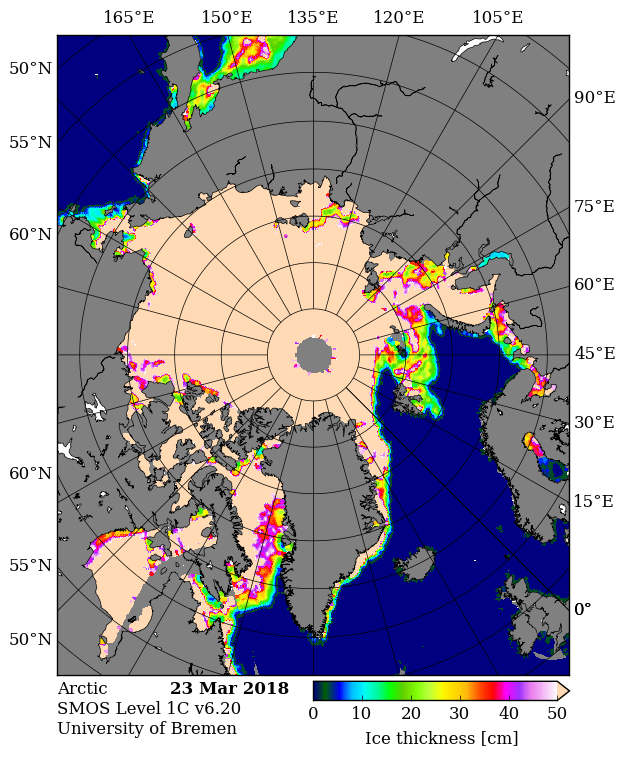
Looking at the third Arctic dimension, here’s the latest SMOS thickness map from the University of Bremen:
and here’s the latest CryoSat-2 thickness map:
They reveal large areas of relatively thin sea ice in the Okhotsk and Barents Seas where the ice can now be expected to melt as quickly as it formed. There is also remarkably little sea ice in the Bering Sea for the time of year:
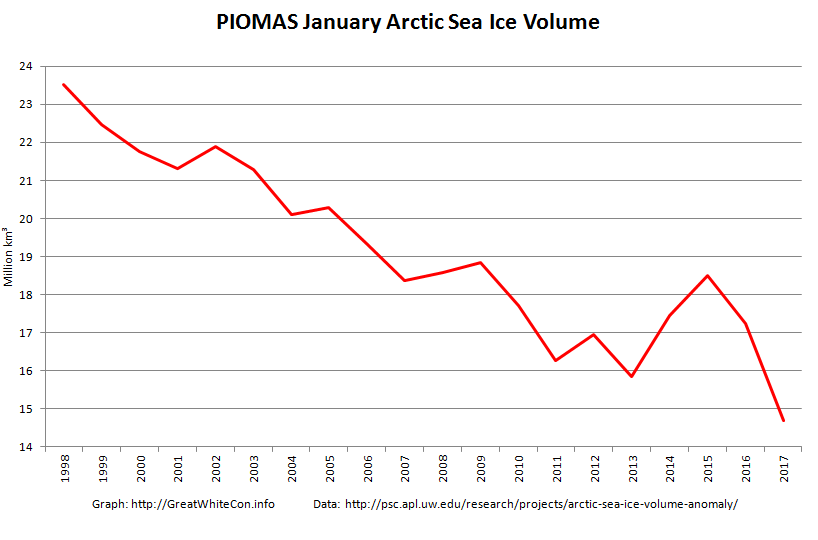
Whilst the official PIOMAS volume figures for January have yet to be released Wipneus has worked his usual magic on the gridded thickness numbers to reveal:
not to mention the calculated volume:
and the volume anomaly:
As Wipneus puts it:
Estimated from the thickness data, the latest value is from 31st of January: 17.57 [1000 km3], which is the second lowest value for that day, 2017 is lowest by a rather large margin at 16.16 [1000 km3].
Here are the “measured” thickness maps from SMOS:
and CryoSat-2:
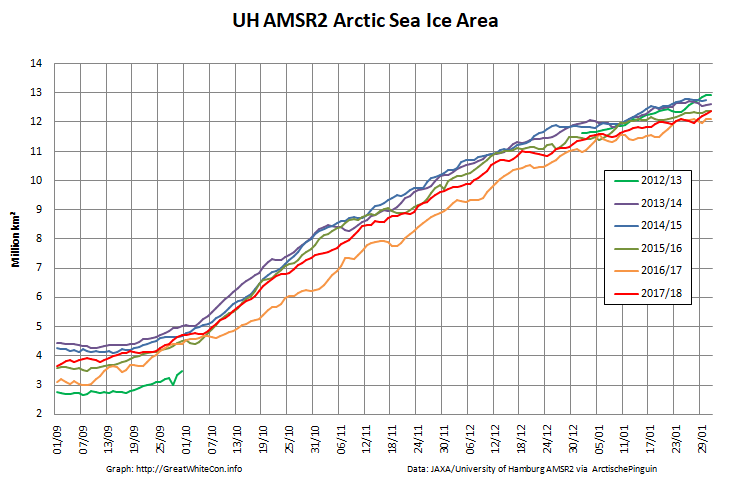
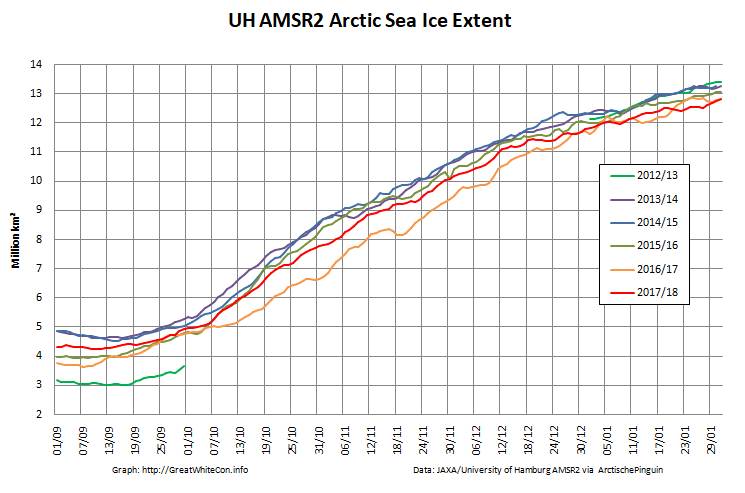
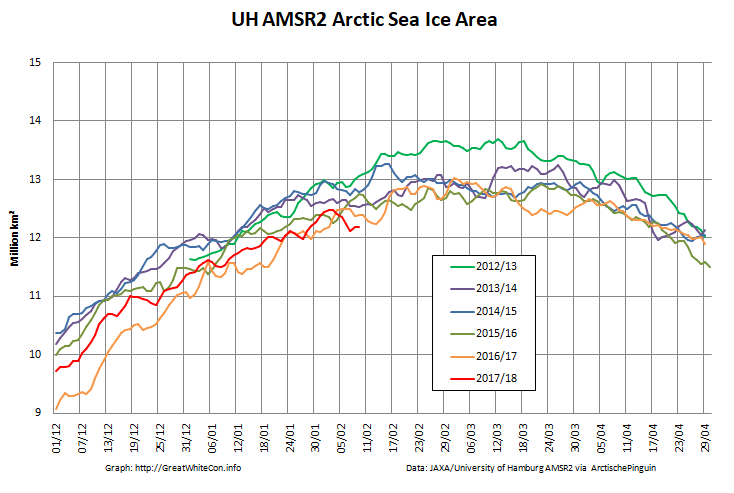
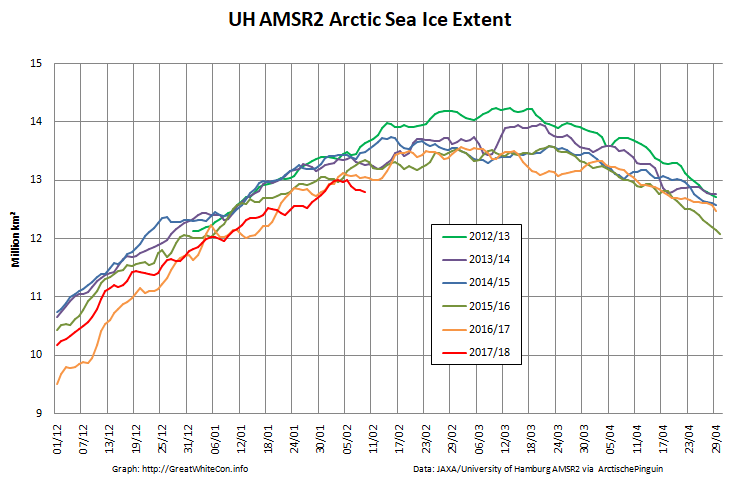
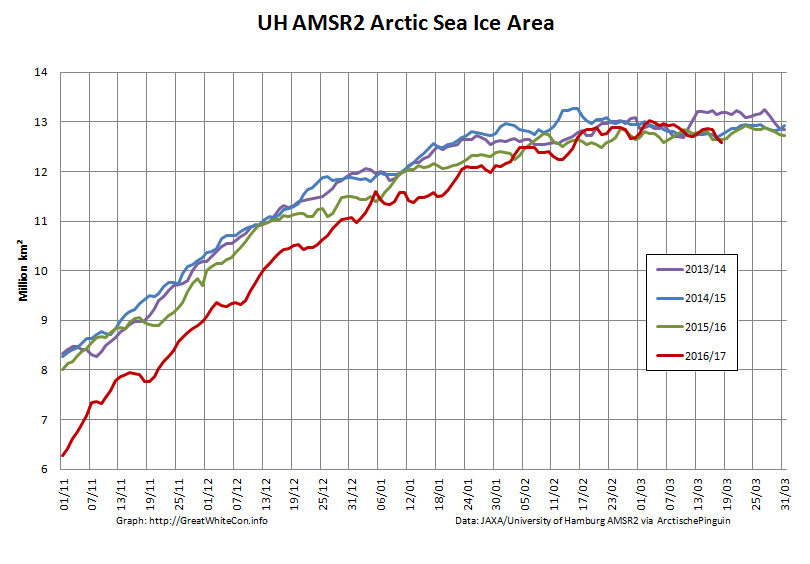
Here are the end of January Arctic wide high resolution AMSR2 graphs based on University of Hamburg data:
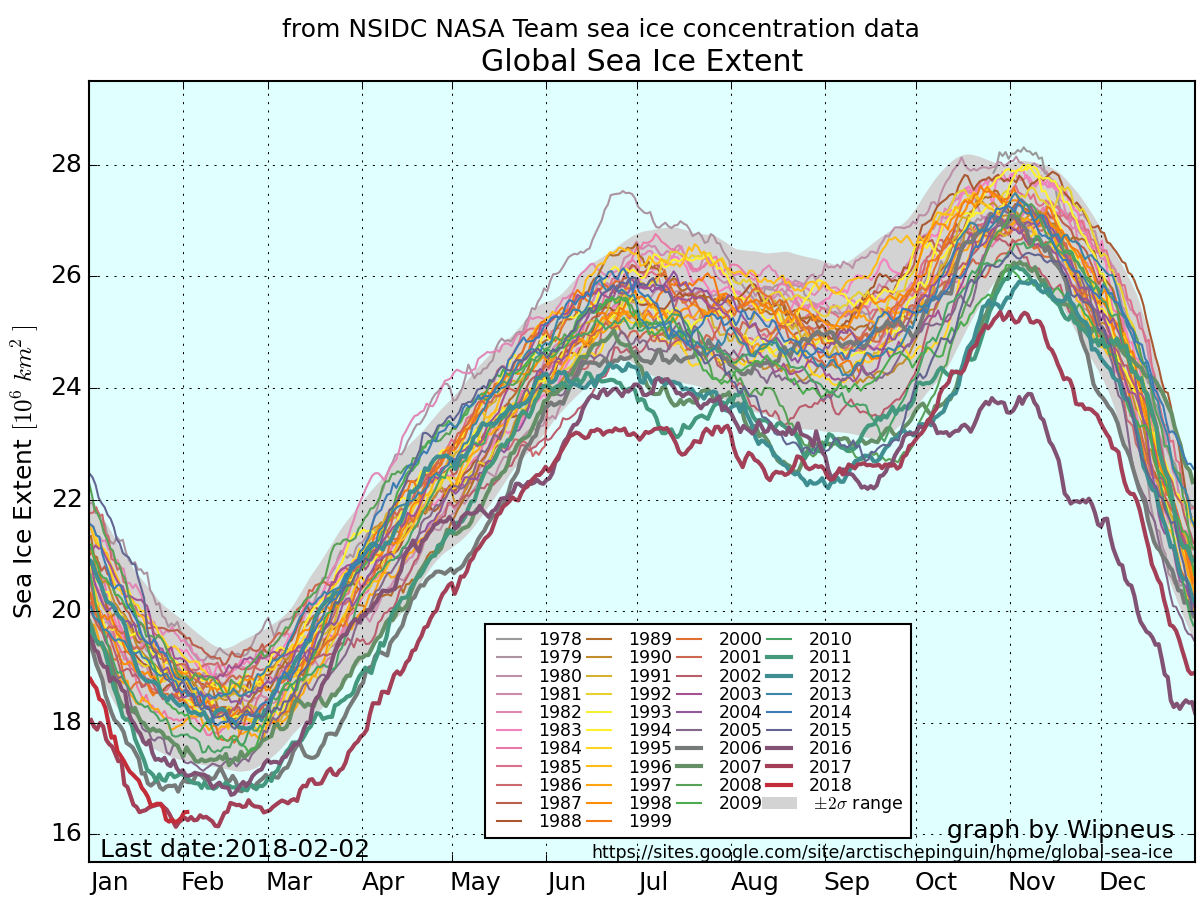
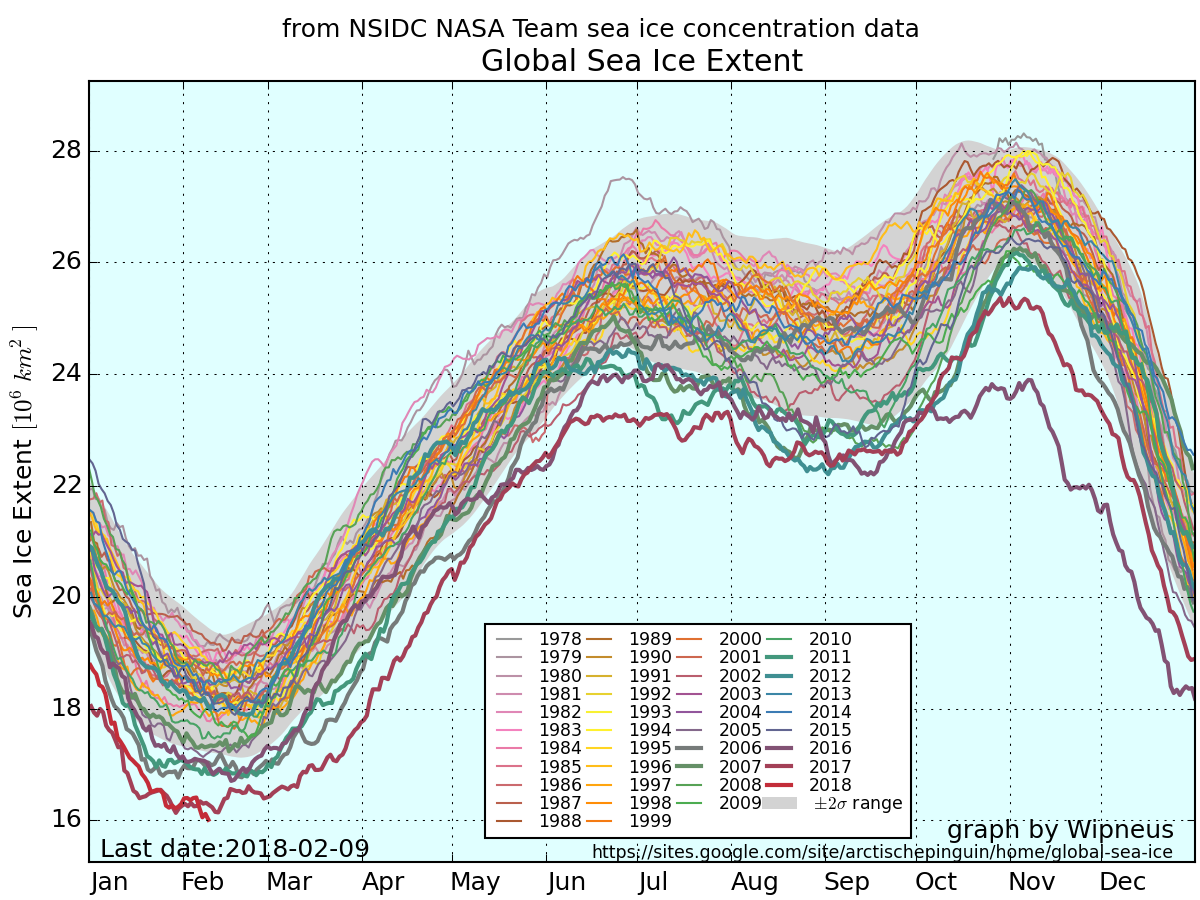
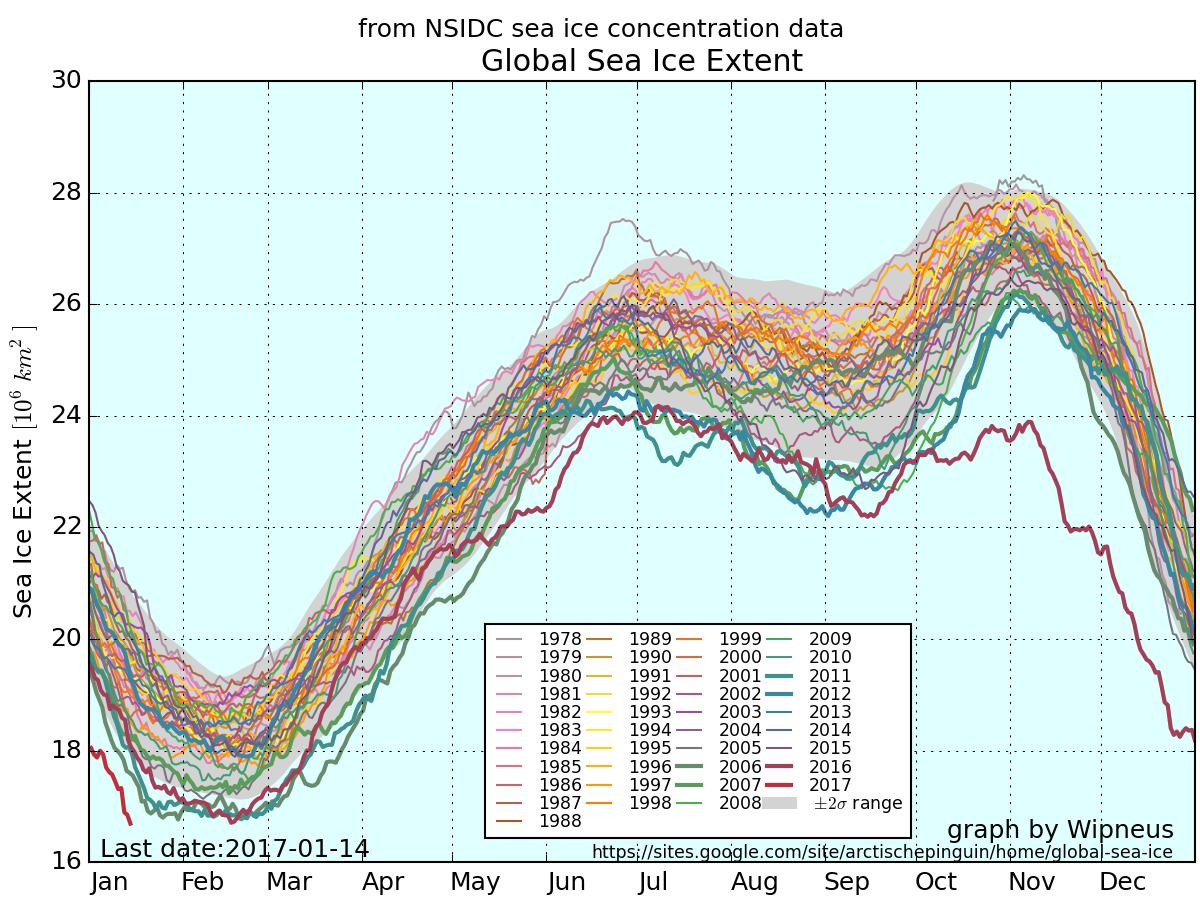
In addition, since it’s that time of year, here too is Wipneus’ NSIDC global sea ice extent:
The minimum thus far is very slightly above last year’s value, but perhaps like last year there will be a “double dip”?
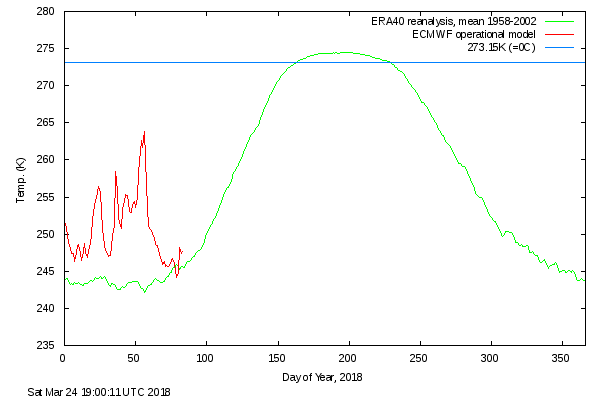
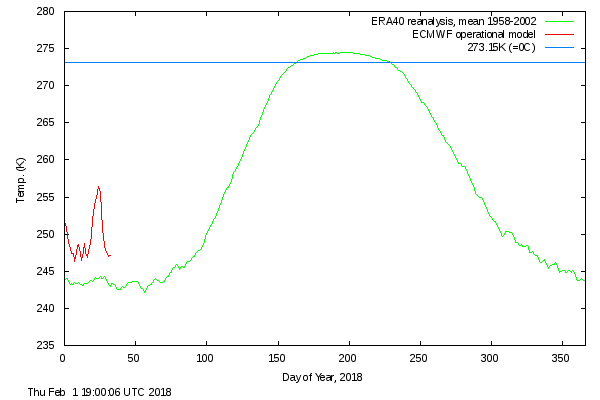
Getting back to the Arctic, here is the DMI >80N temperature plot for January:
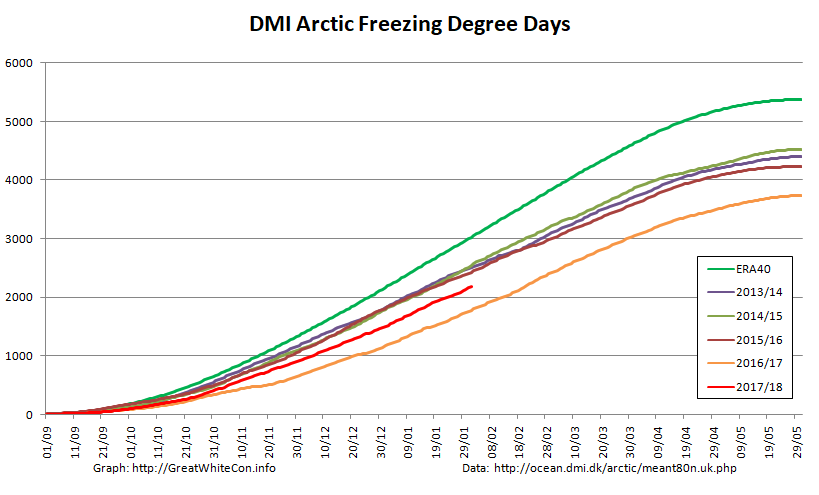
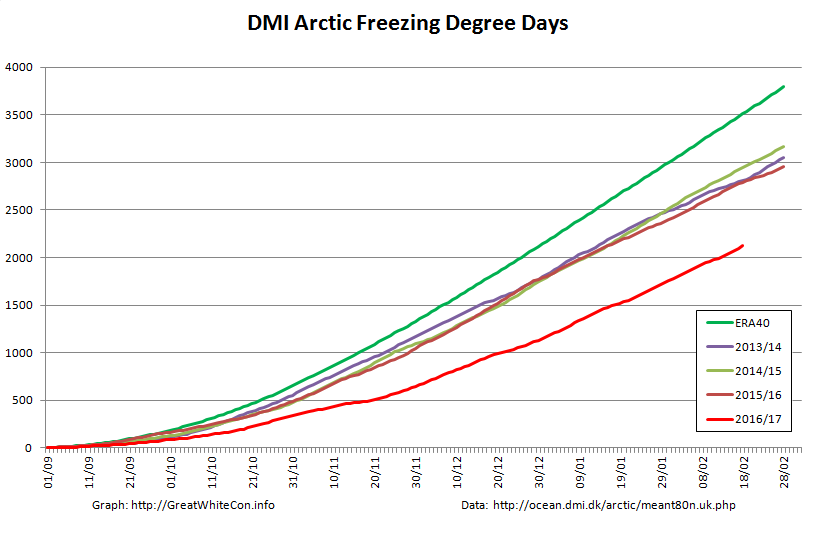
together with the associated freezing degree days graph:
Here’s a video showing the effect of the mid January cyclones on the sea ice in the Fram Strait and north of Svalbard:
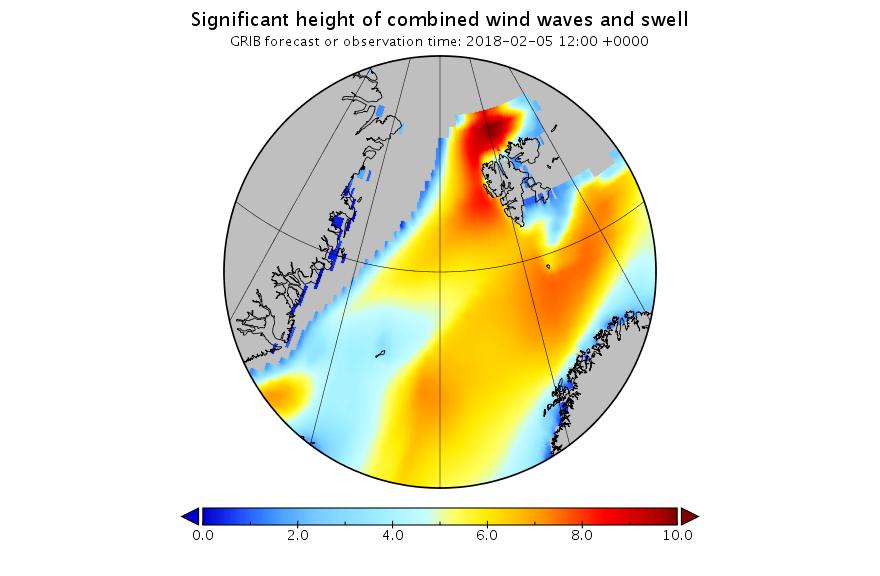
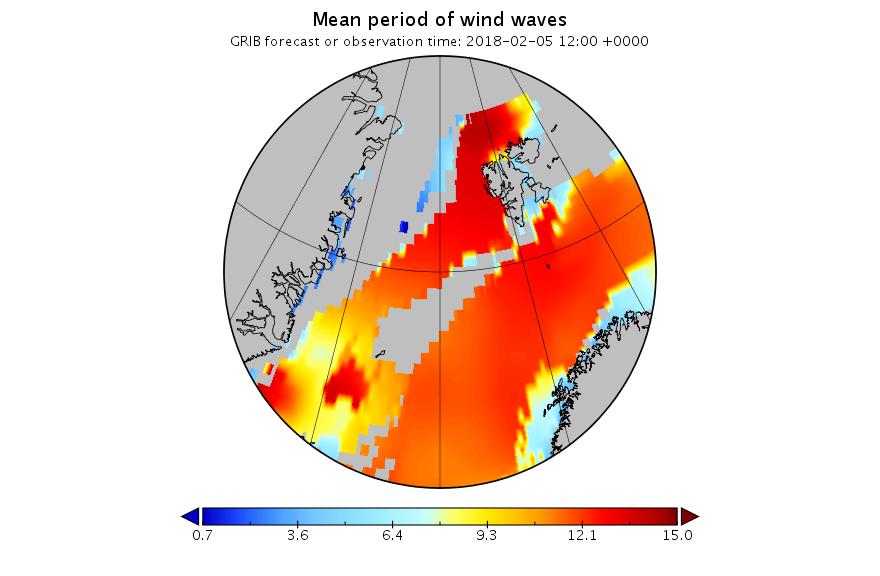
Finally, for the moment at least, here is the current Fram Strait surf forecast for 12:00 UTC on February 5th:
The latest edition of Arctic Sea Ice News has been published. As the NSIDC put it:
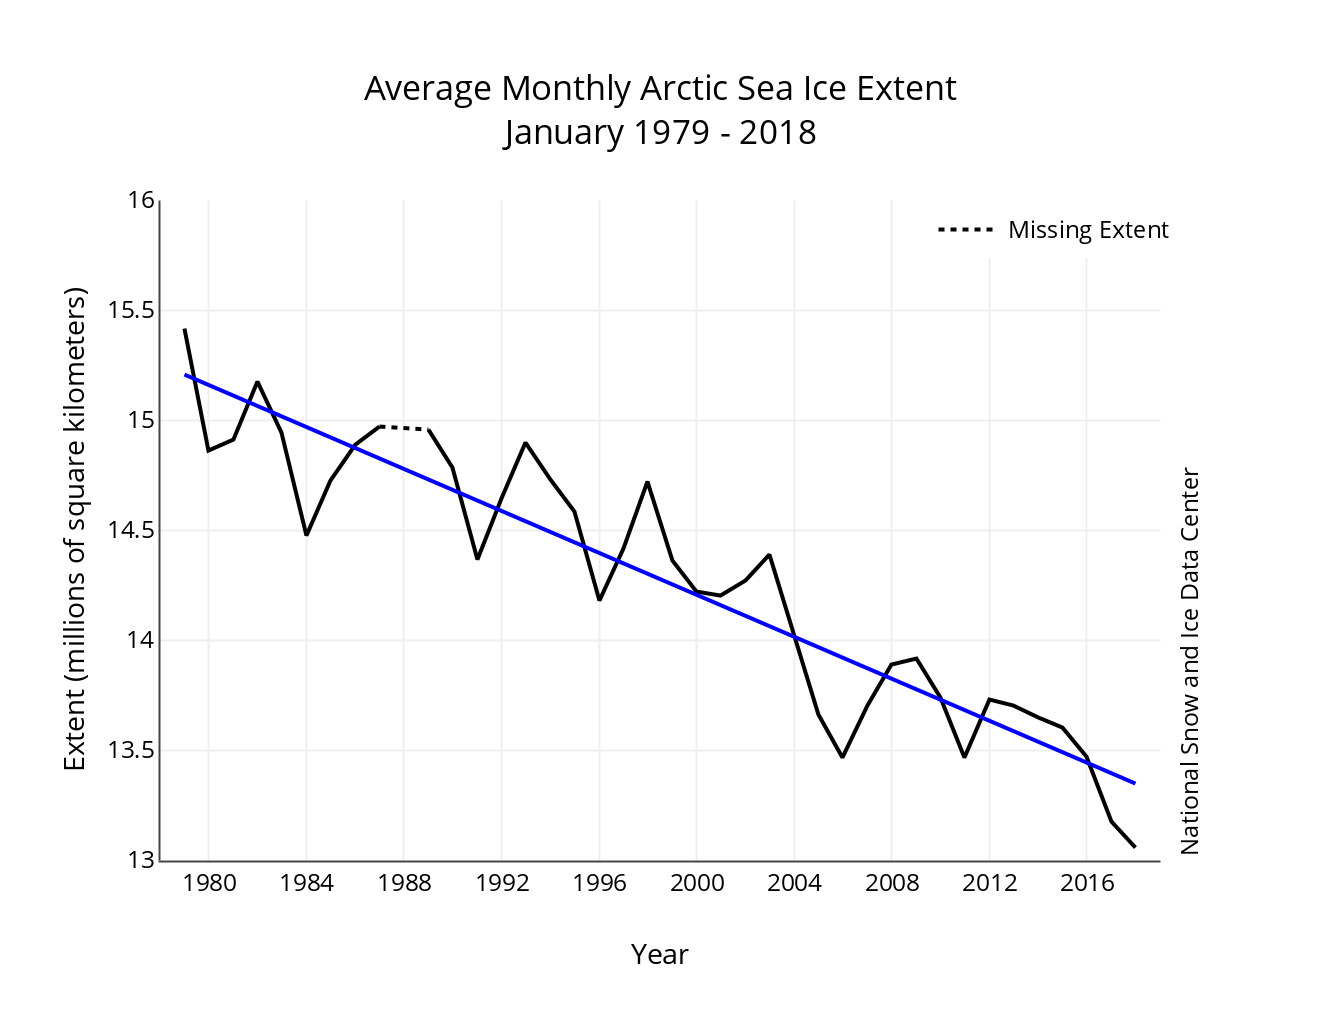
January of 2018 began and ended with satellite-era record lows in Arctic sea ice extent, resulting in a new record low for the month. Combined with low ice extent in the Antarctic, global sea ice extent is also at a record low.
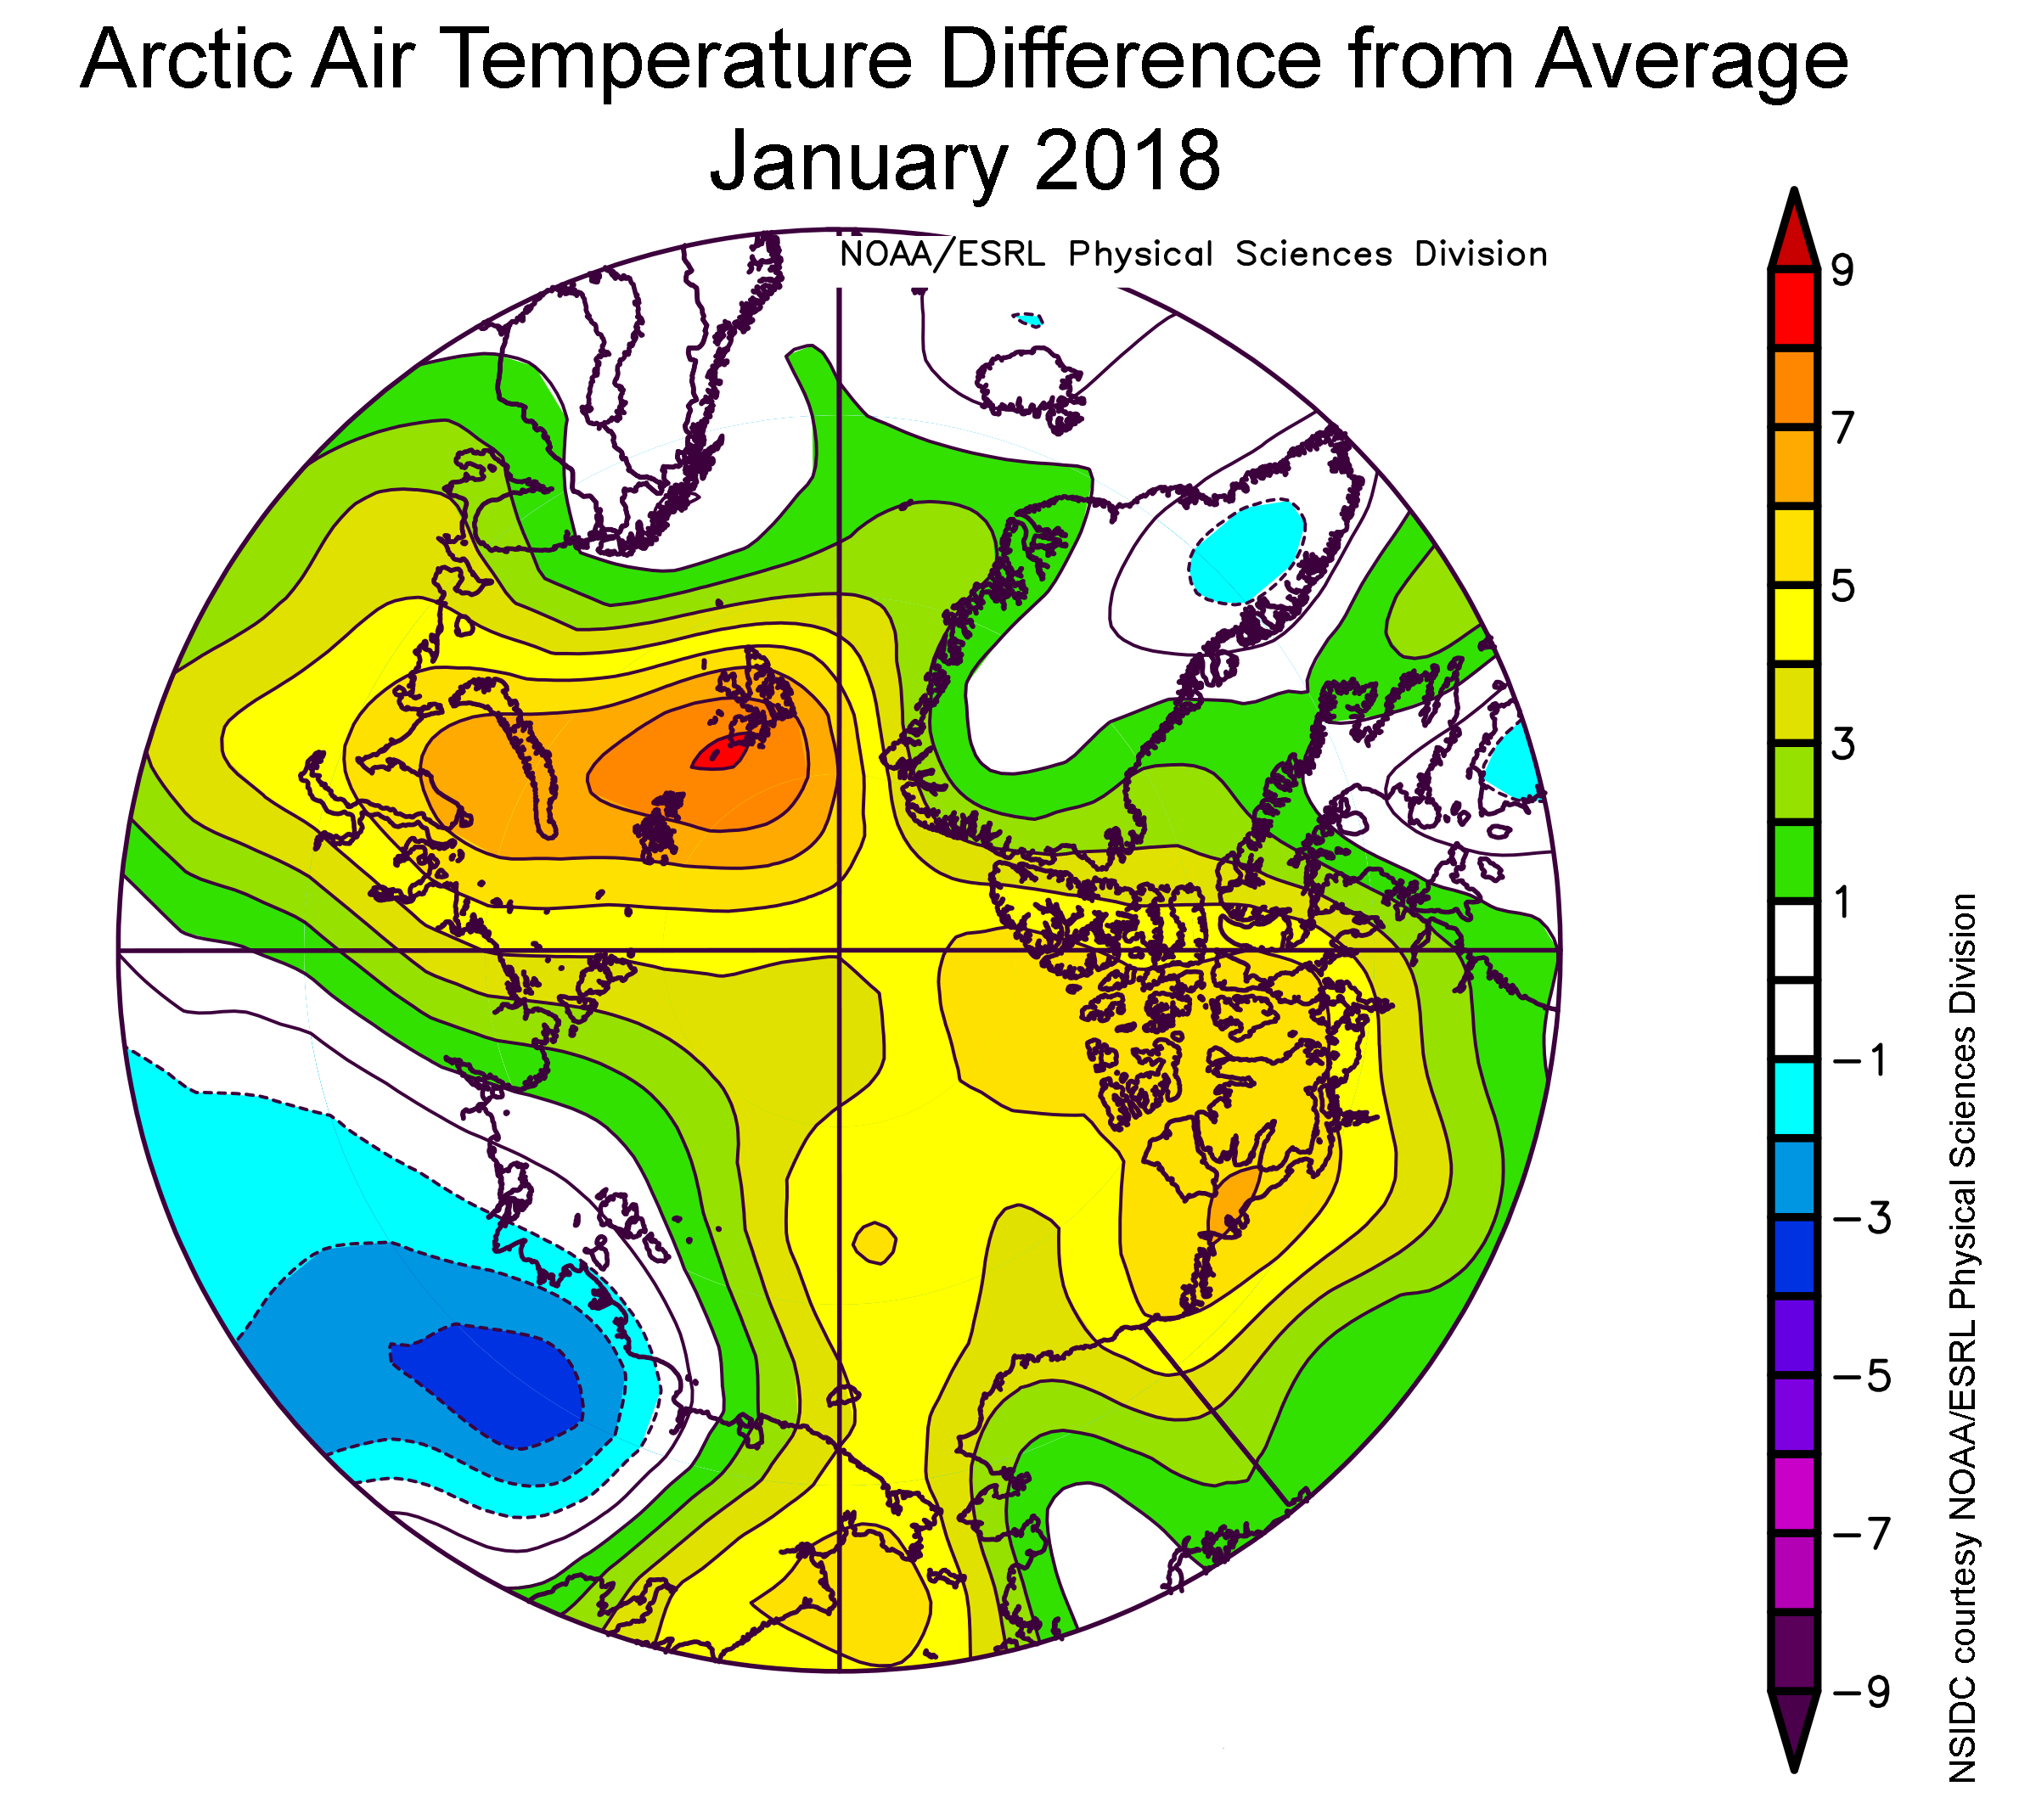
Air temperatures at the 925 hPa level (about 2,500 feet above sea level) remained unusually high over the Arctic Ocean. Nearly all of the region was at least 3 degrees Celsius (5 degrees Fahrenheit) or more above average. The largest departures from average of more than 9 degrees Celsius (16 degrees Fahrenheit) were over the Kara and Barents Seas, centered near Svalbard. On the Pacific side, air temperatures were about 5 degrees Celsius (9 degrees Fahrenheit) above average. By contrast, 925 hPa temperatures over Siberia were up to 4 degrees Celsius (7 degrees Fahrenheit) below average. The warmth over the Arctic Ocean appears to result partly from a pattern of atmospheric circulation bringing in southerly air, and partly from the release of heat into the atmosphere from open water areas.
[Edit – February 10th]
The University of Hamburg’s high resolution AMSR2 derived area is bouncing back after the recent cyclone, but extent is currently still declining:
The recent drop in Arctic sea ice extent has pushed the NSIDC global extent to a new all time (satellite era!) low:
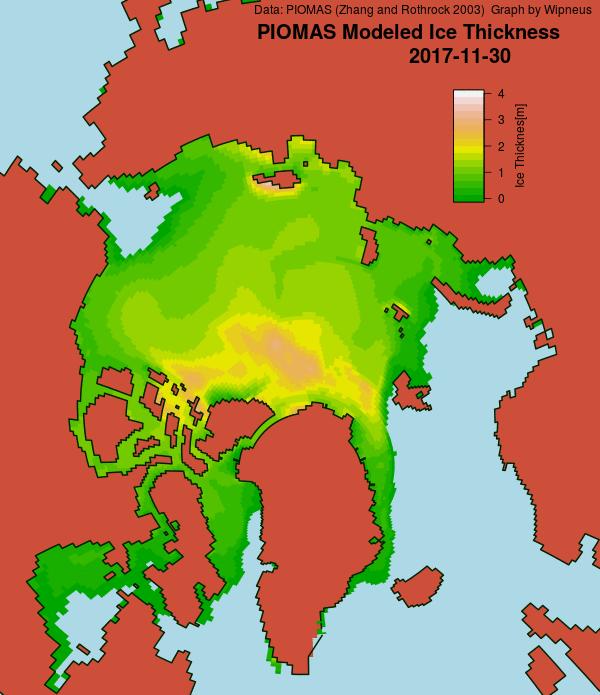
Christmas is coming, and Santa’s secret summer swimming pool has frozen over once again. However the same can’t be said for the Chukchi Sea! More on that in due course, but first let’s take a look at the PIOMAS volume graph at the end of November, courtesy of the wondrous Wipneus on the Arctic Sea Ice Forum:
2017 is currently third lowest, behind 2012 and 2016. Next let’s take a look at Wipneus’ PIOMAS Arctic sea ice thickness map:
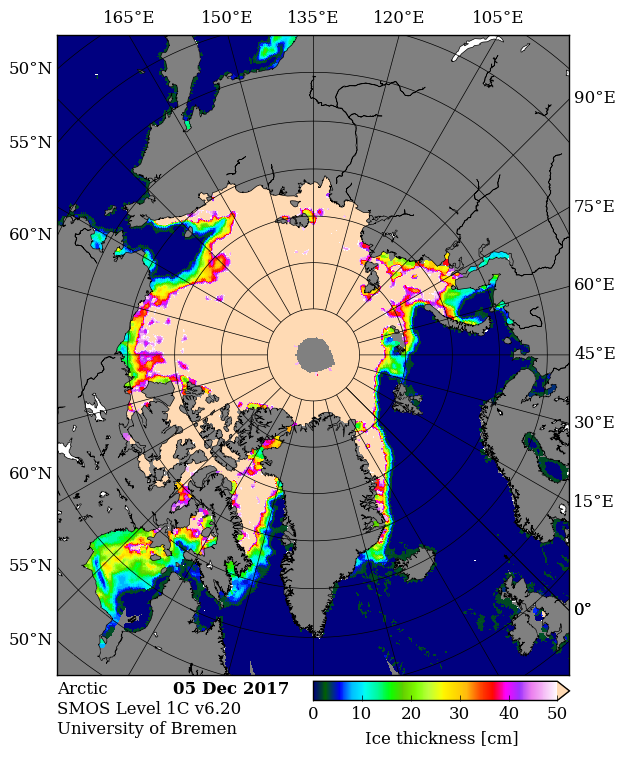
followed by the University of Bremen’s SMOS Arctic sea ice thickness map:
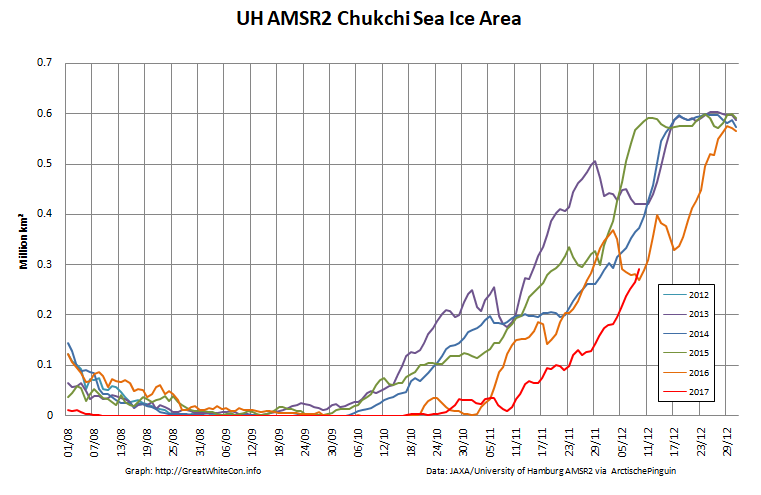
Note the large area of pale blue open ocean still visible in the Chukchi Sea towards the top left of both maps.
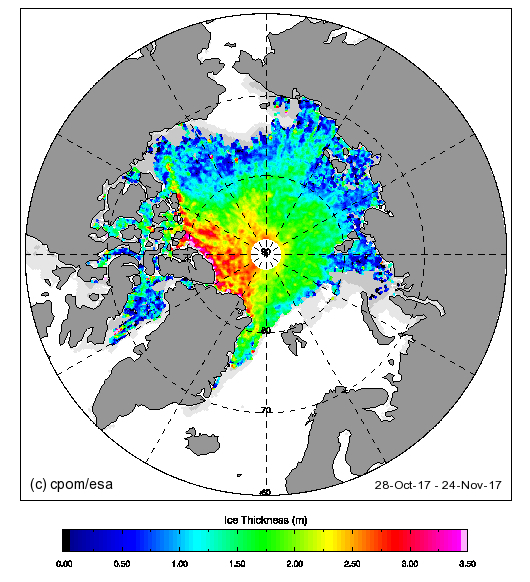
For another perspective on Arctic sea ice thickness here’s the latest Cryosat-2 map, which currently is based on the month up to November 24th:
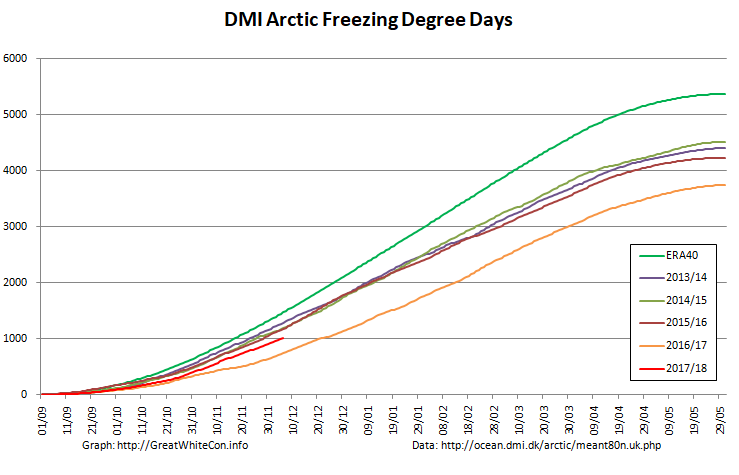
Finally, for the moment at least, here’s our very own Arctic Freezing Degree Days graph based on the DMI’s >80N data:
2017 is currently occupying the wide open space between the astonishingly low numbers last year and all previous years in DMI’s record. Here’s their graph for 2017 so far:
[Edit – December 10th]
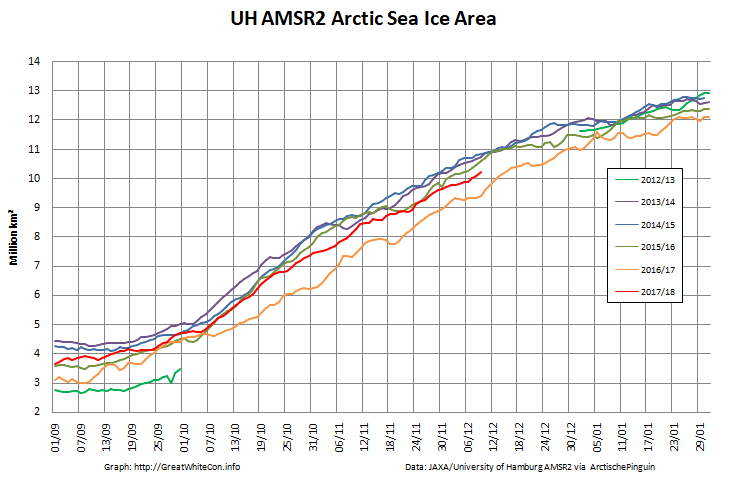
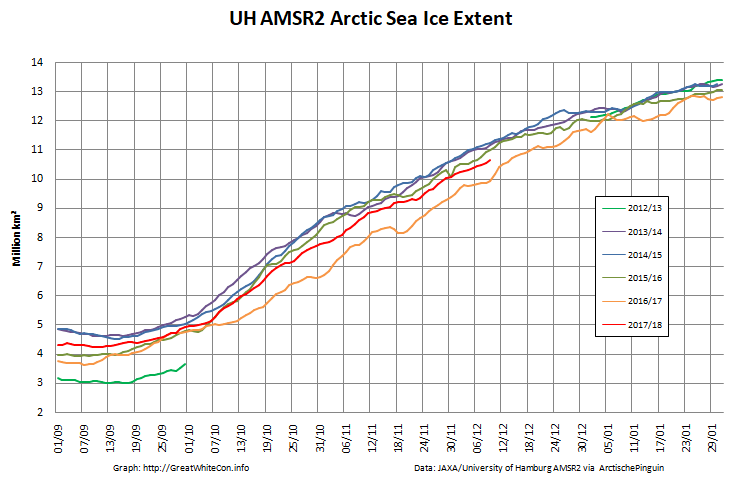
Current Arctic sea ice area and extent derived from the University of Hamburg’s high resolution AMSR2 data:
Plus the latest update on the Chukchi Sea situation:
September has arrived once again, the month in which the assorted Arctic area and extent metrics (almost) always reach their respective annual minima. Now we can start to speculate about what the assorted minima will be, and on what date.
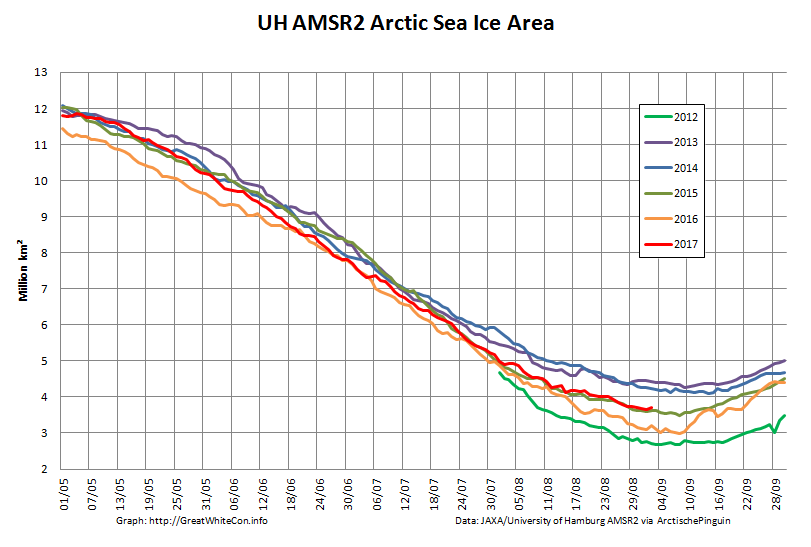
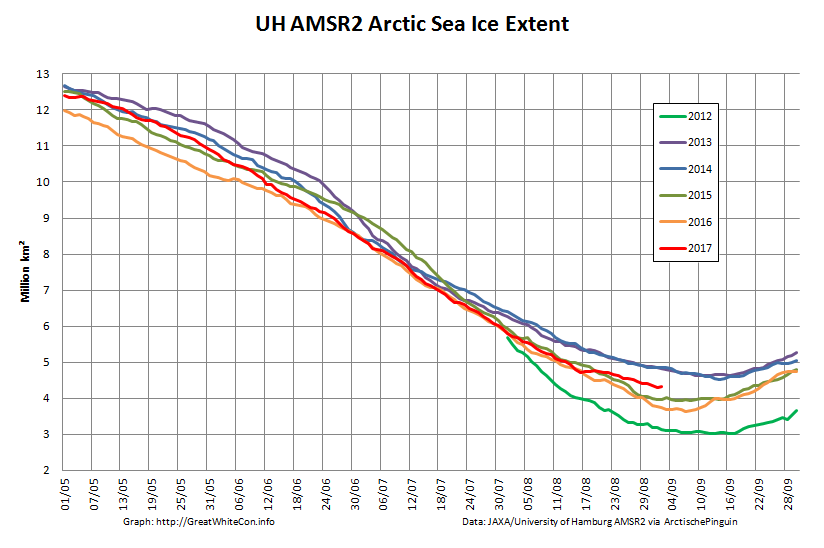
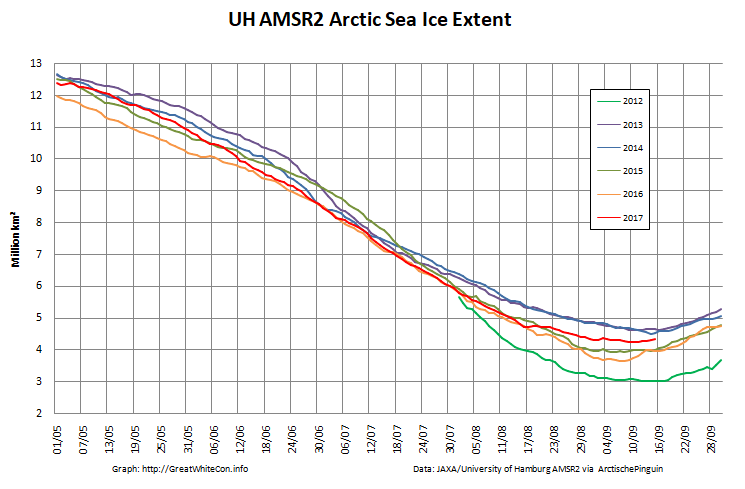
First of all let’s take a look at “Snow White’s” favourite high resolution AMSR2 metrics derived by “Wipneus” from University of Hamburg AMSR2 concentration data:
As you can see, today’s values are both higher than yesterday’s. Hence we already have potential minima to consider! In this case:
UH AMSR2 Area – 3.65 million km² on September 1st
UH AMSR2 Extent – 4.30 million km² on September 1st
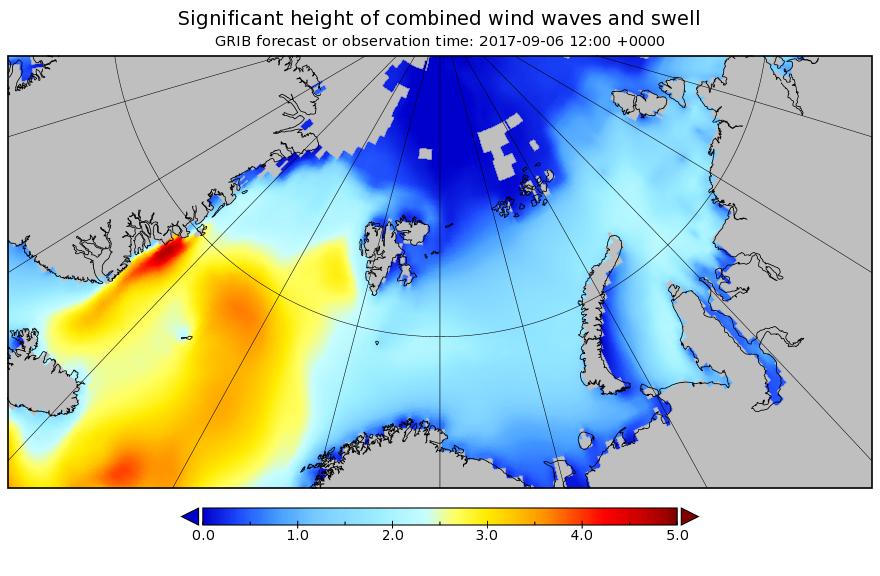
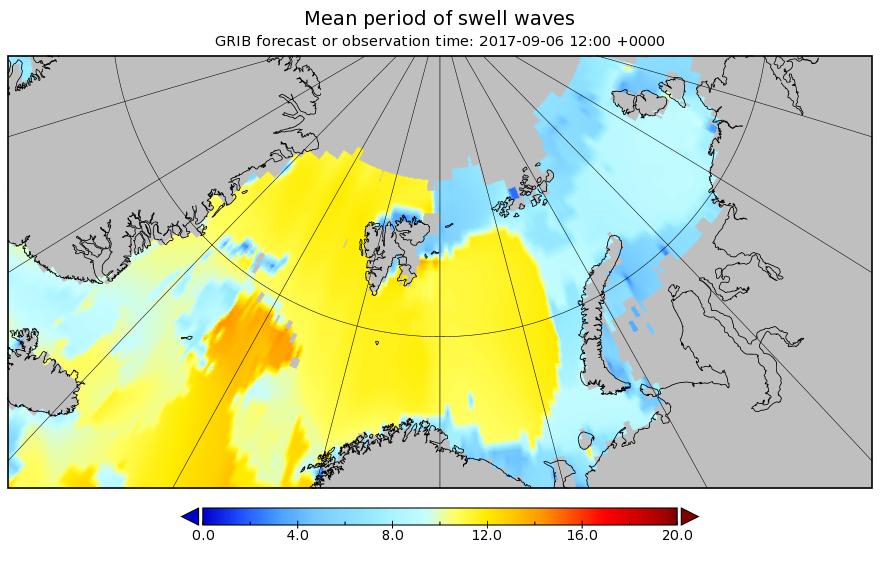
Personally I don’t think those numbers will last long, and here’s one reason why. The “surf forecast” for the far North Atlantic for midday on September 6th:
Some significant swells are currently forecast to batter the ice edge on the Atlantic side of the Arctic over the next few days.
[Edit – September 3rd PM]
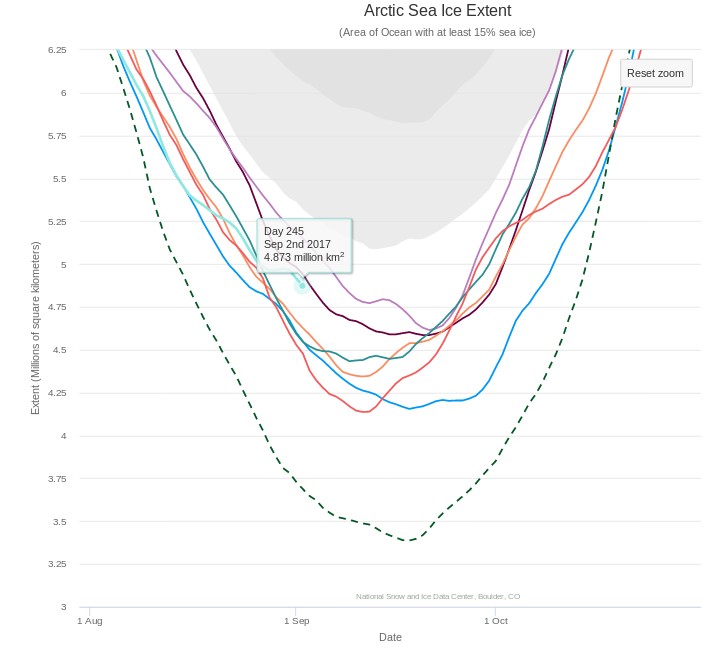
Shock news! Tony Heller has made a prediction about this year’s minimum!! Unlike last year, this year the NSIDC 5 day average extent seems to be his Arctic metric of choice:
Tony tells his faithful flock:
The Arctic sea ice minimum this year is very likely going to be be larger than 2016, 2015, 2012, 2011 and 2007.
It is also likely that the minimum extent will be higher than 2010 and 2008.
Instead of reporting the huge gain in ice and massive failure of their forecasts, climate alarmists will report that extent was “8th lowest on record.”
All those years are on the graph above. We shall see.
[Edit – September 15th]
Our normal Arctic sea ice extent 2017 minimum service will be restored as soon as possible. Meanwhile here is the test card:
On the way the cruise’s resident naturalist and Smithsonian lecturer, Michael Scott, risked the wrath of Trump supporters by pointing to some of the changes Greenland is undergoing.
A Nasa map based on data between 2004 and 2014 revealed that the ice is melting across most of Greenland – an area nine times the size of the UK.
Pulling together several papers, Michael said Greenland’s summer melt season now lasts 70 days longer than in the early 1970s.
This melting is unfreezing the fringes of the permafrost, which may explain why Nasa satellites are picking up fires raging where the ice has retreated.
[Edit – September 16th]
It is of course still to early to be 100% certain about this. However:
It certainly looks as though the bottom is in for the University of Hamburg AMSR2 extent: 4.25 million km² on September 11th.
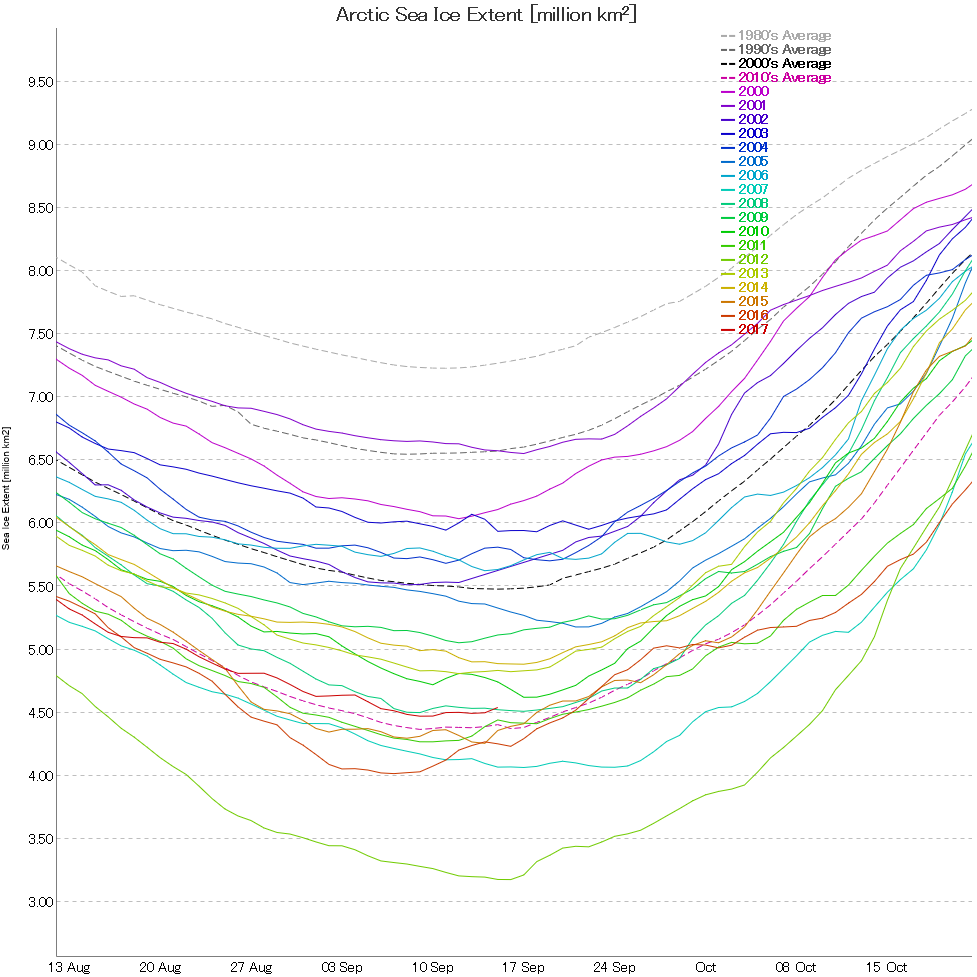
It’s much the same story for JAXA extent:
4.47 million km² on September 9th and 10th.
[Edit – September 19th]
The NSIDC have followed in Snow White’s glass slippered footsteps and tentatively called the minimum:
On September 13, Arctic sea ice appears to have reached its seasonal minimum extent of 4.64 million square kilometers (1.79 million square miles), the eighth lowest in the 38-year satellite record. The overall rate of ice loss this summer was slowed by a persistent pattern of low sea level pressure focused over the central Arctic Ocean.
Please note that this is a preliminary announcement. Changing winds or late-season melt could still reduce the Arctic ice extent, as happened in 2005 and 2010. NSIDC scientists will release a full analysis of the Arctic melt season, and discuss the Antarctic winter sea ice growth, in early October.
Minimum volume was reached at 11th September: 4.542 103km3, which is fourth lowest after 2012, 2011 and 2016 (resp 3.673, 4.302, 4.402) and just below 2010 (4.582).
[Edit – September 23rd]
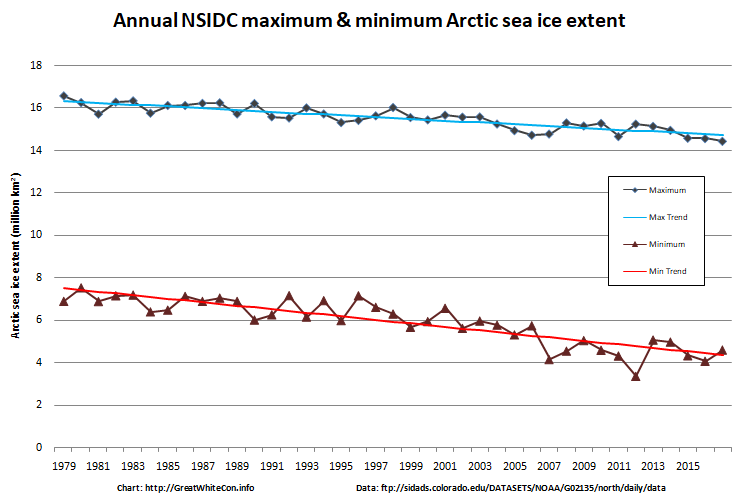
Here’s the 2017 edition of our annual NSIDC daily max/min extent graph:
The maximum extent was the lowest in the satellite record, and the minimum was just fractionally above the trend line. For those that concern themselves with “statistical significance”, the PIOMAS minimum volume was a “statistical tie” for second place:
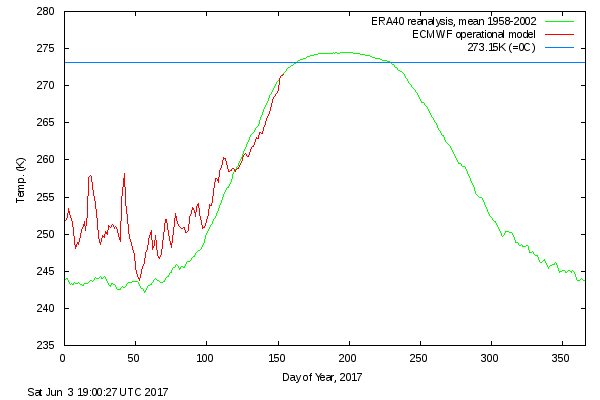
After a comparatively cool May, surface air temperatures in the high Arctic are back up to “normal”:
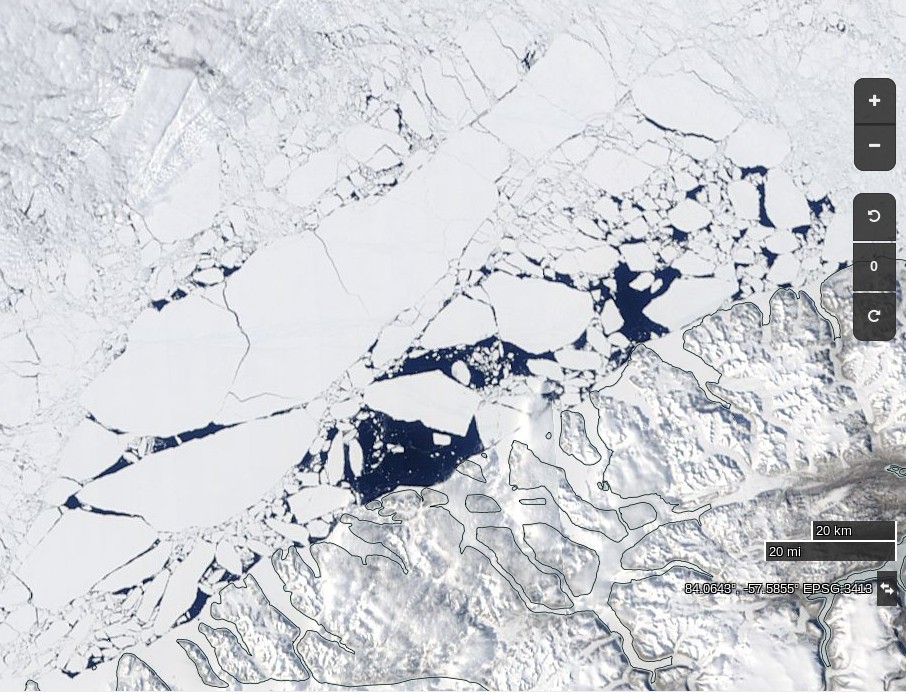
The condition of the sea ice north of 80 degrees is far from normal however. Here’s what’s been happening to the (normally) land fast ice north west of Greenland:
NASA Worldview “true-color” image of the sea ice north west of Greenland breaking up on June 2nd 2017
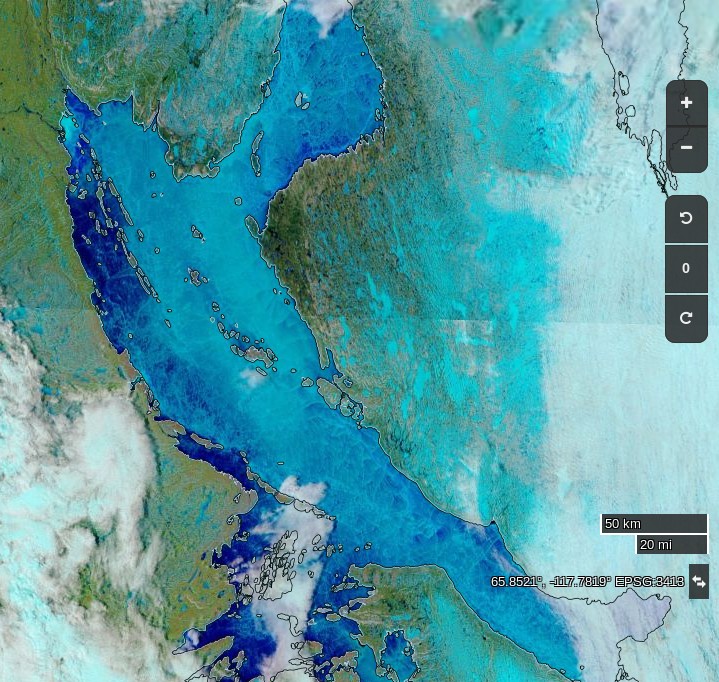
Further south surface melt has set in across the southern route through the Northwest Passage:
NASA Worldview “false-color” image of the Coronation Gulf on June 1st 2017, derived from the MODIS sensor on the Terra satellite
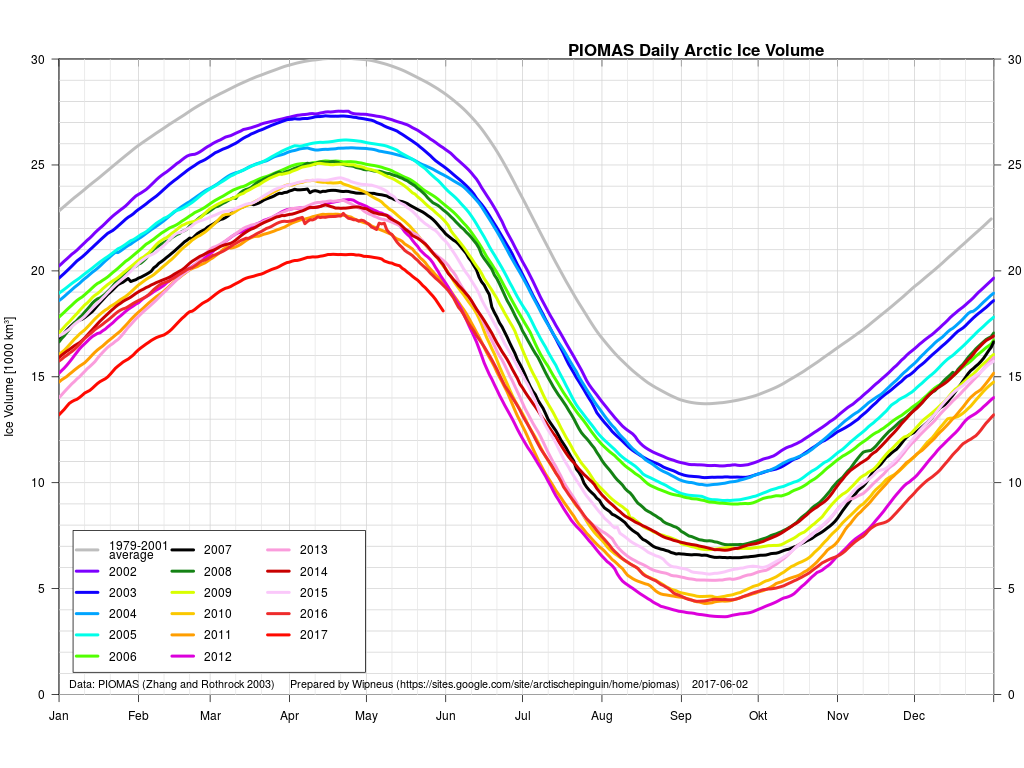
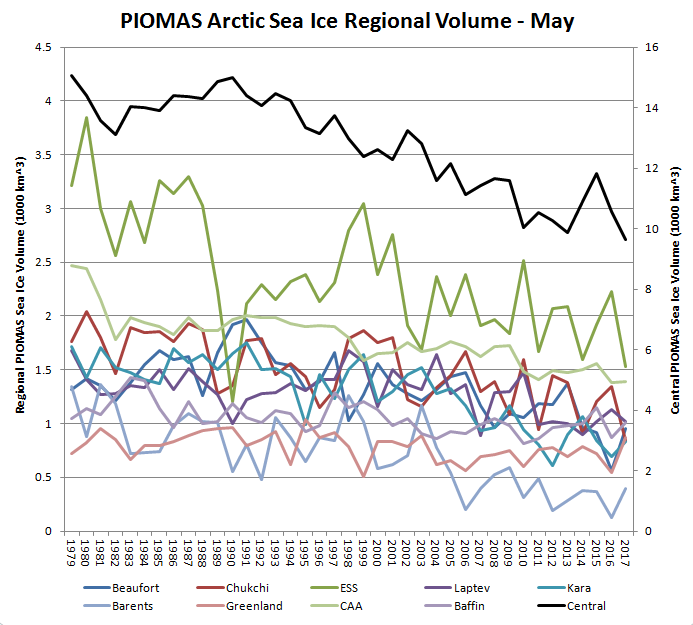
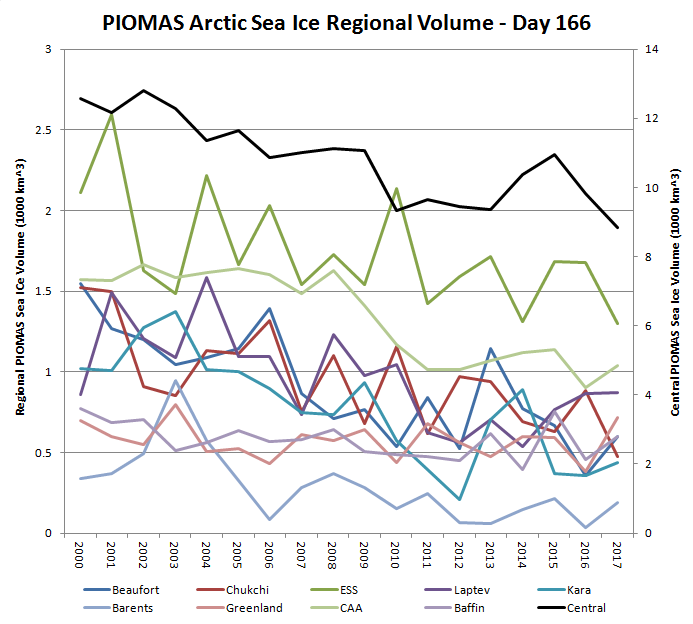
Whilst the gap with previous years has narrowed during May, PIOMAS Arctic sea ice volume is still well below all previous years in their records:
The PIOMAS gridded thickness graph suggests that a large area of thick ice is currently sailing through the Fram Strait to ultimate oblivion:
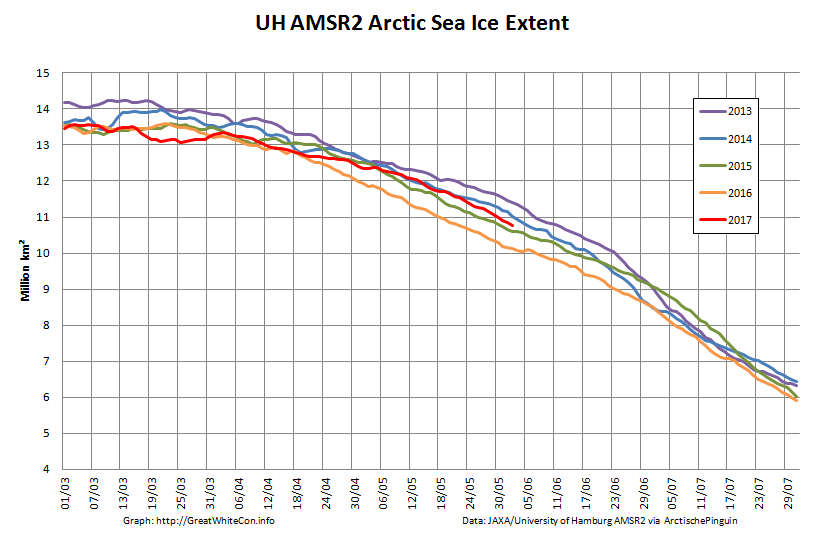
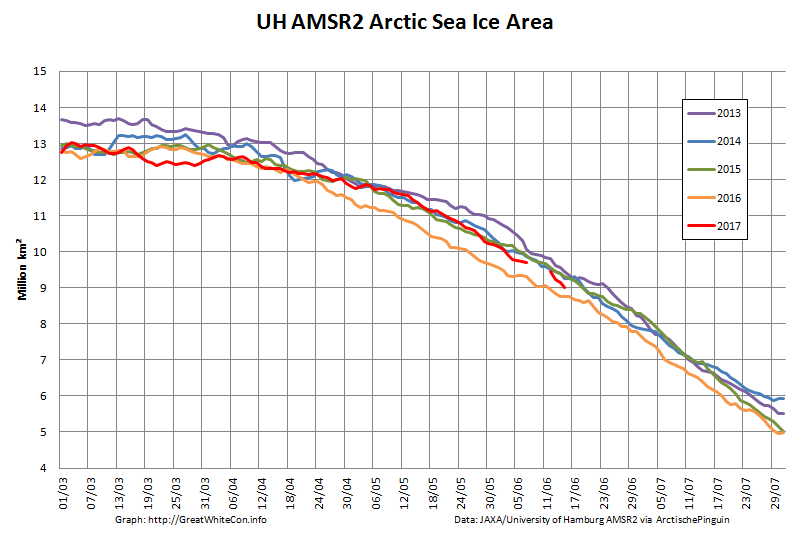
and just in case melt ponds are now affecting those numbers here is extent as well:
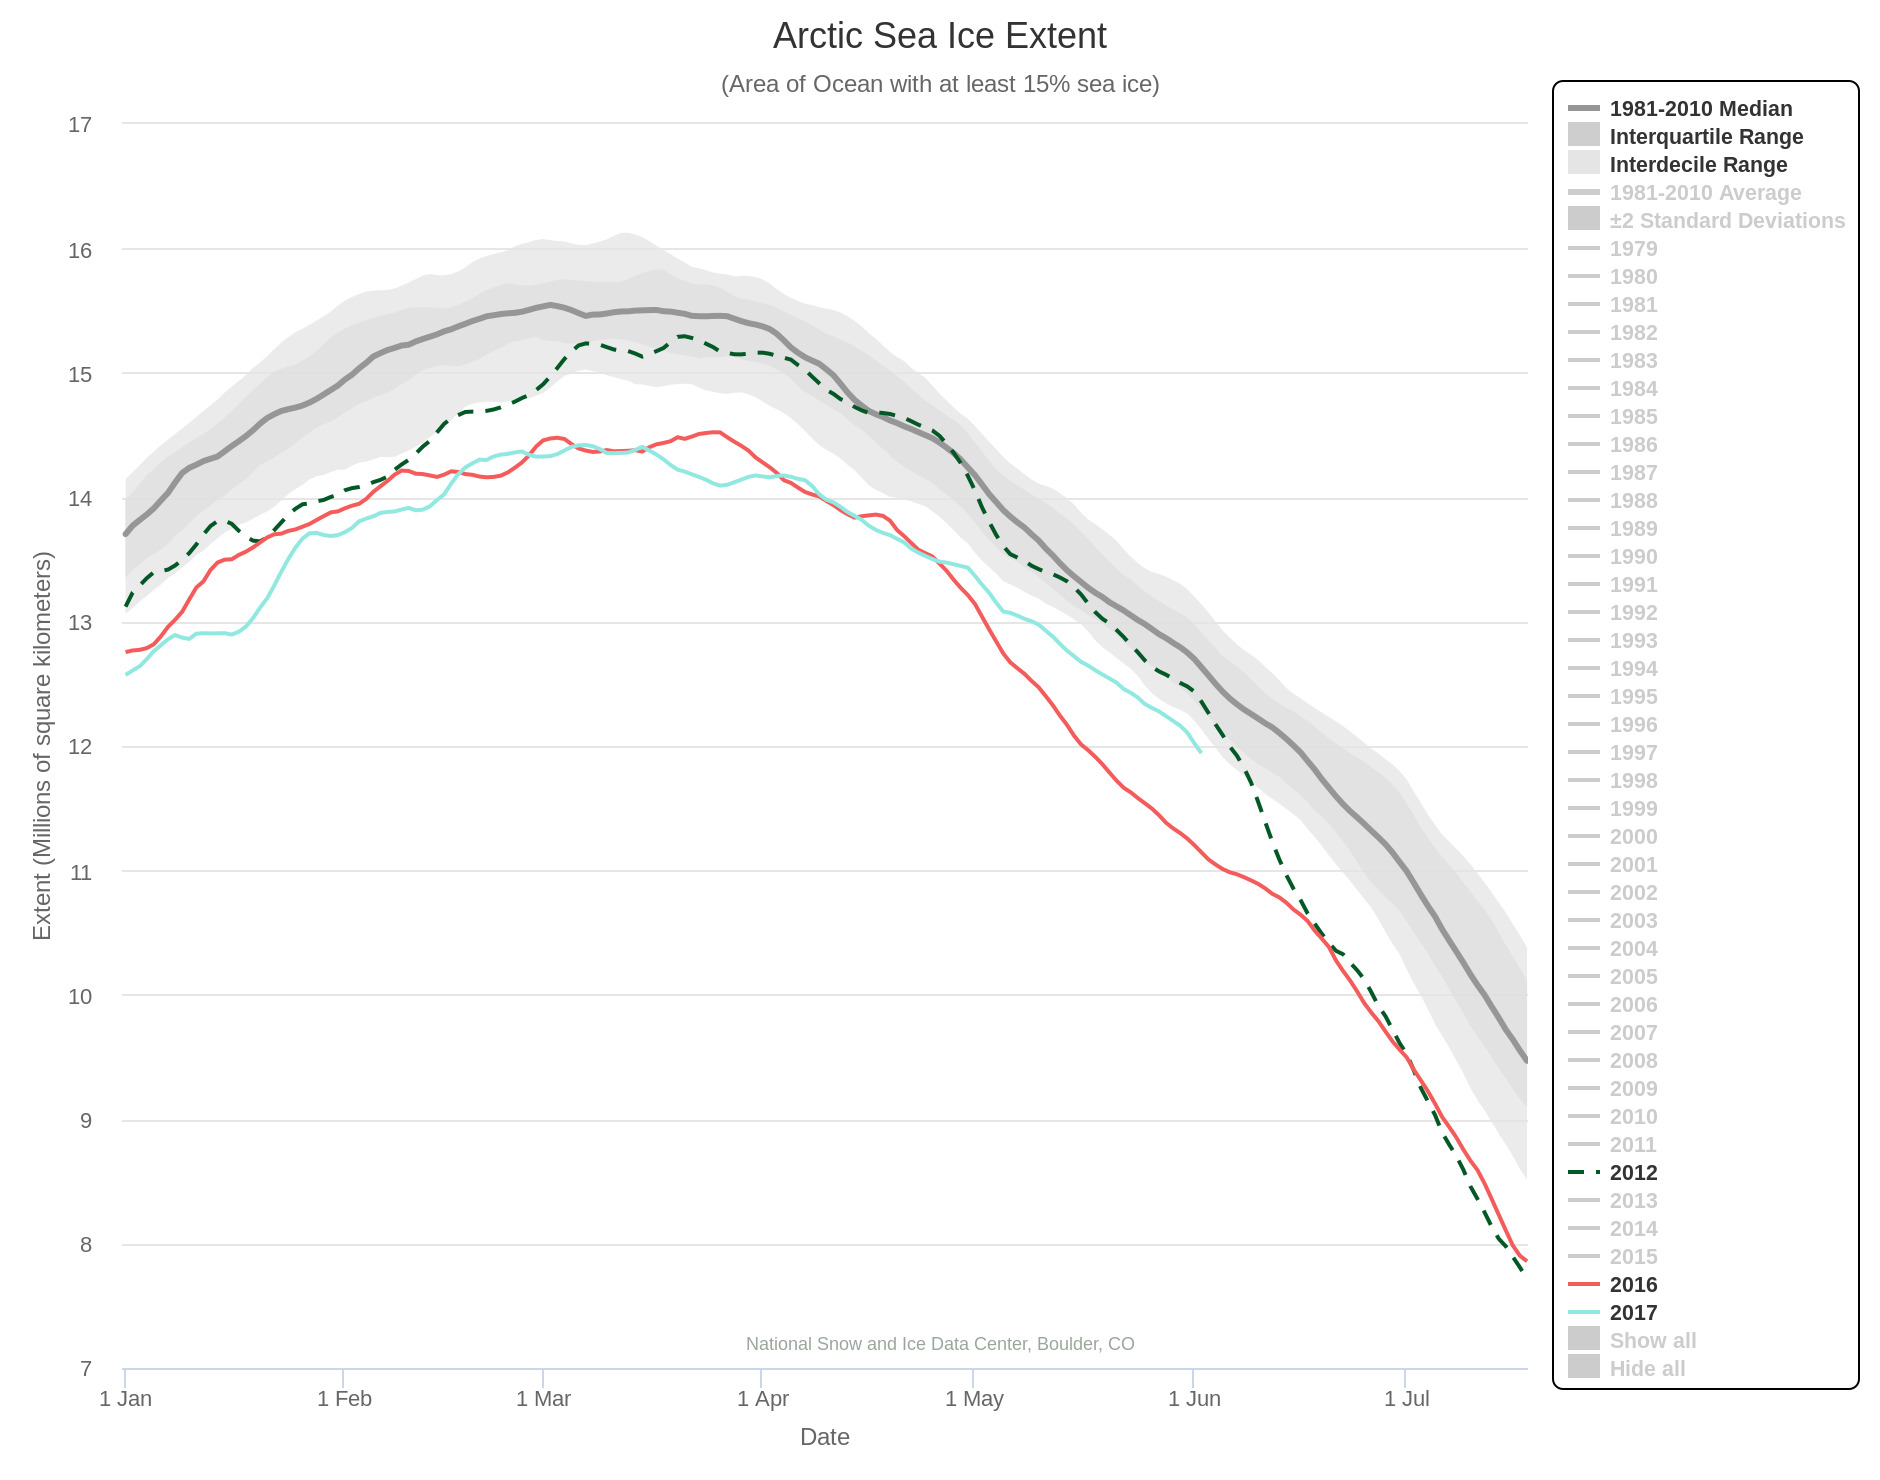
The rate of decrease is inexorably increasing! 2012 extent is currently still well above that of 2017, but those positions may well be reversed by the end of June? Here’s NSIDC’s view on the matter:
[Edit – June 8th]
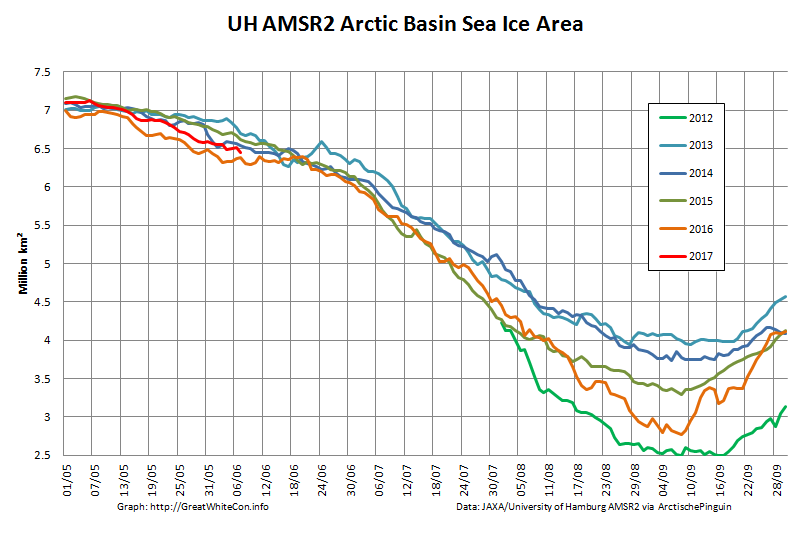
As requested by Tommy, here’s the current Arctic Basin sea ice area:
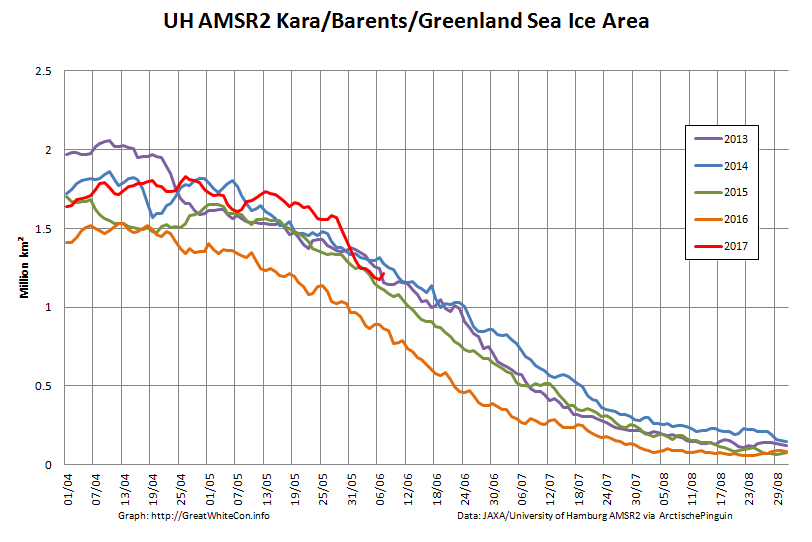
This includes the Beaufort, Chukchi, East Siberian and Laptev Seas along with the Central Arctic. It excludes the Atlantic periphery, which currently looks like this:
[Edit – June 10th]
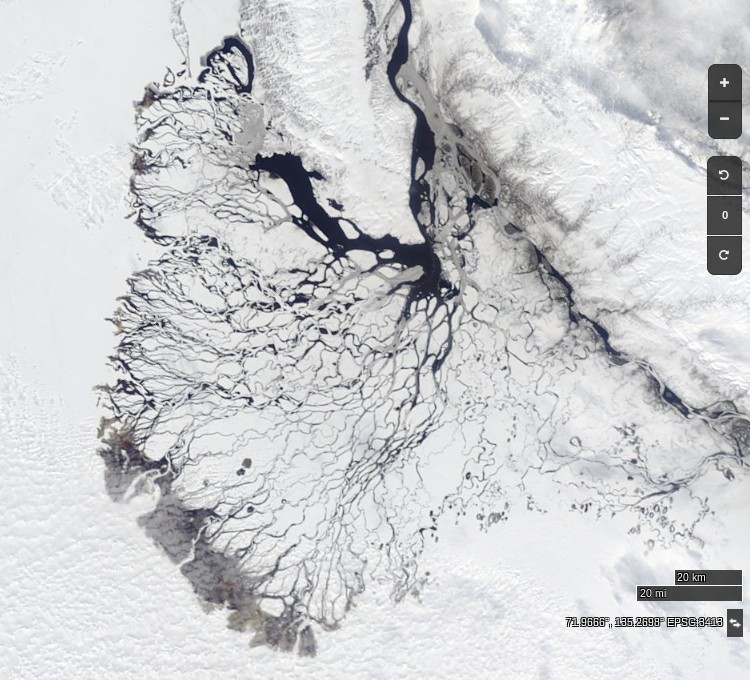
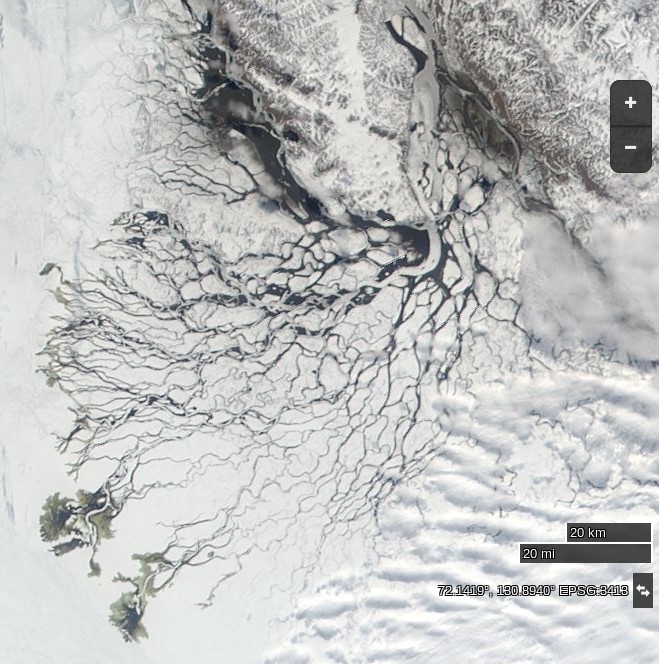
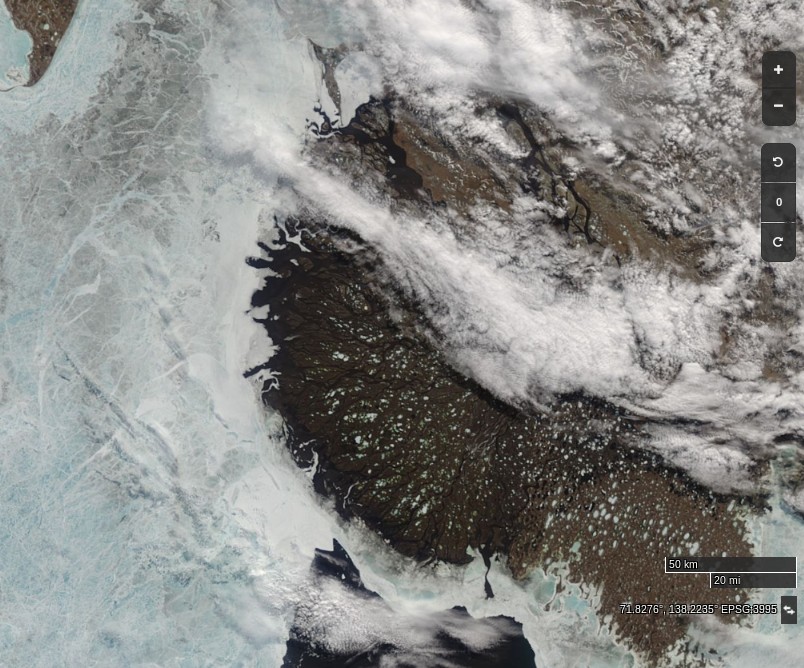
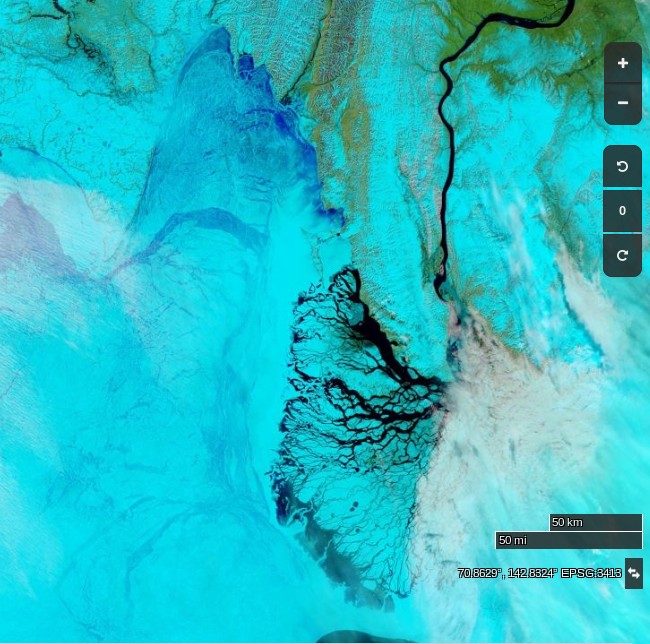
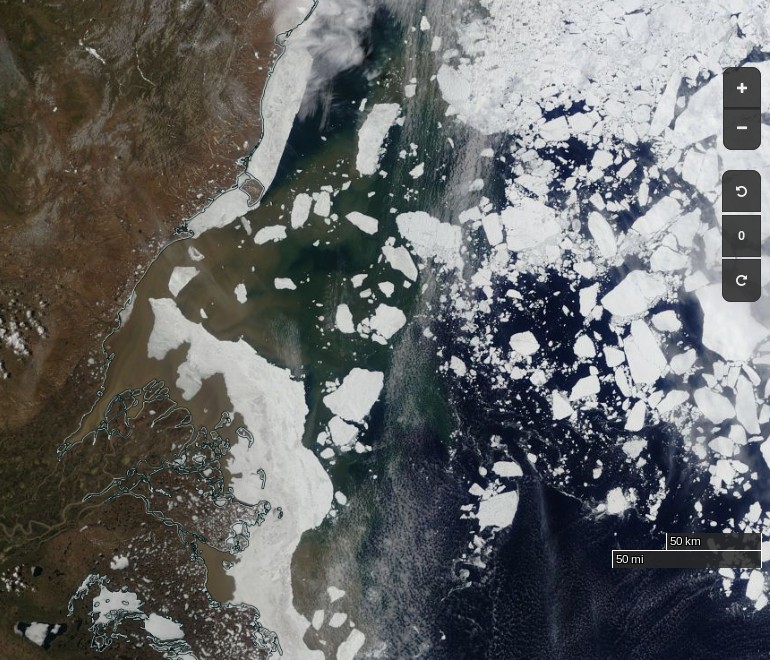
At long last a clear(ish) image of water from the Lena Delta spreading out across the fast ice in the Laptev Sea:
NASA Worldview “true-color” image of the Lena Delta on June 10th 2017, derived from the MODIS sensor on the Terra satellite
NASA Worldview “true-color” image of the Lena Delta on June 10th 2012, derived from the MODIS sensor on the Terra satellite
[Edit – June 11th]
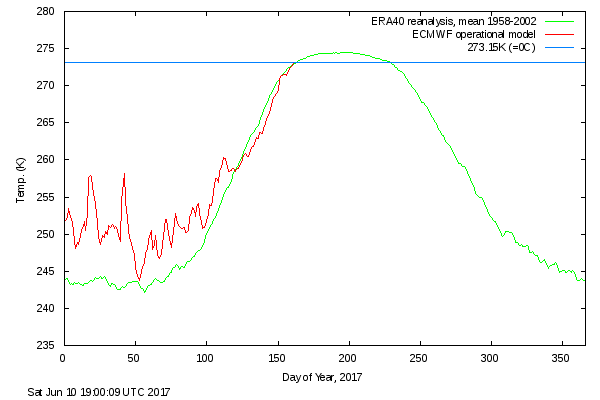
DMI’s daily mean temperature for the Arctic area north of the 80th northern parallel has reached zero degrees Celsius almost exactly on the climatological schedule:
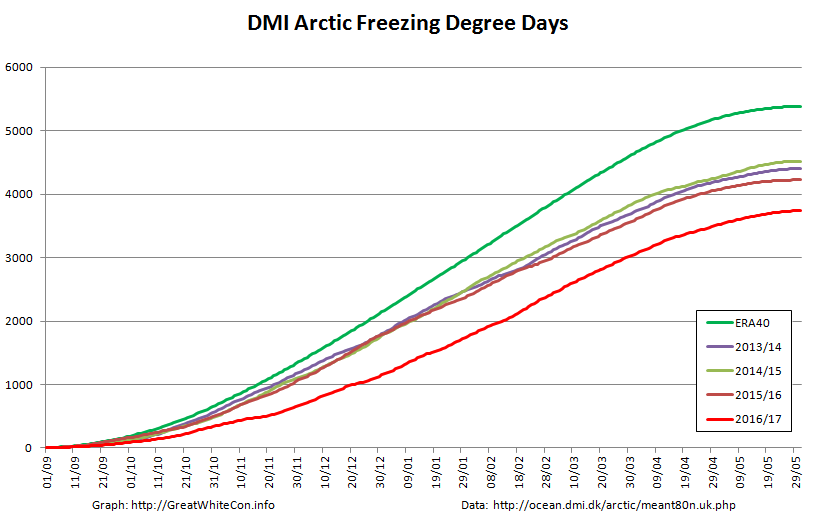
We calculate our freezing degree days on the basis of the freezing point of Arctic sea water at -1.8 degrees Celsius. On that basis this winter’s grand total of 3740 was reached on June 1st:
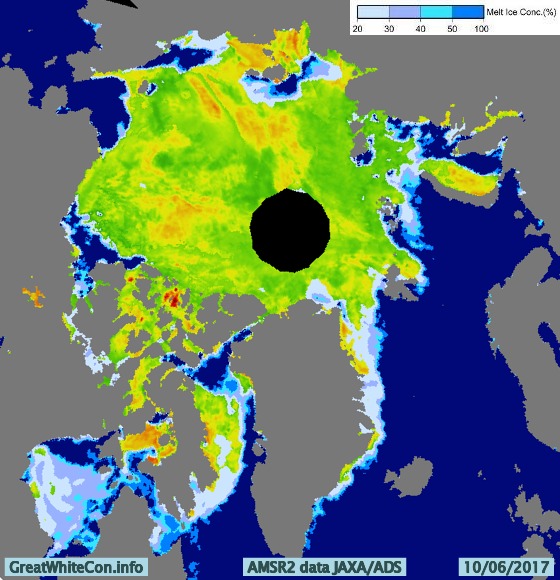
Despite the “coolish” recent weather total FDDs are way below the climatology and other recent years. Consequently there’s a lot less sea ice in the Arctic left to melt at the start of this Central Arctic melting season than in any previous year in the satellite record. However whilst there are some melt ponds visible in the Arctic Basin on MODIS, in that respect 2017 is lagging behind both last year and 2012.
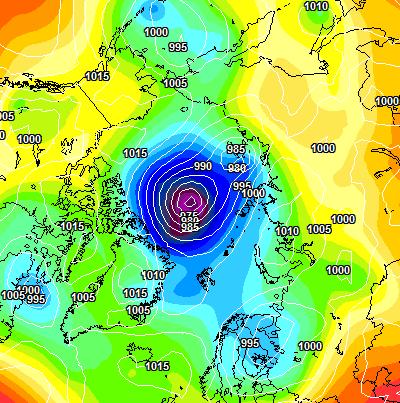
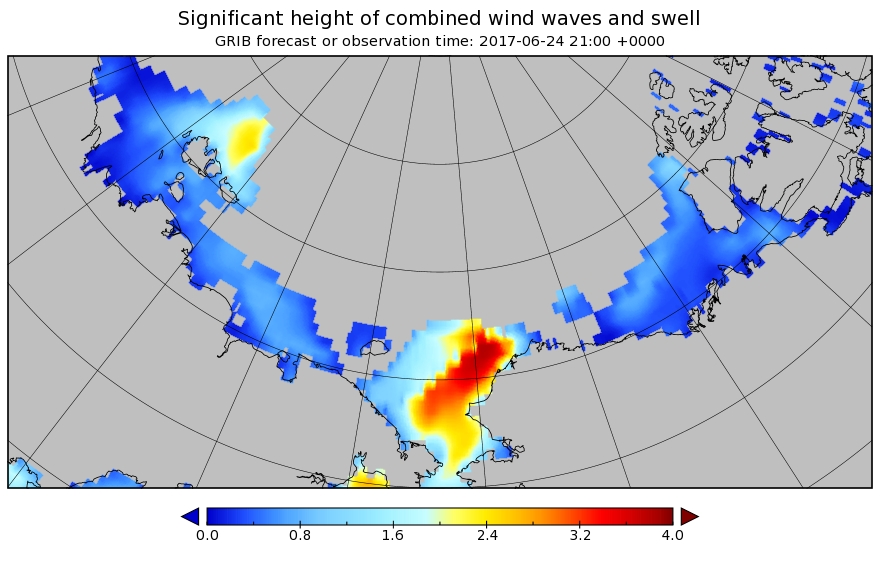
A sub 970 hPa cyclone is starting to enter the realms of realistic possibility, and also forecast are some significant waves in the Chukchi Sea and the expanding 2017 “Laptev Bite”:
[Edit – June 27th]
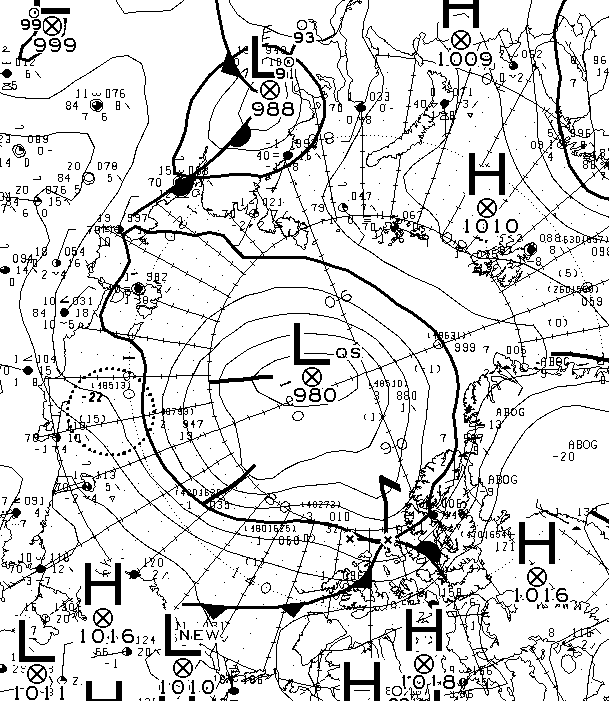
The forecast cyclone was nowhere near as deep as predicted. According to the analysis by Environment Canada it bottomed out at 980 hPa yesterday:
[Edit – June 29th]
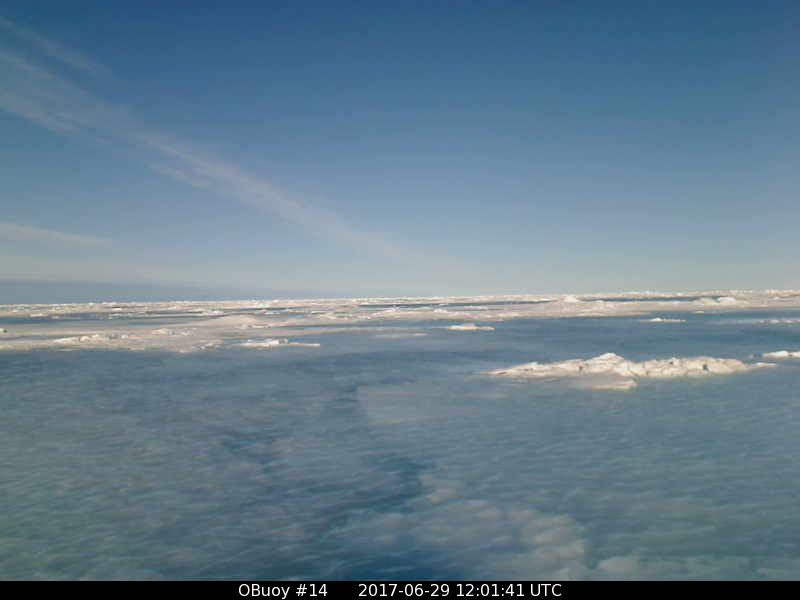
O-Buoy 14 is currently firmly embedded in the fast ice of Viscount Melville Sound, deep in the heart of the Northwest Passage. Here’s the view from the buoy’s camera:
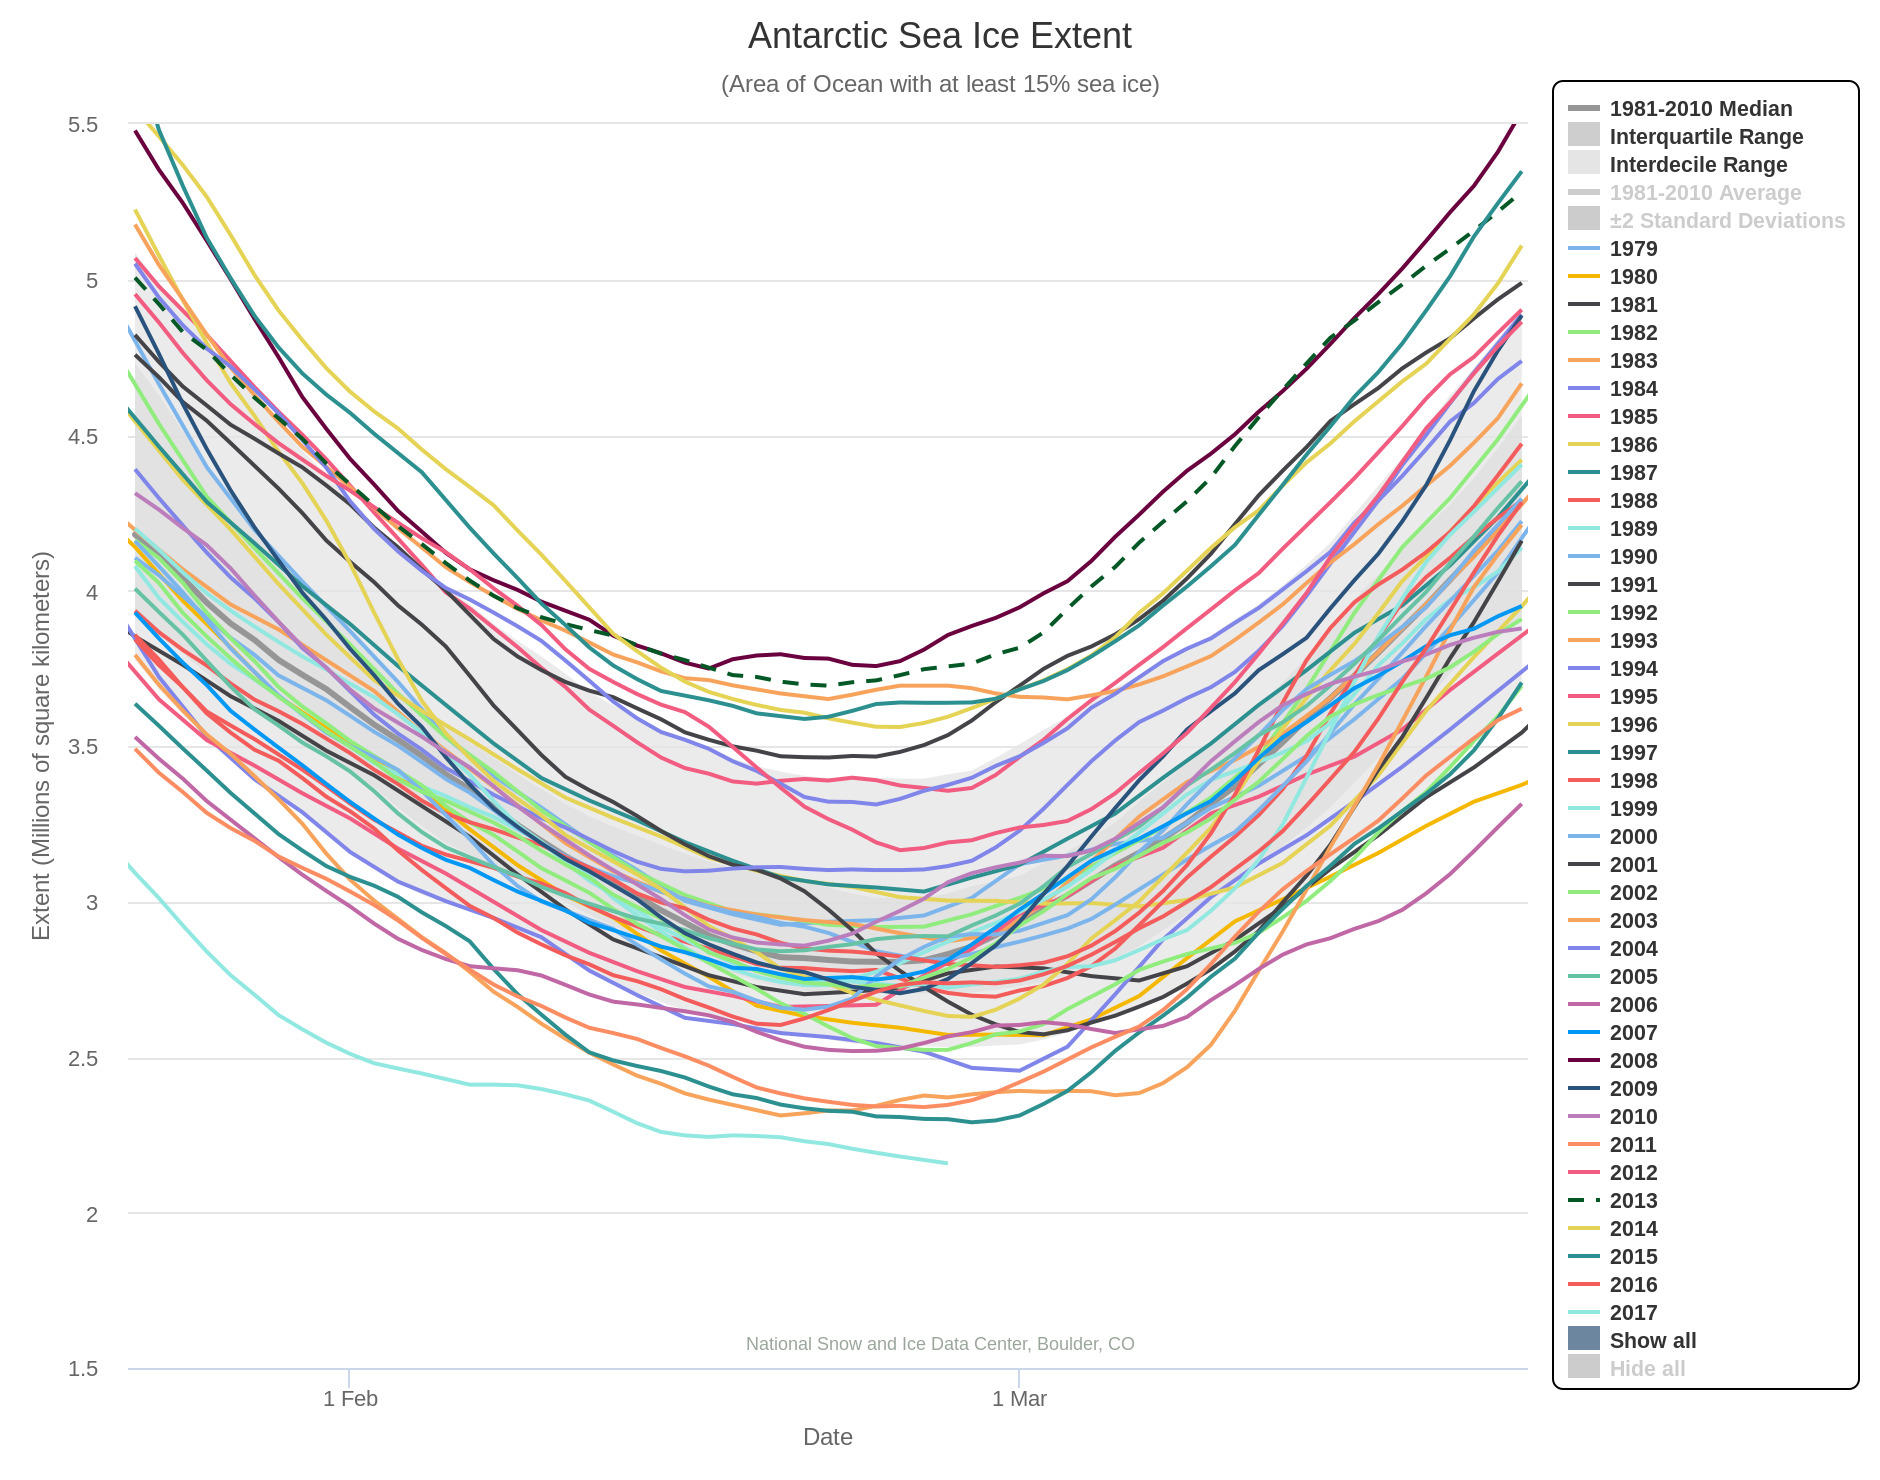
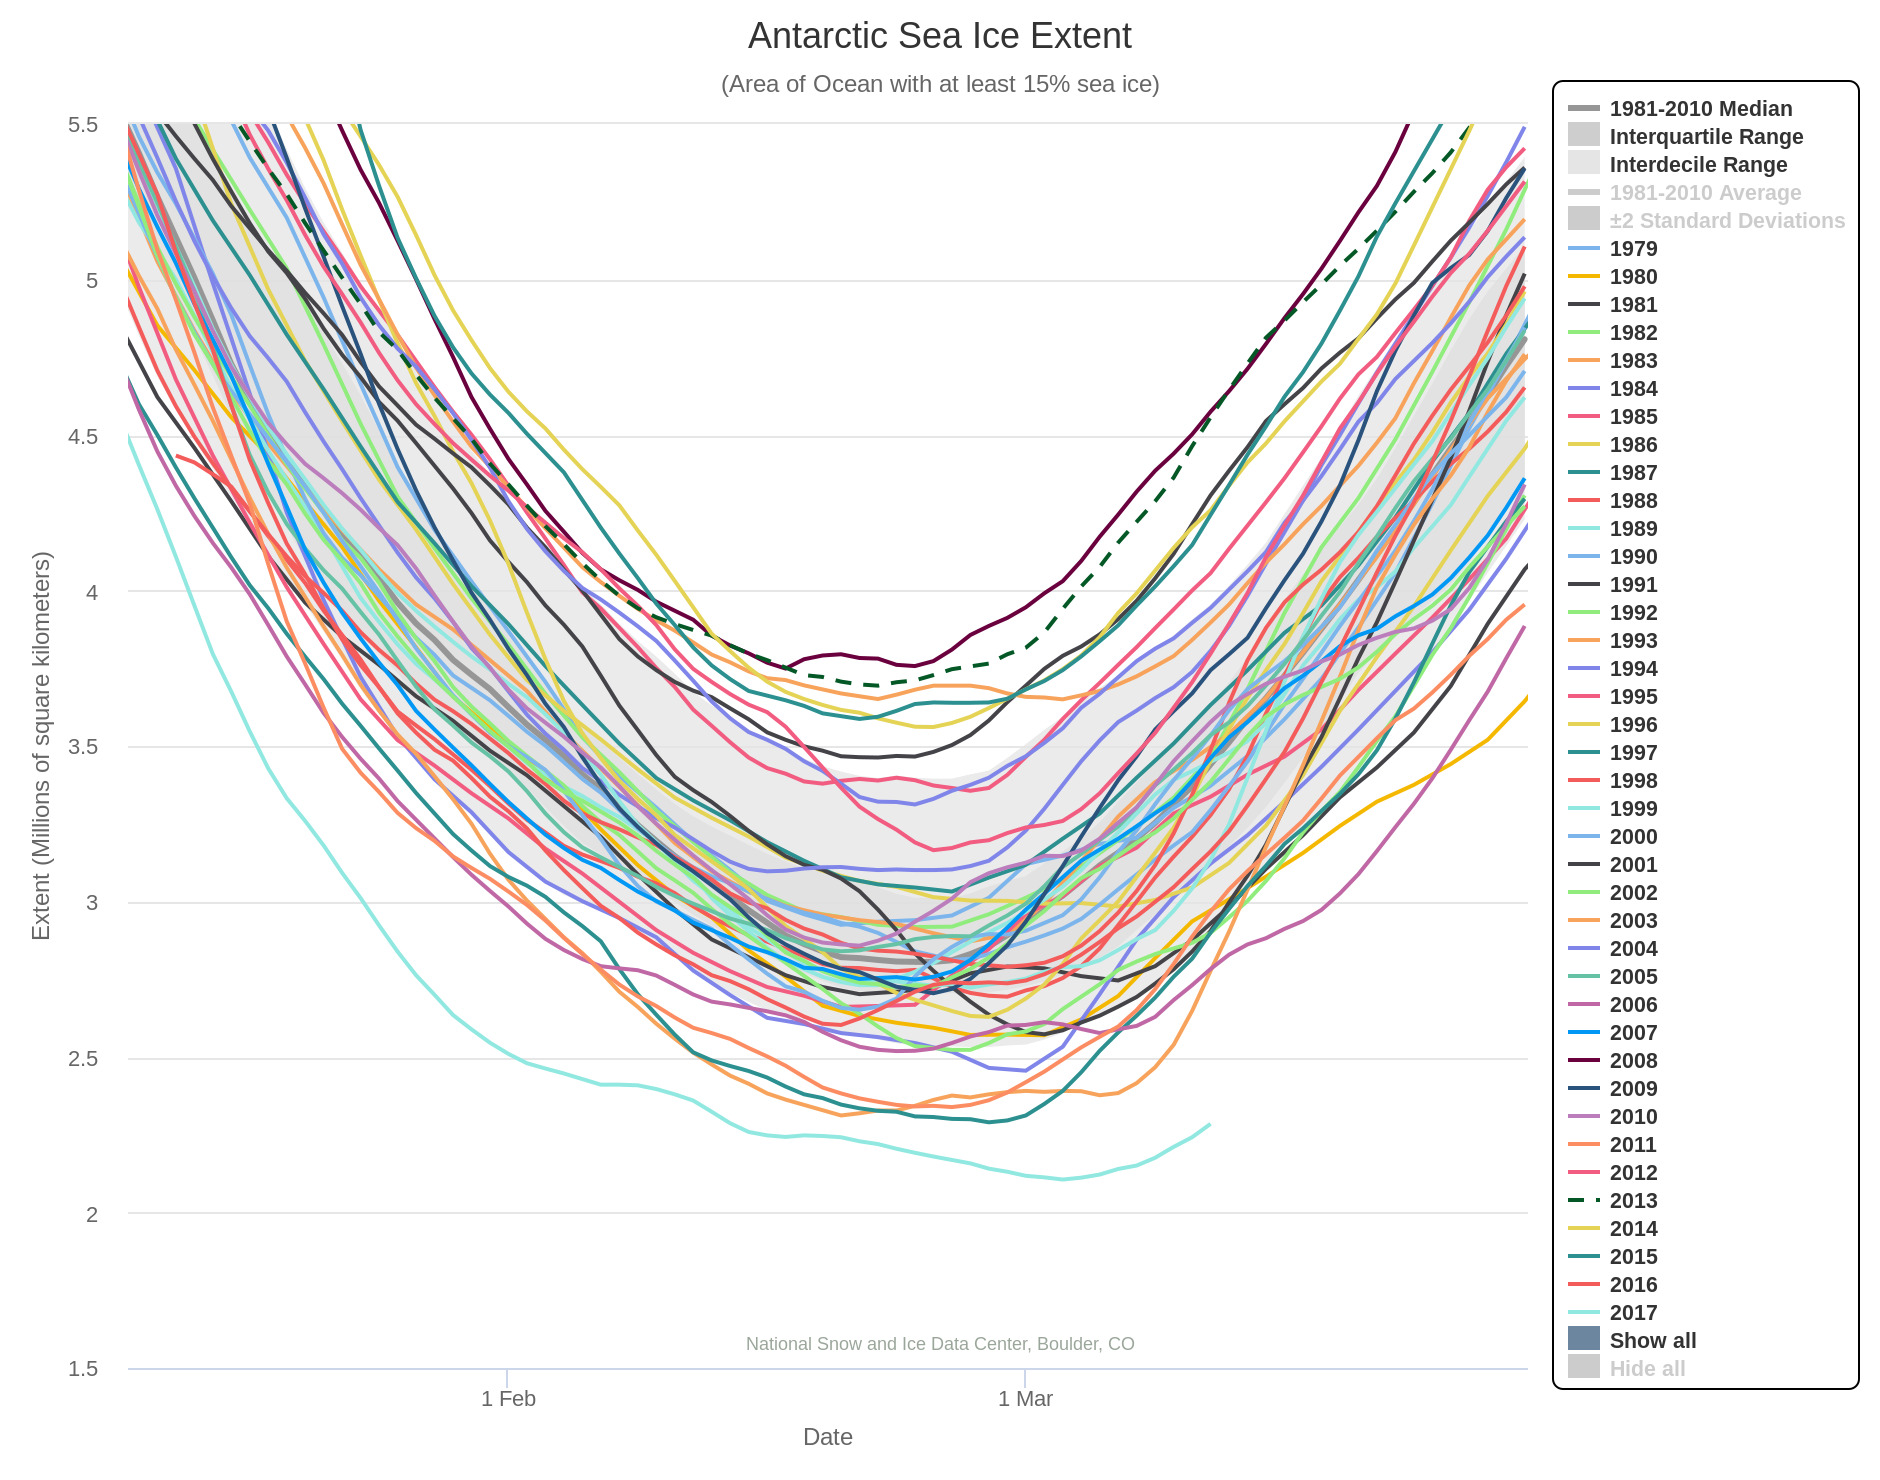
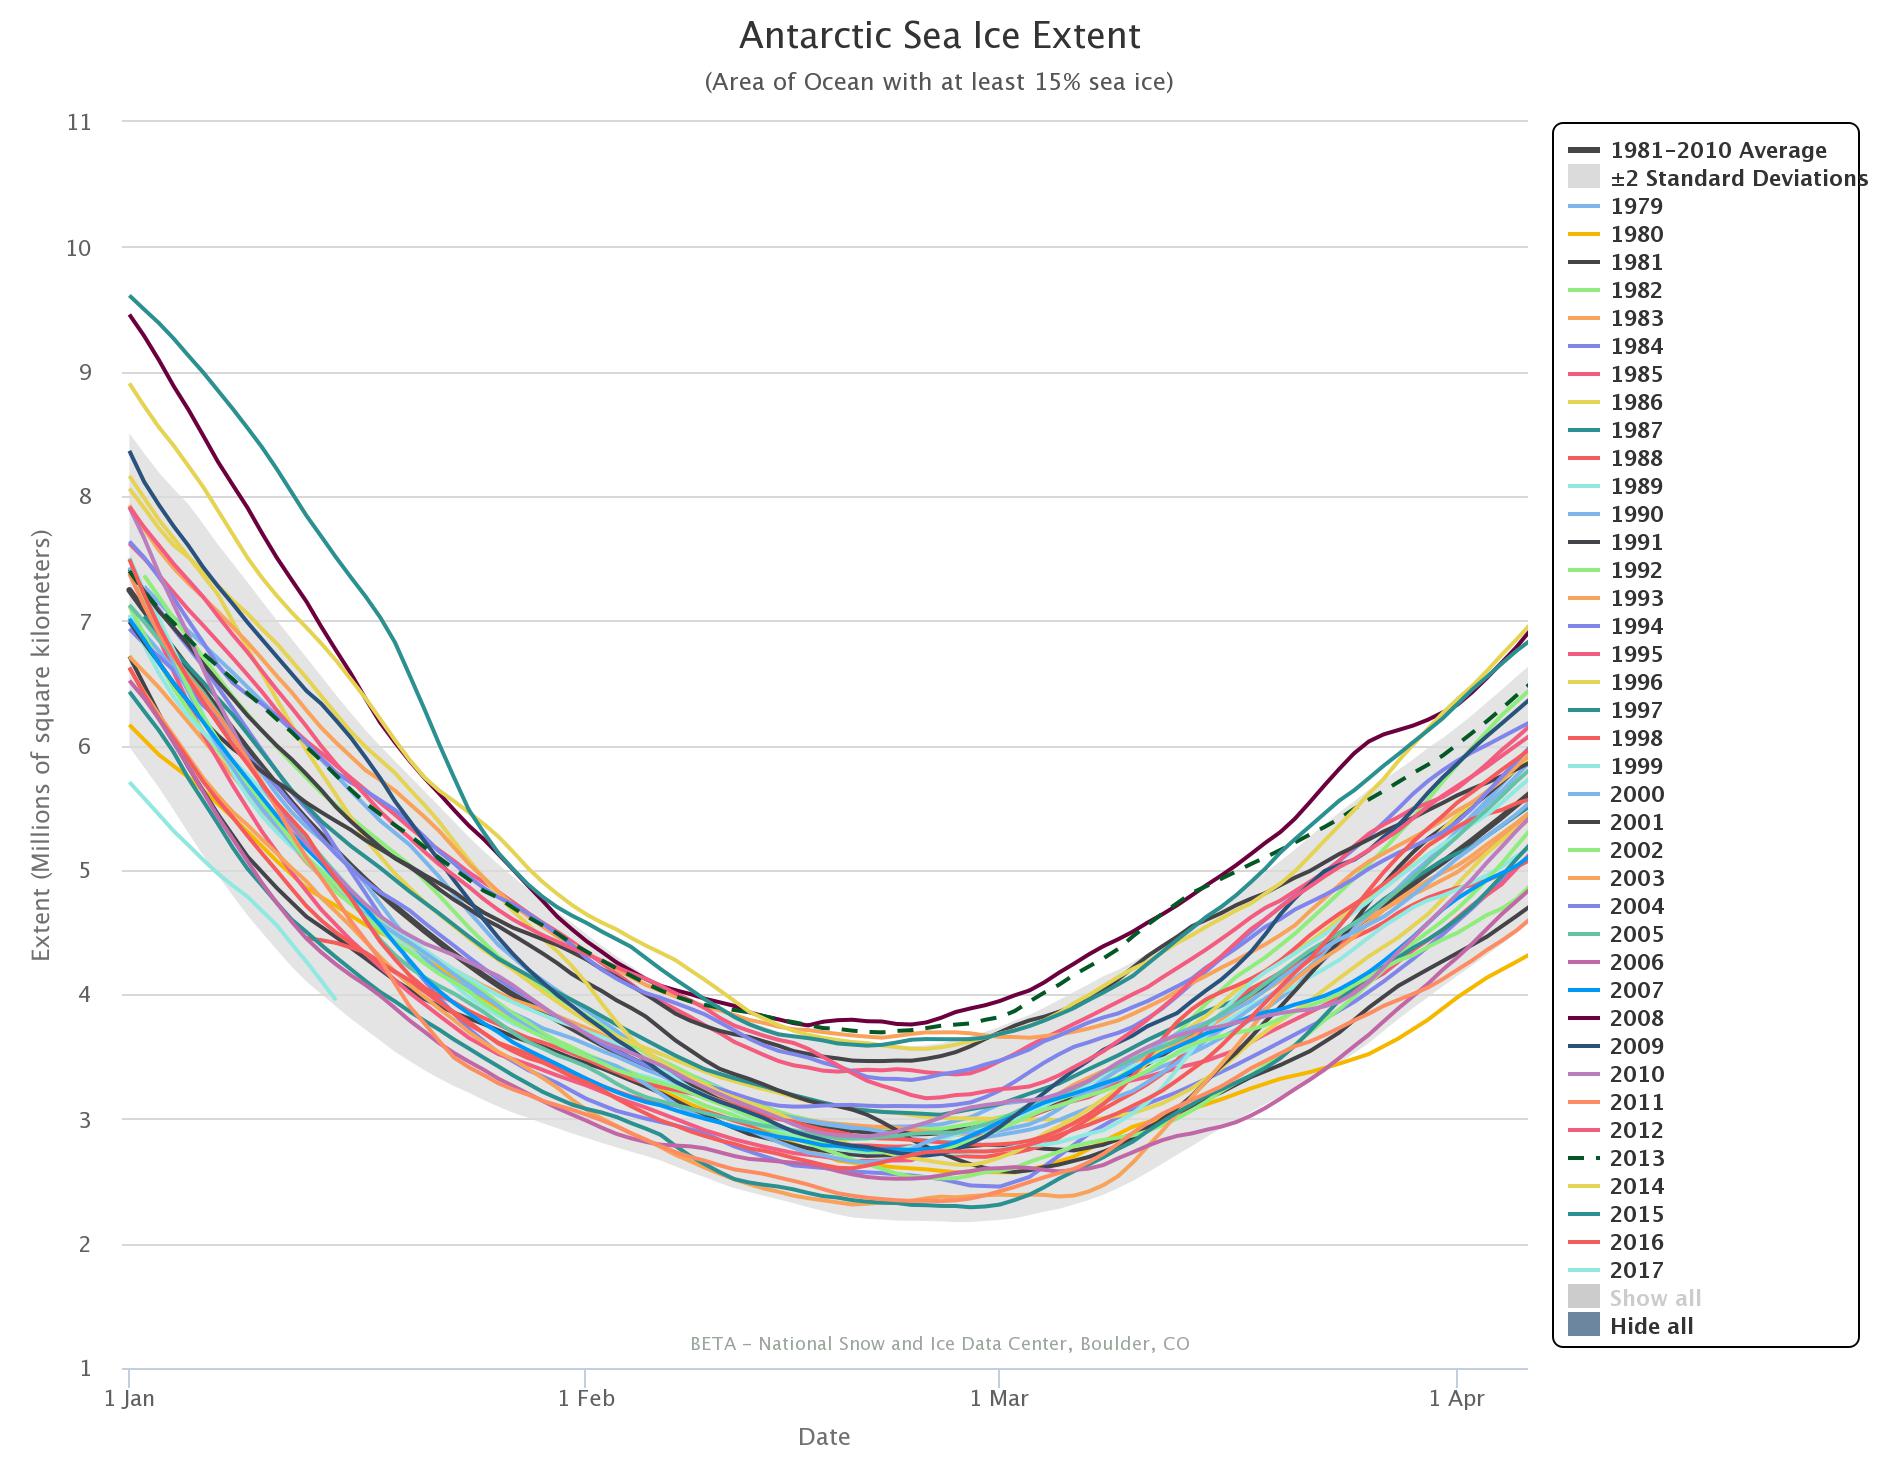
In 2017 Antarctic sea ice extent is beating all the records. All flavours of the metric are already below the minimum of all previous years in the satellite record, and it looks like there’s still some more melting left to go. Here’s the NSIDC’s 5 day averaged extent:
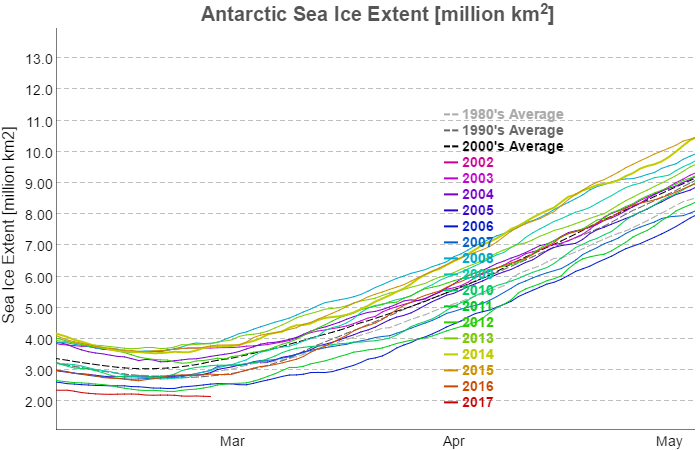
It seems highly likely that the 2017 Antarctic sea ice minimum extent has now been reached. Here’s the NSIDC 5 day averaged extent graph:
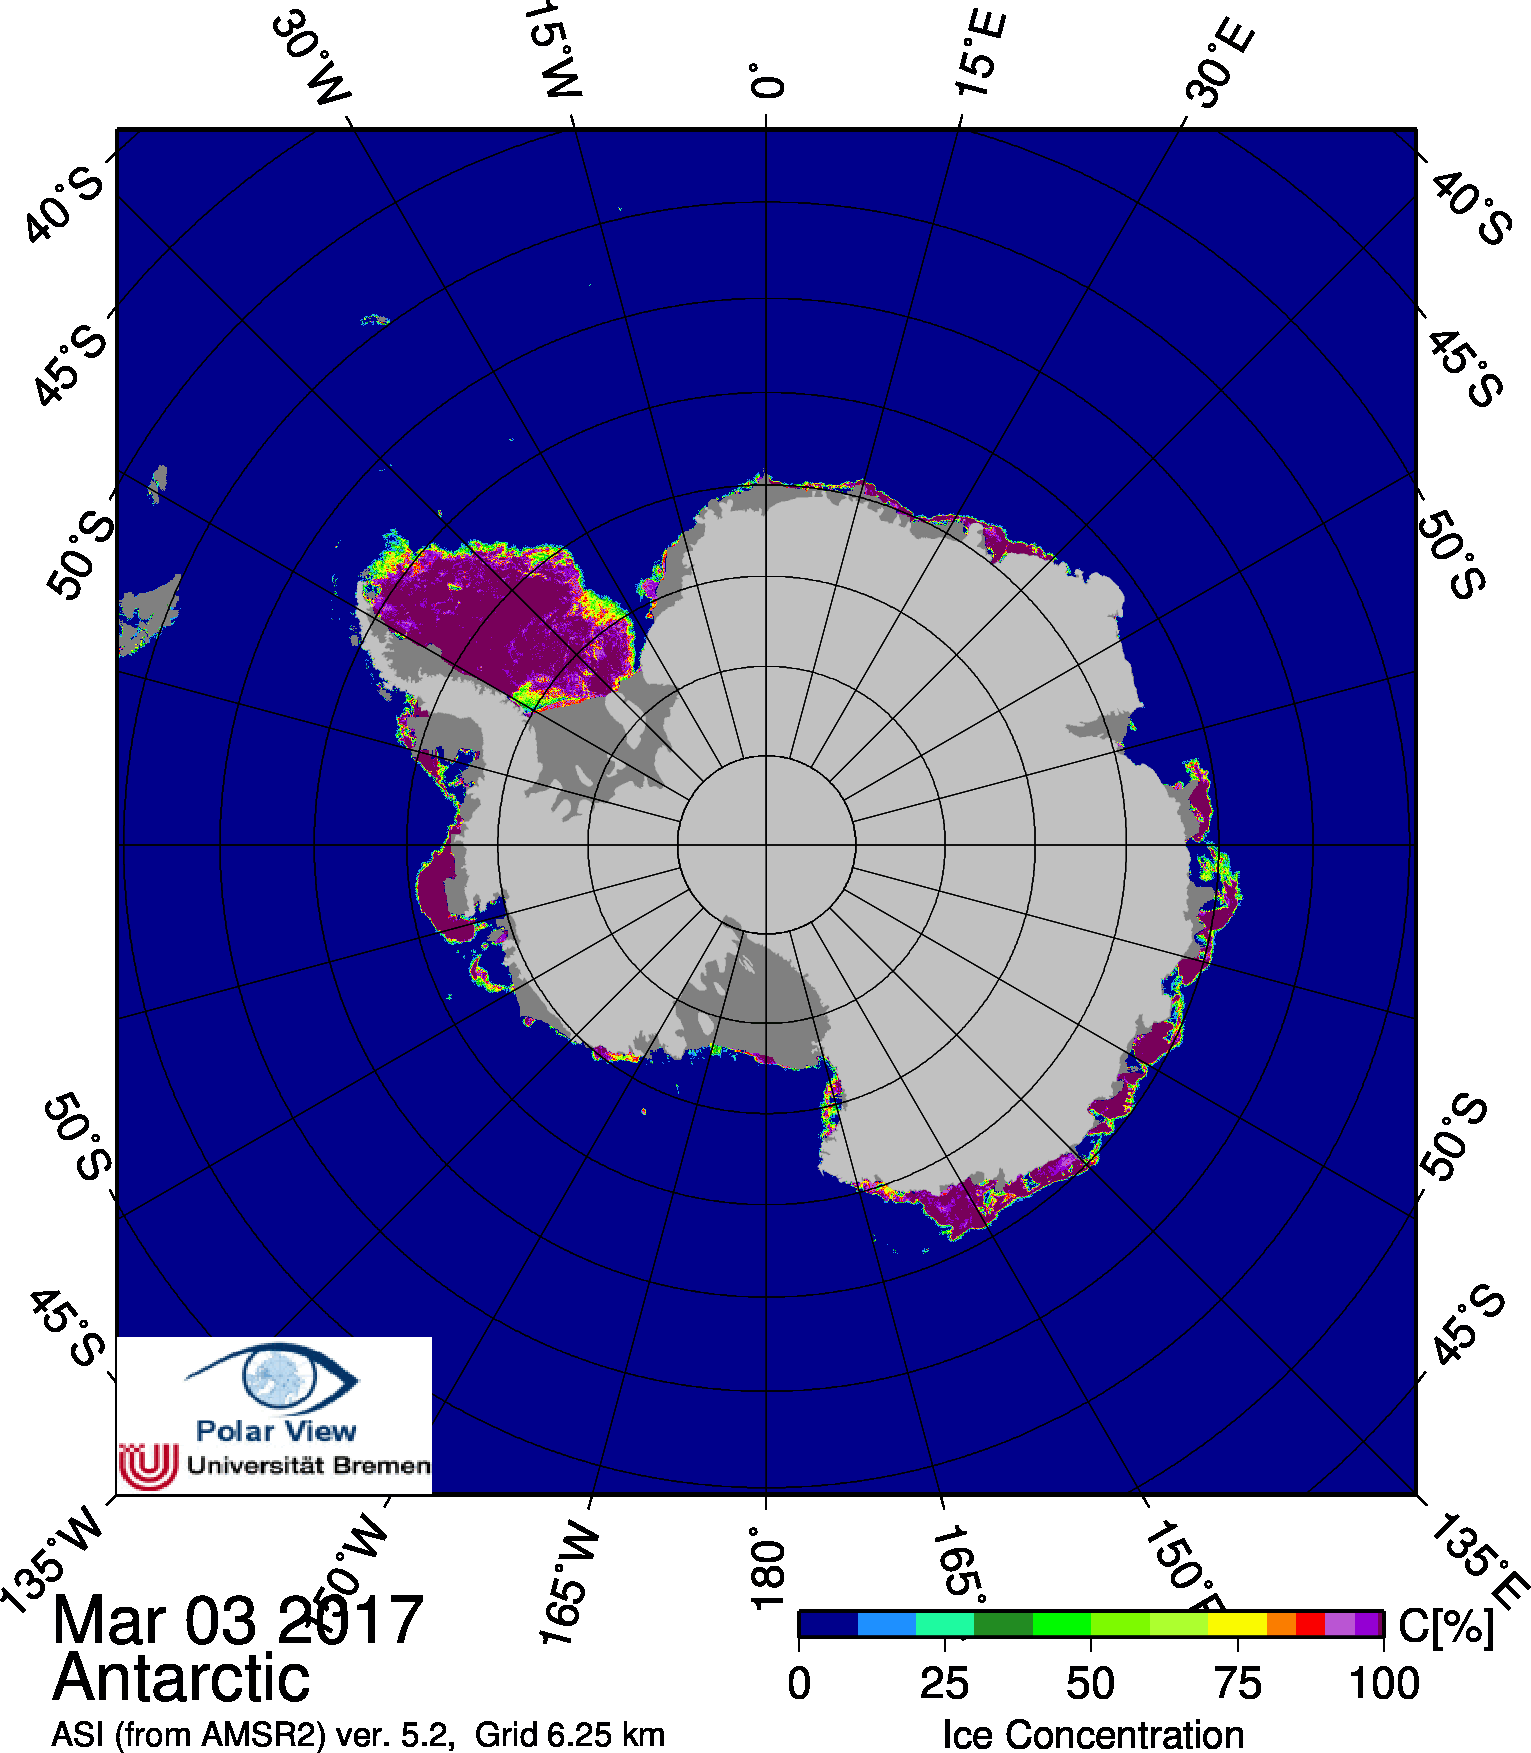
The minimum extent of 2.106 million square kilometers was reached on March 3rd. Here’s the University of Bremen’s Antarctic sea ice concentration map for March 3rd:
David Rose is mercifully quiet this weekend, but there’s no rest for the wicked! Christopher Booker in the Sunday Telegraph leads a bunch of the usual Alt-facts suspects in a barrage of fake news about our dearly beloved Arctic sea ice. According to Mr. Booker in the “Arctic Myths” section of his column today:
As the fake science of global warming continues to crumble, one scare story the zealots are determined to hold on to at all costs is their claim that ice in the Arctic is dangerously vanishing. Yet again lately we have been treated to a barrage of such headlines as “Hottest Arctic on record triggers massive ice melt”.
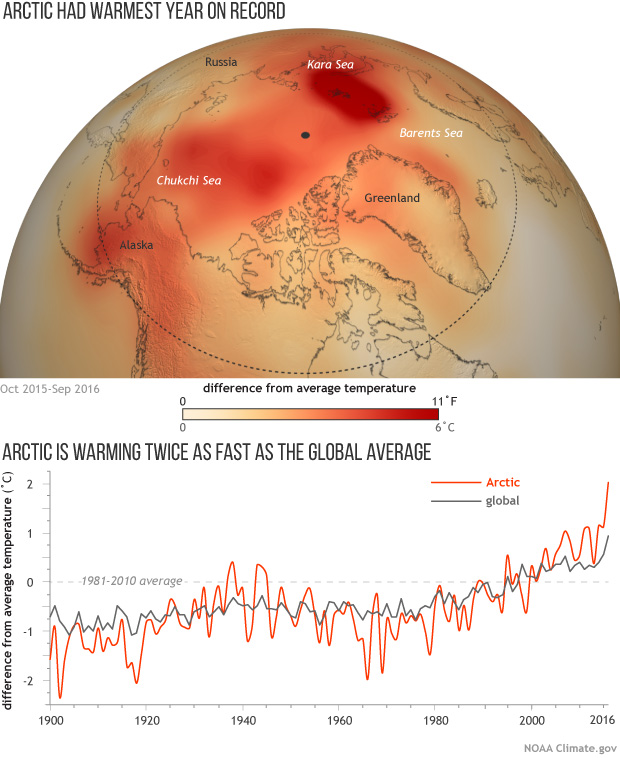
The nearest we got to such a headline here at the Great White Con was “Arctic Sea Ice News from AGU” in which article we showed images which said things like:
That’s because last year was the *hottest year on record in the Arctic! Undeterred by mere facts Mr. Booker continues:
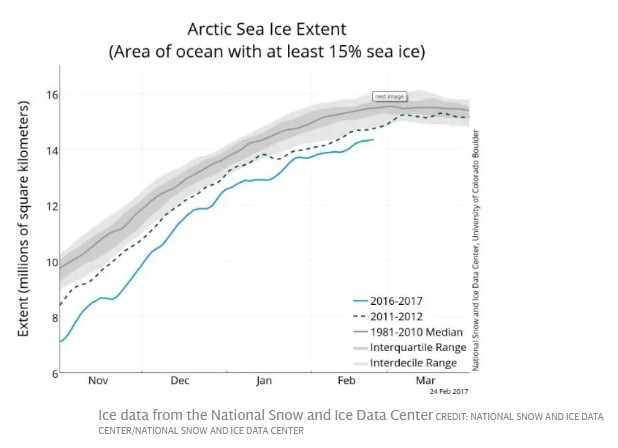
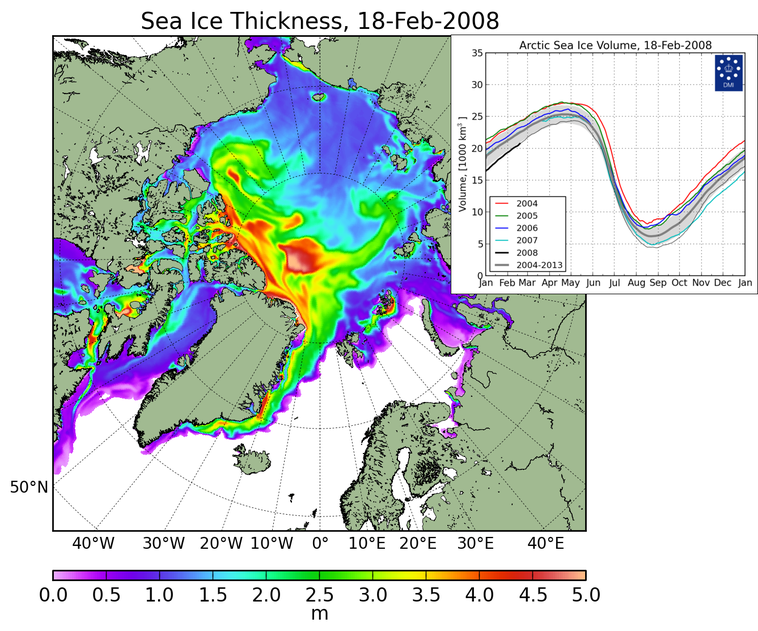
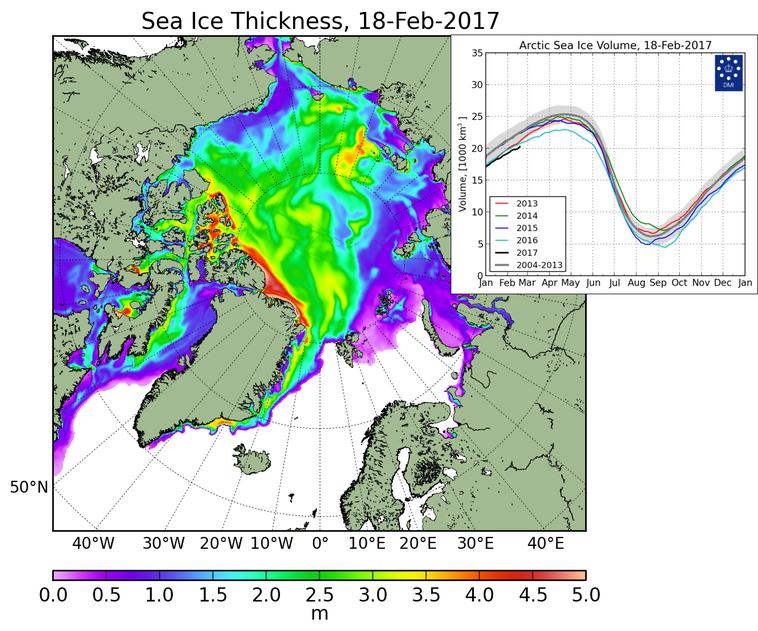
But that ever-diligent blogger Paul Homewood has drawn on official sources such as the US National Snow and Ice Data Center to uncover what is actually happening. Under “Arctic Fake News”, on NotALotOfPeopleKnowThat, he posted a graph showing that last week the extent of sea ice was much the same as it has been at this date ever since 2001. Indeed, according to the Danish Meteorological Institute, there is even more of it today than in February 2006, and it is also significantly thicker. Back in 2008 much of the ice was only a metre thick. Today that has risen to two metres, and in some places four.
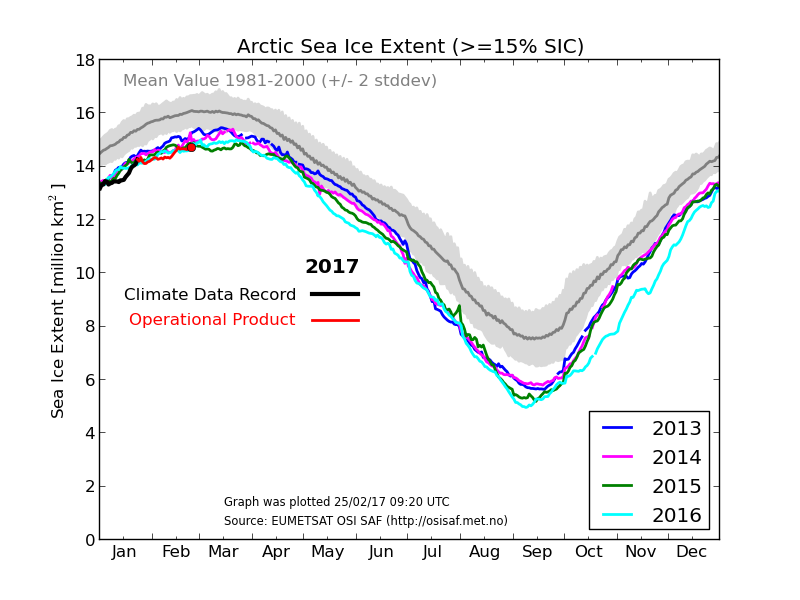
Mr. Booker appears to be more than somewhat confused, since this is what the DMI Arctic sea ice extent graph he links to reveals:
In addition the DMI thickness maps he refers to aren’t available at any of the places he mentions! Not a lot of people know that he was probably thinking of another recent article by Paul Homewood entitled “Arctic Ice Fake News“, which includes these two DMI thickness maps:
Even without considering other sources of Arctic thickness and/or volume data it is quite clear from the two volume graphs that according to the Danish Meteorological Institue Arctic sea ice volume is significantly lower this year than it was in 2008. If Arctic sea ice extent is greater this year and the volume is lower then the laws of physics (which not even the combined talents of Messrs Homewood and Booker can change) dictate that its average thickness must be LESS this year than in 2008!
Mr Booker blunders on:
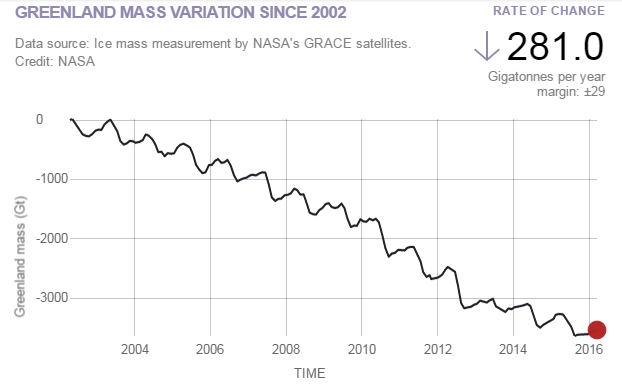
The DMI data also show that the Greenland ice sheet, which we are told is melting at horrendous speed, is actually growing this year at a record rate, to a size way above its average for the past 26 years. And the most authoritative record of Northern Hemisphere snow cover shows this year’s ranking as one of the six highest since 1967.
He seems blissfully unaware that the “DMI data” to which he refers is the output of a DMI climate model that attempts to determine the “surface mass balance” of the Greenland ice sheet. He seems to think it’s a measurement of the mass of the Greenland ice sheet, which it isn’t. However this is, courtesy of NASA:
In his bubble of astounding Arctic ignorance Mr. Booker continues:
The Deplorable Climate Science blog, run by US expert Tony Heller, gleefully reproduces a 2007 headline: “Scientists: ‘Arctic is screaming’, global warming may have passed tipping point”. As Heller comments: “The Arctic is indeed screaming at climate scientists – to shut up.”
Now as luck would have it I have been (vainly!) attempting to persuade Mr. Heller “to shut up” on the very article Mr. Booker references! Let’s take a quick look at a couple of highlights shall we?
It seems safe to assume that Mr. Booker wasn’t reading Mr Heller’s blog on or after February 22nd does it not? Otherwise he would surely have had second thoughts about writing such a ludicrous phrase as “there is even more of it today than in February 2006”?
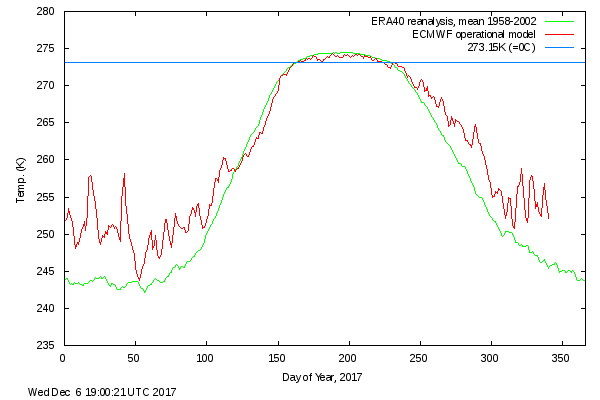
Then of course there’s the burning question of the “Hottest Arctic on record”
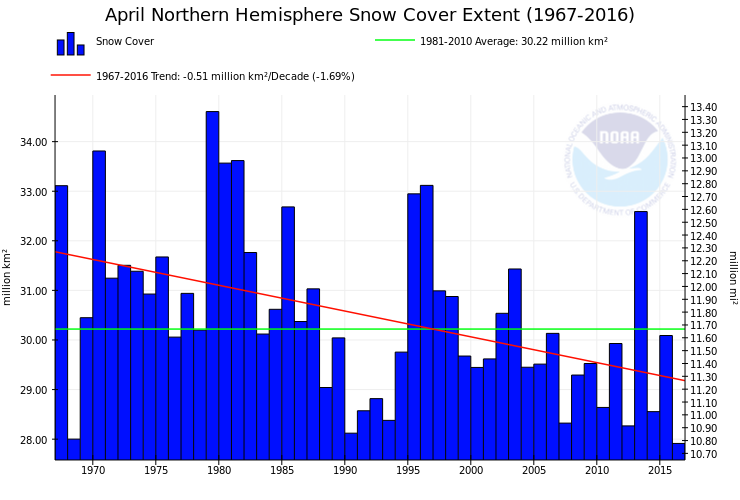
You seem to have forgotten about spring Gail? Here’s April:
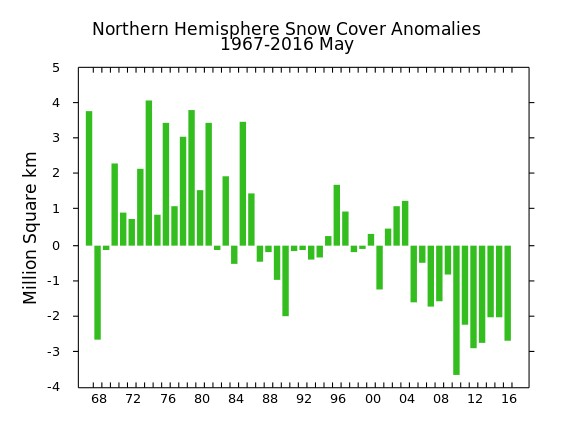
Here’s the May graph from “the most authoritative record of Northern Hemisphere snow cover” for good measure:
To summarise, Messrs Booker and Homewood could have confined their due diligence on their assorted Arctic articles to reading my comments on Mr. Heller’s blog. Having done so it would quickly have become apparent to them that every single point they made was in actual fact a “fake fact”.
The inevitable conclusion is that they have no interest whatsoever in establishing the actual facts about the Arctic. All they are interested in is propagating “fake news” about the Arctic as far and as wide as possible in pursuit of a common “agenda”. As is David Rose.
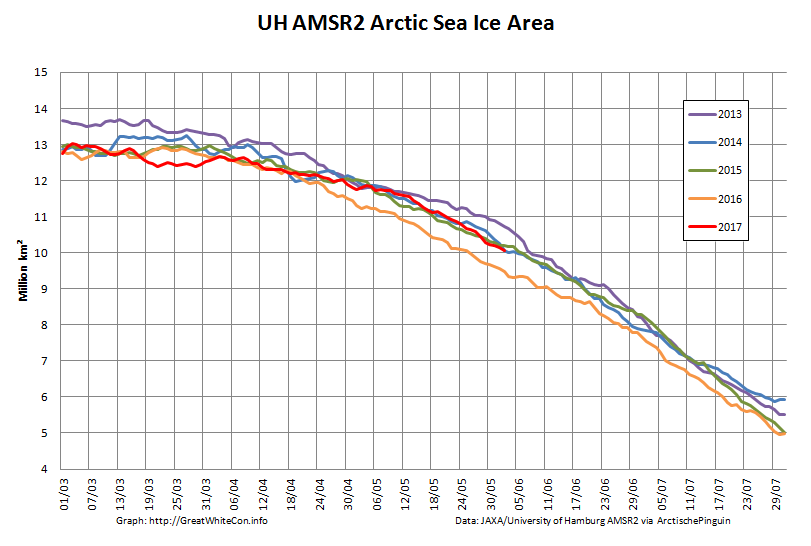
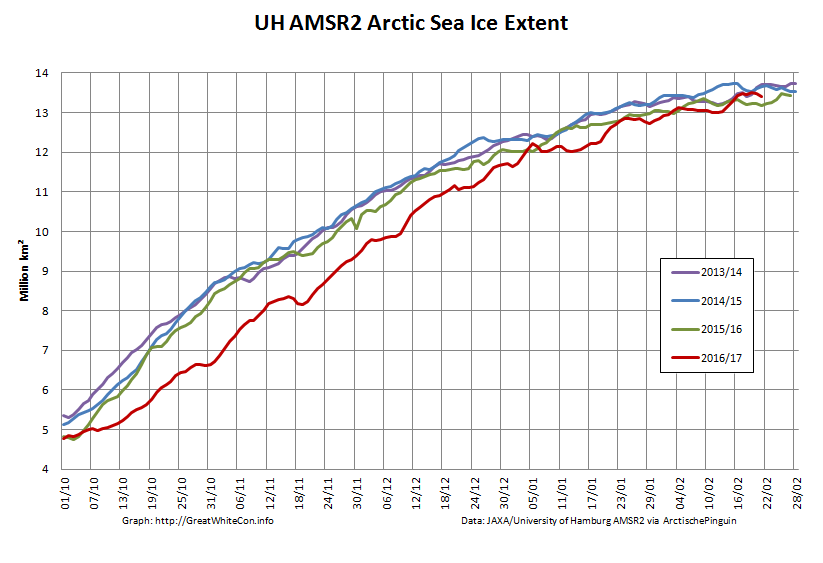
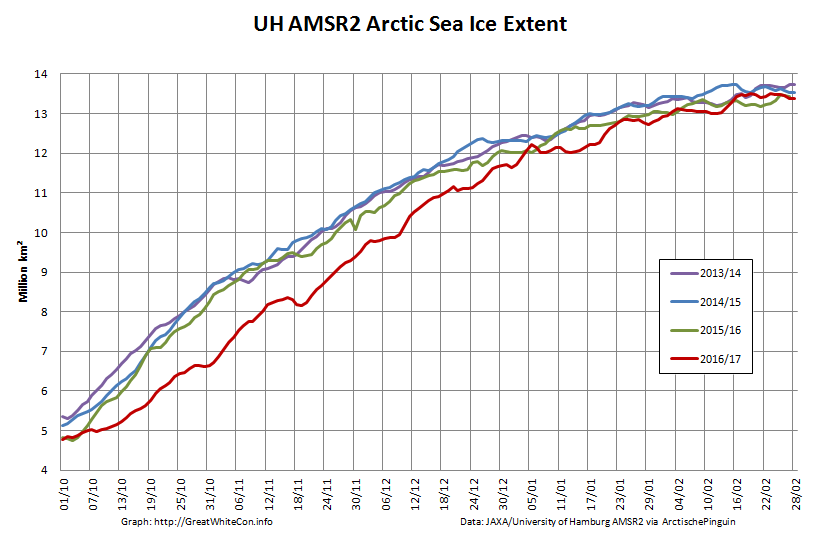
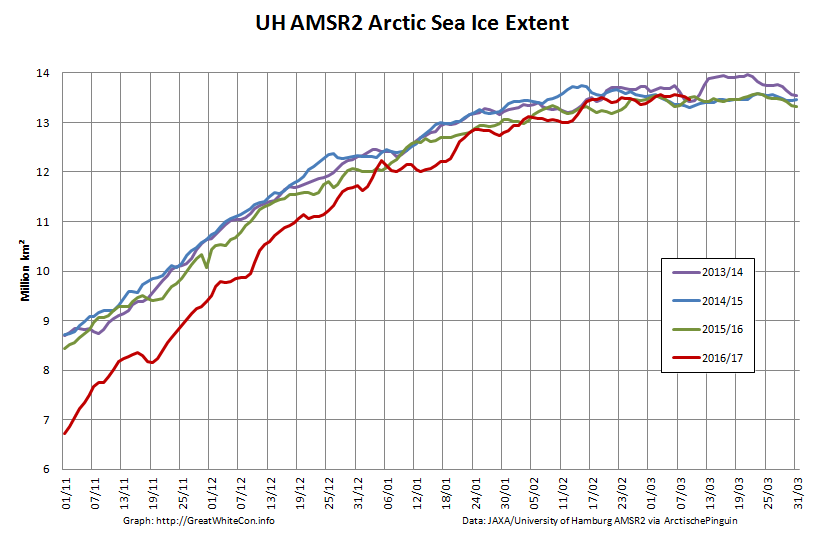
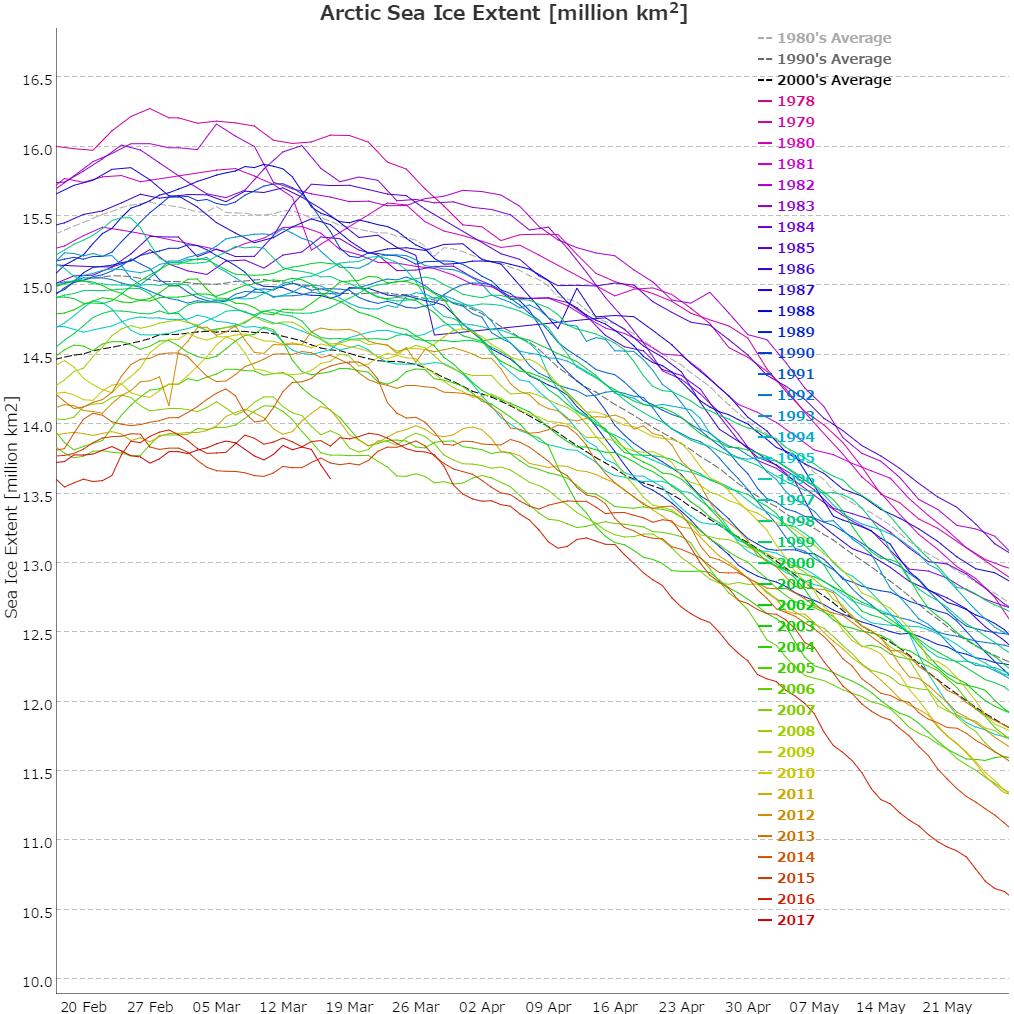
It’s far too early to be sure about this yet, but it’s not beyond the bounds of possibility that the 2017 maximum is already in place. Here’s our favourite high resolution extent graph calculated by “Wipneus” from University of Hamburg/JAXA AMSR2 data:
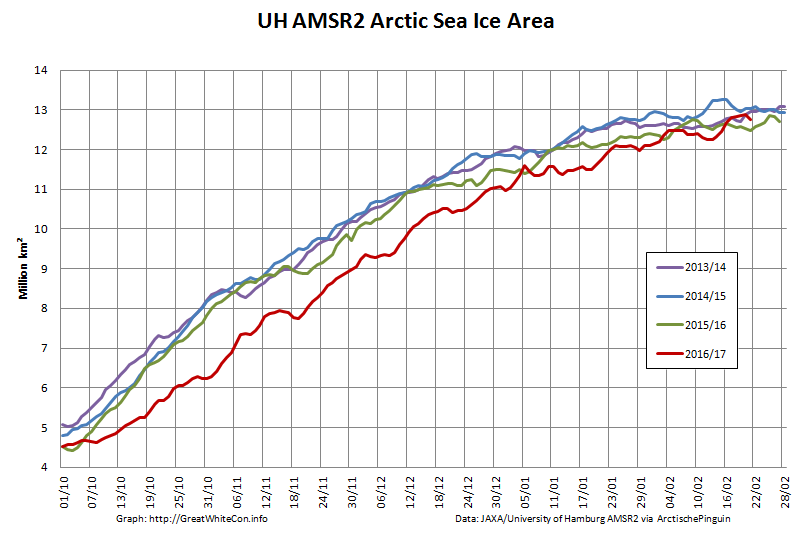
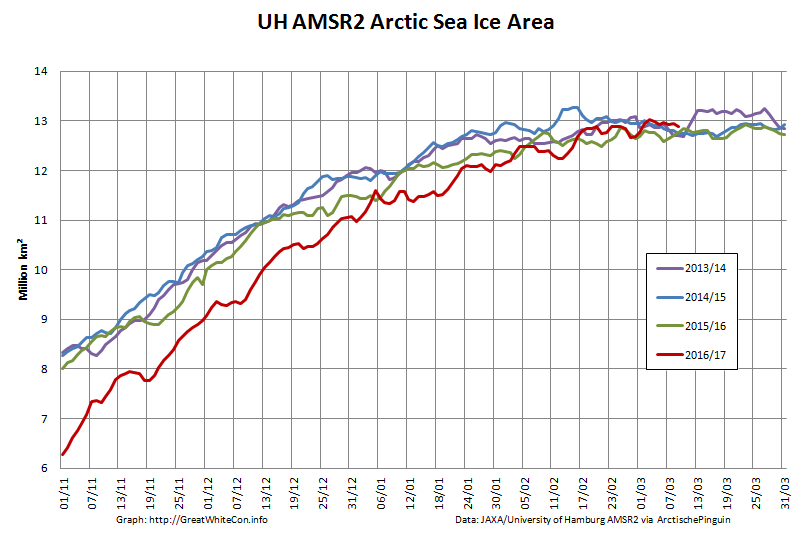
The current maximum Arctic sea ice extent for 2017 is 13.49 million square kilometers on February 19th. Here’s Arctic sea ice area for good measure:
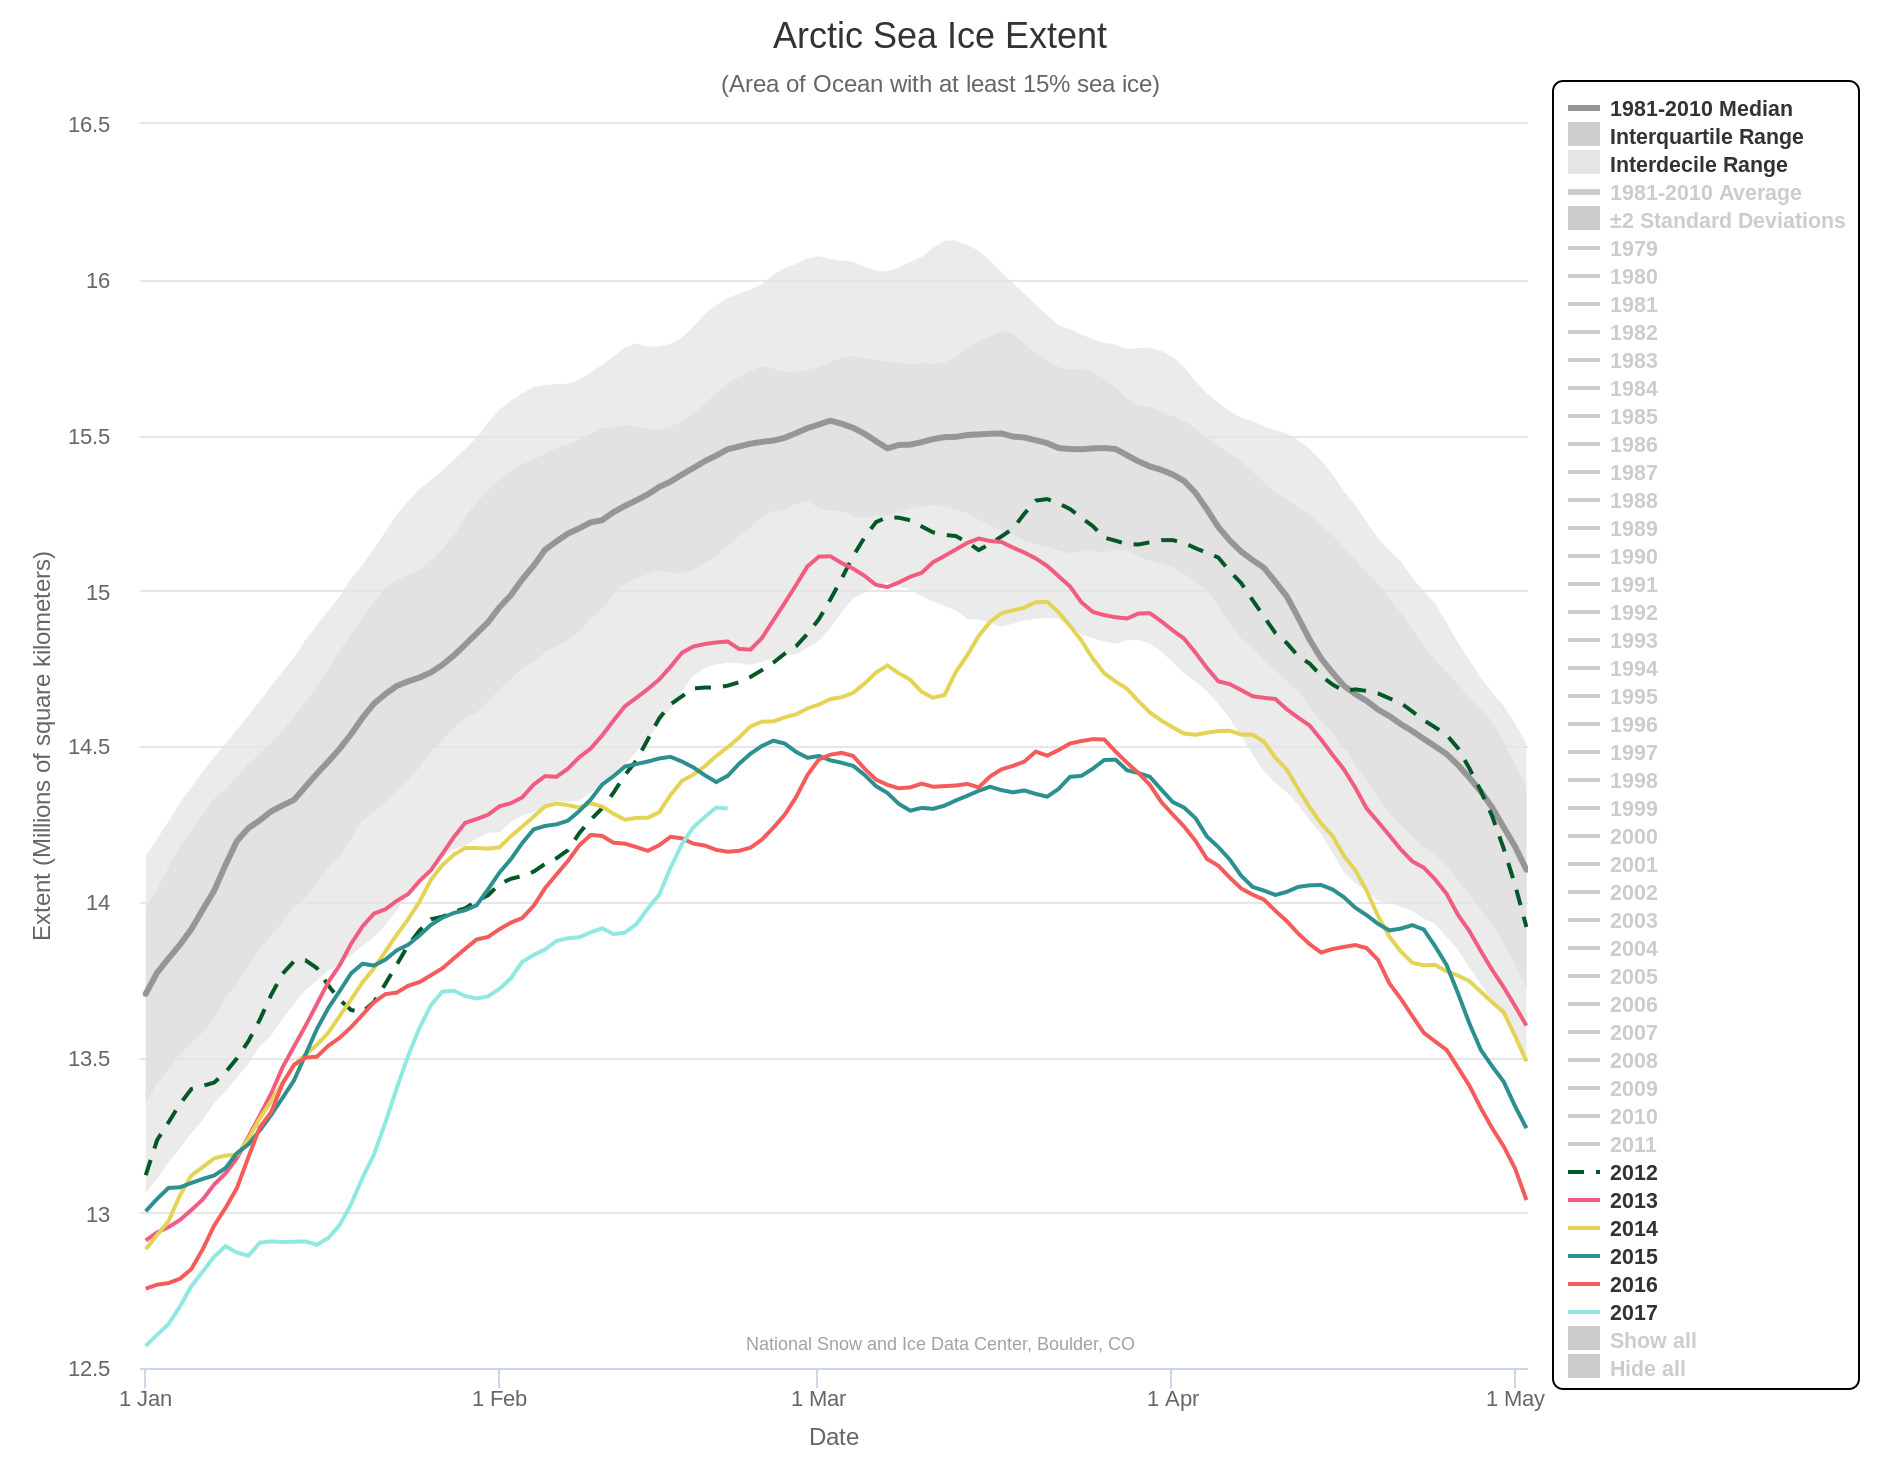
The current maximum area for 2017 is 12.88 million square kilometers on February 20th. Here also is the NSIDC’s 5 day averaged extent:
This reveals a current maximum extent for 2017 of 14.302 million square kilometers on February 20th.
[Edit – March 1st]
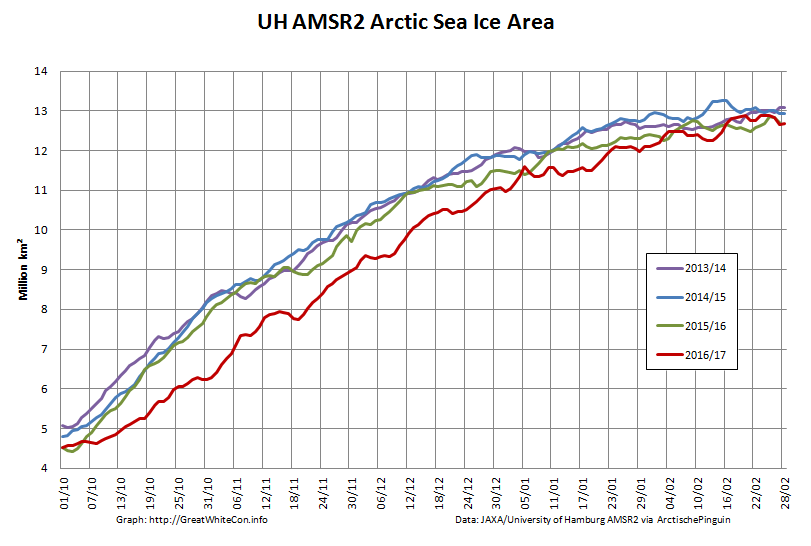
Here are the high resolution AMSR2 area and extent graphs for the end of February:
With each day that passes the highs of February 19th/20th look more likely to have been this years maximum. Nonetheless past experience suggests it’s still far to soon to be sure about that.
[Edit – March 10th]
Arctic sea ice area and extent are declining again, having reached new heights for the year on March 3rd:
However the 2013/14 winter showed a late surge is still possible.
[Edit – March 18th]
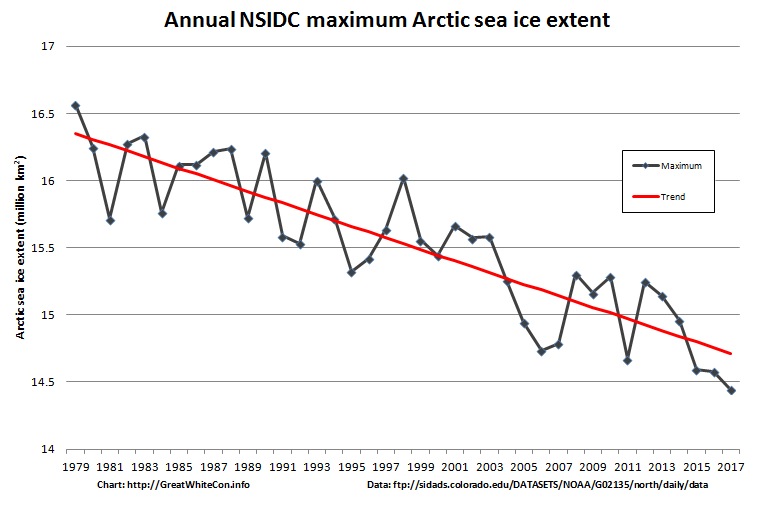
A “late surge” is looking increasingly unlikely. That being the case, here is our provisional long term graph of NSIDC daily Arctic sea ice extent:
Subject to an unanticipated “surge” the 2017 maximum of 14.447 million square kilometers occurred on March 5th.
JAXA extent has dropped steeply over the last couple of days, and it is now once again “lowest for the date since records began”:
The 2017 JAXA maximum of 13.878 million square kilometers occurred on March 6th.
In the continuing absence of updates to Cryosphere Today area, here’s the high resolution Arctic sea ice area graph calculated by “Wipneus” from University of Hamburg/JAXA AMSR2 data:
The maximum for that particular metric was 13.03 million square kilometers on March 3rd.
Here once again is the up to date version of Wipneus’ graphic graphic, this time of global sea ice extent:
As you can see, global sea ice extent has just reached the lowest ever level in the National Snow and Ice Data Center’s satellite records going back to 1979. It was over a month later when the previous record was broken in February 2016, so there is plenty of time for the metric to fall further.
The 2017 curves in the NSIDC’s own extent graphs are coloured in a pale shade of blue. Even so they’re easy to pick out since both Antarctic and Arctic extent are at the lowest level for the date in NSIDC’s records by a considerable margin:
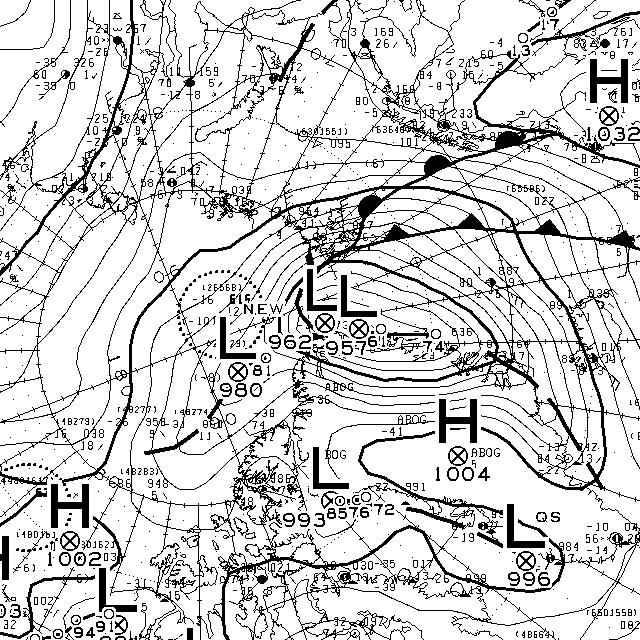
Antarctic sea ice extent is still falling, and the Arctic has been flatlining for several days now and more trouble is heading its way. Another Fram Strait cyclone is brewing, and this time around the storm’s minimum central pressure is already down to 957 hPa according to Environment Canada:
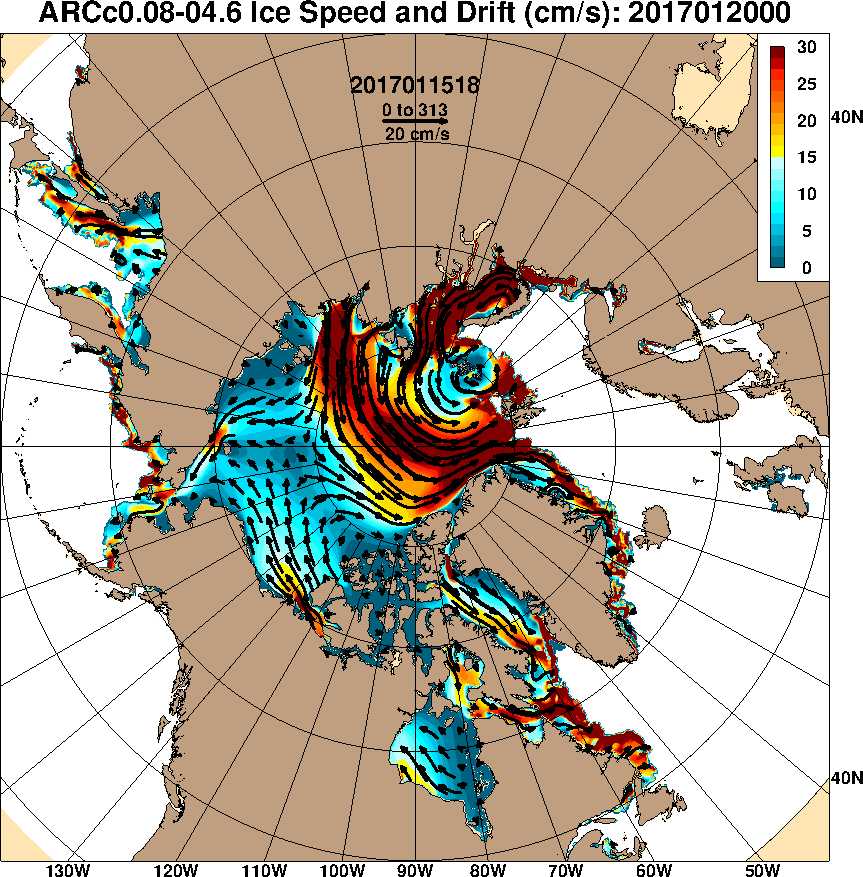
According to the current forecasts it will continue to spin over the central Arctic for several more days, driving export of sea ice via the Fram Strait:
This website uses cookies to improve your experience. We'll assume you're ok with this, but you can opt-out if you wish. Cookie settingsACCEPT
Privacy & Cookies Policy
Privacy Overview
This website uses cookies to improve your experience while you navigate through the website. Out of these, the cookies that are categorized as necessary are stored on your browser as they are essential for the working of basic functionalities of the website. We also use third-party cookies that help us analyze and understand how you use this website. These cookies will be stored in your browser only with your consent. You also have the option to opt-out of these cookies. But opting out of some of these cookies may affect your browsing experience.
Necessary cookies are absolutely essential for the website to function properly. This category only includes cookies that ensures basic functionalities and security features of the website. These cookies do not store any personal information.
Any cookies that may not be particularly necessary for the website to function and is used specifically to collect user personal data via analytics, ads, other embedded contents are termed as non-necessary cookies. It is mandatory to procure user consent prior to running these cookies on your website.