In the absence of the usual mid month PIOMAS Arctic sea ice volume update I’m being moaned at by “angech” over on Judith Curry’s “Climate Etc.” blog:
Any ideas on why PIOMAS mid month update not out, other than not wanting to show a big recovery?
Unlike any of Judy’s denizens I checked out the comparatively new merged CryoSat-2 plus SMOS thickness maps from the Alfred Wegener Institute. “Measured” rather than “modelled” data must be a good thing surely?
Just in case there’s some significant difference between the “reanalysis” and “operational” versions of that product, here is the AWI’s most recent reanalysed Arctic sea ice thickness map, for the week ending January 11th: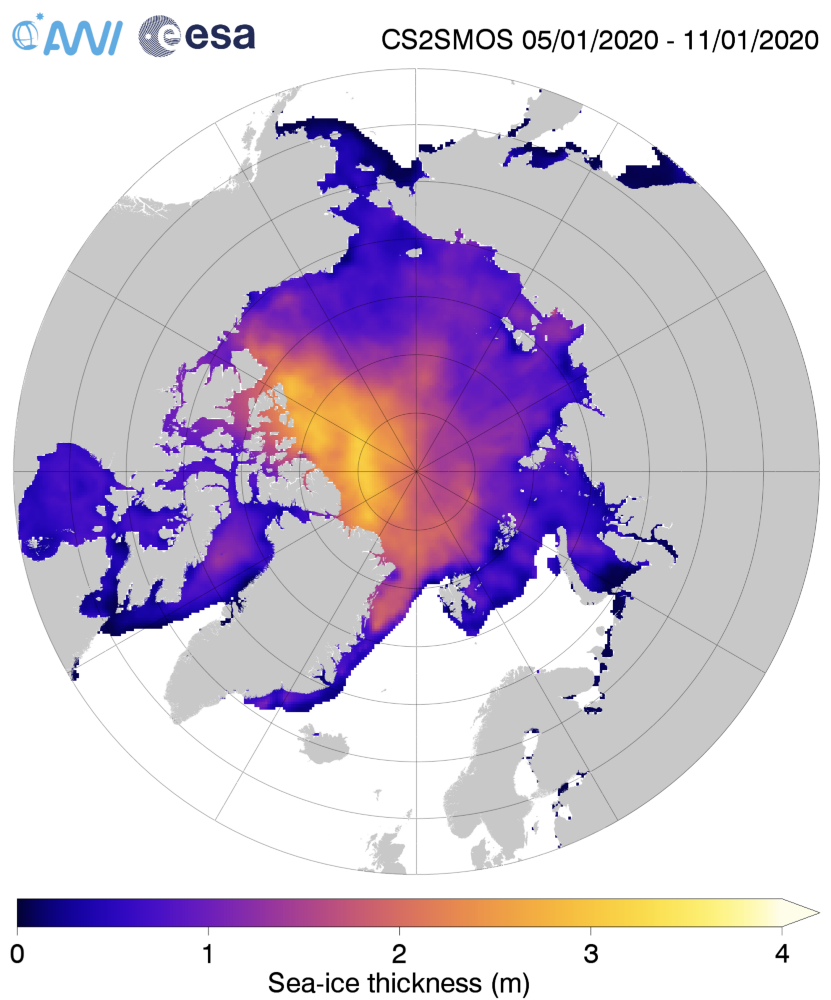
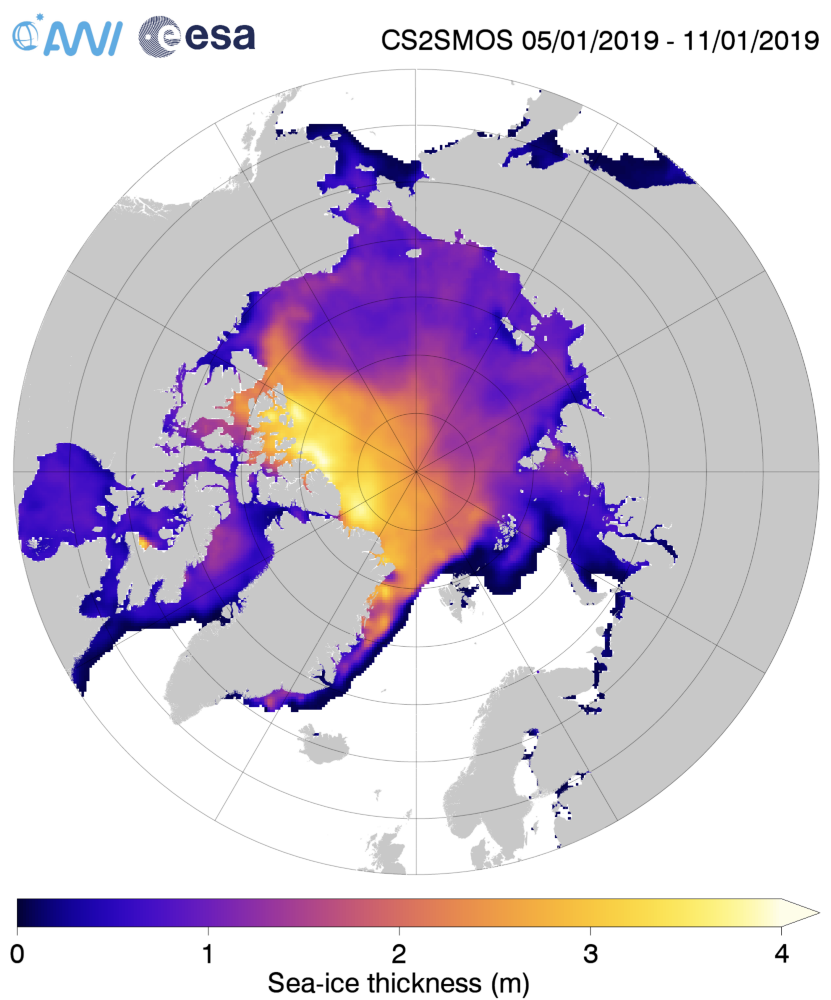
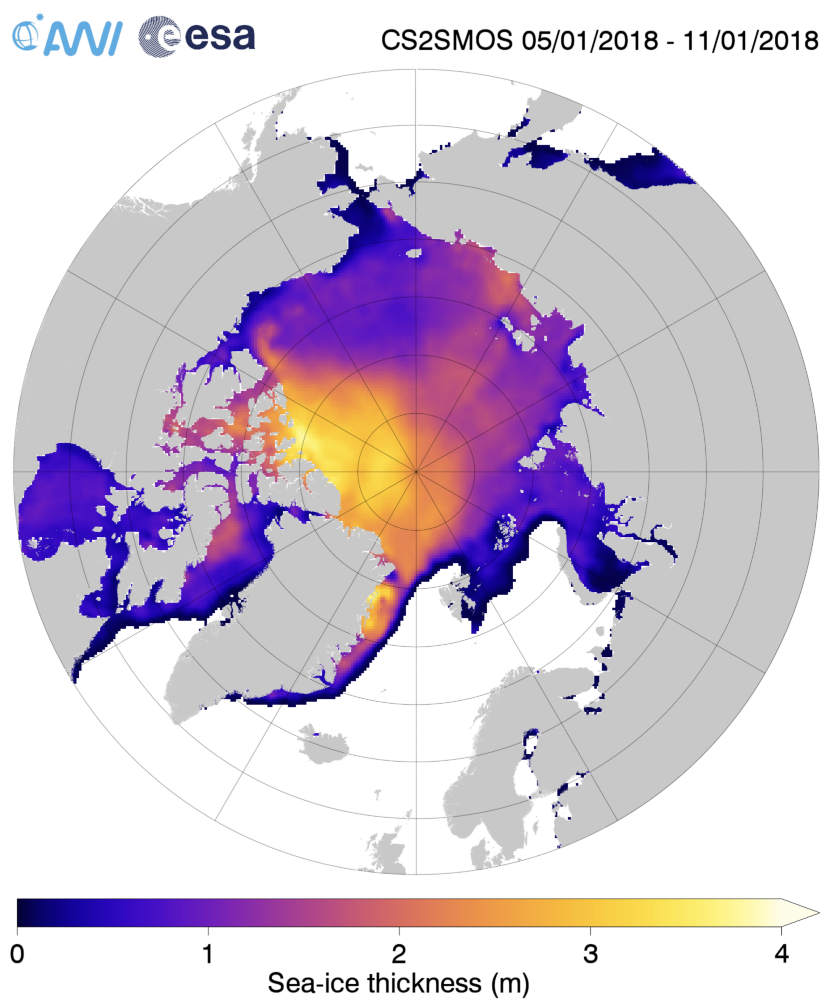
together with the same date from the previous two years:
Make sure to take a close look at the white areas north of Greenland and the Canadian Arctic Archipelago showing sea ice over 4 metres thick.
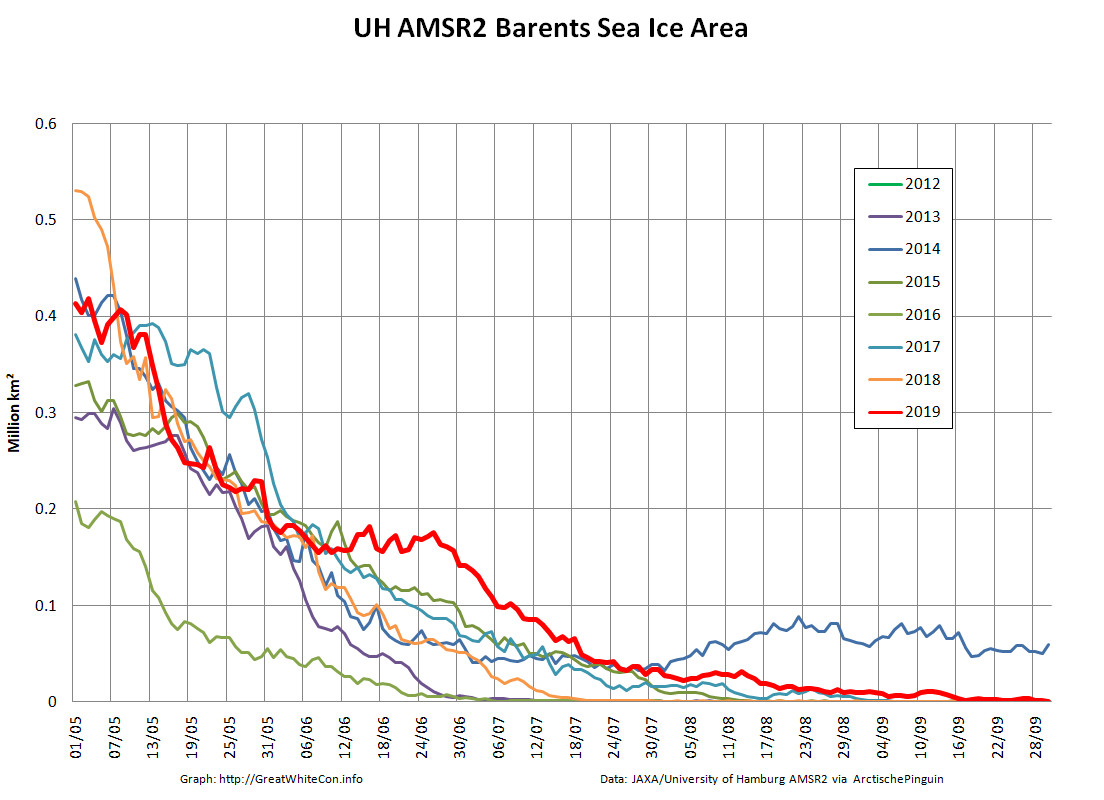
Over the winter of 2018/19 ASCAT revealed that there was a relentless movement of multi-year ice towards both the North Atlantic and the Beaufort Sea.
Not unexpectedly that meant that ice in the northern Barents Sea was slow to melt out in the summer of 2019:
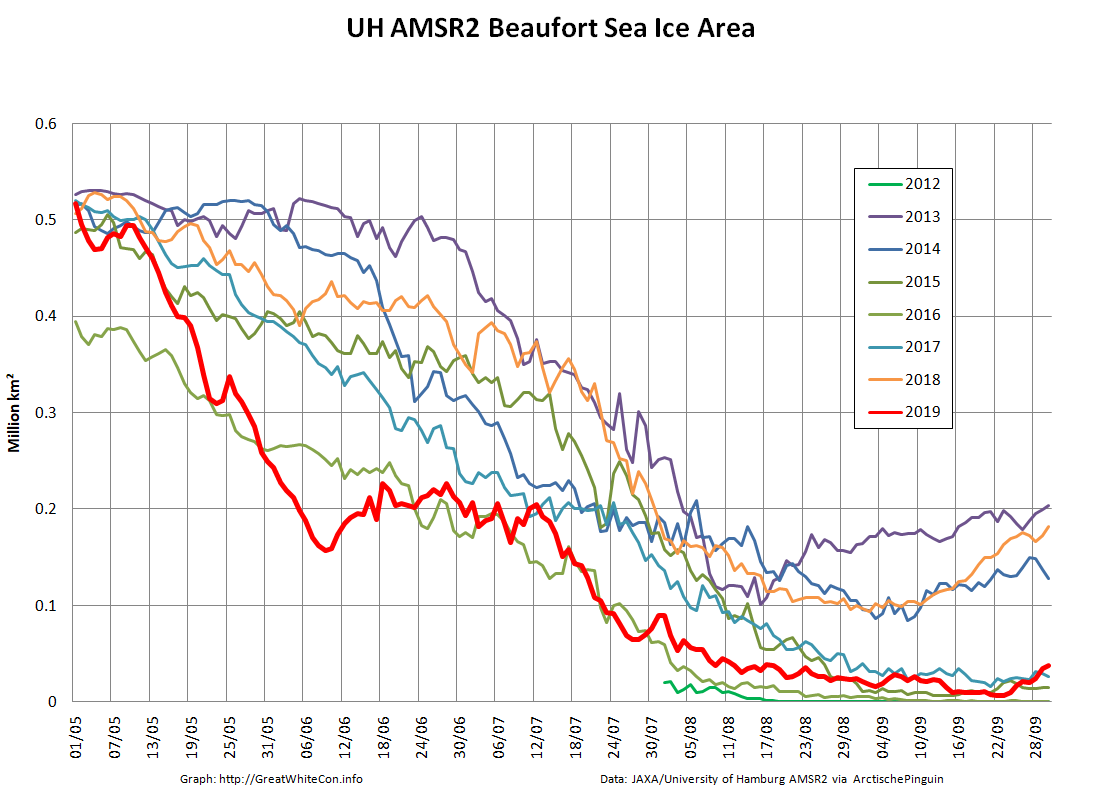
whilst after a fast start the melt in the Beaufort Sea also suffered a “brief hiatus” in June before ultimately melting out almost completely as well:
Perhaps a significant amount of the multi-year ice that survived the winter of 2018/19 has now simply melted away in warm water, to be replaced by much less robust first year ice in the area between the North Pole and the Siberian coast? It will be very interesting to see what the next PIOMAS update in early February reveals.
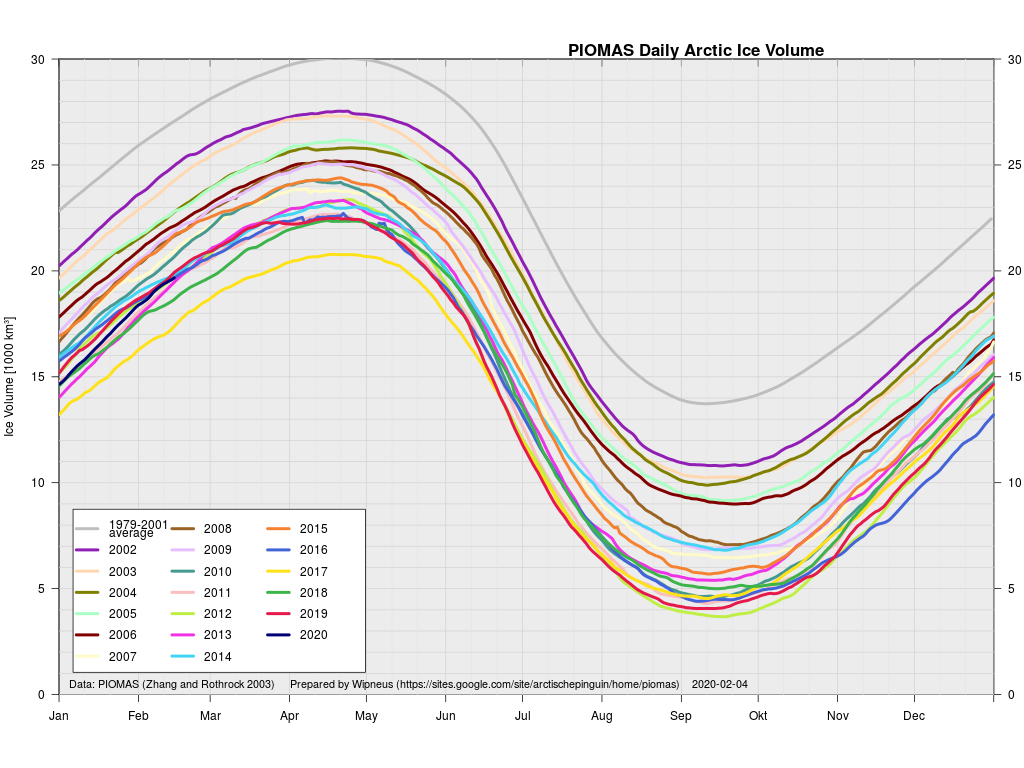
The next PIOMAS update referred to above has now arrived. Here’s the Polar Science Center’s graph:
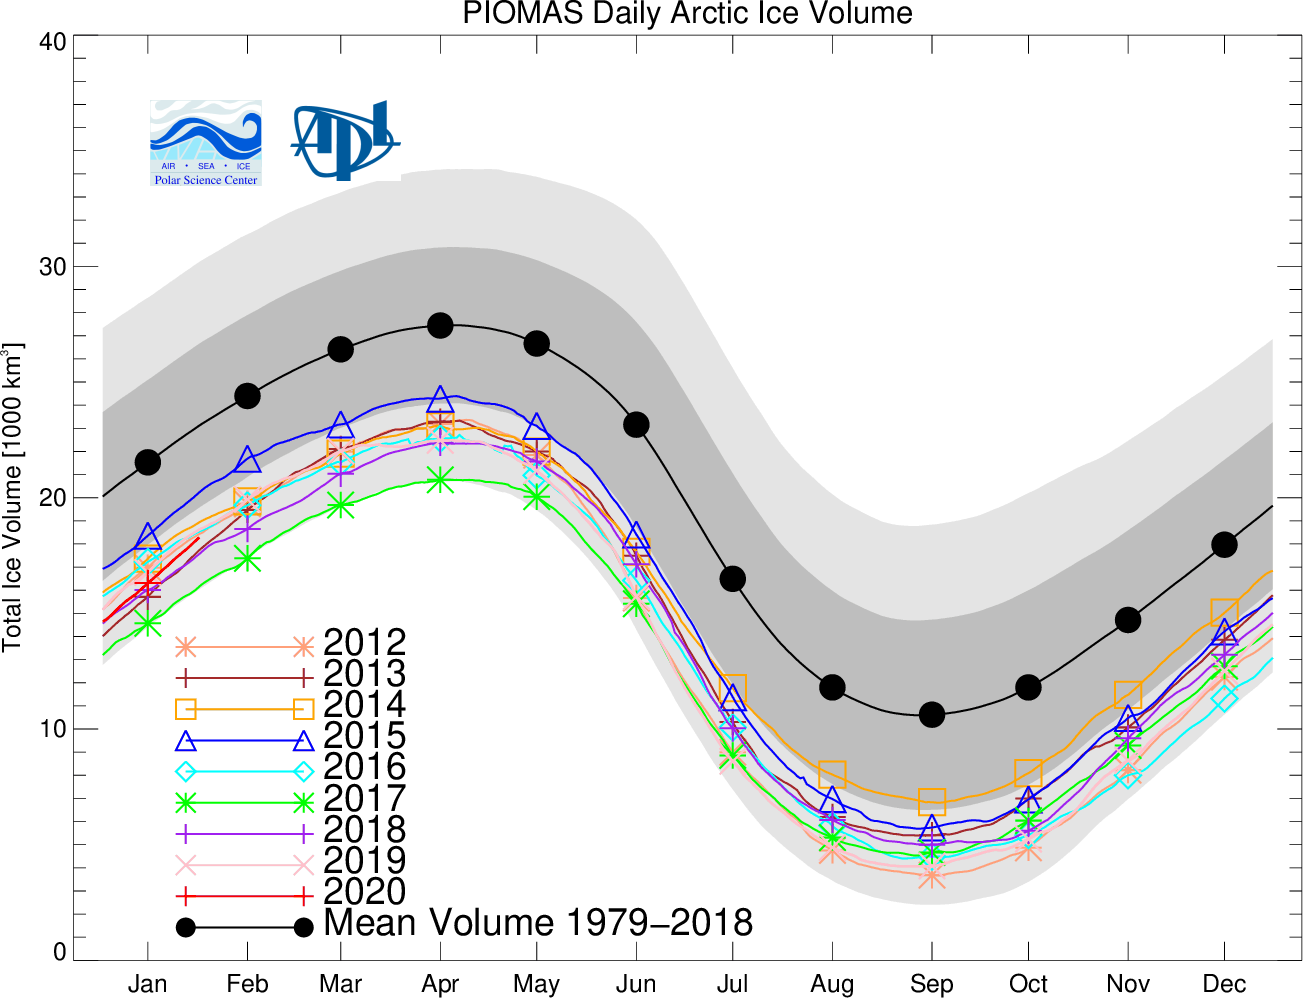
Over on Climate Etc. angech is already exclaiming:
Strange it did go up a fair bit the old PIOMAS.
No publicity at the usual going down sites.
Actually it’s not at all strange, because thus far this winter the polar vortex has been remarkably well behaved. By and large cold air air has stayed in the Arctic. There hasn’t been much in the way of cold air intrusions into mid latitudes or warm air intrusions into the Arctic.
Hence it’s not at all surprising that the thickness of sea ice in the Arctic has been increasing slightly more quickly this winter than in other recent years. By way of some longer term context, here are the official Polar Science Center min/max trends:

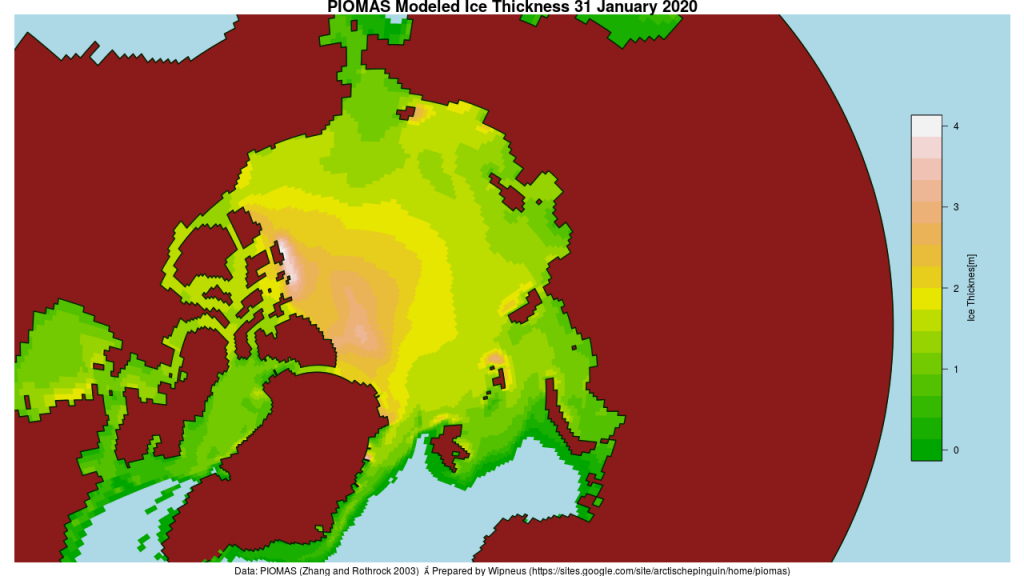
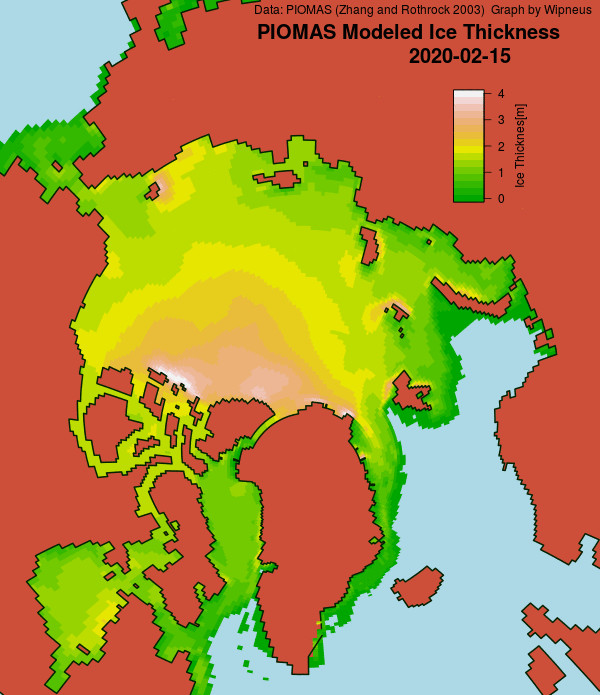
Wipneus has just released the January PIOMAS gridded thickness map. Here it is:
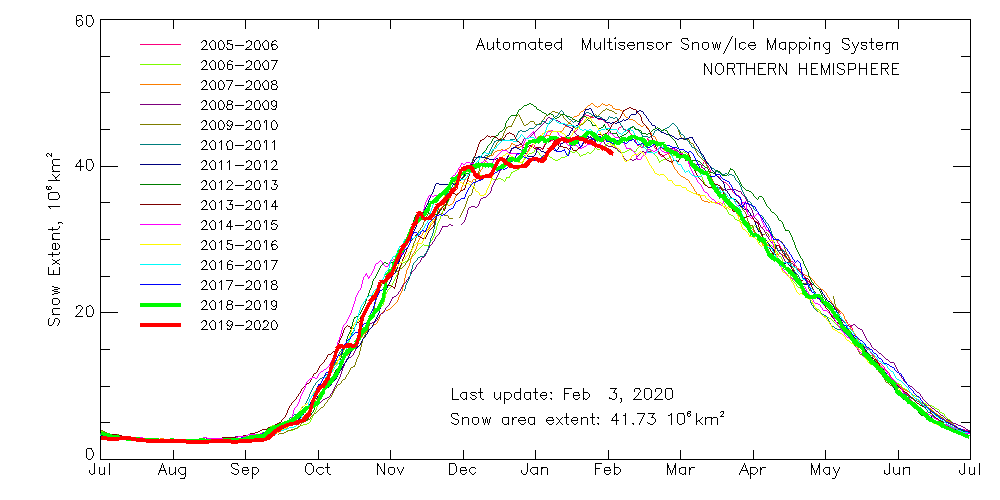
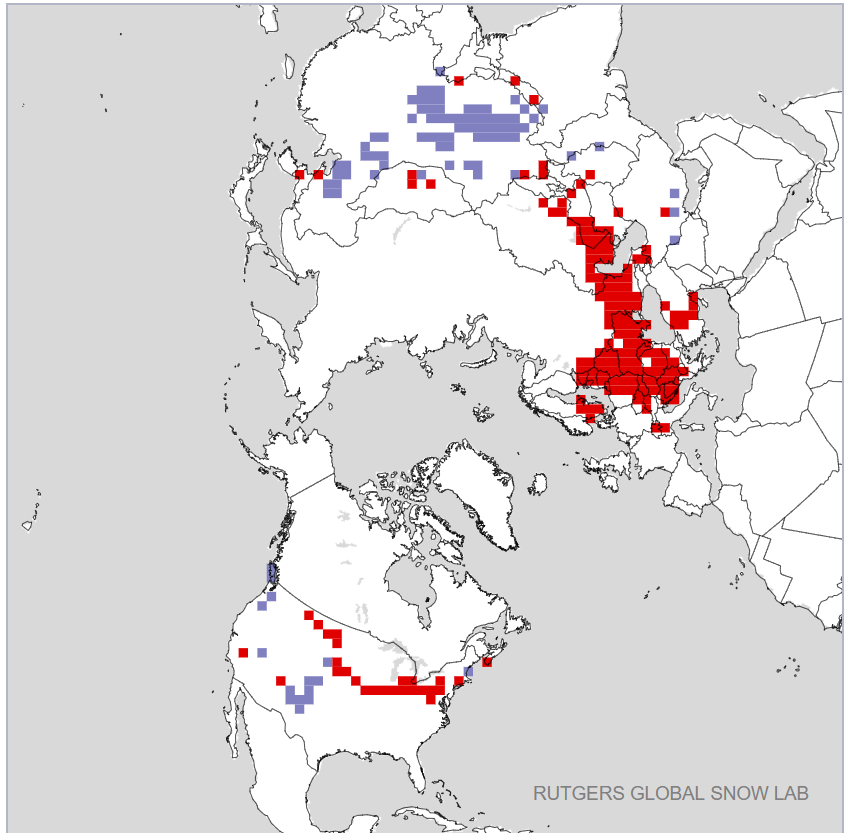
As is all too frequently the case, AdR and other commenters below get very excited about trivial increases in sea ice extent without considering snow extent. One side effect of the lack of cold air outbreaks into mid latitudes so far this winter currently looks like this:
The AWI and PIOMAS sea ice thickness maps above look somewhat different at first glance. That being the case, I’ve written a program to crunch the AWI numbers. Here’s the result:

The source code plus raw and processed data can be accessed via the Arctic Sea Ice Forum:
“CryoSat-2/SMOS Arctic Sea Ice Volume”
Further support for my “polar vortex” theory, from Judah Cohen no less!
I think this plot best sums up the #winter for the Northern Hemisphere –#PolarVortex strength bouncing around from near (daily) record strong to normal all winter long. One more near record strong (PV) for latter half of February. Pretty much the nail in the coffin on this winter pic.twitter.com/OiSZw07VOF
— Judah Cohen (@judah47) February 10, 2020
Here’s the latest update of our novel NRT volume metric:
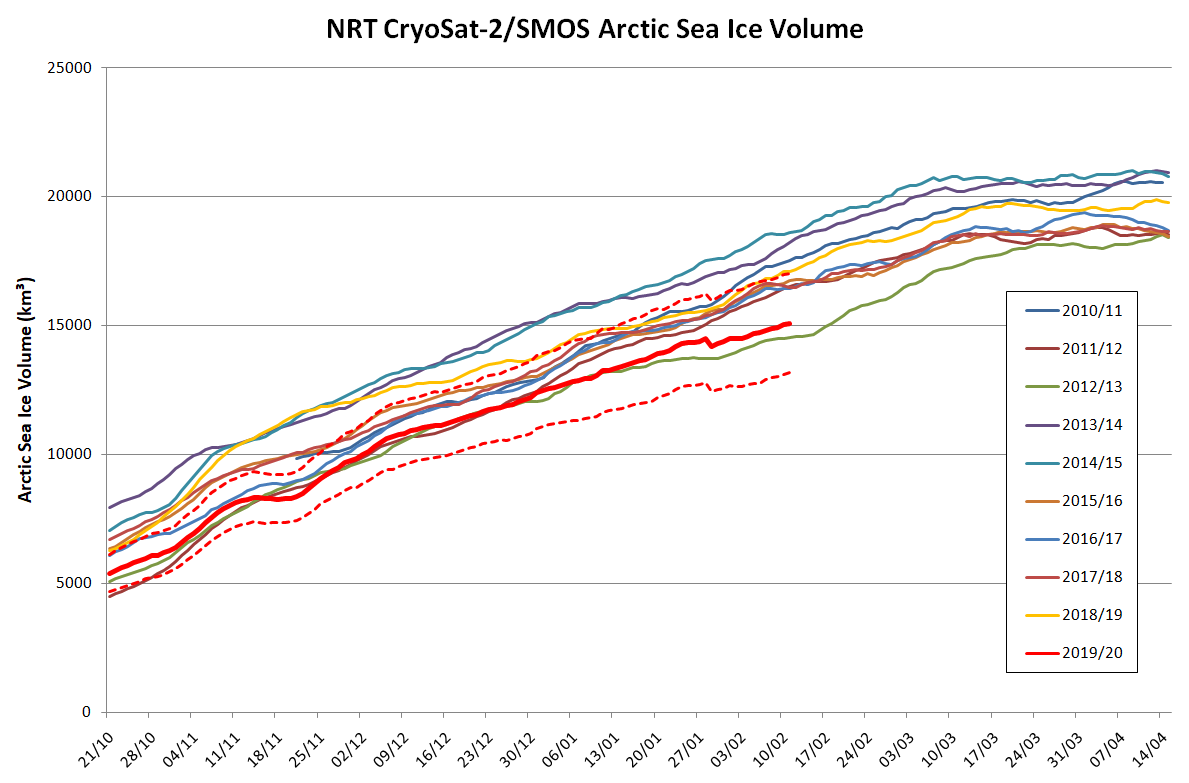
Please note that there is a known problem with the NRT data from January 31st onwards.
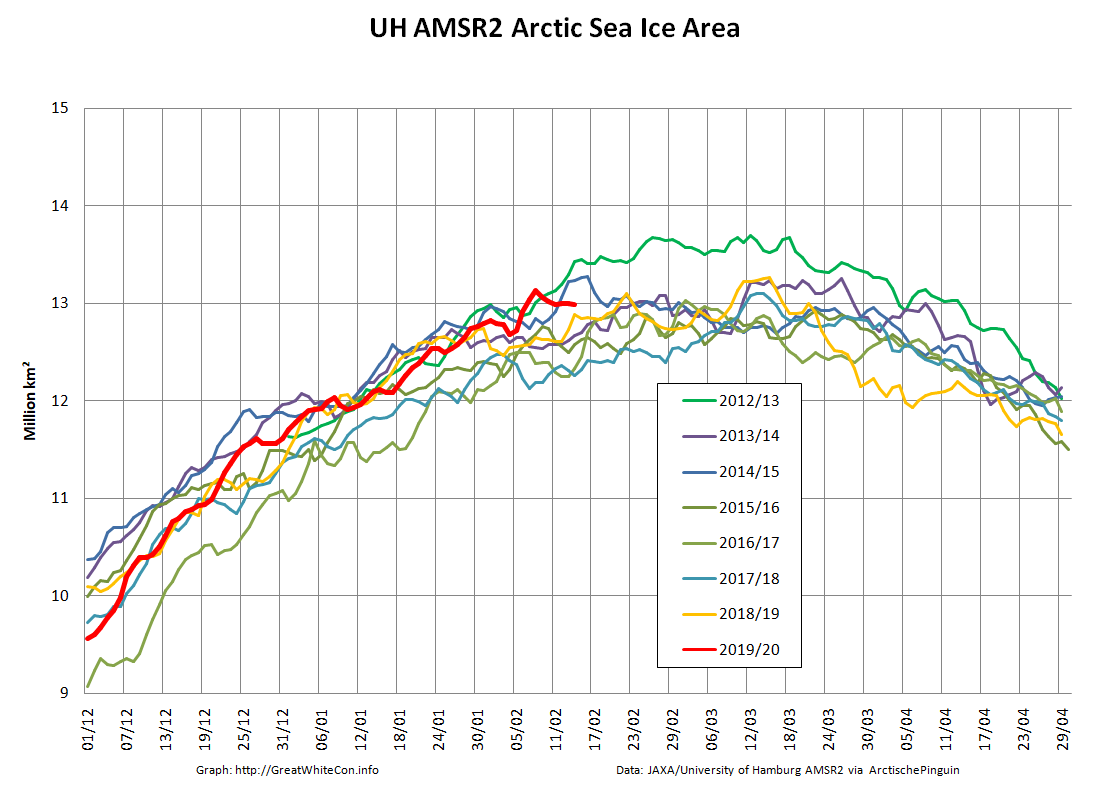
Here too are Wipneus’ latest high resolution AMSR2 area and extent graphs:

Wipneus has released his usual mid month PIOMAS update on the Arctic Sea Ice Forum:
I am forced to ponder once again why the CryoSat-2/SMOS thickness “measured” numbers just above seem to be more at variance with PIOMAS in 2020 than in previous years:

Here’s another weekly NRT volume update:

This time I’ve left off the NRT data from February 6th onwards, since the “issue” referred to above obviously hasn’t been solved yet. As an added bonus here’s a graph showing the trends (or lack thereof) on 3 dates during the October to April freezing season:

“”It will be very interesting to see what the next PIOMAS update in early February reveals.”
Wipneus usually does a mid month update of PIOMAS, also missing.
should have been out a week ago. If it was dropping it would have been out straight away.
Video is fantastic, thanks.
Last year the sea ice did a massive jump twice after a slow refreeze start and then died at the end.
Similar pattern this year. Only of interest if it were to change.
Hi angech,
Thank you for your kind words!
The PIOMAS team started issuing the mid month updates as a favour to the members of the Arctic Sea Ice Forum:
https://forum.arctic-sea-ice.net/index.php/topic,119.msg116175.html#msg116175
If they currently have other matters to attend to so be it! In the meantime here is Wipneus’ most recent “PIOMAS delta” map for your delectation:
A heads up regarding DMI volume from Ruth Mottram on Twitter:
Here’s a novel “near real time” thickness product from Christian John on Twitter:
I’m not quite clear on his methodology as yet, but it involves merged CS2/SMOS thickness and AMSR2 extent! More later hopefully.
What I like is our air of constant bravado despite the setbacks of the obvious.
Like Monty Python’s Black Knight.
Out of ammo, out of limbs, we fight on regardless.
Is this the same Ruth Mottram of DMI fame?
The organisation that copped heaps for showing sea ice volume expanding rapidly 4 years ago?
Who took a 3 month break to adjust their algorithms?
Then came out with a much lower result.
Poor girl.
And you thought I was referring to climate sceptics defending the indefensible.
–
There must be at least 3 products defining sea ice volume.
They should all agree somewhat surely?
No.
The marvels of science, repeating an experiment 3 times and getting 3 different answers.
I cherry picked my best one.
Only 2 weeks to see if my prediction on Piomas is correct.
Mild snark is all us armless, legless crittur’s can manufacture these days.
(Don Lemon ref*)
I don’t think you’ve clicked my alter ego’s link angech? If you did you certainly missed my “cherry picking” point!
FYI Steve/Tony still hasn’t allowed my pertinent comment out of moderation over at the Deplorable Client Science Blog.
It seems Steve/Tony neglected to block me again when he revealed his true identity on Twitter!
A new day has dawned, over here in the once Great Britain at least. Tony Heller has still not released my Arctic comment from purgatory, or anybody else’s as far as I can see:
I hope Tony and Toto are both OK?
One of my comments has now emerged from invisibility at the Deplorable Climate Science Blog. However something even more strange than usual is going on over there:
It seems Steve/Tony and Toto have been frantically busy editing an Arctic sea ice themed video:
The graph’s subtitle is misleading enough!
Which graph are you referring to David?
There’s a fair few to choose from! DMI volume?
Oh, sorry, Jim. Forgot all about this.
I meant that I’m observing a major science denier stating the planet has had its “ten hottest years on record,” when “hiatus” was all I heard from these people until just a few years ago.
Their dark little corner keeps getting smaller and smaller.
Their corner has got darker still David, hard though that may be to imagine. I accidentally found myself in the midst of Roger Pielke Jr.’s Twitter meltdown yesterday:
Steve/Tony still hasn’t answered any of my (im)pertinent questions, so:
Looks like PIOMAS results are out, volume ramp slightly faster than normal (for mid-January), roughly middle of the pack compared to recent years, and roughly in line with DMI numbers. Net, net, pretty ordinary. Wonder what the spin will be?
Hello again Taylor,
I’ve already shown you the spin from Tony Heller. Total and utter ballcocks as per usual!
Or isn’t that the sort of “spin” you had in mind.
Note that my PIOMAS update above preceded your comment. Have you read it yet?
Ok, so the spin is (reading your recent posts) that when previously touted metrics like volume and extent aren’t behaving appropriately (ie plummeting), then switch to metrics (snow cover) which have been previously ignored (too high) and are now low, making your case. I would prefer to stick with one suite of metrics and see where that takes us.
For example, has the ‘death spiral’ stalled? What would cause it to restart? Reverse? What period is appropriate to determine its direction?
What have you been smoking Taylor?
Snow cover information has been available on our Sea Ice Graphs page for ever and a day. See also:
https://GreatWhiteCon.info/tag/snow-cover/
As for the volume “death spiral”, please see the PIOMAS trend graph helpfully provided for your enlightenment just above.
Sorry for the confusion, I was referring to the spiral trend over the last 10 years. Flat or only barely down, depending on whether you pick high point or low point. Starting the trend in ‘79 has been commented on before, pretty much guarantees a long-term downward direction on both, as you know (‘scientists warn of coming ice age’ and all that). It appears that April 2020 will make it 11 years of flat on the high side, as others pointed out, anybody’s guess on the September trend at this point.
Here’s Andy Lee Robinson’s original “death spiral”:
So you’d like to cherry pick 2009 as your starting point? April 2019 looks significantly lower to me? As indeed does September!
Good to see what appears to be an above average increase. Only a hunch but feel like we could be in for another year like 2013, where we get a bit of a rebound in extent. In the near term, I think once this years strong polar vortex breaks down a cool NH spring will follow (nature try’s to balance short term anomalies) and a delayed melting season.
Hi AD (assuming I’ve interpreted your handle correctly),
See my February 5th update above:
As the sun sneaks above the horizon in the far north as spring progresses it starts melting snow long before it starts melting sea ice.
What does nature do with long term anomalies?
Don’t disagree that snow at lower latitudes will melt long before sea ice. The lack of snow is mostly confined to Europe and KZ, and it wouldn’t take much of an “event” to redress this anomaly. This is what I was eluding to with my hunch (and only a hunch)- I wouldn’t be surprised to see some belated significant snowfall in Europe when the polar vortex breaks down at the end of this winter, and ultimately a delayed NH spring.
It’s clear the strongly positive AO and NAO this winter has been beneficial to Arctic sea ice so far, but detrimental to NH snow cover/temperatures. However, what that means for Arctic sea ice come September is beyond meaningful prediction.
As far as excitement regarding a minor uptick, I’m just interested to observe and understand, because there is a hell of a lot we don’t understand despite what some people will claim.
Quite so AD.
As I have stated numerous times, let’s see how things look in May before jumping to any hasty conclusions about what the 2020 Arctic sea ice melting season might bring?
Here’s the latest update on the novel CryoSat-2/SMOS volume metric:
Note that Stefan Hendricks has flagged up an “issue” with the CryoSat-2 NRT data:
https://spaces.awi.de/display/SIRAL/2020/02/11/CryoSat-2+-+missing+NRT+data+in+baseline-D
The NRT Level-1 data to the CryoSat-2 sea ice product is missing several orbits, mostly in the Russian Arctic as can be seen in the figure below.
Especially for angech, 2020 JAXA Arctic sea ice extent compared to 2012:
Regular readers may recall that the summer of 2012 resulted in lowest minimum extent of the satellite era?
Who would’ve thunk it?
Thanks Jim,
I am happy to stay quiet and wait and watch.
Still do not understand how and why the main volume assessments regularly mismatch but cross over at the same time each year.
Suggests an algorithm problem
Keep a close eye on JAXA extent then angech. Here’s their latest update:
Conspiracy theorist? Moi?
A slight uptick in JAXA extent yesterday:
Perhaps it’s time to open a 2020 maximum extent thread?
There was a 5C spike on DMI today but that’s 9 days later….
The “spike on DMI” happened as predicted. This is from February 20th:
And has since plummeted… Frankly, these trends are so variable (and dependent on weather) that they are dangerous to rely on, whichever side of the debate you’re on. DMI today has Arctic temps at the average of 1958-2002, for example, and volume in the 2SD range of 1981-2000, but that doesn’t imply much about max or min values, IMHO
Oops, meant extent, not volume. Volume has a way to go, but has been trending lower than in recent years. Looking forward to the take from PIOMAS
It has indeed “plummeted”:
The usefulness of DMI’s Arctic temperature numbers are certainly debatable, but are often quoted by the “skeptics” amongst us. I’m afraid it amused me more than somewhat to predict the recent spike just as Tony Heller was announcing “Arctic Winter Temperatures Down Several Degrees Since 2016”. Perhaps more useful is the derived “freezing degree days” metric, but we can continue that conversation over on the 2020 maximum thread.
Piomas website
“February ice thickness anomalies from PIOMAS agree well with CryoSat 2 data from the Alfred Wegener Institute (Fig 7) with the strongest positive and negative anomalies in the right places. However CryoSat-2 data show total volume for February 2020 substantially lower than PIOMAS with 2020 Febuary near record low levels over the 2011-2020 period. ”
–
Why would anyone say in the right places??
One imagines anomalies are already in the wrong places, being anomalies.
Do two wrongs make something right?
–
Still waiting on making a comment on sea ice extent this year. We both live in hope.
Is the fellow at ASIB alright? Neven? Or on holidays? Miss his updates, hope he is OK
“CryoSat-2 data show total volume for February 2020 substantially lower than PIOMAS”
As I’ve been pointing out here for a while:
“Why would anyone say in the right places??”
I assume they simply mean that the CryoSat-2 and PIOMAS data agree on where the areas of anomalously thick/thin sea ice are located.
Neven is answering his emails. I haven’t asked him what happened to the last PIOMAS update at the ASIB.
Thanks good to know he is ok. There are precious few people around on both sides who do the hard work of running blogs