Our regular reader(s) may recall our extended coverage on the plucky little yacht Northabout‘s ultimately successful attempt to circumnavigate the Arctic Ocean in the summer of 2016?
Many were the skeptics who said she stood no chance of finding a way through some “thick sea ice” apparently blocking her path across the Laptev Sea, but they were proved wrong:
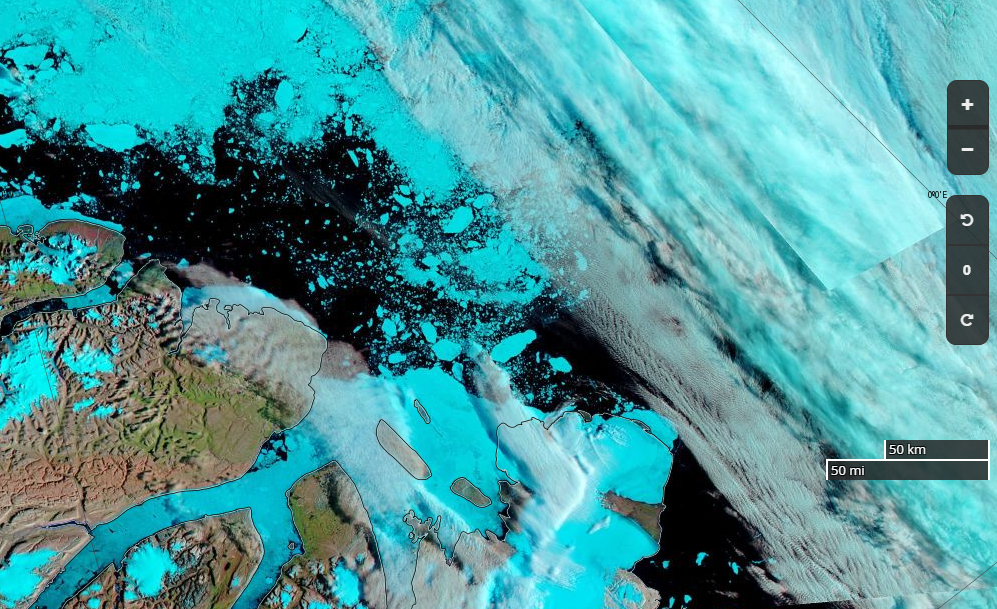
As a thought experiment in the summer of 2018 we’re now thinking the unthinkable. If she put her mind to it could Northabout circumnavigate Greenland in 2018? Let’s take a look at the evidence shall we? The allegedly “oldest, thickest Arctic sea ice” north of Greenland isn’t there any more this summer:
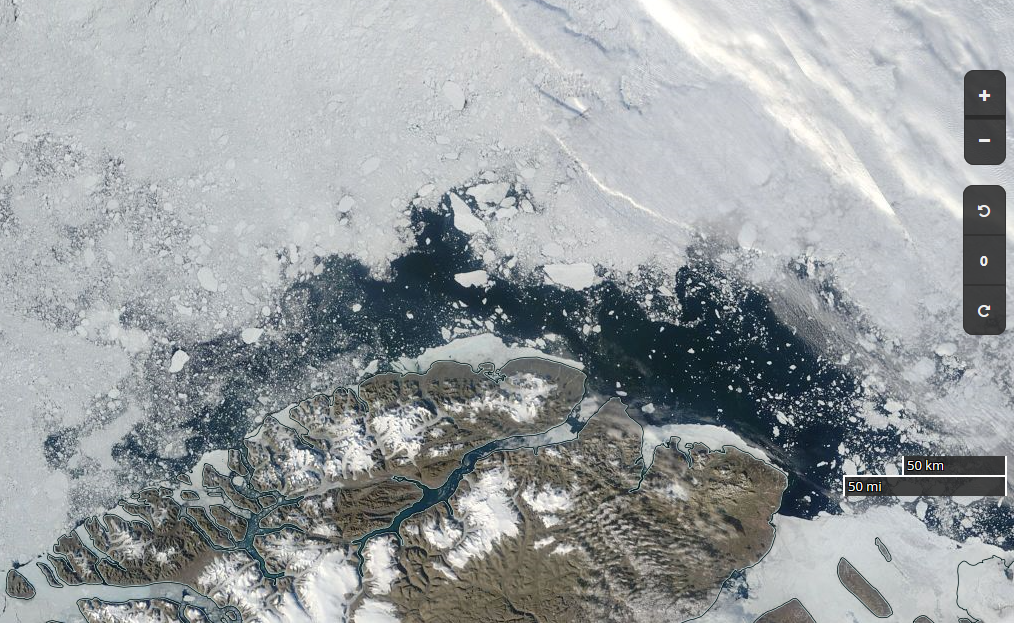
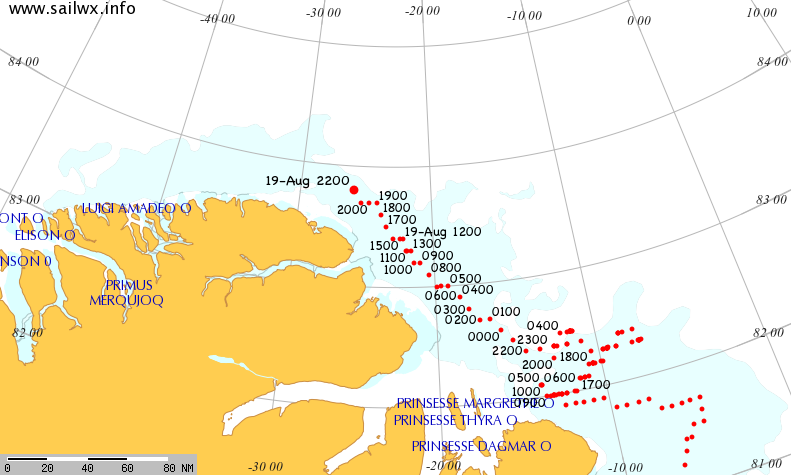
The research icebreaker Polarstern has already inspected the open waters off Kap Morris Jesup, the most northerly tip of Greenland:
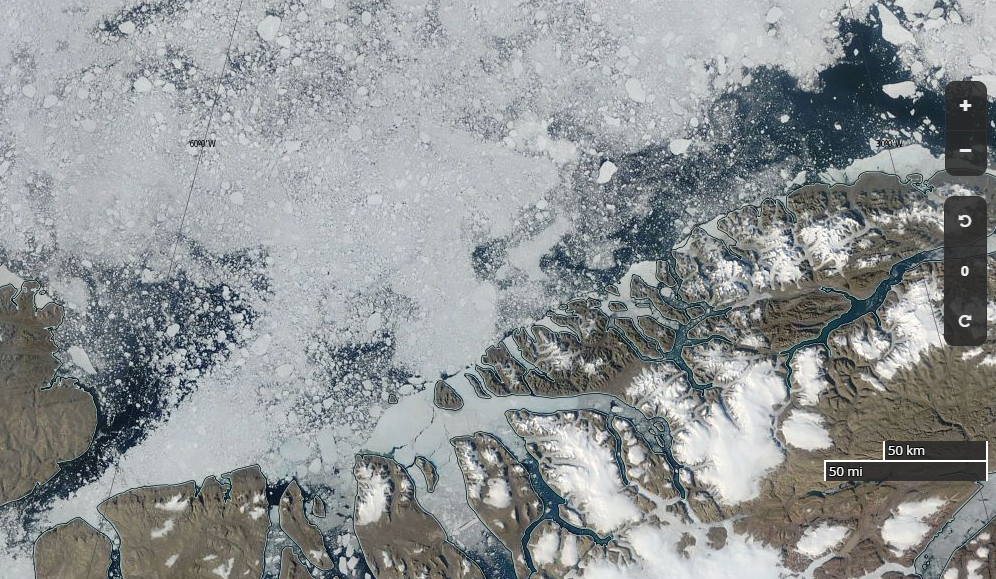
What’s more the waters of the Lincoln Sea currently look no more tricky to traverse than the Laptev Sea in August 2016:
In conclusion, for the moment at least, what’s the theoretical solution to our 2018 thought experiment?
Here’s another thought to ponder as well. I don’t suppose it’s in the Alfred Wegener Institute’s PS115 mission plan, but do you suppose Polarstern could circumnavigate Greenland at the moment?
[Edit – August 23rd]
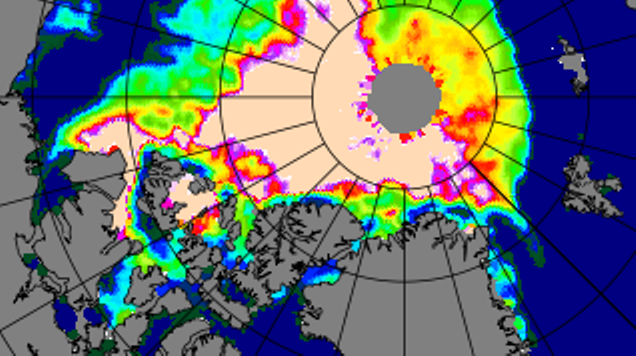
The University of Bremen used not to publish their Arctic sea ice “thinness” maps in summer. However now they do, so here’s a close up of Northern Greenland for August 22nd:
[Edit – August 26th]
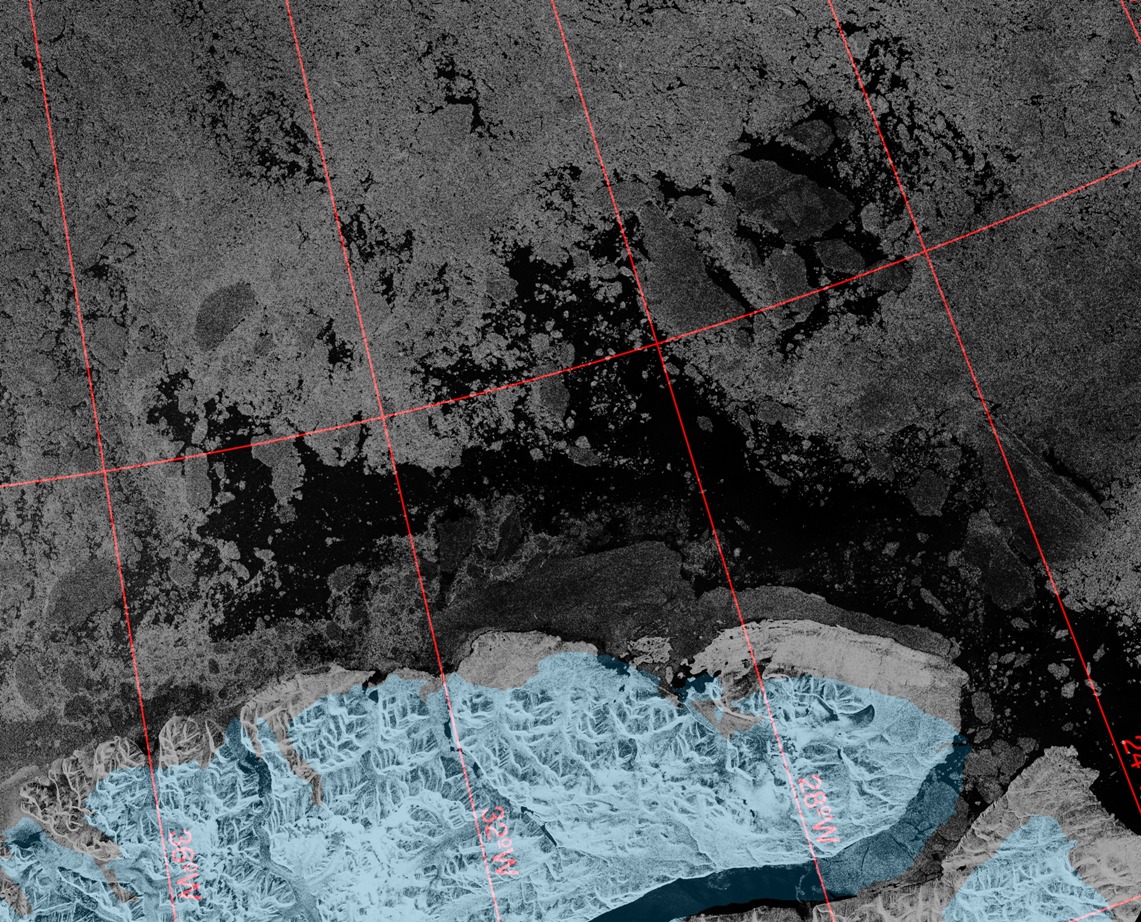
First of all here’s one of our occasional sea ice motion videos:
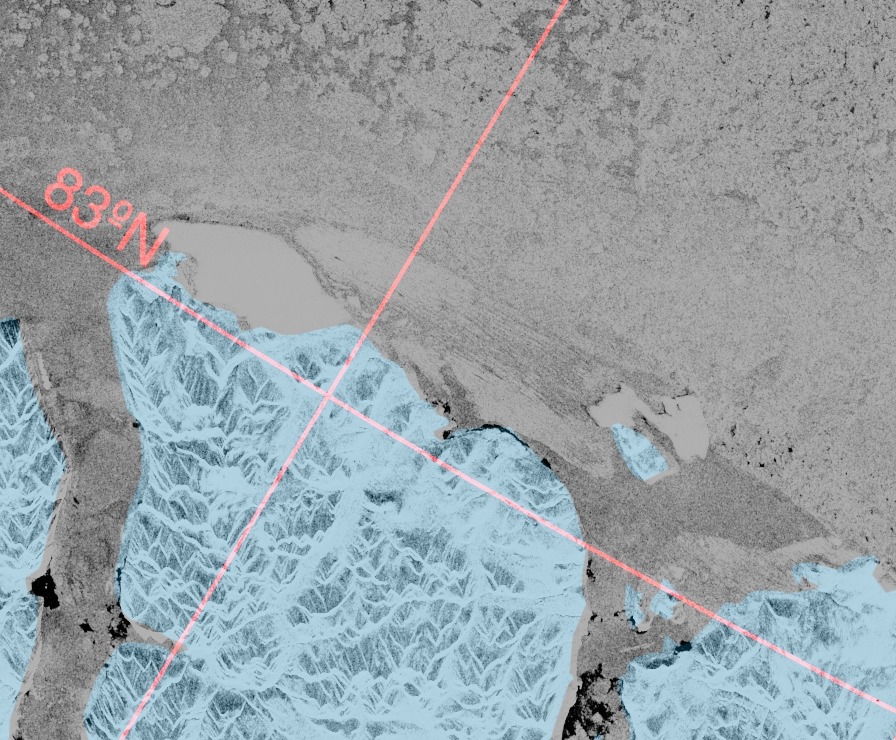
This one reveals the open water north of Greenland in February as well as the much longer event in August. Next here’s a Sentinel 1B synthetic aperture radar image of the Kap Morris Jesup area from yesterday:
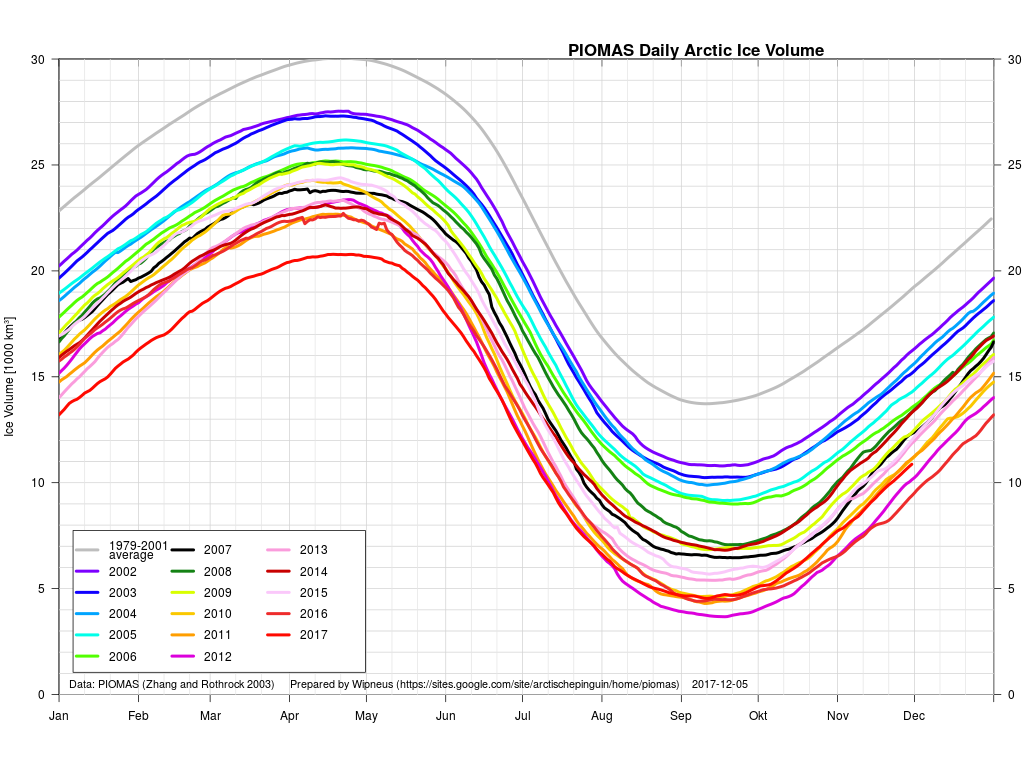
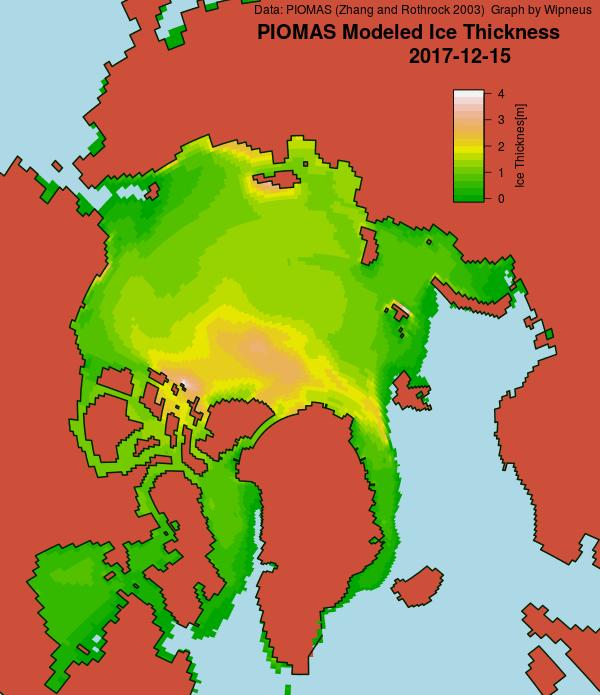
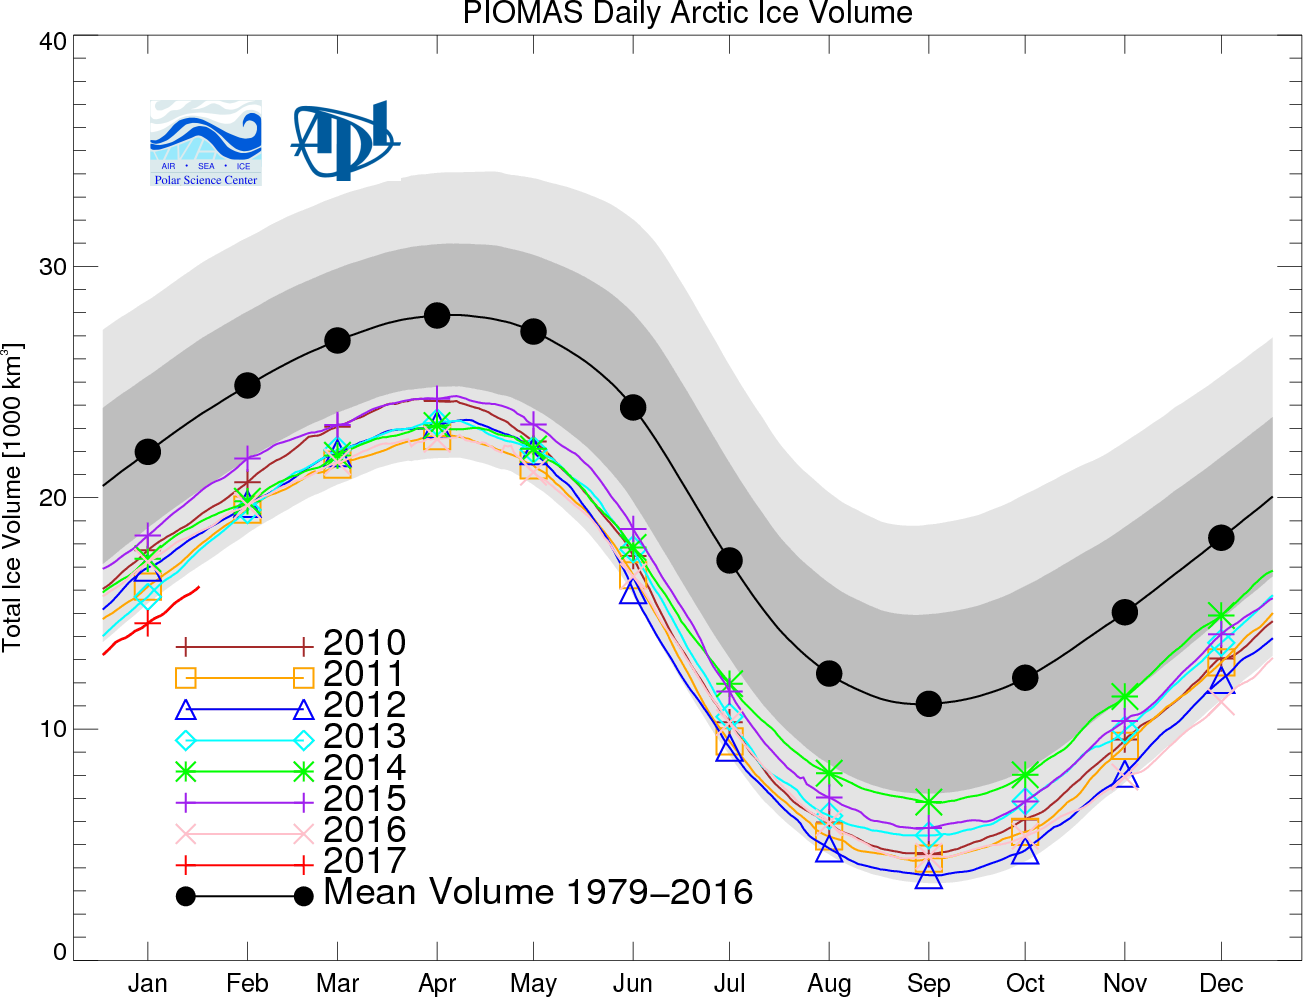
Christmas is coming, and Santa’s secret summer swimming pool has frozen over once again. However the same can’t be said for the Chukchi Sea! More on that in due course, but first let’s take a look at the PIOMAS volume graph at the end of November, courtesy of the wondrous Wipneus on the Arctic Sea Ice Forum:
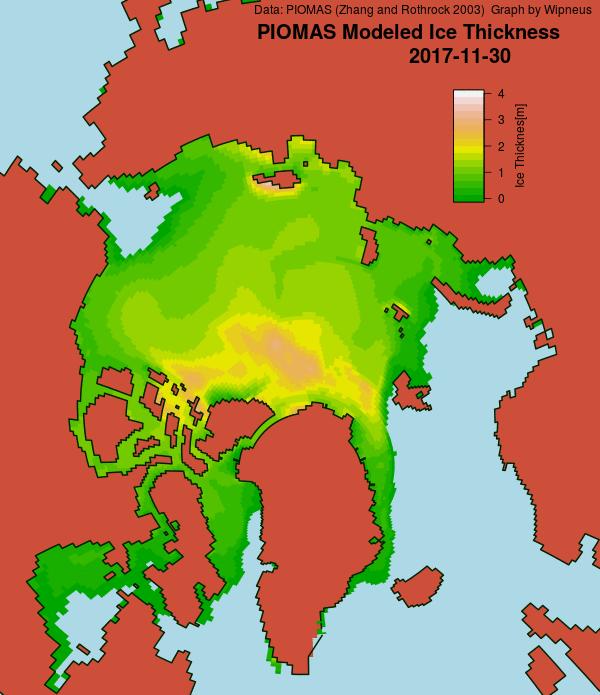
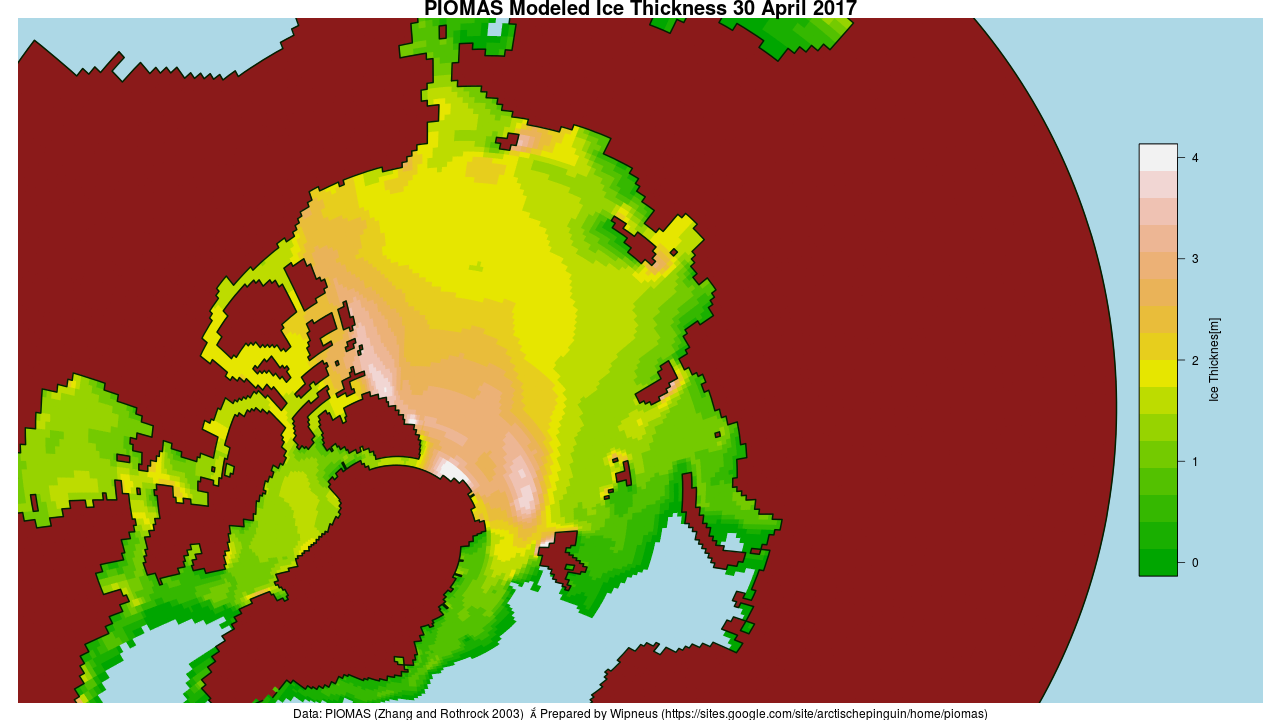
2017 is currently third lowest, behind 2012 and 2016. Next let’s take a look at Wipneus’ PIOMAS Arctic sea ice thickness map:
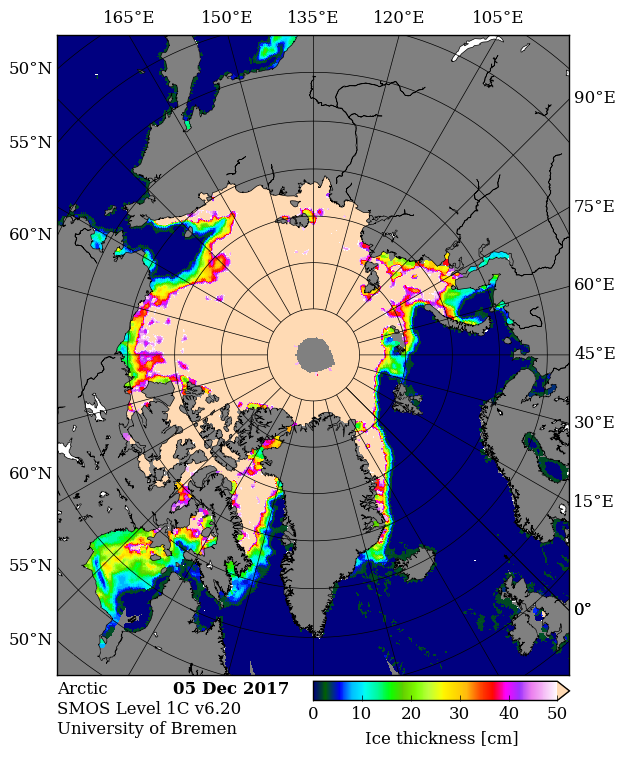
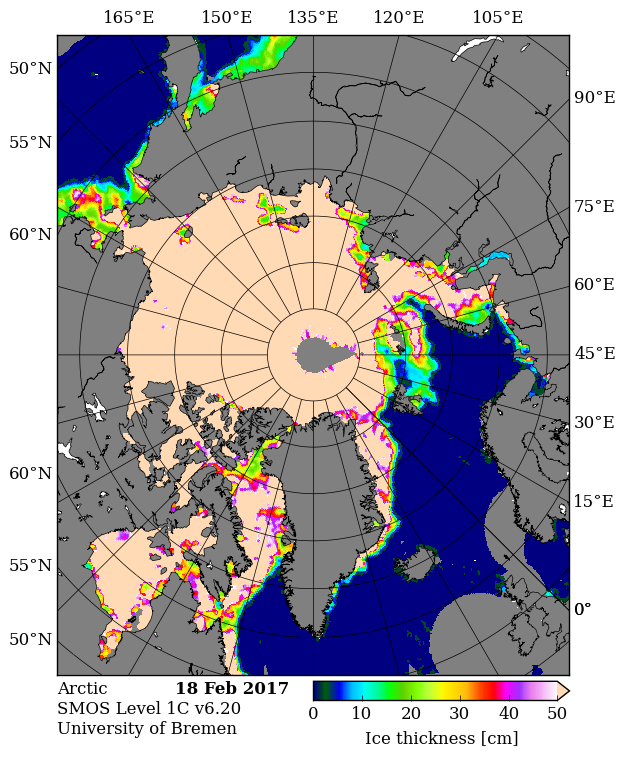
followed by the University of Bremen’s SMOS Arctic sea ice thickness map:
Note the large area of pale blue open ocean still visible in the Chukchi Sea towards the top left of both maps.
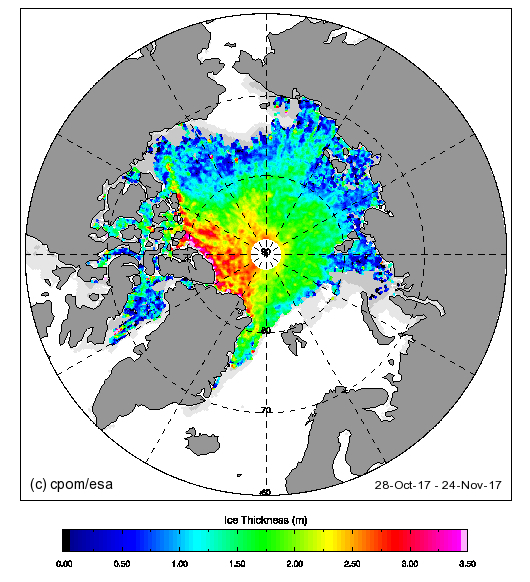
For another perspective on Arctic sea ice thickness here’s the latest Cryosat-2 map, which currently is based on the month up to November 24th:
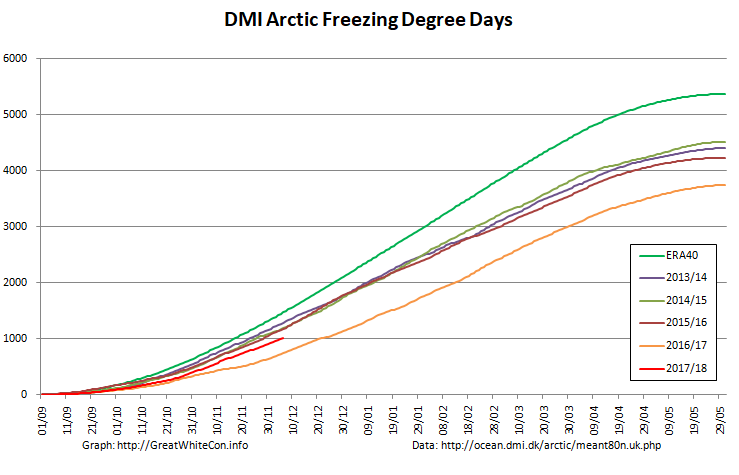
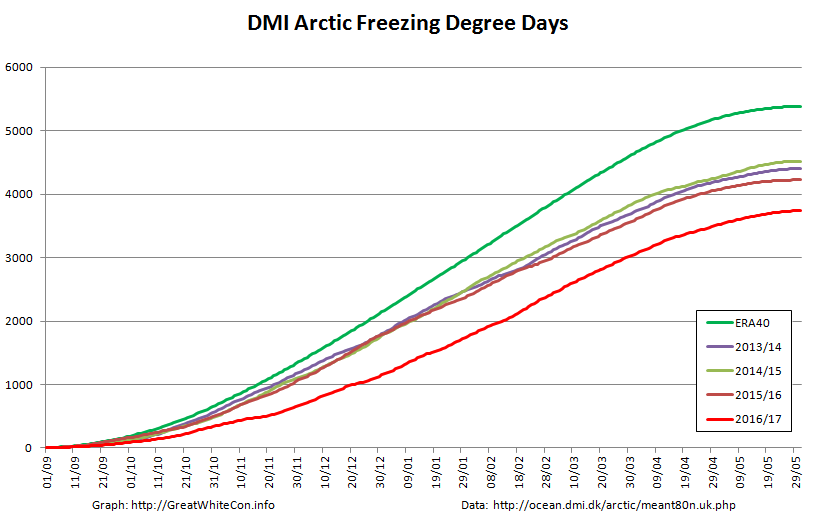
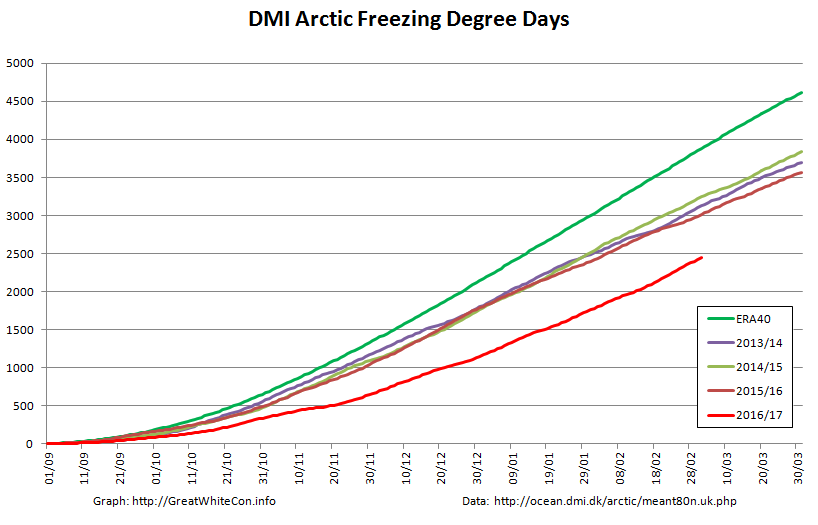
Finally, for the moment at least, here’s our very own Arctic Freezing Degree Days graph based on the DMI’s >80N data:
2017 is currently occupying the wide open space between the astonishingly low numbers last year and all previous years in DMI’s record. Here’s their graph for 2017 so far:
[Edit – December 10th]
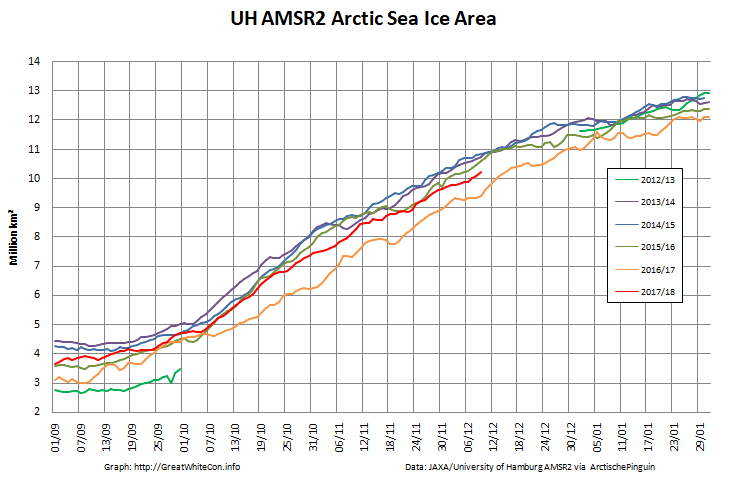
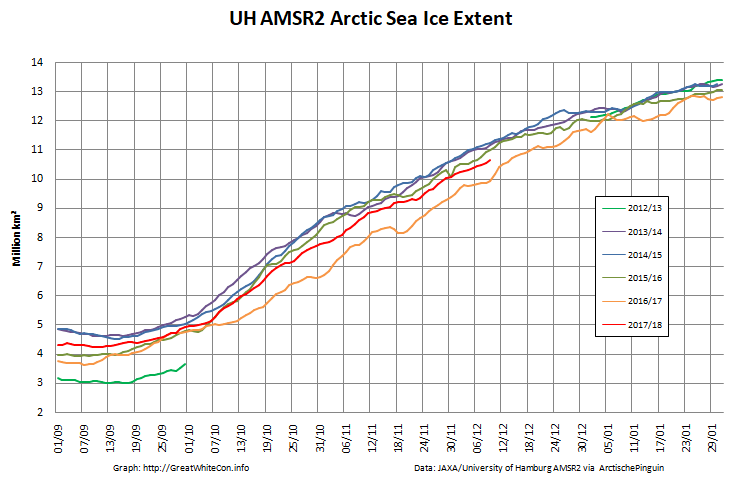
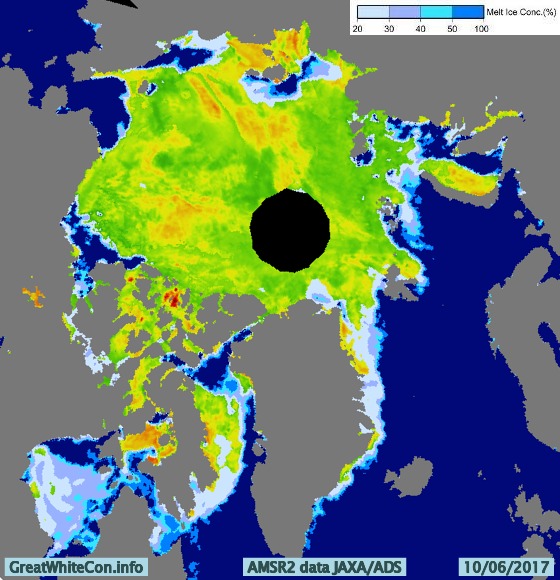
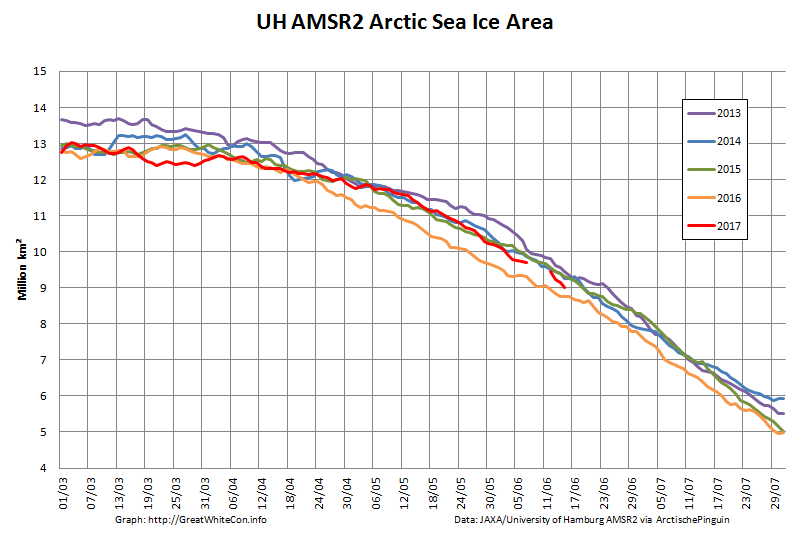
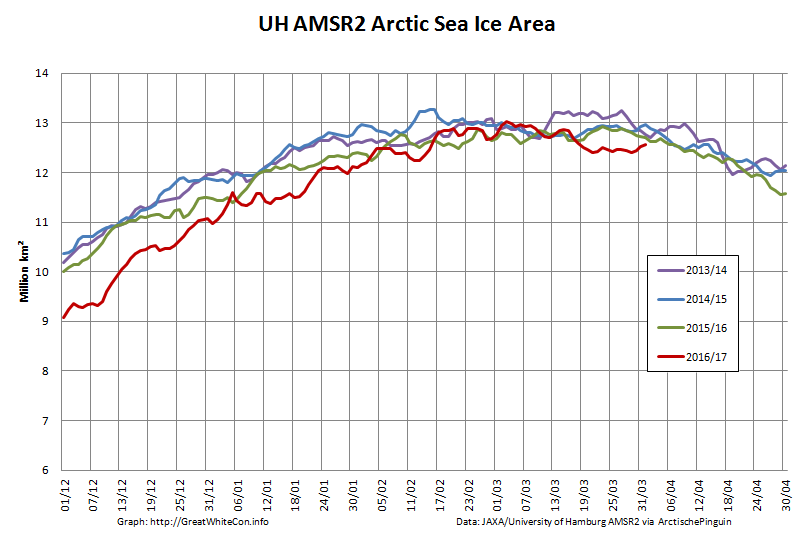
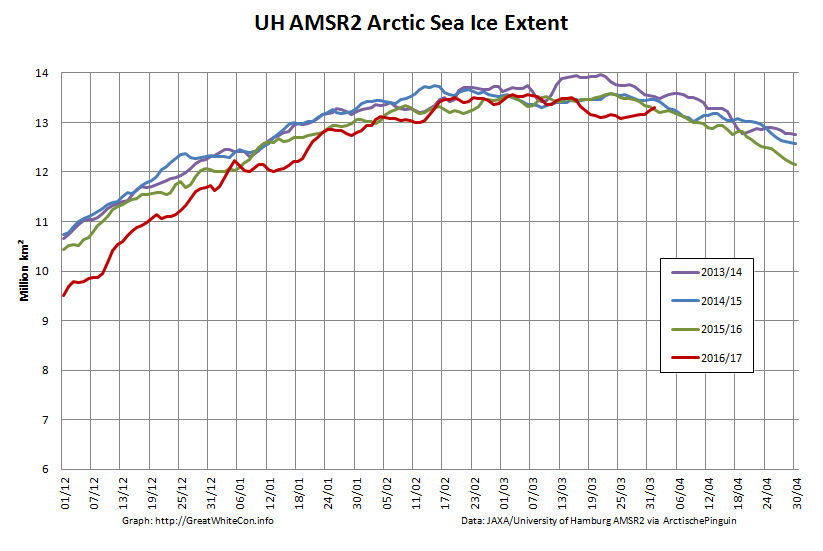
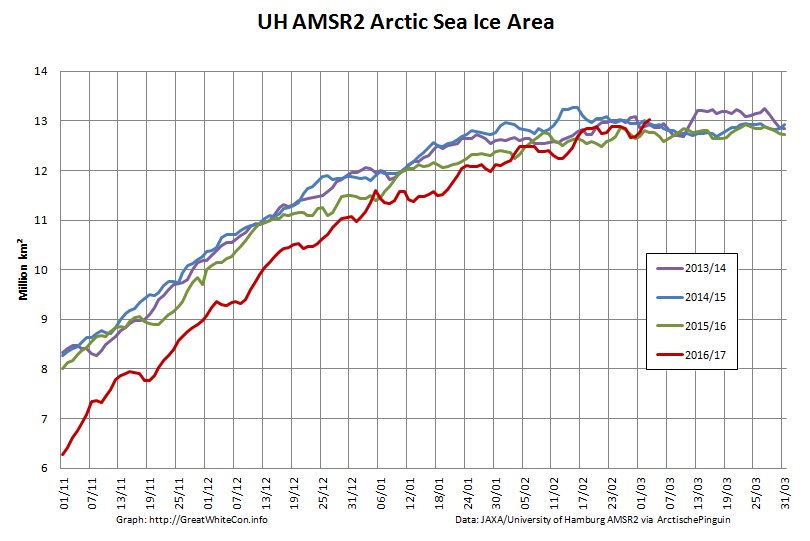
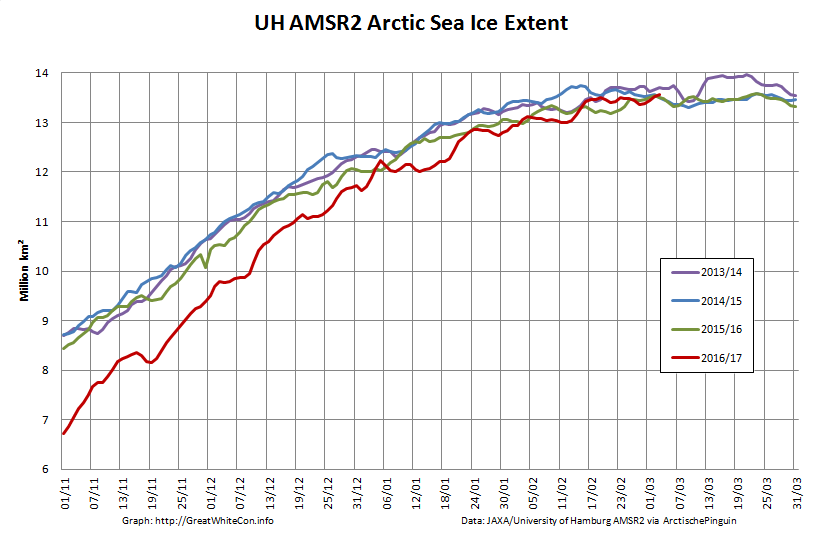
Current Arctic sea ice area and extent derived from the University of Hamburg’s high resolution AMSR2 data:
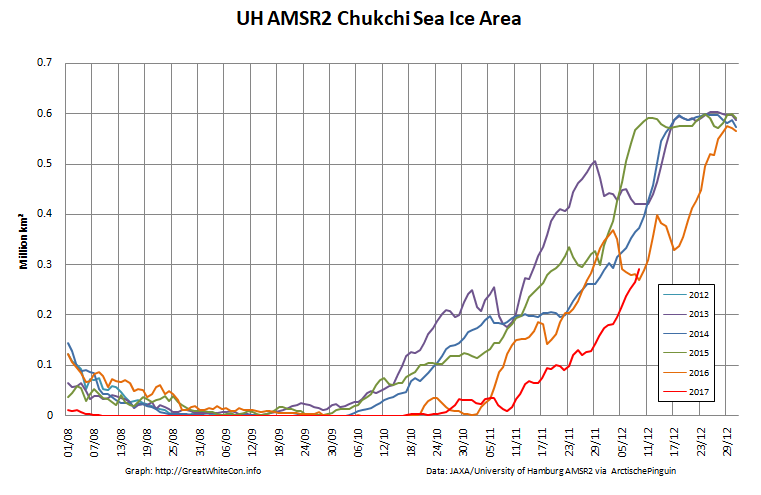
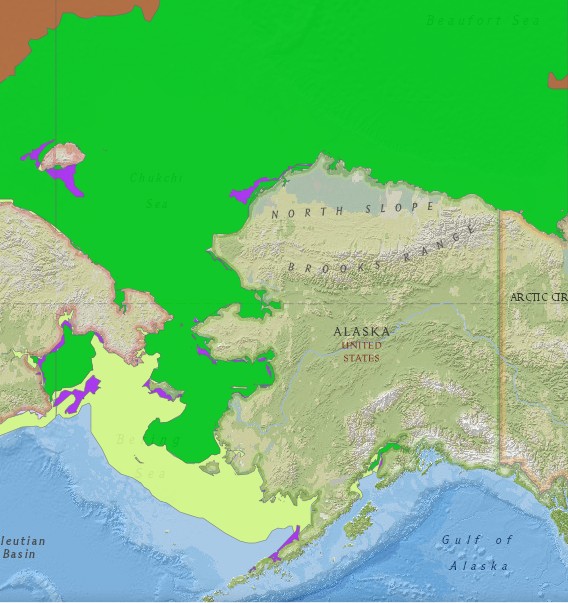
Plus the latest update on the Chukchi Sea situation:
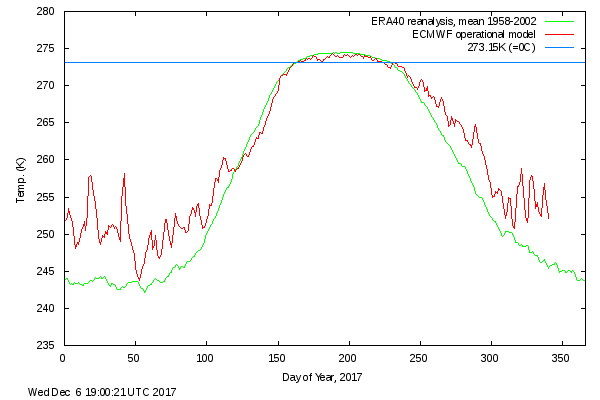
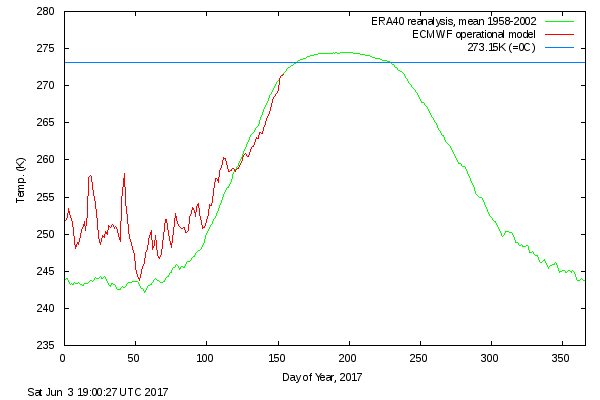
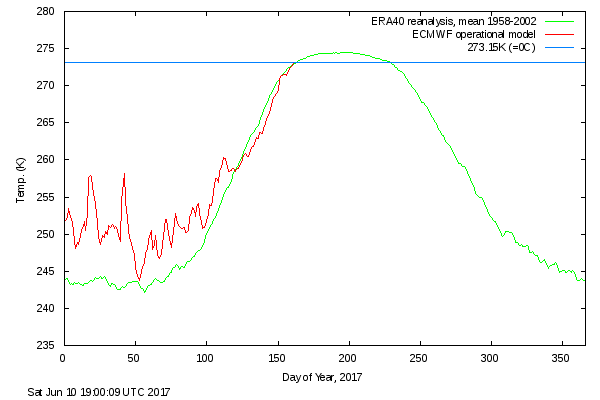
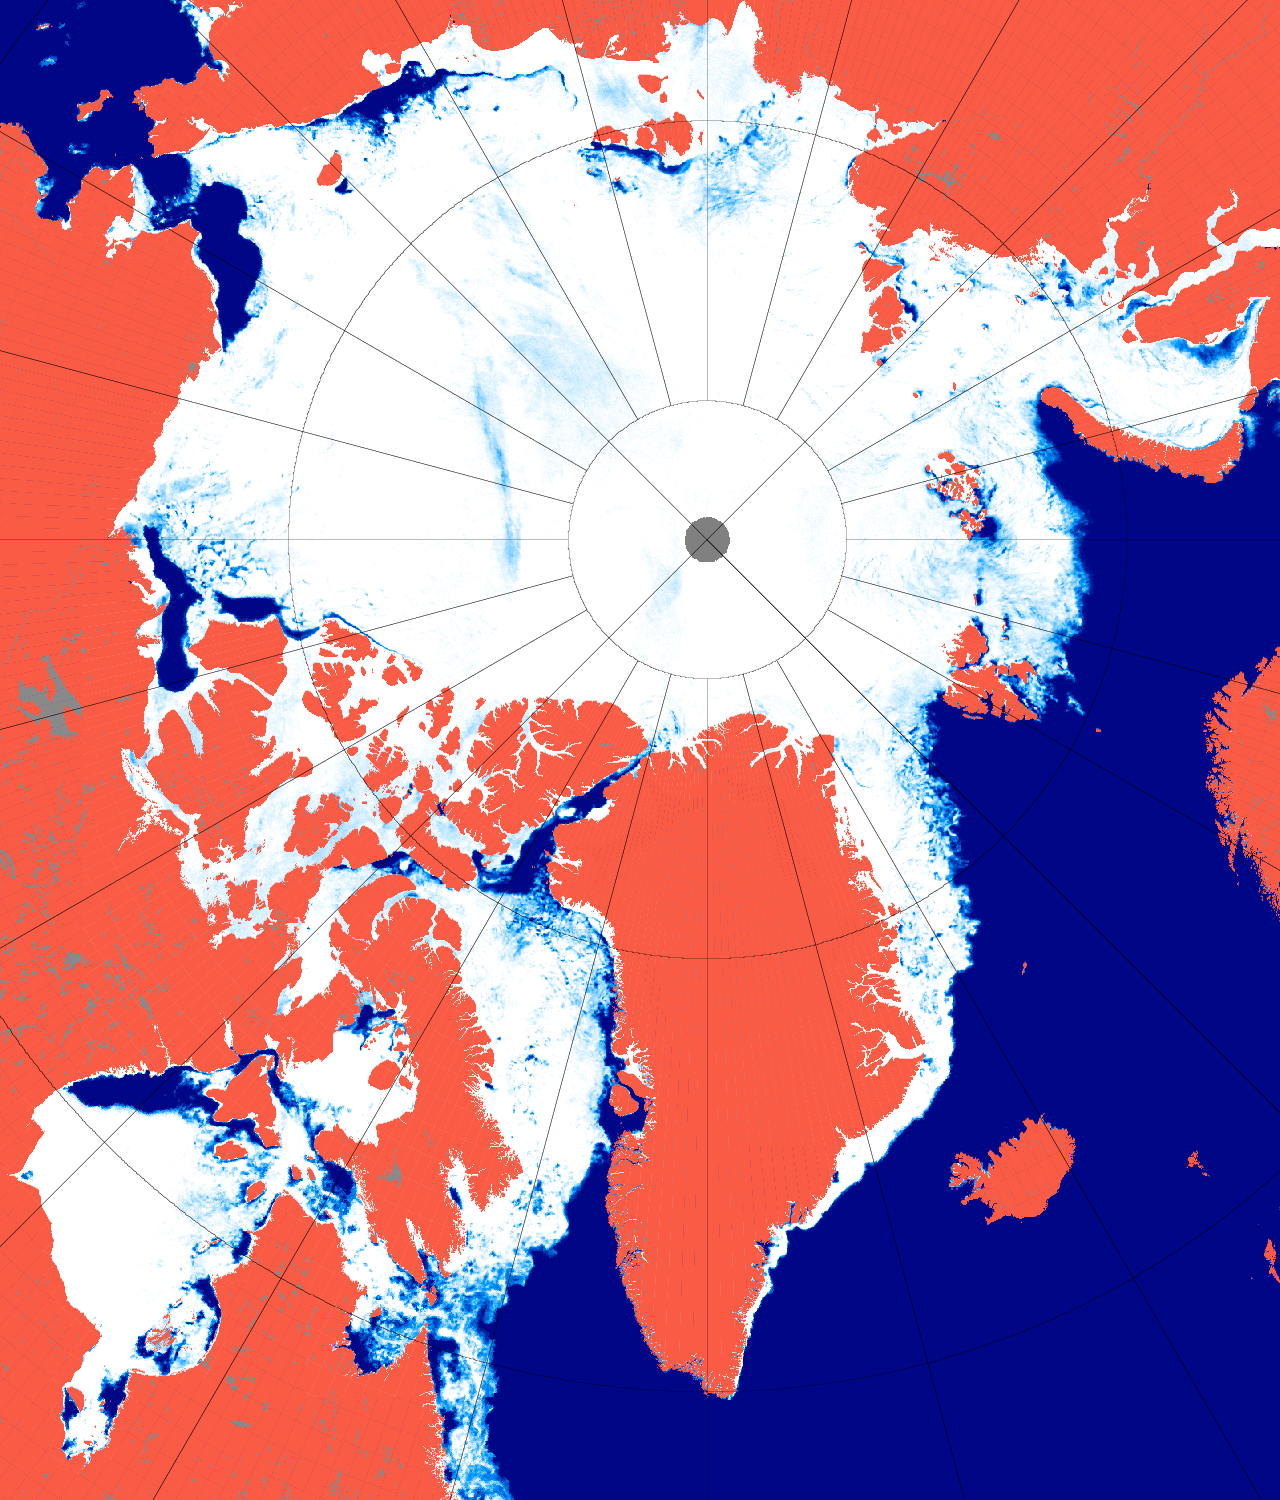
After a comparatively cool May, surface air temperatures in the high Arctic are back up to “normal”:
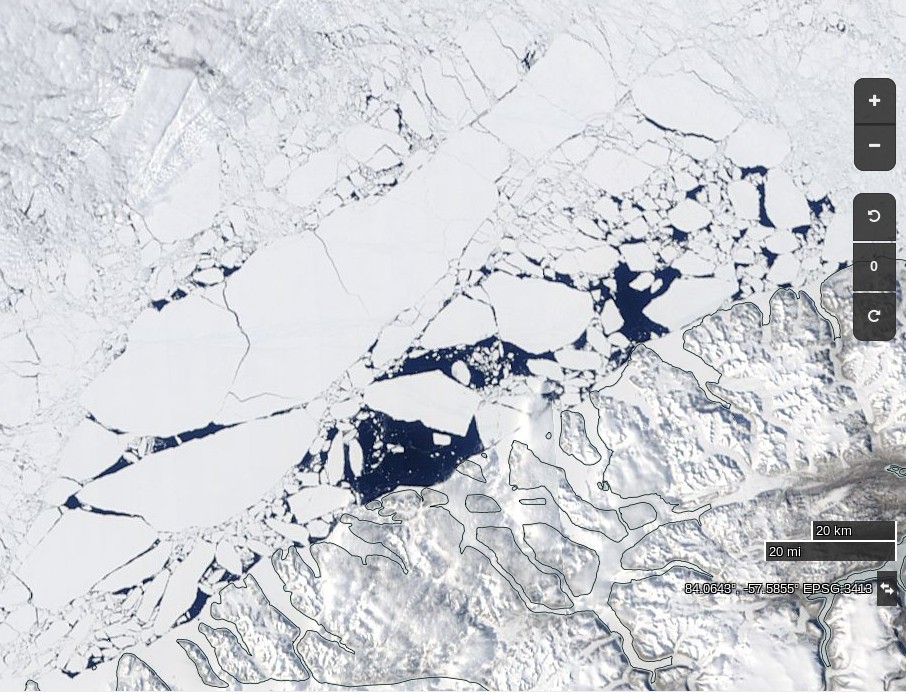
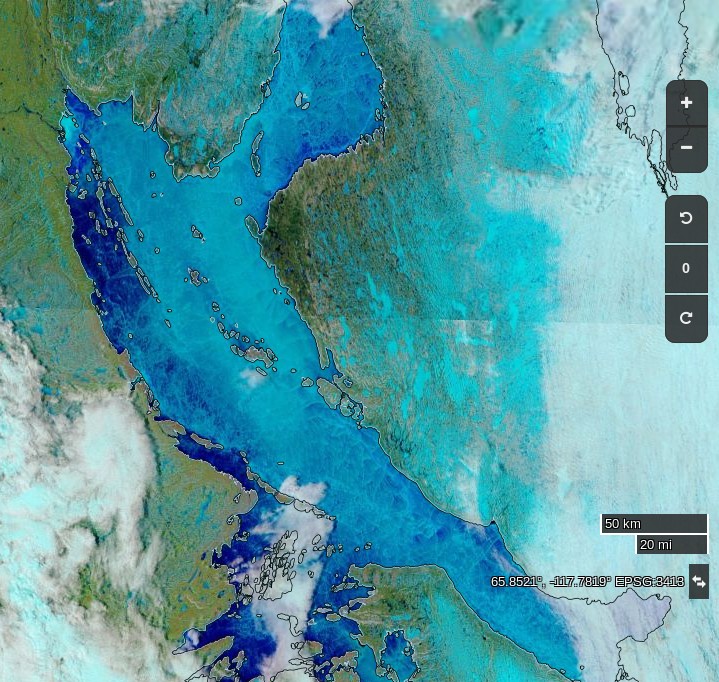
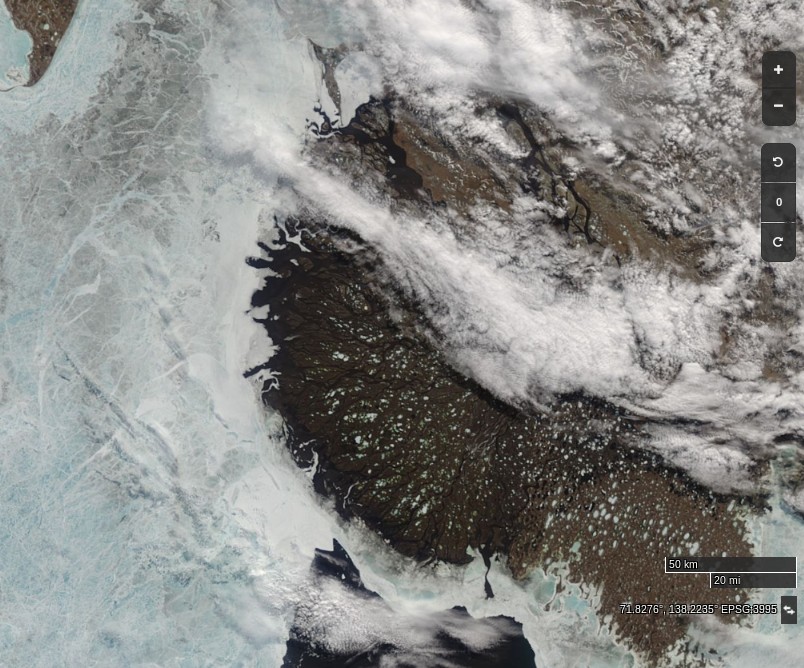
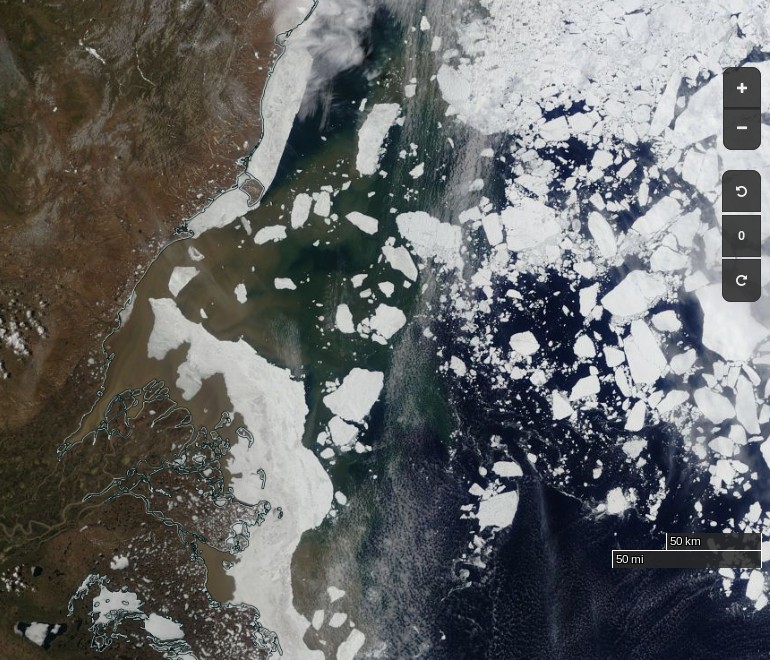
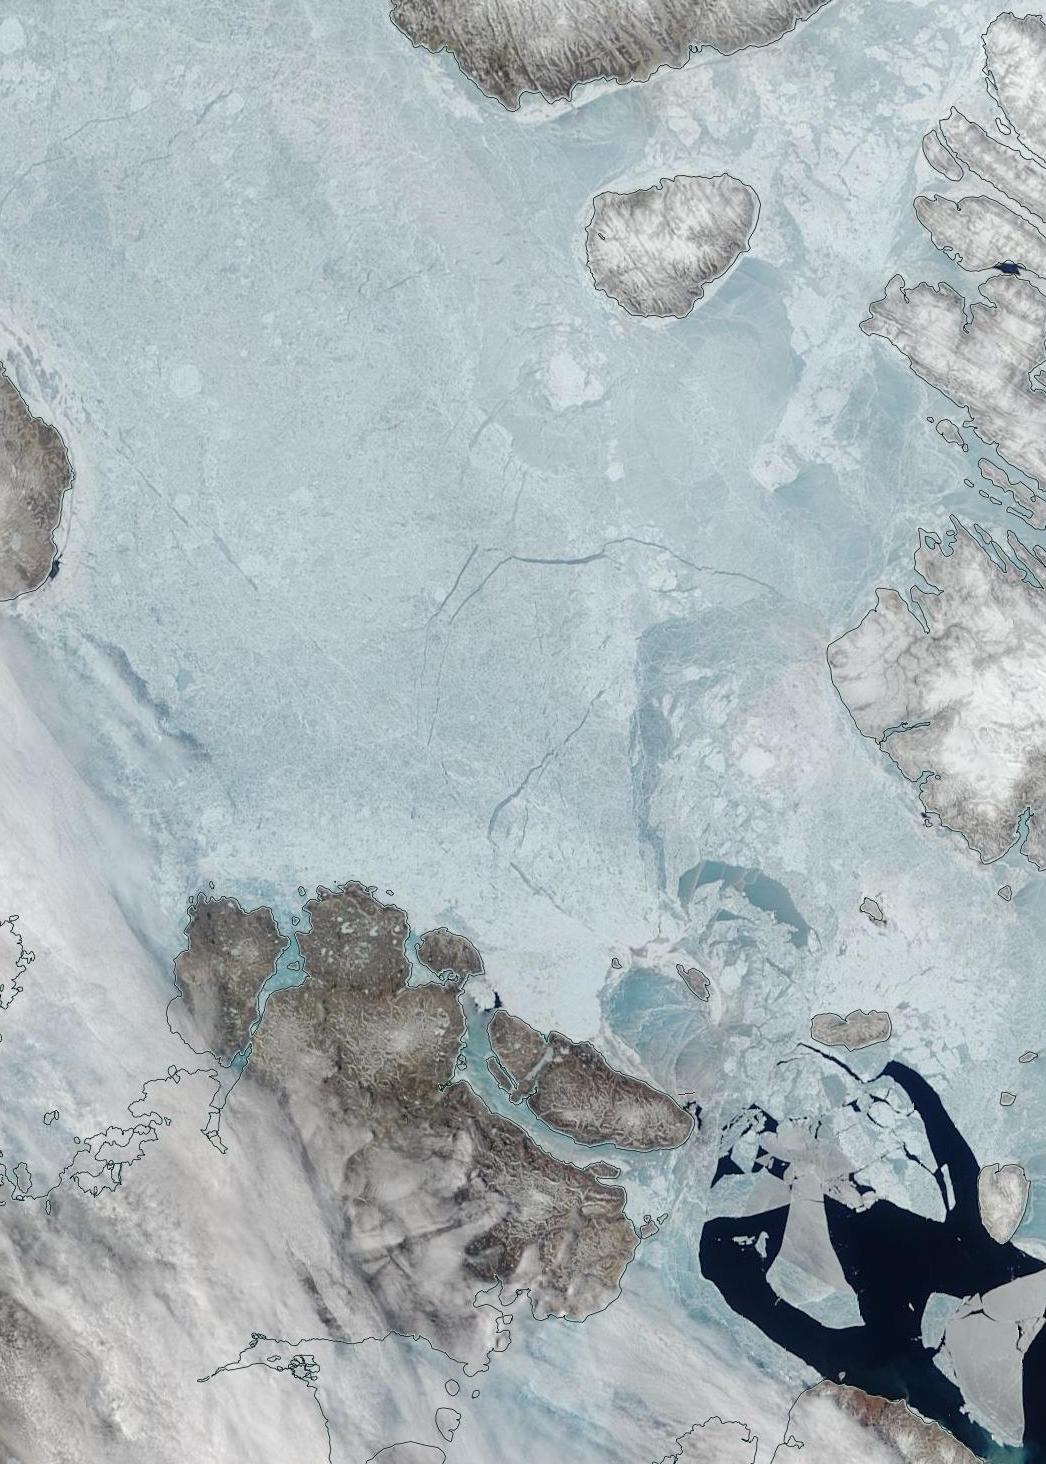
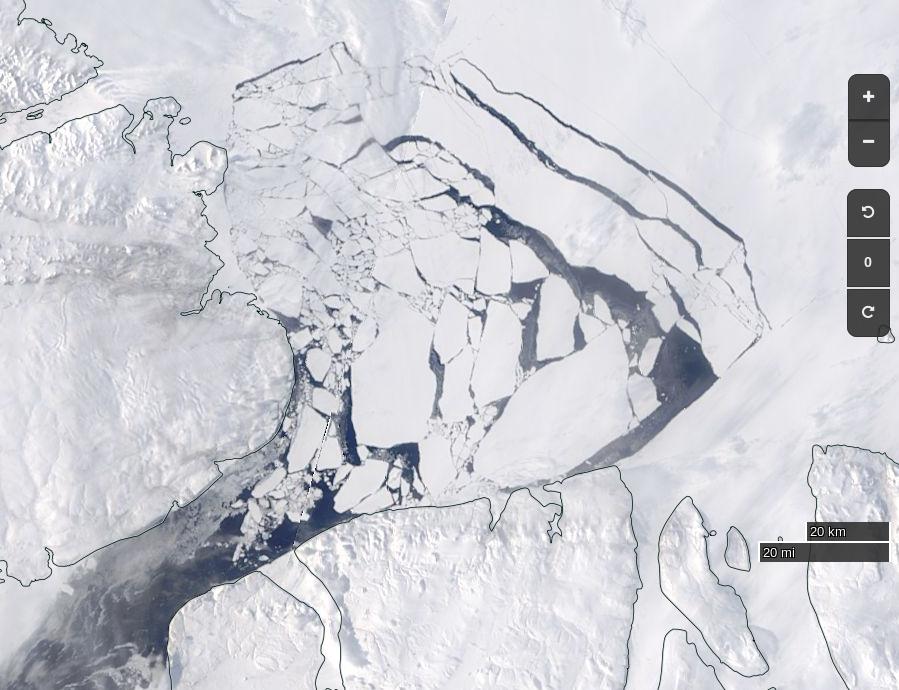
The condition of the sea ice north of 80 degrees is far from normal however. Here’s what’s been happening to the (normally) land fast ice north west of Greenland:
NASA Worldview “true-color” image of the sea ice north west of Greenland breaking up on June 2nd 2017
Further south surface melt has set in across the southern route through the Northwest Passage:
NASA Worldview “false-color” image of the Coronation Gulf on June 1st 2017, derived from the MODIS sensor on the Terra satellite
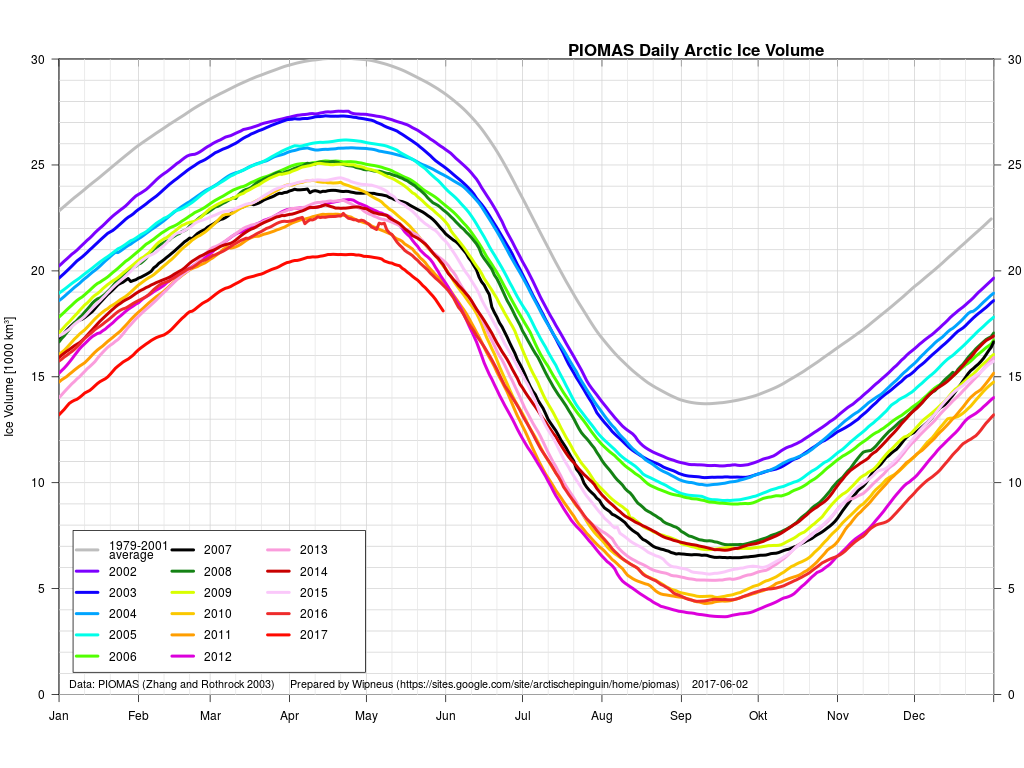
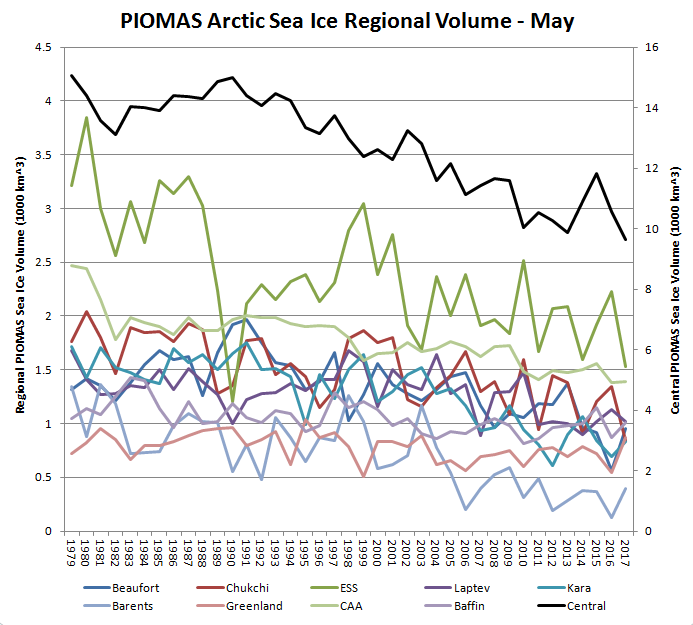
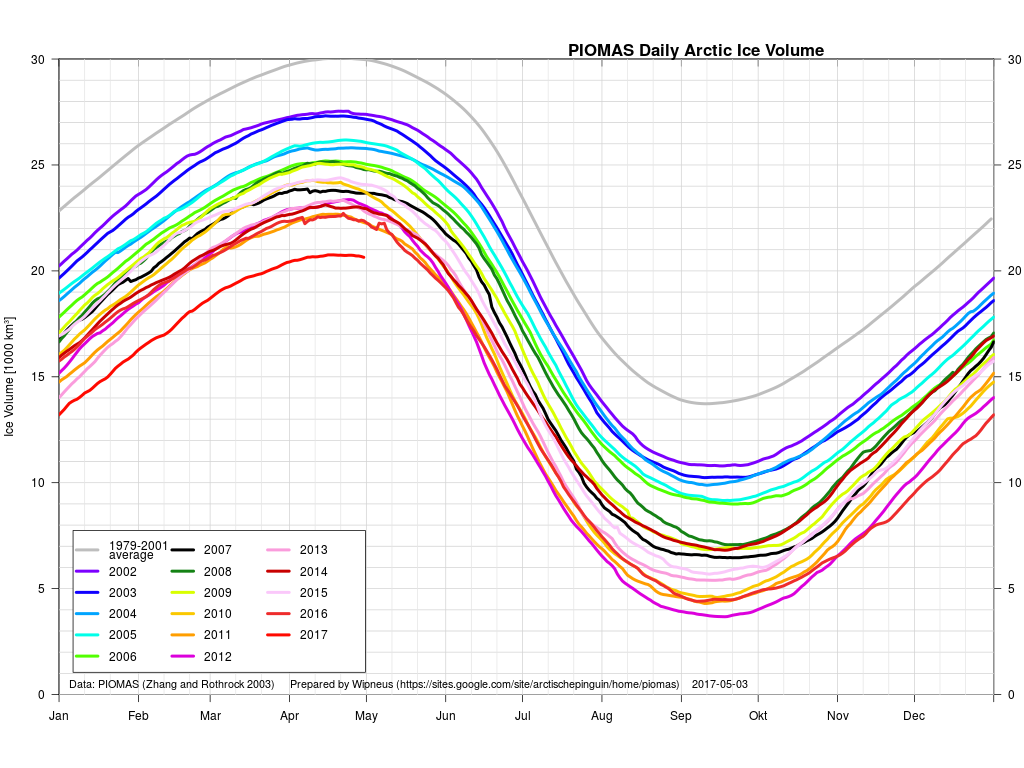
Whilst the gap with previous years has narrowed during May, PIOMAS Arctic sea ice volume is still well below all previous years in their records:
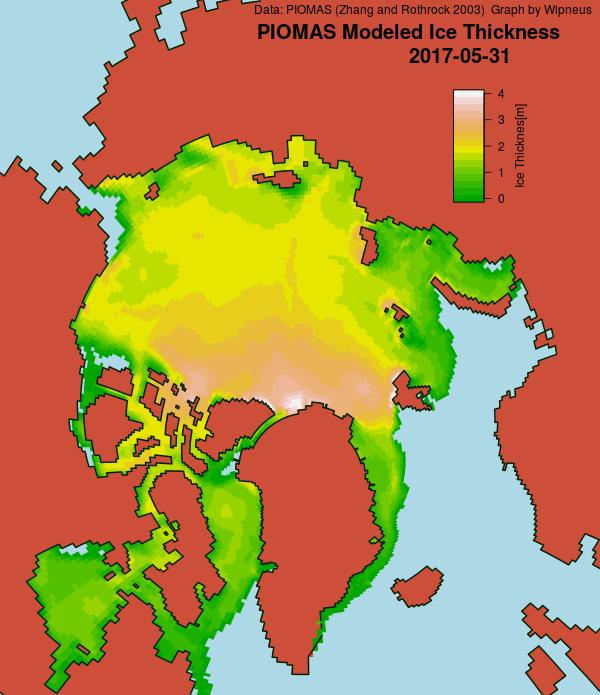
The PIOMAS gridded thickness graph suggests that a large area of thick ice is currently sailing through the Fram Strait to ultimate oblivion:
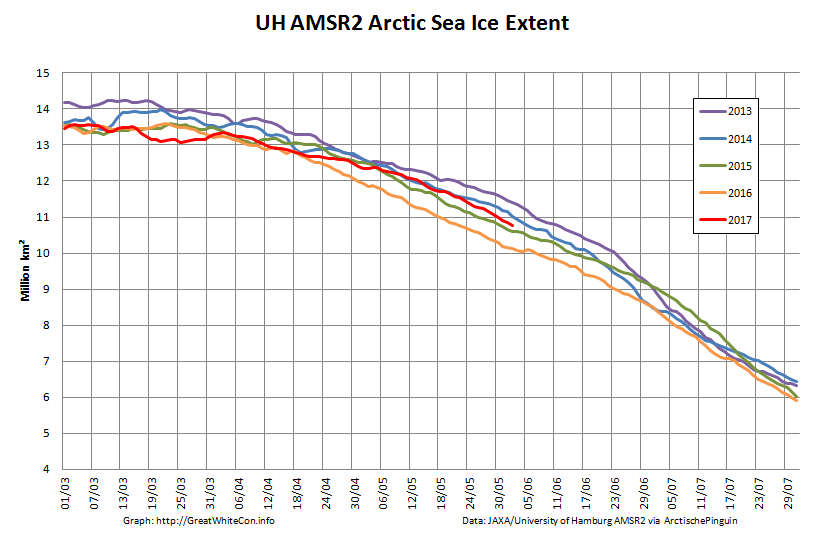
and just in case melt ponds are now affecting those numbers here is extent as well:
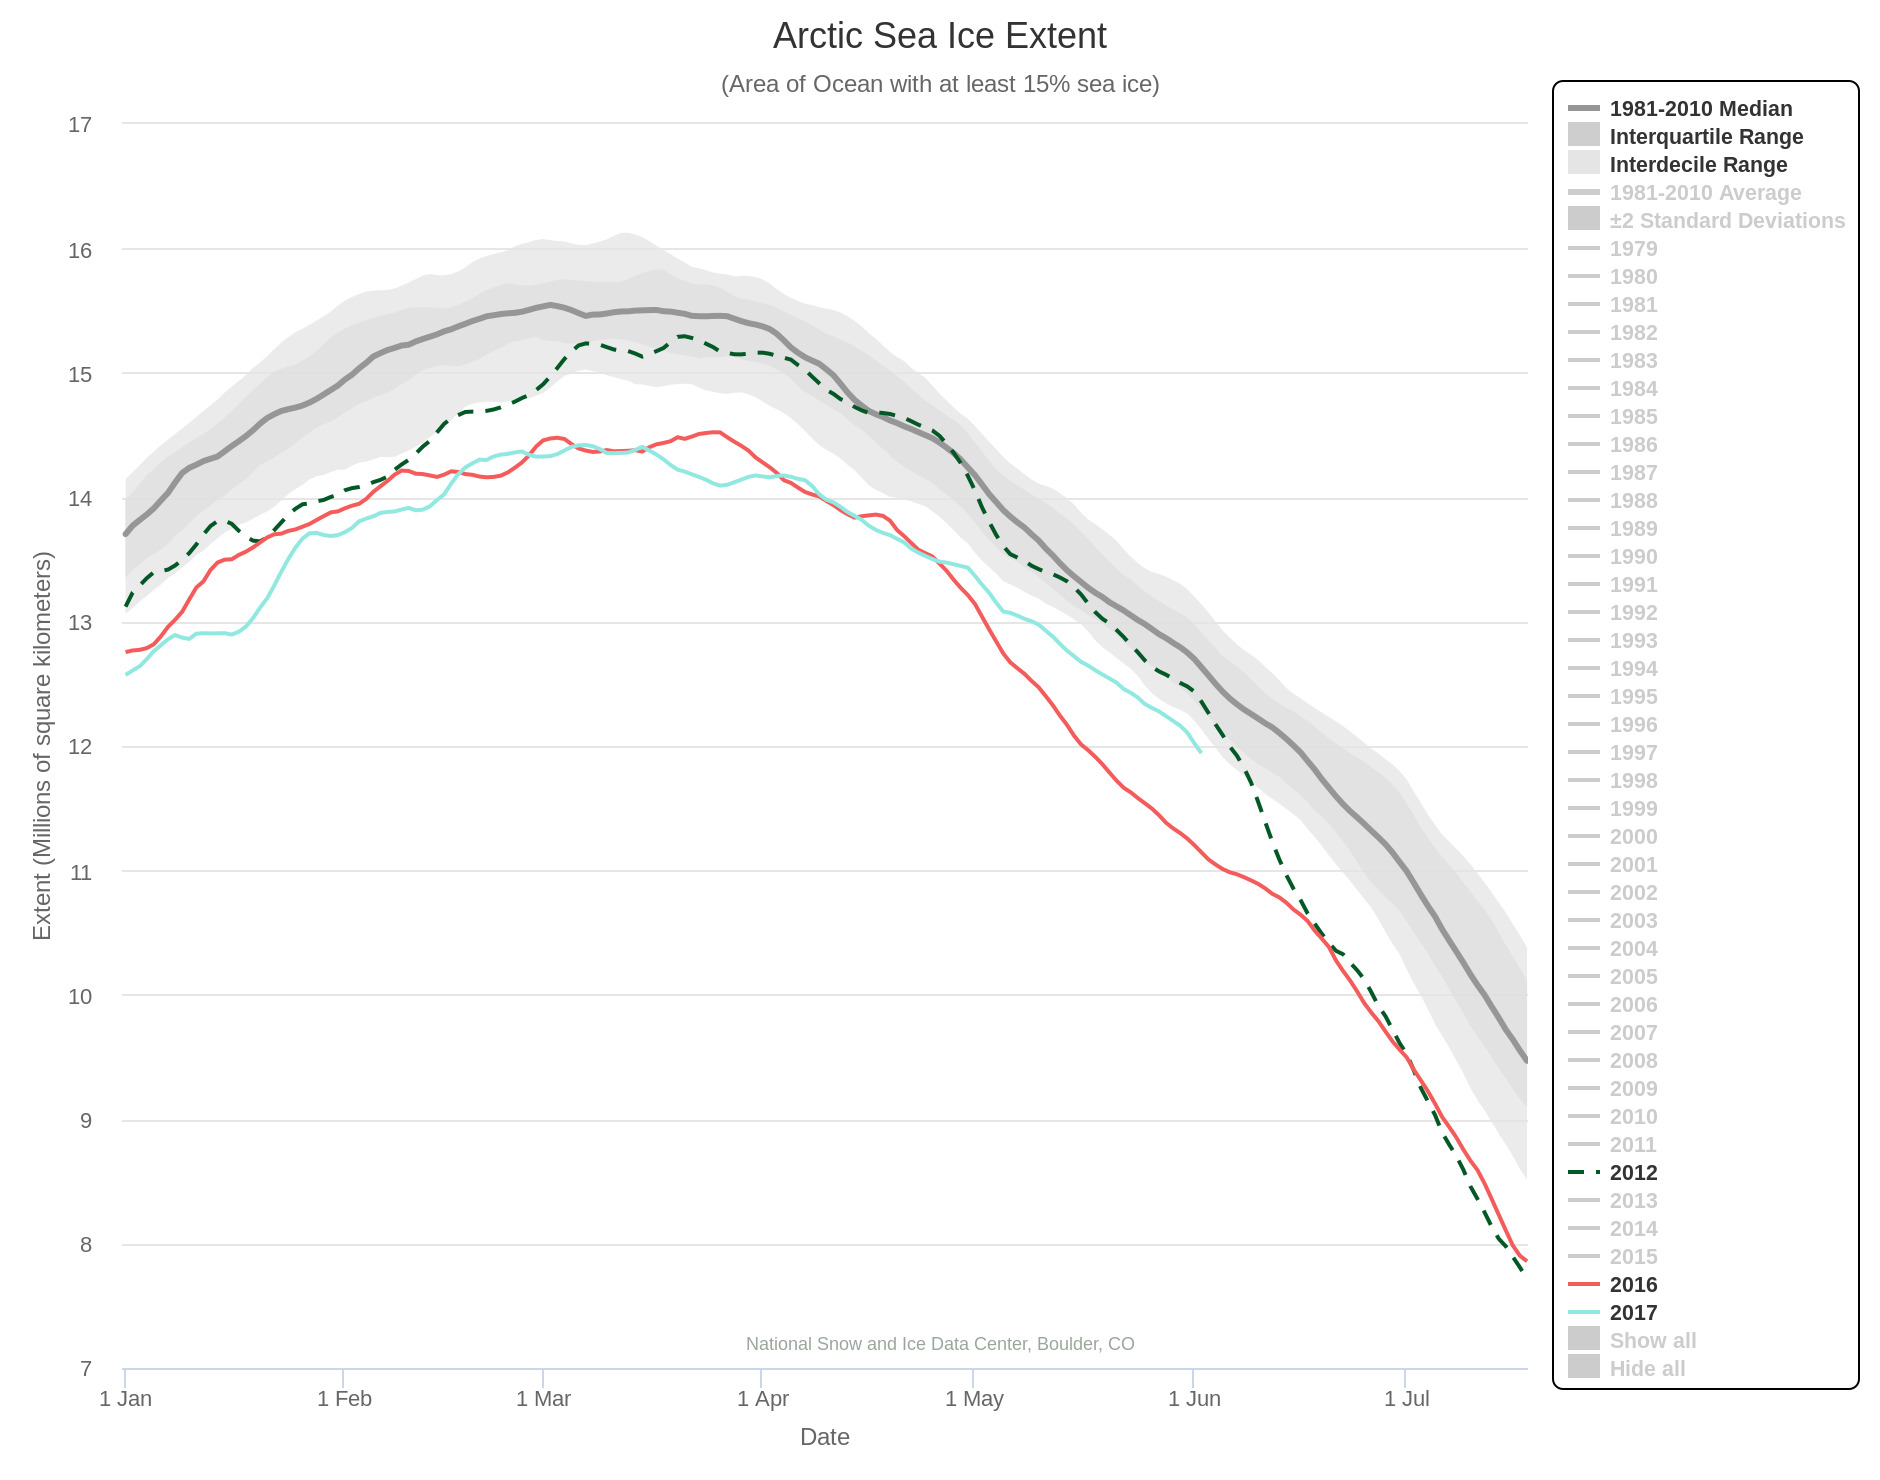
The rate of decrease is inexorably increasing! 2012 extent is currently still well above that of 2017, but those positions may well be reversed by the end of June? Here’s NSIDC’s view on the matter:
[Edit – June 8th]
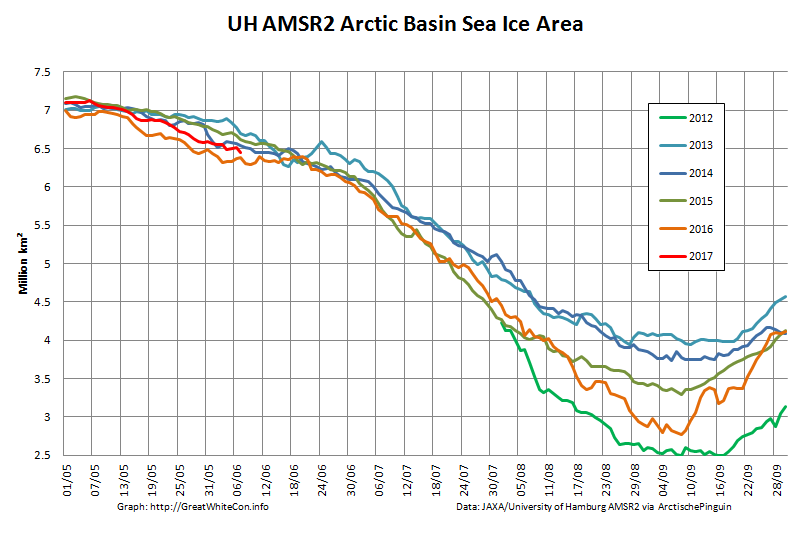
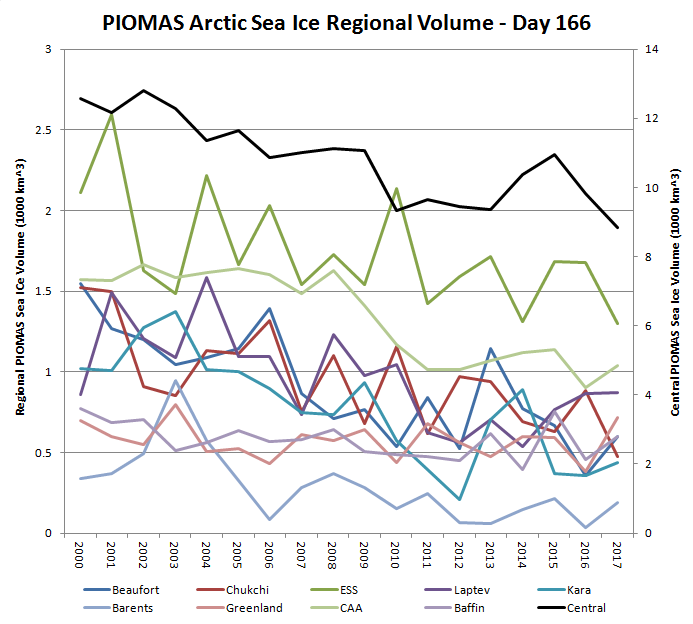
As requested by Tommy, here’s the current Arctic Basin sea ice area:
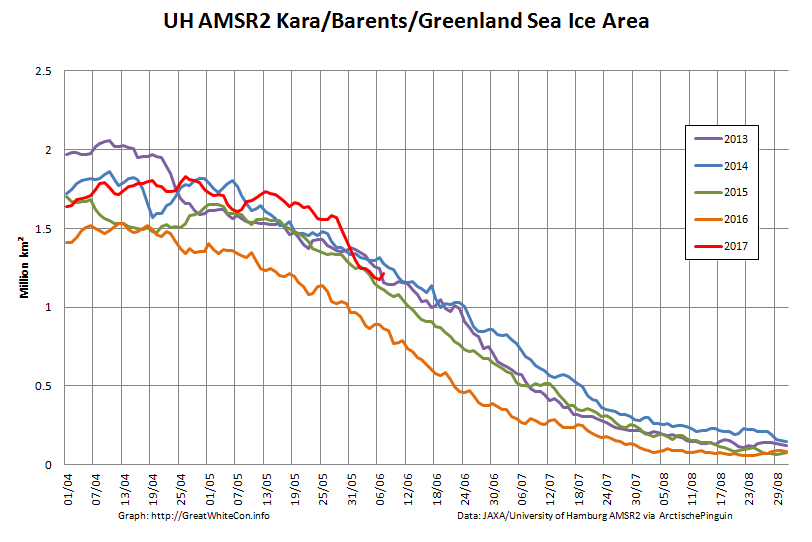
This includes the Beaufort, Chukchi, East Siberian and Laptev Seas along with the Central Arctic. It excludes the Atlantic periphery, which currently looks like this:
[Edit – June 10th]
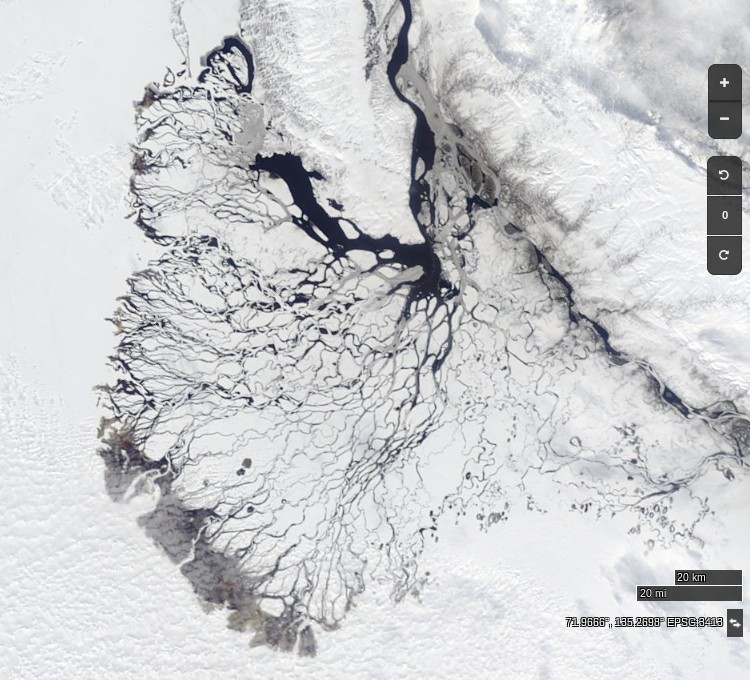
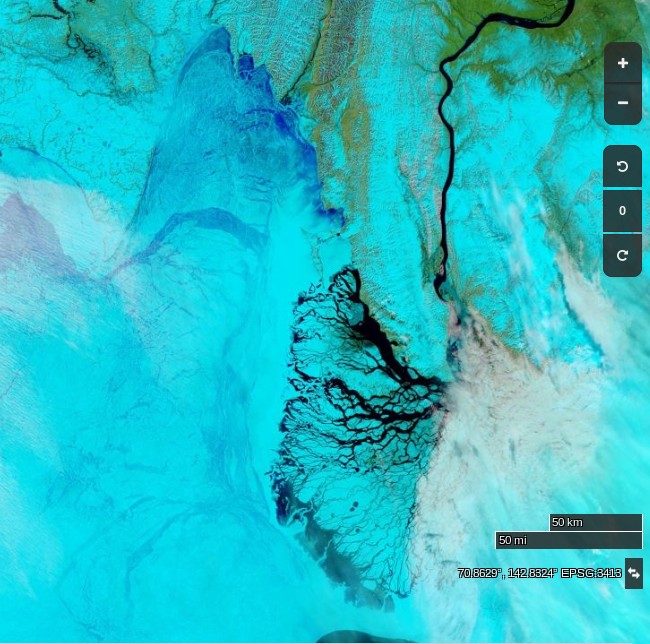
At long last a clear(ish) image of water from the Lena Delta spreading out across the fast ice in the Laptev Sea:
NASA Worldview “true-color” image of the Lena Delta on June 10th 2017, derived from the MODIS sensor on the Terra satellite
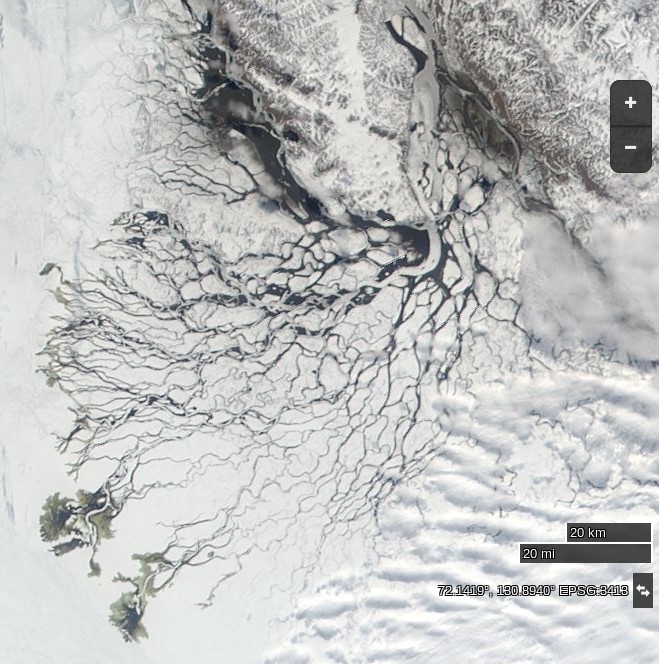
NASA Worldview “true-color” image of the Lena Delta on June 10th 2012, derived from the MODIS sensor on the Terra satellite
[Edit – June 11th]
DMI’s daily mean temperature for the Arctic area north of the 80th northern parallel has reached zero degrees Celsius almost exactly on the climatological schedule:
We calculate our freezing degree days on the basis of the freezing point of Arctic sea water at -1.8 degrees Celsius. On that basis this winter’s grand total of 3740 was reached on June 1st:
Despite the “coolish” recent weather total FDDs are way below the climatology and other recent years. Consequently there’s a lot less sea ice in the Arctic left to melt at the start of this Central Arctic melting season than in any previous year in the satellite record. However whilst there are some melt ponds visible in the Arctic Basin on MODIS, in that respect 2017 is lagging behind both last year and 2012.
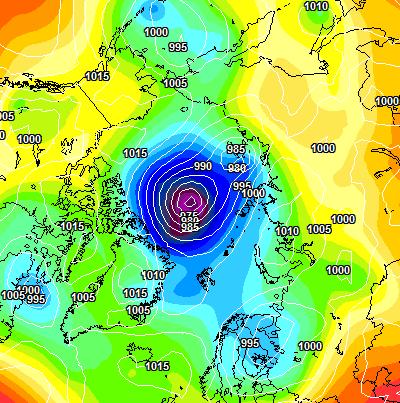
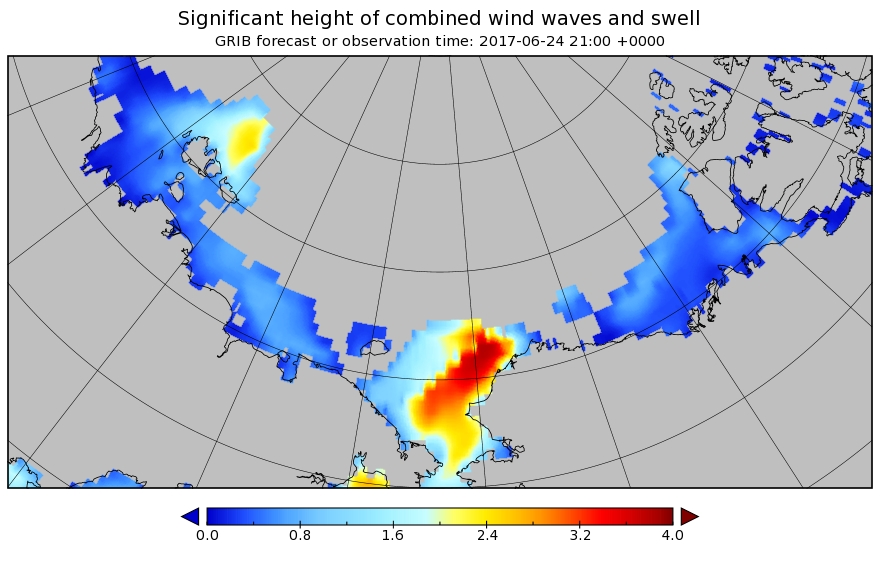
A sub 970 hPa cyclone is starting to enter the realms of realistic possibility, and also forecast are some significant waves in the Chukchi Sea and the expanding 2017 “Laptev Bite”:
[Edit – June 27th]
The forecast cyclone was nowhere near as deep as predicted. According to the analysis by Environment Canada it bottomed out at 980 hPa yesterday:
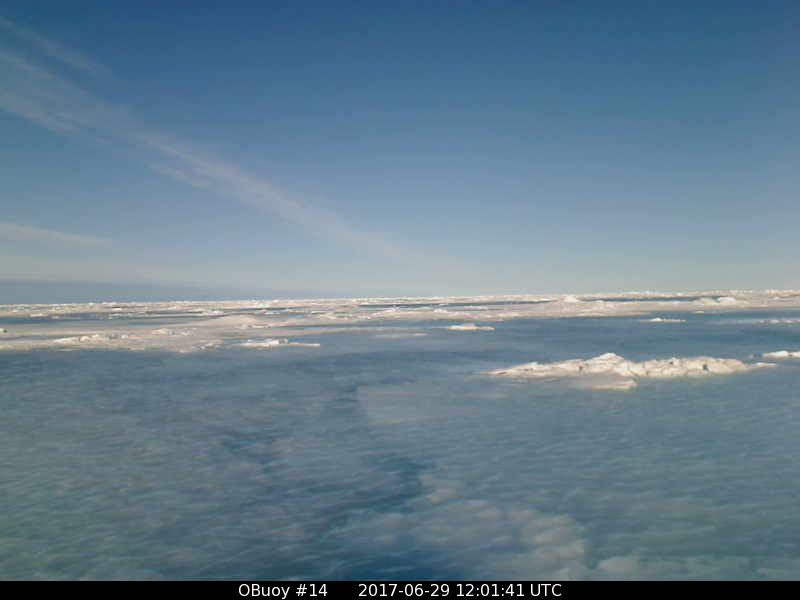
[Edit – June 29th]
O-Buoy 14 is currently firmly embedded in the fast ice of Viscount Melville Sound, deep in the heart of the Northwest Passage. Here’s the view from the buoy’s camera:
Before we got on to the more usual Arctic metrics let’s bear in mind that the beginning of May is the time when the ice on the mighty Mackenzie River begins to break up, ultimately sending a surge of (comparatively!) warm water rushing into the Beaufort Sea. The patches of open water visible in the Beaufort Sea off the Mackenzie Delta in early April refroze, but have recently opened up once again:
NASA Worldview “true-color” image of the Beaufort Sea on May 2nd 2017, derived from the MODIS sensor on the Terra satellite
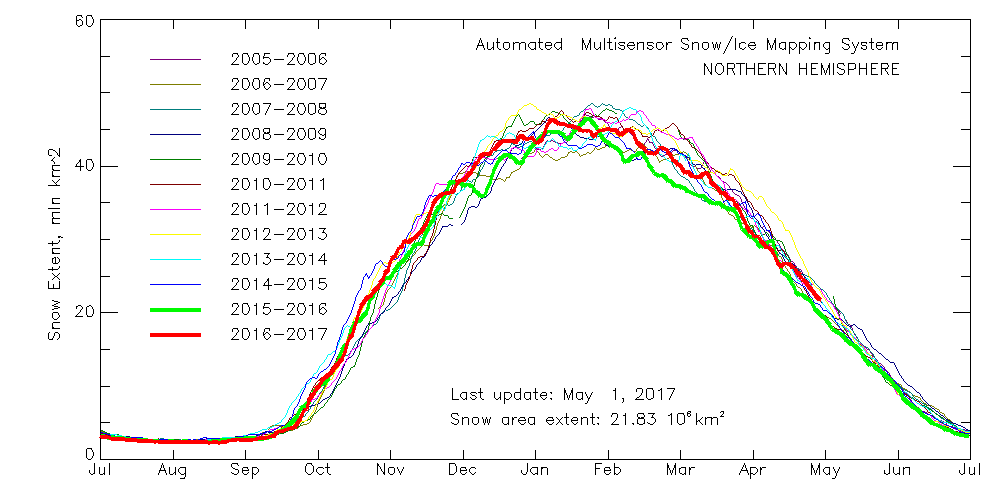
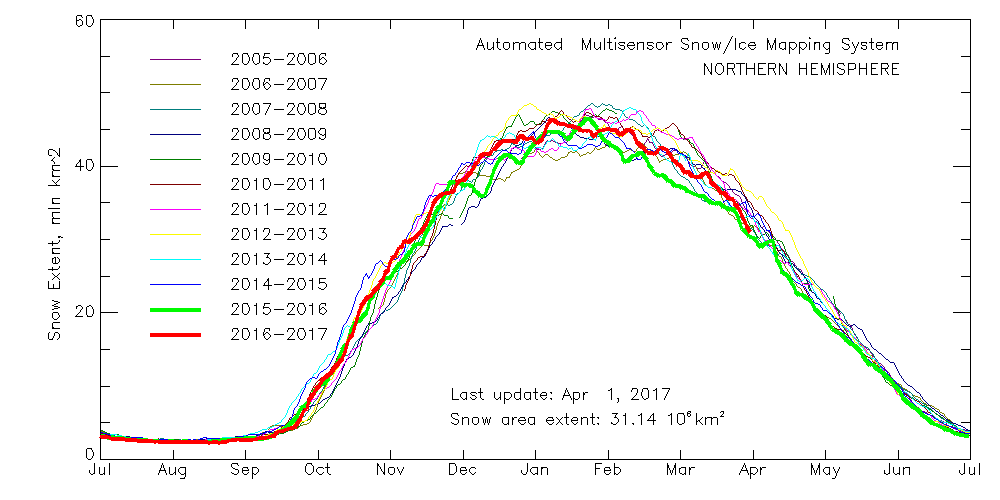
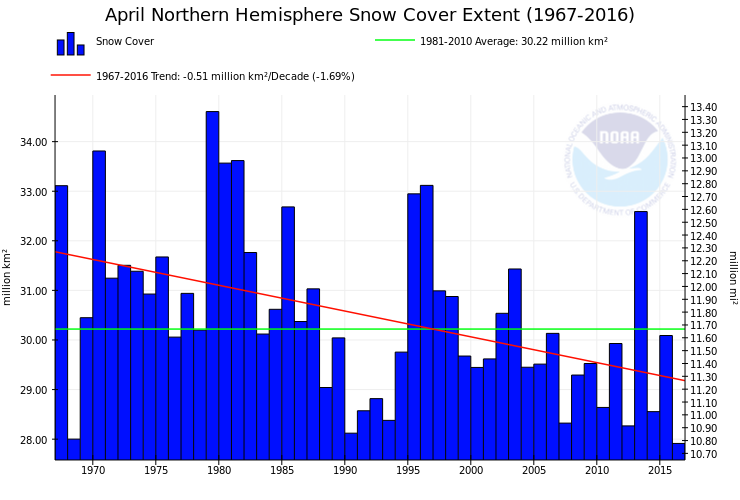
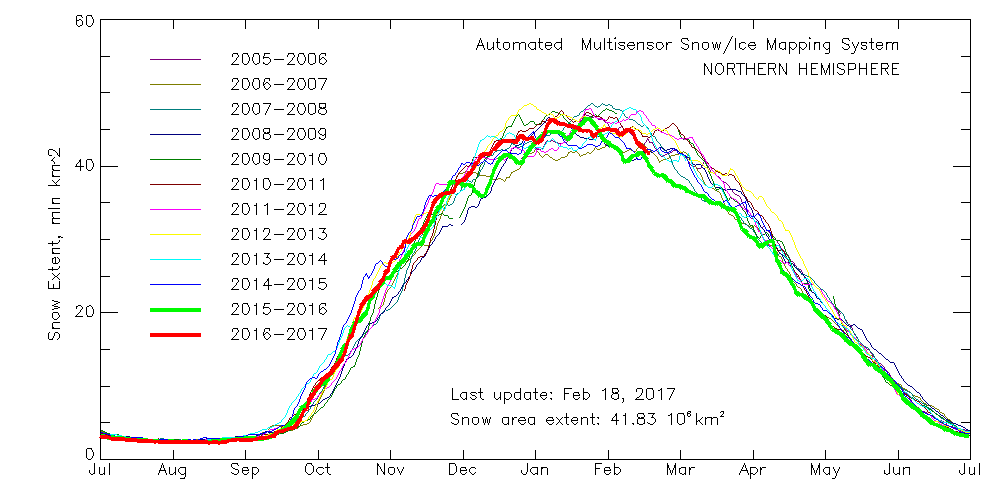
Meanwhile Northern Hemisphere snow cover is falling fast, albeit still above last year’s levels:
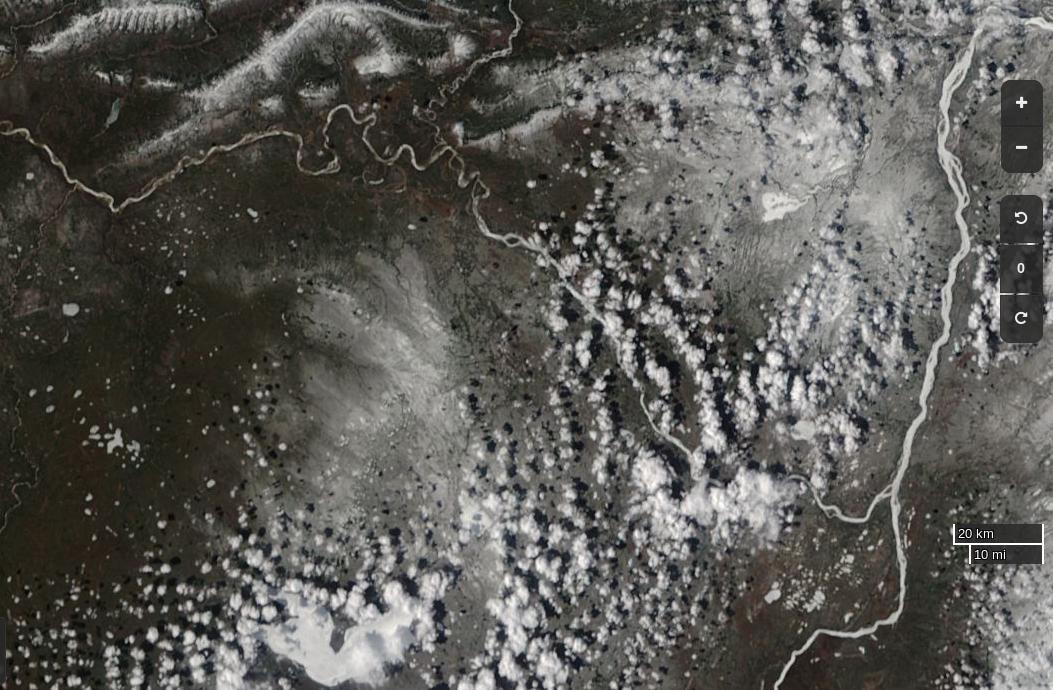
Here’s the current view of the Liard River in northern Canada, with the Mackenzie River running bottom to top on the right hand side:
NASA Worldview “true-color” image of the Liard and Mackenzie Rivers on May 2nd 2017, derived from the MODIS sensor on the Terra satellite
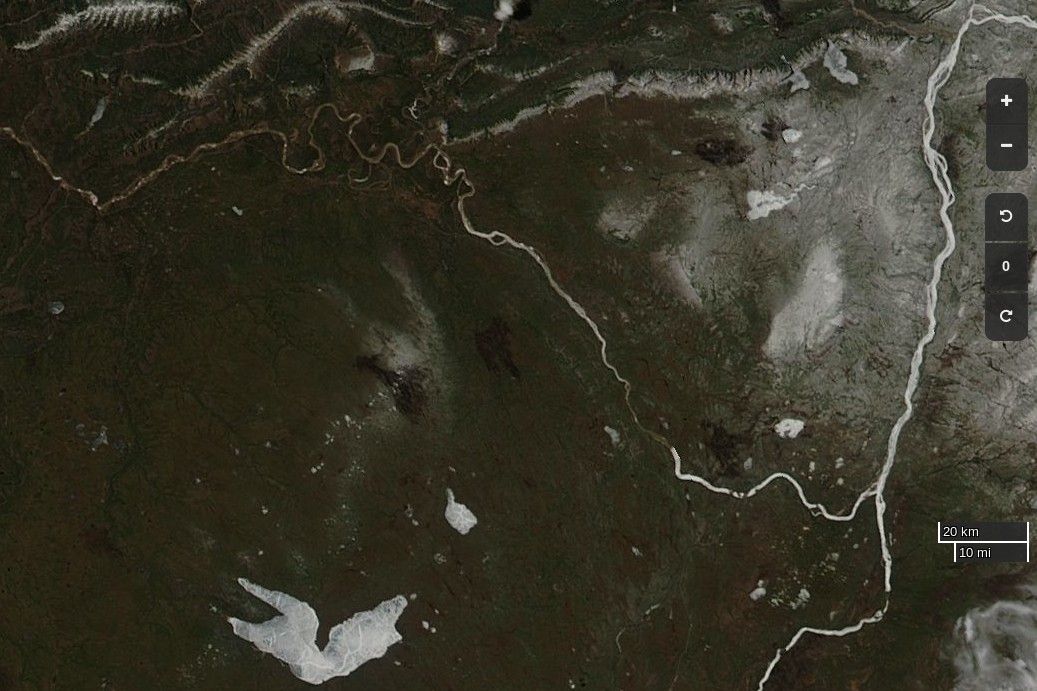
The break-up of the Liard leads the Mackenzie, and taking a look at last year’s view of the same area it’s apparent that this year there’s somewhat more snow on the ground, and that this years Mackenzie break-up will therefore be a few days later than last year:
NASA Worldview “true-color” image of the Liard and Mackenzie Rivers on May 2nd 2016, derived from the MODIS sensor on the Aqua satellite
Whilst early melt in the Beaufort Sea is currently behind last year, the reverse is most certainly the case next door in the Chukchi Sea. The skies are rather cloudy there at the moment, but using the Suomi NPP day/night band to peer through the gloom reveals this:
NASA Worldview “day/night band” image of the Chukchi Sea on May 2nd 2017, derived from the VIIRS sensor on the Suomi satellite
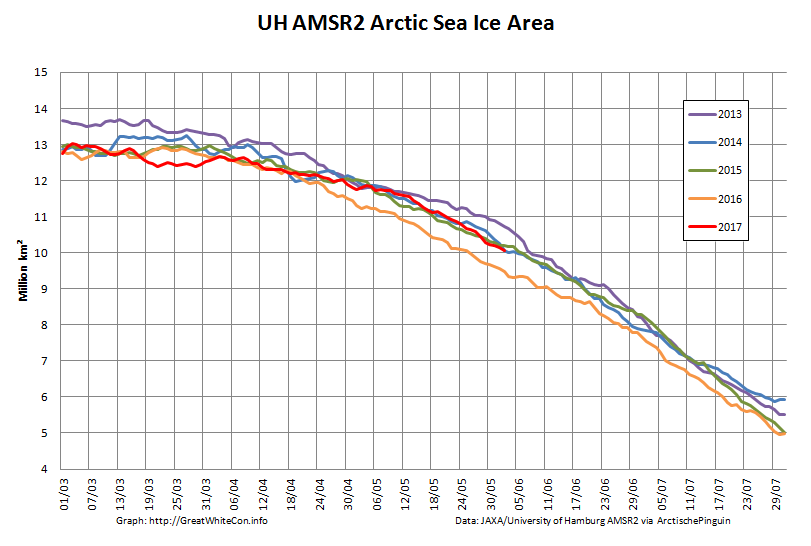
Whilst sea coverage on the Pacific periphery has continued to fall, extent on the Atlantic side has not been following suit. Hence overall Arctic sea ice area is no longer lowest in the satellite record:
Finally, until the new PIOMAS numbers are released at least, here’s how DMI freezing degree days look at the moment:
[Edit – May 4th]
The April PIOMAS numbers have been published: Arctic sea ice volume is yet again by far the lowest on record:
[Edit – May 5th]
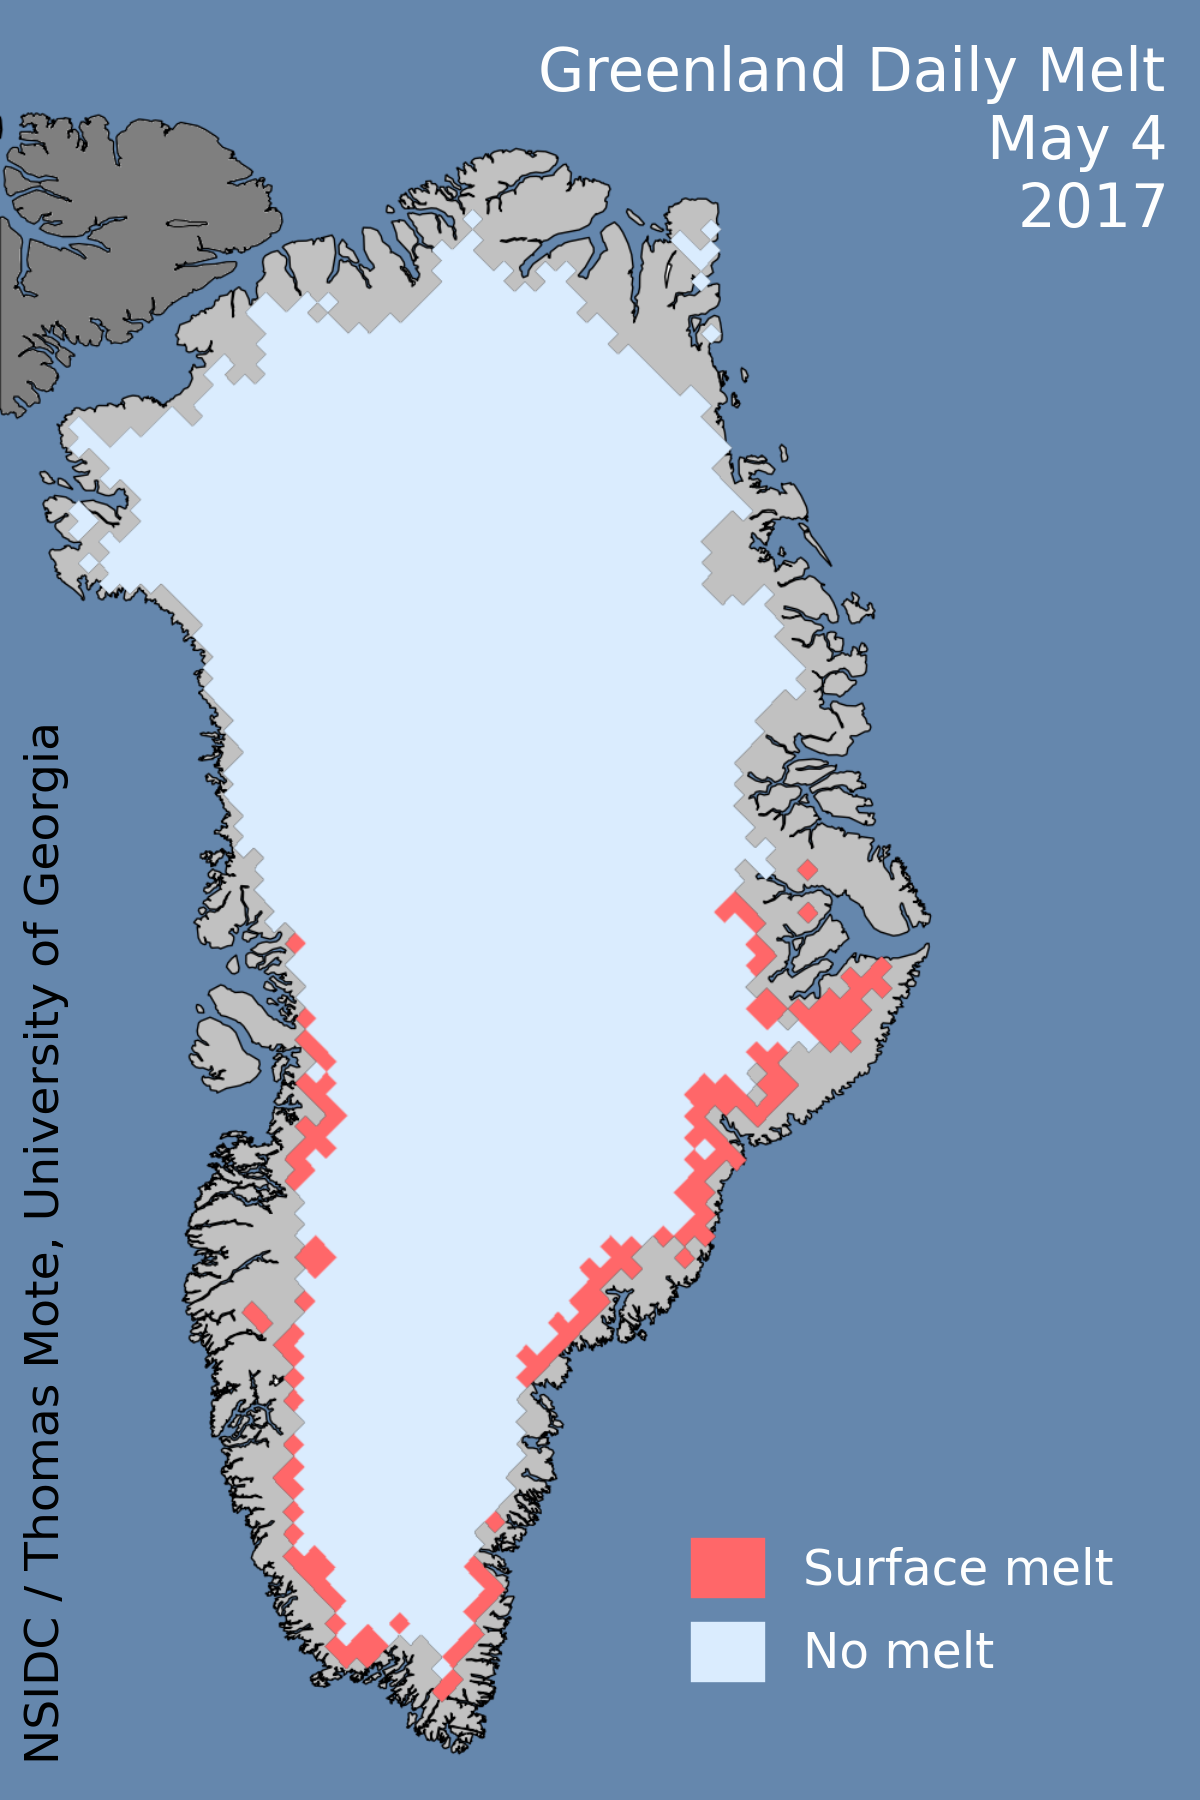
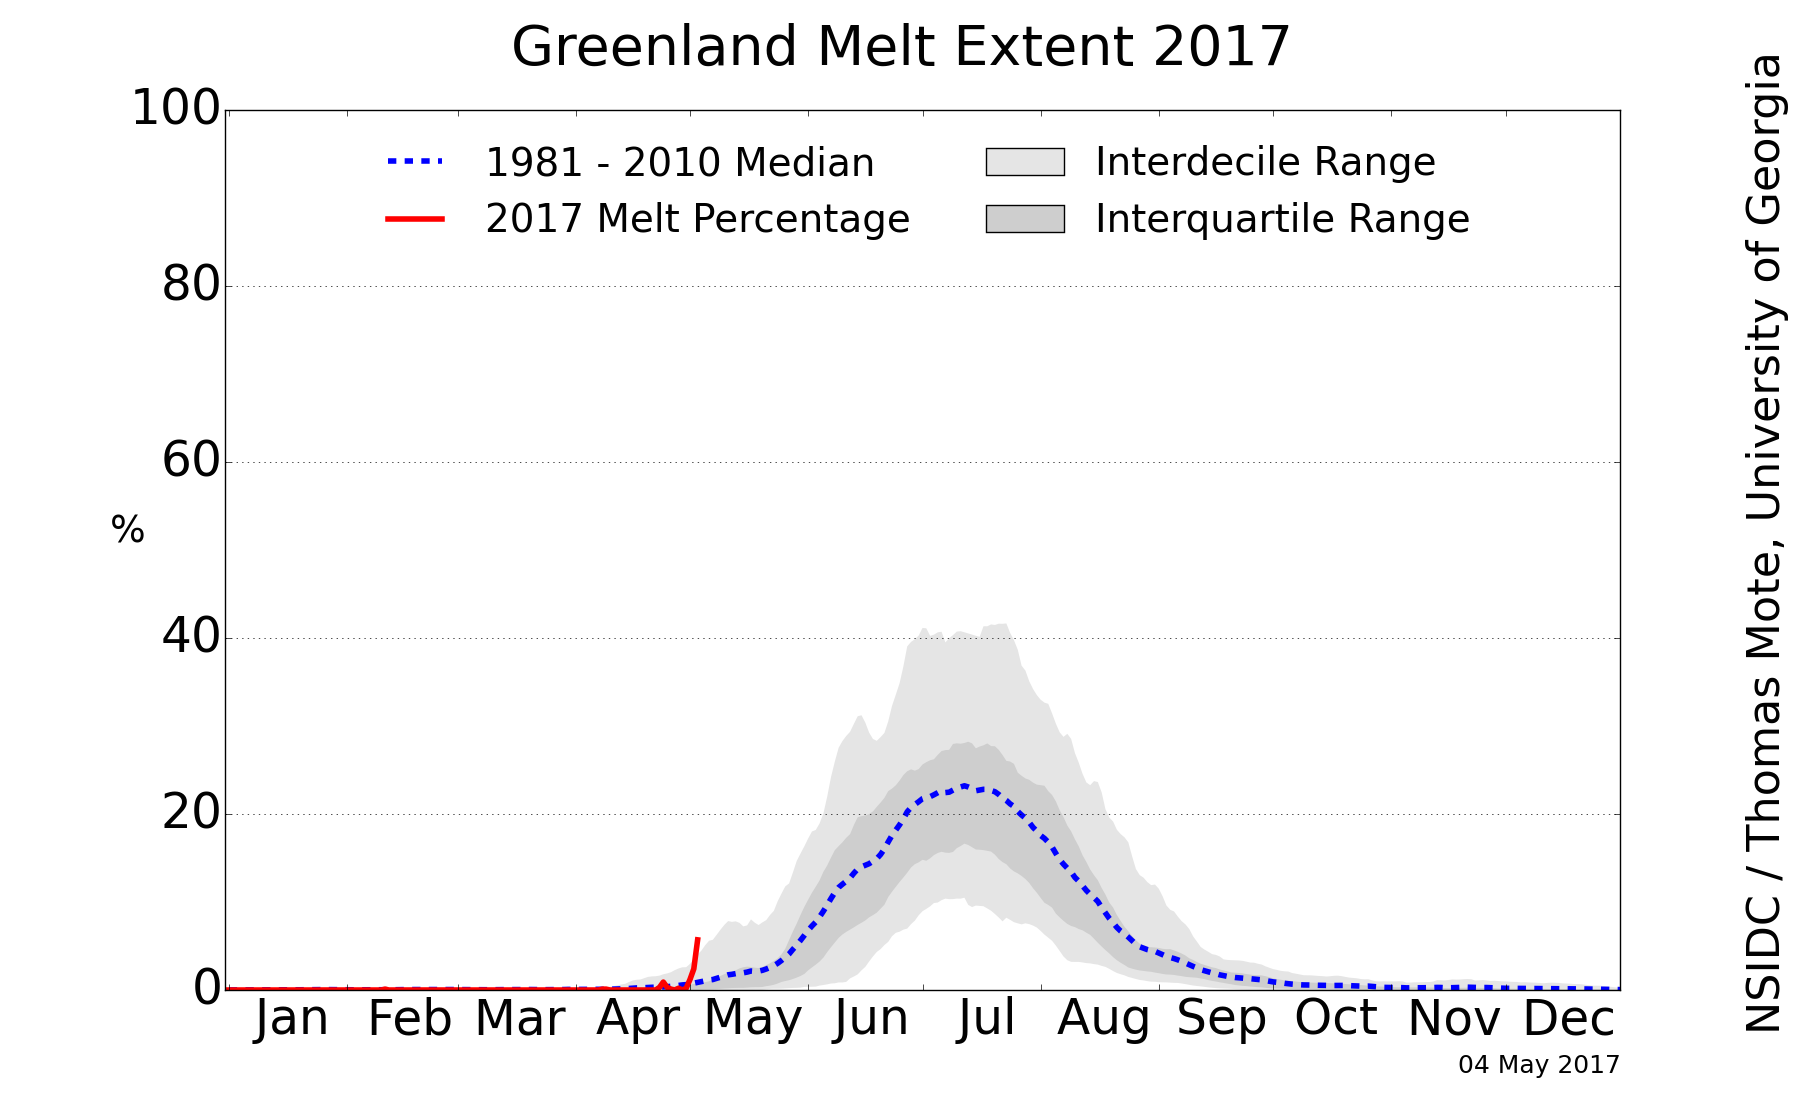
Greenland ice sheet surface melt has started early this year:
[Edit – May 12th]
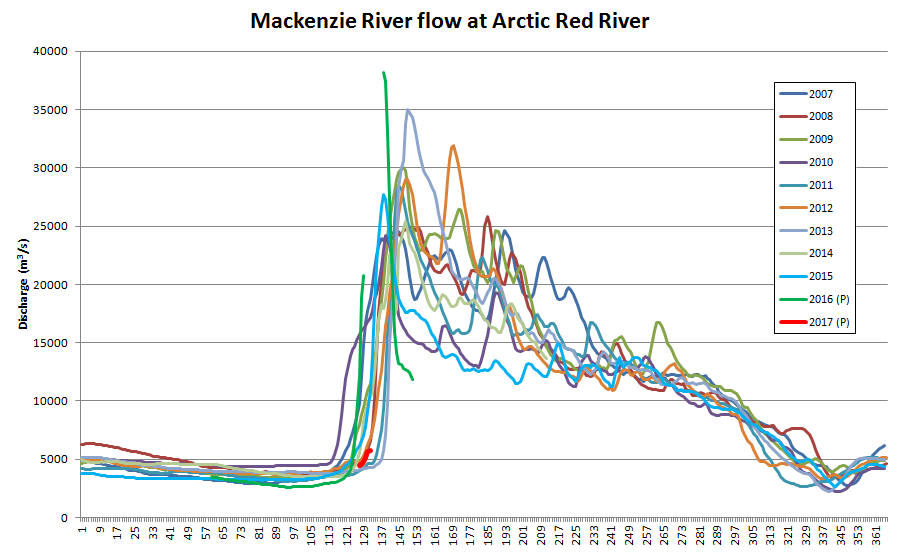
The ice break-up of the Mackenzie River is now visible as increased flow at the junction with Arctic Red River just south of the delta:
Mackenzie River flow at Arctic Red River up to May 12th 2017
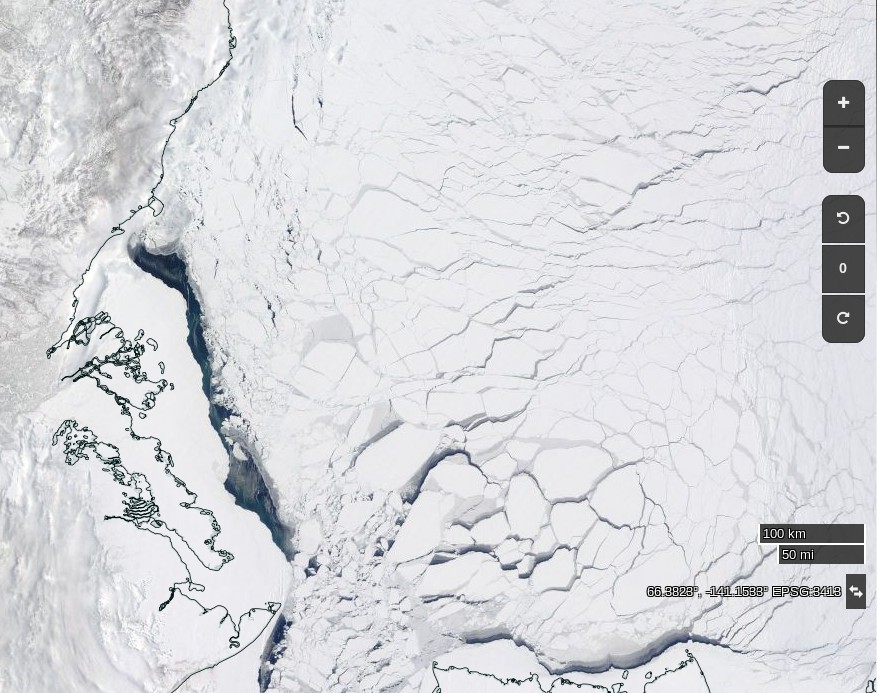
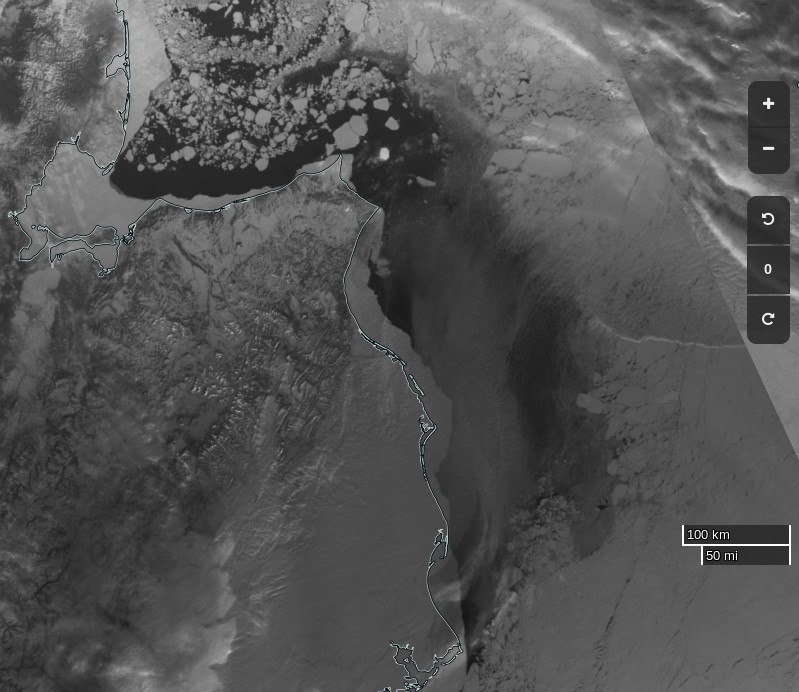
Meanwhile the sea ice in the Lincoln Sea north the Nares Strait is coming apart at the seams:
NASA Worldview “true-color” image of the Lincoln Sea on May 12th 2017, derived from the MODIS sensor on the Terra satellite
[Edit – May 17th]
May seems to be shaping up as month of two halves, both spatially and temporally. Here’s an overview of the current state of play:
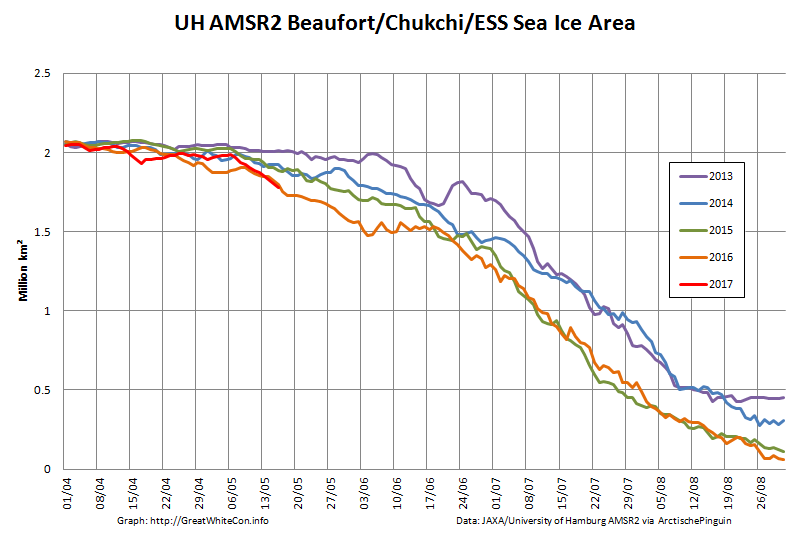
On the Pacific side of the Arctic sea ice area has been declining rapidly courtesy of the expanding areas of open water visible in the Beaufort, Chukchi and East Siberian Seas. It’s currently tracking below other recent years:
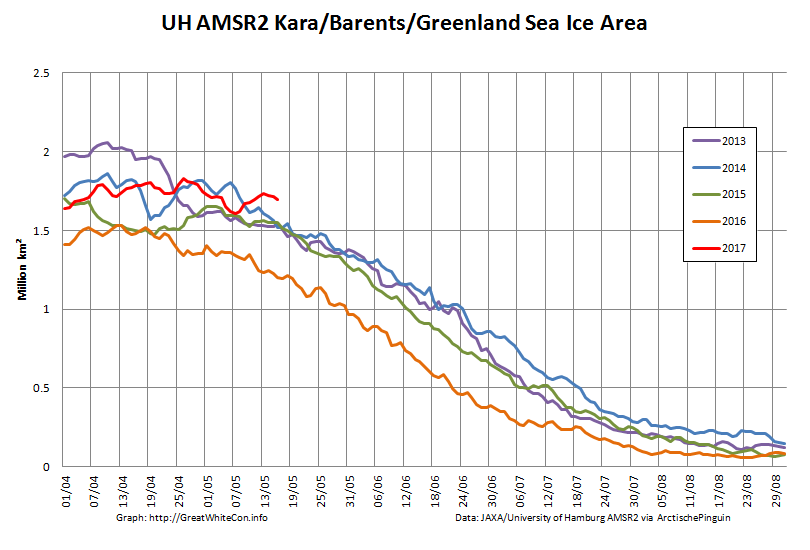
However over on the Atlantic side area has been flatlining, and is currently above other recent years:
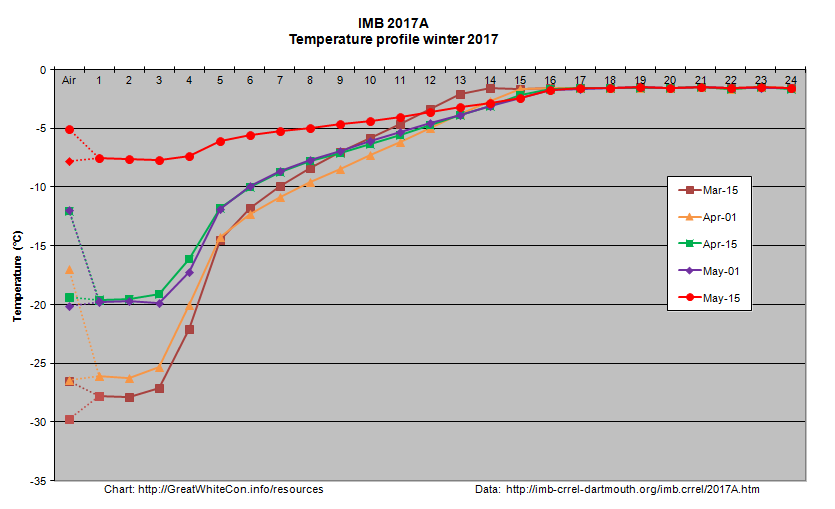
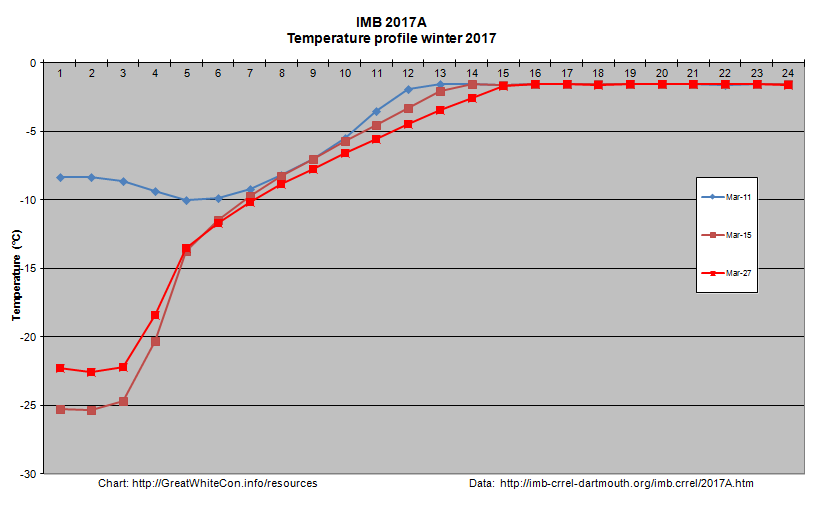
Ice mass balance buoy 2017A is now located near the boundary between the Beaufort and Chukchi Seas and as the melting season in that vicinity rapidly approaches it reveals that thermodynamic thickening has thus far achieved a mere 119 cm:
Arctic wide sea ice area has recently started to decline at an increasing rate:
During the second half of the month it will be interesting to see whether the forecast high temperatures produce significant melt ponding. If so it’s conceivable that 2017 area could drop below 2016 again by the beginning of June. There already signs of surface melt at places as far apart as Franklin Bay, Chaunskaya Bay and even the Great Bear Lake!
Watch this space!
References
Muhammad, P., Duguay, C., and Kang, K.-K.: Monitoring ice break-up on the Mackenzie River using MODIS data, The Cryosphere, 10, 569-584, doi:10.5194/tc-10-569-2016, 2016.
Rood S. B., Kaluthota S., Philipsen L. J., Rood N. J., and Zanewich K. P. (2017) Increasing discharge from the Mackenzie River system to the Arctic Ocean, Hydrol. Process., 31, 150–160. doi: 10.1002/hyp.10986.
Kwok, R., L. Toudal Pedersen, P. Gudmandsen, and S. S. Pang (2010), Large sea ice outflow into the Nares Strait in 2007, Geophys. Res. Lett., 37, L03502, doi:10.1029/2009GL041872.
Particularly in view of all the balderdash concerning “climate science” being spouted in Washington DC on Wednesday lets first of all run through some Arctic sea ice facts from April 1st 2017 or thereabouts:
Northern Hemisphere Snow Extent:
Arctic Sea Ice Area:
Arctic Sea Ice Extent:
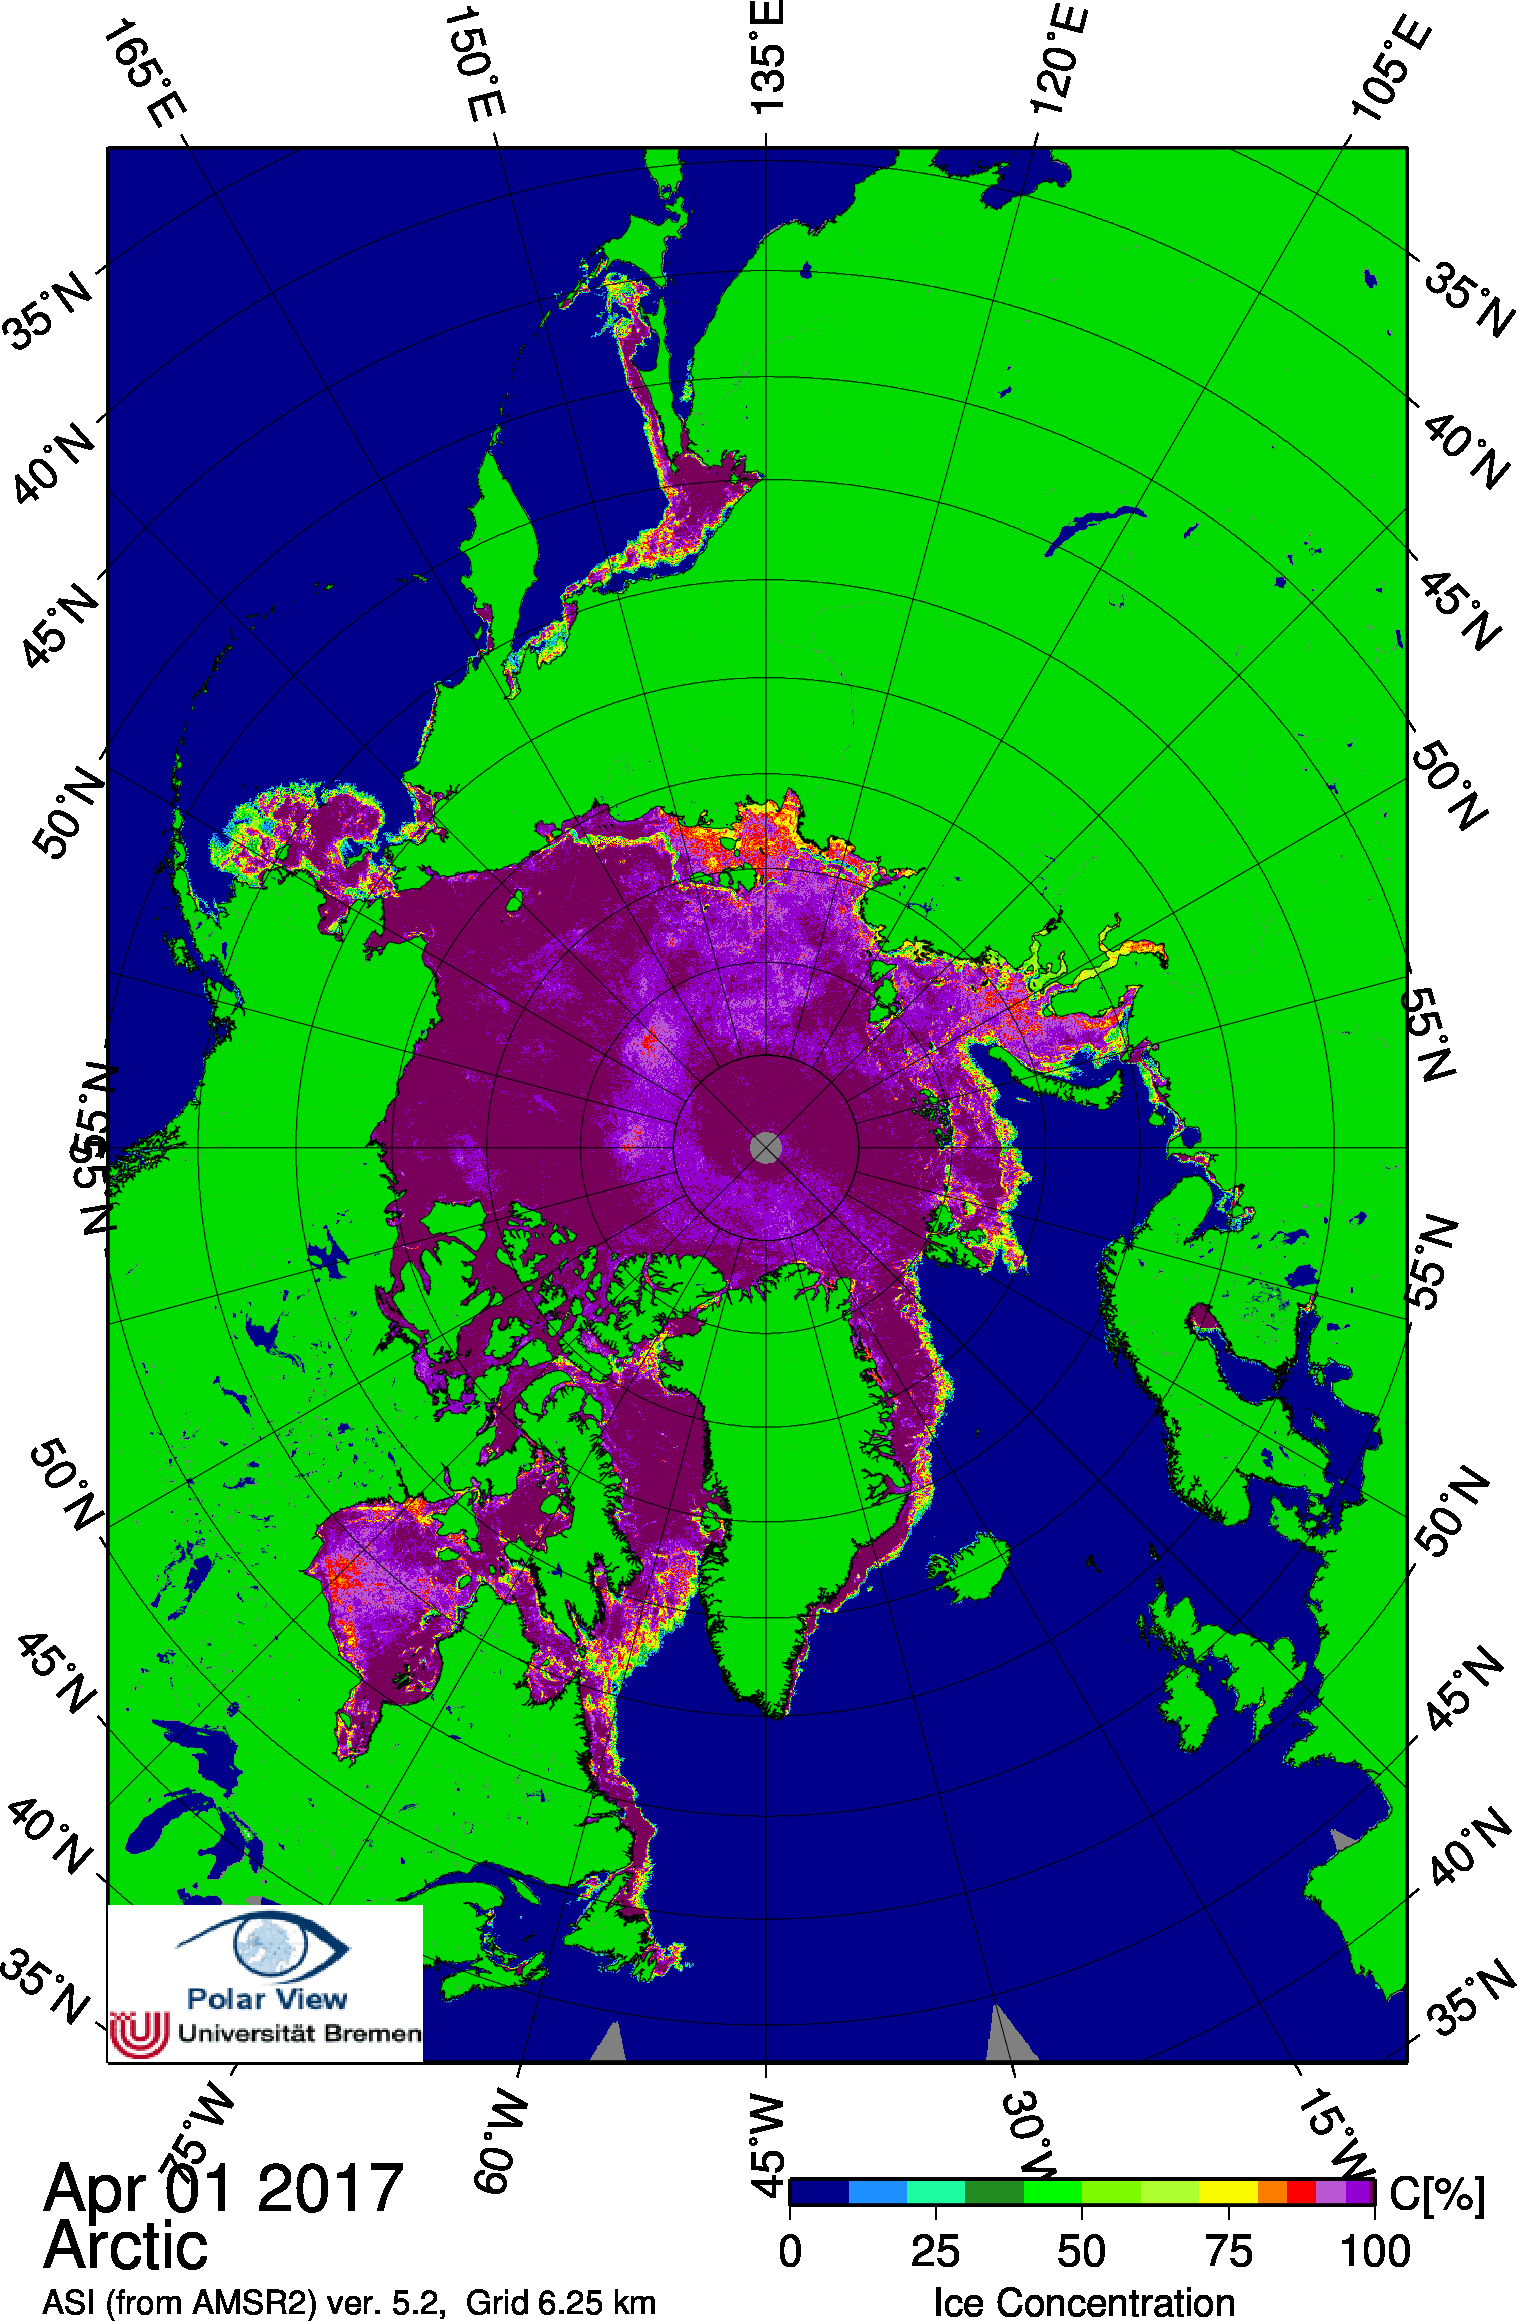
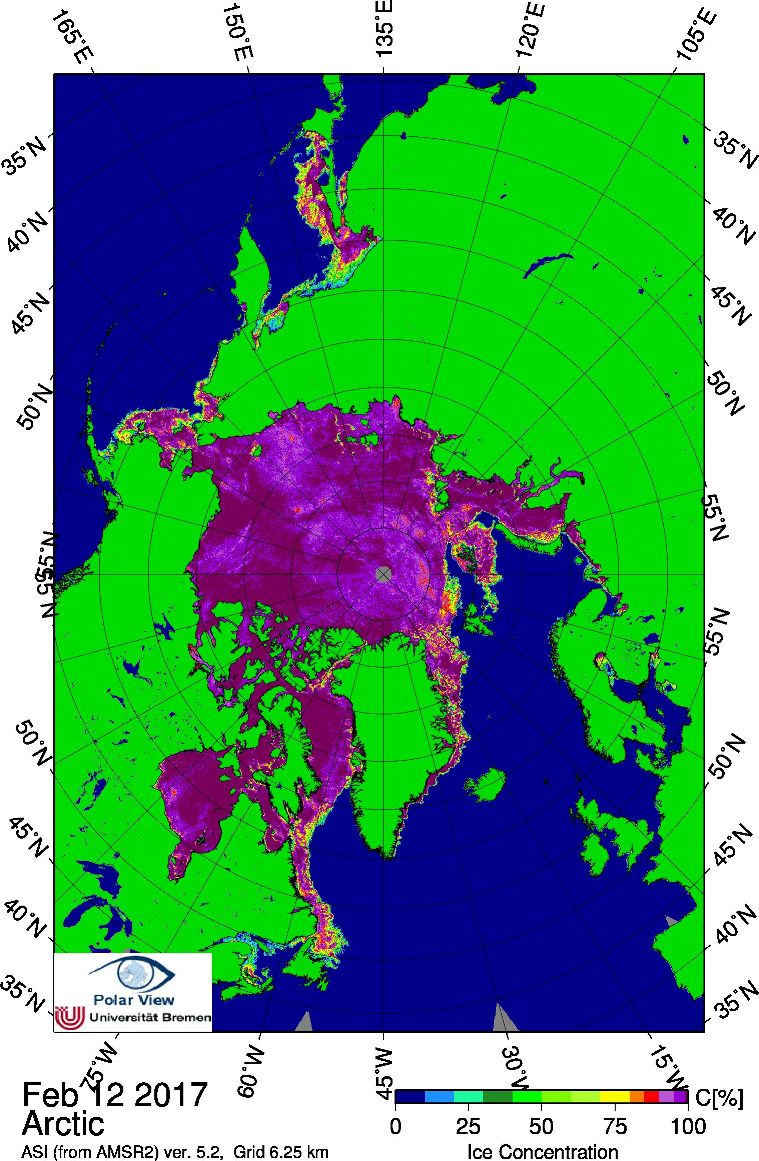
Arctic Sea Ice Concentration:
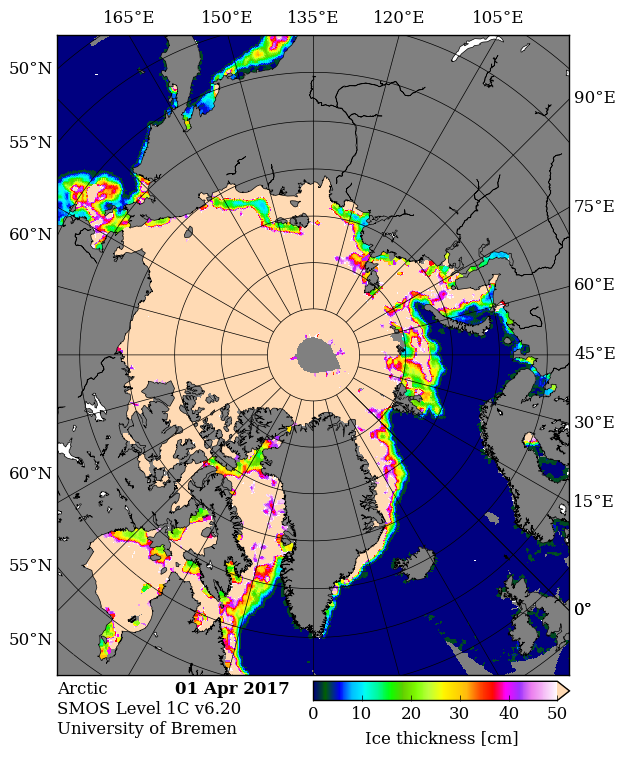
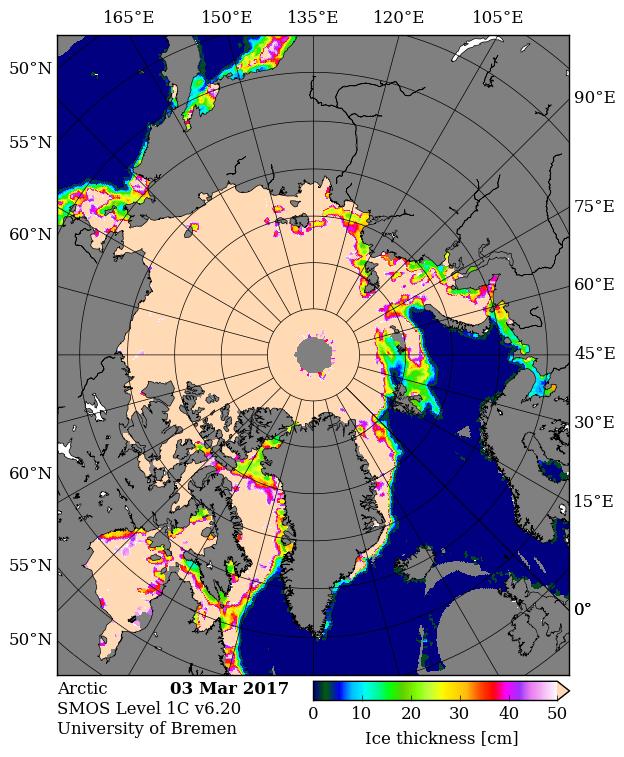
Thin ice map from the University of Bremen SMOS:
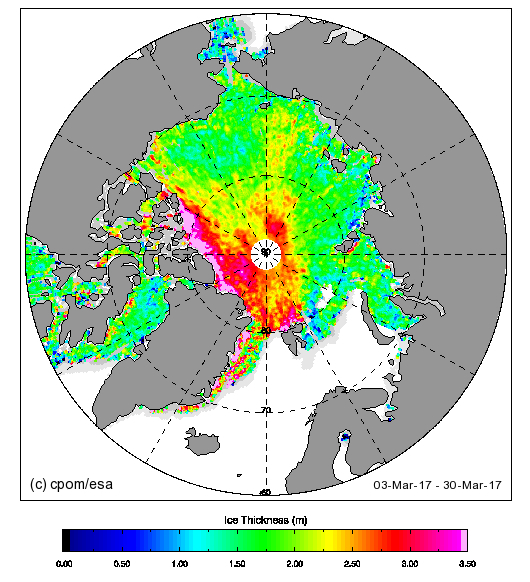
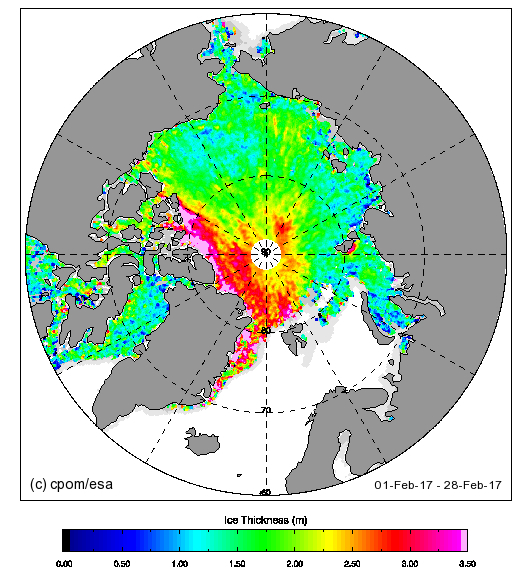
Thick ice map from CPOM CryoSat-2
Beaufort Sea ice thickness growth graph:
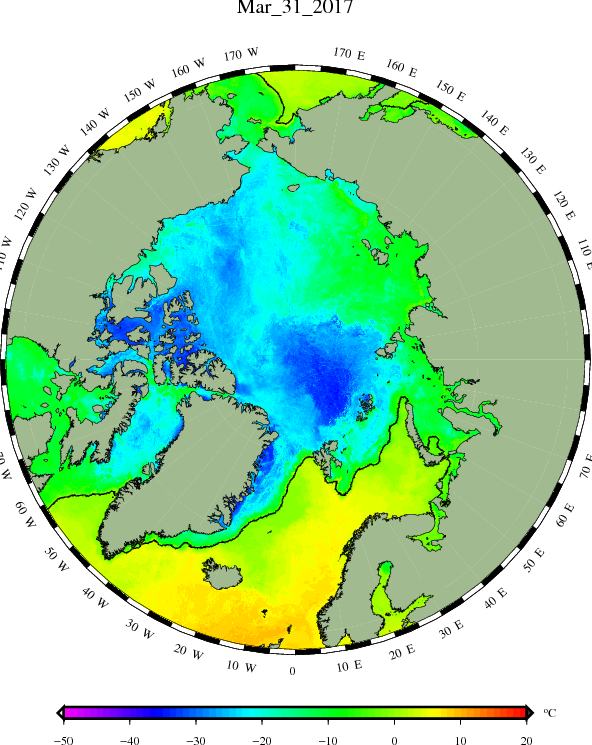
DMI sea ice temperature map:
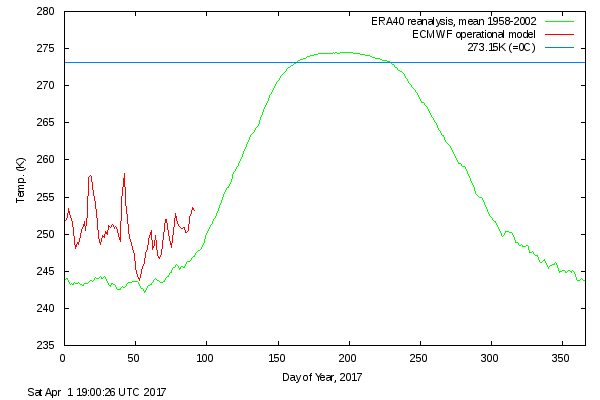
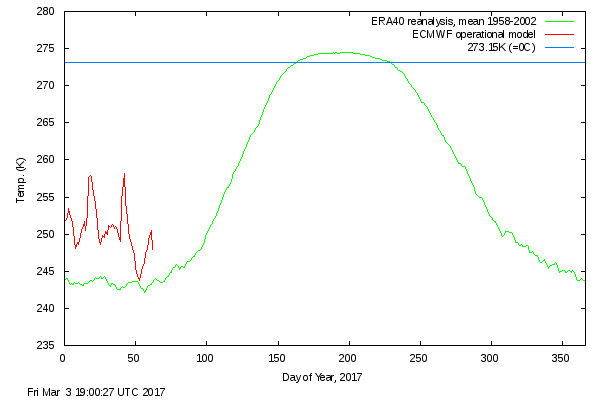
DMI atmospheric temperature graph:
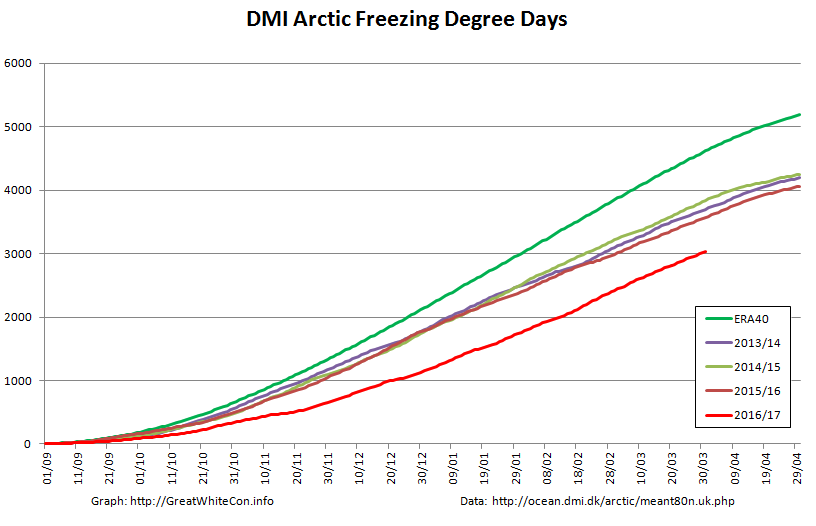
DMI Arctic Freezing Degree Days:
PIOMAS volume for March will follow in a few days, but it’s extremely unlikely to be anything other than “lowest for the date”.
What preliminary conclusions can we draw from this plethora of pretty pictures? First of all the Arctic hasn’t suddenly gone into “deep freeze” mode. Temperatures above 80 degrees north are rising again and are well above the climatology. Freezing degree days are still the lowest on record by a wide margin. Northern hemisphere snow cover is falling fast and is currently just above last year.
In contrast to last year, and thanks to lots of cyclones and very little in the way of anticyclones, there’s plenty of sub half meter sea ice in the Laptev and East Siberian Seas and hardly any in the Beaufort Sea. There’s also plenty of thin ice to be seen on both the Atlantic and Pacific peripheries.
The usual southerly arch hasn’t formed in the Nares Strait between Greenland and Ellesmere Island, and as SMOS shows the sea ice in the strait is consequently very thin. That leads one to wonder when the northern arch in the Lincoln Sea might give way.
It’s not immediately apparent from the still images above, but there’s been relatively large amounts of “old ice” exported from the Central Arctic on the Atlantic side, hence the recent increase in overall extent which is now second lowest for the date (since satellite records began). Area has been creeping up as well over recent days, but is still lowest for the date, as it has been for most of the last year. Sea ice “compactness” has decreased somewhat and given all the thin ice around the edges extent will soon start dropping once again.
All in all, the Arctic sea ice prognosis is not good. Are you watching Lamar Smith? (Pun intended!)
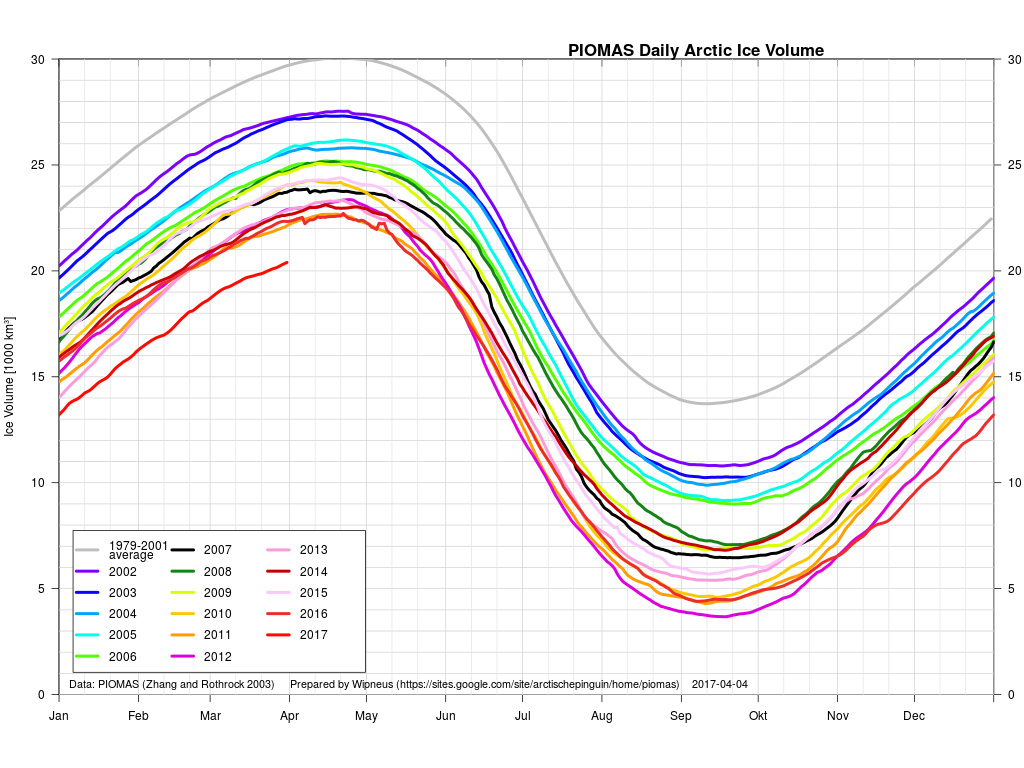
[Edit – April 4th]
The March PIOMAS update is out! As suspected, Arctic sea ice volume is still by far the lowest on record:
Volume on March 31st 2017 was 20.398 thousand cubic kilometers. The previous lowest volume for the date was 22.129 thousand km³ in 2011.
Here too is the PIOMAS modelled Arctic sea ice thickness map:
PIOMAS daily gridded thickness for March 31st 2017
[Edit – April 12th]
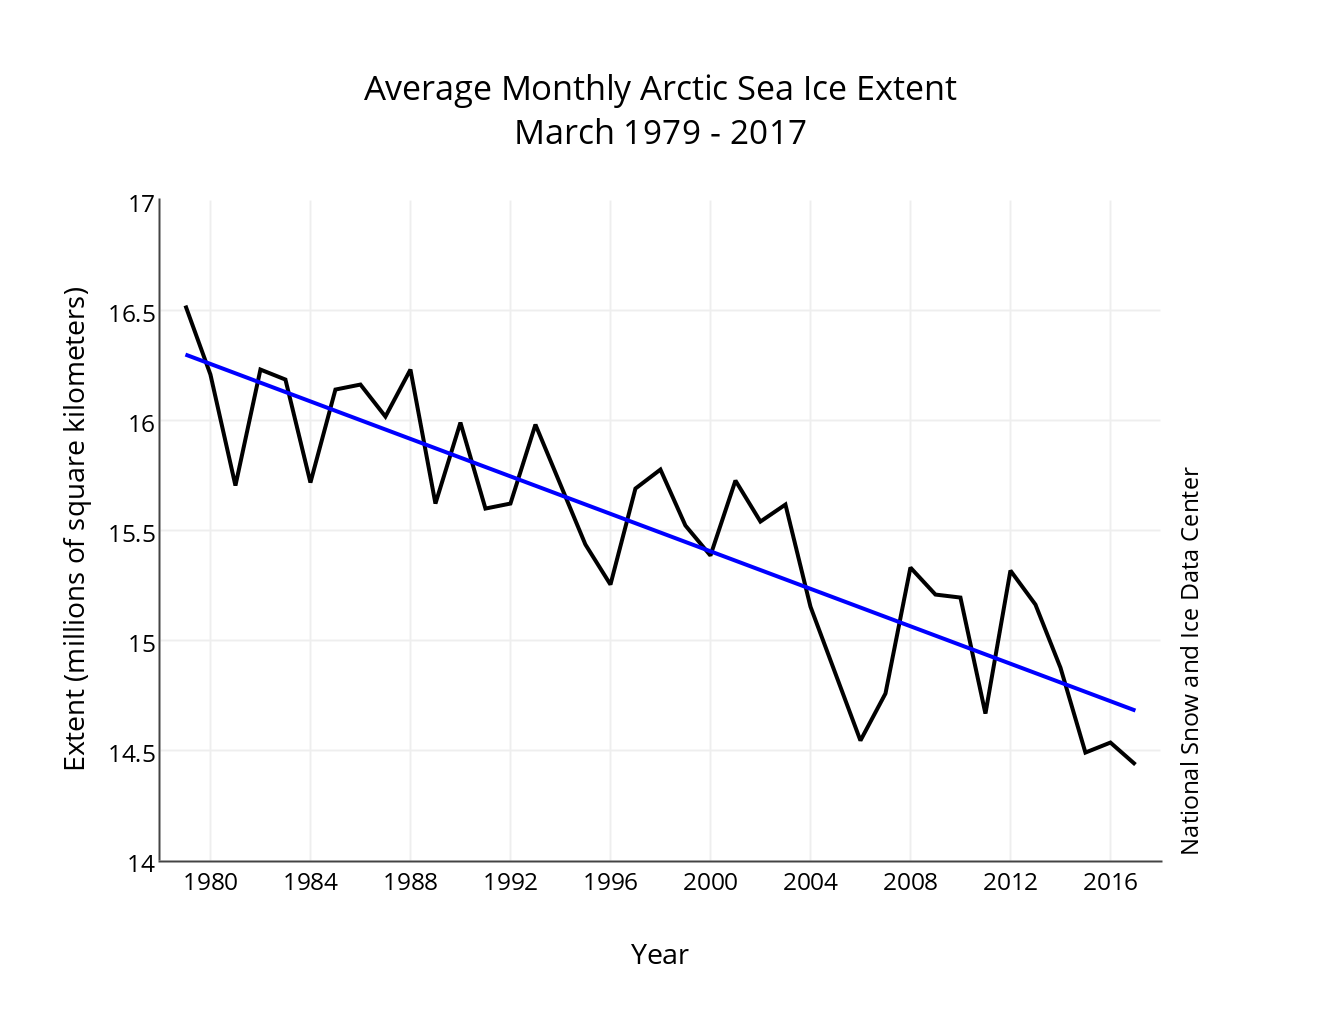
The latest edition of the NSIDC’s Arctic Sea Ice News confirms that their monthly extent metric for March 2017 was the lowest in the satellite record for the month:
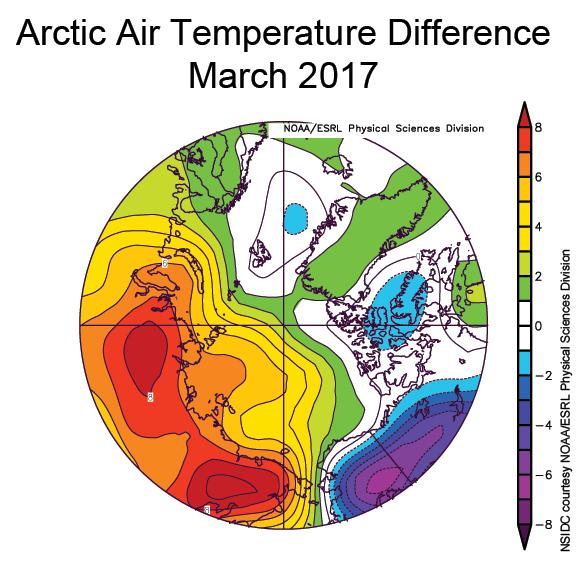
As well as highlighting the anomalously warm temperatures across much of the Arctic:
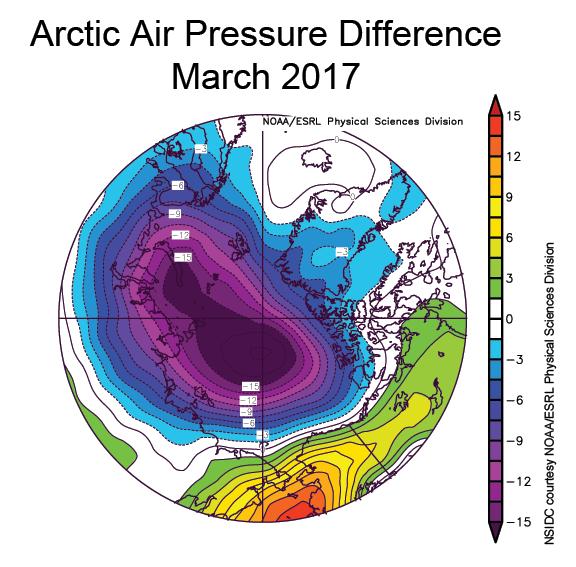
the NSIDC article includes this telling pressure anomaly map:
New work by an international team led by Igor Polyakov of the University of Alaska Fairbanks provides strong evidence that Atlantic layer heat is now playing a prominent role in reducing winter ice formation in the Eurasian Basin, which is manifested as more summer ice loss. According to their analysis, the ice loss due to the influence of Atlantic layer heat is comparable in magnitude to the top down forcing by the atmosphere.
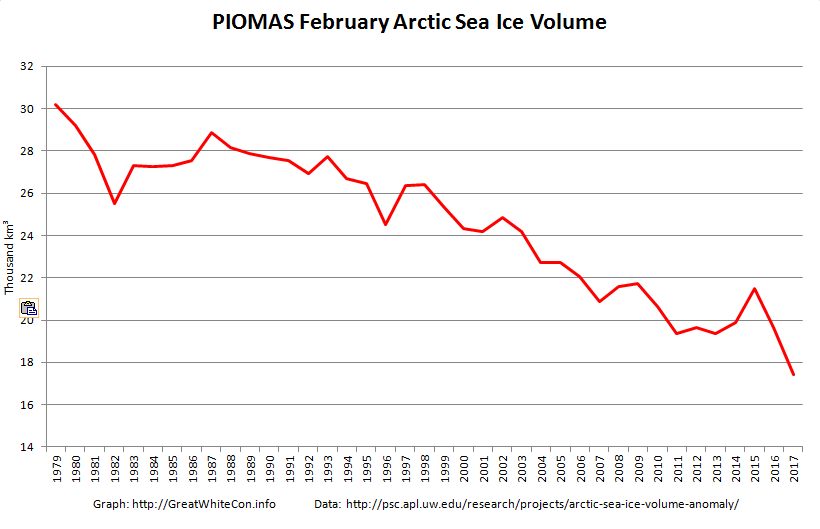
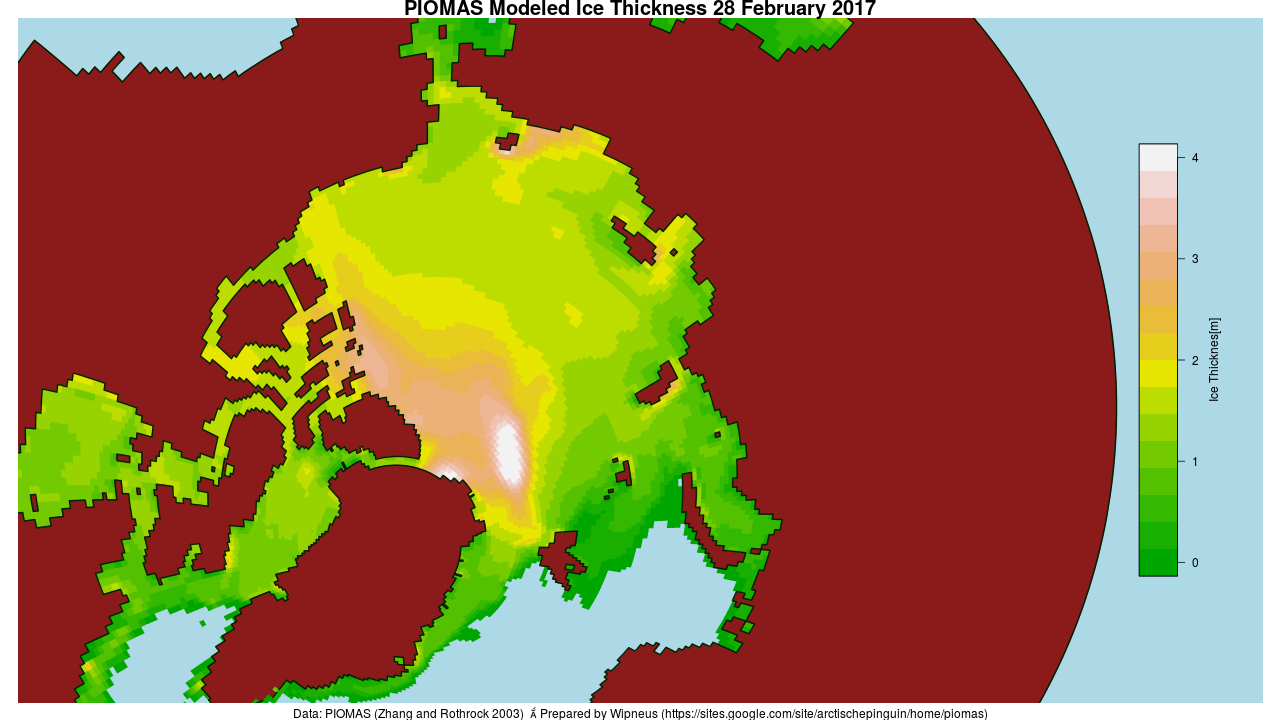
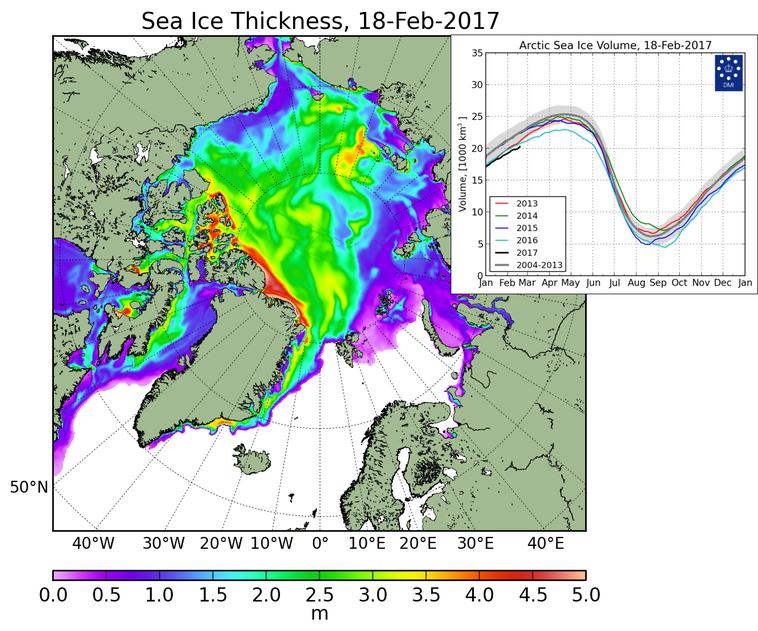
The February 2017 PIOMAS Arctic sea ice volume numbers are out. It’s no longer surprising to report that they are the lowest ever for the month of February in records going back to 1979:
Here’s the PIOMAS gridded thickness map for February 28th:
There does seem to be a small patch of slightly thicker ice in the East Siberian Sea off Chaunskaya Bay, but there’s still a much larger area of sub 0.5 meter thick ice in the Laptev and Kara Seas.
The Danish Meteorological Institute’s temperatures for the “Arctic area north of the 80th northern parallel” graph shows somewhat more “normal” readings in February 2017, but still without falling below the ERA40 climatology this year or in 2016:
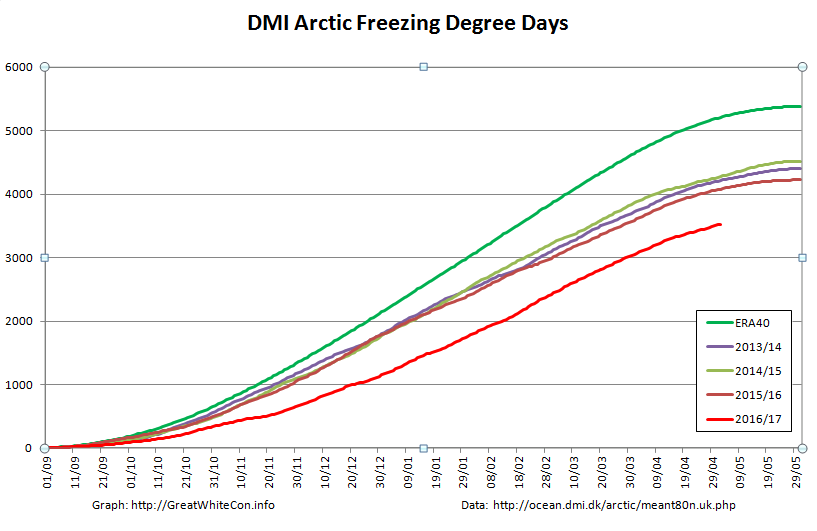
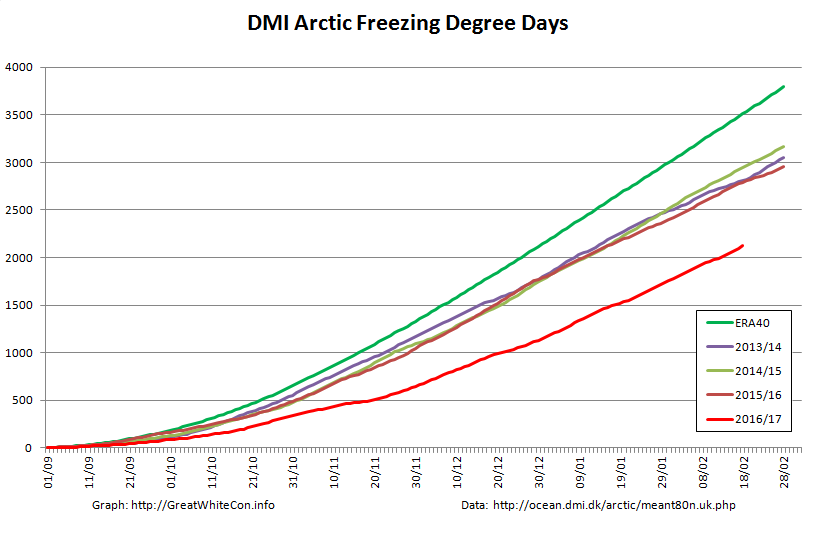
The graph of cumulative Freezing Degree Days (FDD for short) is still far below all previous years in DMI’s records going back to 1958:
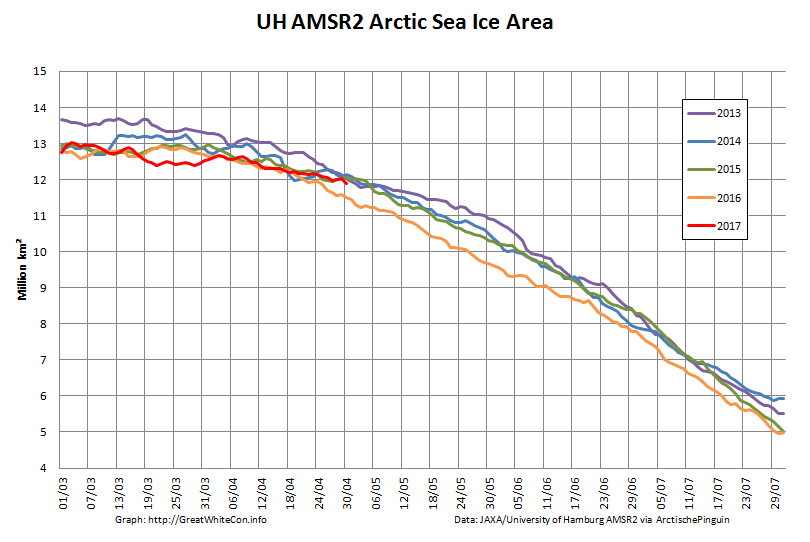
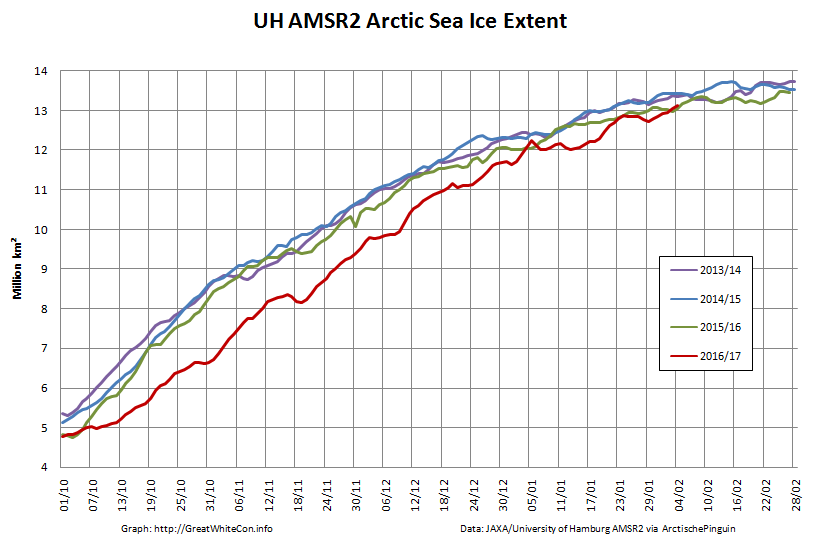
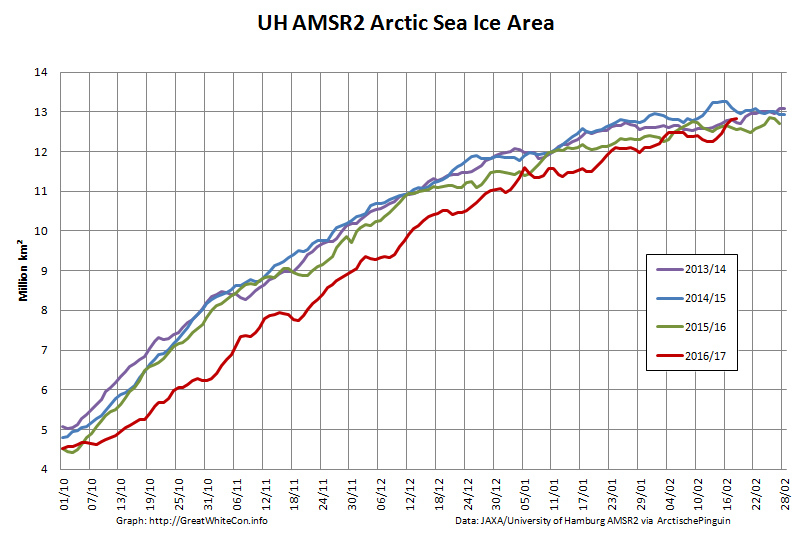
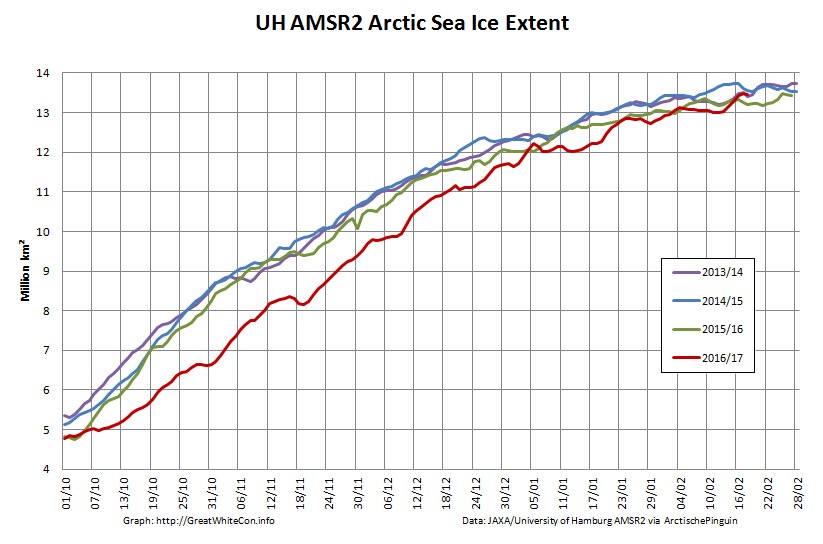
Finally, for the moment at least, here’s the high resolution AMSR2 Arctic sea ice area and extent:
I’m going to have to eat some humble pie, or crow pie as I gather it’s usually referred to across the Atlantic, following my tentative “2017 maximum prediction” a couple of weeks ago. Both area and extent posted new highs for the year yesterday, with area creeping above 13 million square kilometers for the first time this year.
[Edit – March 7th]
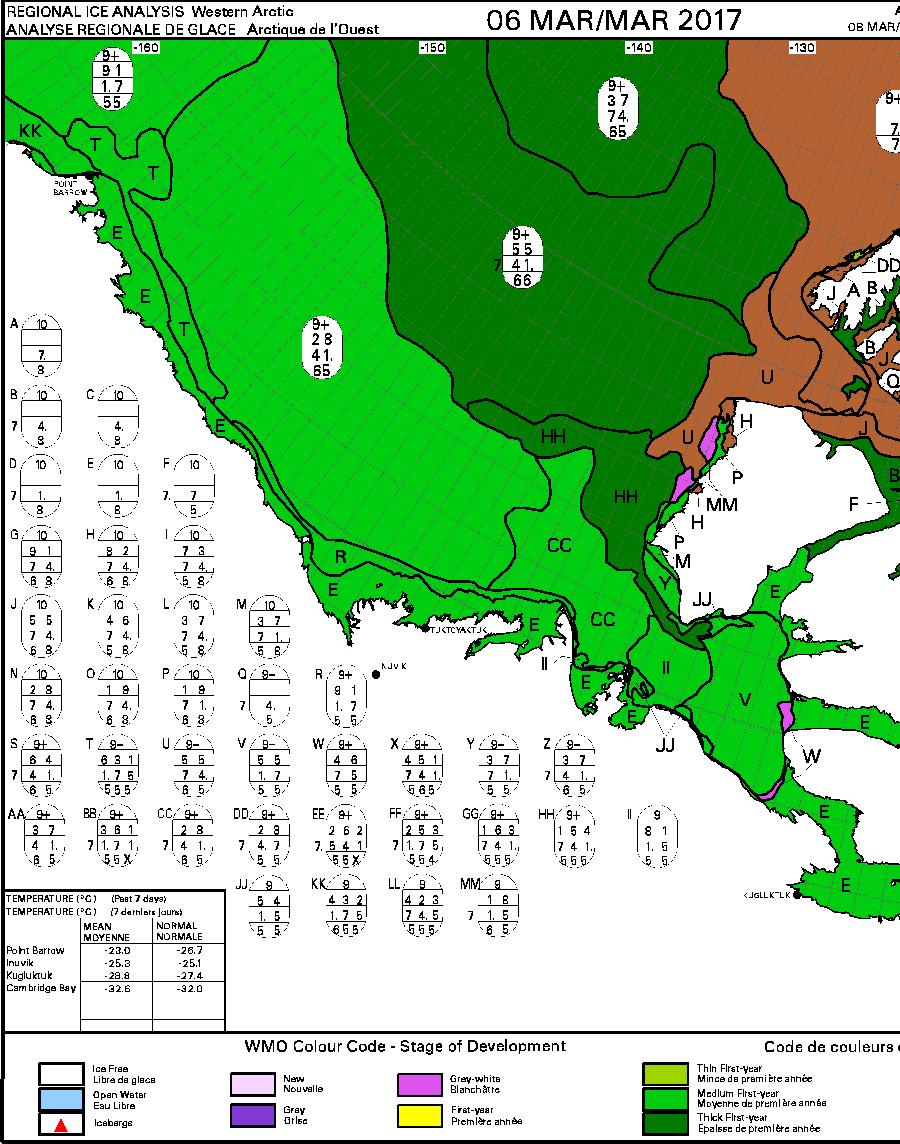
Commenter Michael Olsen suggests that “thicker ice being pushed into the Alaskan and Russian parts of the Arctic Ocean”. Here’s some evidence:
The United States’ National Weather Service current sea ice stage of development map for Alaskan waters:
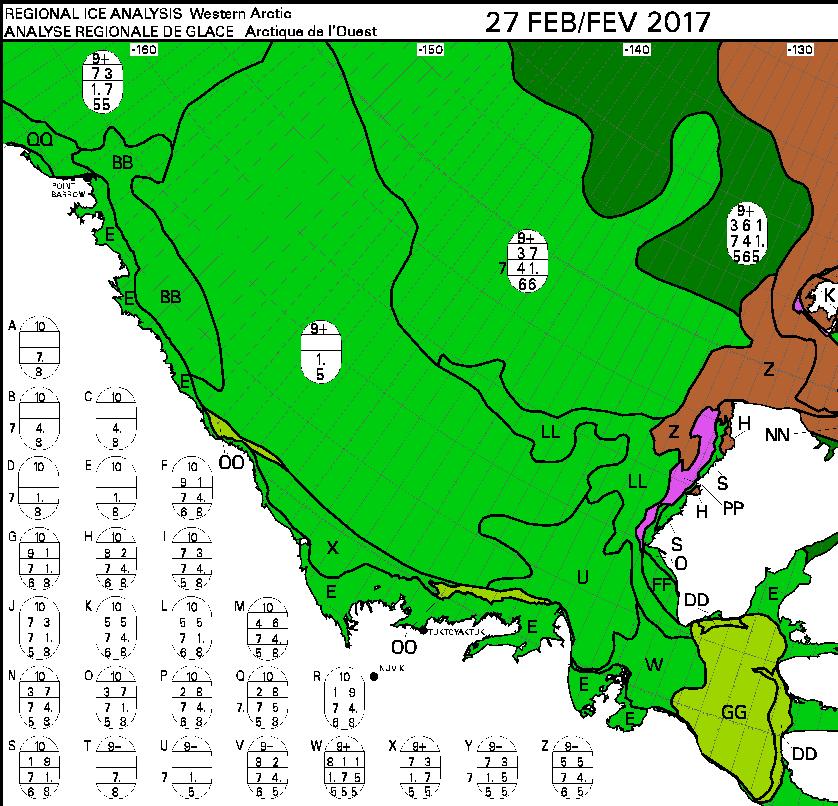
This week’s Canadian Ice Service sea ice stage of development map is expected later today, so for now here’s last week’s:
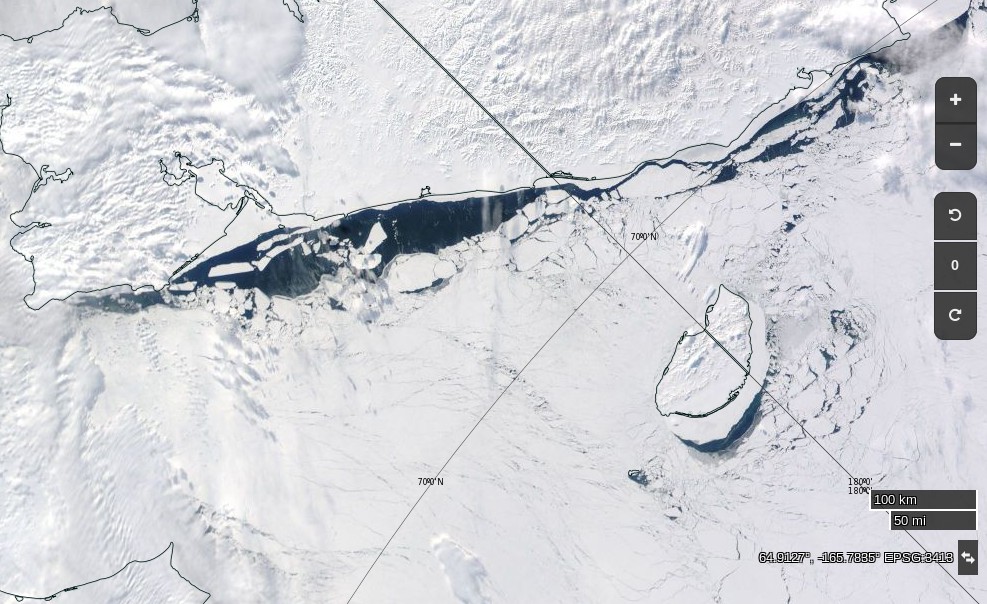
Especially for Michael, a visual image of all the “thicker ice [that’s been] pushed into the Russian parts of the Arctic Ocean” courtesy of the nice folks at NASA:
NASA Worldview “true-color” image of the Chukchi Sea on March 10th 2017, derived from the MODIS sensor on the Aqua satellite
[Edit – March 12th]
Yet another strong Arctic cyclone has been battering the sea ice in the Arctic Basin. According to Environment Canada this one bottomed out at 971 hPa at 06:00 UTC today.
David Rose is mercifully quiet this weekend, but there’s no rest for the wicked! Christopher Booker in the Sunday Telegraph leads a bunch of the usual Alt-facts suspects in a barrage of fake news about our dearly beloved Arctic sea ice. According to Mr. Booker in the “Arctic Myths” section of his column today:
As the fake science of global warming continues to crumble, one scare story the zealots are determined to hold on to at all costs is their claim that ice in the Arctic is dangerously vanishing. Yet again lately we have been treated to a barrage of such headlines as “Hottest Arctic on record triggers massive ice melt”.
The nearest we got to such a headline here at the Great White Con was “Arctic Sea Ice News from AGU” in which article we showed images which said things like:
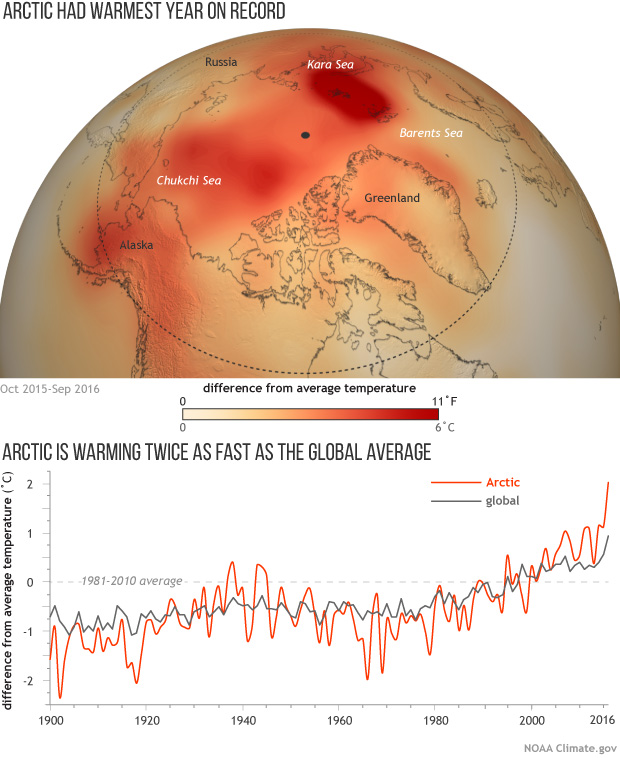
That’s because last year was the *hottest year on record in the Arctic! Undeterred by mere facts Mr. Booker continues:
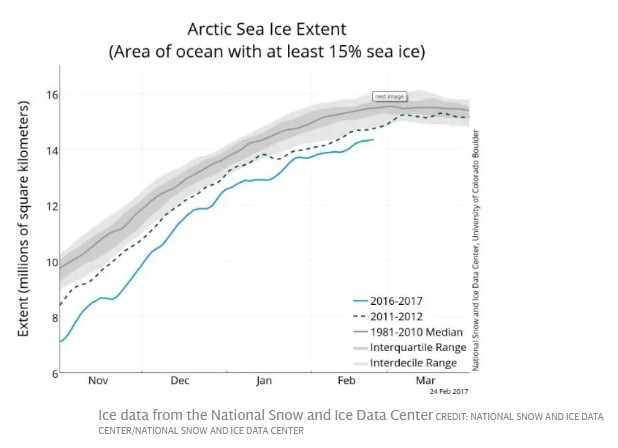
But that ever-diligent blogger Paul Homewood has drawn on official sources such as the US National Snow and Ice Data Center to uncover what is actually happening. Under “Arctic Fake News”, on NotALotOfPeopleKnowThat, he posted a graph showing that last week the extent of sea ice was much the same as it has been at this date ever since 2001. Indeed, according to the Danish Meteorological Institute, there is even more of it today than in February 2006, and it is also significantly thicker. Back in 2008 much of the ice was only a metre thick. Today that has risen to two metres, and in some places four.
Mr. Booker appears to be more than somewhat confused, since this is what the DMI Arctic sea ice extent graph he links to reveals:
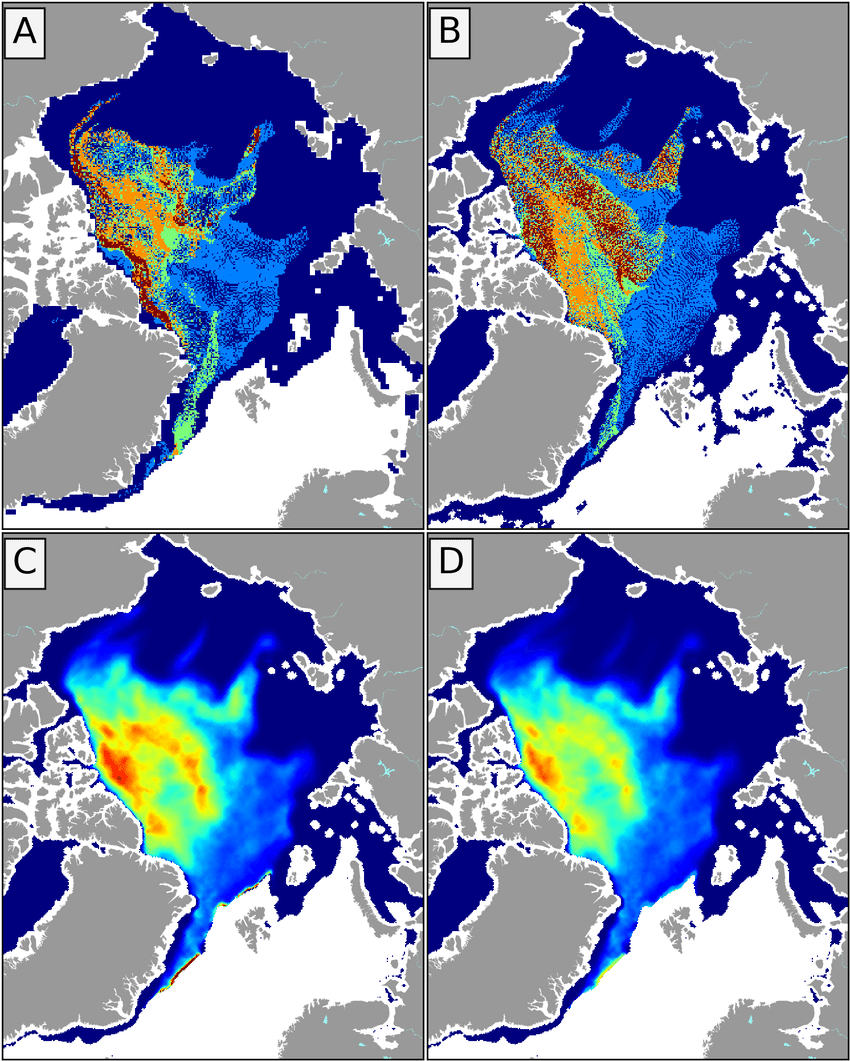
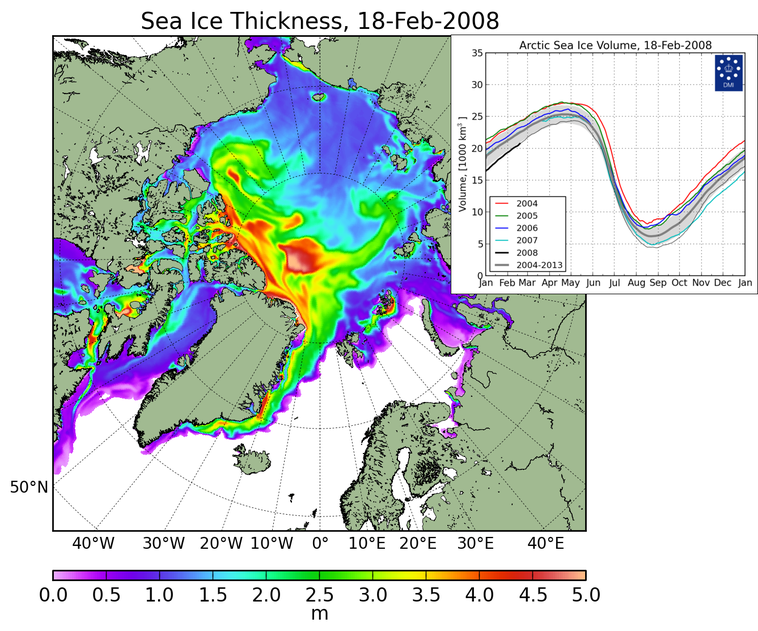
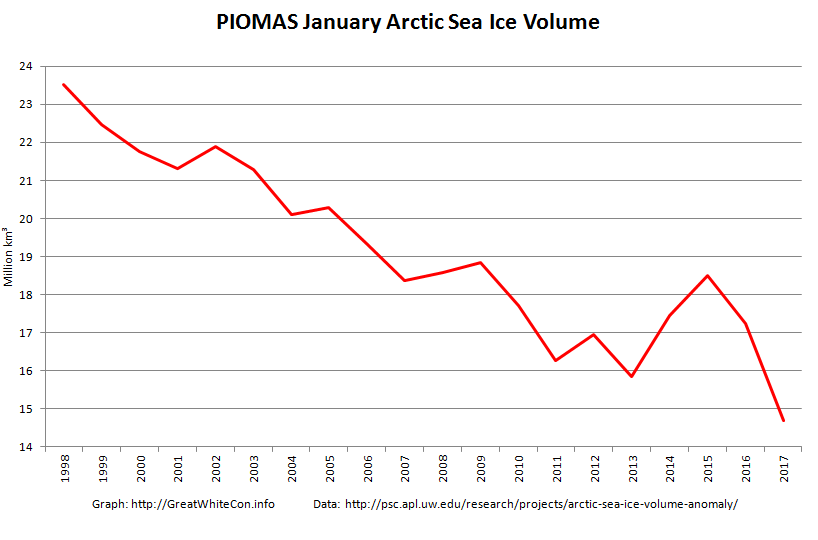
In addition the DMI thickness maps he refers to aren’t available at any of the places he mentions! Not a lot of people know that he was probably thinking of another recent article by Paul Homewood entitled “Arctic Ice Fake News“, which includes these two DMI thickness maps:
Even without considering other sources of Arctic thickness and/or volume data it is quite clear from the two volume graphs that according to the Danish Meteorological Institue Arctic sea ice volume is significantly lower this year than it was in 2008. If Arctic sea ice extent is greater this year and the volume is lower then the laws of physics (which not even the combined talents of Messrs Homewood and Booker can change) dictate that its average thickness must be LESS this year than in 2008!
Mr Booker blunders on:
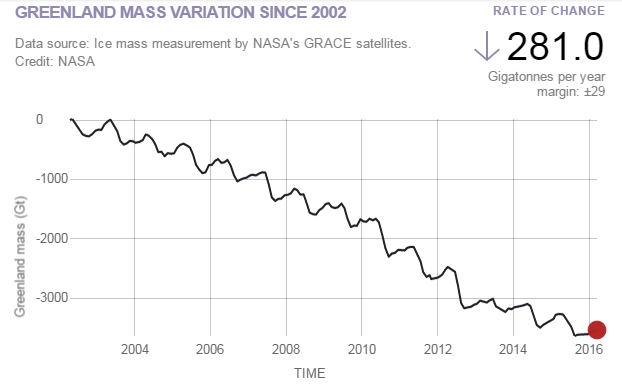
The DMI data also show that the Greenland ice sheet, which we are told is melting at horrendous speed, is actually growing this year at a record rate, to a size way above its average for the past 26 years. And the most authoritative record of Northern Hemisphere snow cover shows this year’s ranking as one of the six highest since 1967.
He seems blissfully unaware that the “DMI data” to which he refers is the output of a DMI climate model that attempts to determine the “surface mass balance” of the Greenland ice sheet. He seems to think it’s a measurement of the mass of the Greenland ice sheet, which it isn’t. However this is, courtesy of NASA:
In his bubble of astounding Arctic ignorance Mr. Booker continues:
The Deplorable Climate Science blog, run by US expert Tony Heller, gleefully reproduces a 2007 headline: “Scientists: ‘Arctic is screaming’, global warming may have passed tipping point”. As Heller comments: “The Arctic is indeed screaming at climate scientists – to shut up.”
Now as luck would have it I have been (vainly!) attempting to persuade Mr. Heller “to shut up” on the very article Mr. Booker references! Let’s take a quick look at a couple of highlights shall we?
It seems safe to assume that Mr. Booker wasn’t reading Mr Heller’s blog on or after February 22nd does it not? Otherwise he would surely have had second thoughts about writing such a ludicrous phrase as “there is even more of it today than in February 2006”?
Then of course there’s the burning question of the “Hottest Arctic on record”
You seem to have forgotten about spring Gail? Here’s April:
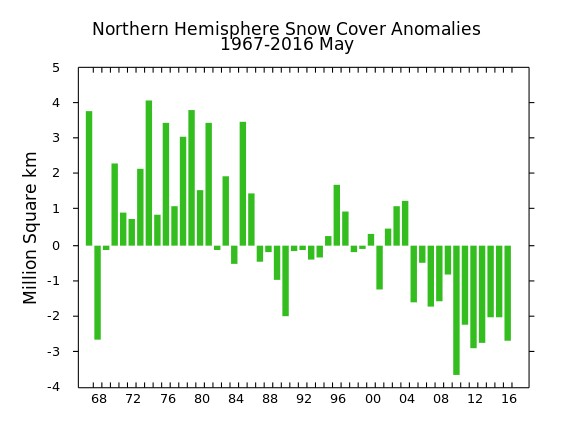
Here’s the May graph from “the most authoritative record of Northern Hemisphere snow cover” for good measure:
To summarise, Messrs Booker and Homewood could have confined their due diligence on their assorted Arctic articles to reading my comments on Mr. Heller’s blog. Having done so it would quickly have become apparent to them that every single point they made was in actual fact a “fake fact”.
The inevitable conclusion is that they have no interest whatsoever in establishing the actual facts about the Arctic. All they are interested in is propagating “fake news” about the Arctic as far and as wide as possible in pursuit of a common “agenda”. As is David Rose.
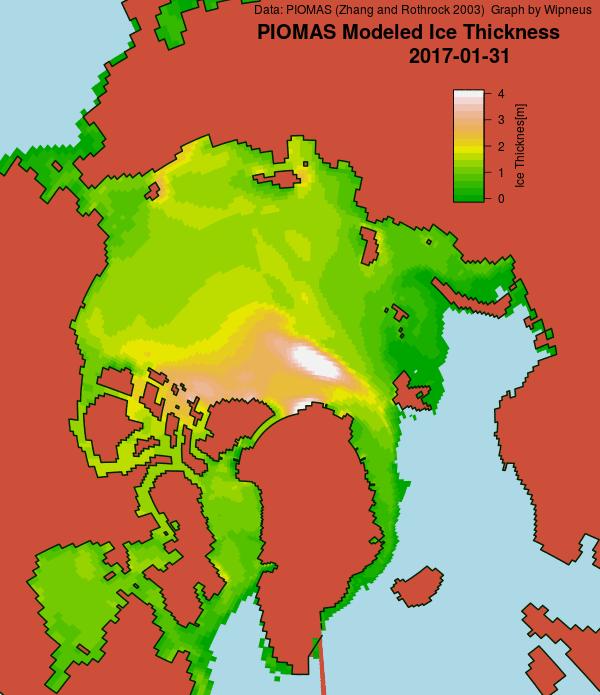
Here’s the PIOMAS gridded thickness for January 31st, courtesy of Wipneus at the Arctic Sea Ice Forum:
Somewhat anomalously it shows the thickest ice some distance away from the coast of Greenland and/or Ellesmere Island. Here too is Andy Lee Robinson‘s updated PIOMAS “Arctic death spiral”:
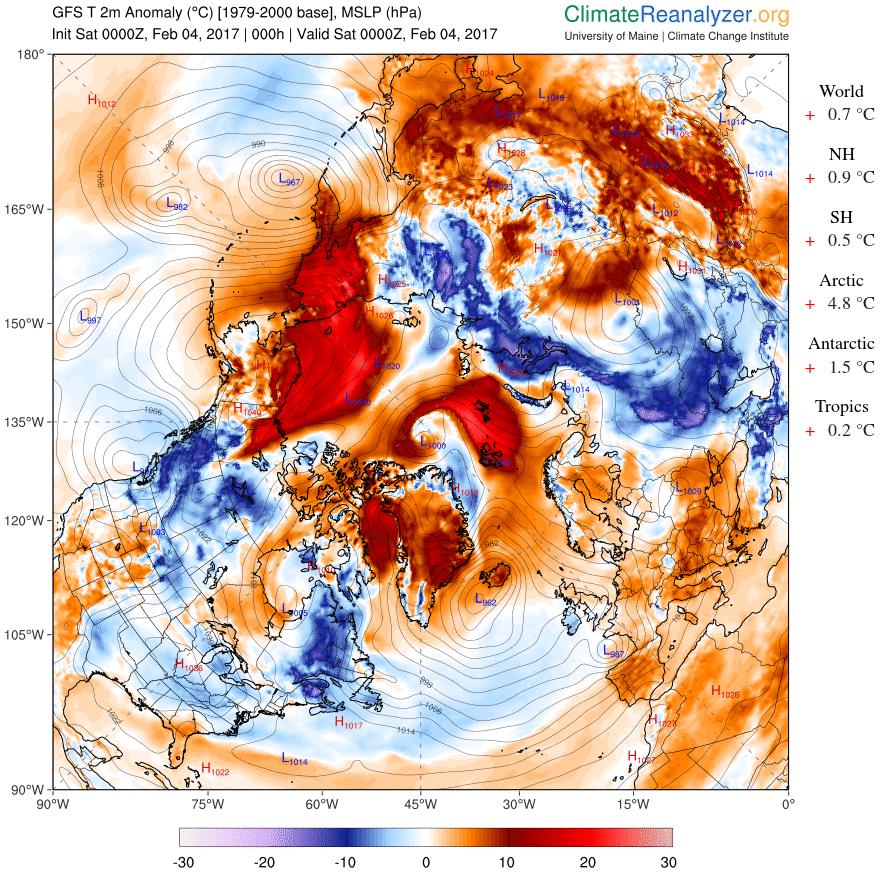
Meanwhile yet more anomalously warm air is entering the Arctic Basin from both the Pacific and Atlantic sides:
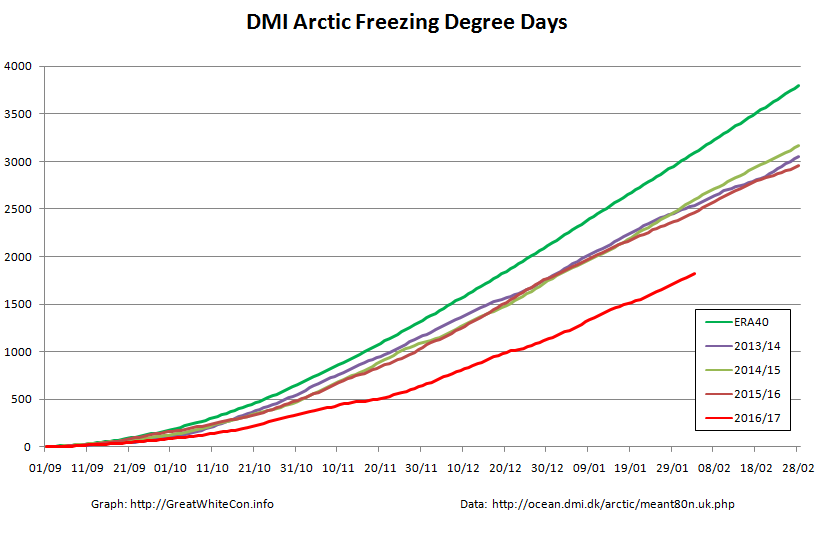
That sort of thing has happened quite a few times over the 2016/17 freezing season, as you can see from this graph of cumulative Freezing Degree Days (FDD for short):
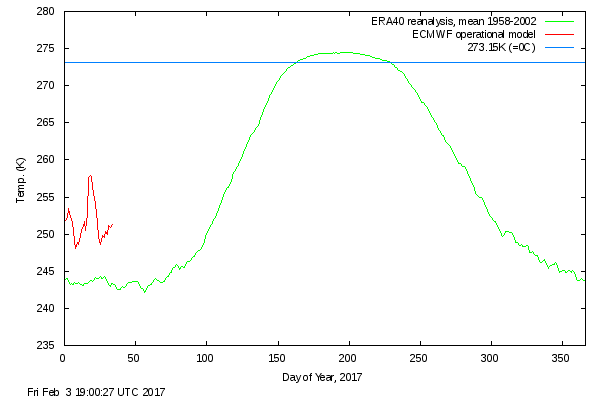
The FDD graph is based on the same data as the probably much more familiar DMI “Daily mean temperatures for the Arctic area north of the 80th northern parallel” graph:
Things are warming up in the Arctic once again.
[Edit – February 5th]
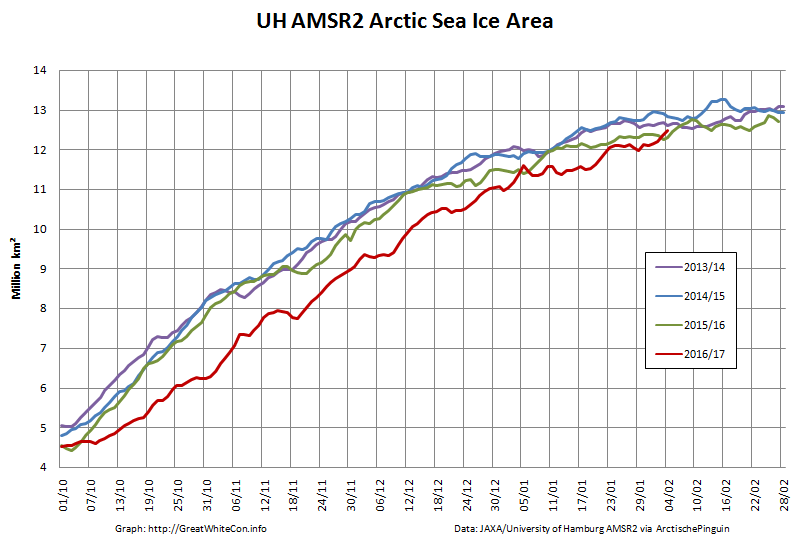
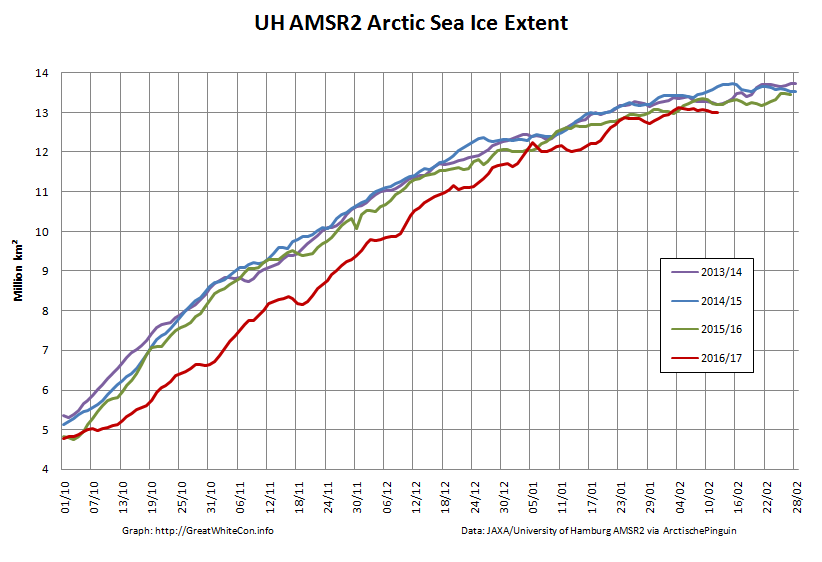
Whilst we await the arrival of the forecast anomalous warmth, how are some other metrics coming along? Here’s the high resolution AMSR2 area and extent:
It looks like they’re back in the “normal” range for now, does it not?
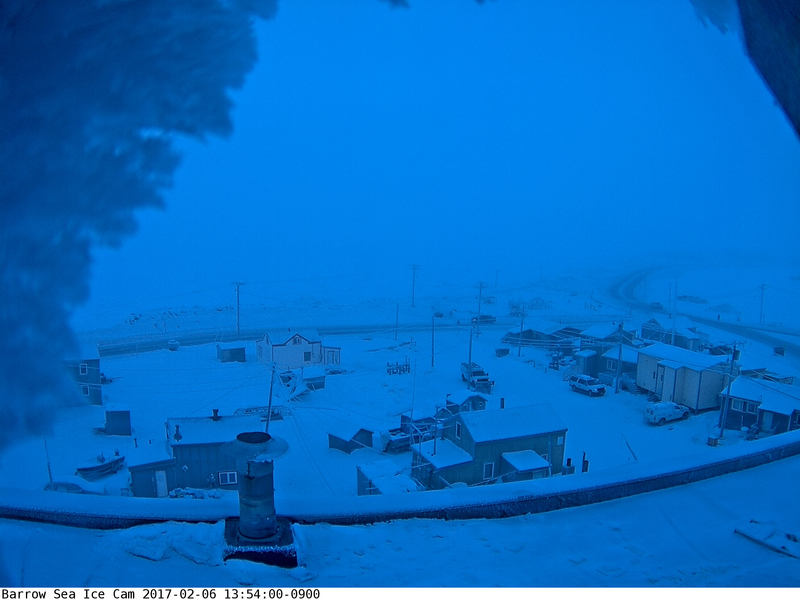
[Edit – February 6th]
Things currently still look fairly frosty over on the Pacific side of the Arctic, as you can see from the webcam at Utqiagvik (Barrow as was):
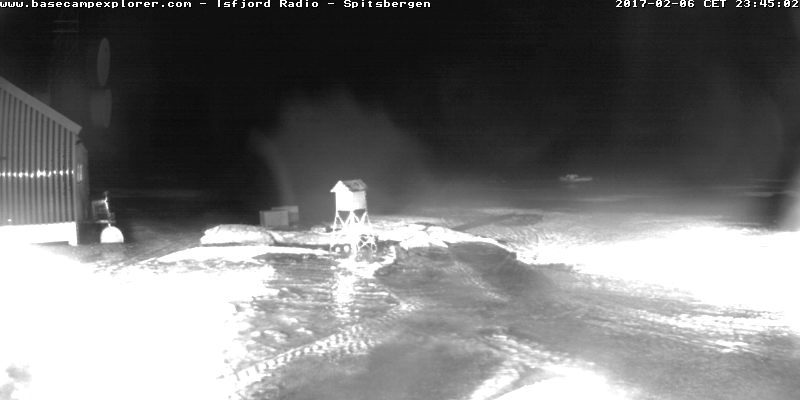
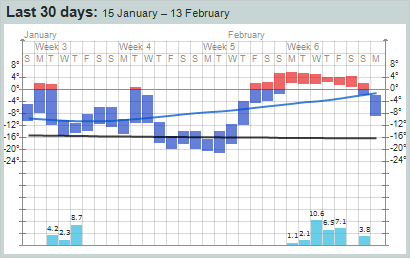
However over on the Atlantic side (and especially for “Richard”!) melting can now be observed on Svalbard:
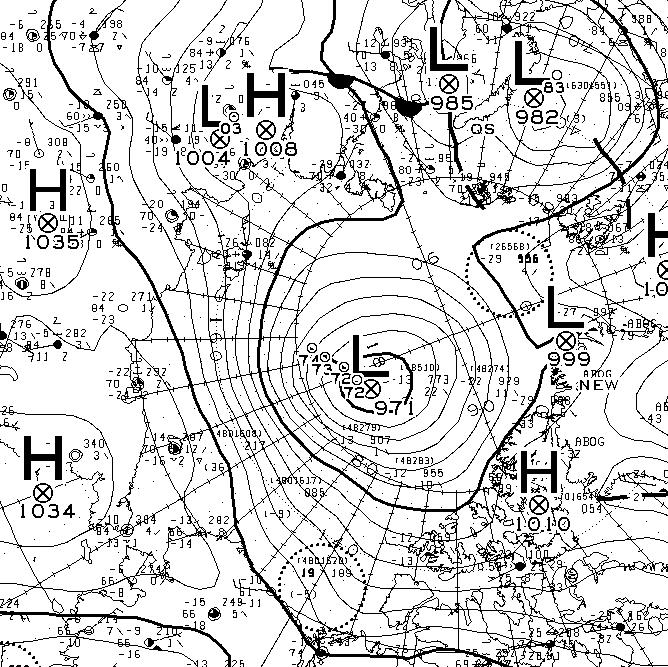
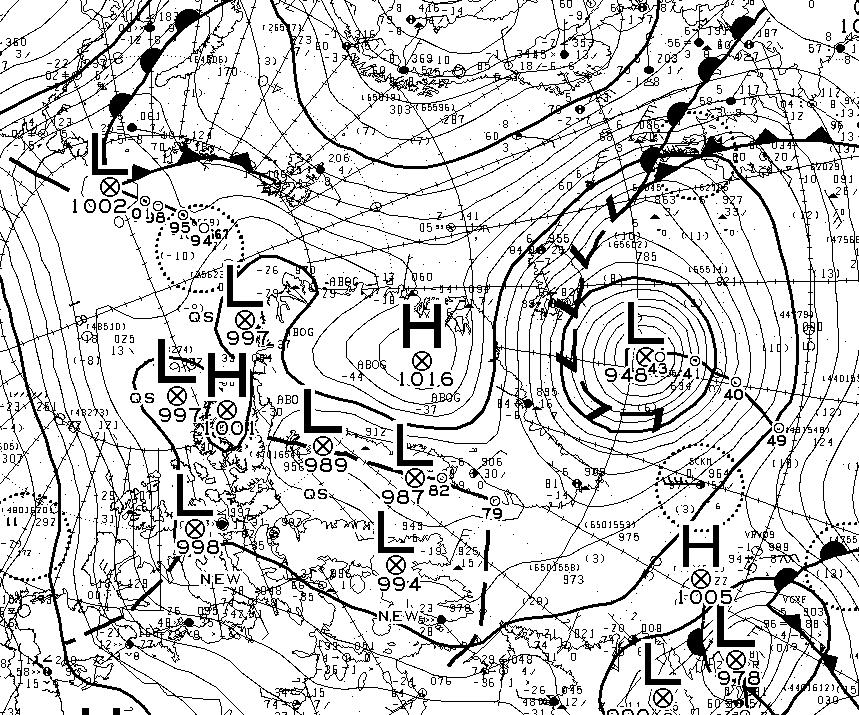
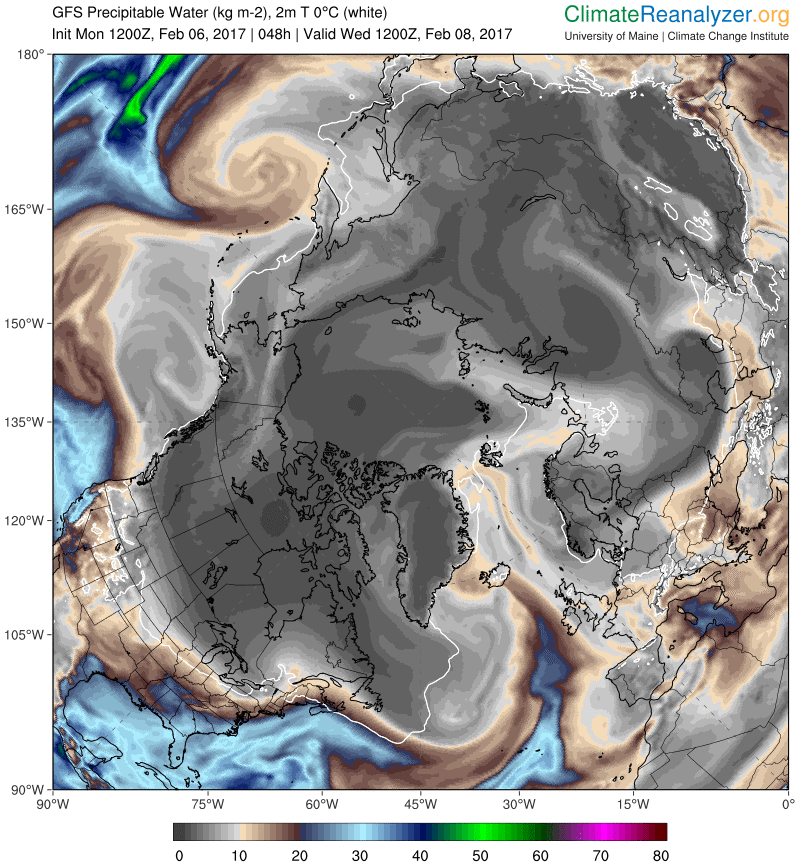
An extremely powerful cyclone off Greenland is pumping heat and moisture northwards:
Note that the cyclone’s MSLP fell to 940 hPa earlier today. This is the GFS precipitable water forecast for Wednesday lunchtime:
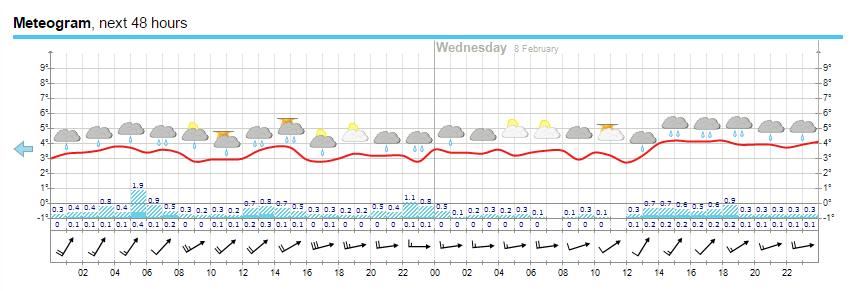
Finally, for the moment at least, here’s the current weather forecast for Longyearbyen in Svalbard:
All in all there’s plenty more heat and moisture on the way.
I recently found myself in an extended discussion on Professor Judith Curry’s “Climate Etc.” blog with Tony Brown. Tony asserts that:
In 1932, a Soviet expedition led by Professor Otto Yulievich Schmidt was the first to sail all the way from Arkhangelsk to the Bering Strait in the same summer without wintering en route. After a couple more trial runs, in 1933 and 1934, the Northern Sea Route was officially defined and open and commercial exploitation began in 1935. The next year, part of the Baltic Fleet made the passage to the Pacific where armed conflict with Japan was looming.
and asks:
Are you SERIOUSLY suggesting that the northern sea route was not operable from the 1930’s onwards?
My response?
I’m still awaiting your pick of the year in the 1930s in which the NSR was most “open”. I have a sneaking suspicion it won’t conform to, for example, the current Canadian Ice Service definition.
I won’t bore you with the long list of questions I asked Tony that he has thus far failed to answer. Instead let’s take a closer look at the history of the Northern Sea Route than Tony is willing and/or able to undertake. Perhaps the most obvious place to start is the “History of the Northern Sea Route“? However this does rather gloss over the 1930s. For our initial reference let’s see what Bill Barr has to say in his “The Drift of Lenin’s Convoy in the Laptev Sea, 1937 – 1938″, published in 1980.
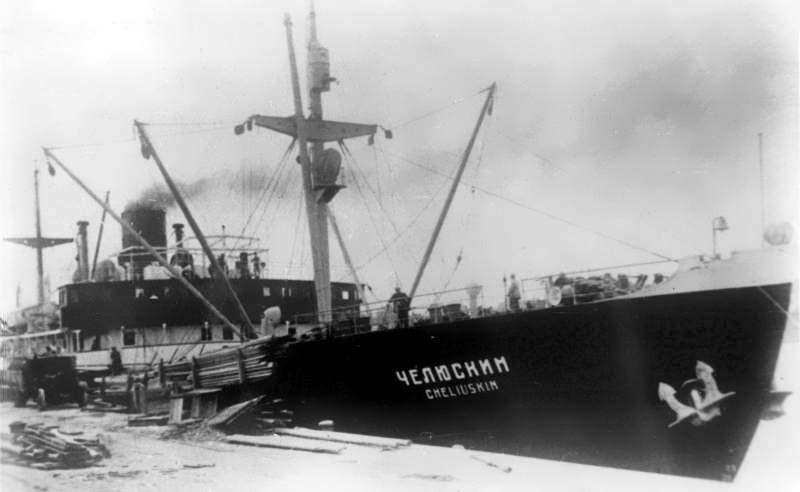
Only a few months after Sibiryukov‘s limited success in her attempt at a one-season passage of the Northern Sea Route, so eloquently embodied in her final emergence from the ice of the Chukchi Sea under improvised sails, on December 17, 1932 Sovnurkom (the Soviet of Peoples’ Commissars) took the momentous step of forming the Chief Administration of the Northern Sea Route (Gluvnoye Upruvleniye Severnogo Morskogo Puli), more commonly known as Gluvsevmorput’. Its primary task was to establish safe, reliable navigation from the White Sea to Bering Strait, but in a series of subsequent decrees over the next few years it also acquired a remarkable array of ancillary functions, and along with them, remarkably wide powers. In effect Gluvsevmorput’ was given almost complete control of the entire vast area of Siberia north of 62″ (the latitude of Yakutsk) not only in terms of transport and economic development, but also education, health services and cultural development. Even with these extensive powers, however, the new organization’s first attempt at demonstrating that it was capable of tackling its primary task was a disastrous failure. In her attempt at making a one-season passage of the Northern Sea Route in the summer of 1933 the steamer Chelyuskin became beset in the ice of the Chukchi Sea, and after drifting helplessly for several months, was ultimately crushed and sank on February 13, 1934. However, the new organization’s reputation was definitely redeemed the following year when the icebreaker Fyodor Litke reached Murmansk on September 20, 1934, having succeeded where Chelyuskin had so utterly failed.
To summarise, one of Tony’s “trial runs in 1933” was “a disastrous failure”!
On 1 October 1932 the icebreaking steamer Sibiryukov emerged from the ice in Bering Strait having completed the first one-season passage of the Northern Sea Route from Arkhangelsk. It was not an unqualified success, however; Sibiryakov had lost her propeller two weeks previously and had managed to reach the edge of the ice only under improvised sails and with a large measure of luck.
Moving on to another 1933 “trial run” Bill informs us that:
In 1933 the newly-formed Gluvsevmorput’ dispatched the first convoy of freighters via the Northern Sea Route to the mouth of the Lena to deliver cargoes bound for the Yakut ASSR. It consisted of three freighters and was escorted by the icebreaker Krasin. Despite heavy ice conditions in the Kara Sea two of the ships reached Tiksi, their destination, and unloaded their cargoes. The third ship, bound for Bukhta Nordvik with an oil exploration expedition, ran aground near its destination and turned back. Severe ice conditions in Proliv Vil’kitskogo forced all three ships to winter at the Ostrova Samuila. A shore station was built and a full scientific programme maintained all winter. Urvantsev, the chief scientist, took the opportunity to make a winter reconnaissance survey of the northern portion of Poluostrov Taymyr using half-tracks. The convoy was freed from the ice by the icebreaker Fyodor Litke in the summer of 1934 and having completed their tasks all three ships ultimately returned safely to Arkhangel’sk.
Not exactly an unqualified success either then, and certainly not a single season transit of the full Northern Sea Route! However despite all her assorted trials and tribulations the icebreaker Fyodor Litke did manage to complete a single season transit from Vladivostok to Murmansk, and according to Wikipedia “became a Soviet propaganda icon”.
Returning to Barr 1980, we discover that:
In the summer of 1935 Fyodor Litke escorted the first two laden freighters, Vantsetti and Iskra, through the Sea Route from west to east; sailing from Leningrad on July 8, they reached Vladivostok on October 8. Meanwhile two other steamers, Anadyr’ and Stalingrad, made the through-passage in the opposite direction, sailing from Vladivostok on July 23 and 25 and reaching Leningrad on October 16.
The following season (1936) saw a spectacular increase in activity along the Northern Sea Route; a total of 160 ships travelled parts of the route (the bulk of them from the west to the mouth of the Yenisey and back), while 16 vessels made the through-passage, 14 from west to east, and 2 from east to west, the latter being Vantsetti and Iskra homeward bound to Leningrad. The ships heading east included the first Soviet warships to utilize the Northern Sea Route, the destroyers Voykov and Stalin, escorted once again by Fyodor Litke
Hence 1935 and 1936 were far more successful years than the previous two, but then we come to 1937. Quoting Barr 1980 once again:
The plans for the 1937 season were equally ambitious, but by then the run of luck had ended. Due to a combination of abnormally severe ice conditions and some very unfortunate decisions as to routing of convoys and deployment of icebreakers towards the end of the season, 25 ships were obliged to winter on an emergency basis at various points in the Soviet Arctic. Perhaps the most critical aspect, however, was that of Gluvsevmorput’s fleet of icebreakers; only one, the veteran Yermak was not forced to winter in the Arctic.
One of the other questions I asked Tony Brown over at Prof. Judy’s was:
It would be helpful if you selected an ice chart from the 1930s to illustrate your point.
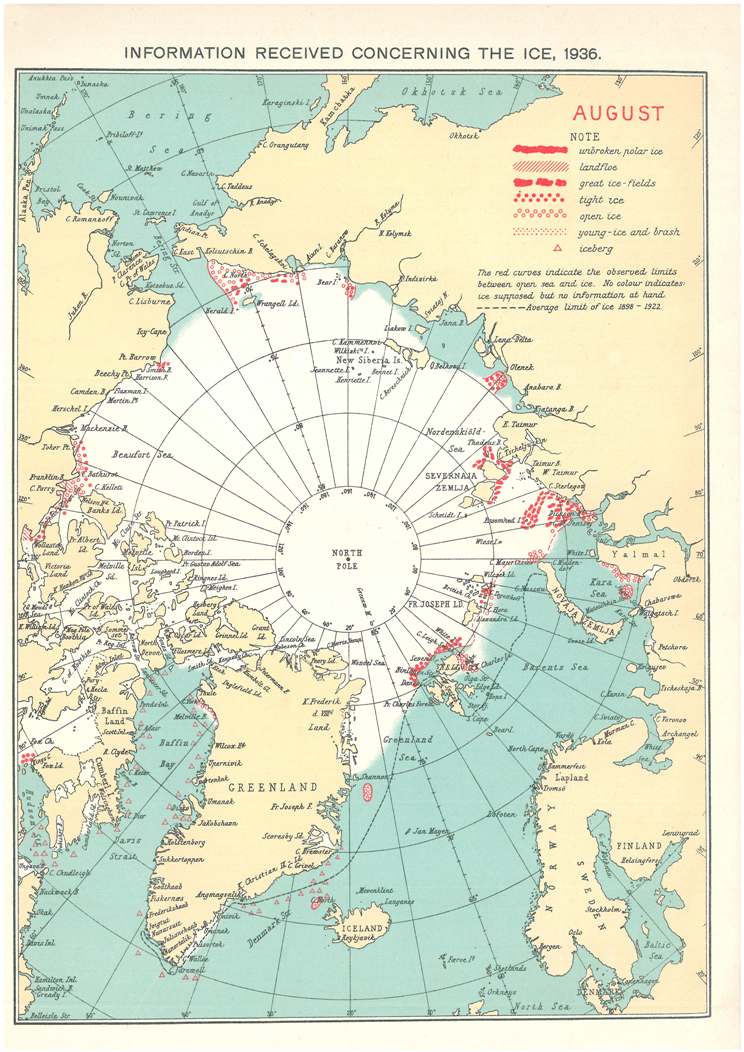
Tony still hasn’t got around to doing that, so why don’t we take a look at the August 1936 chart from the archives of the Danish Meteorological Institute:
It certainly doesn’t look to me as though the entire Northern Sea Route was covered by no more than 3/10 concentration sea ice in August 1936. For comparison purposes here’s the Russian Arctic and Antarctic Research Institute ice chart for the end of August 2016:
For an eyewitness account of conditions along the Northern Sea Route in 2016 see our series of articles on the voyage of the yacht Northabout
The Polar Ocean Challenge team issued a press release last night. This is what it said:
The Polar Ocean Challenge successfully completed their quest to sail the North East Passage and North West Passage in one season. The North West Passage was completed in an astonishing 14 days due to the fact that it was almost totally ice free. They encountered ice only twice in their 1800 mile NW Passage part of the voyage. This highlights an extraordinary loss of sea ice in the Arctic in the 30 years that David Hempleman-Adams has been coming to the area. He said, ‘whilst we are all delighted to have succeeded, it is extremely worrying to see this lack of ice so starkly‘ The objective of the expedition was to raise awareness of the change in the fragile climate in the Arctic. They left Lancaster Sound at the end of the NW Passage at 19.18 UTC on 12th September and are headed for Greenland.
This seems likely to cause much gnashing of teeth in certain quarters, where it is claimed that:
The S/V NORTHABOUT has failed to cross the Pacific Ocean Arctic Circle in the Bering Strait as the official starting line to validate their Northwest Passage attempt. You cannot say you climbed Mount Everest by just reaching high camp – you must summit. You don’t ride a bicycle in the Tour de France without starting and finishing over the course in the designated places. Likewise, you must cross BOTH the Pacific Ocean Arctic Circle in the Bering Strait and the Atlantic Ocean Arctic Circle in Davis Strait to validate a Northwest Passage.
In Northabout’s defence I pointed out that:
Perhaps the Polar Ocean Challenge team have other priorities than gaining an entry on that particular list?
If you’re planning a single season circumnavigation a diversion via Provideniya or Nome doesn’t make a whole lot of sense, rules or no rules.
but nobody else seemed to take that view!
Today they also pointed out on their Twitter feed that they are a:
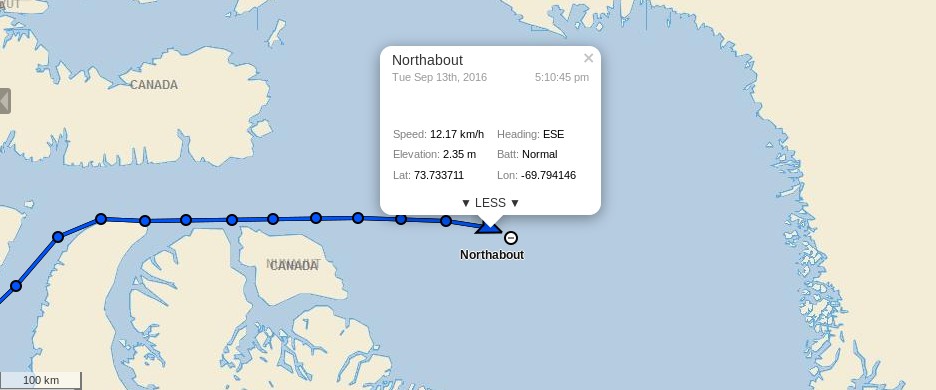
Pressing on the crew of Northabout are now approaching halfway across Baffin Bay:
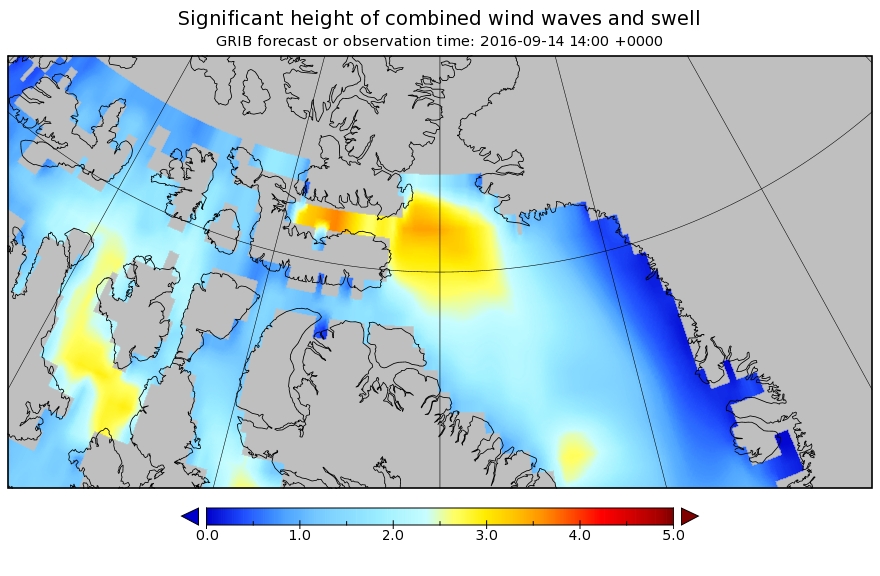
Her crew are trying to reach Upernavik in Greenland before the impending storm gets too bad. Here’s our own WaveWatch III based forecast for tomorrow afternoon:
Today Tonight and Wednesday Wind light increasing to south 15 knots early this evening and to south 20 late this evening. Wind backing to southeast 25 overnight then diminishing to light Wednesday afternoon.
Waves
Today Tonight and Wednesday Seas 1 metre building to 2 after midnight.
Thursday
Wind light increasing to northwest 15 knots in the afternoon then veering to north 20 late in the day.
Friday
Wind north 30 knots diminishing to north 20.
I seem to recall that 30 knot winds are best avoided! After Upernavik Northabout will head for Nuuk further south in Greenland and then across the North Atlantic back to Bristol, where she started her voyage back in June. It is certainly not beyond the bounds of possibility that there will be winds of 30 knots and more to contend with on that final leg of the Polar Ocean Challenge!
[Edit – September 14th]
Northabout has obviously not managed to escape the storm entirely. Ben Edwards reports today:
I hate this part of a journey. Yesterday as I came off watch we were scheduled to arrive about midnight tonight. I hate that anyway because you get the so close yet so far feeling. But typically as I came off watch the wind picked up, moved to an unhelpful angle and created the worst sea state we’ve had since the Chuckchi Sea. We’re still supposed to arrive about two in the morning but it will make the next twenty two hours really horrible. Not that our arrival time mattes too much, we can’t go in till it’s light anyway.
Gale from south and southeast, 13 to 18 m/s. From the western part decreasing and becoming south and southwest, 5 to 10 m/s, in northern part locally 13 m/s. Thursday gradually in eastern part south and southeast, 8 to 13 m/s, but in western part cyclonic variable, up to 10 m/s. Especially in northern part locally rain, sleet or snow with moderate to poor visibility, otherwise good visibility.
Significant wave height: 3,5 m. Swells: 3 m.
Many icebergs and growlers in the eastern part along the coast, otherwise few icebergs and growlers.
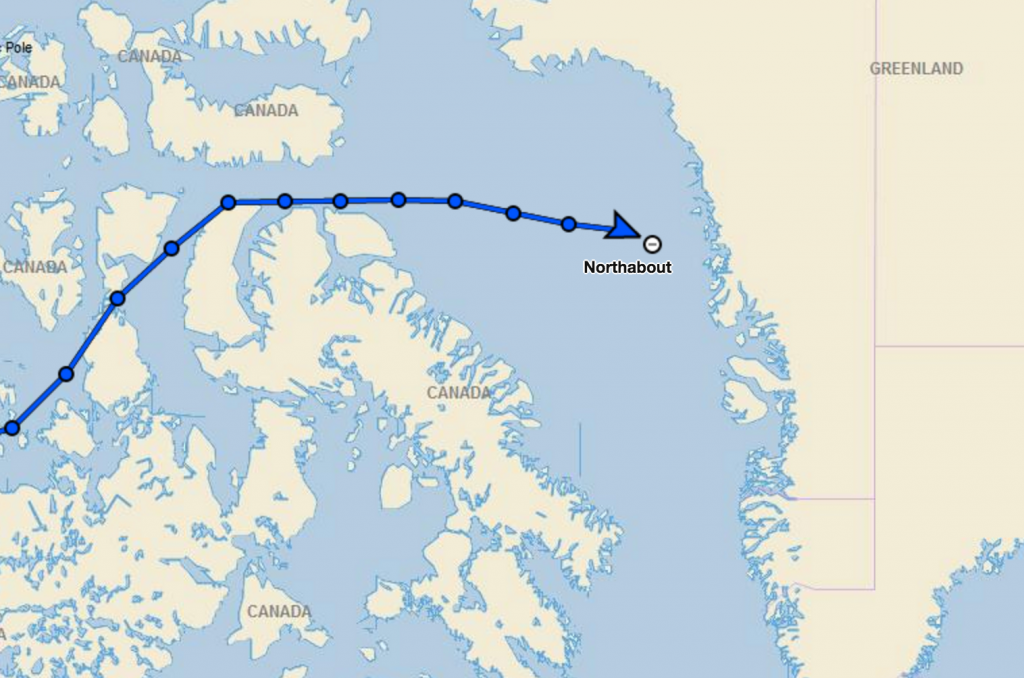
Upernavik is slightly south of there, but nonetheless Ben will have a few more uncomfortable hours, and Northabout may yet meet some more ice before her crew set foot on dry land once again:
[Edit – September 15th]
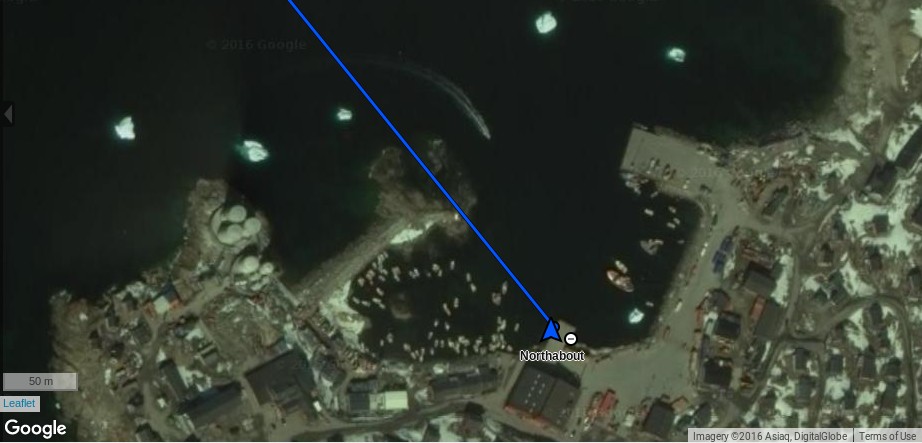
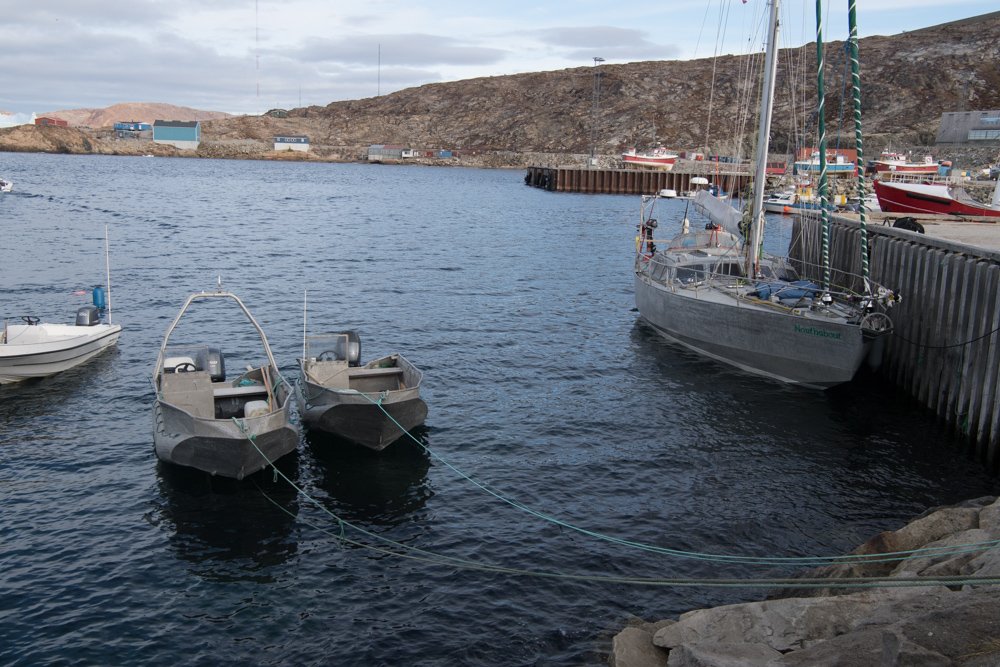
Northabout has just arrived in Upernavik:
[Edit – September 16th]
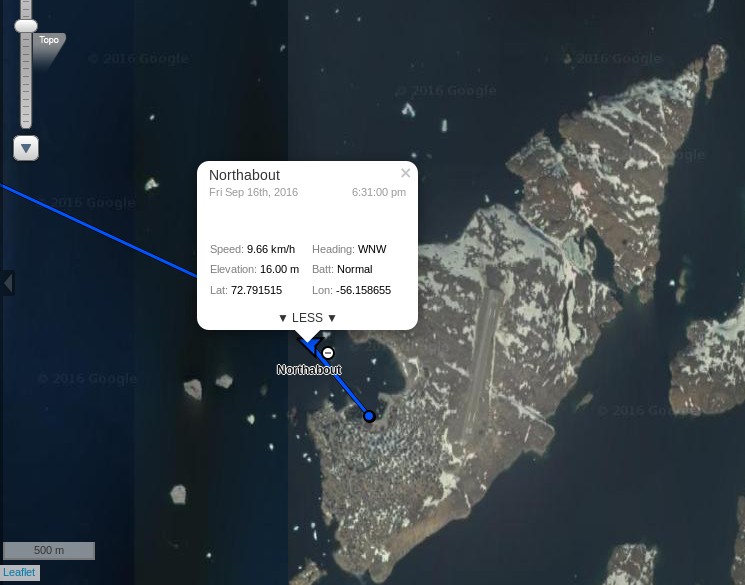
It looks as though Northabout has just left Upernavik, and is now en route to Nuuk:
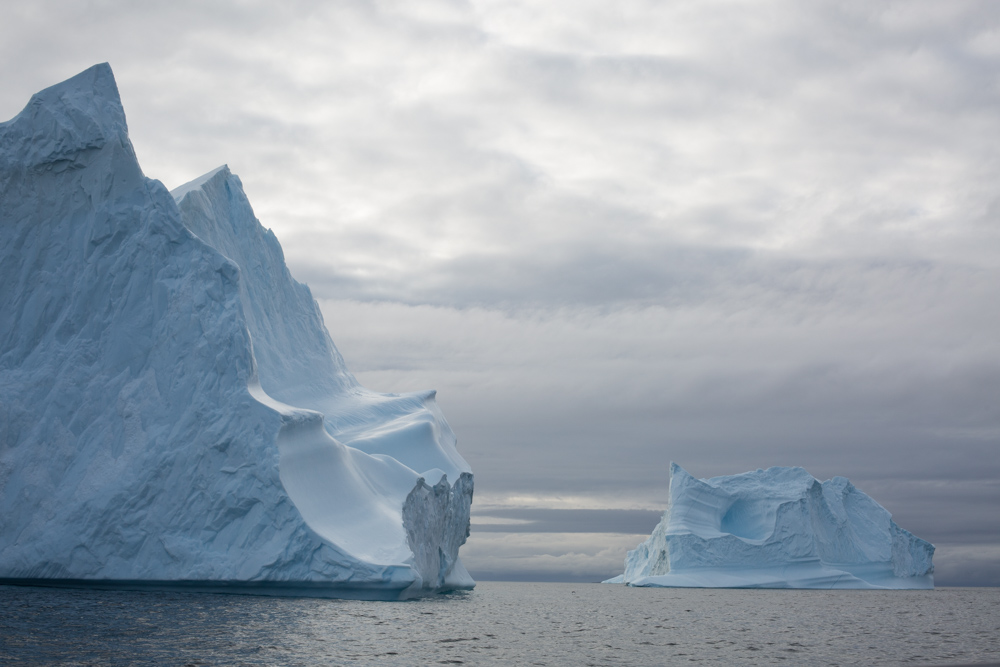
As we expected, it was a long night last night as the big swell and Northernly winds continued to sweep us along from Upernavik, big surf waves behind us breaking under us, Northabout became a little Hawwai five o. We made our way along the coastline through amazing beautiful icebergs created by glaciers at Ilulissat.
The icebergs were between the size of telly to the size of a house to the size of a grand hotel. They were breaking up, and once or twice right in front of us creating lots a small bergs and ice chunks that don’t float so high above the water and so are difficult to spot especially with a large 10 foot swell, they disappear and reappear in the water around us.
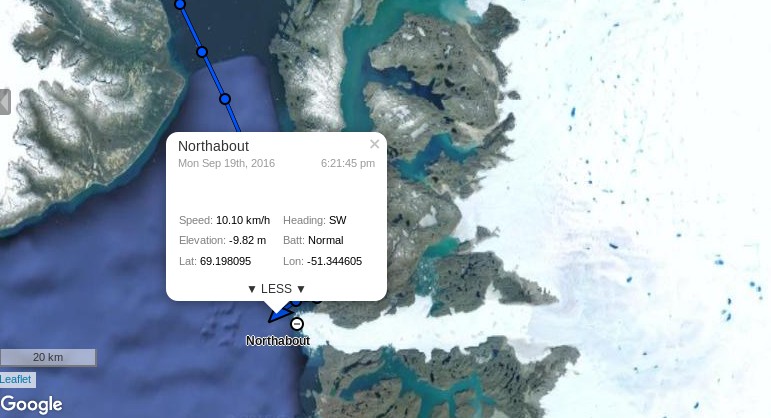
[Edit – September 19th]
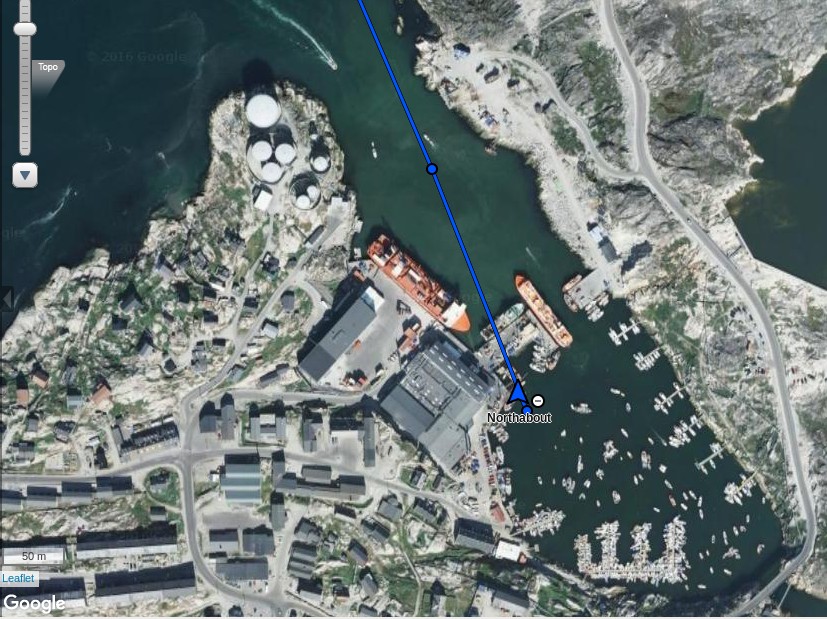
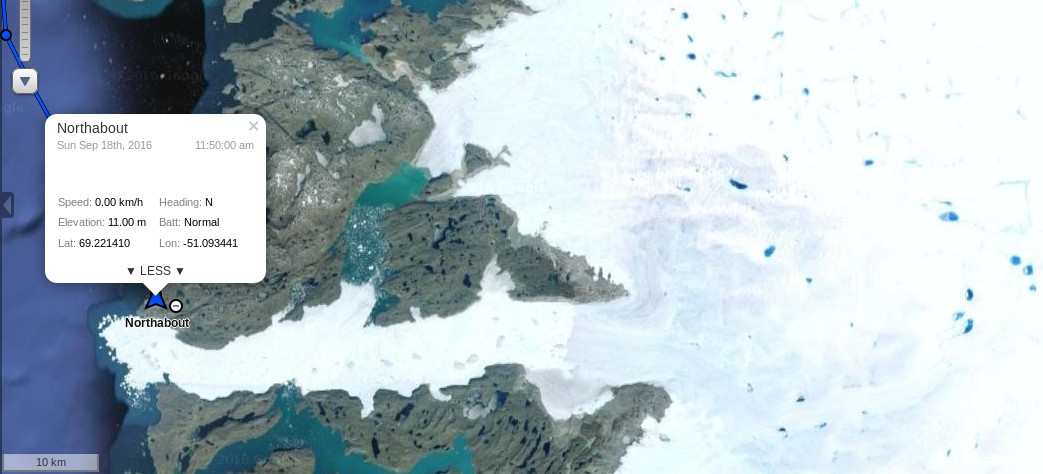
Northabout has just left Ilulissat, en route for Nuuk:
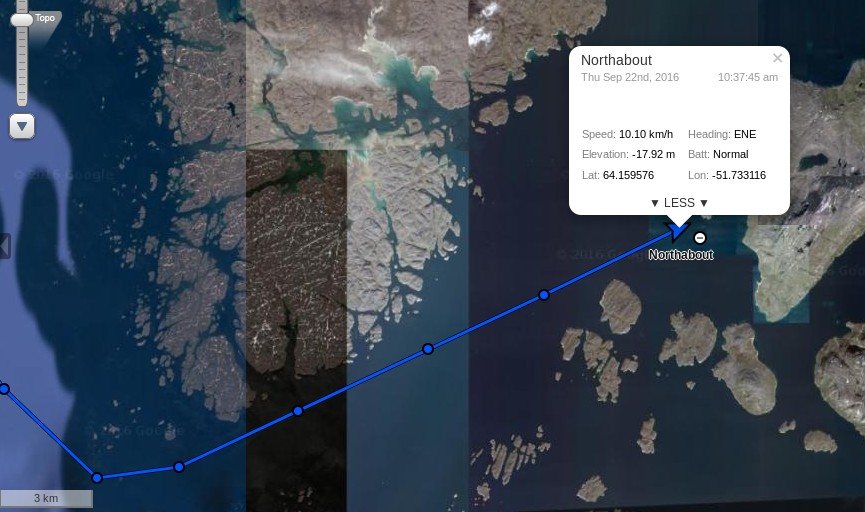
[Edit – September 22nd]
Northabout has crossed the Arctic Circle and has just reached Nuuk, the capital of Greenland:
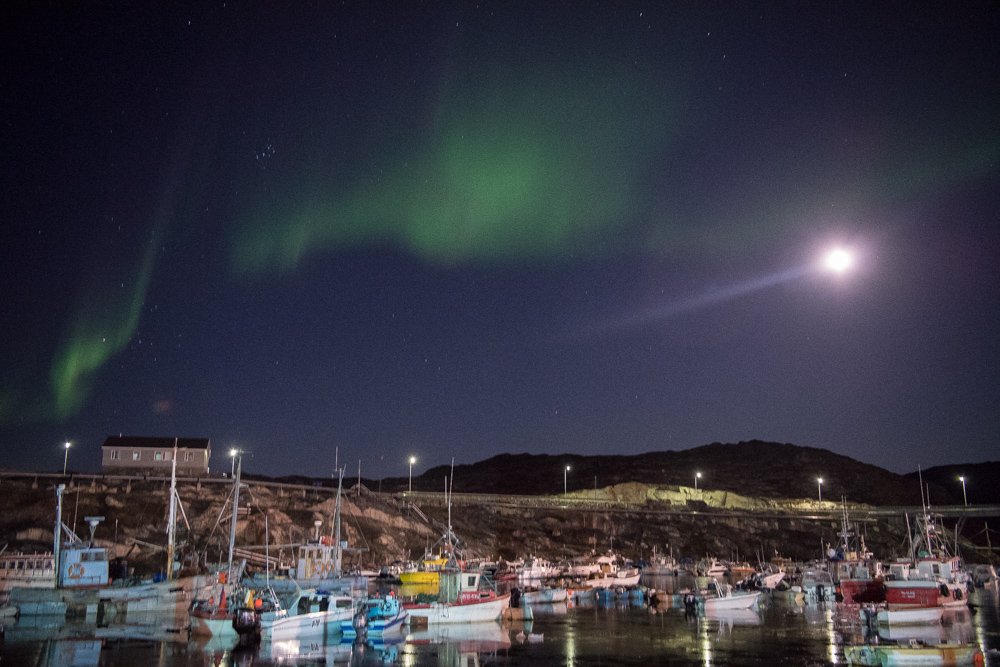
En route from Ilulissat her crew have seen some amazing sights:
This website uses cookies to improve your experience. We'll assume you're ok with this, but you can opt-out if you wish. Cookie settingsACCEPT
Privacy & Cookies Policy
Privacy Overview
This website uses cookies to improve your experience while you navigate through the website. Out of these, the cookies that are categorized as necessary are stored on your browser as they are essential for the working of basic functionalities of the website. We also use third-party cookies that help us analyze and understand how you use this website. These cookies will be stored in your browser only with your consent. You also have the option to opt-out of these cookies. But opting out of some of these cookies may affect your browsing experience.
Necessary cookies are absolutely essential for the website to function properly. This category only includes cookies that ensures basic functionalities and security features of the website. These cookies do not store any personal information.
Any cookies that may not be particularly necessary for the website to function and is used specifically to collect user personal data via analytics, ads, other embedded contents are termed as non-necessary cookies. It is mandatory to procure user consent prior to running these cookies on your website.