My Arctic alter ego was checking out the new “X” rated edition of Twitter when “she” couldn’t help but notice that Elon Musk had allowed Tony Heller back into the climate “debate” thereon, albeit with a new handle.
“Snow White” also noticed that for some strange reason Tony was telling lots of porky pies about Arctic sea ice again! Hence:
Here's @TonyClimate demonstrating yet again that either:
1) He has no understanding of all things #Arctic, or
2) He understands well enough, but he pulls the wool over the eyes of his faithful flock of followers.https://t.co/yYNhpSncLE
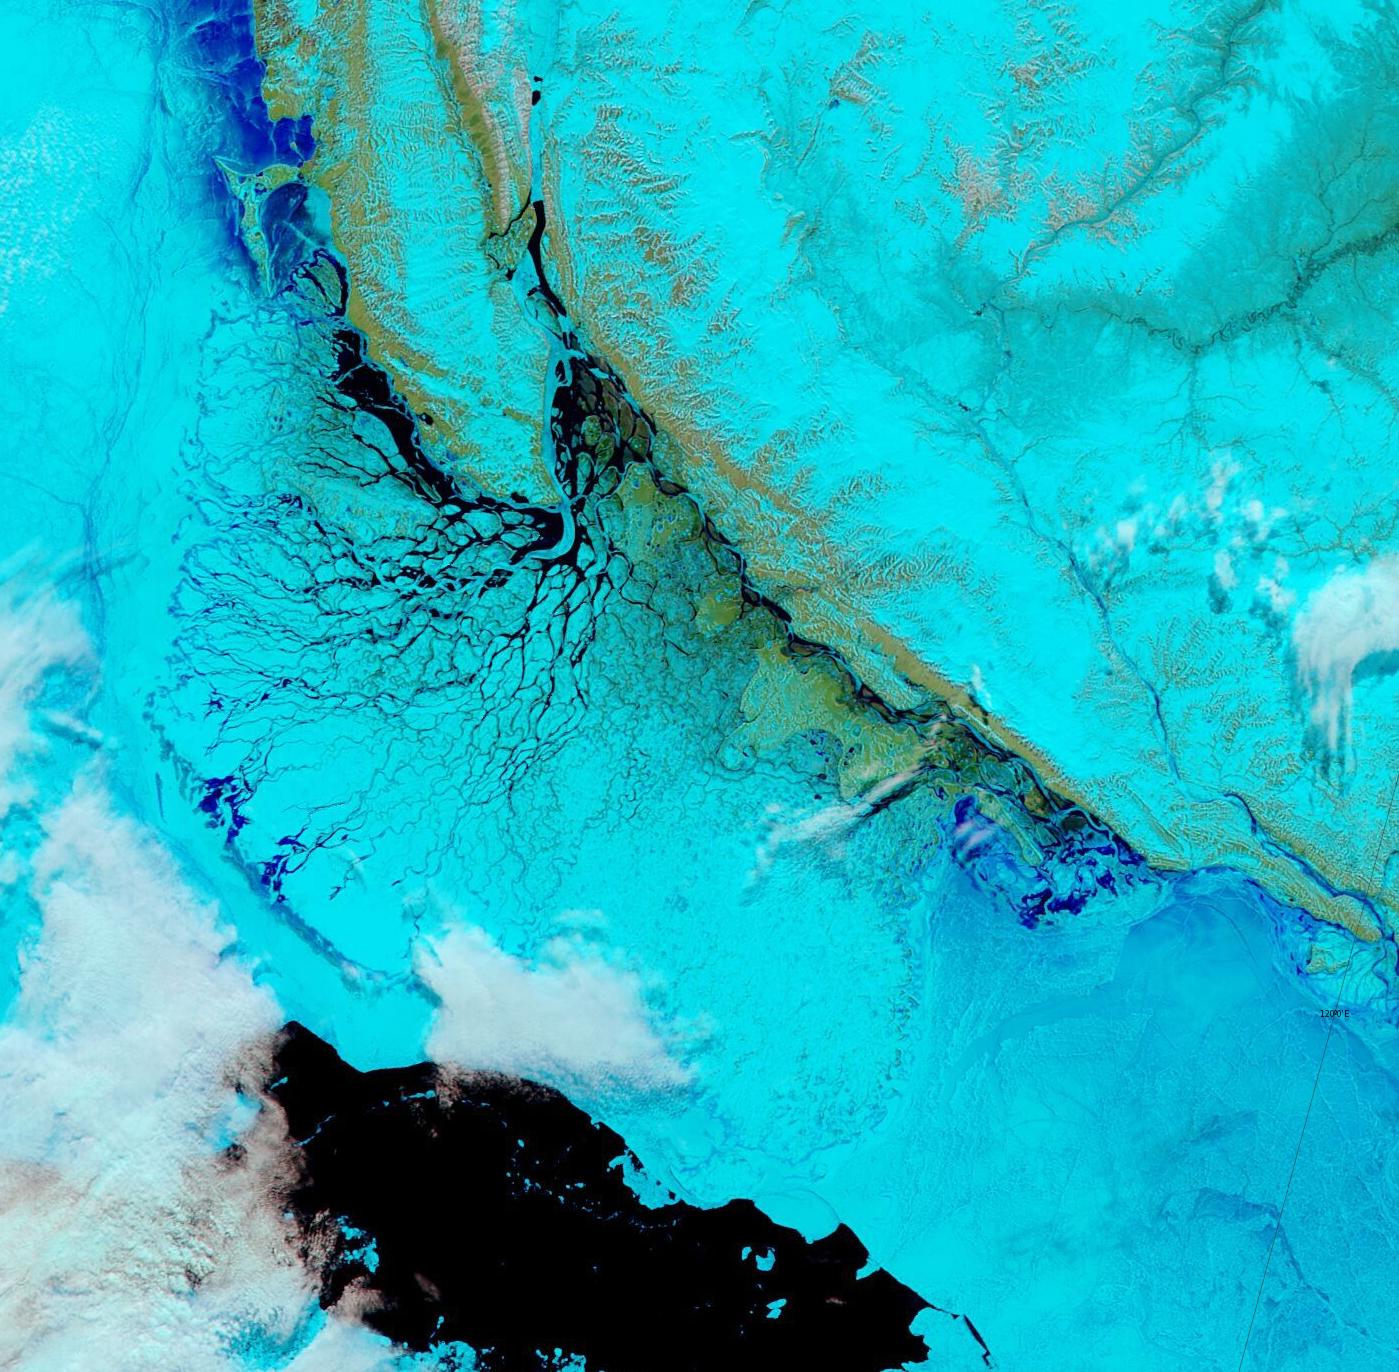
By way of a change, which is allegedly as good as a rest, let’s start the new month with a very pretty and almost cloud free “pseudo-colour” image of the Lena Delta and adjacent areas of the Laptev Sea:
“False colour” image of the Lena Delta on June 1st from the MODIS instrument on the Aqua satellite
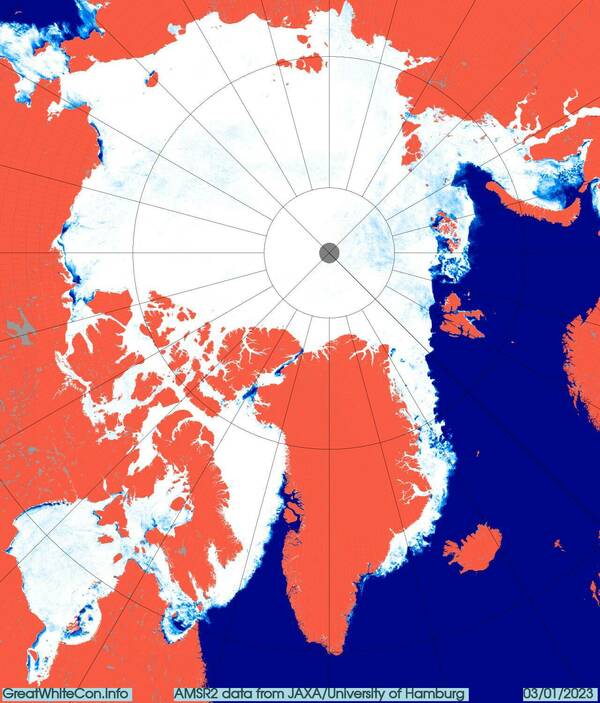
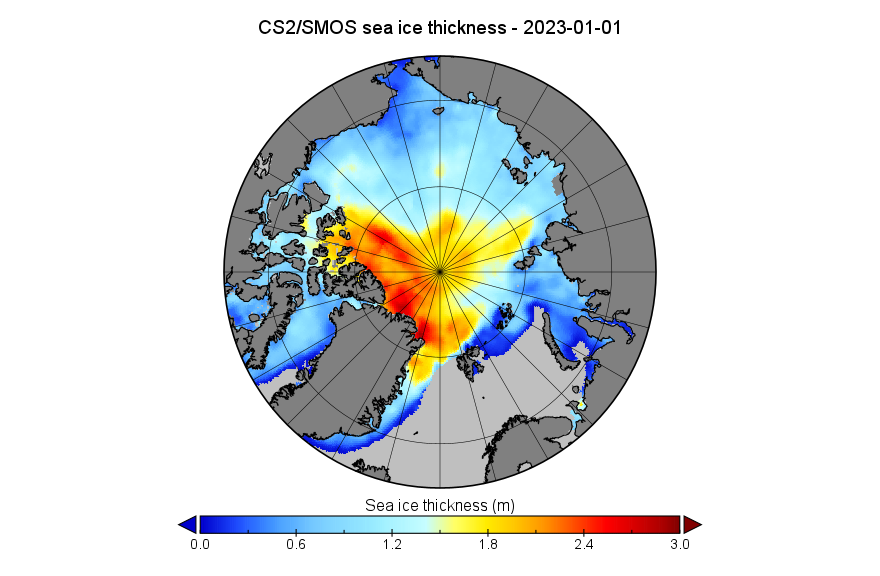
At the beginning of the New Year all the central regions of the Arctic are now refrozen apart from a small area of the Kara Sea:
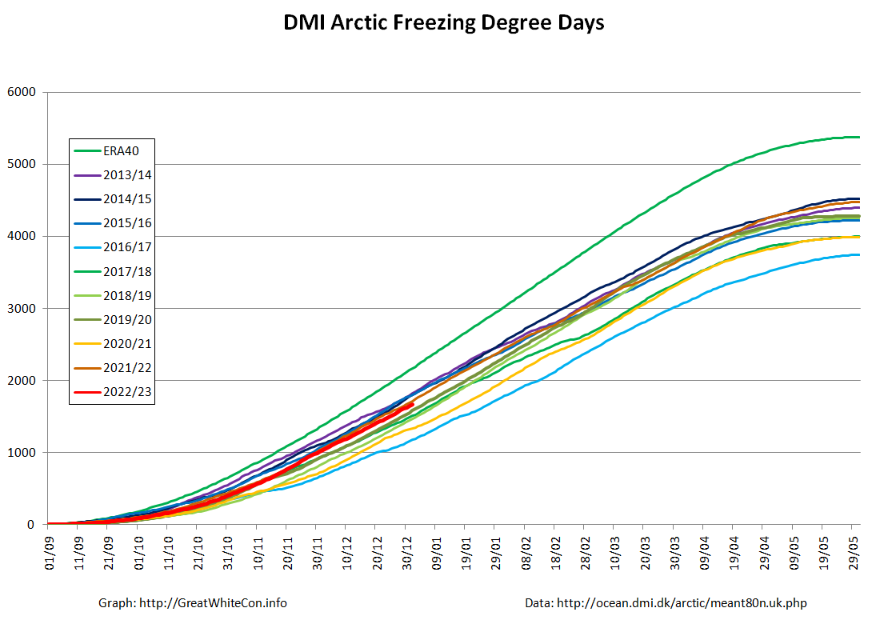
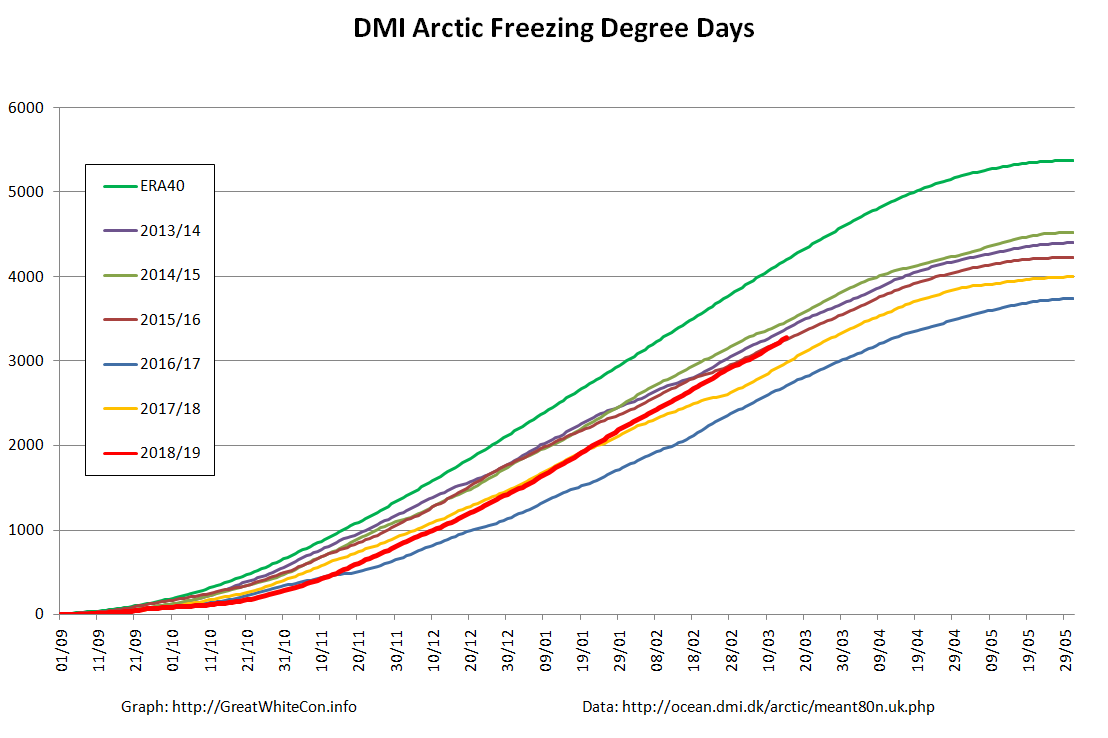
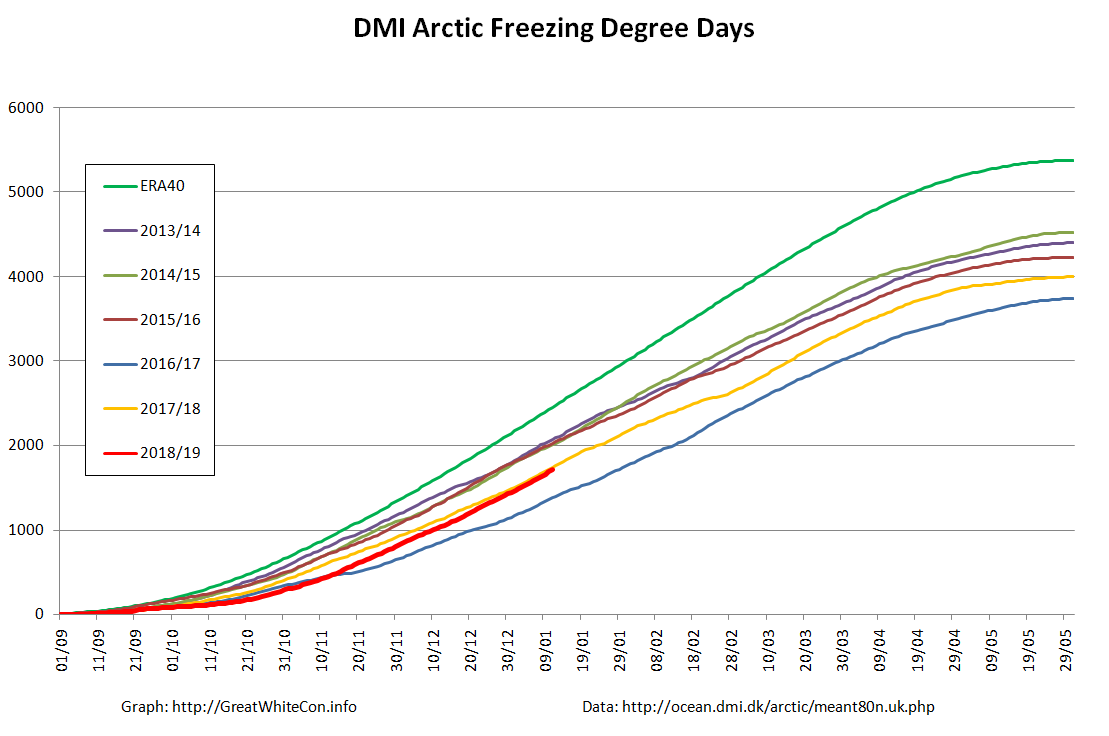
Most Arctic sea ice metrics are near the middle of their respective ranges over the last decade. By way of example, here is a graph of Arctic Freezing Degree Days based on the Danish Meteorological Institute’s temperature data for the area north of 80 degrees latitude:
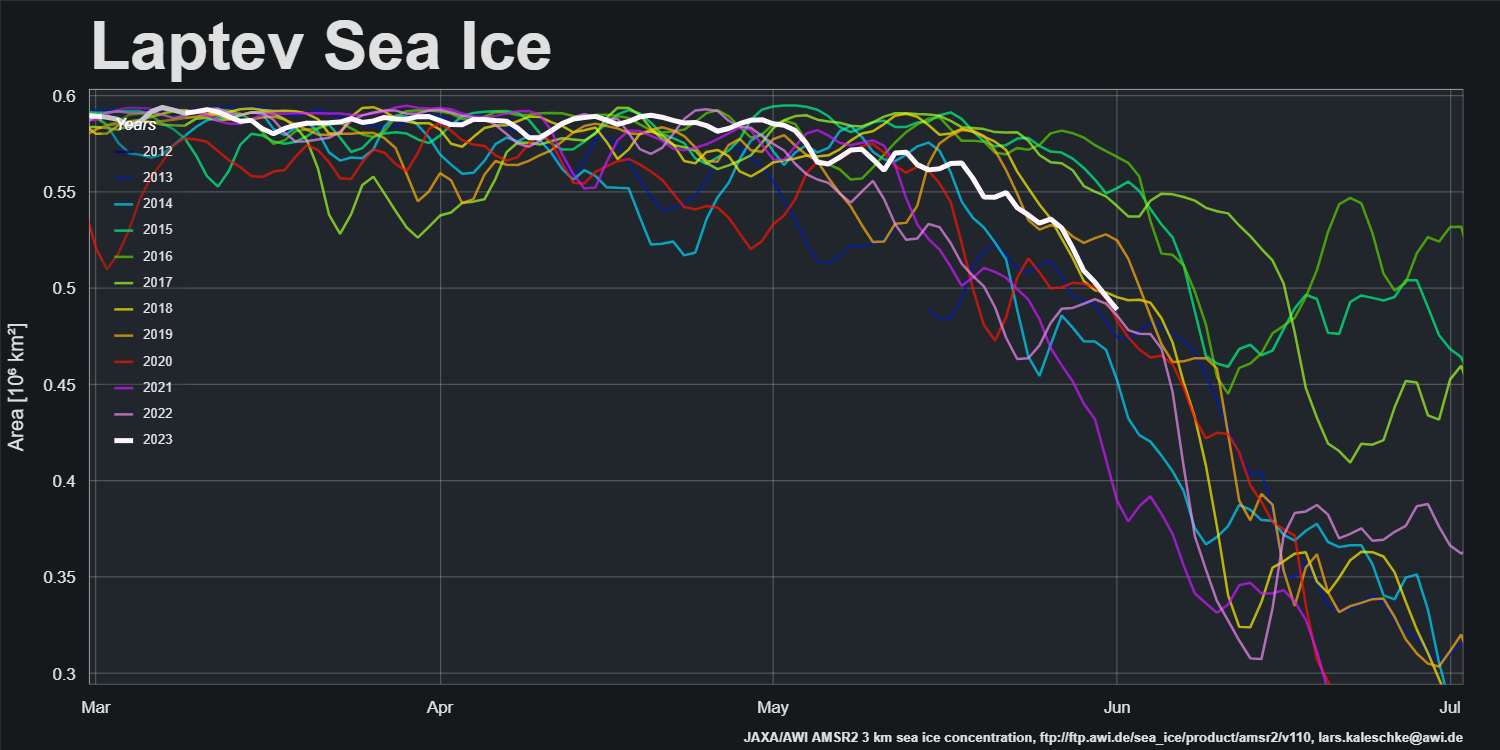
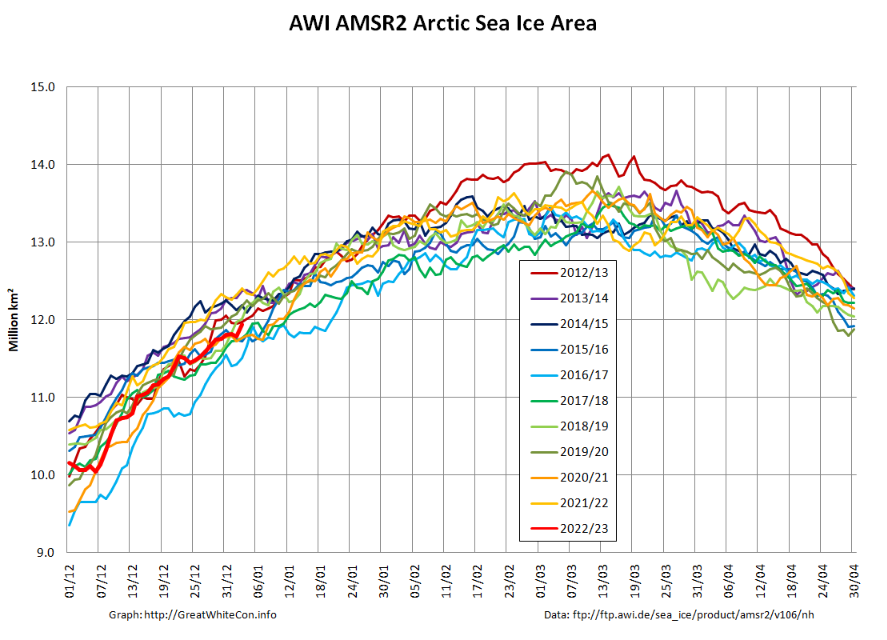
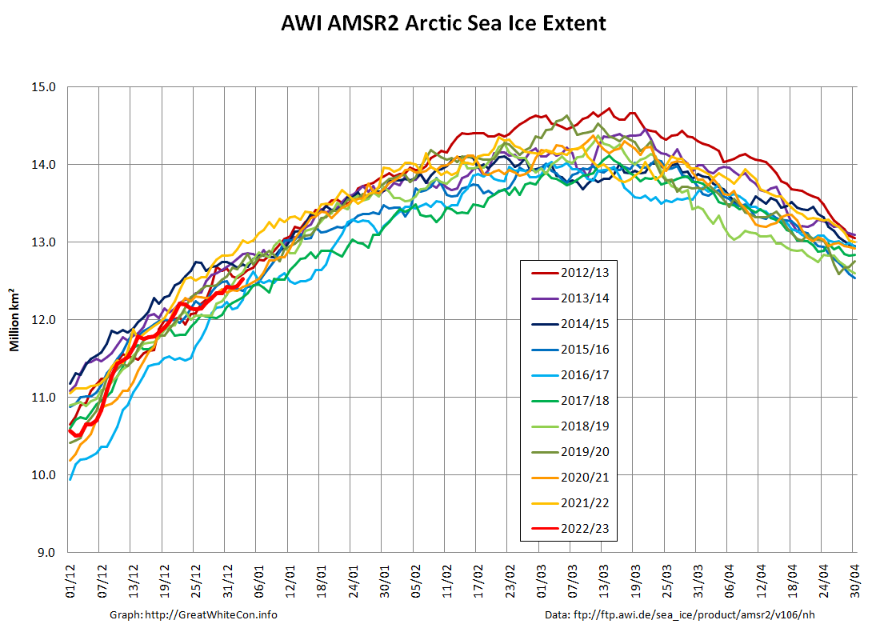
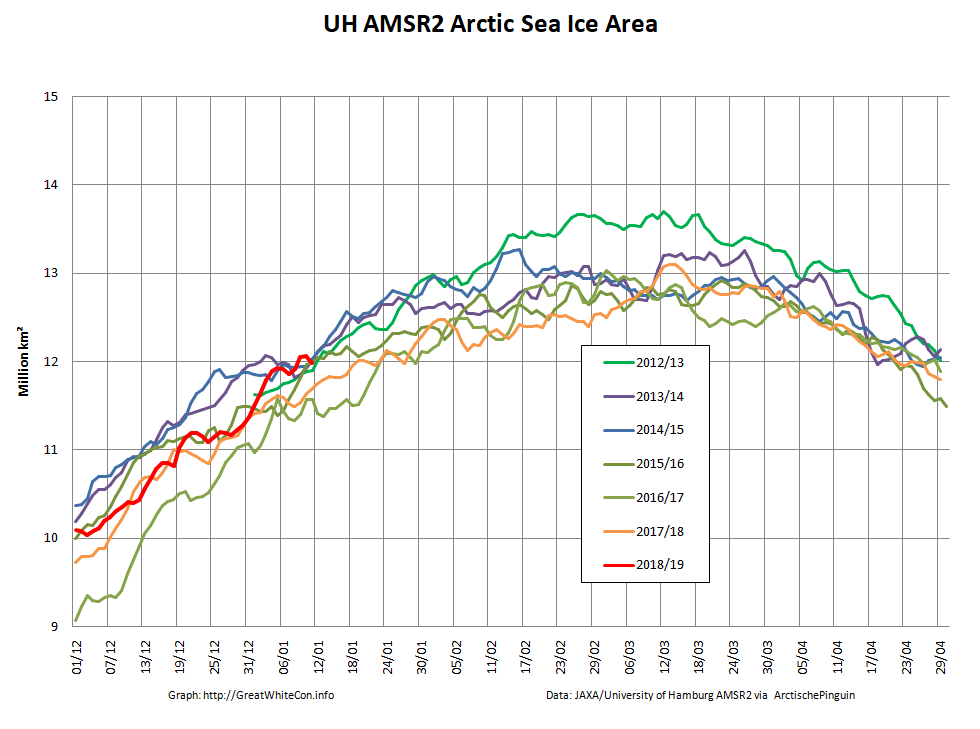
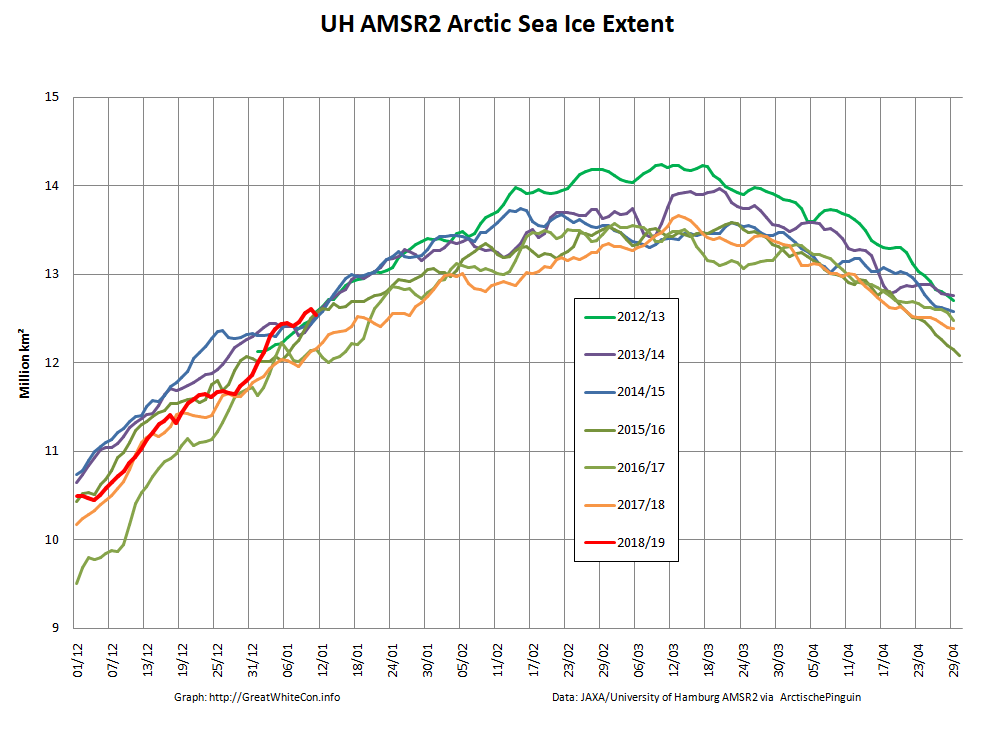
Here too are the high resolution AWI AMSR2 area and extent graphs:
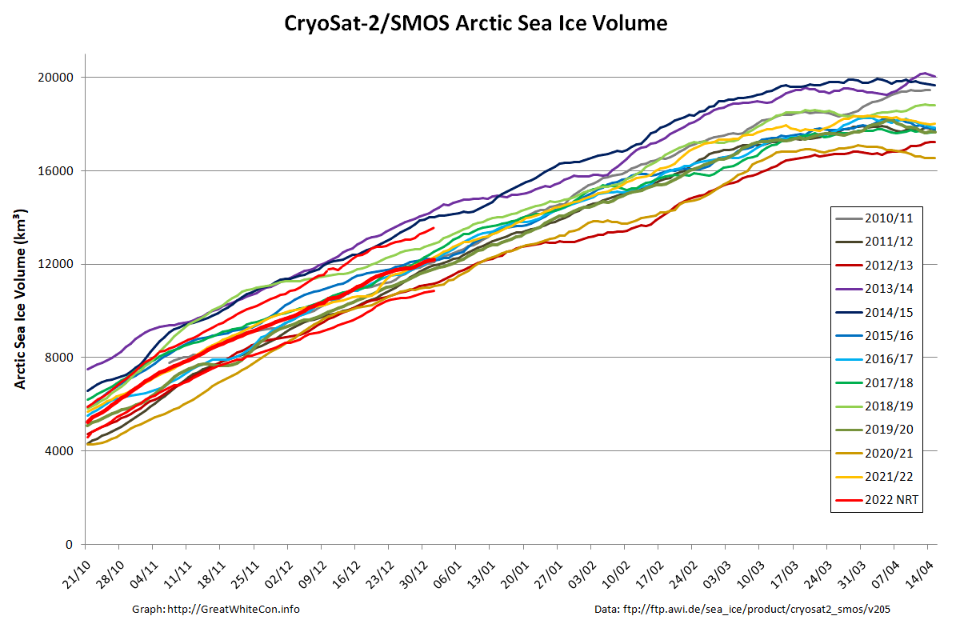
The latest AWI CryoSat-2/SMOS volume graph tells a similar story:
Although overall volume is in the middle of the pack, the associated thickness map:
and the thickness anomaly map from the Finnish Meteorological Institute reveal an unusual distribution of thicker ice:
A considerable volume of ice currently situated between Svalbard and North East Greenland seems destined to exit the Central Arctic Basin via the Fram Strait over the coming months.
[Edit – January 24th]
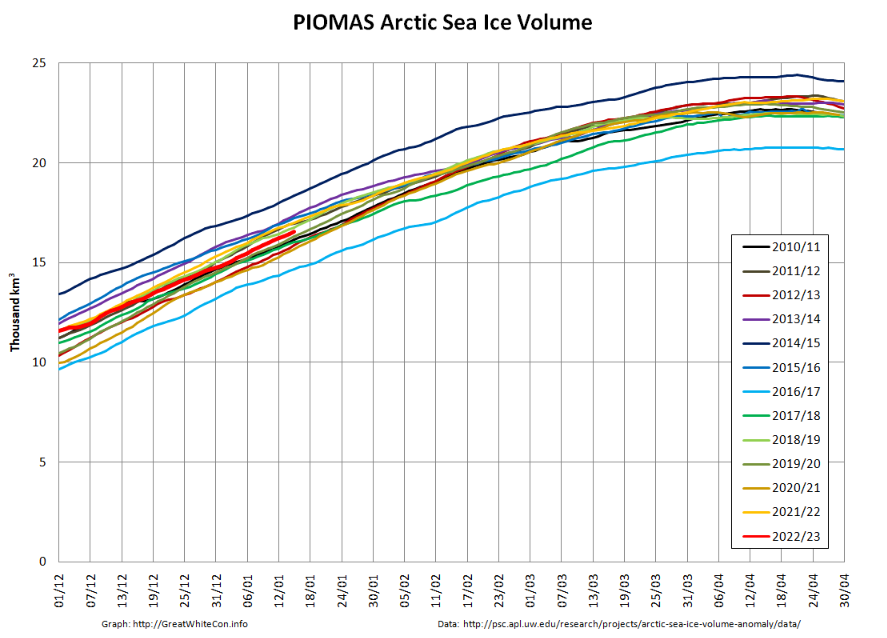
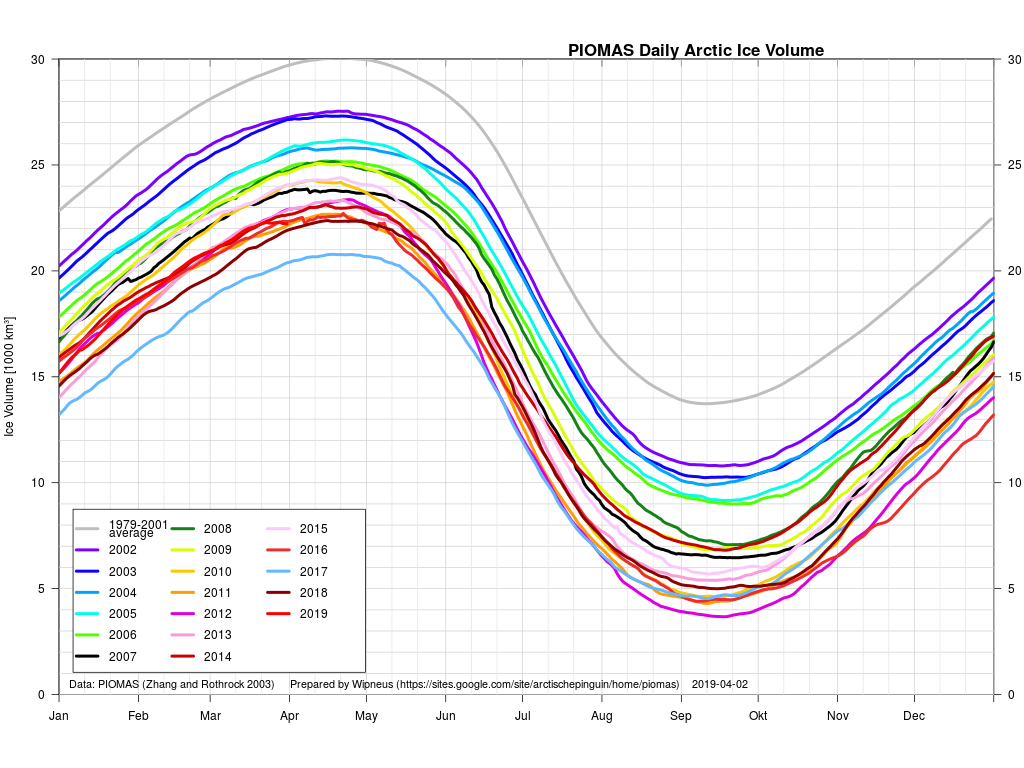
In a somewhat belated mid month update, here’s the PIOMAS daily Arctic sea ice volume graph:
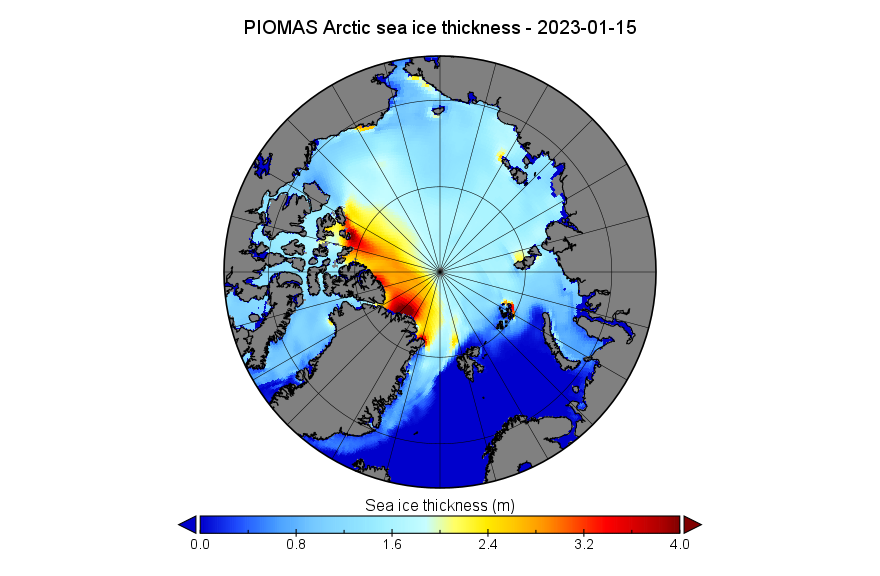
together with the PIOMAS thickness map on January 15th:
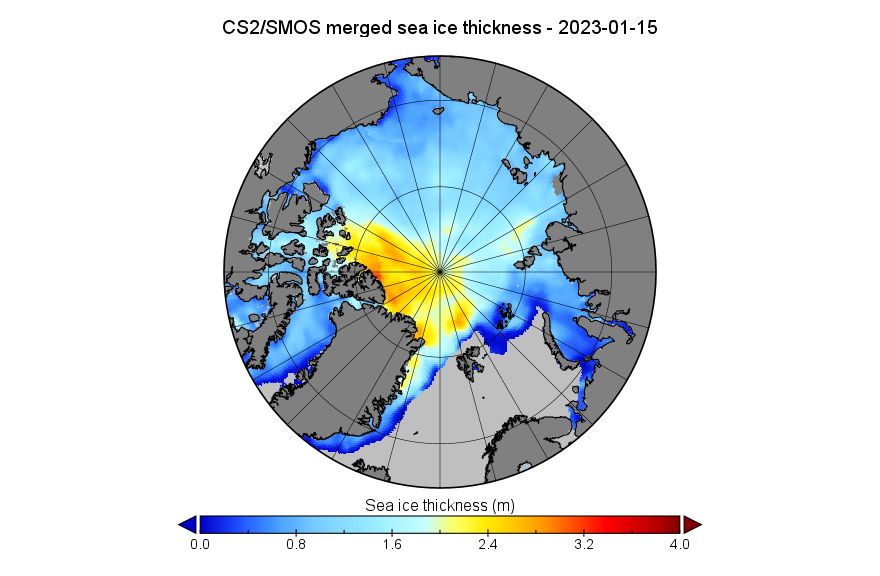
For comparison purposes here’s the AWI CryoSat-2/SMOS thickness map using the same scale:
Note the change of scale from the beginning of the month CS2/SMOS map at the top.
Here too is Lars Kaleschke’s animation of recent Arctic sea ice concentration, with the width of leads exaggerated to reveal ice motion:
Click to animate (10 Mb!)
Evidently sea ice export from the so called “last ice area” is continuing via the Nares Strait and in particular via the Fram Strait between Greenland and Svalbard.
Although not on the same scale as the cyclone at around the same time last year, surface pressure of a storm near Svalbard bottomed out at 965 hPa yesterday:
It will be interesting to see what effect the storm has on the ice on the Atlantic periphery over the next few days.
Not a lot of people know that our headline for today (apart from the terminating question mark) has been shamelessly plagiarised from Paul Homewood’s latest Arctic article. This will give you a flavour of Paul’s purple prose:
Electroverse have uncovered some blatant data tampering by DMI:
“It would appear that the Danish Meteorological Institute (DMI) may have taken a leaf out of NASA’s ‘data-fudging 101‘.
Sometime between late-Nov and early-Dec this year, the DMI’s Arctic Sea Ice Volume chart experienced a mysterious ‘vanishing’ of ice — this is revealed by a direct comparison of the Nov 18th and the Dec 8th charts below.”
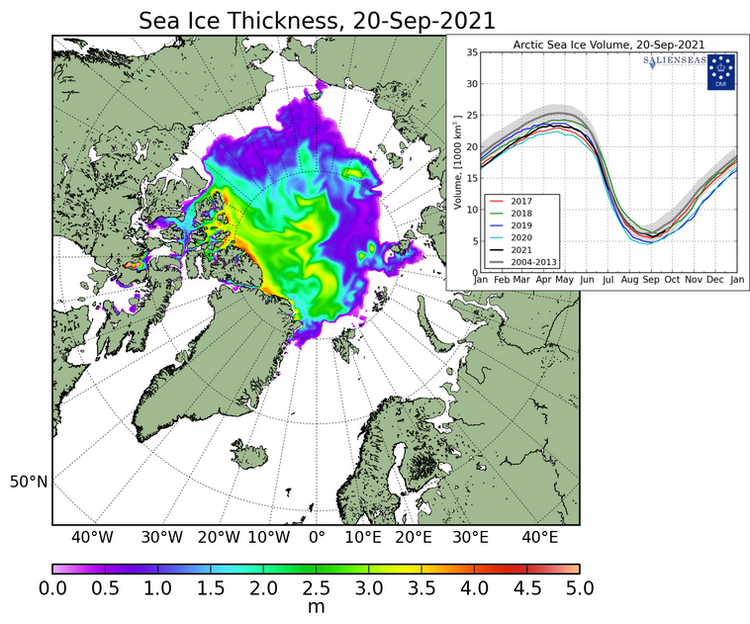
I am able to corroborate their findings. In September I took this screenshot of DMI sea ice thickness. Note that the black line for this year was close to the 2018 line, and above 2017 for Sep 20th:
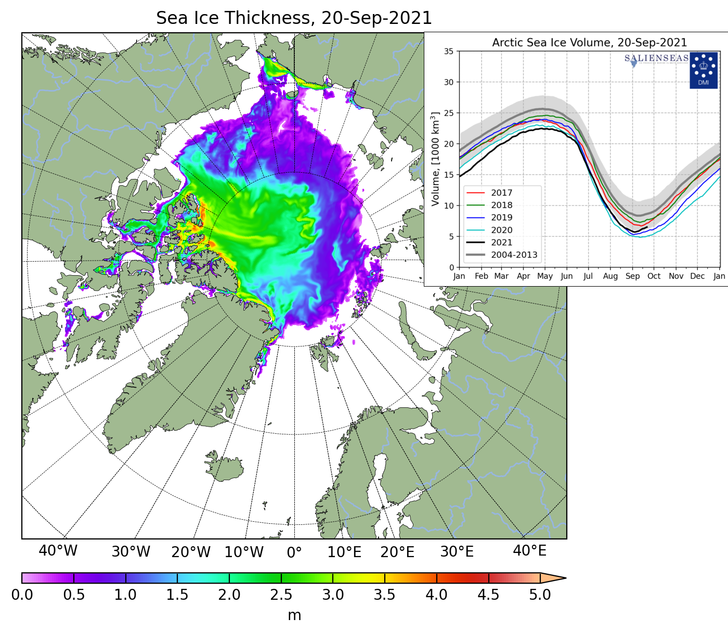
But the new version shows this year well below those two years:
There is no other way to describe this than blatant fraud. The changes do not appear to have been even documented, and the old data is not archived, being simply “replaced”. These should surely be very basic scientific requirements.
Neither does there appear to have been any public announcement by DMI about the fact or the justifications for what amounts to a significant change.
What this episode means is that DMI can no longer be trusted to produce honest, reliable data. It also raises the question of whether similar tampering has been carried out in previous years, without anybody being aware. After all, it is only by pure accident that it has been spotted this time.
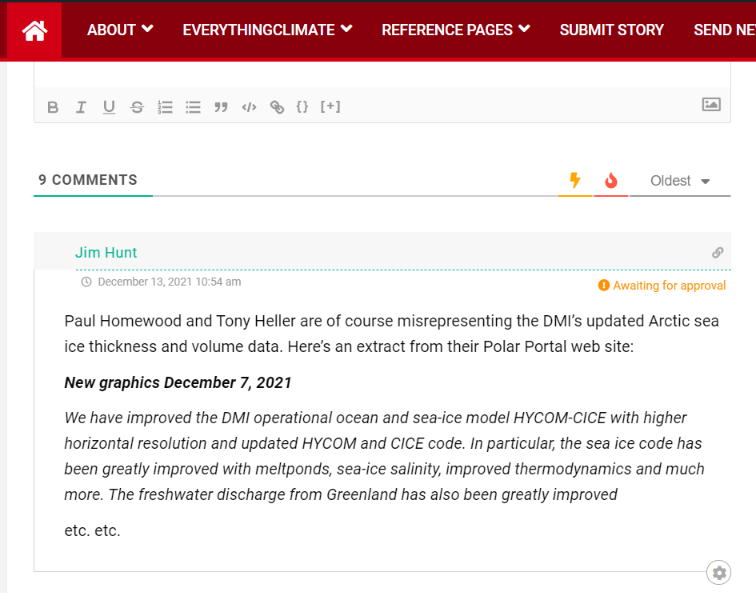
Even fewer people know that my helpful explanatory comment is currently invisible to Paul’s band of merry (mostly) men:
Should anyone contrive to click on the invisible link this what they would see just below the DMI’s recent Tweet:
Quite predictably Tony Heller has also jumped on the self same bandwagon, claiming in an article entitled “Rapidly Disappearing Arctic Ice” that:
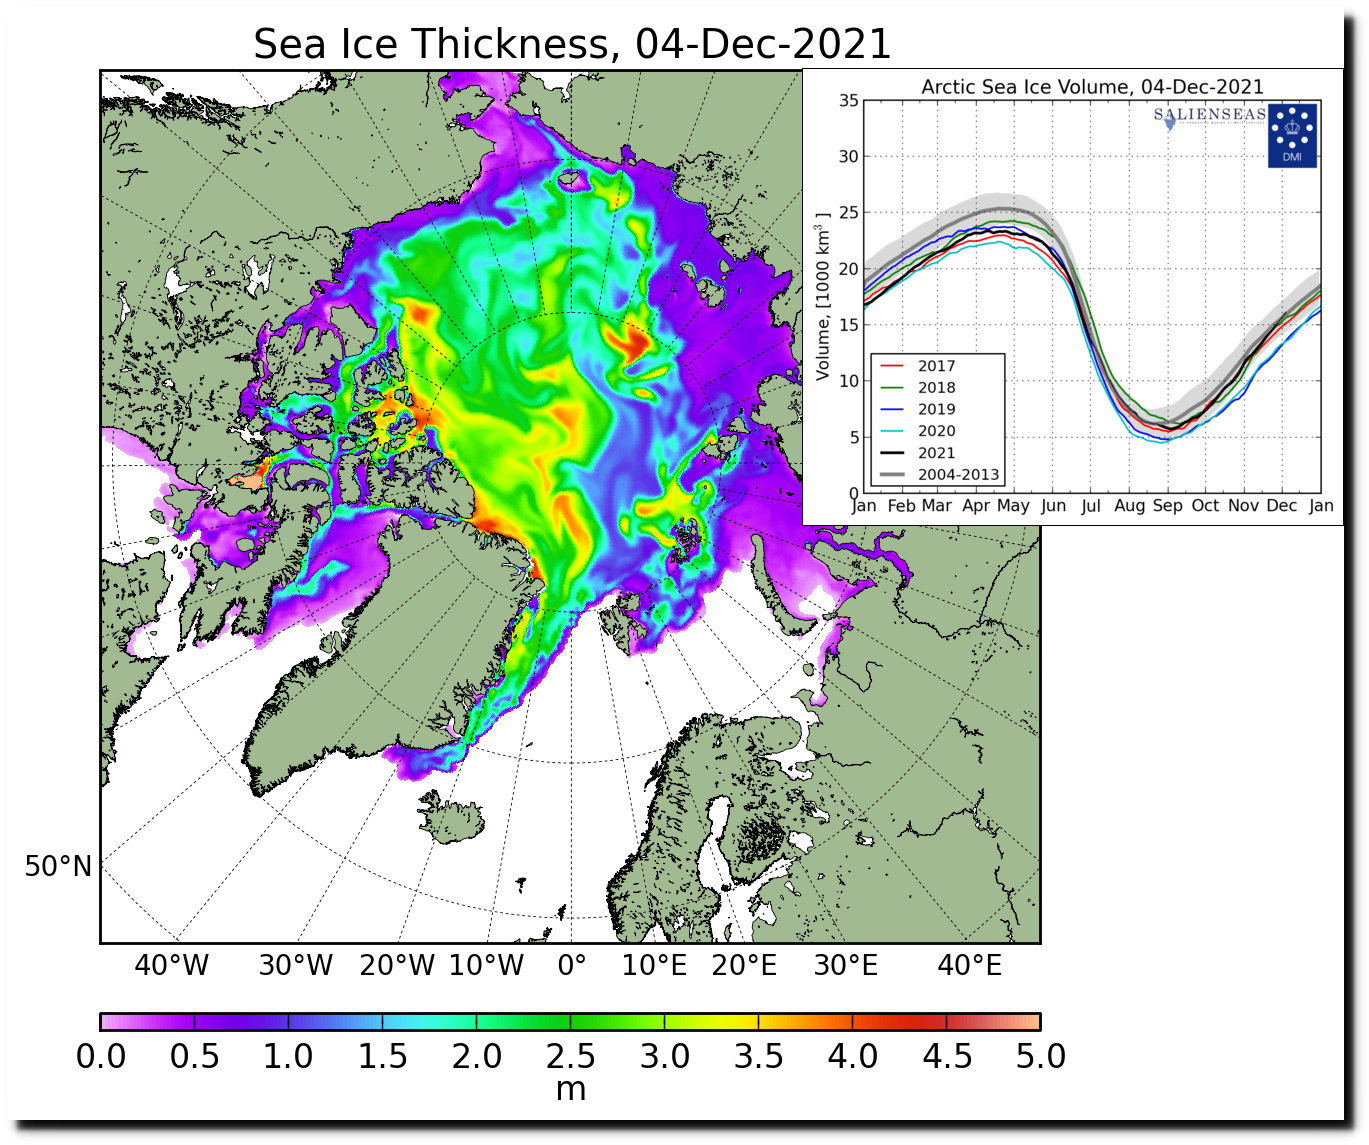
On December 4, DMI showed Arctic sea ice volume above the 2004-2013 average:
Quite predictably, the data disappeared for three days, and now that it has returned, DMI has massively reduced the amount of sea ice in the Arctic. Much of the thick ice off the coast of Siberia has disappeared:
In normal circumstances I would of course point out the error of his ways to Tony via Twitter. However:
Here is the DMI’s explanation for the recent change in their Arctic sea ice thickness/volume visualisations, as shown on their “Polar Portal” web site:
New graphics December 7, 2021
We have improved the DMI operational ocean and sea-ice model HYCOM-CICE with higher horizontal resolution and updated HYCOM and CICE code. In particular, the sea ice code has been greatly improved with meltponds, sea-ice salinity, improved thermodynamics and much more. The freshwater discharge from Greenland has also been greatly improved using freshwater product from GEUS, which especially improves the coastal ocean currents and thus the ice transport nearshore Greenland. The model has been running continuously since September 1990. Therefore, we have by December 07, 2021 updated the graphics of sea-ice thickness and volume using the new and improved data on Polarportal and ocean.dmi.dk.
The improved model setup has led to higher variability as well as less abrupt melting during the melt season, which gives a shift of approximately half a month for the time of minimum ice volume. The trend between the years is almost unchanged. Thereby, a year with a large sea-ice volume in the old setup also has a large volume in the new setup, and similar for years with low sea-ice volume.
I always thought that “skeptical” folk didn’t much care for the output of “climate models” but I guess I must have been mistaken?
[Edit – December 13th]
Needless to say my comment at NALOPKT is still invisible this evening. However credit where credit is due. Tony Heller has at least not censored my comments on his blog. Earlier today Watts Up With That referred to both the Heller and Homewood DMIGate2 articles. Do you suppose the following helpful comment of mine will ever see the light of day at WUWT?
Watch this space for more #DMIGate2 news as and when we receive it!
There isn’t a million more square kilometers of ocean covered with ice than at the same time last year. Or is there?
For our younger readers perhaps I should point out that is a reference to the genesis of the Great White Con blog way back in the mists of time in September 2013, when a Daily Mail headline proudly, but erroneously, declared that:
And now it’s global COOLING! Record return of Arctic ice cap as it grows by 60% in a year.
With the COP26 conference due to start in Glasgow on October 31st UK Prime Minister Boris Johnson had this to say to the United Nations General Assembly yesterday, amongst other things:
In the words of the Oxford philosopher Toby Ord “we are just old enough to get ourselves into serious trouble”…
It is time for humanity to grow up.
It is time for us to listen to the warnings of the scientists – and look at Covid, if you want an example of gloomy scientists being proved right – and to understand who we are and what we are doing.
The world – this precious blue sphere with its eggshell crust and wisp of an atmosphere – is not some indestructible toy, some bouncy plastic romper room against which we can hurl ourselves to our heart’s content.
Daily, weekly, we are doing such irreversible damage that long before a million years are up, we will have made this beautiful planet effectively uninhabitable – not just for us but for many other species.
And that is why the Glasgow COP26 summit is the turning point for humanity.
If all that sounds unlikely, then take a look:
https://youtu.be/Z_YPE7vy_wQ?t=27
As we surmised at the time of the recent G7 Summit in Cornwall:
I’ve been waiting for the results of the ARCUS SIPN August call, but despite the timetable specifying “26 August 2020 (Wednesday)” they’ve still not been published and I can wait no longer!
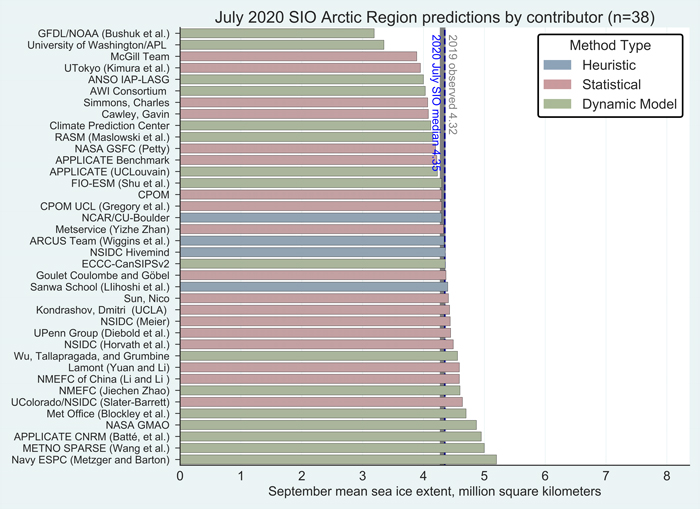
Hopefully the August “predictions” will be available soon, but for the moment let’s take a look at the July 2020 Sea Ice Outlook instead:
For the Arctic, the median July Outlook for September 2020 average sea-ice extent is 4.36 million square kilometers, essentially identical to the median prediction in the June report, with quartiles of 4.1 and 4.6 million square kilometers. For comparison, the historical record September low over the period of satellite observations was set in 2012 at 3.57 million square kilometers, and the second lowest record was 4.27 million square kilometers set in 2007. This year’s projection is close to the 2019 observed September sea-ice extent of 4.32 million square kilometers. As was also the case for the June report, only two of the outlooks project September sea-ice extent below the 2012 record. The consensus judgement against a new record low September sea-ice extent hence remains unchanged. Interestingly, as of this report, observed extent stands at a record low for this time of year.
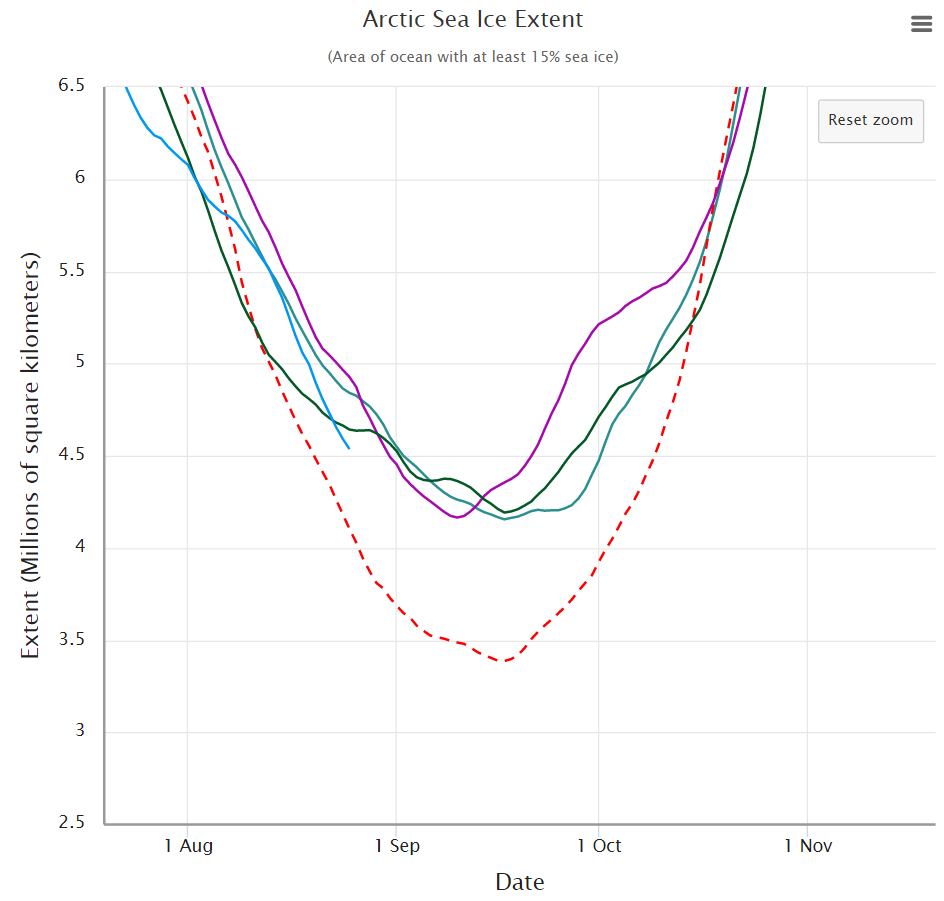
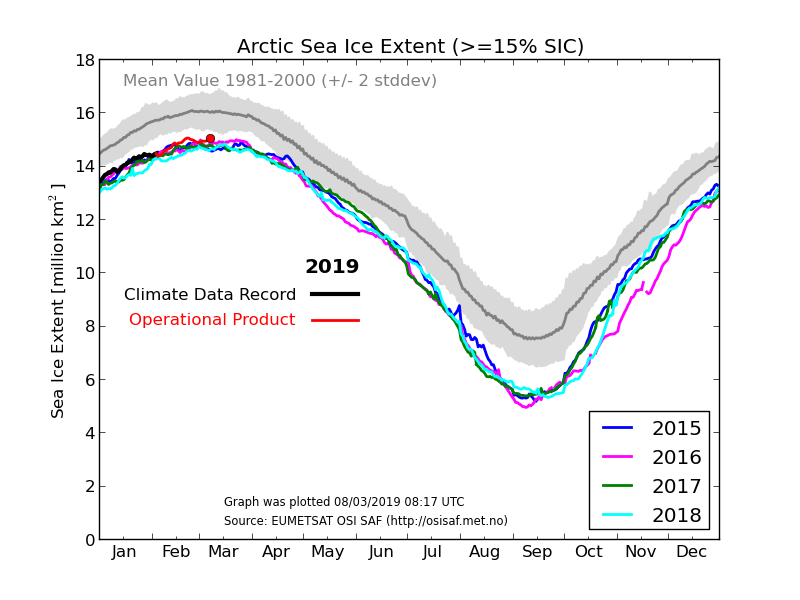
Note that those numbers represent “September 2020 average sea-ice extent” and not the daily minimum. Let’s now take a look at the assorted different flavours of “Arctic sea ice extent” metric. Firstly here’s the NSIDC’s “Charctic” 5 day average extent:
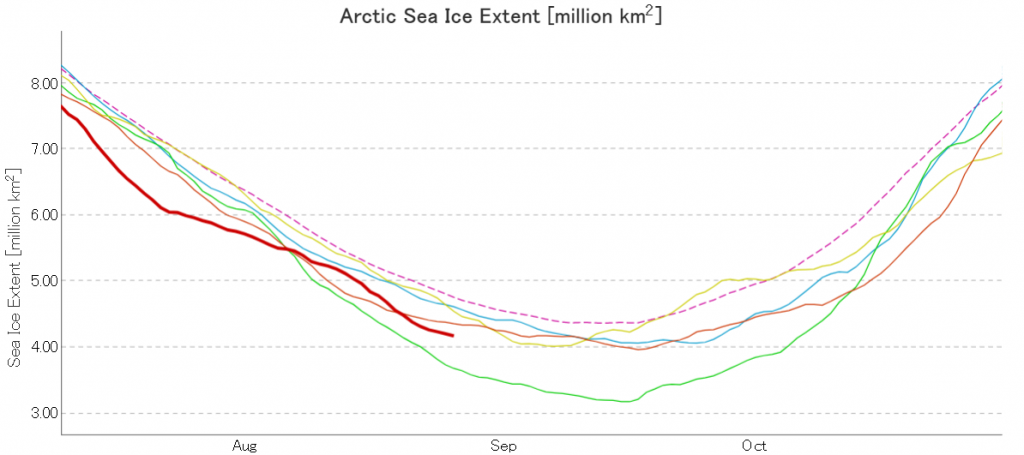
Next here’s JAXA/ViSHOP extent, generally assumed to be a “2 day average”:
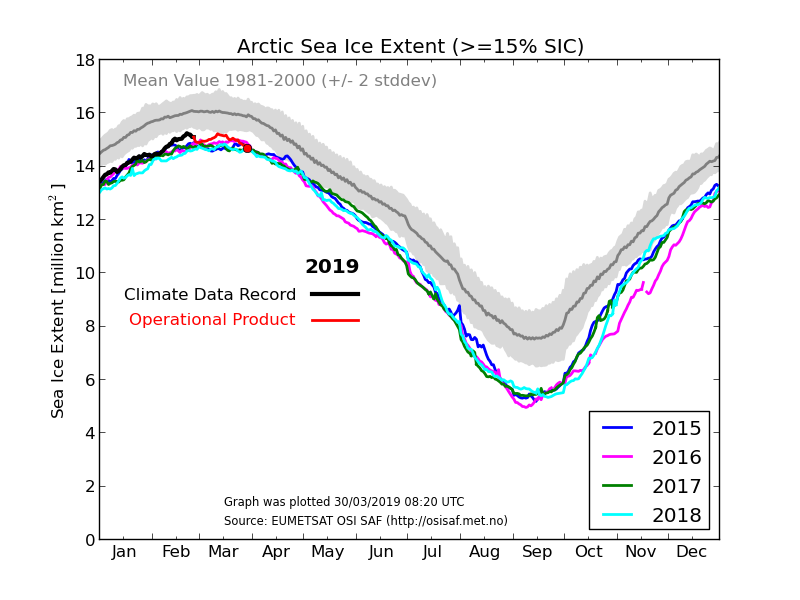
Next here’s the DMI version, which neglects to include 2012:
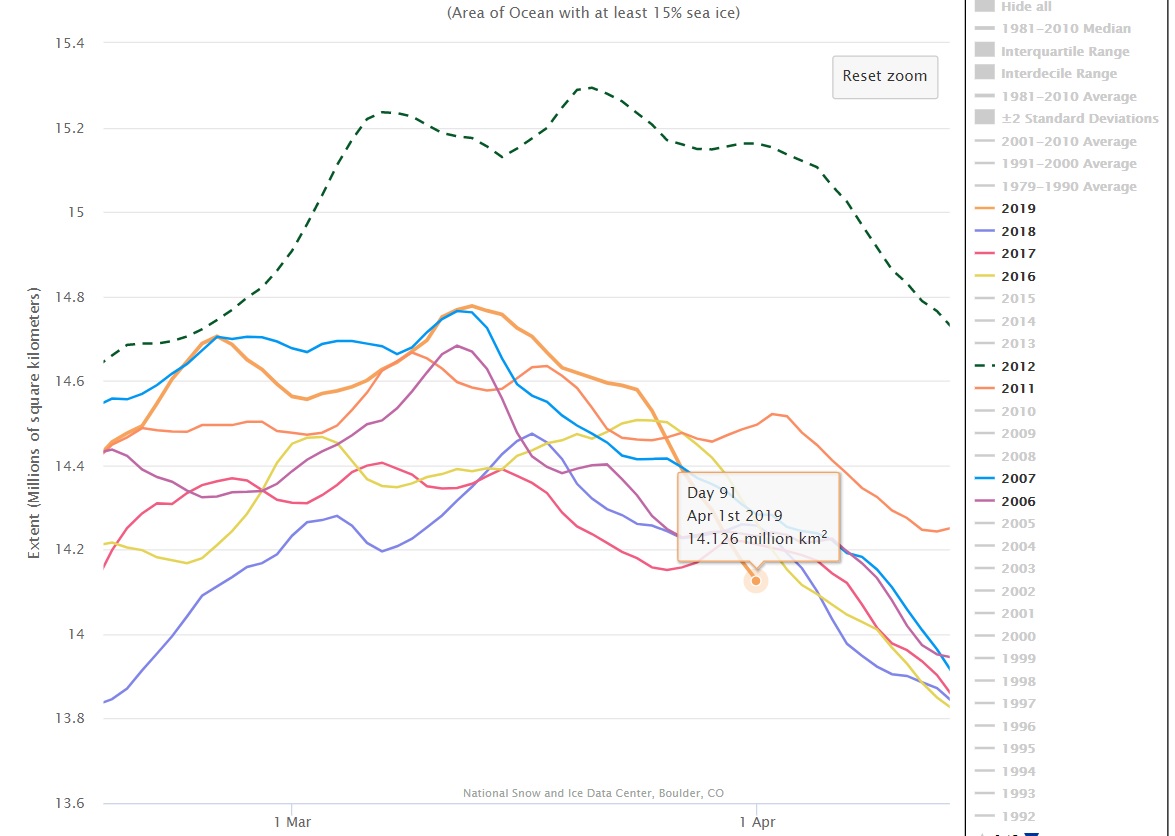
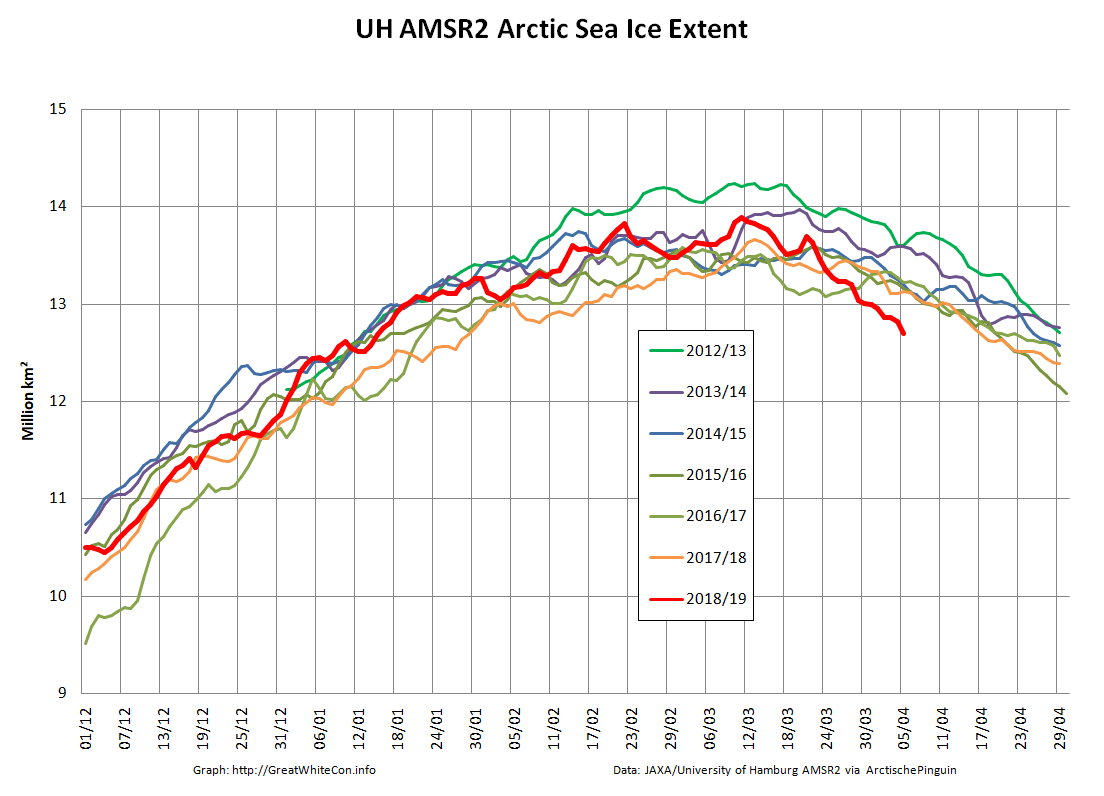
At the beginning of April 2019 all the assorted Arctic sea ice extent metrics are at their respective lowest levels for the date in the satellite record. Just for a change let’s start with the JAXA/ViSHOP graph for April 1st, based on AMSR2 data:
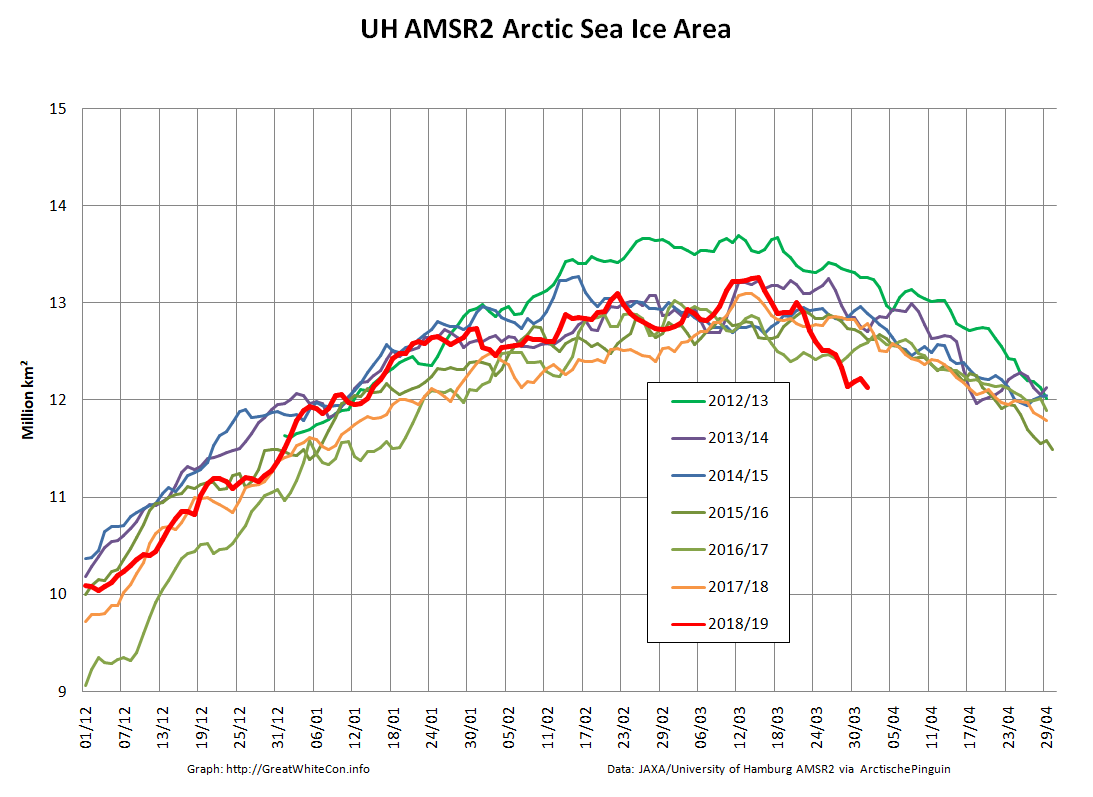
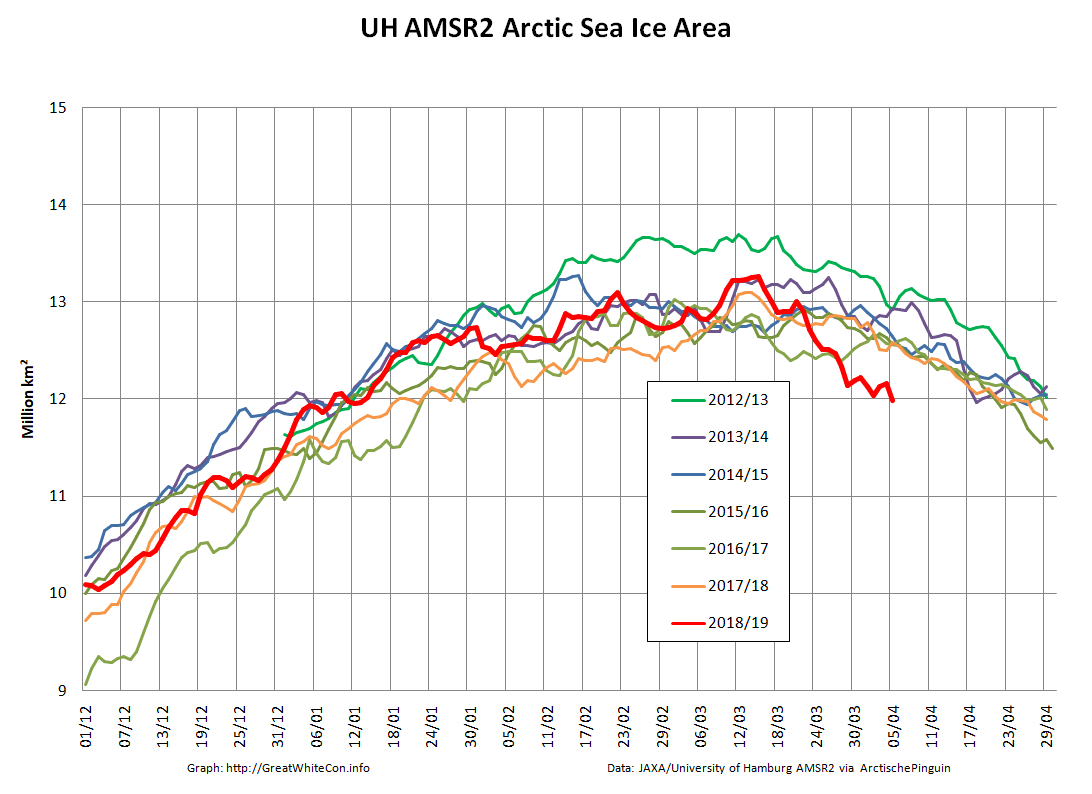
That shows extent apparently on an inexorable decline. However the higher resolution graphs derived by Wipneus from University of Hamburg AMSR2 concentration data reveal that Arctic sea ice extent has changed little over the last couple of days, and area has even increased somewhat:
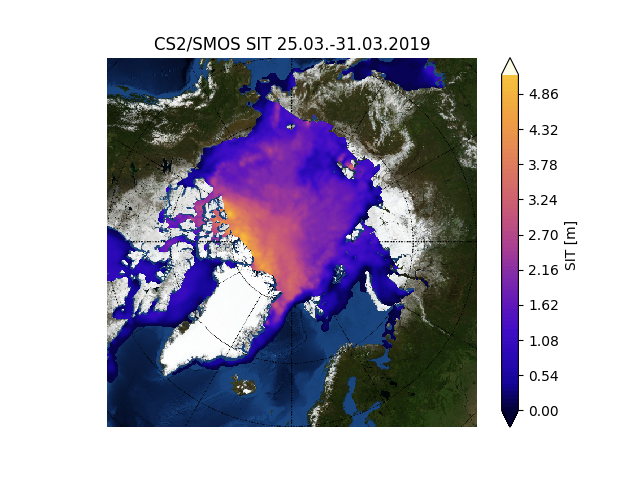
Whilst we wait for Wipneus’ latest PIOMAS thickness and volume update, here’s the gridded merged CryoSat-2/SMOS thickness data from the Finnish Meteorological Institute:
Watch this space for some other extent graphs once they’ve updated to April 1st. In particular the DMI’s version of events will be of great interest, since by way of a little All Fools Day fun I passed on the latest Arctic sea ice news to Tony Heller and the denizens of his “Deplorable Climate Science Blog” yesterday. They were not amused! By way of example, Rah solemnly informed me that:
Tony consistently has used the DMI data as his primary source on the conditions in the Arctic, while you jump to whatever source you think justifies your bias. Get a life. Arctic air temps this year so far have been running below what they were at this time last year.
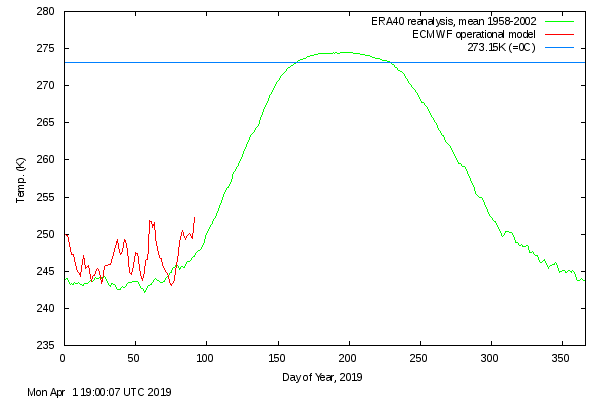
This is the graph that Steve/Tony used in an attempt to make his point:
Plus the April 2nd DMI “Arctic temperature” graph:
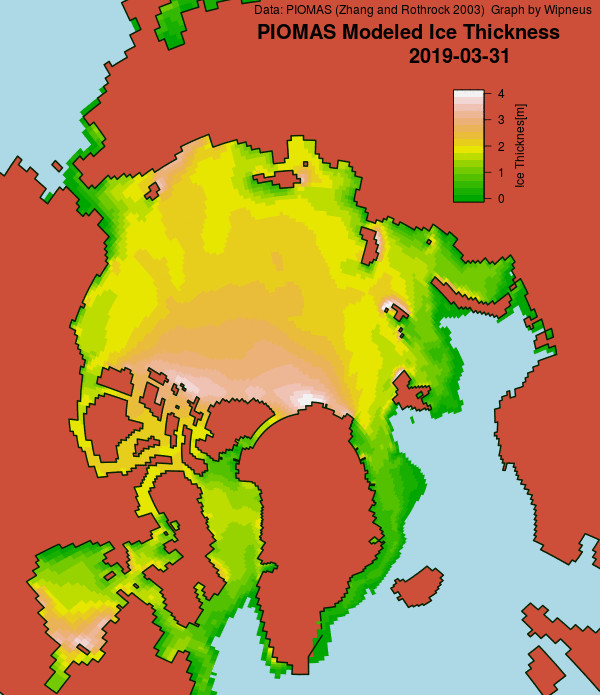
[Edit – April 3rd]
Snow White asked Axel Schweiger nicely on Twitter, and as if by magic the PIOMAS numbers for March have been released, including gridded thickness. Wipneus has crunched them to reveal the following end of March sea ice thickness map:
plus a rather unusual volume graph:
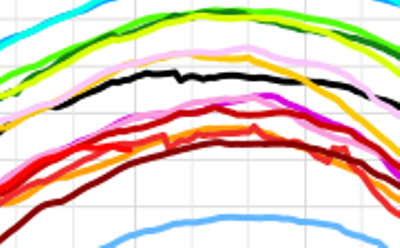
Here’s a closeup view:
According to the PIOMAS model Arctic sea ice volume has been flatlining for the last couple of weeks, and may even have peaked already!
Meanwhile returning to 2 dimensions the decline in area has resumed:
[Edit – April 7th]
Wipneus’ UH high resolution extent fell another 129k yesterday:
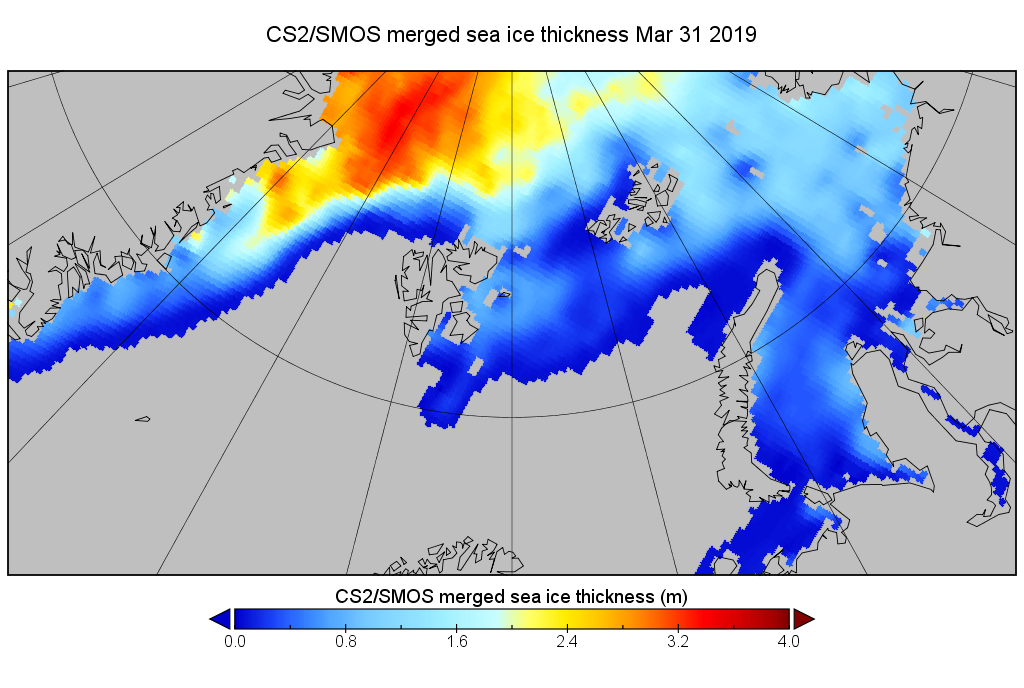
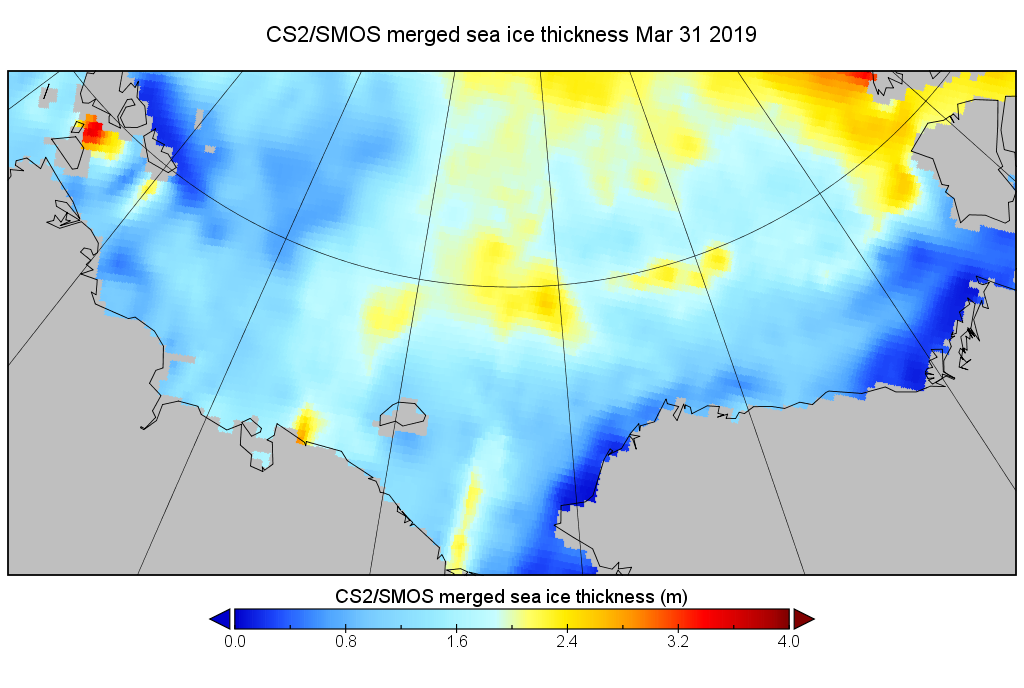
Plus a close up look at the FMI merged Cryosat-2/SMOS thickness for both the Atlantic and Pacific sides of the Arctic:
Apart from the usual thick ice queueing for the Fram Strait exit there’s not a lot to prevent the comparatively swift early melt from continuing apace.
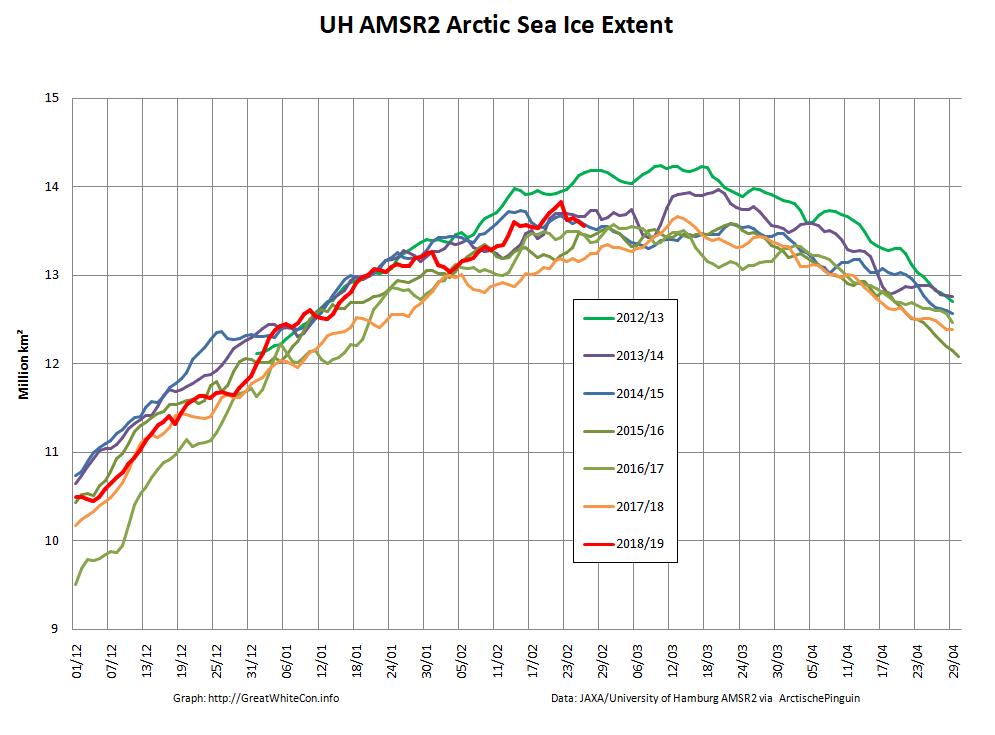
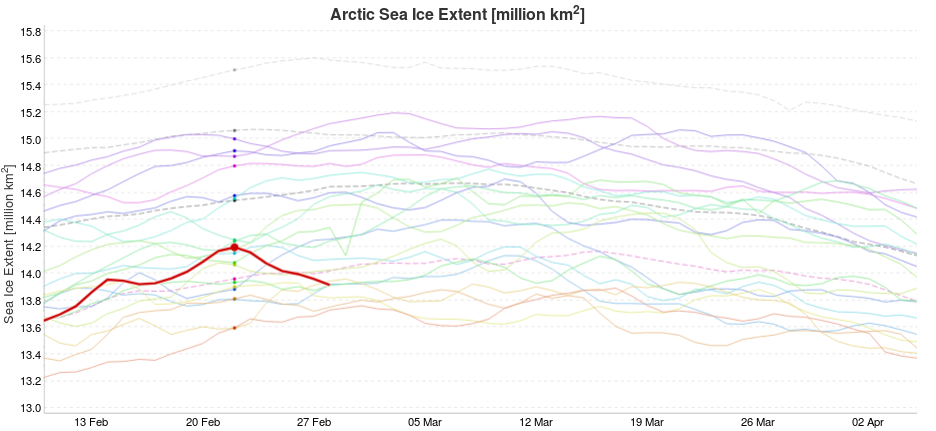
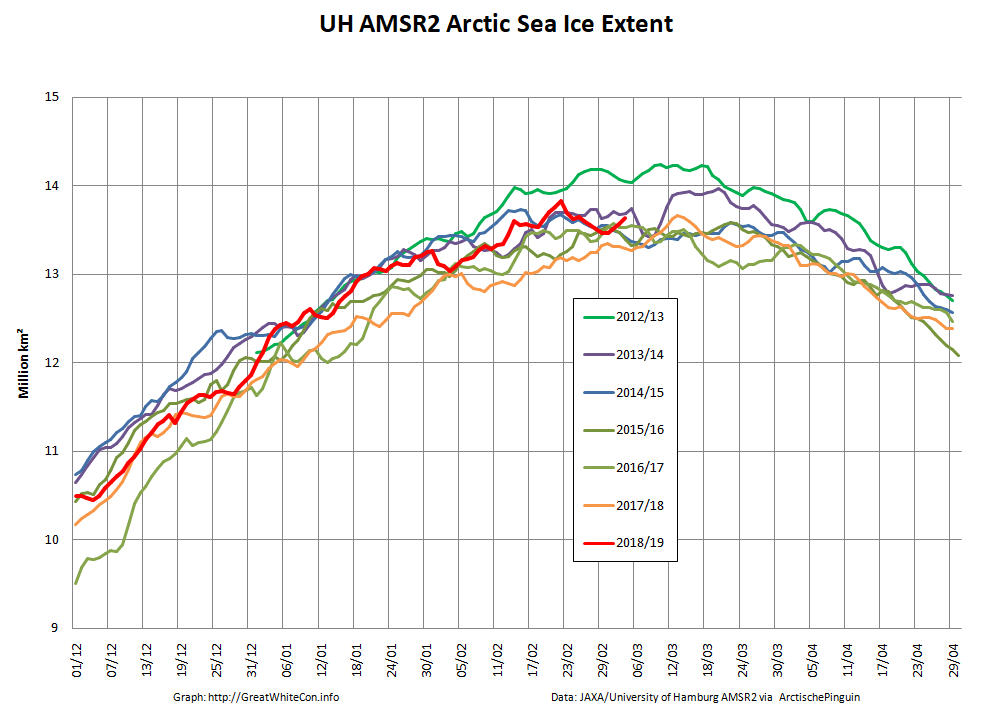
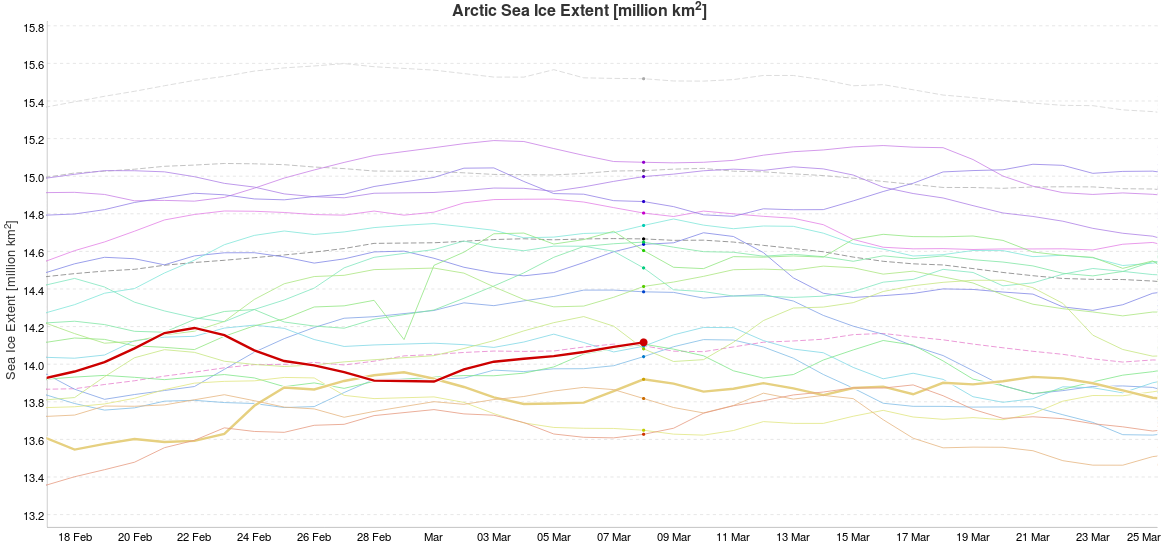
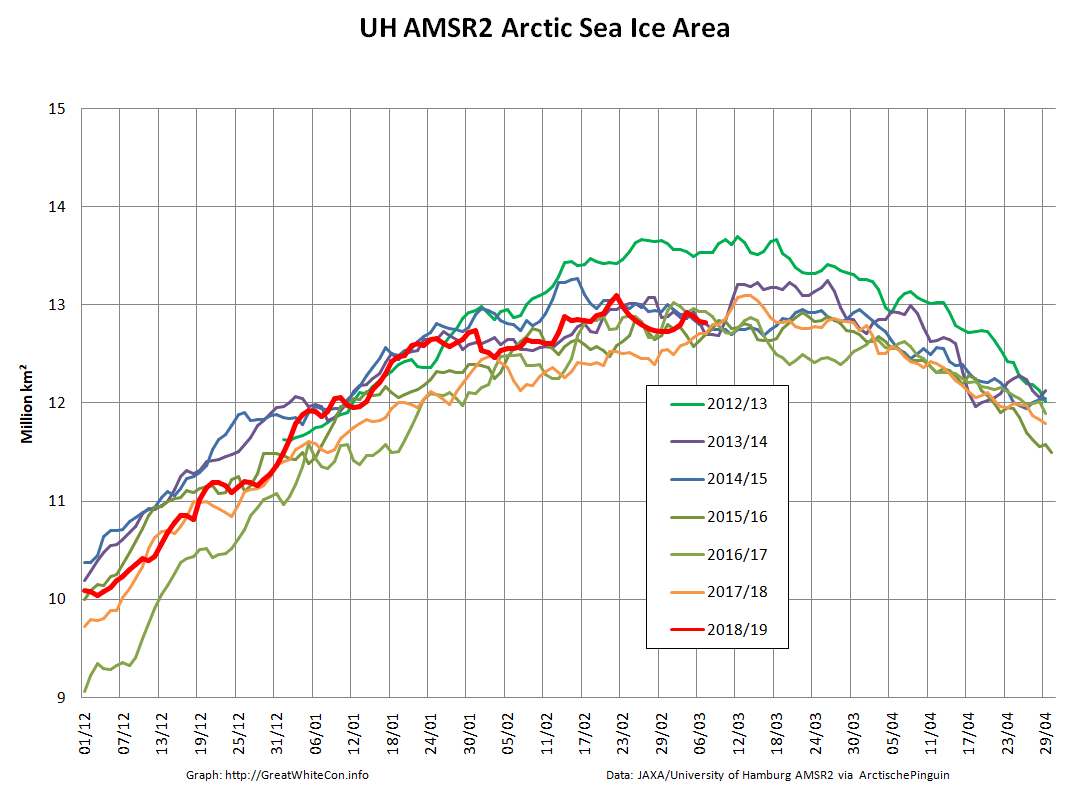
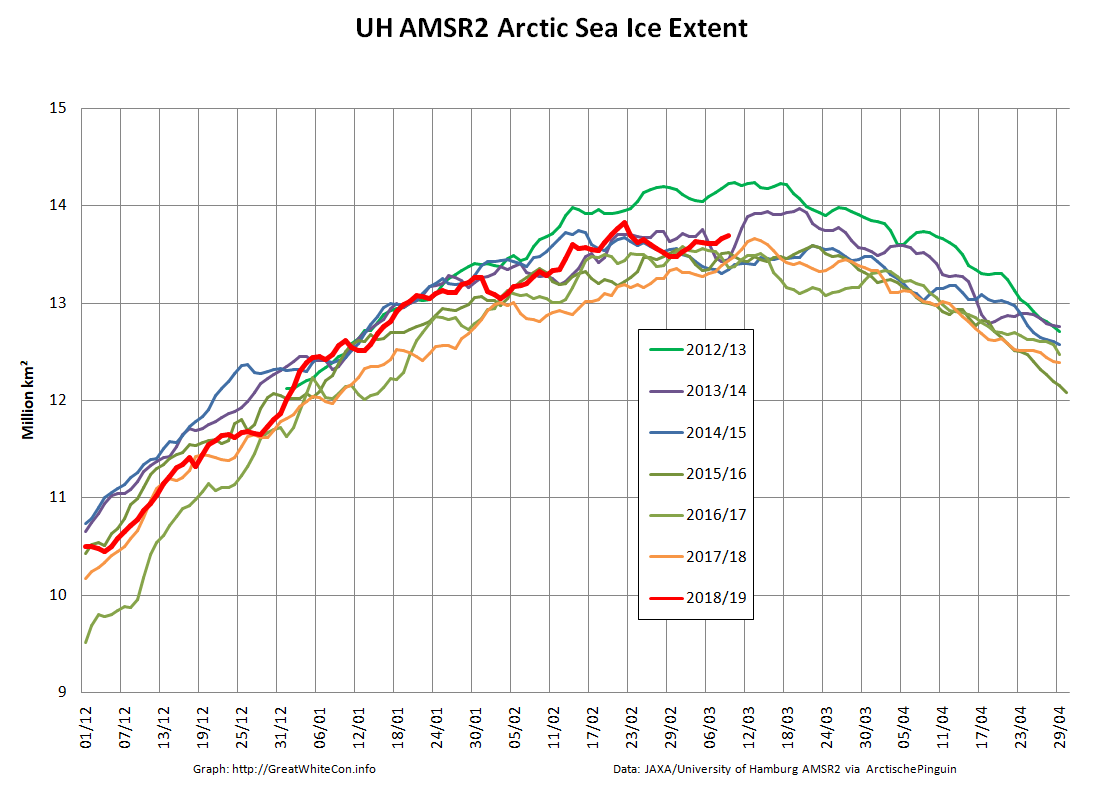
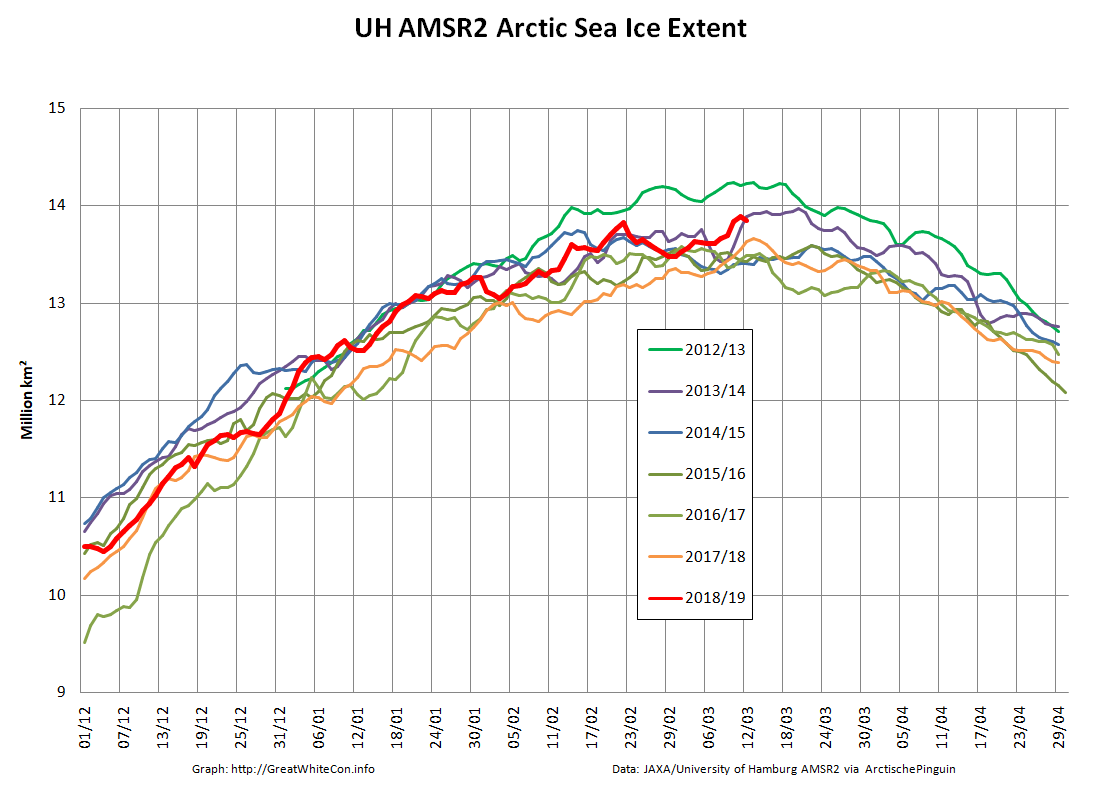
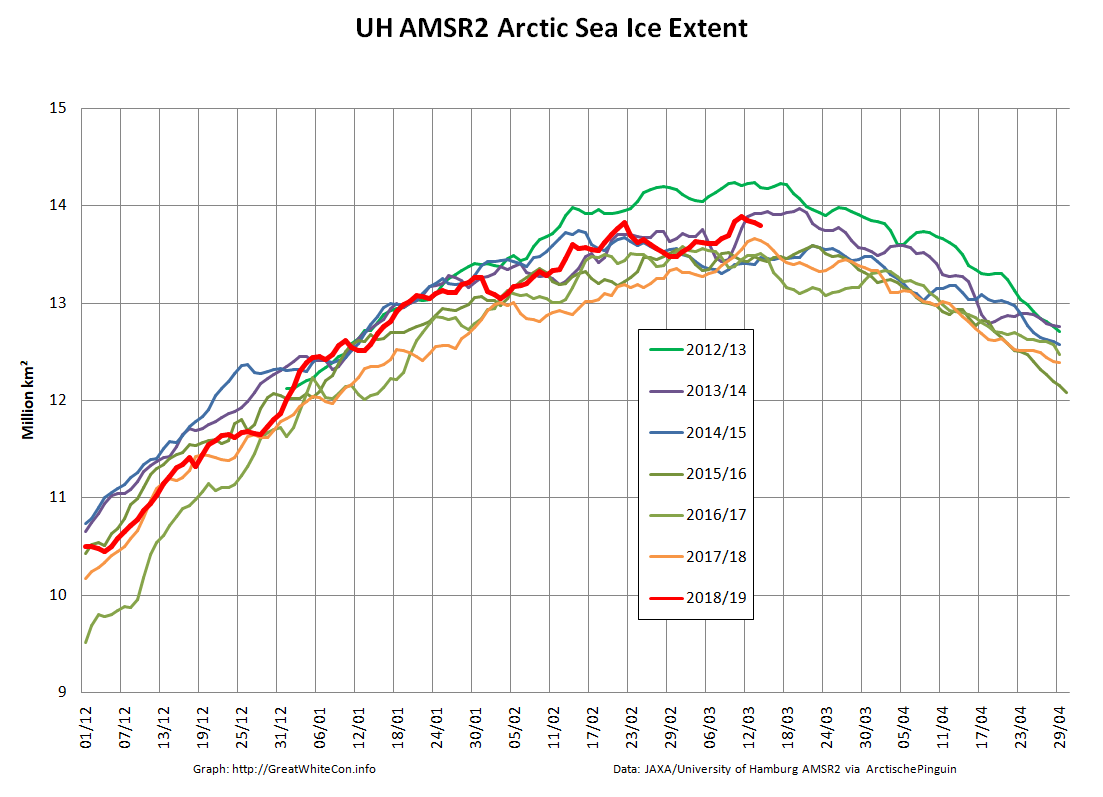
March 2019 has arrived, which in recent years has proved to be by far the likeliest month to contain the maximum extent of Arctic sea ice for the year. To begin with, here’s our favourite high resolution extent graph calculated by “Wipneus” from University of Hamburg/JAXA AMSR2 data:
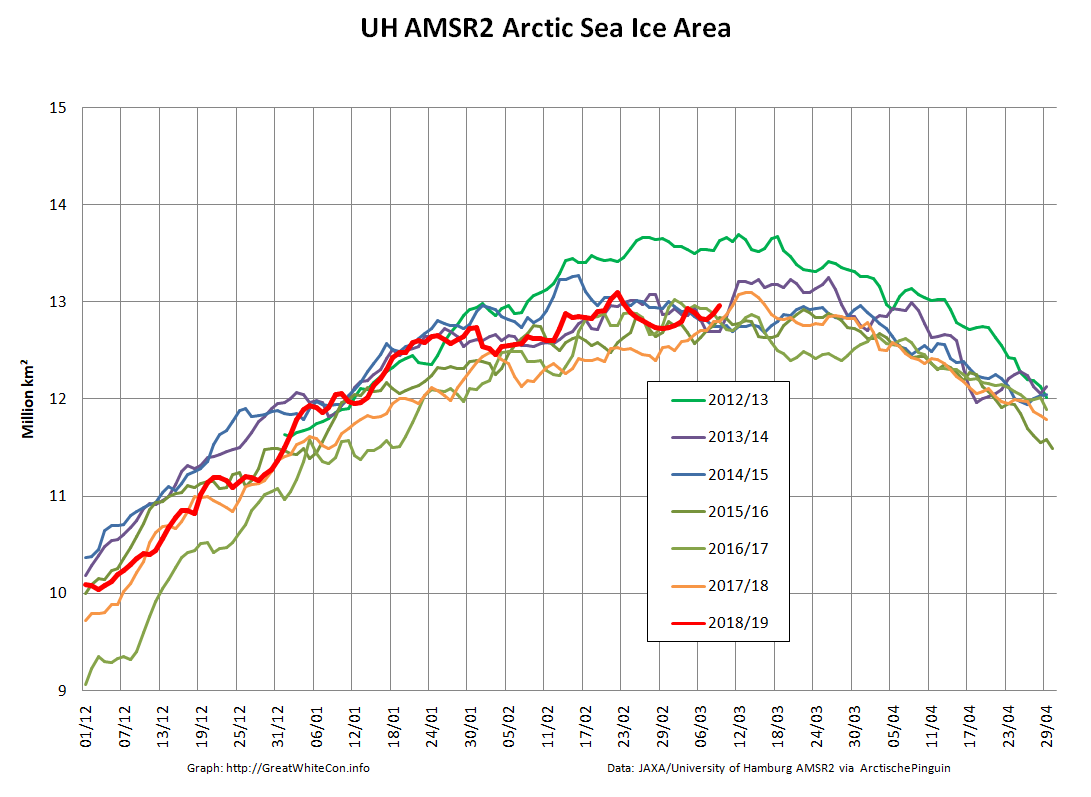
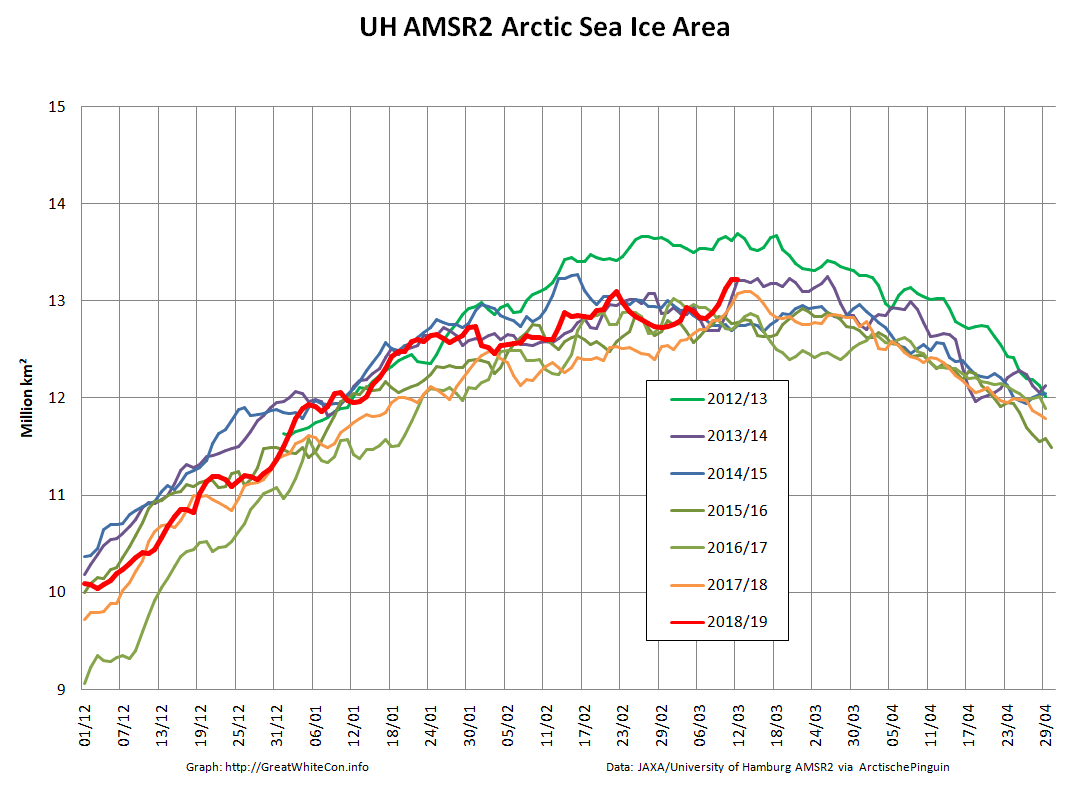
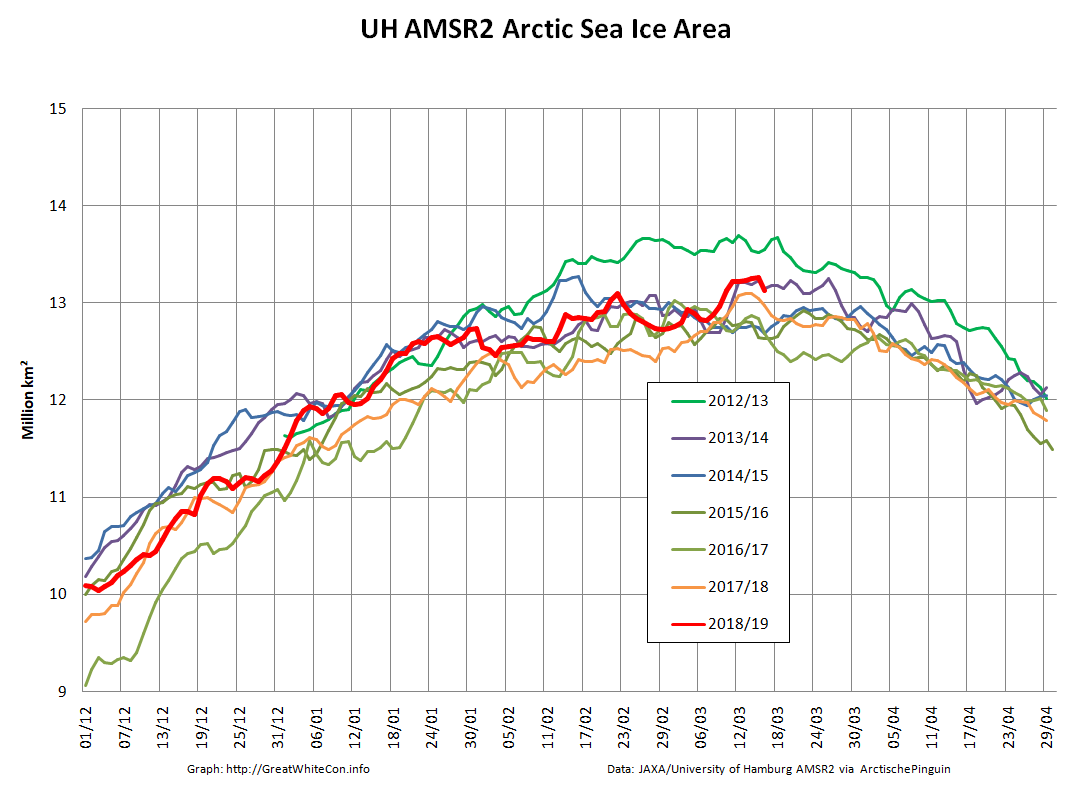
Hopefully you can plainly see the pronounced sharp peak towards the end of February 2019? The current maximum Arctic sea ice extent for 2019 is 13.83 million square kilometers on February 22nd. Here’s Arctic sea ice area for good measure:
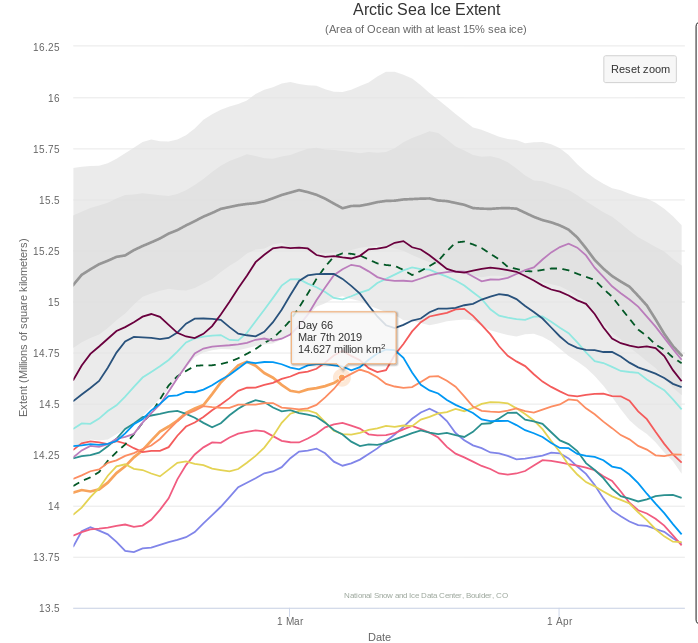
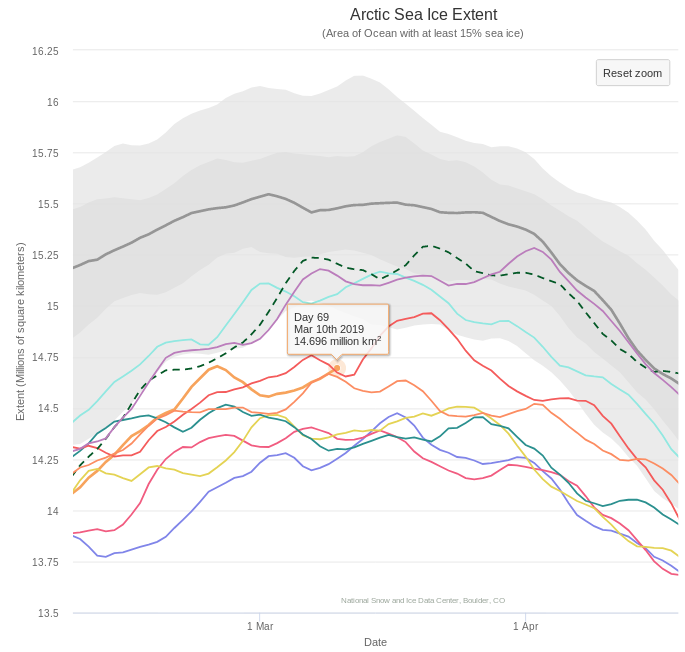
The current maximum area for 2019 is 13.10 million square kilometers, also on February 22nd. Here too is the NSIDC’s 5 day averaged extent:
This reveals a current maximum extent for 2019 of 14.705 million square kilometers on February 24th.
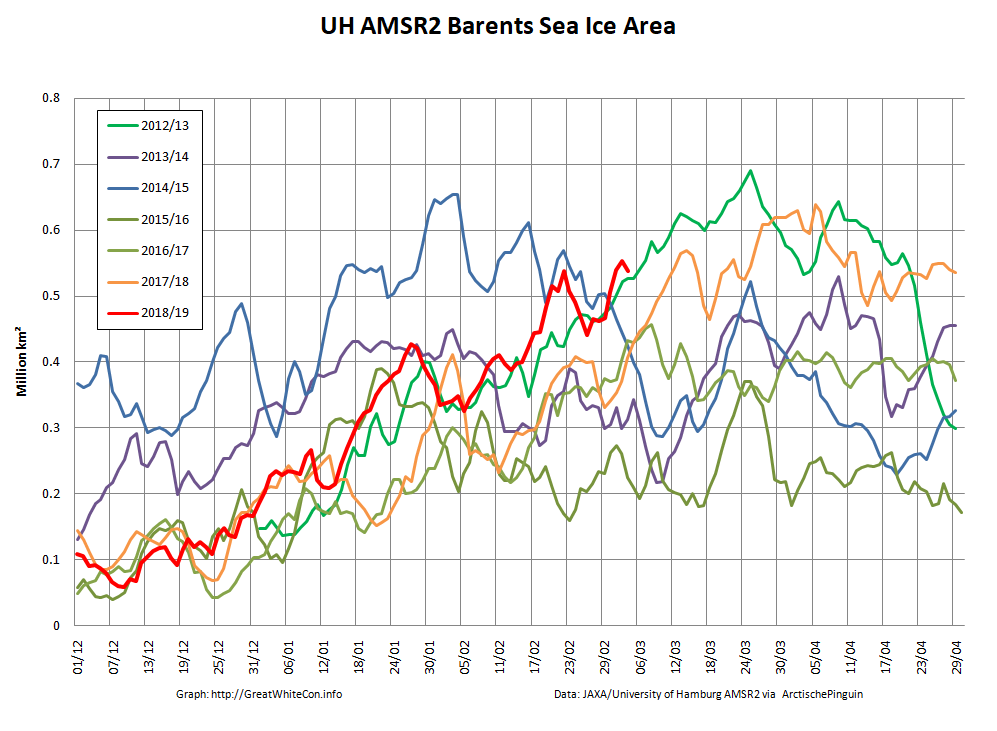
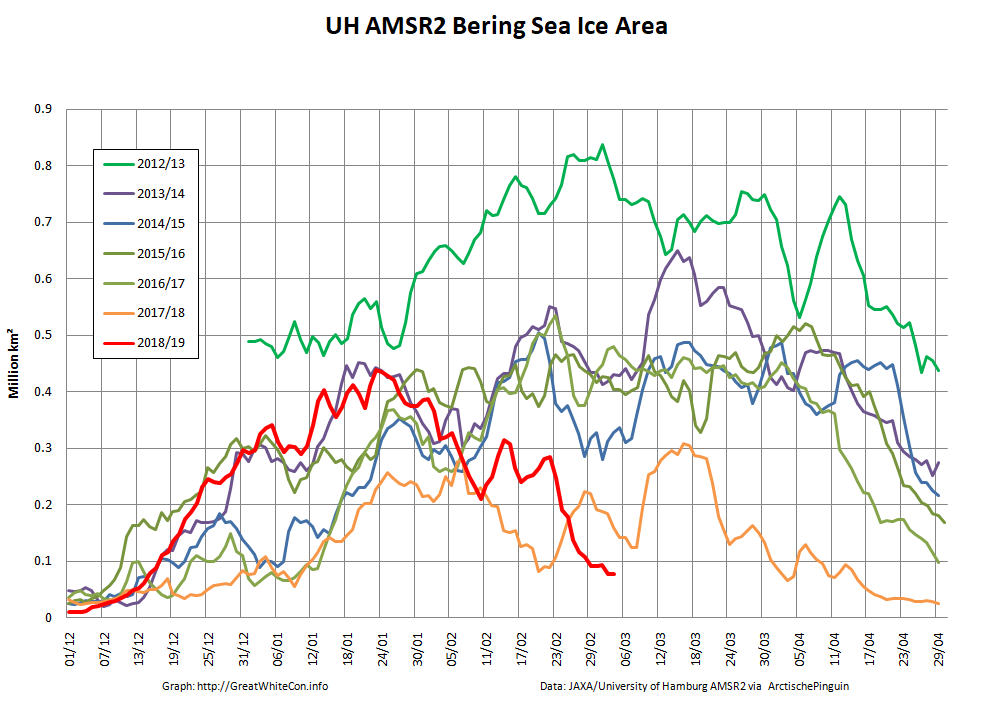
At this juncture you may well be wondering what the cause of that sudden sharp peak might be? Here’s your starter for ten:
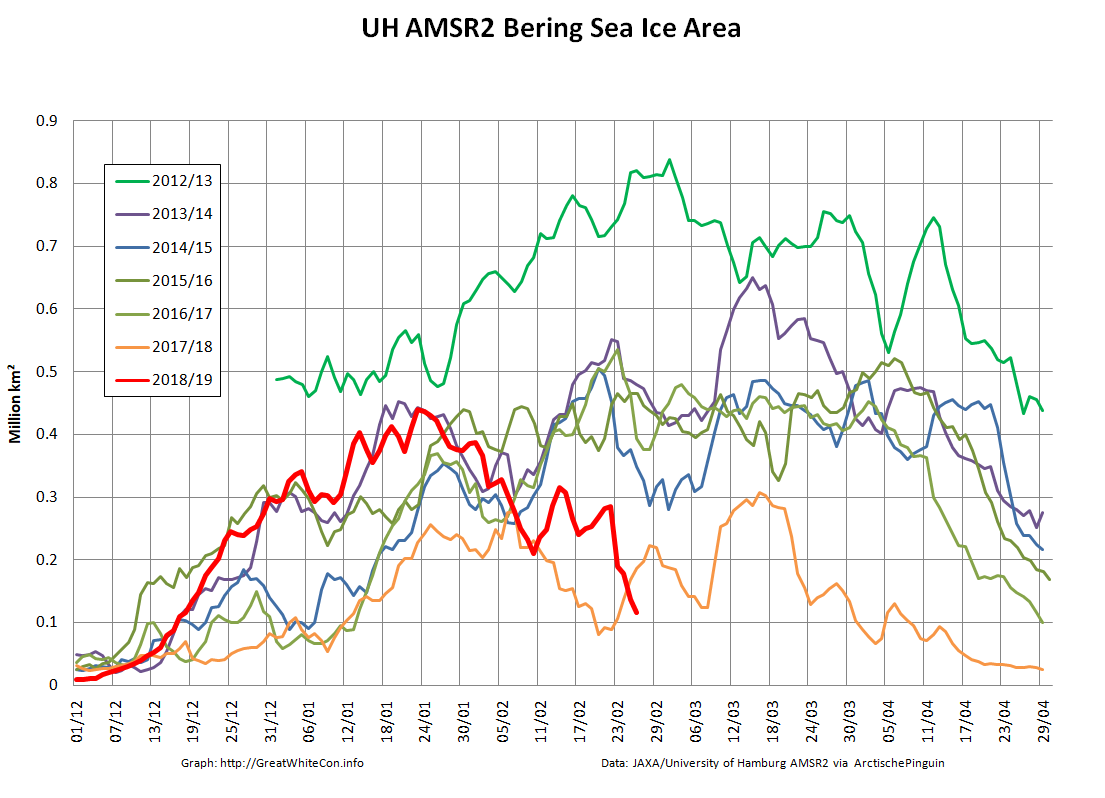
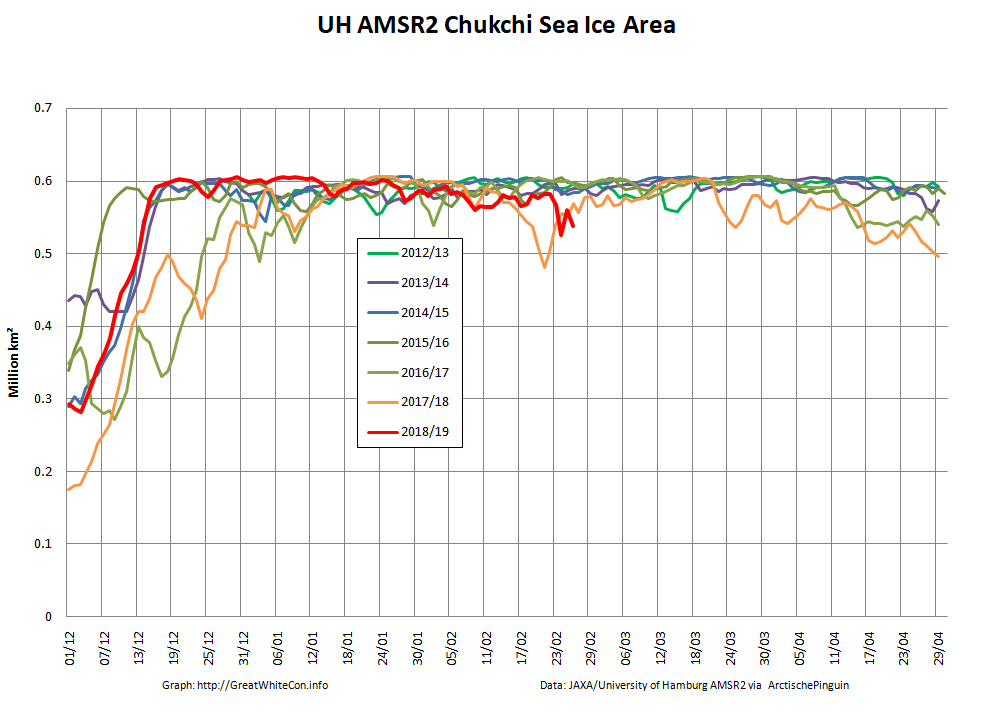
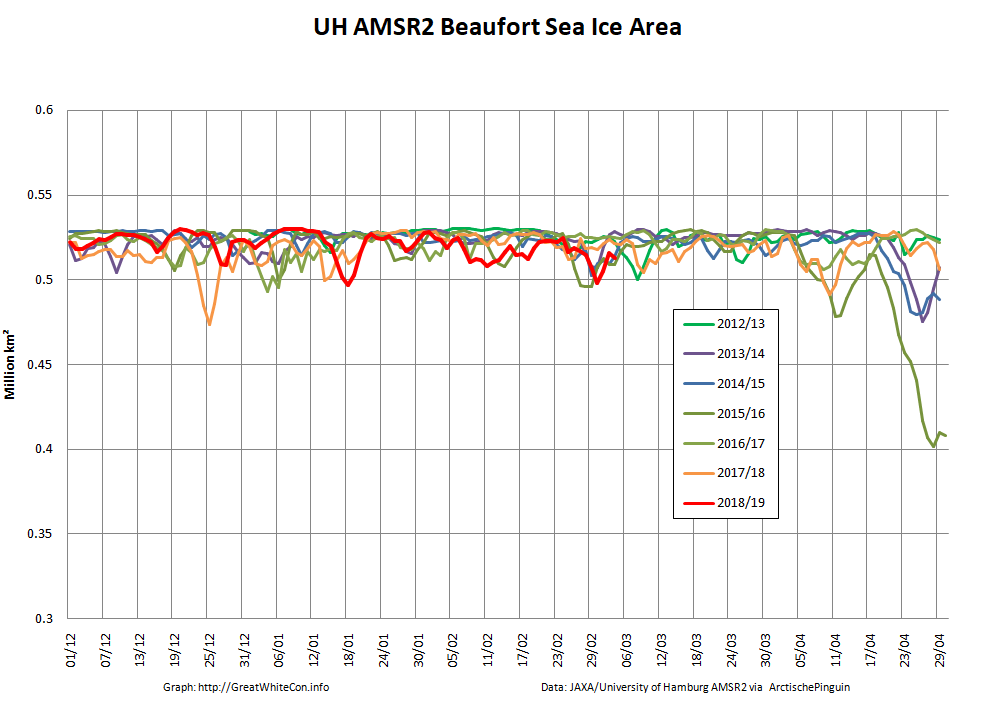
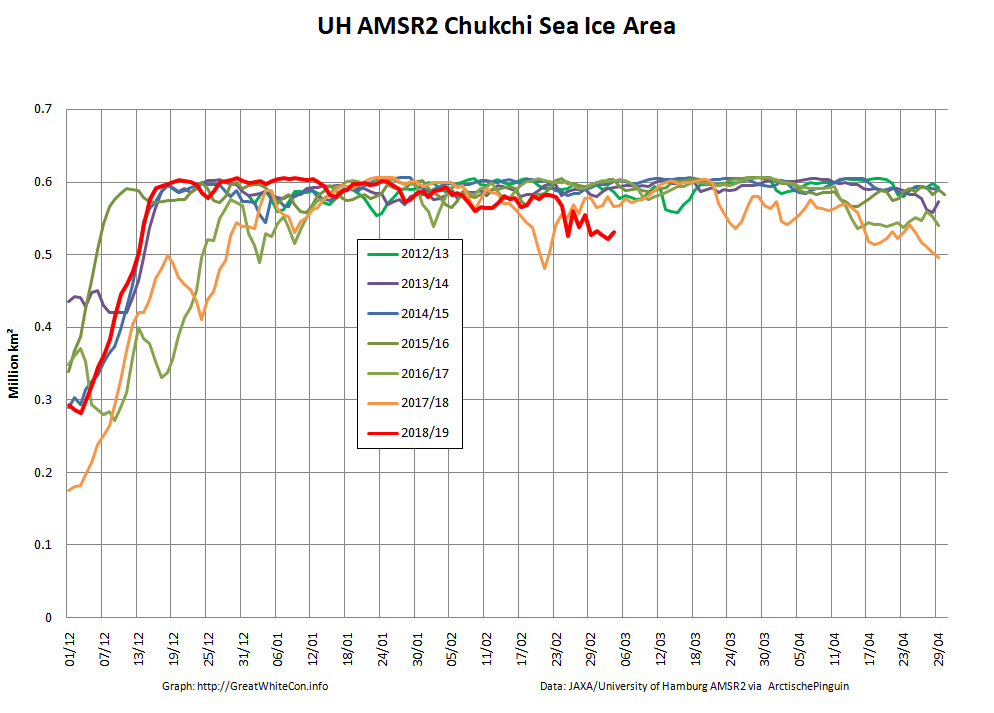
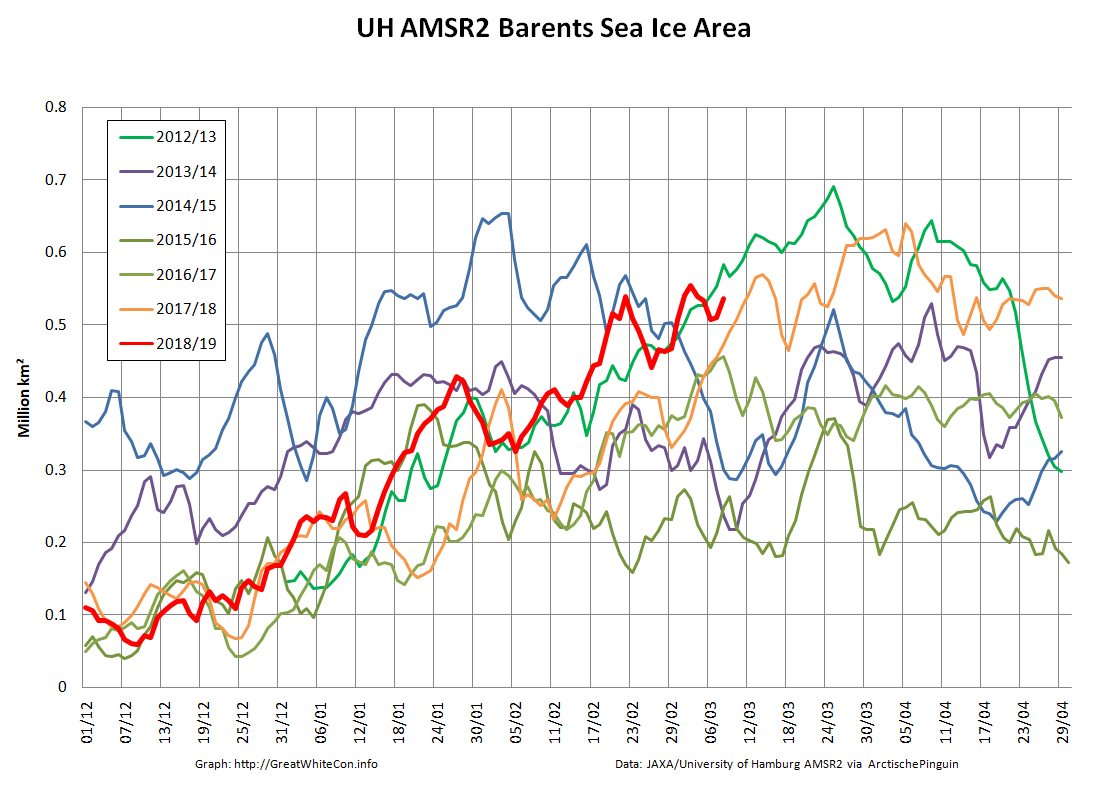
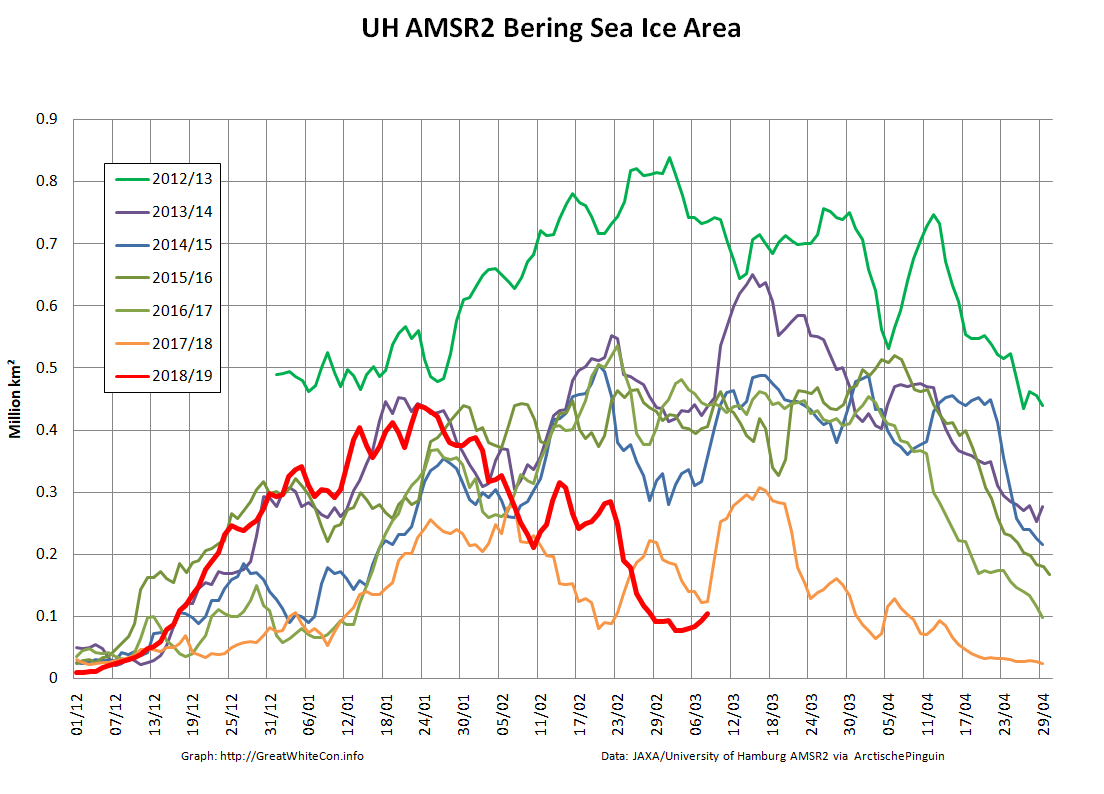
Whilst overall Arctic sea ice area is unremarkable for the current decade, sea ice area in the Bering Sea is remarkable low for the time of year! What’s more much like last year the Chukchi Sea is not currently full to overflowing with sea ice, and is also lowest for the date in the AMSR2 satellite records:
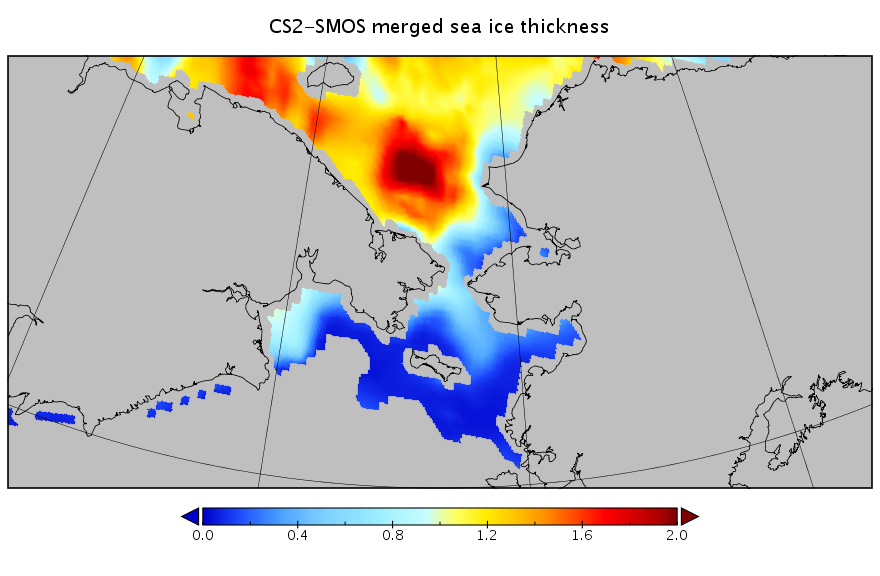
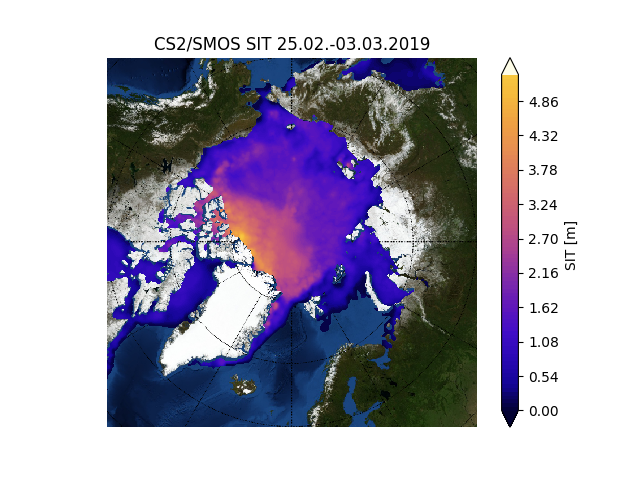
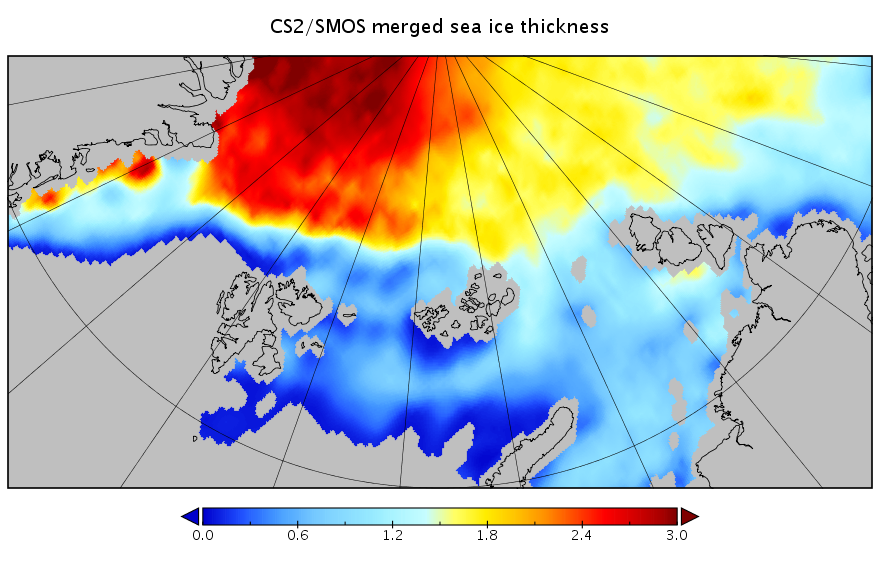
I’ve also been experimenting with the new gridded CryoSat-2/SMOS thickness data from the Finnish Meteorological Institute, which reveals this:
That’s a weekly overview dated February 24th, but it does perhaps explain how such a large area of sea ice could melt so swiftly?
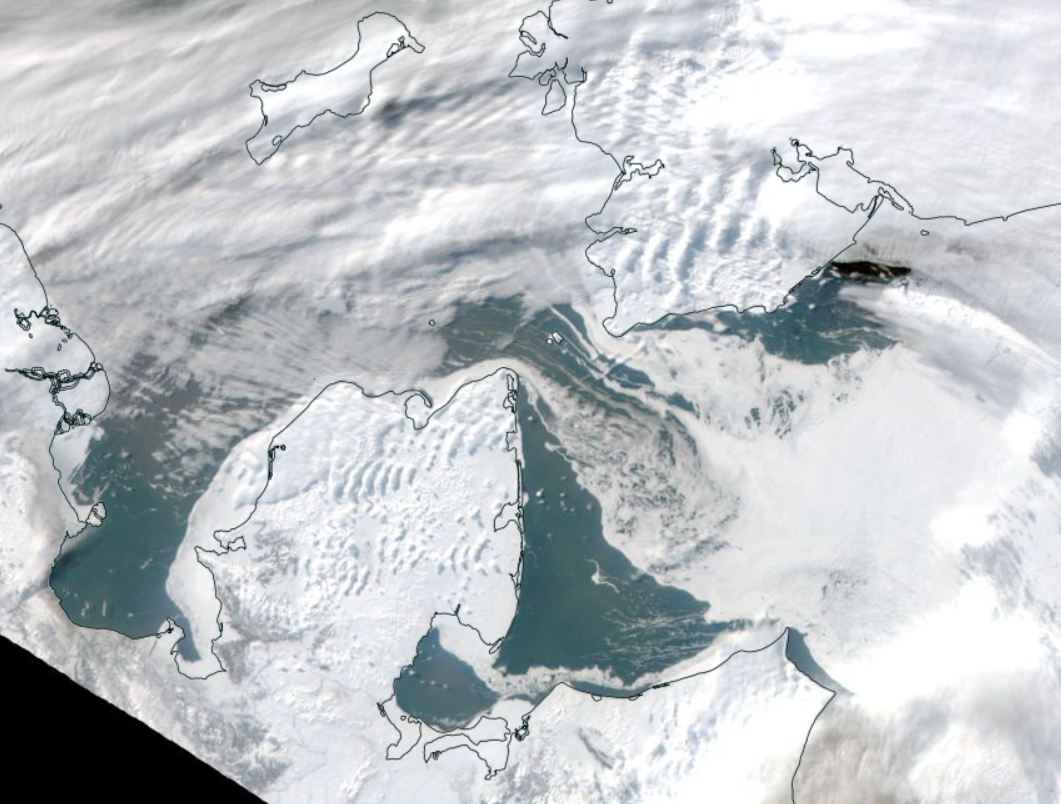
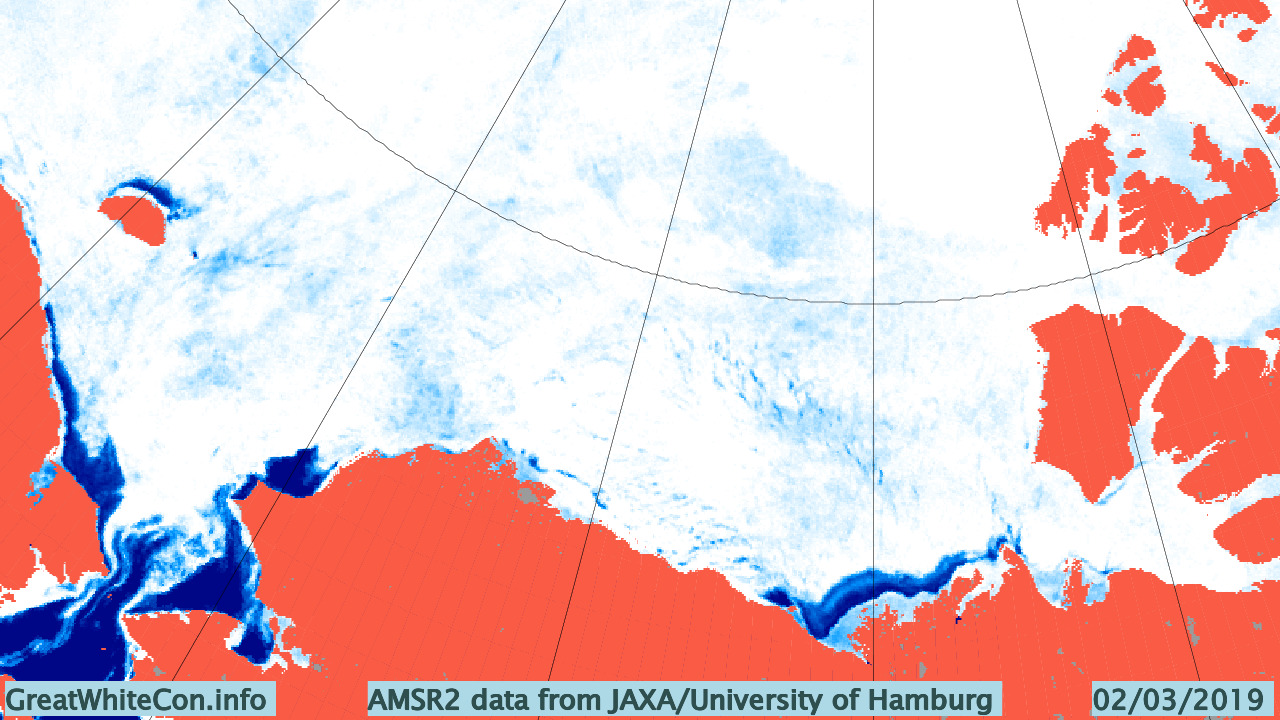
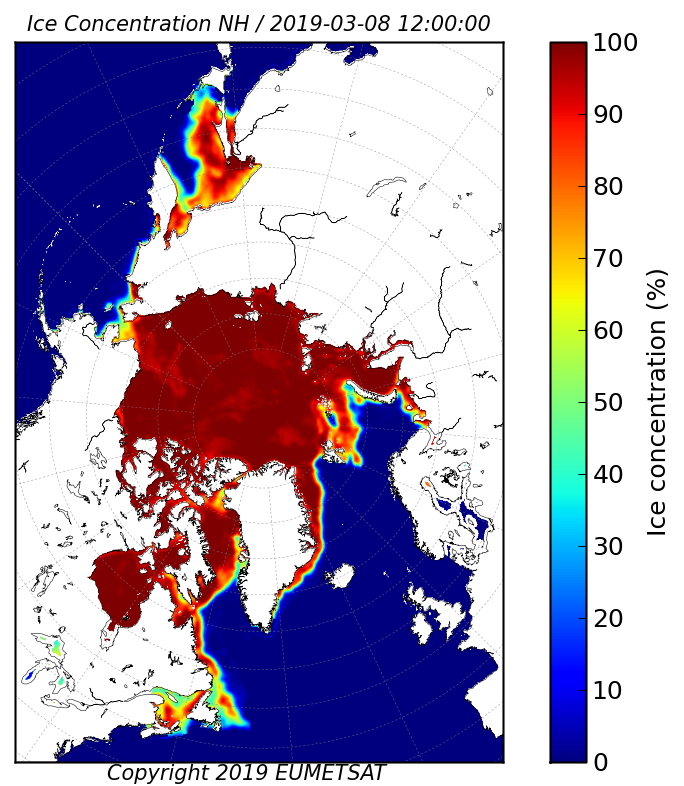
As luck would have it the skies are reasonably clear over the Bering Strait this morning (UTC). Here’s Terra’s view from on high of the current situation:
In addition, here is the underlying sea ice concentration data from the OSI-SAF:
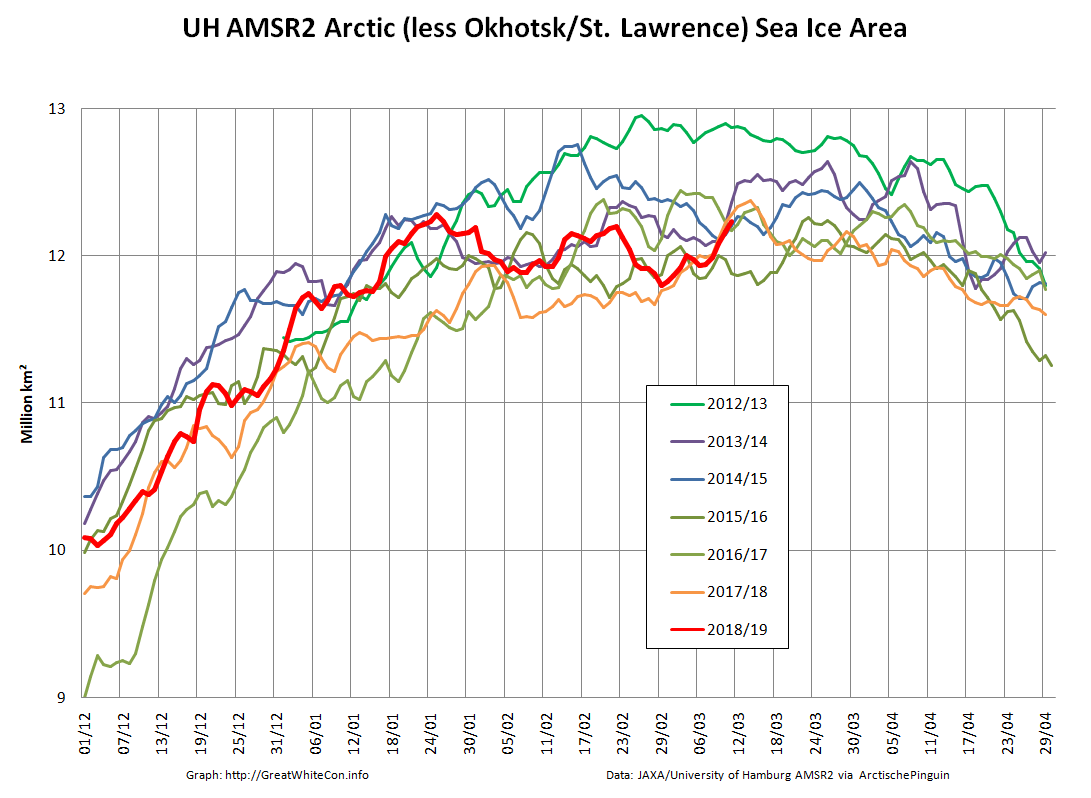
Since Michael is also asserting that there currently exists “the greatest February Arctic sea ice extent (according to DMI) in your blog’s history”, here’s Arctic sea ice area excluding the extremely peripheral Okhotsk and St. Lawrence regions:
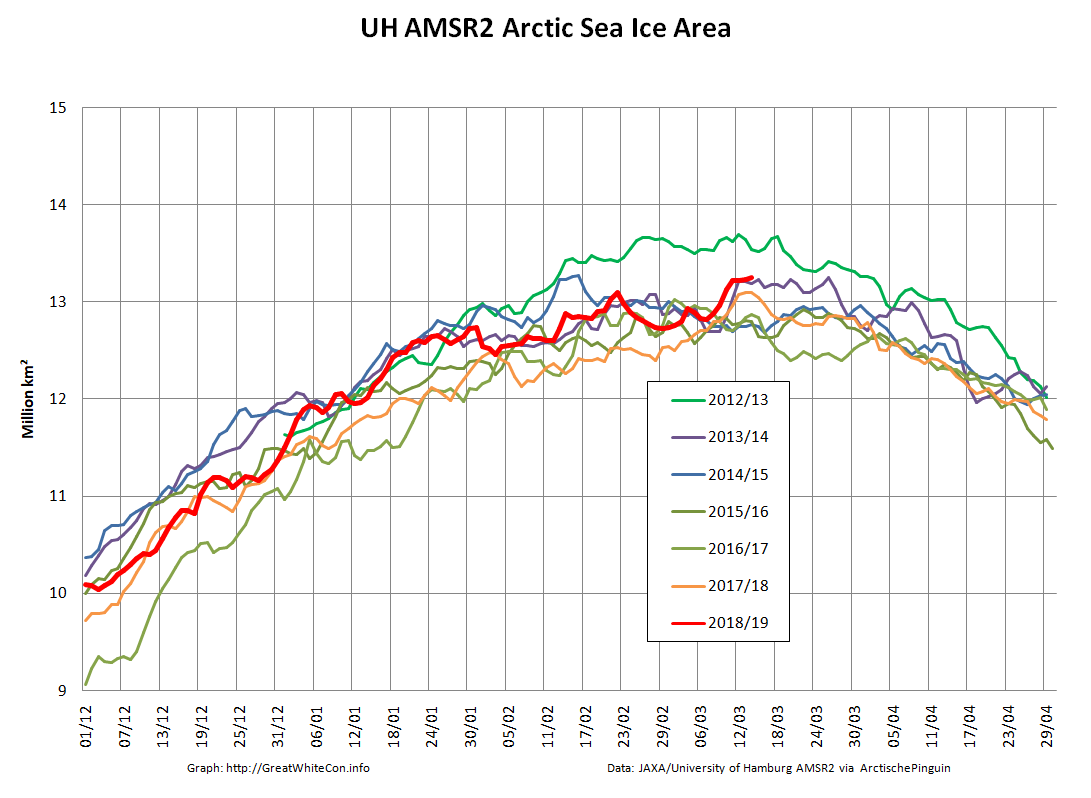
P.S. Wipneus’ Pi has processed the AMSR2 data now, and area shows another, more modest, decline today:
Both area and extent are still moving inexorably upwards:
The late February maximum still holds, on the high resolution numbers at least. The JAXA/VISHOP web site is down at the moment, so we’ll have to wait for an update to that particular metric, as well as a post weekend update to the NSIDC’s Charctic chart.
P.S. Jaxa is still down this afternoon, but here’s the latest from the NSIDC:
[Edit – March 13th]
Arctic wide area and extent have blasted past their respective late February maxima:
However Arctic sea ice area excluding the Okhotsk and St. Lawrence peripheral regions has still not exceeded the maximum formed on January 25th:
[Edit – March 14th]
This morning’s data reveal the first decline in extent for several days:
The (extremely!) tentative new maximum Arctic sea ice extent for 2019 is 13.89 million square kilometers on March 12th.
[Edit – March 15th]
JAXA is back!
UH AMSR2 confirms that extent is still declining:
[Edit – March 16th]
Arctic sea ice extent continues to decline, whilst area is still flatlining:
Meanwhile a look at freezing degree days based on the DMI’s dubiously weighted data for north of 80 degrees reveals the story of the freezing season. A historically warm start, but now back in amongst the pack of the 2010s:
[Edit – March 17th]
It looks as though there’ll be no going back from this. Arctic sea ice area is finally following extent’s decline in no uncertain terms:
Barring exceedingly unforeseen circumstances after this year’s “double top” that leaves the 2019 Arctic sea ice maximum extent numbers as follows:
UH/Wipneus AMSR2 – 13.89 million square kilometers on March 12th
JAXA/VISHOP AMSR2 – 14.27 million square kilometers on March 12th
NSIDC 5 day SSMIS – 14.78 million square kilometers on March 13th
[Edit – March 19th]
Arctic sea ice area has fallen off the proverbial cliff over the last few days. There can now be no doubt that the 2019 maximum extent has been reached:
That being the case, all other Arctic sea ice discussion for the month of March can now take place over at:
On March 13, 2019, Arctic sea ice likely reached its maximum extent for the year, at 14.78 million square kilometers (5.71 million square miles), the seventh lowest in the 40-year satellite record, tying with 2007. This year’s maximum extent is 860,000 square kilometers (332,000 square miles) below the 1981 to 2010 average maximum of 15.64 million square kilometers (6.04 million square miles) and 370,000 square kilometers (143,000 square miles) above the lowest maximum of 14.41 million square kilometers (5.56 million square miles) set on March 7, 2017. Prior to 2019, the four lowest maximum extents occurred from 2015 to 2018.
The date of the maximum this year, March 13, was very close to the 1981 to 2010 median date of March 12.
Please note this is a preliminary announcement of the sea ice maximum. At the beginning of April, NSIDC scientists will release a full analysis of winter conditions in the Arctic, along with monthly data for March.
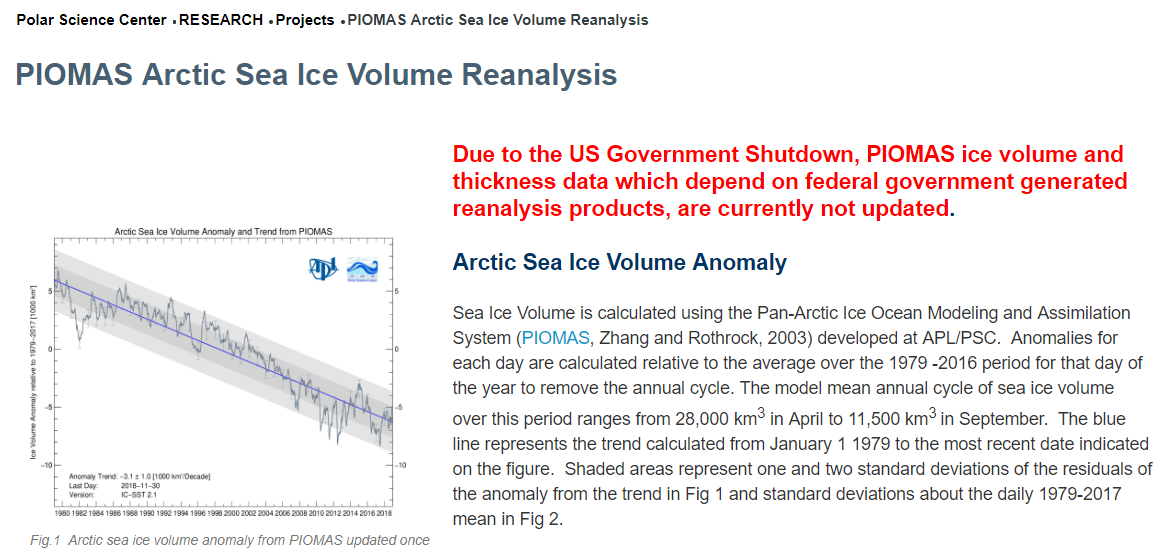
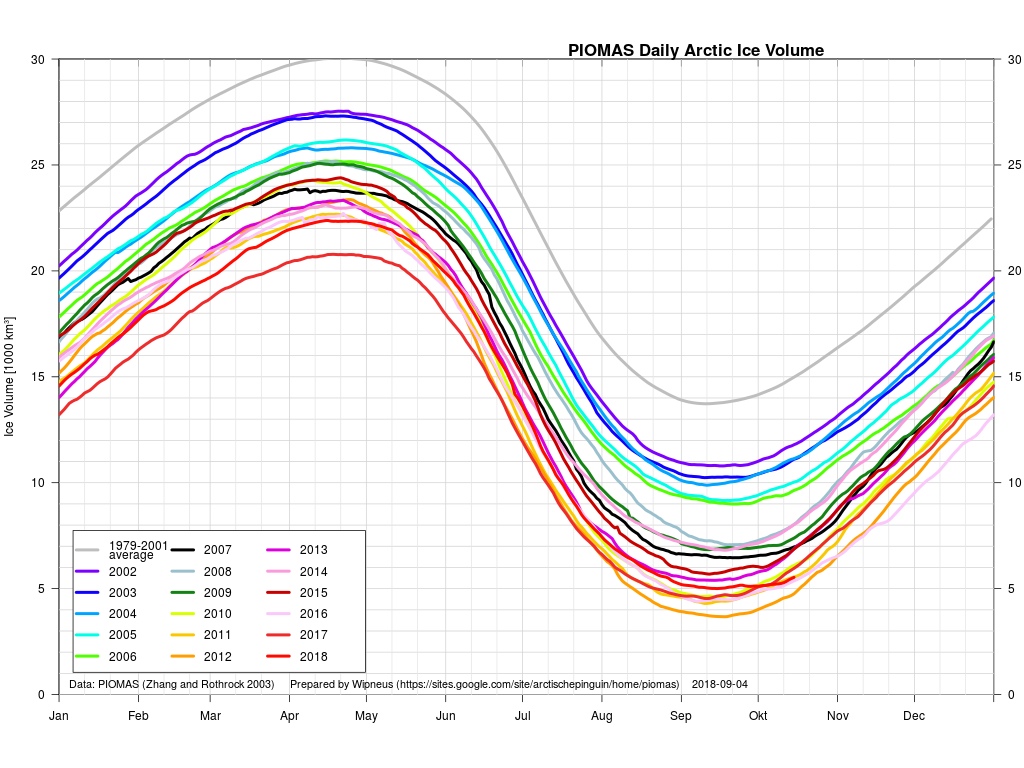
We generally write our periodic reports on the state of Arctic sea ice around the time the PIOMAS volume numbers are published. It seems as though we’ll have a long wait for that to happen at the moment though. According to The Economist today:
America’s government shutdown has become the longest in history. Hundreds of thousands of federal workers remain either stuck at home or forced to work without pay. To reopen the government President Donald Trump is demanding $5.7bn for his border wall. Nancy Pelosi, who presides over the most polarised House of Representatives in recent memory, does not want to give it to him.
Due to the US Government Shutdown, PIOMAS ice volume and thickness data which depend on federal government generated reanalysis products, are currently not updated.
Instead of PIOMAS, let’s start instead with the January 2019 edition of the National Snow and Ice Data Center’s Arctic Sea Ice News:
As 2018 came to a close, Arctic sea ice extent was tracking at its third lowest level in the satellite record, while sea ice in the Antarctic remained at historic lows. Slightly faster growth in the first few days of the new year, mostly in the Pacific sea ice areas, has the daily sea ice extent at fifth lowest as of this post.
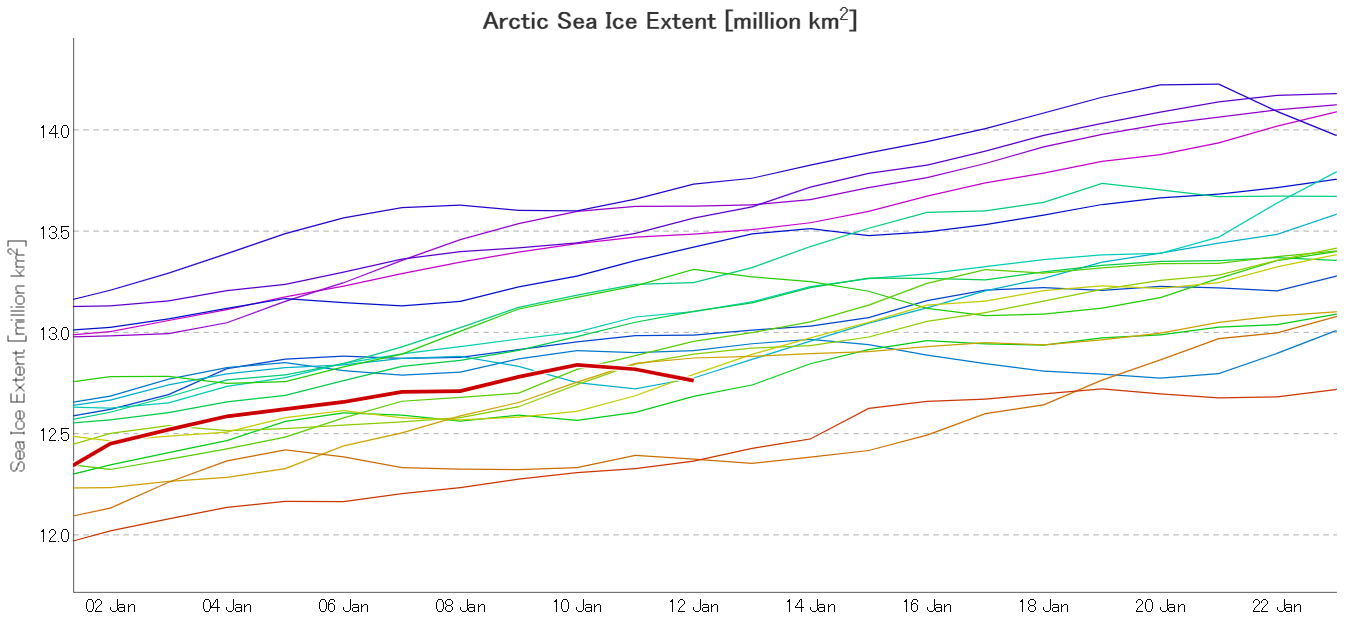
Now let’s take a look at our favourite high resolution AMSR2 area and extent metrics:
You can see that towards the end of December Arctic sea ice extent was verging on lowest for the date, since when it has risen quickly to reach highest for the date in the brief AMSR2 records a few days ago.
The NSIDC also mention the US Government shutdown:
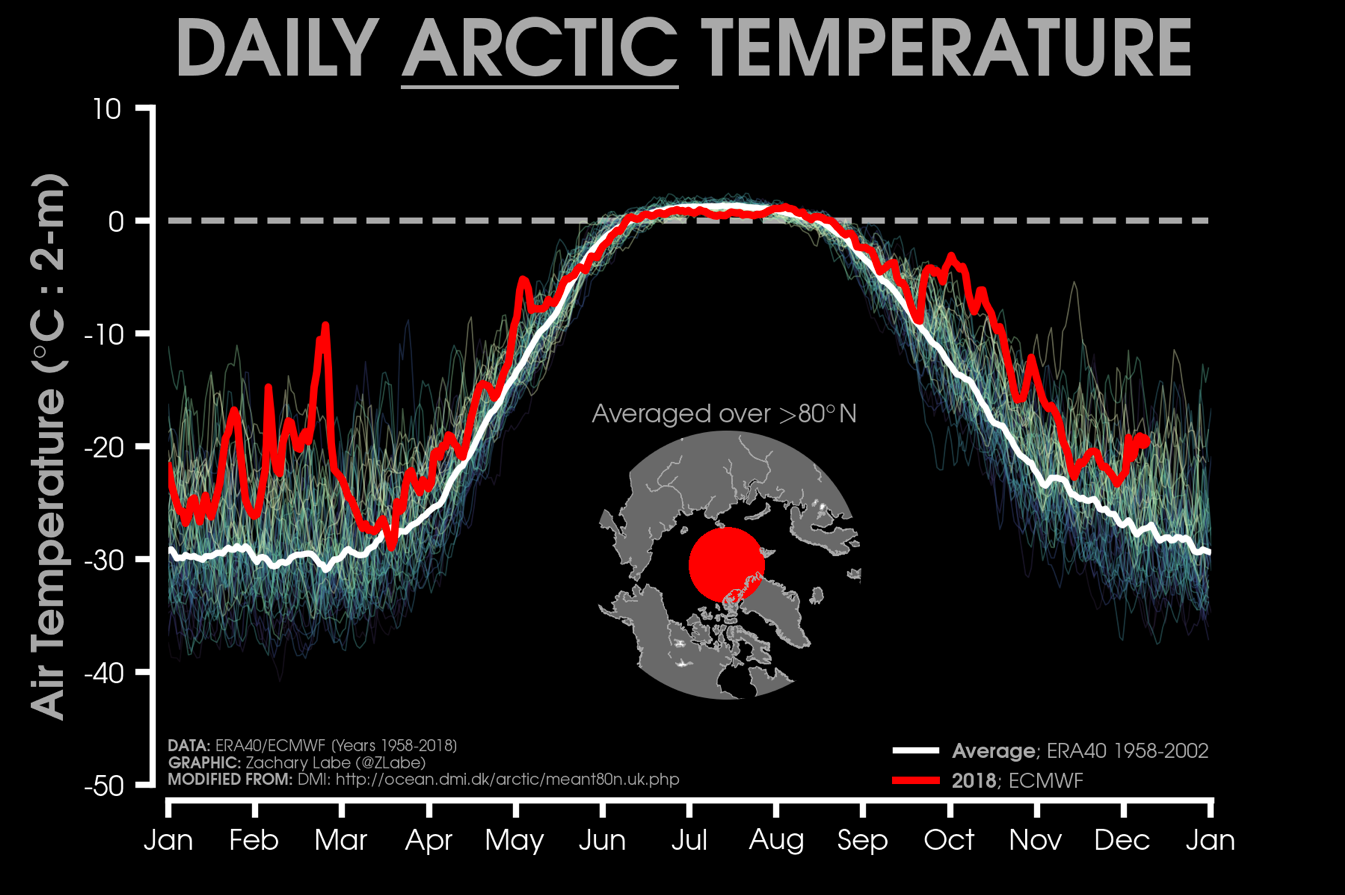
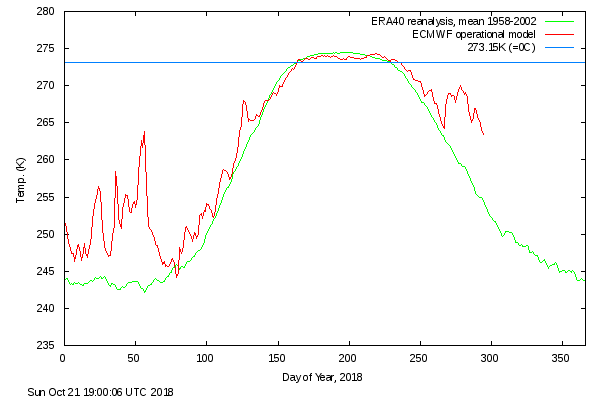
Unfortunately, as a result of the partial government shutdown, we are unable to access the National Oceanic and Atmospheric Administration (NOAA) pages to retrieve information on atmospheric air temperatures and sea level pressure patterns. Instead, we turn to daily (2 meters above the surface) mean air temperatures north of 80 degrees North from the European Centre for Medium-Range Weather Forecasts (ECMWF) operational model. This analysis shows that air temperatures remained above the 1958 to 2002 average for all of December.
That brings us on to our Arctic freezing degree days graph, based on DMI data:
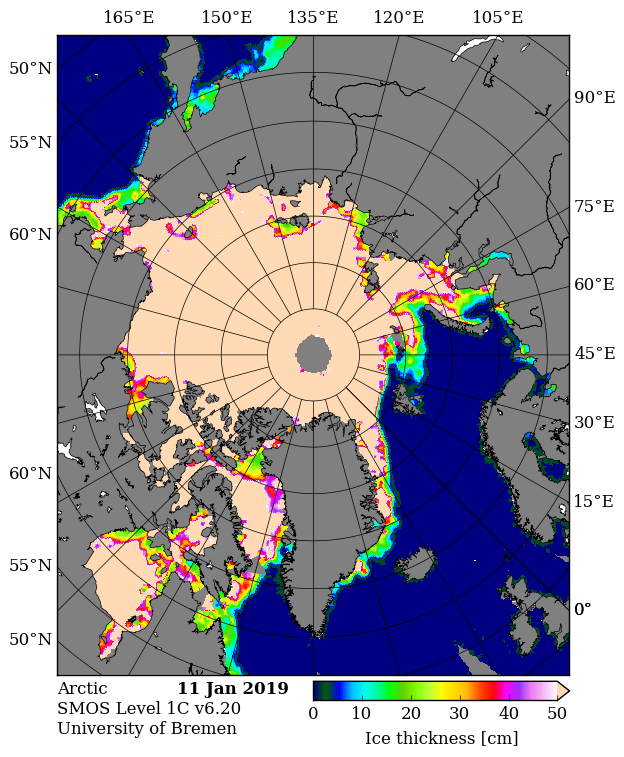
After a very slow start to the freezing season the FDD numbers are now vying for second place with last year, behind the astonishingly warm winter of 2016/17. In the absence of the PIOMAS volume numbers we can at least take a look at sea ice thickness. Here’s CryoSat-2:
All those sources seem to be agreed that large areas of both the Barents and Kara Seas are currently covered by young thin ice. Finally, for the moment at least, let’s take a look at some extracts from the NSIDC’s review of 2018:
January 2018 began the year with record low sea ice extents for the Arctic as a whole.
The seasonal maximum, reached on March 17, 2018, was the second lowest in the satellite record. While low extent persisted through April and May, sea ice loss during early summer was unremarkable despite above average 925 hPa air temperatures over the Arctic Ocean and Eurasia.
Air temperatures over the Arctic Ocean in July were below average, followed by above average temperatures in August. In fact, on average, August temperatures were higher than July temperatures in 2018. This is highly unusual in the Arctic and something not seen in at least 40 years.
The September 2018 seasonal minimum extent ended up slightly above the long-term linear trend line, tying with 2008 for the sixth lowest in the satellite record. After the minimum, the ocean was slow to freeze up, and October sea ice extent ended up as the third lowest. However, ice growth was very rapid in November, such that November 2018 extent approached the interquartile range of the 1981 to 2010 median. Nevertheless, large amounts of open water remained in the Barents and Chukchi Seas. By the end of December, ice conditions in the Chukchi Sea were back to average, while extent remained unusually low in the Barents Sea.
Coverage of old ice (greater than 4 years old) over the Arctic continued to decline. Such old ice covers only 5 percent of the area it used to in 1980s.
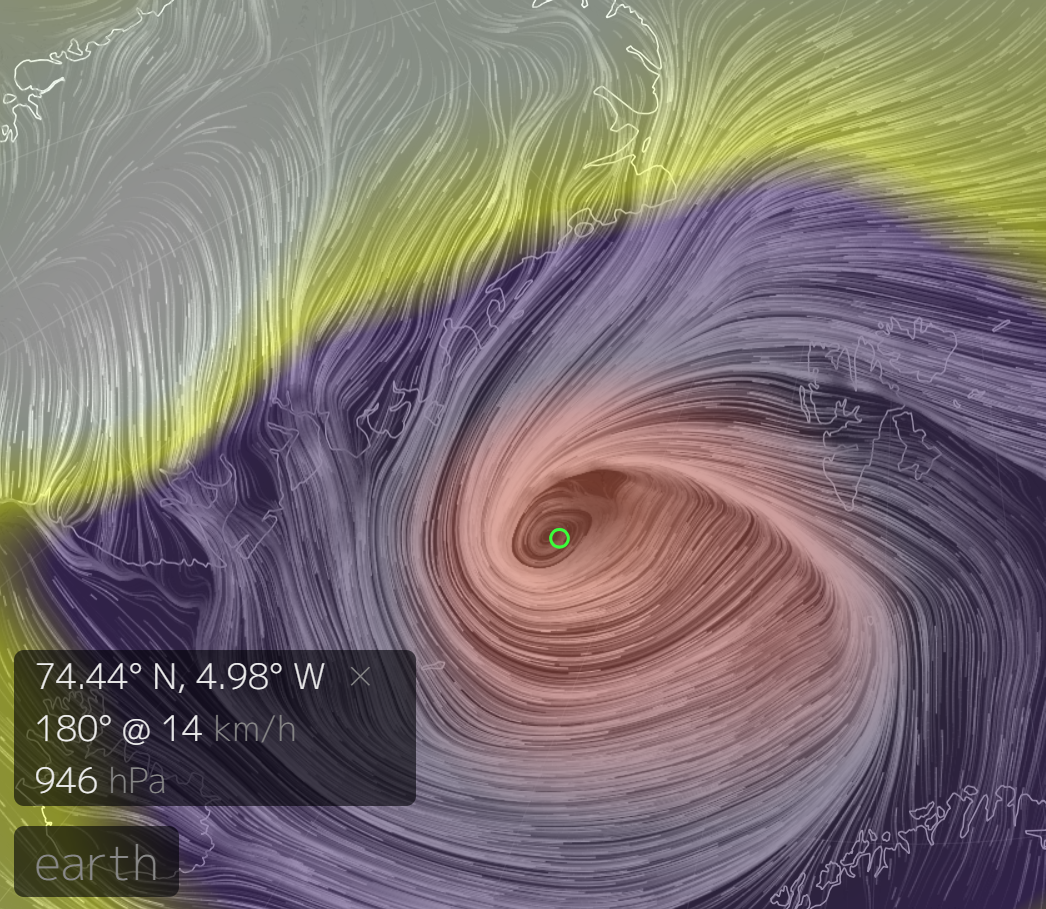
[Edit – January 13th]
Arctic sea ice area and extent have both been falling over the last few days, possibly as a result of the recent cyclone which created strong northerly winds in the Fram Strait. This is from Earth at 09:00 UTC on January 10th, showing a MSLP of 946 hPa:
Here’s what used to be referred to as JAXA extent:
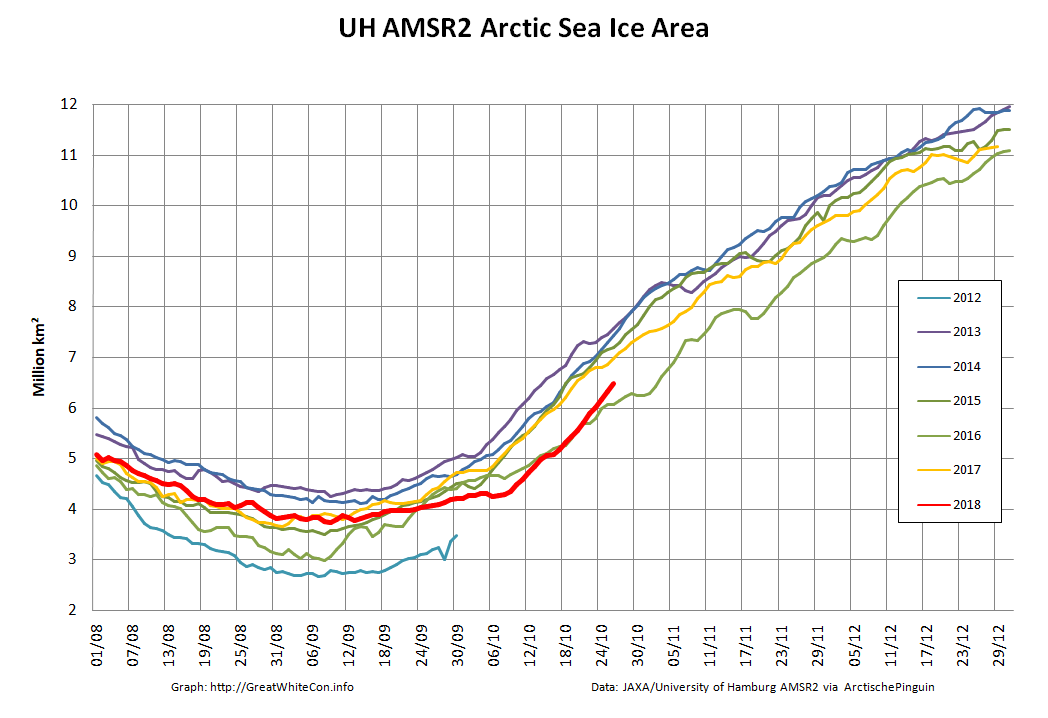
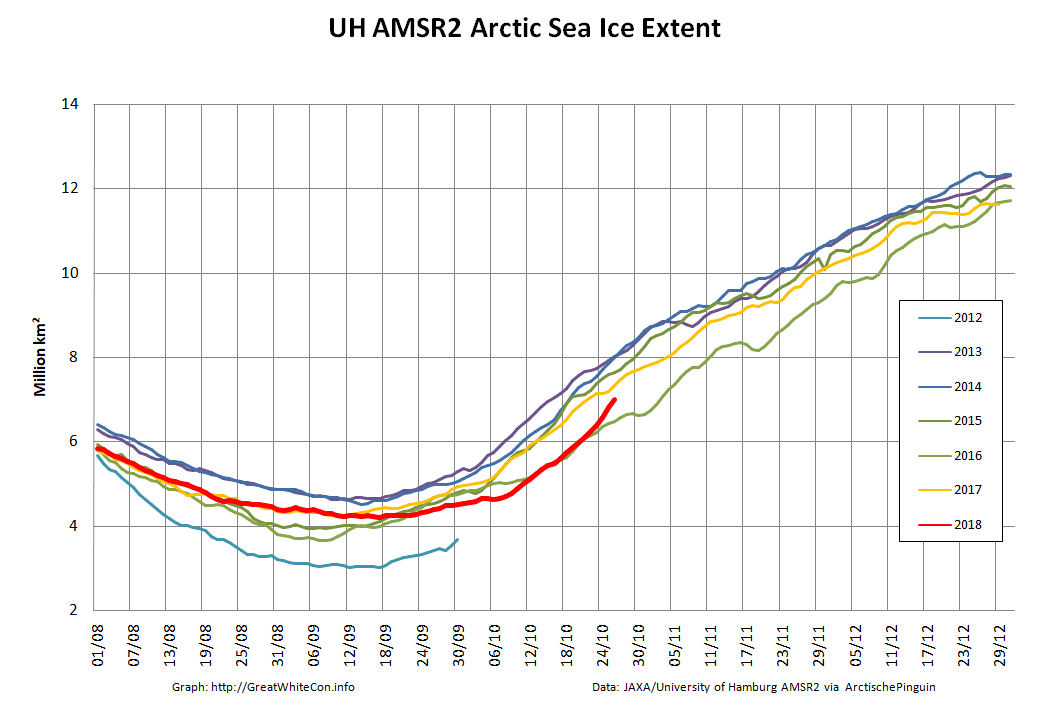
A somewhat belated start to our October 2018 coverage, but firstly please take a look at this graph:
Following a remarkably sluggish refreeze this year JAXA extent is currently the lowest for the date since their records began. Meanwhile Wipneus has just released his mid month PIOMAS volume update on the Arctic Sea Ice Forum:
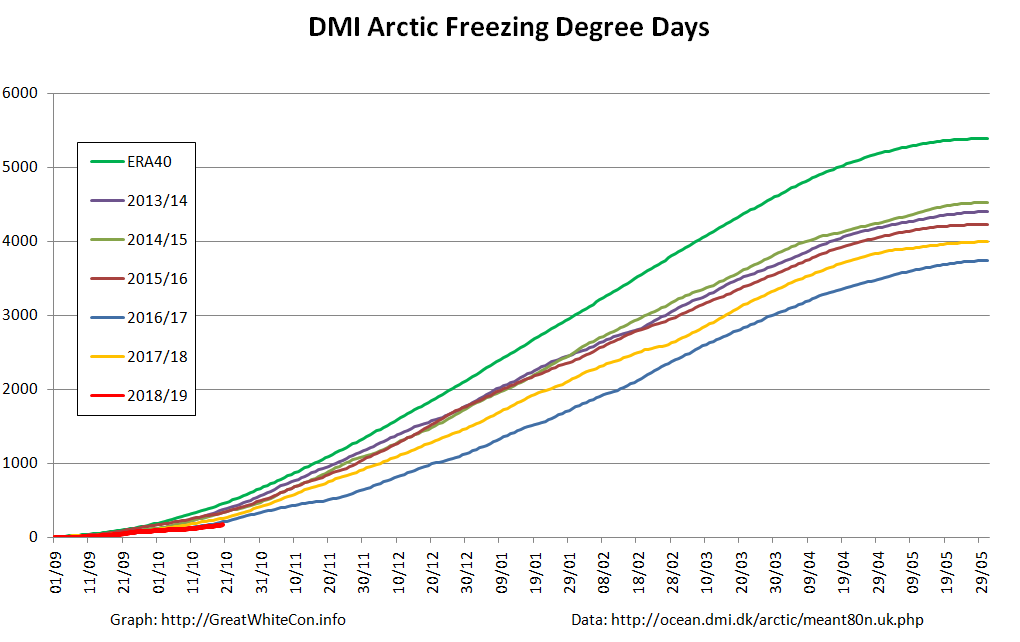
That graph reveals that Arctic sea ice volume has been increasing much more slowly than usual during October. The fact that the DMI freezing degree days graph is currently below all previous years in their records no doubt has something to do with that:
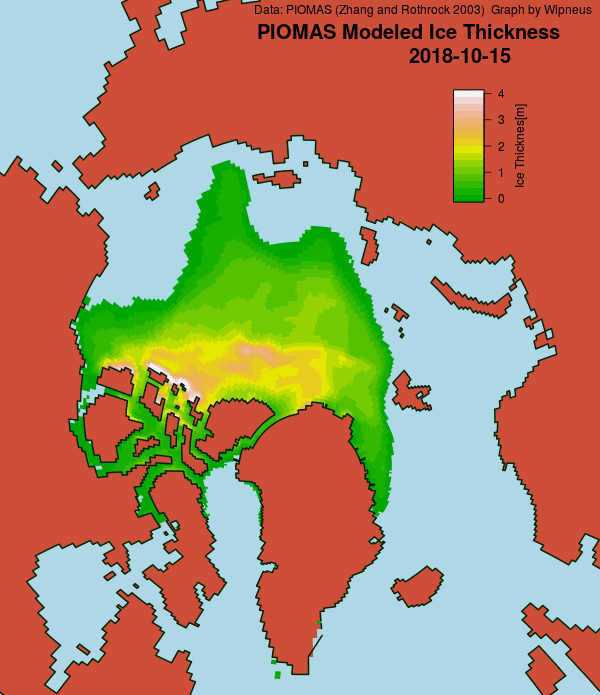
Wipneus has also updated the mid month PIOMAS gridded thickness map:
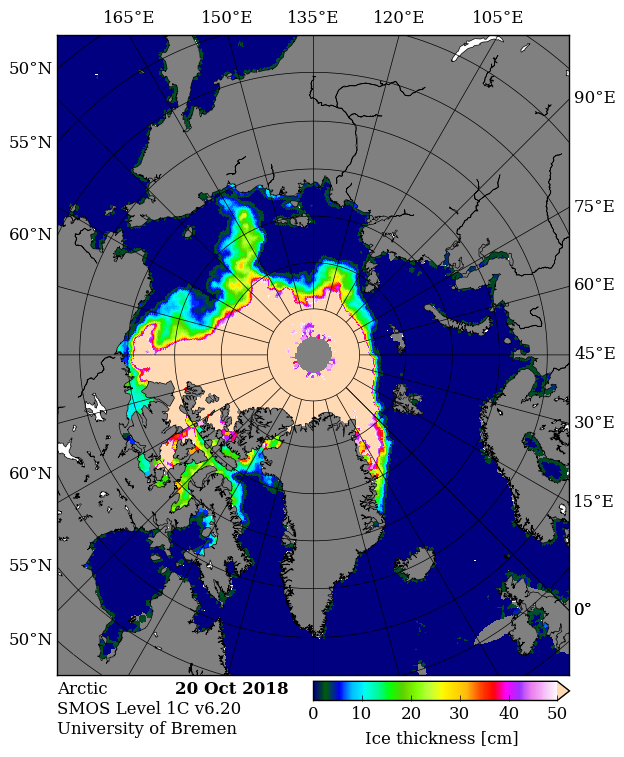
For a handle on the areas of thinner ice where refreezing is taking place around the periphery of the pack, here’s the latest SMOS map:
Finally, for the moment at least, here’s our favourite high resolution AMSR2 area and extent metrics based on JAXA data processed by the University of Hamburg to produced gridded concentration which is then used to derive area and extent by the inimitable Wipneus once again:
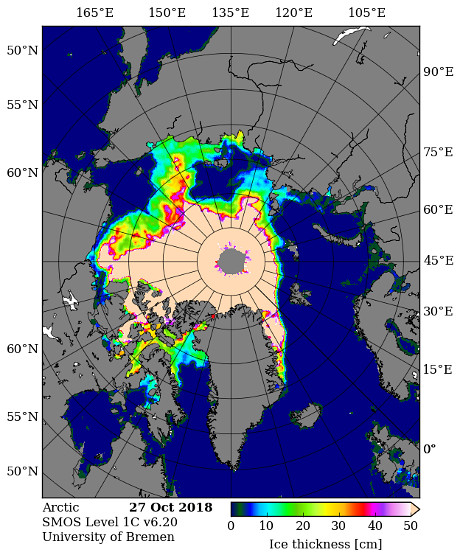
[Edit – October 28th]
Here’s the latest thickness maps from SMOS:
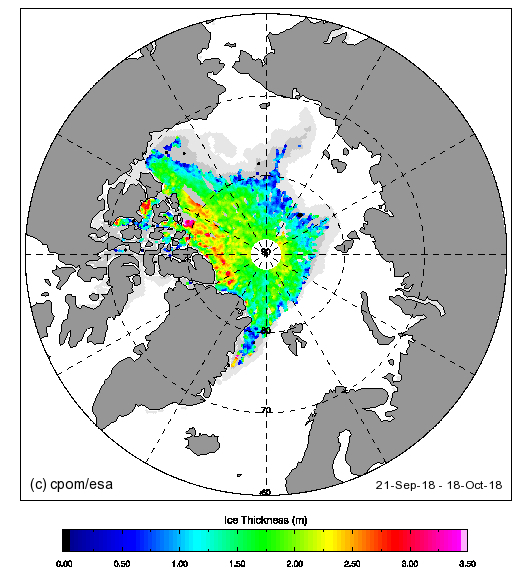
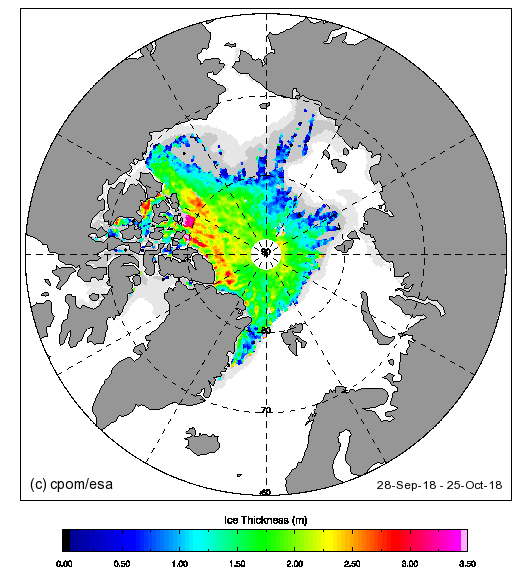
and CryoSat-2:
There’s been a recent rapid refreeze, leaving large areas of thin ice around the edges of the central pack:
This website uses cookies to improve your experience. We'll assume you're ok with this, but you can opt-out if you wish. Cookie settingsACCEPT
Privacy & Cookies Policy
Privacy Overview
This website uses cookies to improve your experience while you navigate through the website. Out of these, the cookies that are categorized as necessary are stored on your browser as they are essential for the working of basic functionalities of the website. We also use third-party cookies that help us analyze and understand how you use this website. These cookies will be stored in your browser only with your consent. You also have the option to opt-out of these cookies. But opting out of some of these cookies may affect your browsing experience.
Necessary cookies are absolutely essential for the website to function properly. This category only includes cookies that ensures basic functionalities and security features of the website. These cookies do not store any personal information.
Any cookies that may not be particularly necessary for the website to function and is used specifically to collect user personal data via analytics, ads, other embedded contents are termed as non-necessary cookies. It is mandatory to procure user consent prior to running these cookies on your website.