I only found out about this webinar after it had already started. My Arctic alter ego somewhat cheekily suggested to the Arctic Research Consortium of the United States (ARCUS for short) that our research into waves in the Arctic was ahead of theirs, and was rather surprised when they agreed with “her”!
You are! Happening now, join us here: https://t.co/nDuhoT8LRw or watch posted recording on our youtube channel in about a week.
Fortunately the “Ocean Waves in the New Arctic” webinar was recorded, and here it is in its entirety:
See if you can spot the question “Snow White” asked?
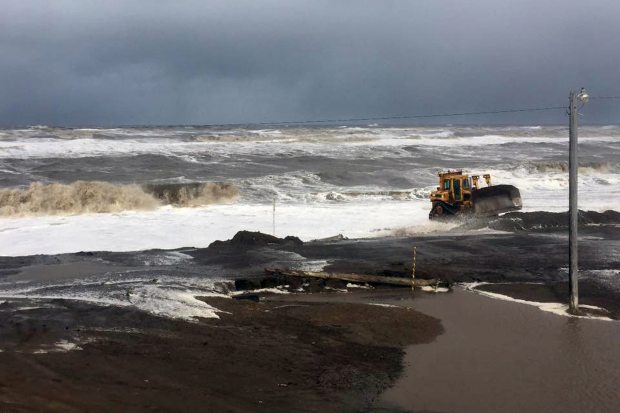
Amongst other things, Jim mentioned in his talk coastal erosion due to increased wave action. That included a flooding event at Utqiaġvik (Barrow) in 2017. Here’s what happened during a similar event there in 2015:
Photograph by Brittni Driver via Alaska Dispatch News
Jim also mentioned the erosion of the permafrost bluff at Drew Point, exacerbated by increasing wave action. According to a recent article on that topic:
Eroding permafrost coasts are likely indicators and integrators of changes in the Arctic System as they are susceptible to the combined effects of declining sea ice extent, increases in open water duration, more frequent and impactful storms, sea-level rise, and warming permafrost.
Our results show that mean annual erosion for the 2007–2016 decade was 17.2 m yr−1, which is 2.5 times faster than historic rates, indicating that bluff erosion at this site is likely responding to changes in the Arctic System.
Here’s a video of permafrost disappearing into the Beaufort Sea in 2008:
[Edit – March 1st]
A slightly less technical video from the University of Washington featuring Jim Thomson and some big waves in the New Arctic:
A couple of years ago I was asked to provide “a handful of things [you] will be keeping an eye on over the next few months to judge how ‘good’ or ‘bad’ the melt is going?”
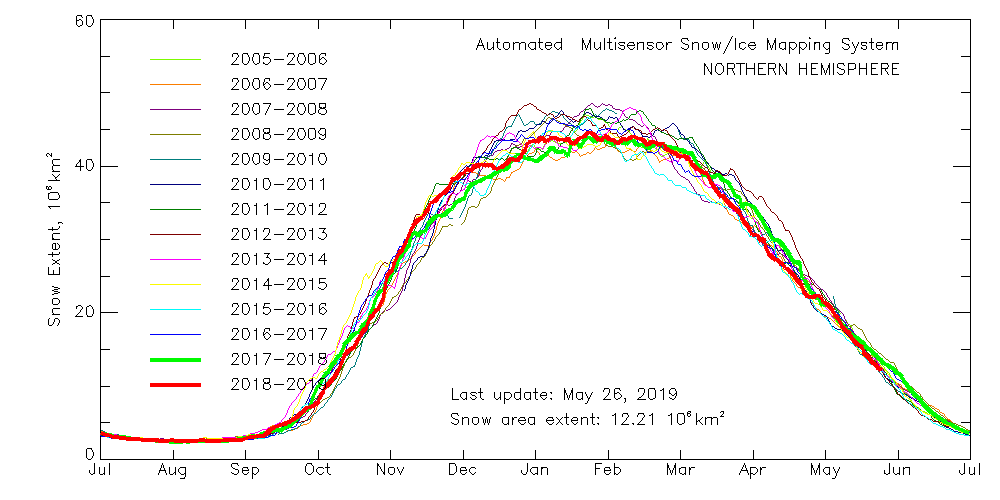
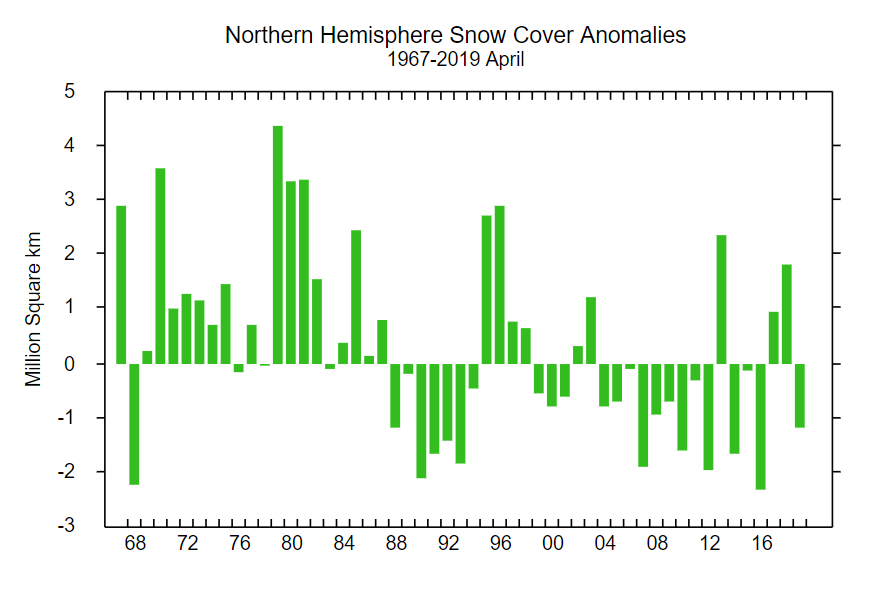
That suggests snow cover over land is close to recent lows, which is confirmed by the Rutgers University snow cover anomaly graph for April:
This year is anomalously low, but not by as much as 2012 and 2016. For completeness, here also is the current US National Ice Center snow cover map:
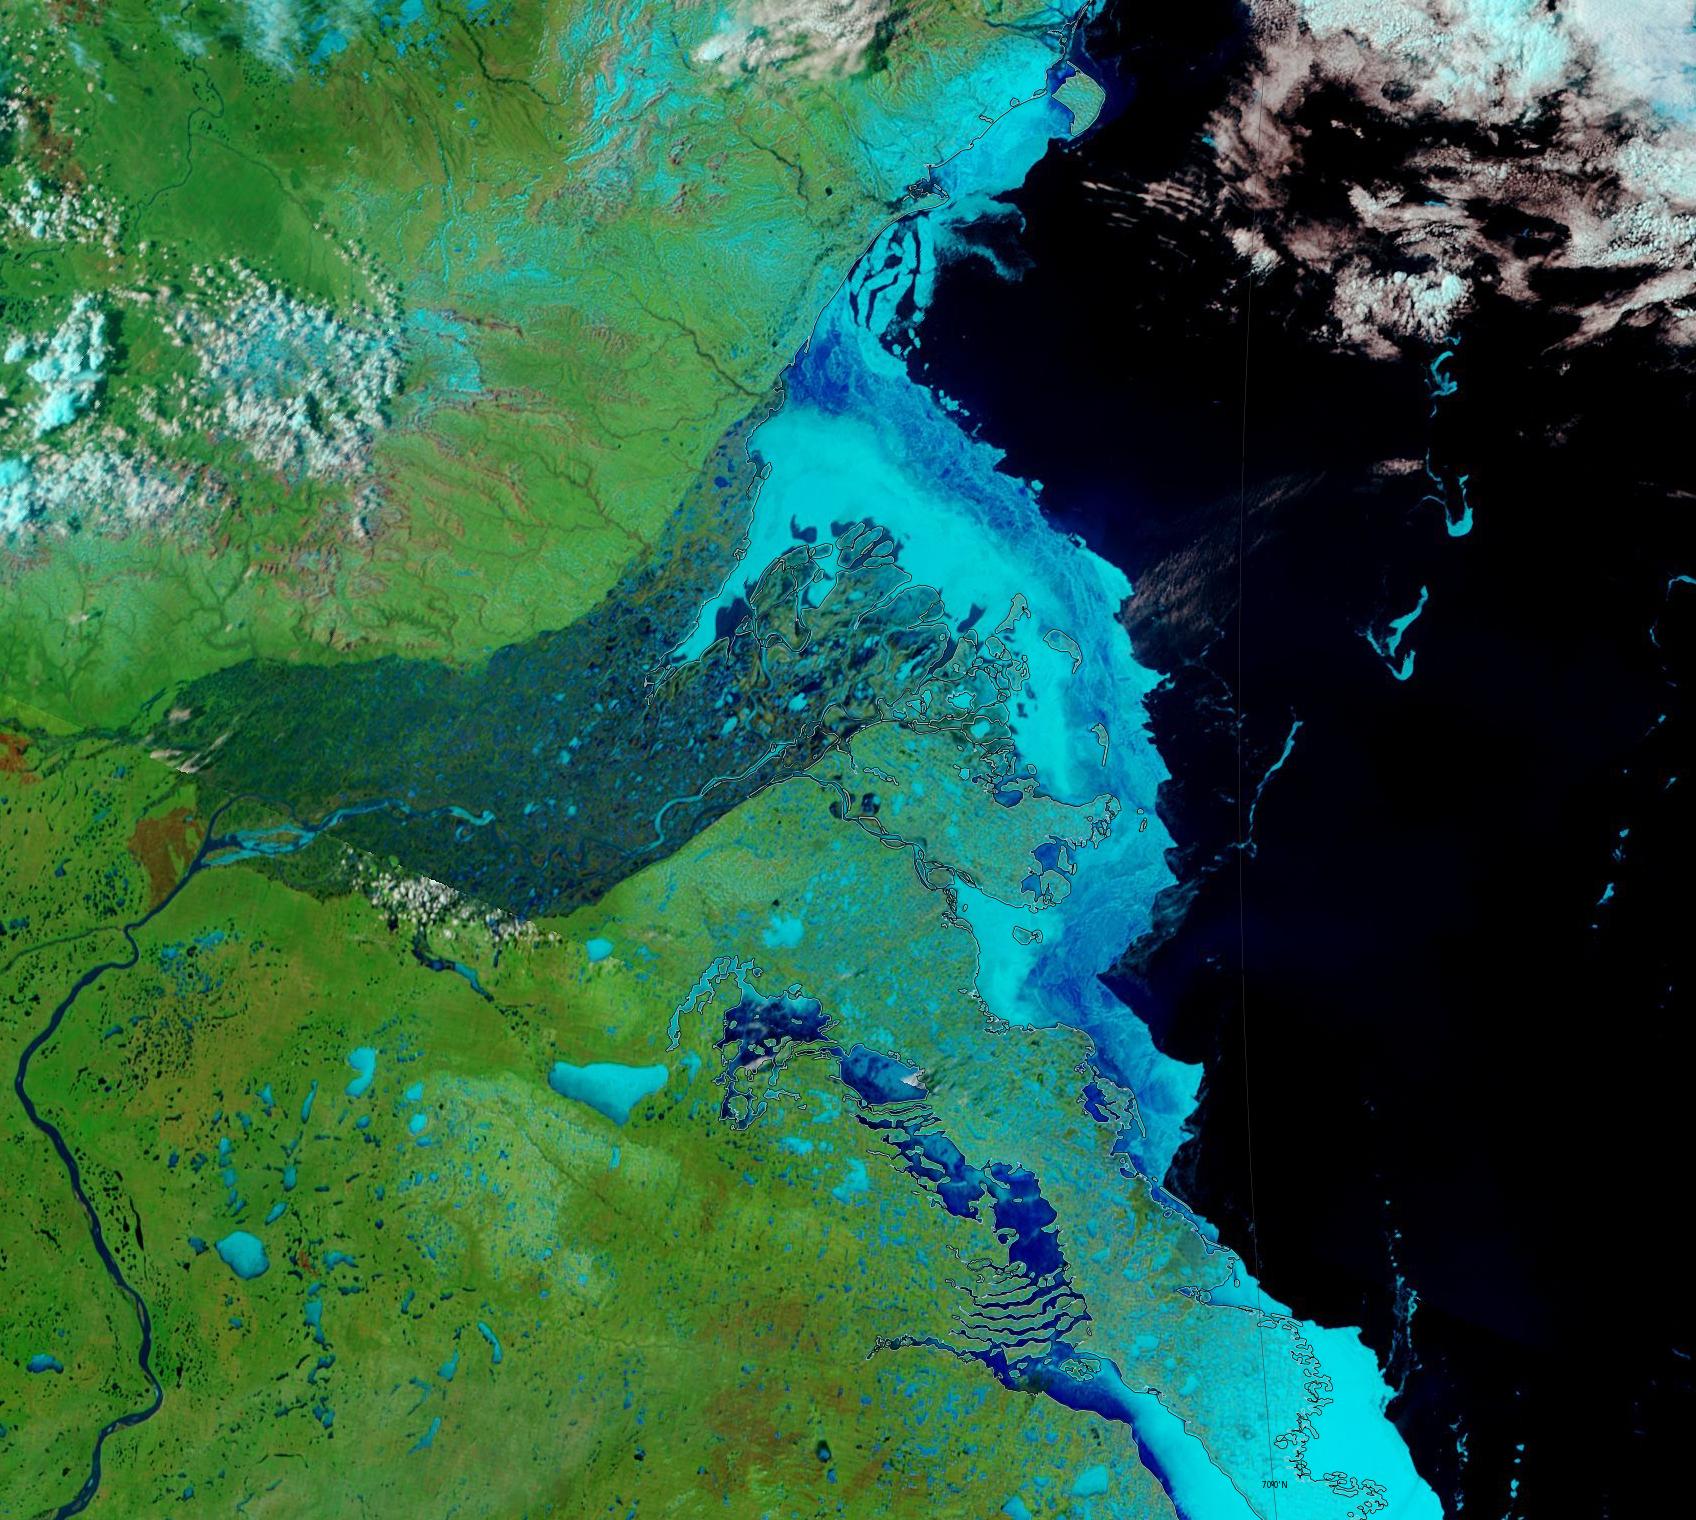
Moving on to melt ponds, there are plenty to be seen on the fast ice around the Mackenzie river delta:
NASA Worldview “false-color” image of the Mackenzie Delta on May 24th 2019, derived from the MODIS sensor on the Terra satellite
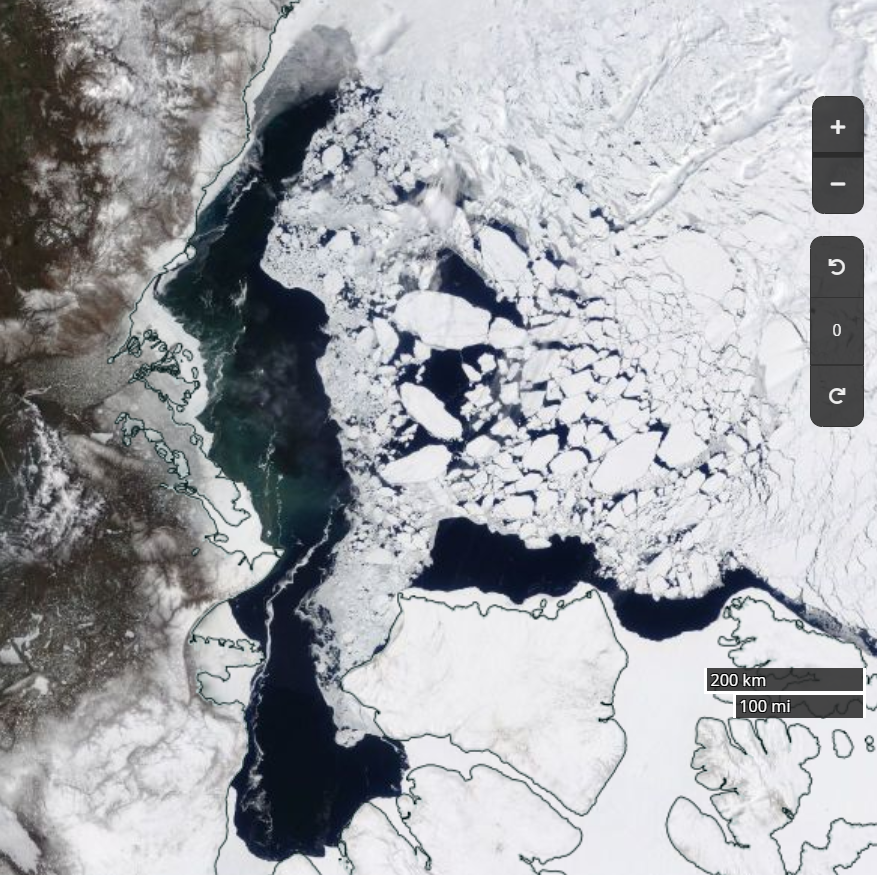
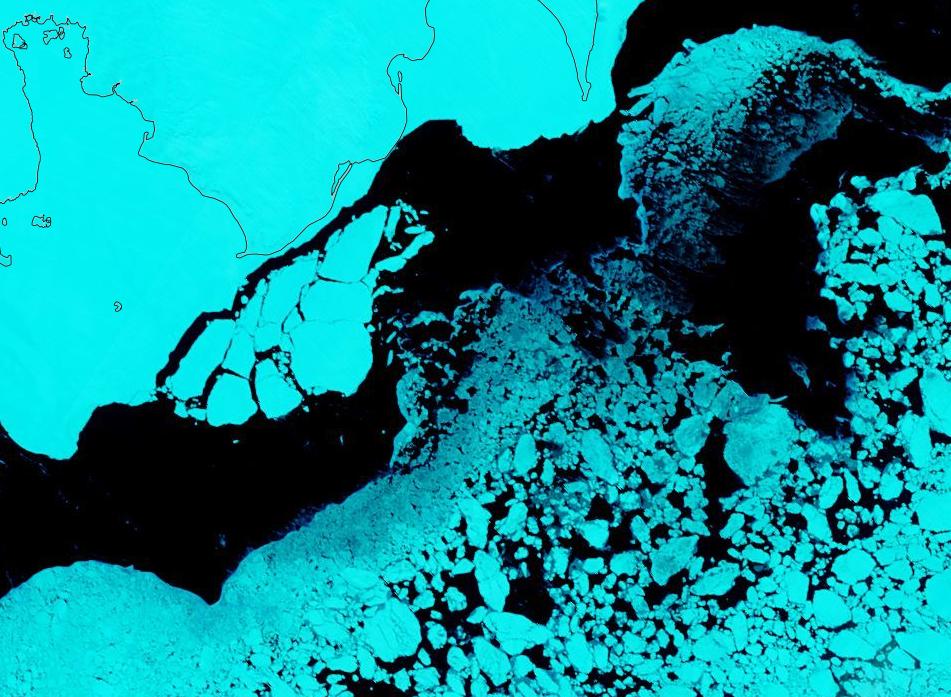
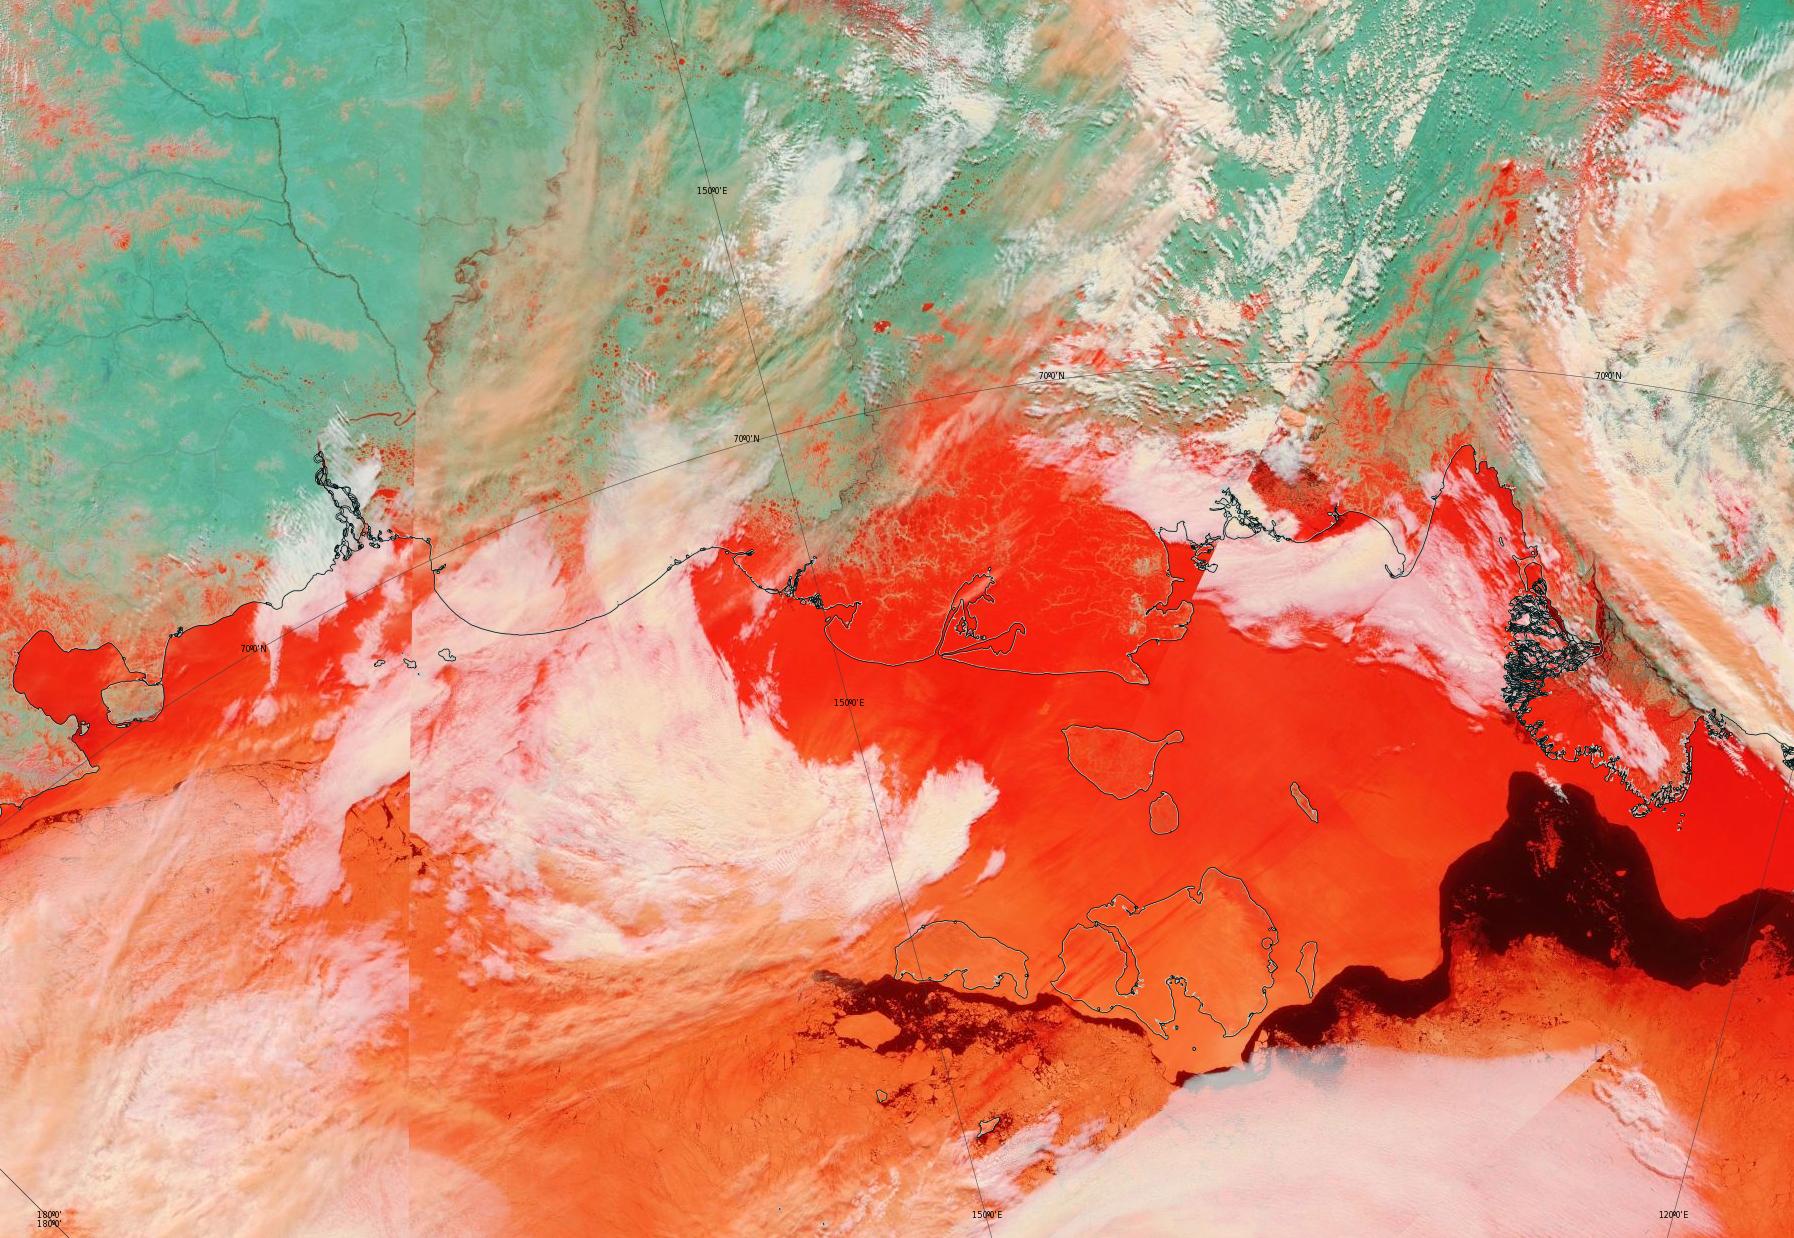
There also seem to be signs of some at a higher latitude off Ostrov Kotelny in the New Siberian Islands:
NASA Worldview “false-color” image of the Laptev Sea on May 23rd 2019, derived from the MODIS sensor on the Terra satellite
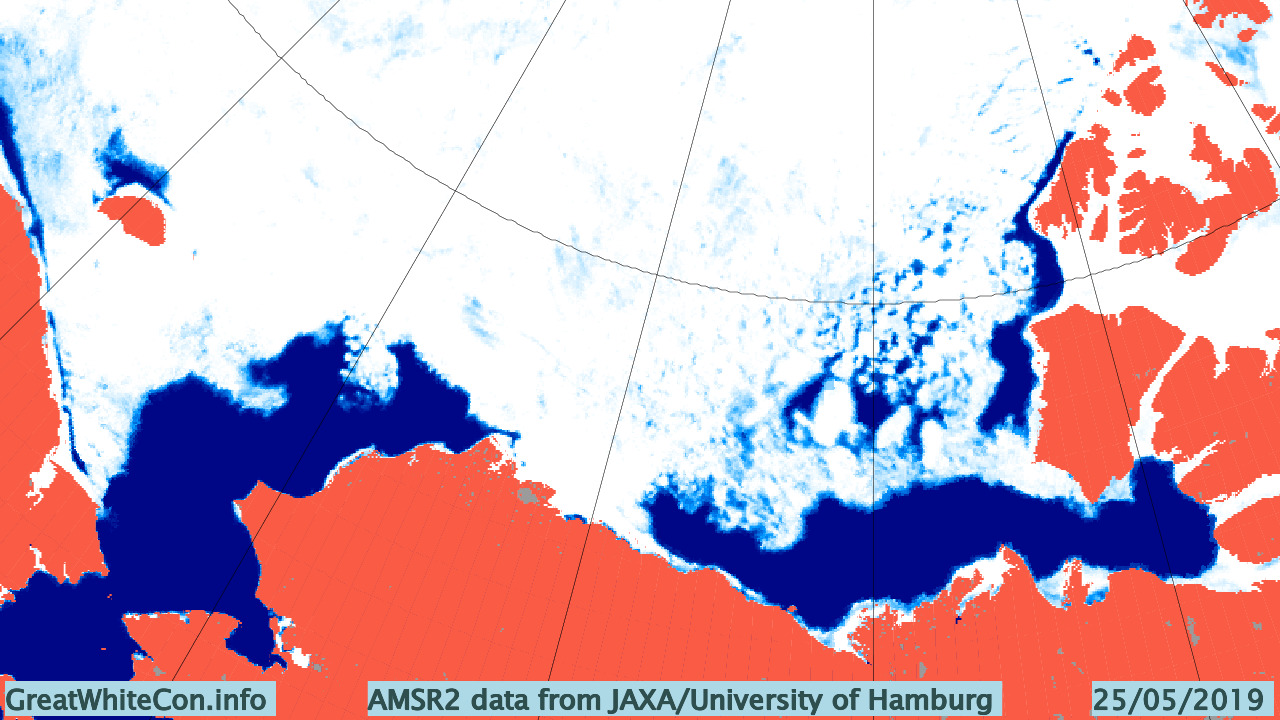
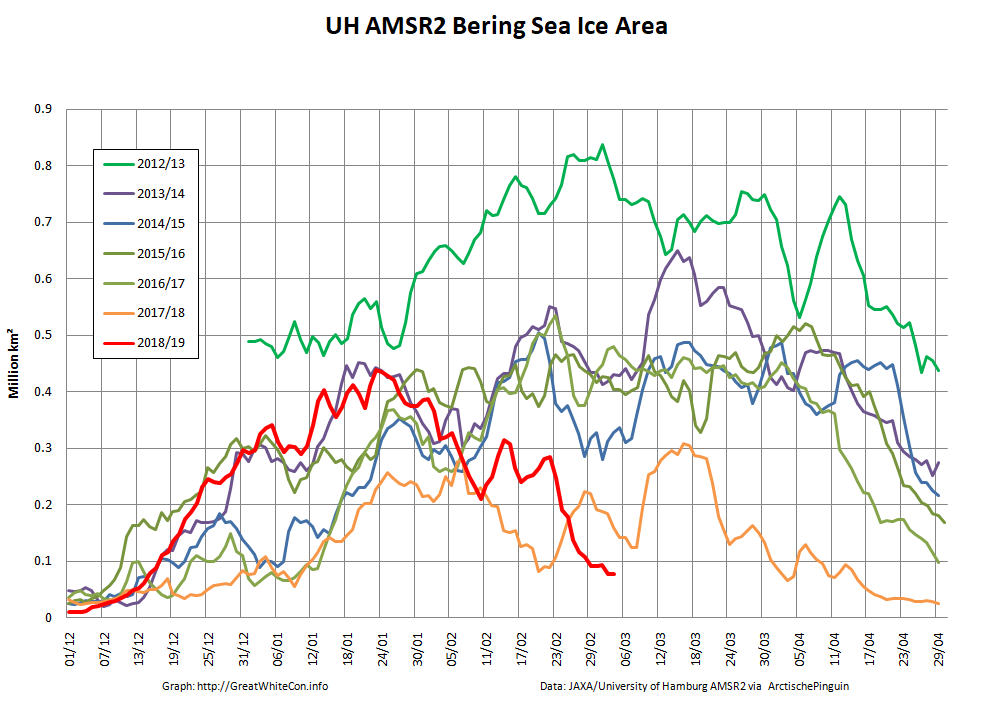
This year there is also a lot of open water in the Chukchi Sea, and almost no sea ice left in the Bering Sea:
Compared with 2016 at the same time of year I am compelled to say that with June 1st just around the corner the 2019 summer melting season is primed to progress more quickly.
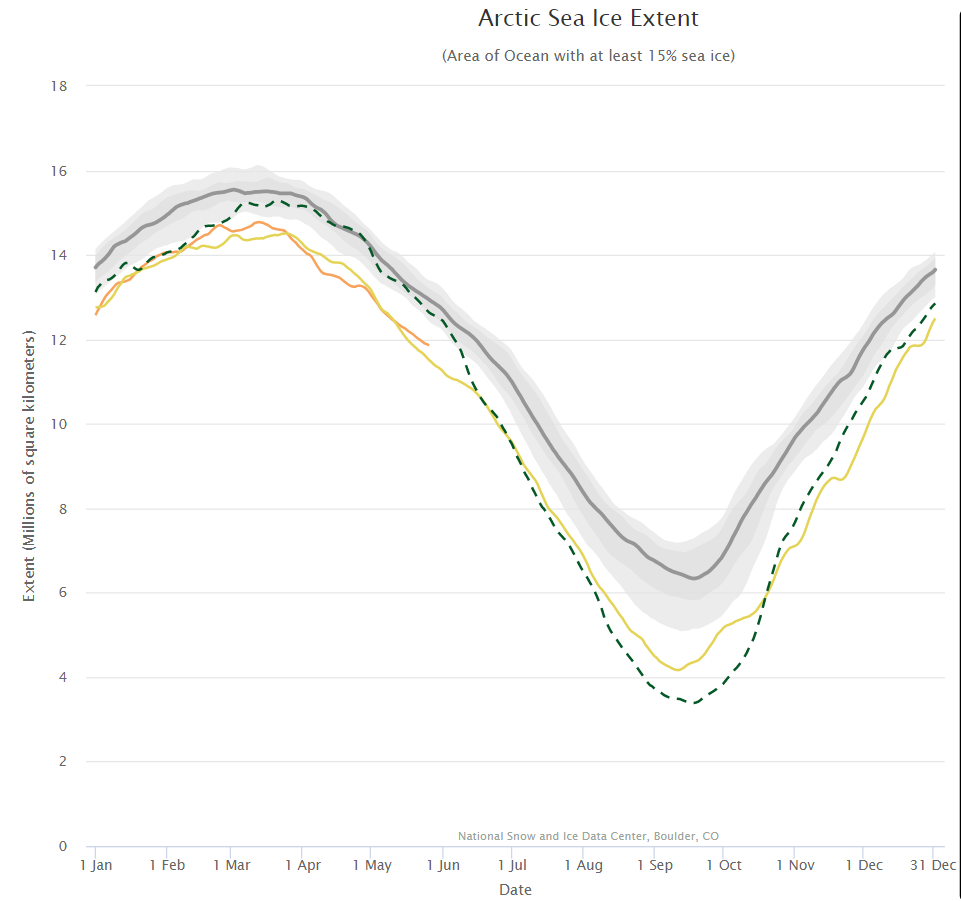
The next obvious comparison to make is with the (in)famous year of 2012, which resulted in the lowest ever minimum extent in the satellite record. Firstly let’s look at the National Snow and Ice Data Center’s graph of Arctic sea ice extent:
Currently extent is significantly below 2012, albeit somewhat above 2016 at the same time of year. And what of melt ponds? In 2012 there was evidence of less snow cover over land and more surface water on the ice on the Siberian side of the Arctic:
NASA Worldview “false-color” image of the Eastern Arctic on May 25th 2012, derived from the MODIS sensor on the Terra satellite
Other than that Arctic sea ice in 2019 looks to be in worse shape than in 2012.
[Edit – May 27th]
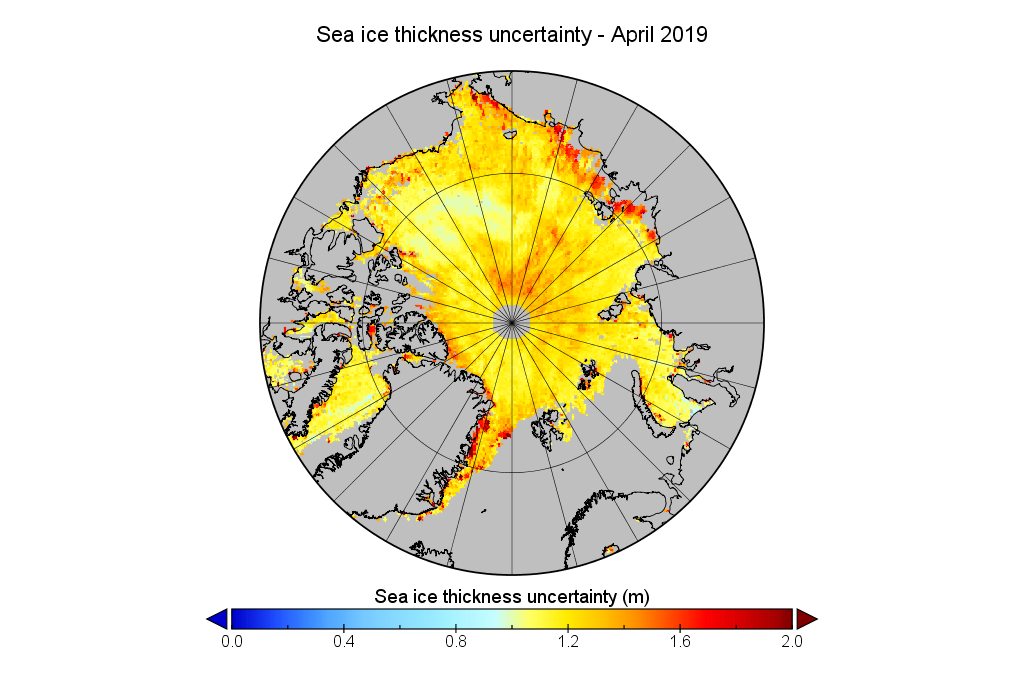
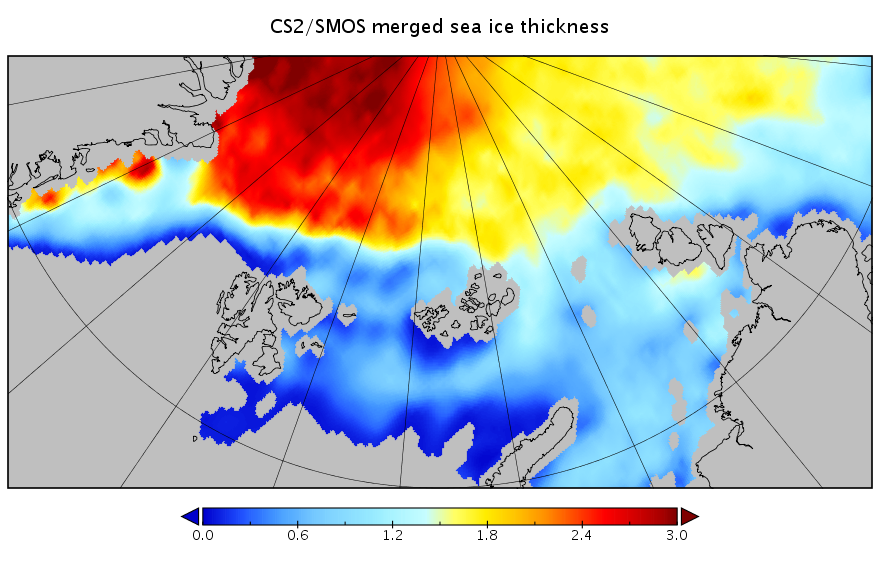
We’ve established that the extent of Arctic sea ice at the end of May 2019 is less than in 2012, but something else to consider is whether that ice is currently thicker than in 2012, or not. Satellites can have a reasonable stab at measuring the area of sea ice, but the third dimension is much trickier. The European Space Agency’s CryoSat-2 satellite has been attempting to measure sea ice thickness since 2010, so let’s take at the conclusions it has reached:
Don’t forget to take a good long look at the associated uncertainties too:
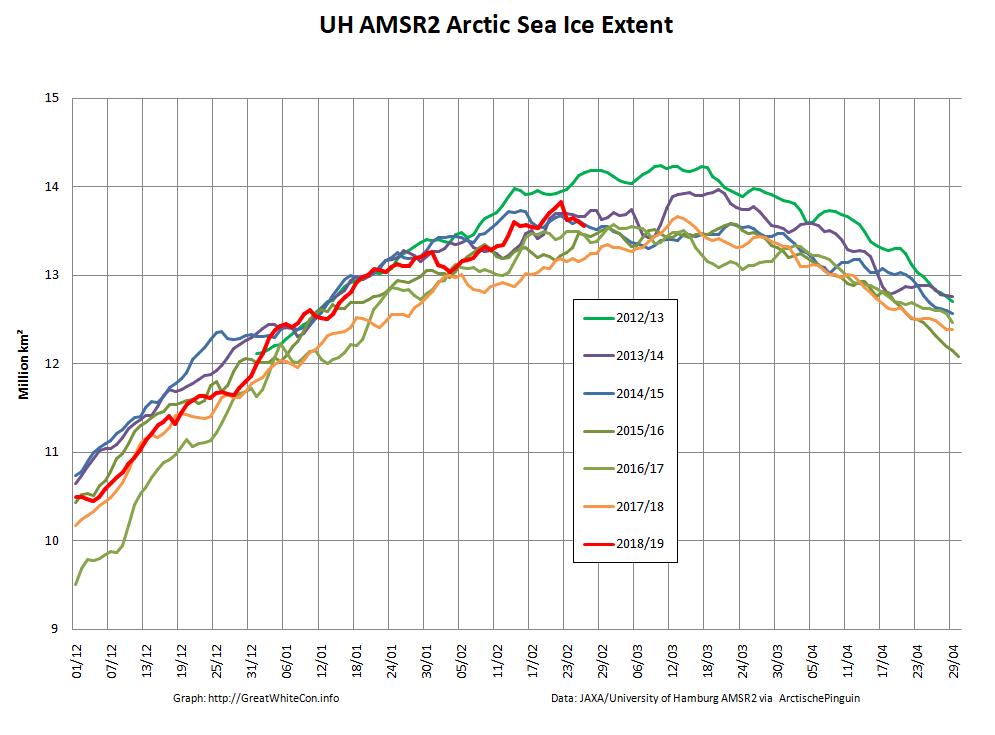
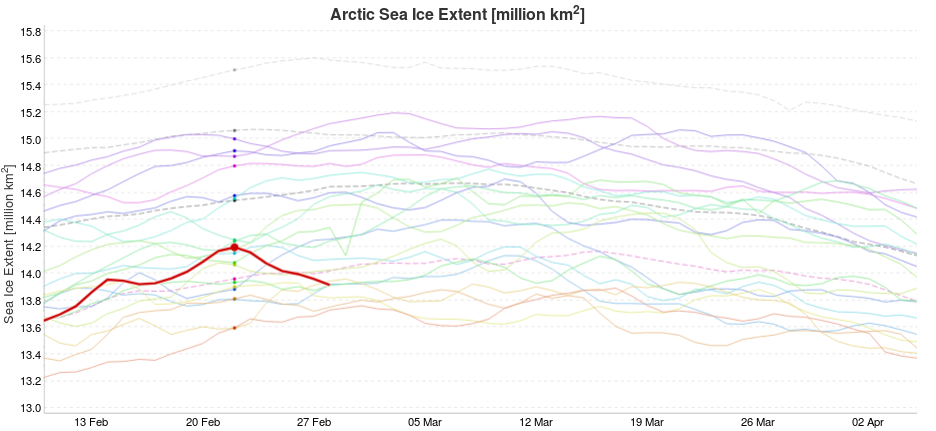
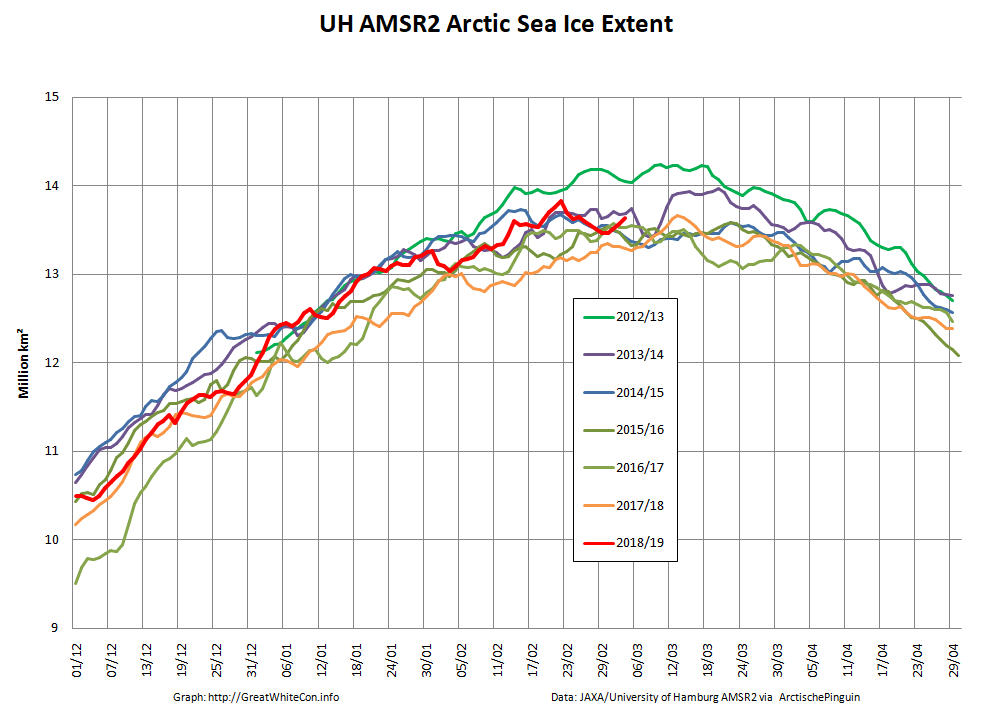
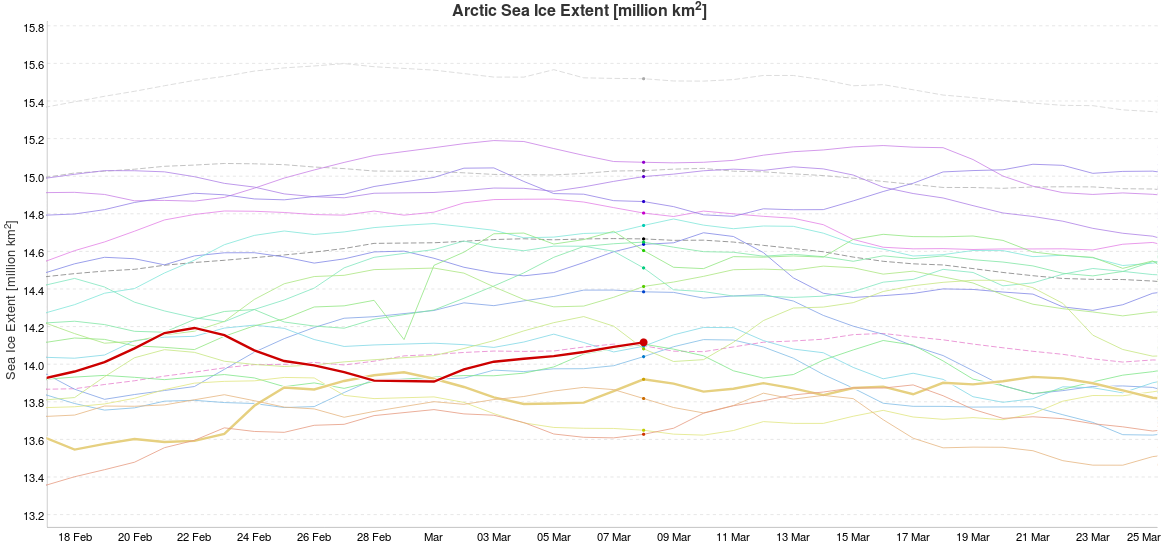
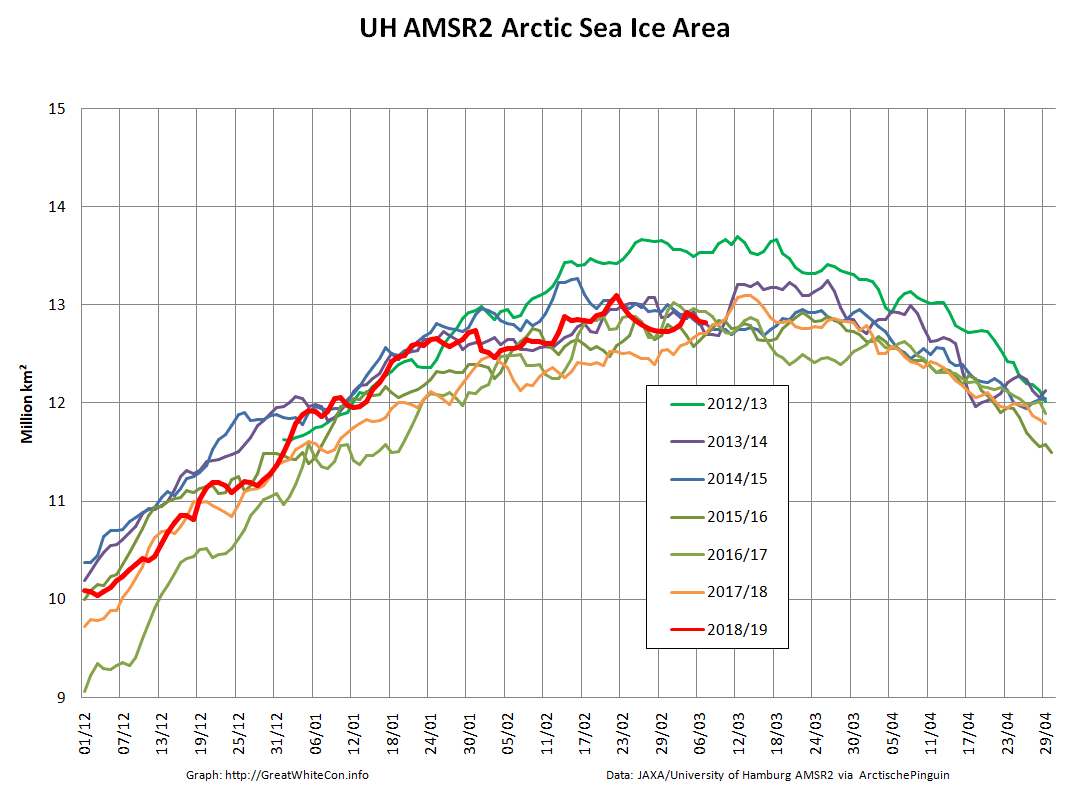
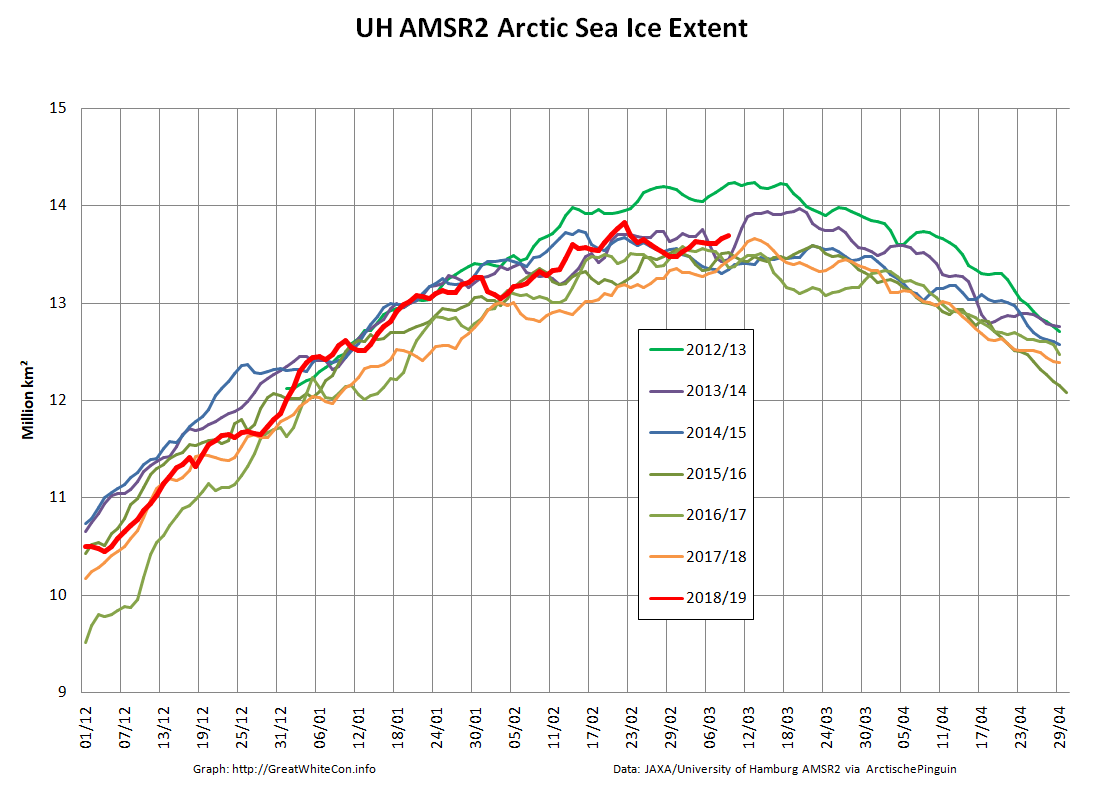
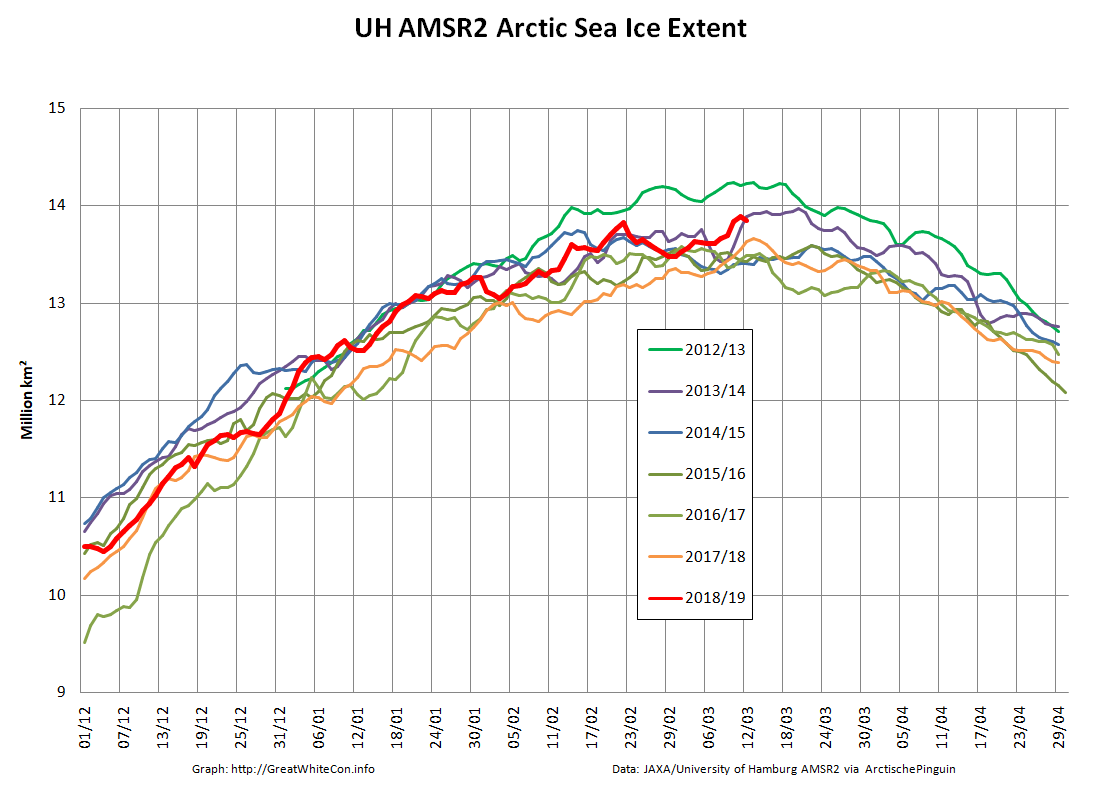
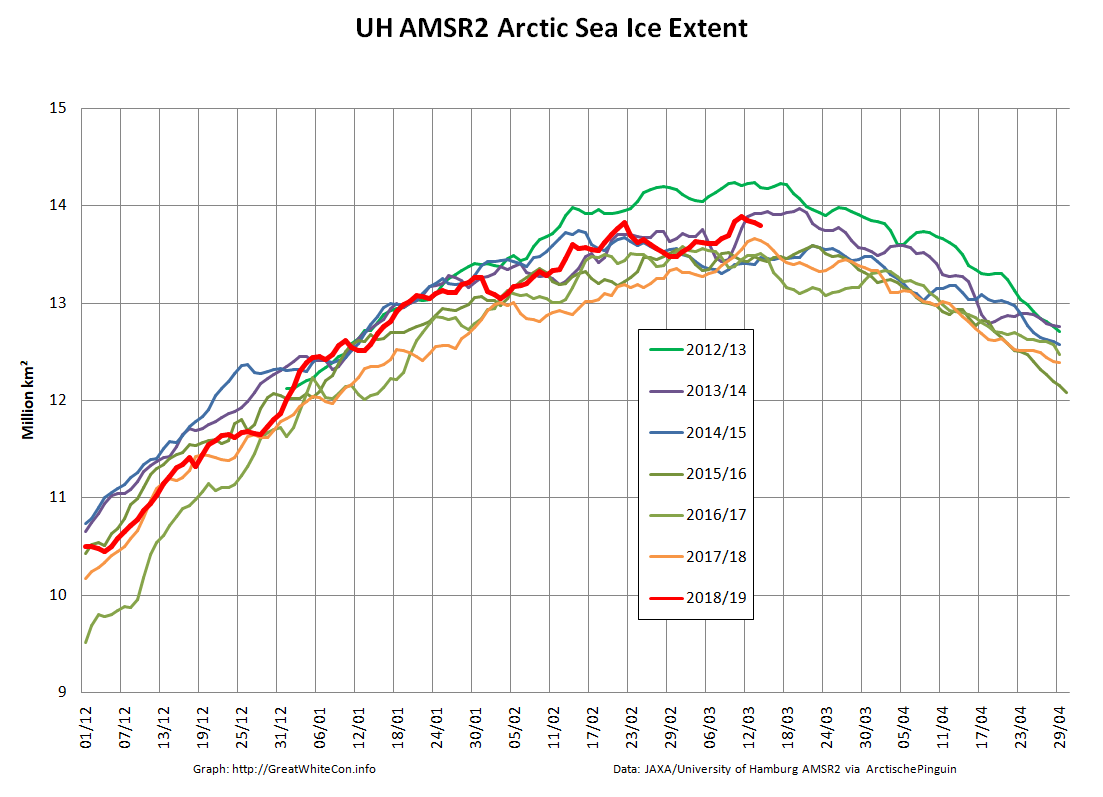
March 2019 has arrived, which in recent years has proved to be by far the likeliest month to contain the maximum extent of Arctic sea ice for the year. To begin with, here’s our favourite high resolution extent graph calculated by “Wipneus” from University of Hamburg/JAXA AMSR2 data:
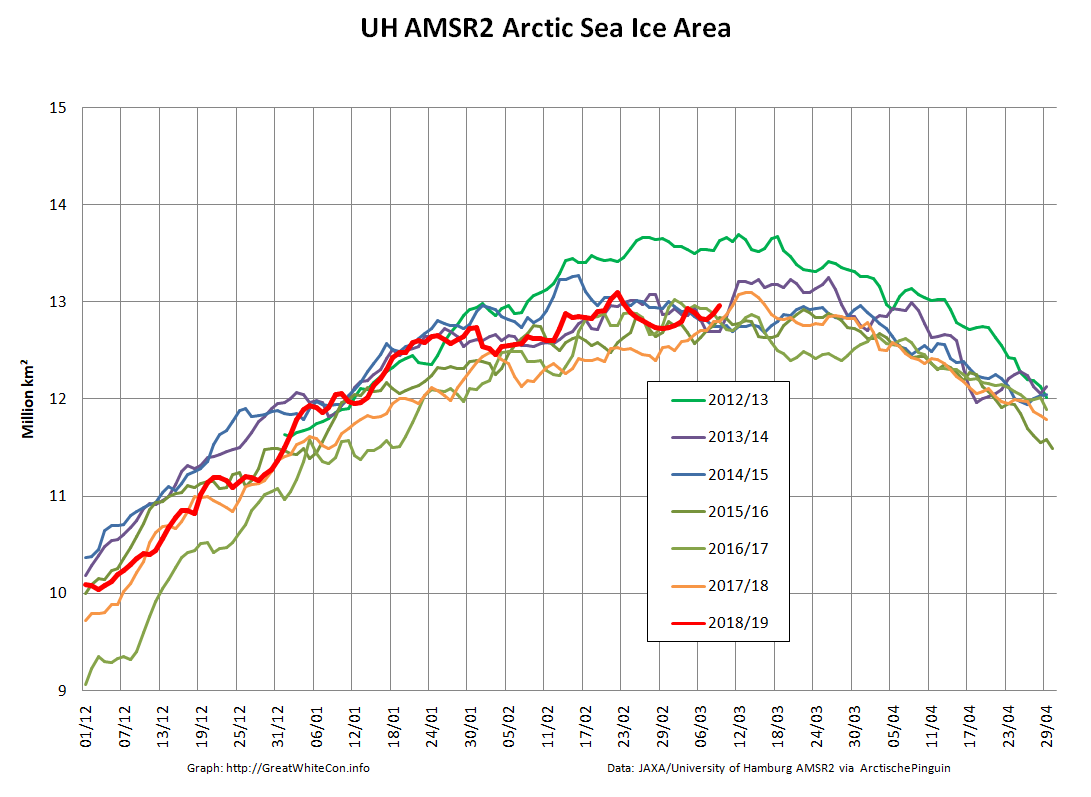
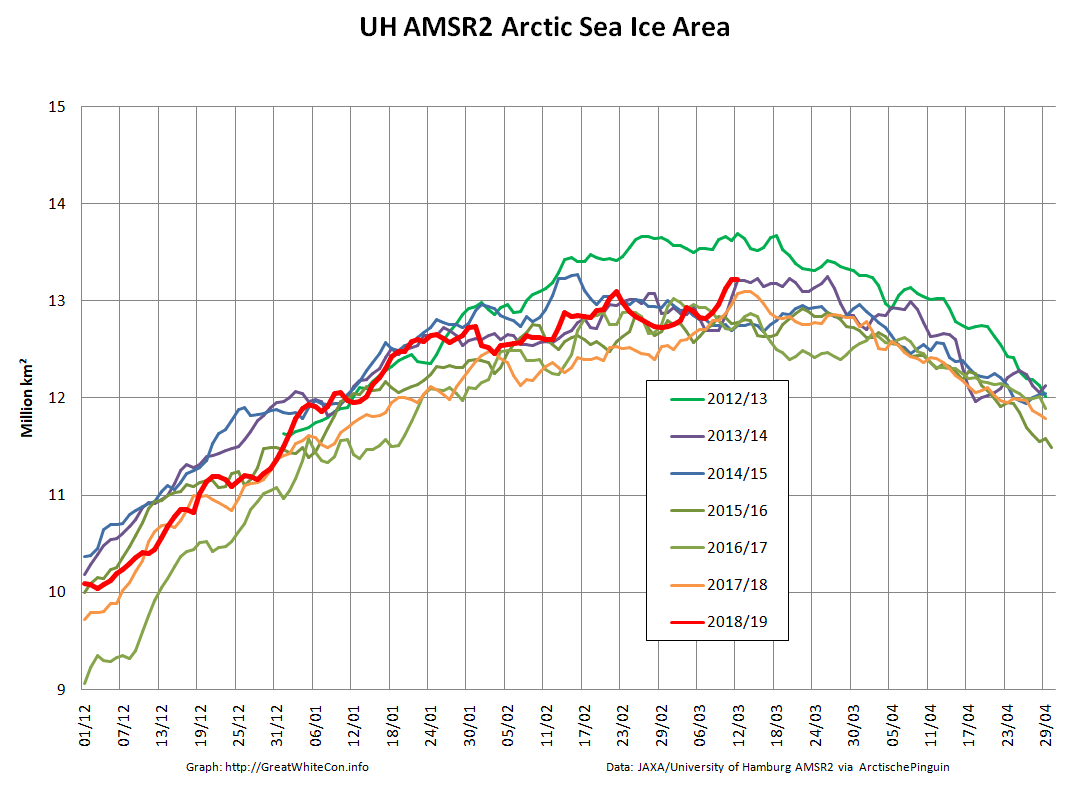
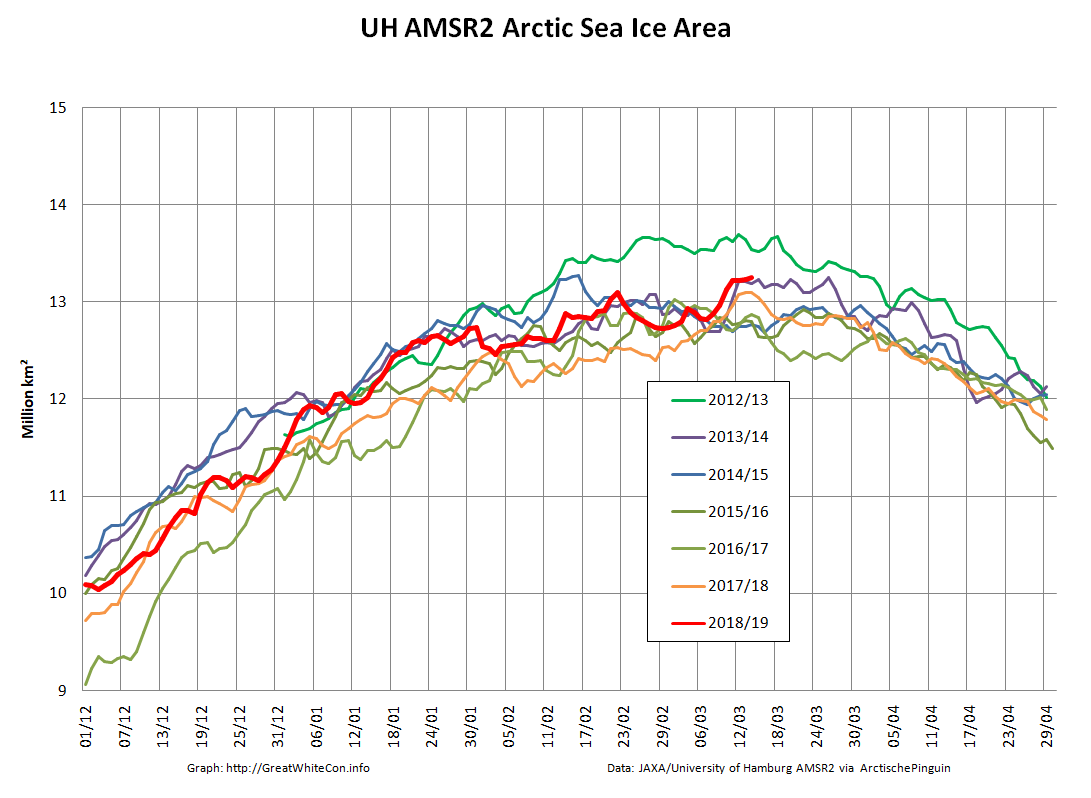
Hopefully you can plainly see the pronounced sharp peak towards the end of February 2019? The current maximum Arctic sea ice extent for 2019 is 13.83 million square kilometers on February 22nd. Here’s Arctic sea ice area for good measure:
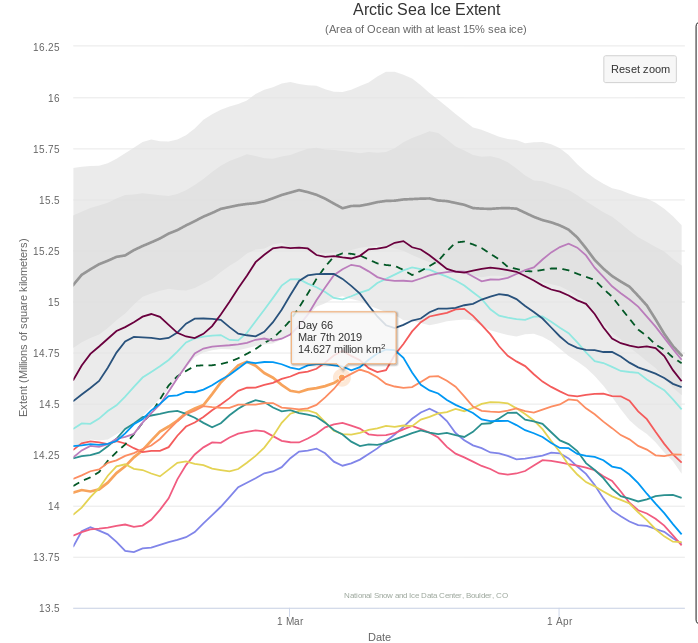
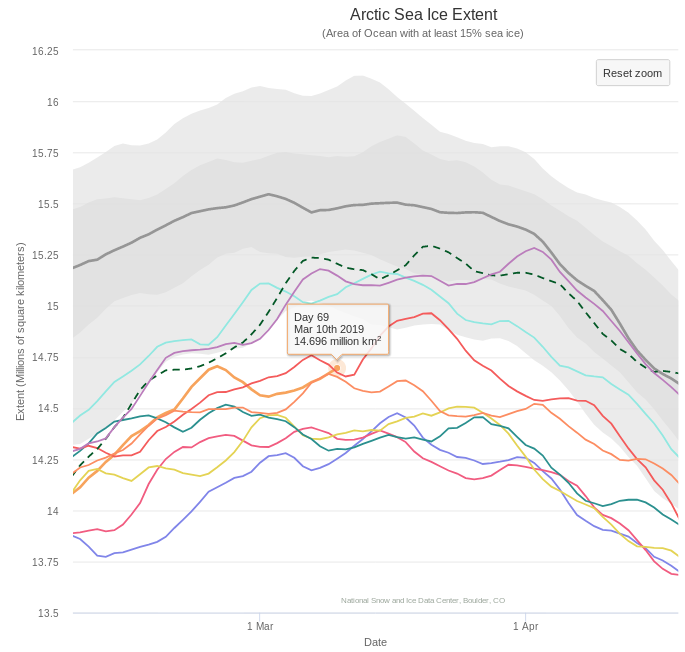
The current maximum area for 2019 is 13.10 million square kilometers, also on February 22nd. Here too is the NSIDC’s 5 day averaged extent:
This reveals a current maximum extent for 2019 of 14.705 million square kilometers on February 24th.
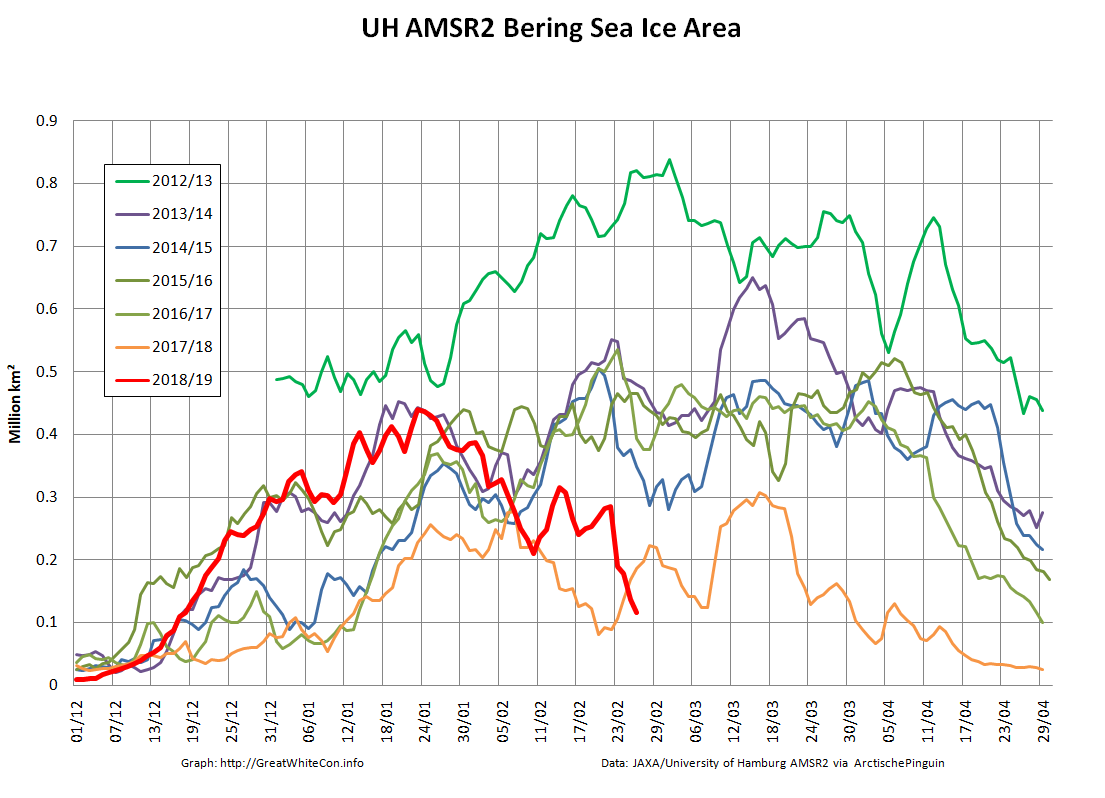
At this juncture you may well be wondering what the cause of that sudden sharp peak might be? Here’s your starter for ten:
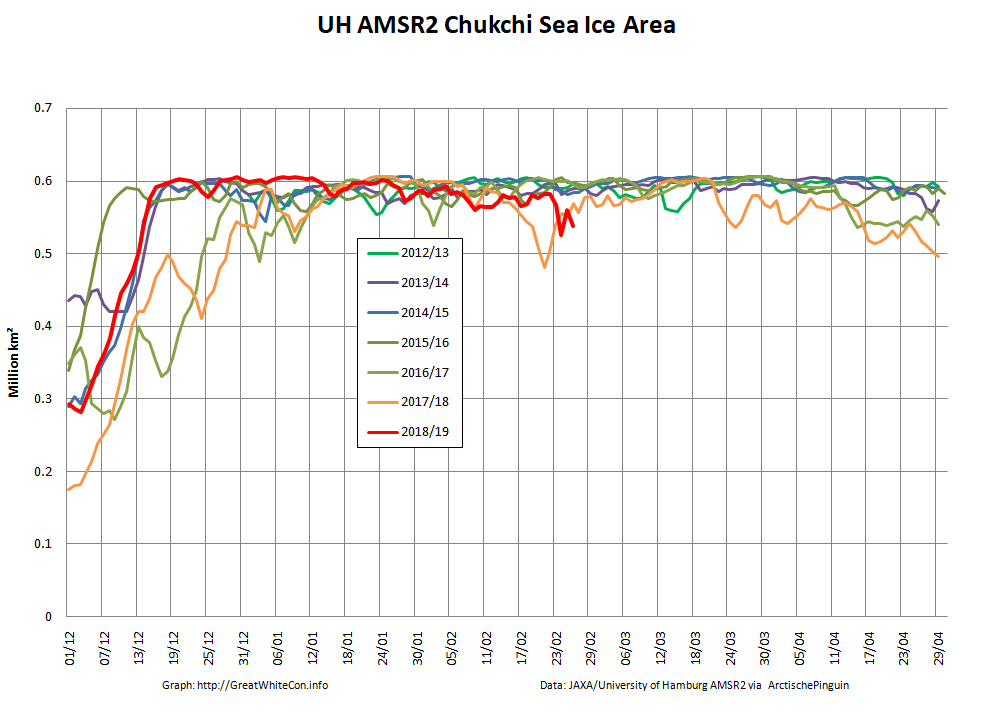
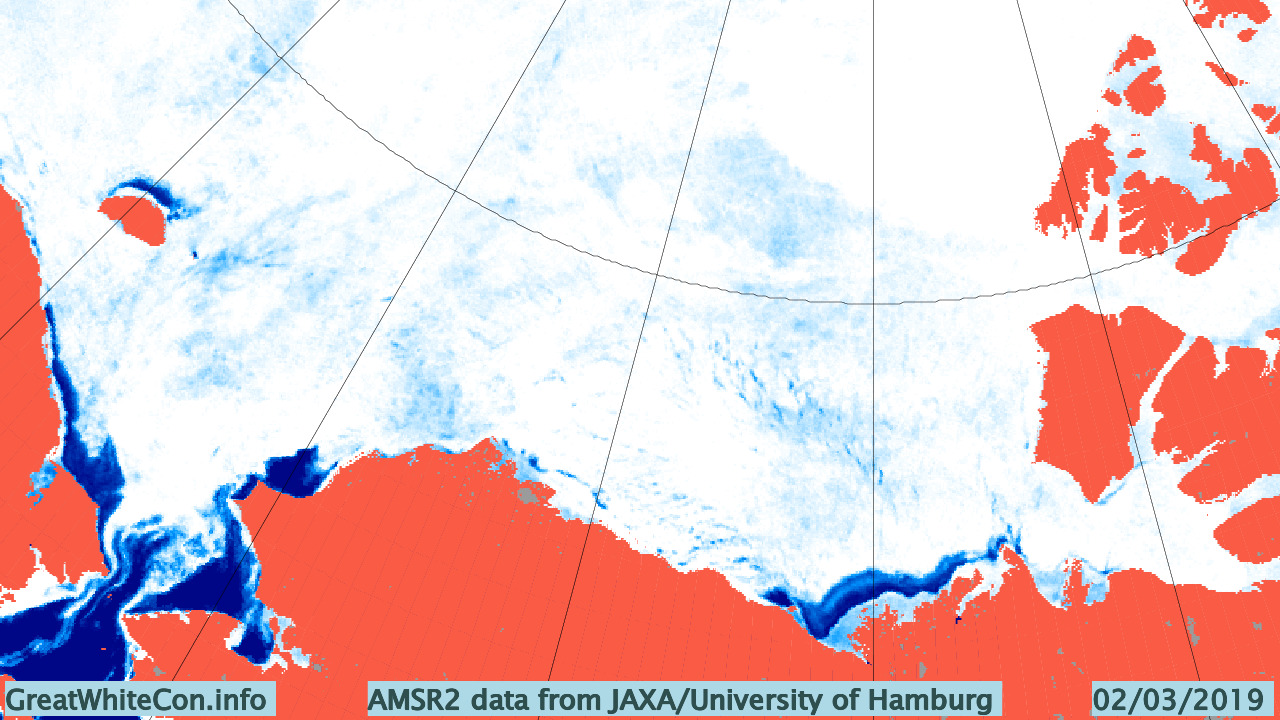
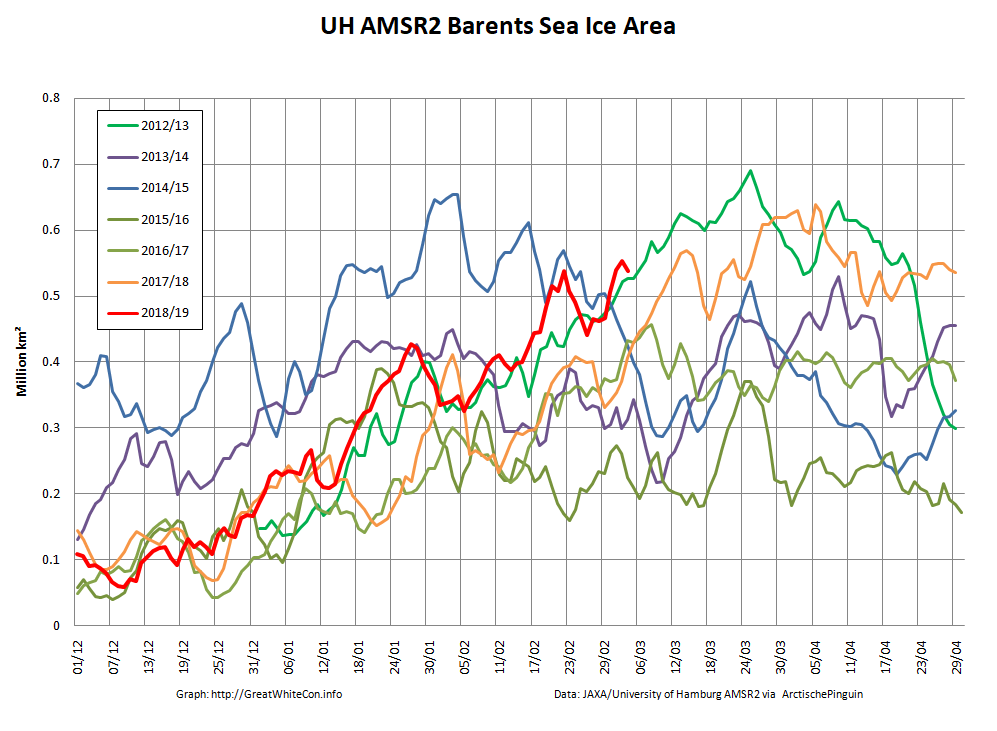
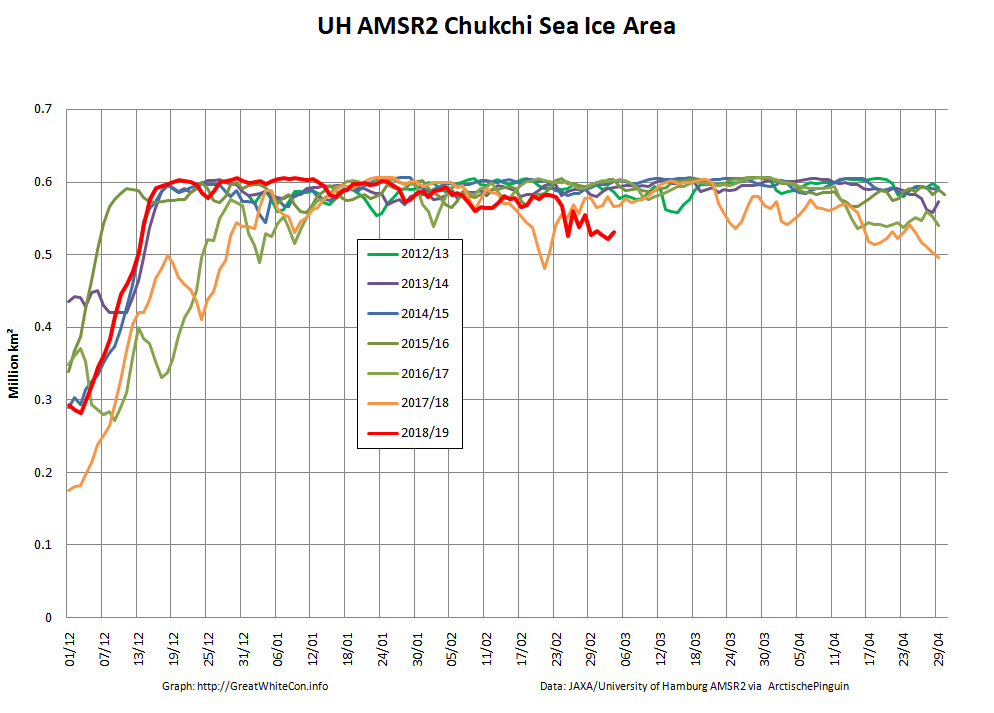
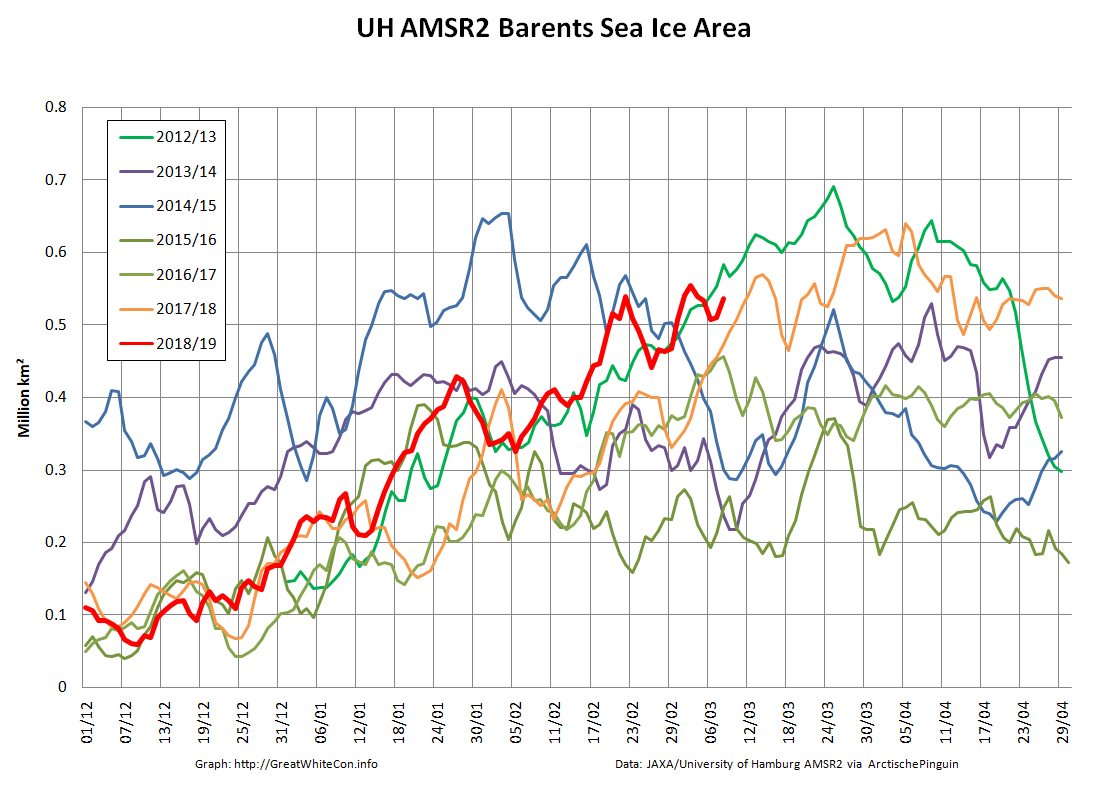
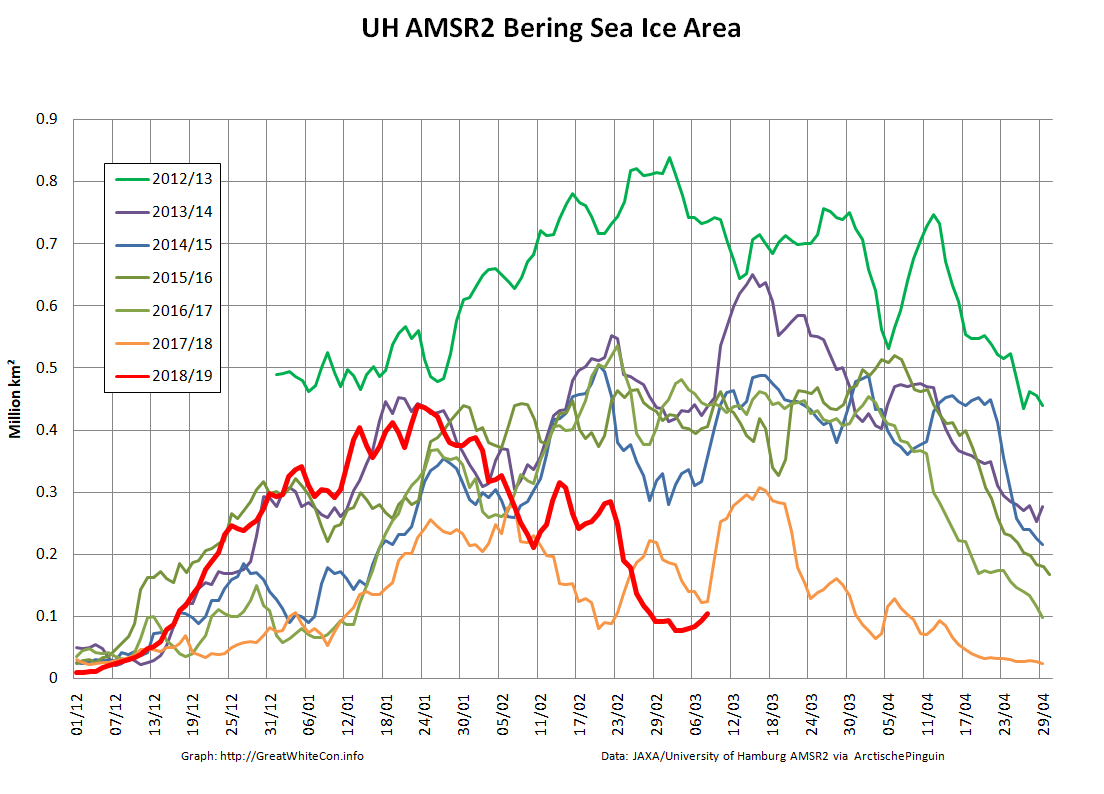
Whilst overall Arctic sea ice area is unremarkable for the current decade, sea ice area in the Bering Sea is remarkable low for the time of year! What’s more much like last year the Chukchi Sea is not currently full to overflowing with sea ice, and is also lowest for the date in the AMSR2 satellite records:
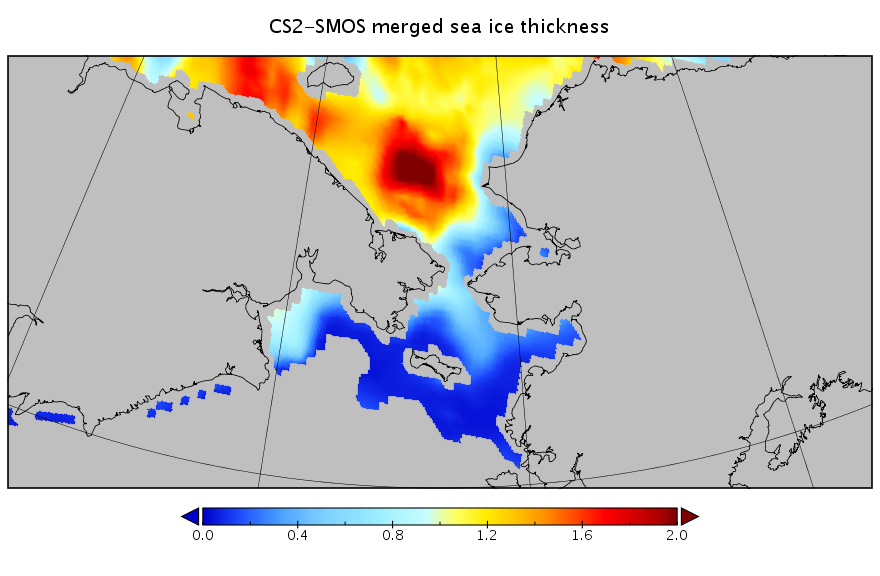
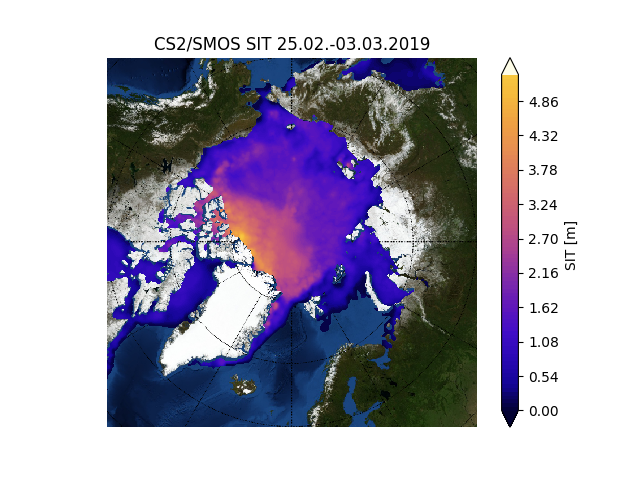
I’ve also been experimenting with the new gridded CryoSat-2/SMOS thickness data from the Finnish Meteorological Institute, which reveals this:
That’s a weekly overview dated February 24th, but it does perhaps explain how such a large area of sea ice could melt so swiftly?
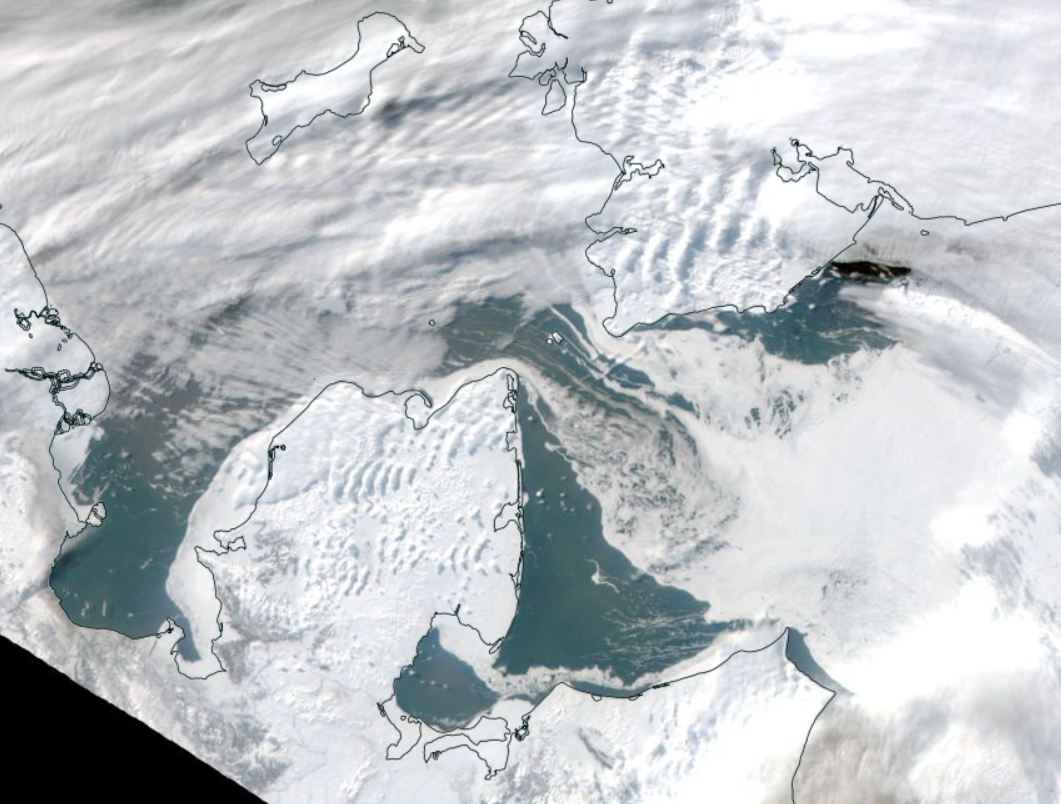
As luck would have it the skies are reasonably clear over the Bering Strait this morning (UTC). Here’s Terra’s view from on high of the current situation:
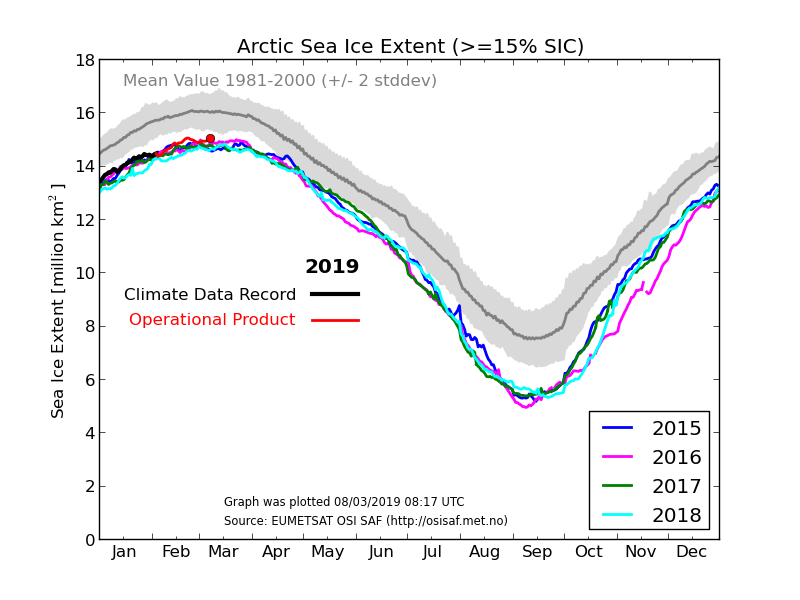
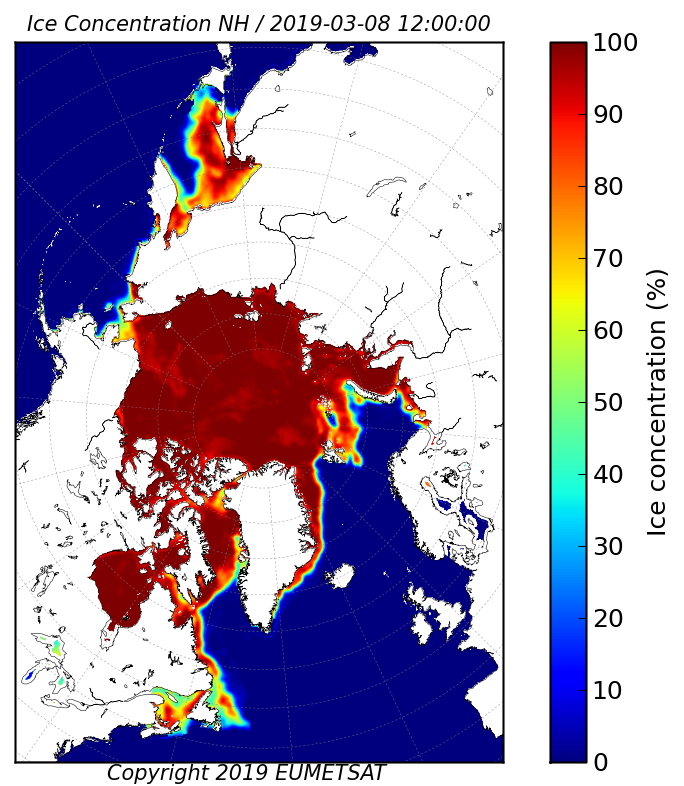
In addition, here is the underlying sea ice concentration data from the OSI-SAF:
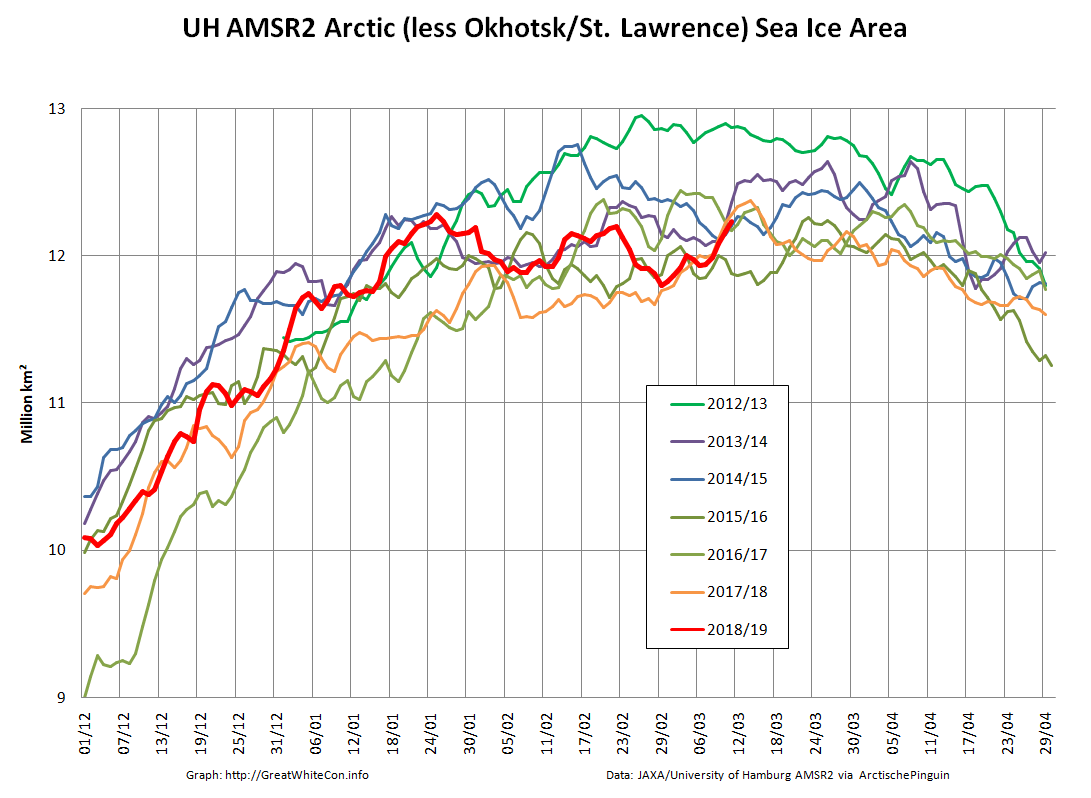
Since Michael is also asserting that there currently exists “the greatest February Arctic sea ice extent (according to DMI) in your blog’s history”, here’s Arctic sea ice area excluding the extremely peripheral Okhotsk and St. Lawrence regions:
P.S. Wipneus’ Pi has processed the AMSR2 data now, and area shows another, more modest, decline today:
Both area and extent are still moving inexorably upwards:
The late February maximum still holds, on the high resolution numbers at least. The JAXA/VISHOP web site is down at the moment, so we’ll have to wait for an update to that particular metric, as well as a post weekend update to the NSIDC’s Charctic chart.
P.S. Jaxa is still down this afternoon, but here’s the latest from the NSIDC:
[Edit – March 13th]
Arctic wide area and extent have blasted past their respective late February maxima:
However Arctic sea ice area excluding the Okhotsk and St. Lawrence peripheral regions has still not exceeded the maximum formed on January 25th:
[Edit – March 14th]
This morning’s data reveal the first decline in extent for several days:
The (extremely!) tentative new maximum Arctic sea ice extent for 2019 is 13.89 million square kilometers on March 12th.
[Edit – March 15th]
JAXA is back!
UH AMSR2 confirms that extent is still declining:
[Edit – March 16th]
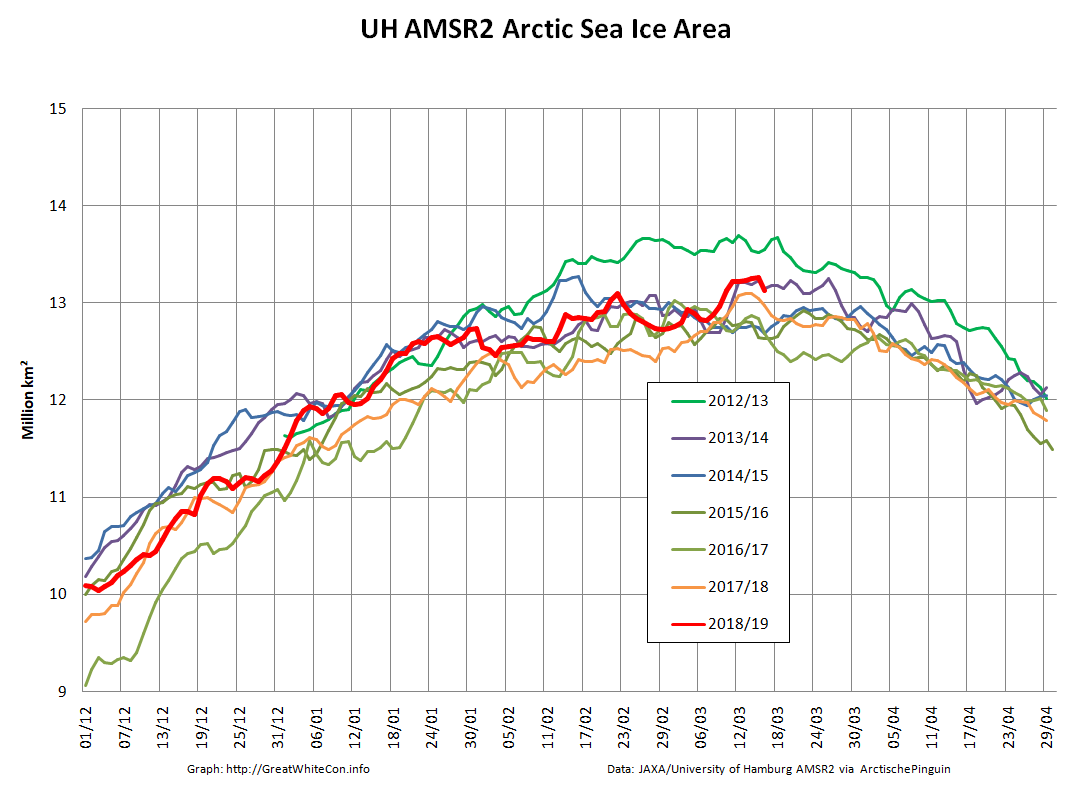
Arctic sea ice extent continues to decline, whilst area is still flatlining:
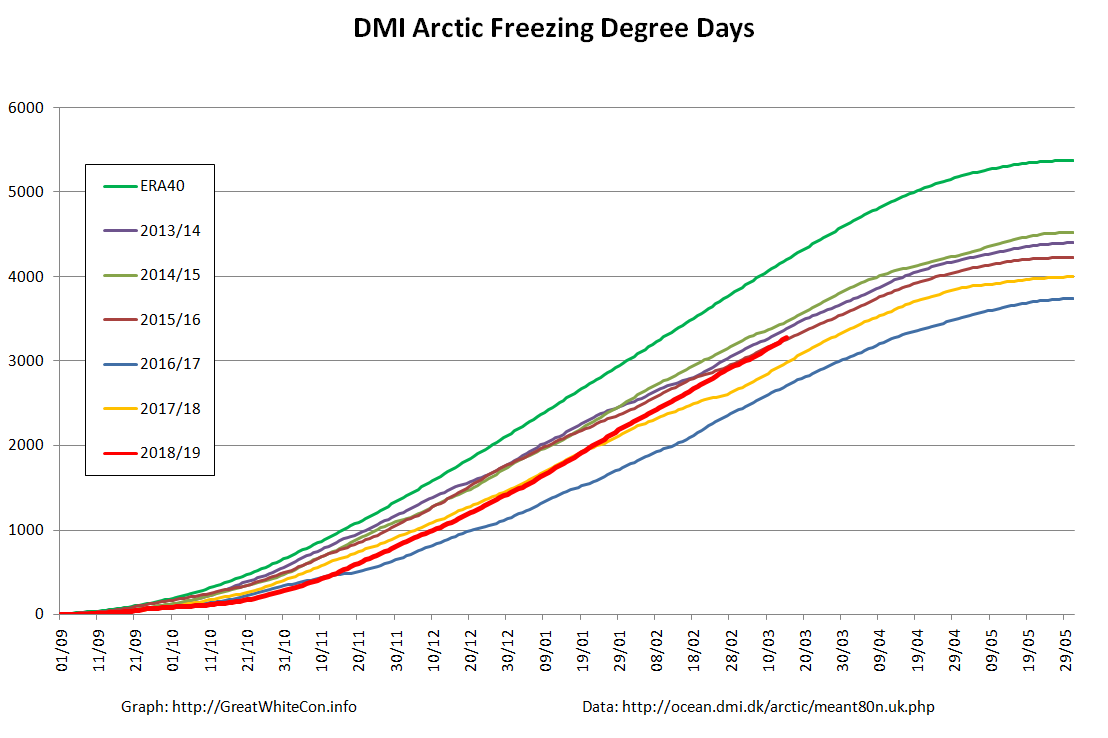
Meanwhile a look at freezing degree days based on the DMI’s dubiously weighted data for north of 80 degrees reveals the story of the freezing season. A historically warm start, but now back in amongst the pack of the 2010s:
[Edit – March 17th]
It looks as though there’ll be no going back from this. Arctic sea ice area is finally following extent’s decline in no uncertain terms:
Barring exceedingly unforeseen circumstances after this year’s “double top” that leaves the 2019 Arctic sea ice maximum extent numbers as follows:
UH/Wipneus AMSR2 – 13.89 million square kilometers on March 12th
JAXA/VISHOP AMSR2 – 14.27 million square kilometers on March 12th
NSIDC 5 day SSMIS – 14.78 million square kilometers on March 13th
[Edit – March 19th]
Arctic sea ice area has fallen off the proverbial cliff over the last few days. There can now be no doubt that the 2019 maximum extent has been reached:
That being the case, all other Arctic sea ice discussion for the month of March can now take place over at:
On March 13, 2019, Arctic sea ice likely reached its maximum extent for the year, at 14.78 million square kilometers (5.71 million square miles), the seventh lowest in the 40-year satellite record, tying with 2007. This year’s maximum extent is 860,000 square kilometers (332,000 square miles) below the 1981 to 2010 average maximum of 15.64 million square kilometers (6.04 million square miles) and 370,000 square kilometers (143,000 square miles) above the lowest maximum of 14.41 million square kilometers (5.56 million square miles) set on March 7, 2017. Prior to 2019, the four lowest maximum extents occurred from 2015 to 2018.
The date of the maximum this year, March 13, was very close to the 1981 to 2010 median date of March 12.
Please note this is a preliminary announcement of the sea ice maximum. At the beginning of April, NSIDC scientists will release a full analysis of winter conditions in the Arctic, along with monthly data for March.
Our title for today refers back to the Great Arctic Cyclone of August 2012. There has been some speculation over on the Arctic Sea Ice Blog about whether a similar event is about to occur this year.
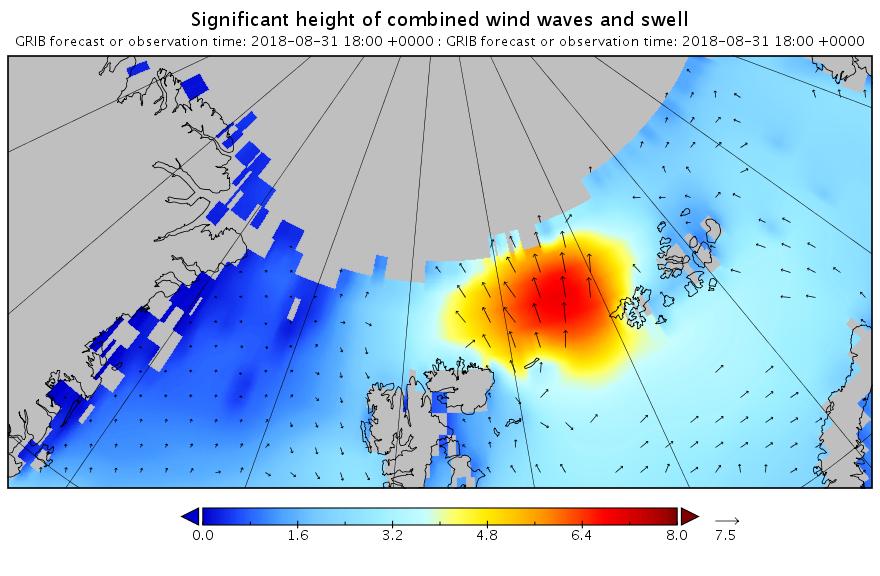
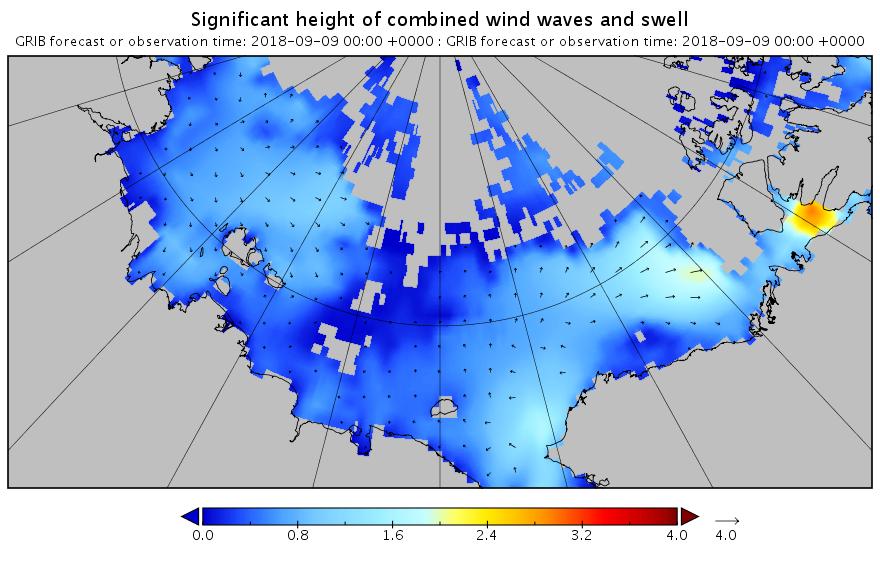
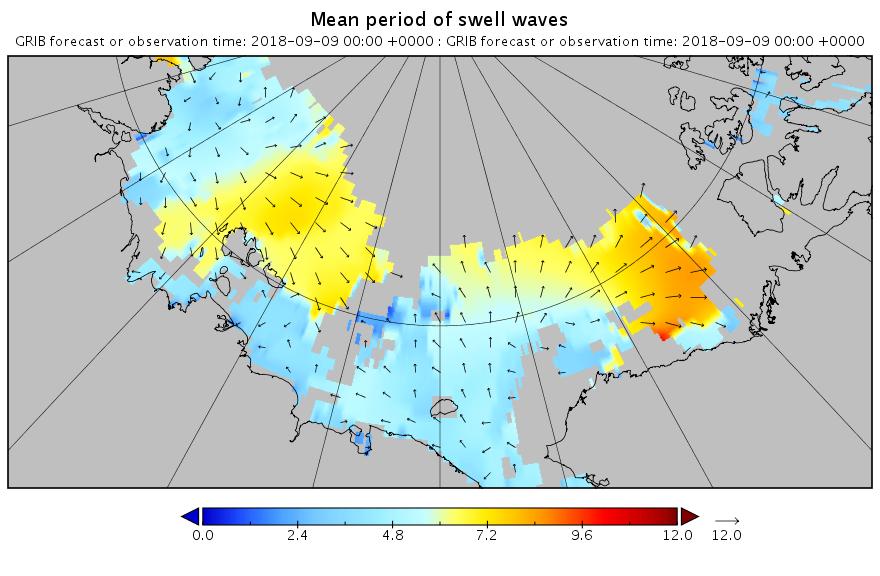
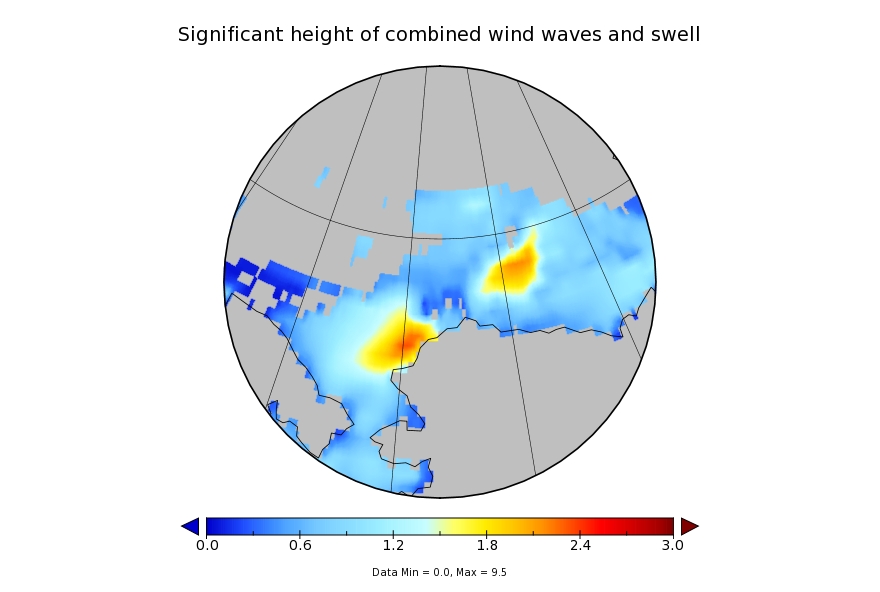
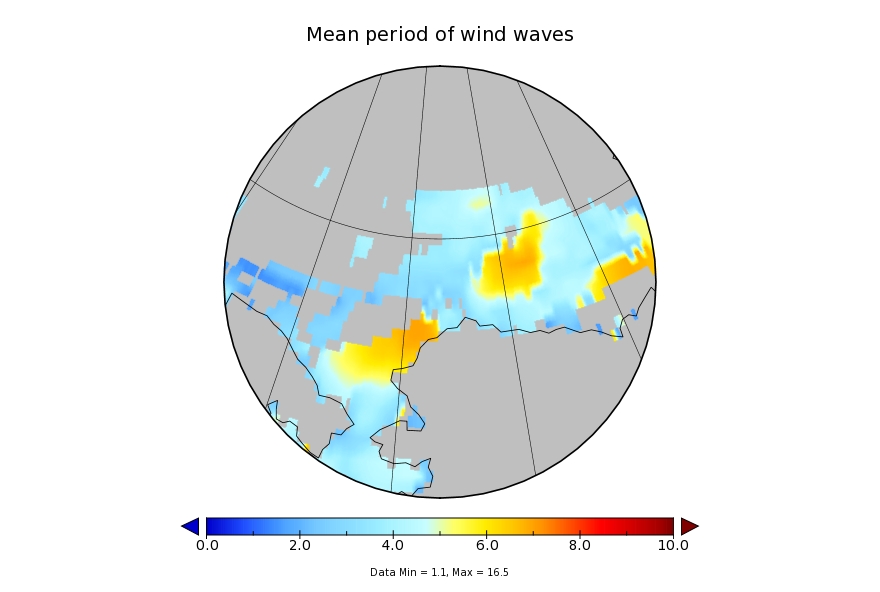
It’s later in the season of course, but as is our wont we always look at the waves first. Here is the current WaveWatch III forecast for the evening of August 31st UTC:
In summary the forecast shows some very large waves with a substantial period for inside the Arctic Circle directed straight at the ice edge. Let’s follow the forecast over the next few days carefully shall we?
[Edit – August 30th]
The latest wave forecast for tomorrow evening isn’t as extreme as 3 days ago. Note the change in the significant height scale:
Nonetheless the height and period are still very significant!
[Edit – August 31st]
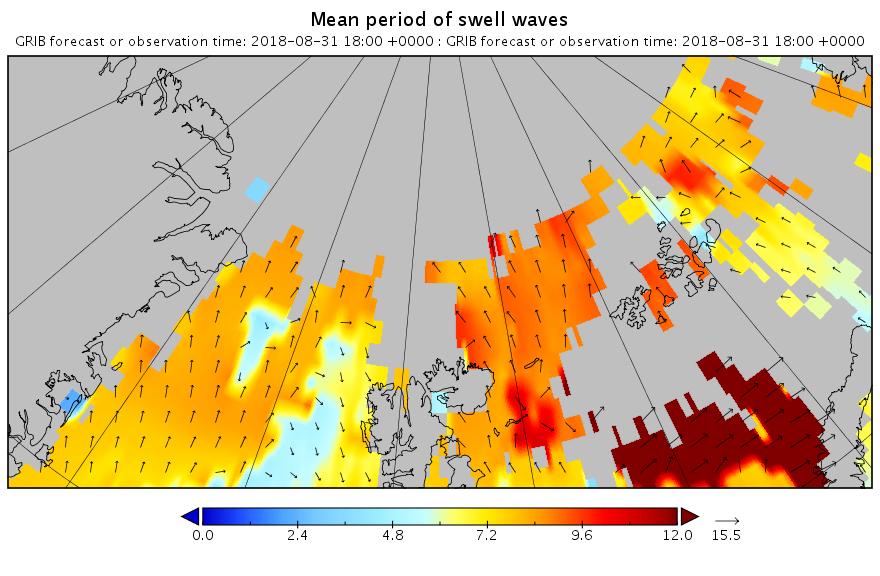
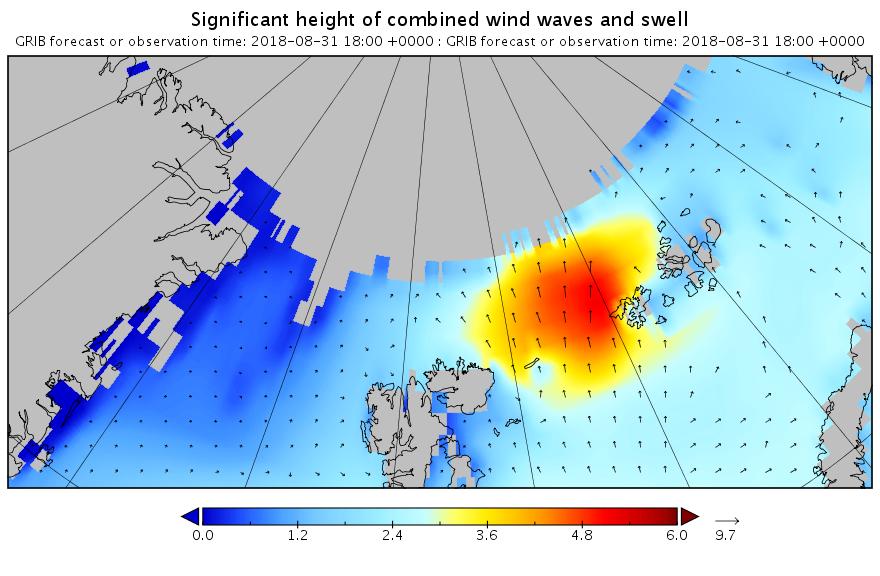
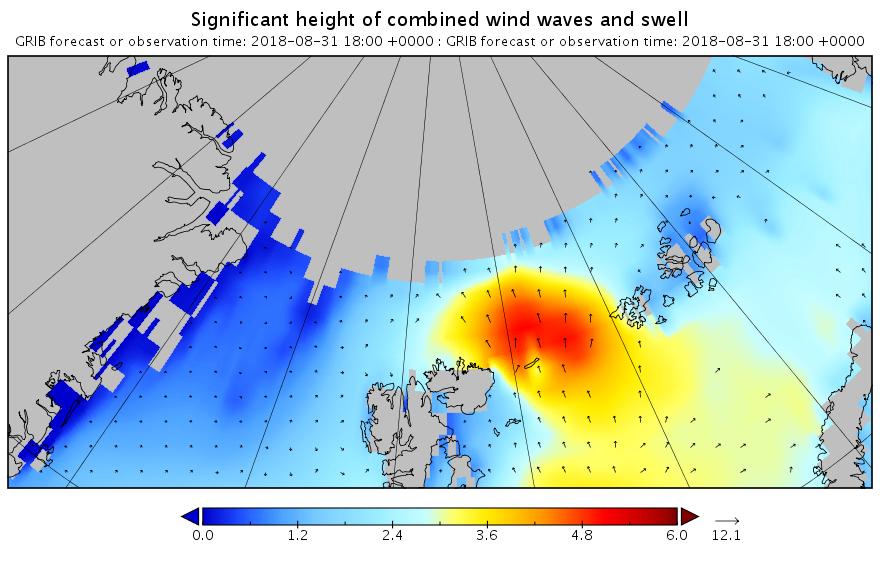
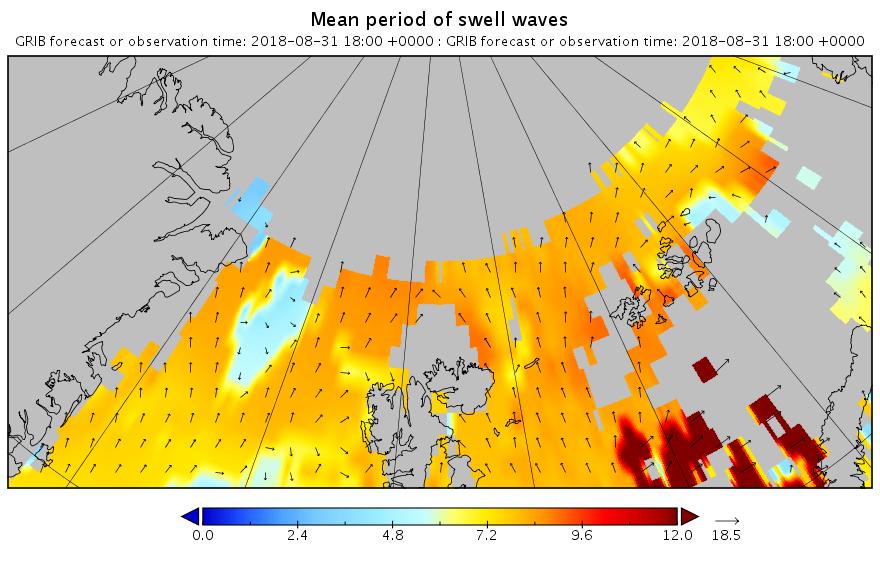
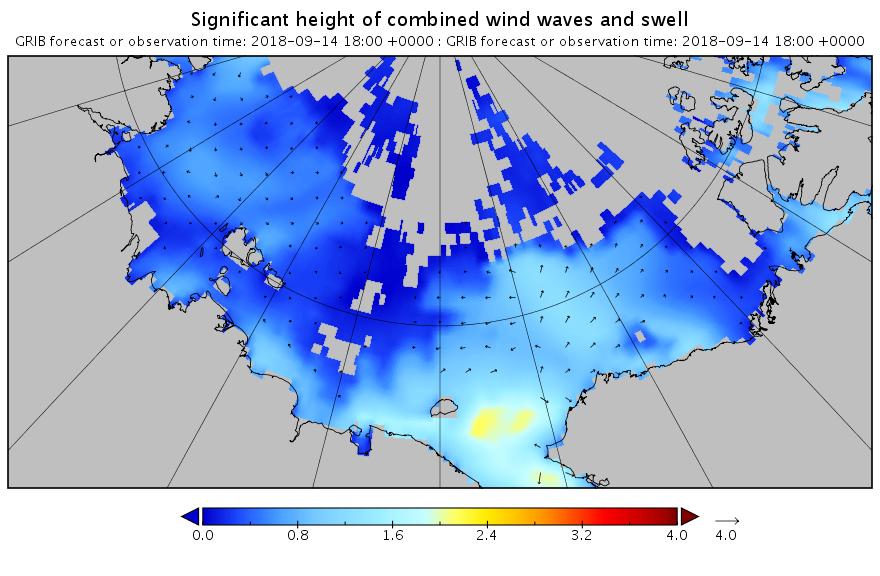
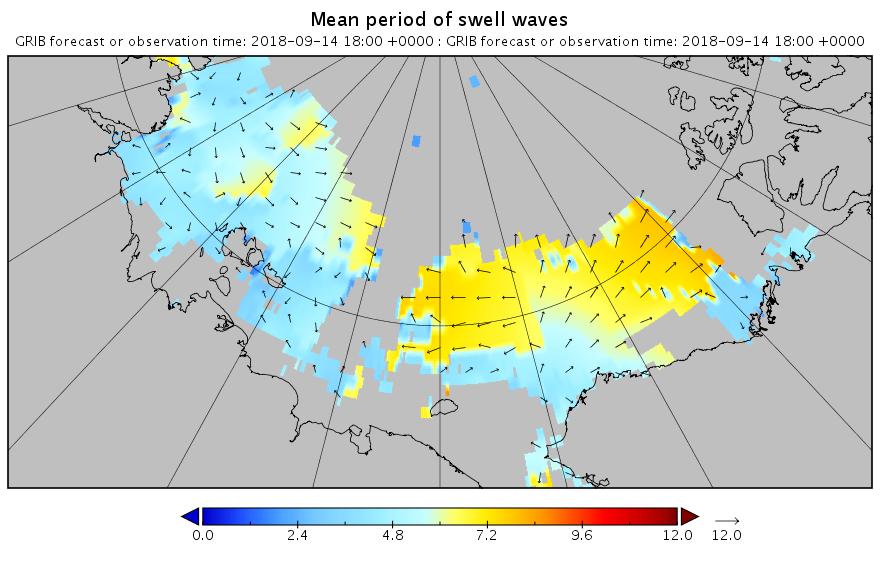
Here’s the latest forecast for 6 PM this evening (UTC):
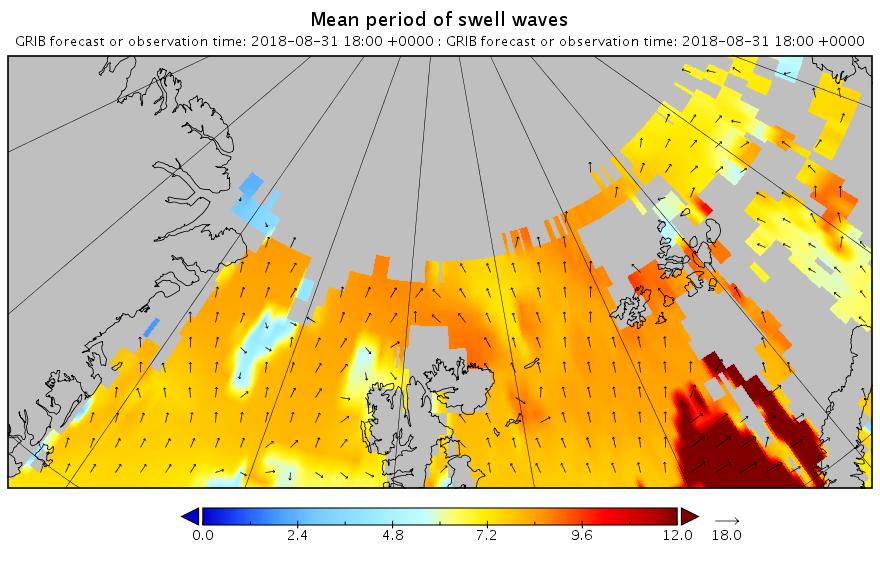
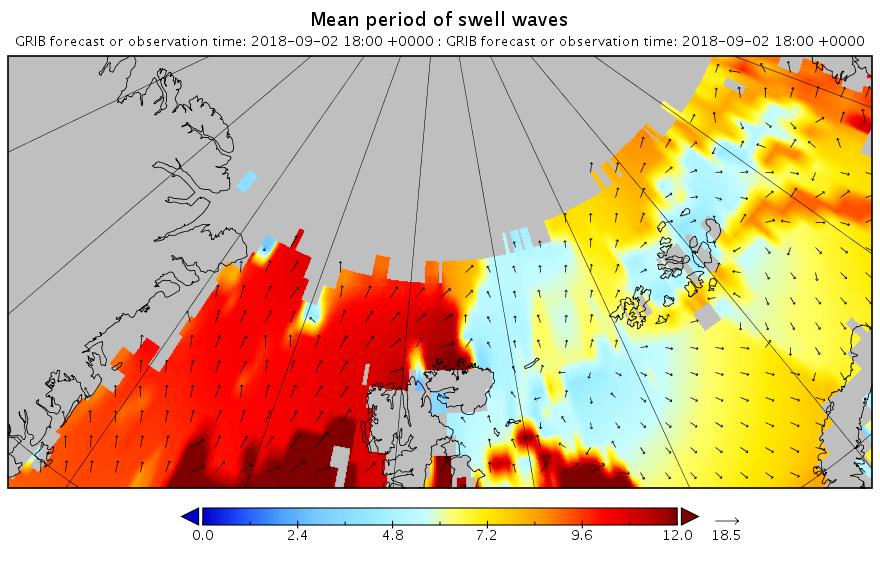
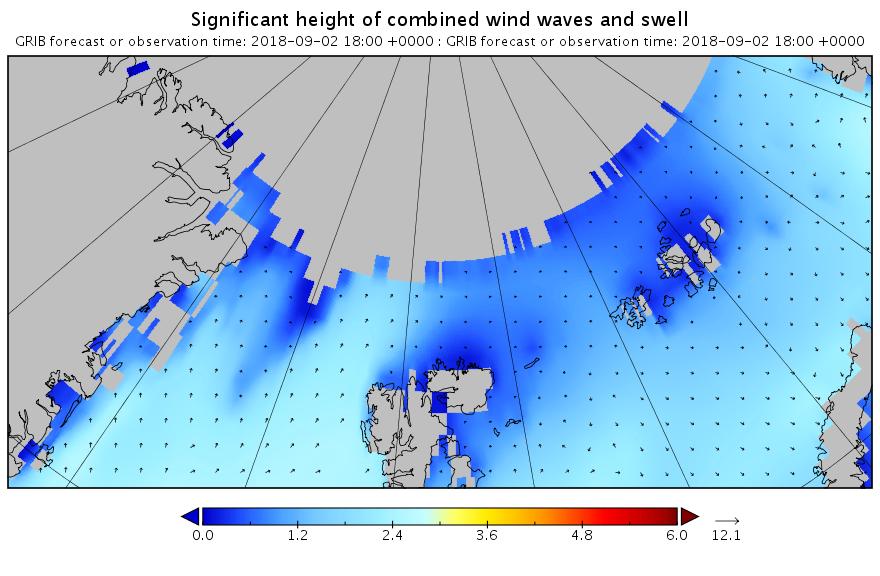
Note how the open water across almost the entire map is full of what in the Arctic counts as a long period swell. That means that the forecast for 2 days later looks like this:
Less height but with a longer period. All of which means that the sea ice north of the Atlantic Ocean isn’t about to receive a short sharp shock. It has a sustained battering lasting several days to look forward to.
[Edit – September 1st]
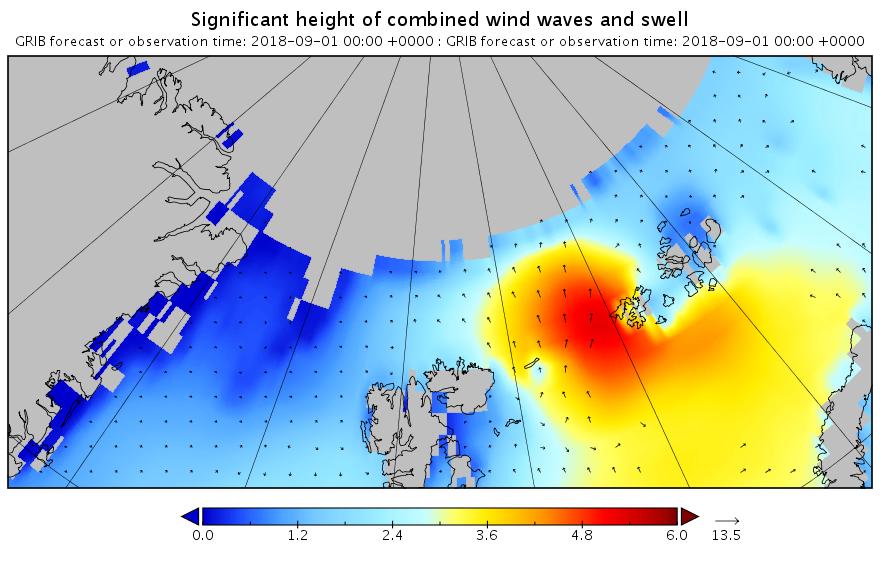
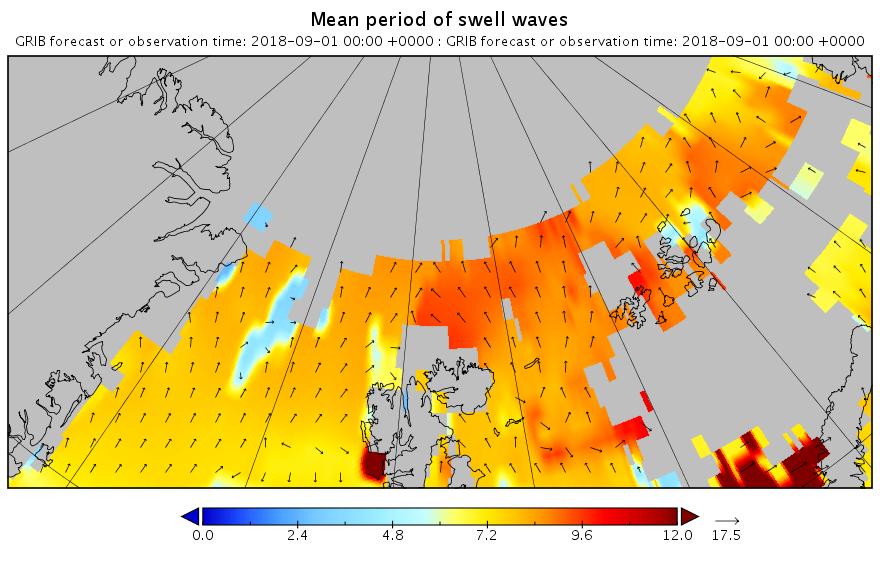
The barrage of assorted swells has begun. Here’s the “hindcast” from midnight last night UTC:
Now lets take a look at tomorrow’s forecast for the Laptev Sea. This is for 09:00 UTC:
Note once again the change of scale on the wave/swell height map. Nevertheless a 3+ meter swell heading over into the East Siberian Sea isn’t something you see every day.
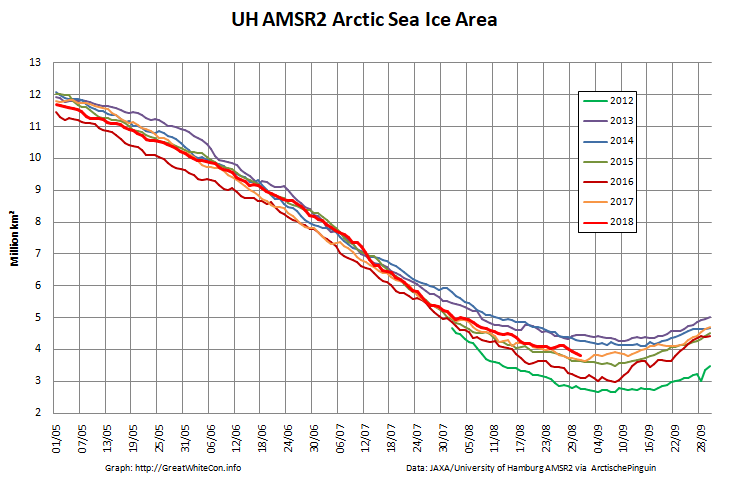
Now were into September the 2018 annual minimum extent can’t be too far away. Extent decline appears to have stalled. However “high res” AMSR2 area is currently falling fast, for the time of year at least:
[Edit – September 2nd]
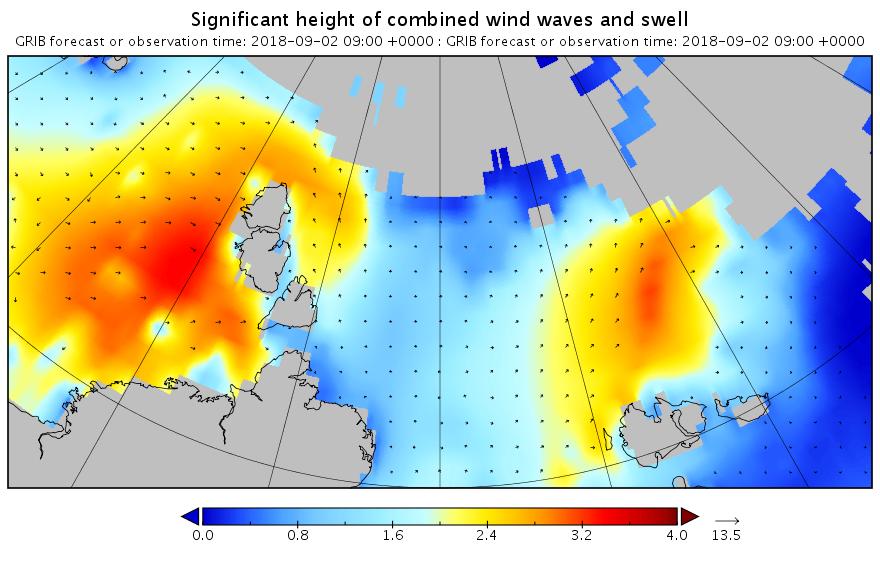
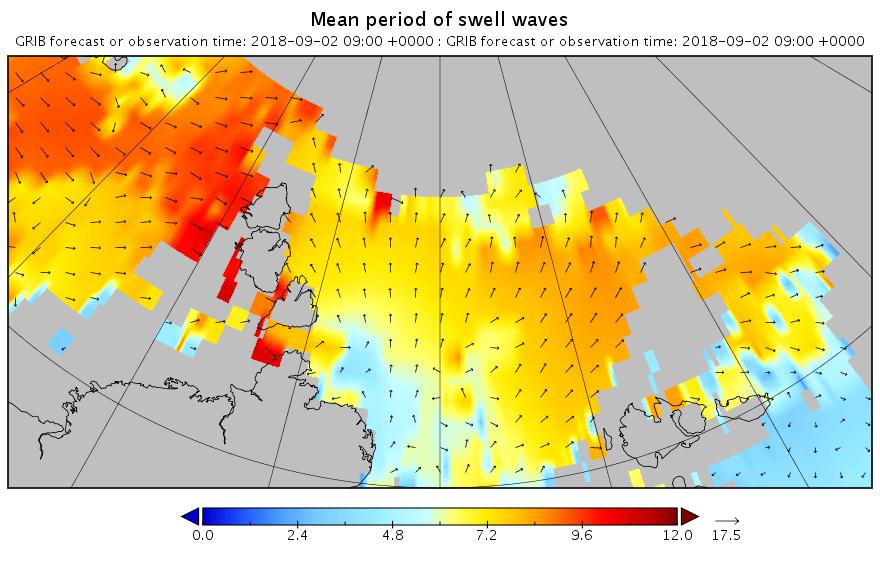
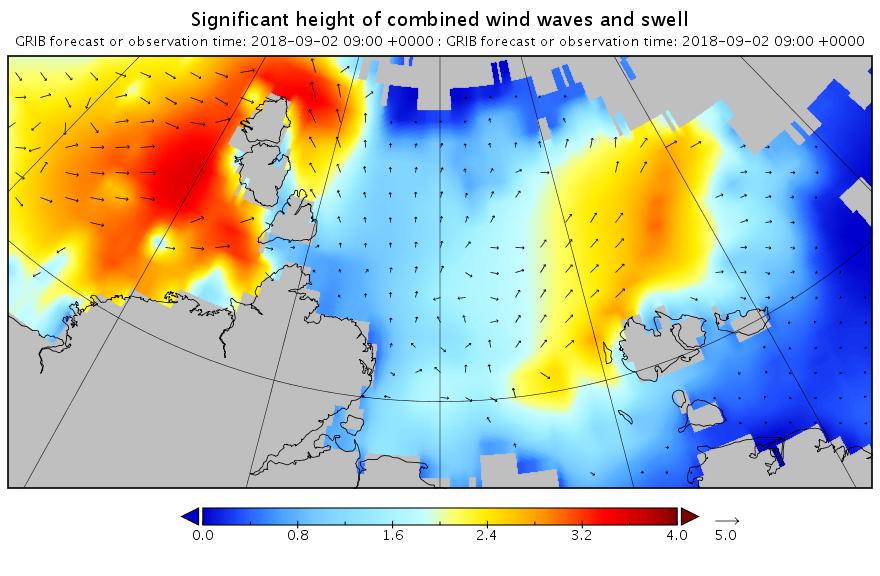
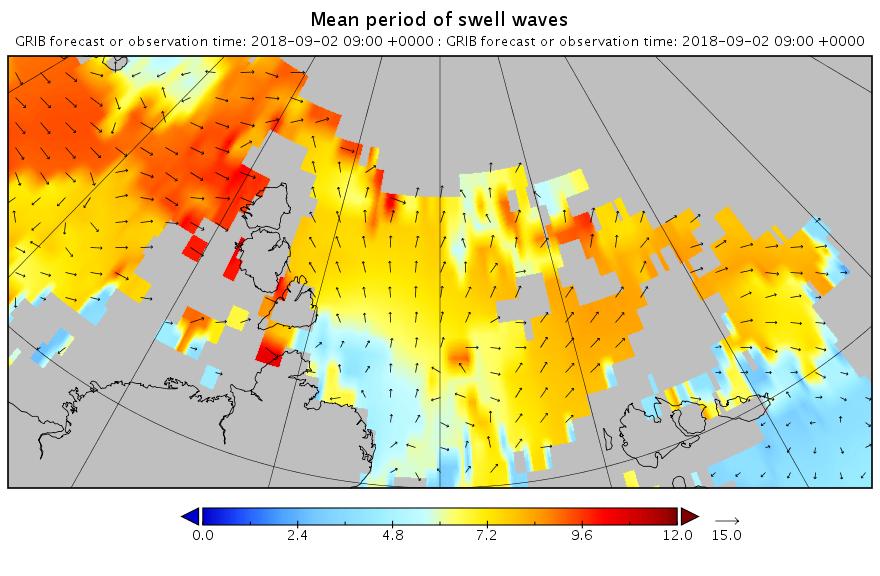
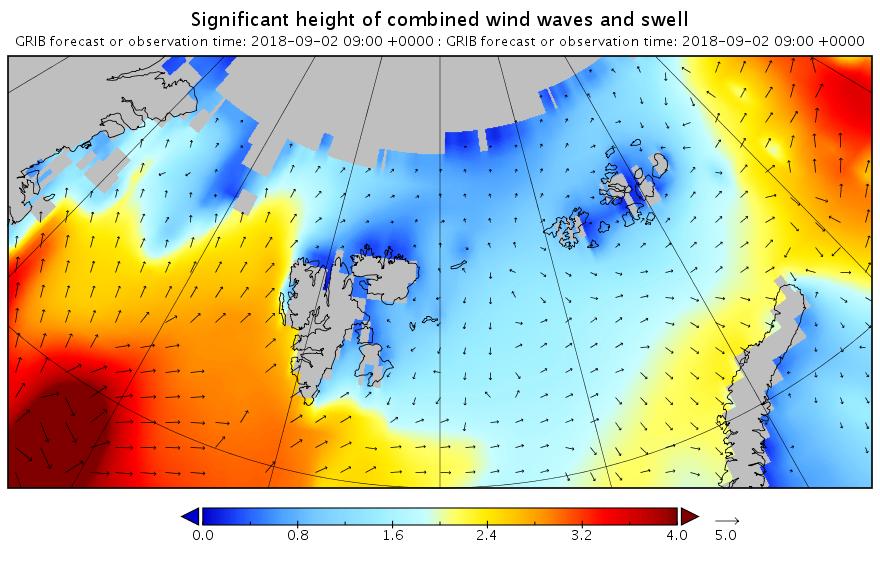
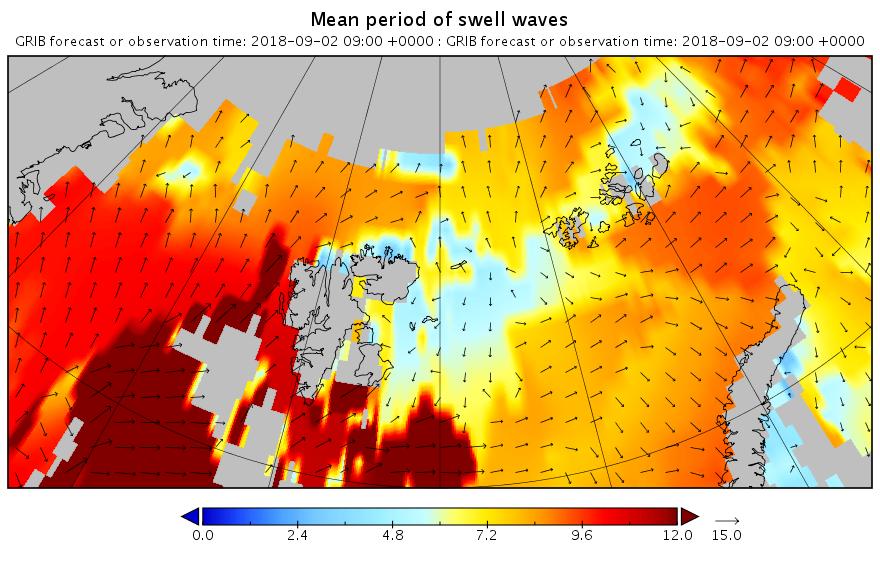
Here are the swell and period forecasts at midnight for round about now, 09:00 UTC:
All the seas between Greenland and the New Siberian Islands are awash with swells with a period of 8 second or greater. This is most unusual, to put it mildly!
[Edit – September 3rd]
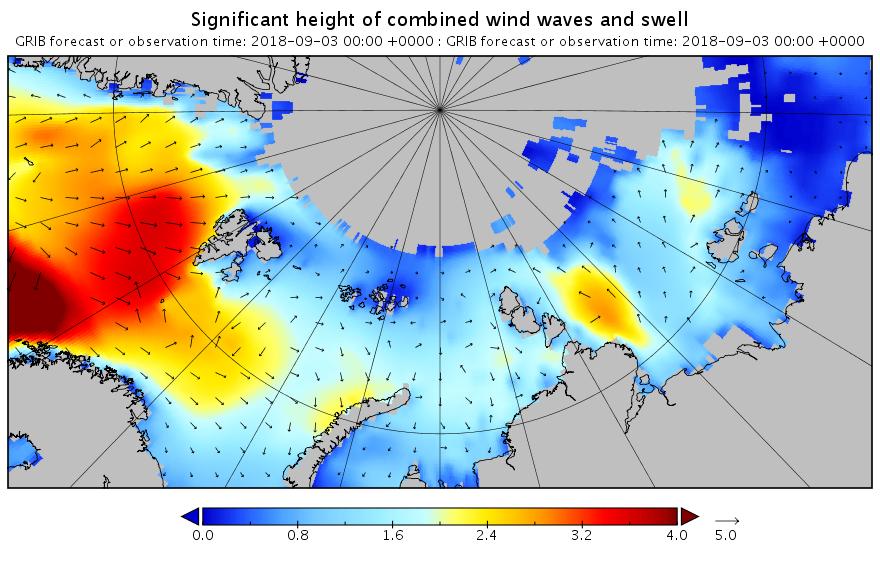
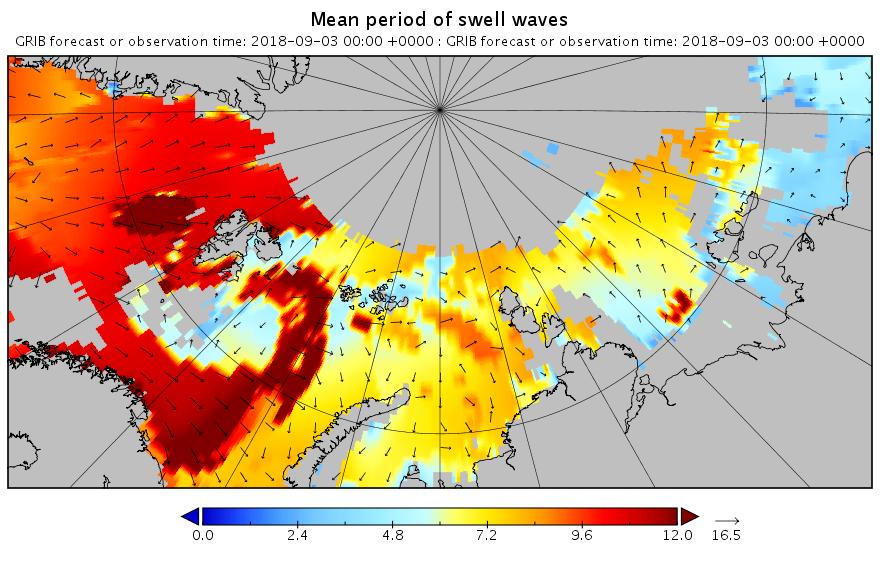
Here’s the WaveWatch III “hindcast” from midnight last night UTC for the Russian side of the Arctic Ocean:
There are still significant swells almost everywhere you look.
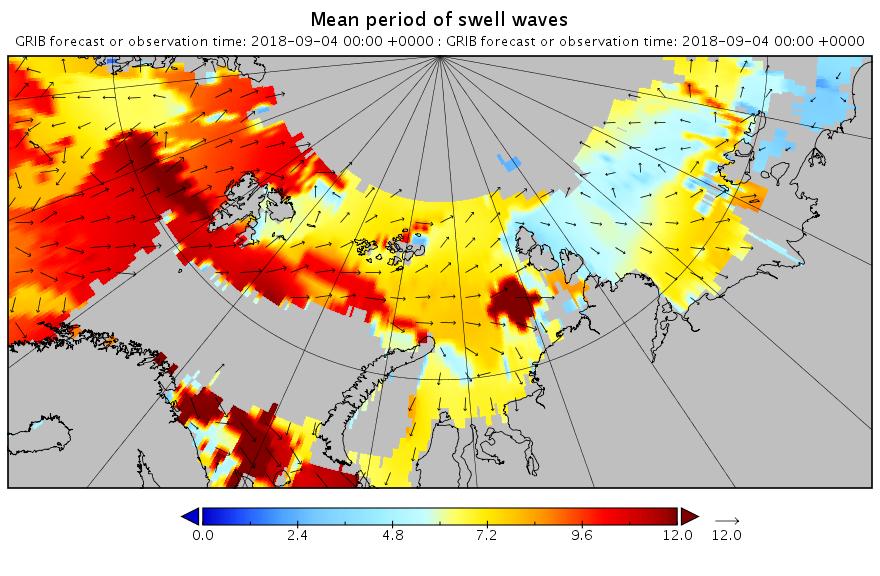
[Edit – September 4th]
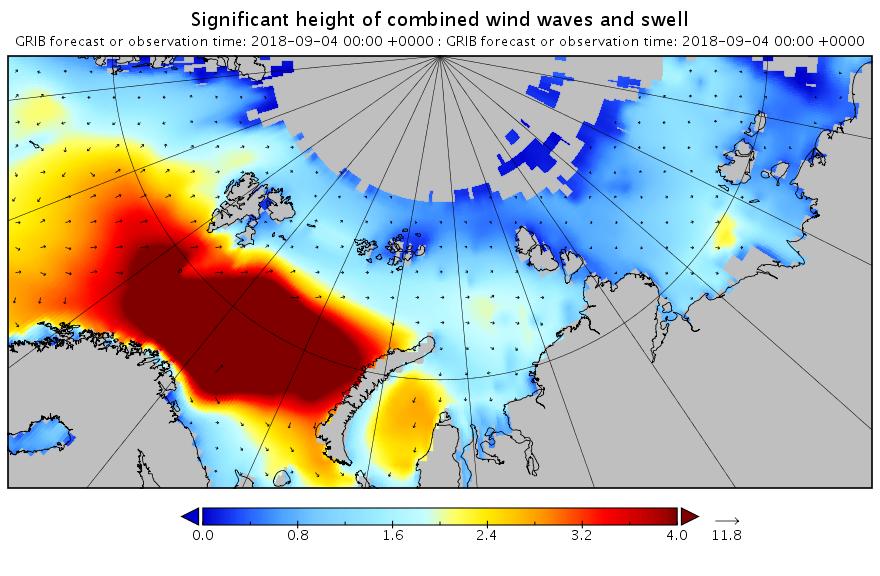
Using the same scales as yesterday, here’s today’s hindcast from midnight:
There’s still plenty of action in the Arctic Ocean!
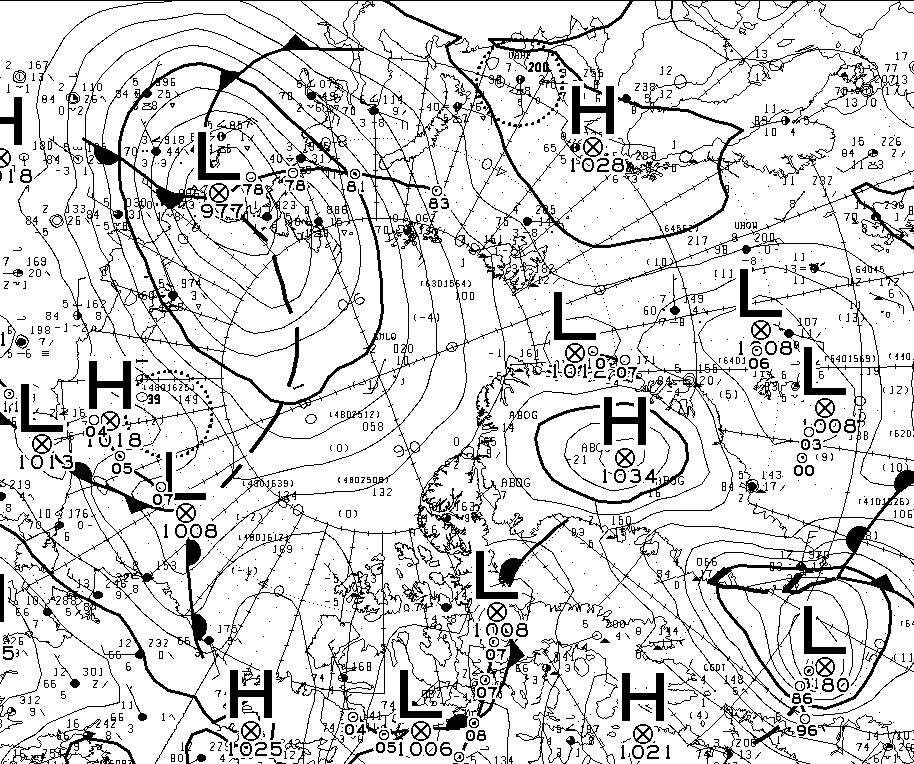
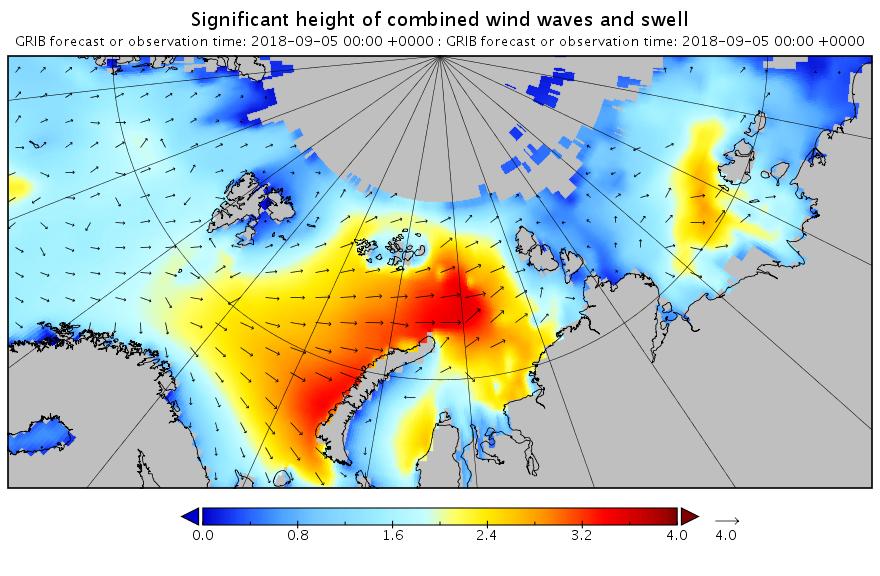
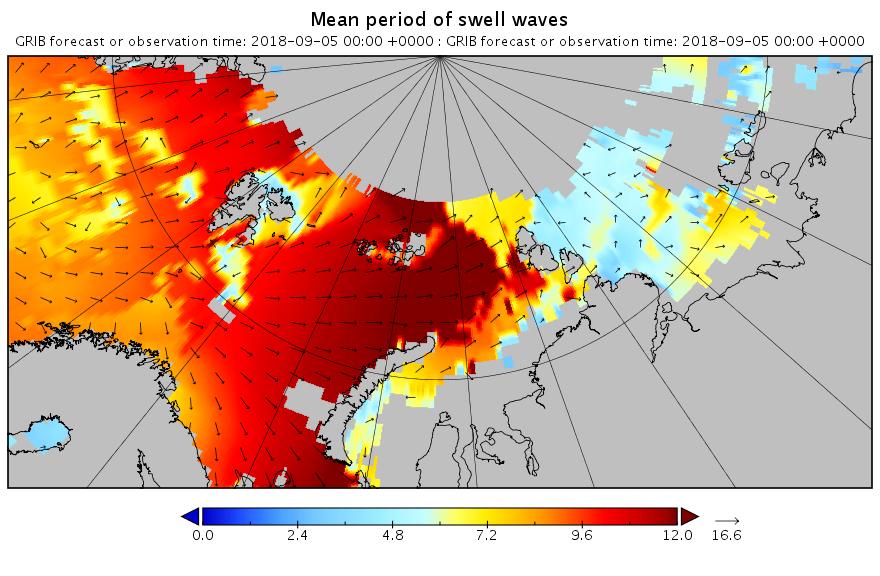
[Edit – September 5th]
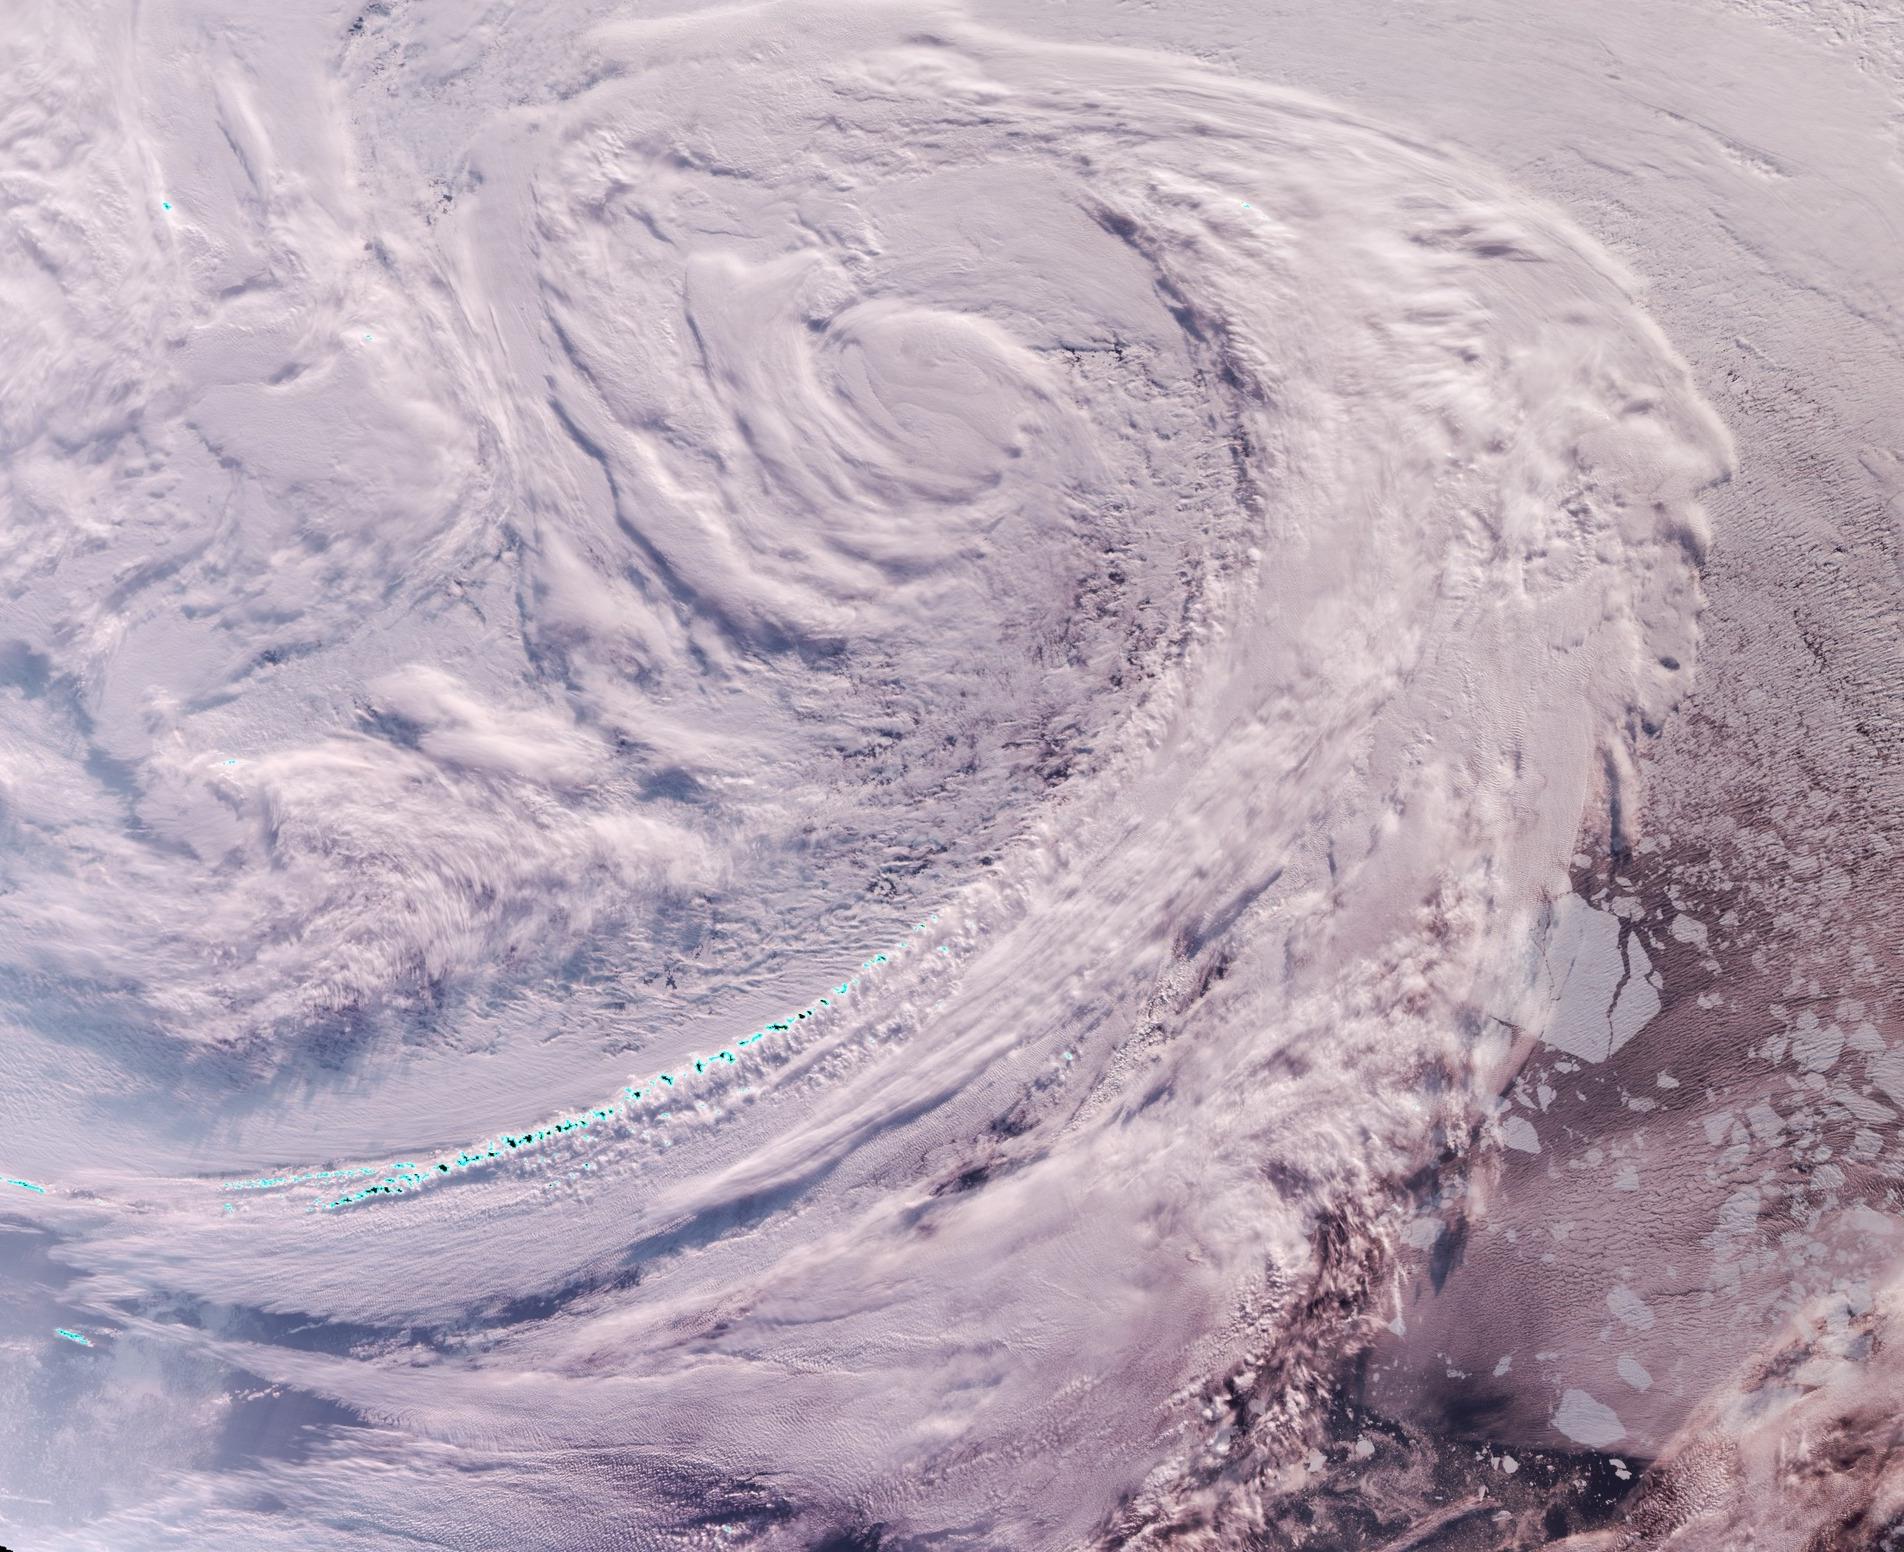
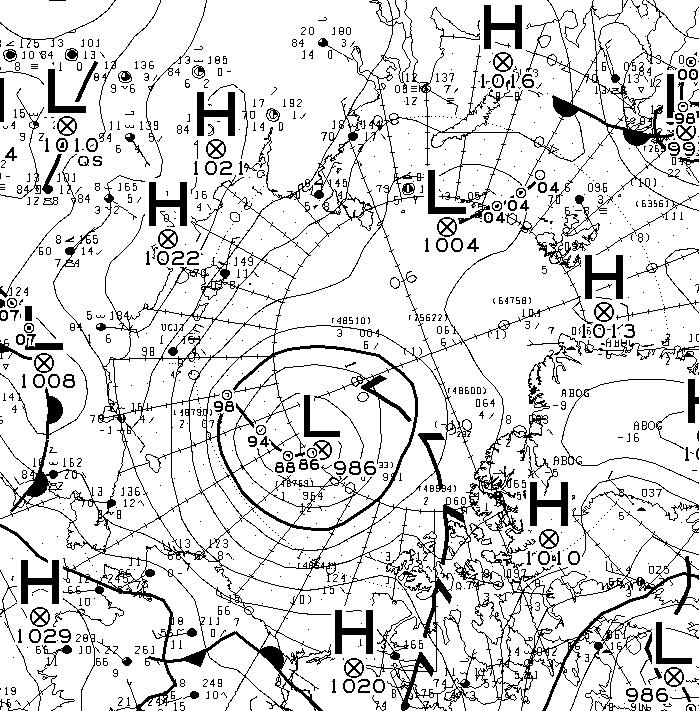
Feel free to debate whether it merits the “Great” prefix, but this is how the early September 2018 Arctic cyclone has panned out. According to this morning’s Environment Canada synopsis the cyclone is centred near the coast of the Laptev Sea and is down to a MSLP of 977 hPa:
Here’s another WaveWatch III hindcast from midnight UTC:
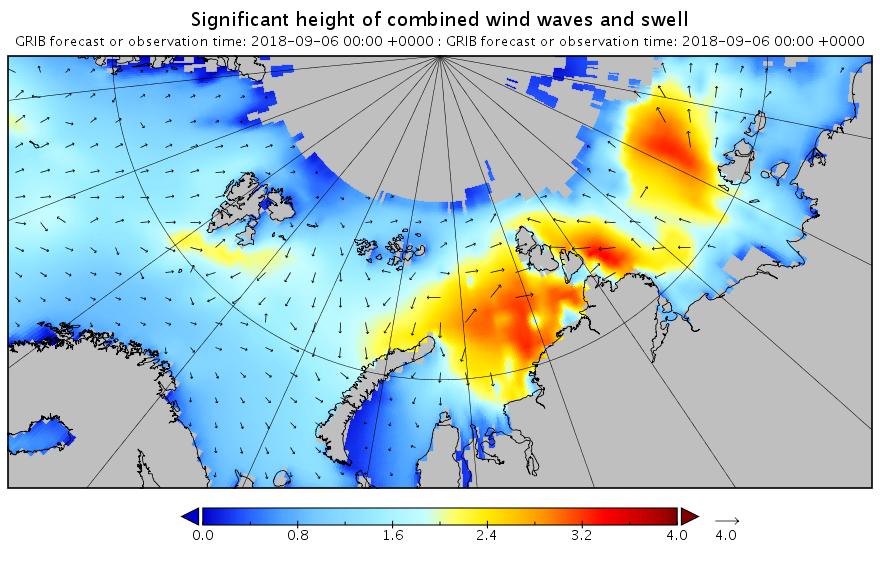
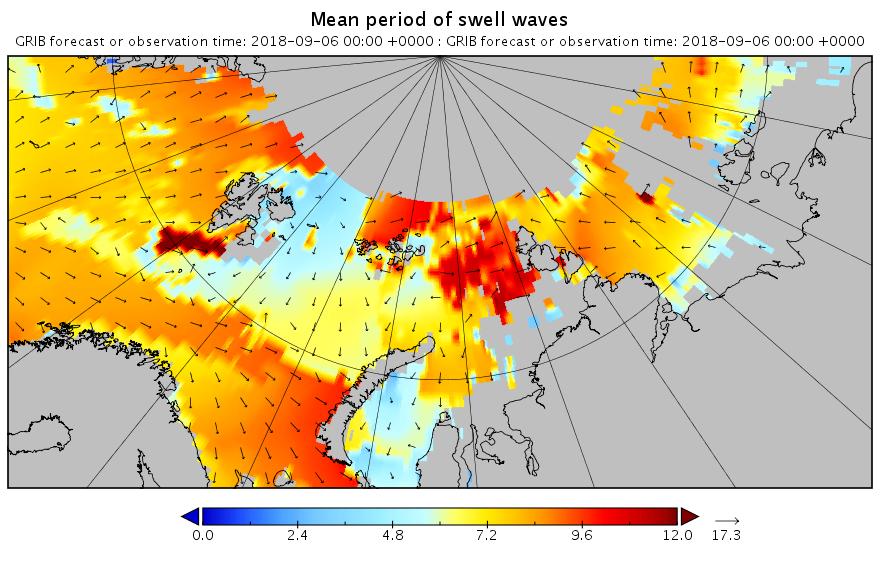
[Edit – September 6th]
Need I say more?
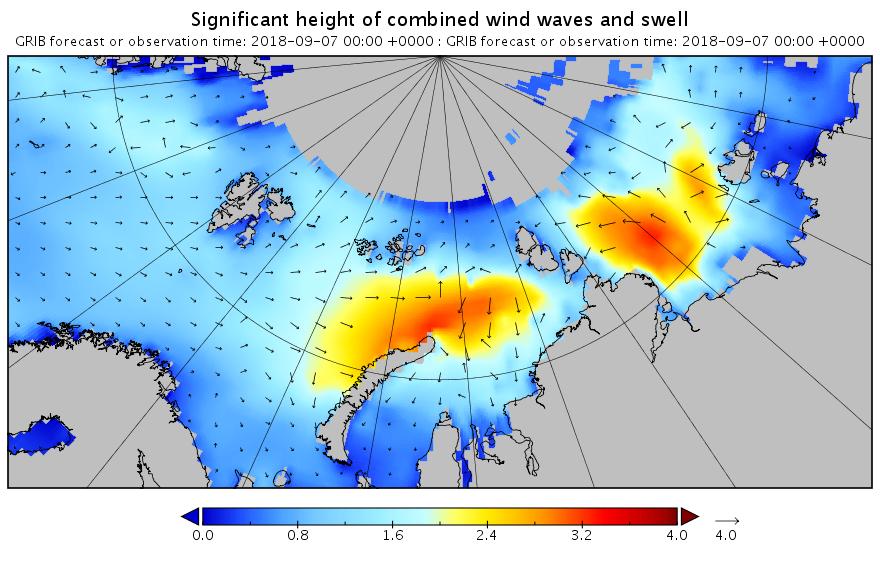
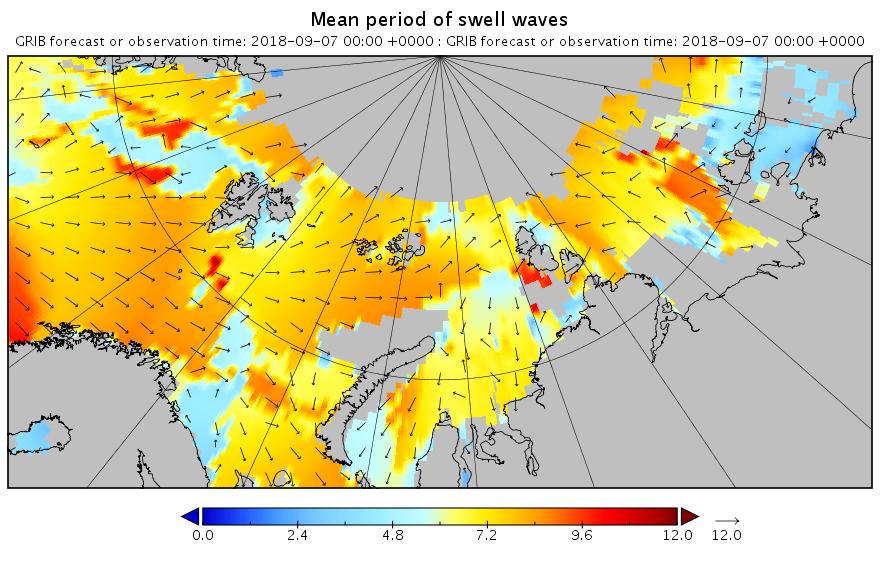
[Edit – September 7th]
The swell in the Fram Strait an Barents Sea is diminishing, but the period in the Laptev Sea is increasing now:
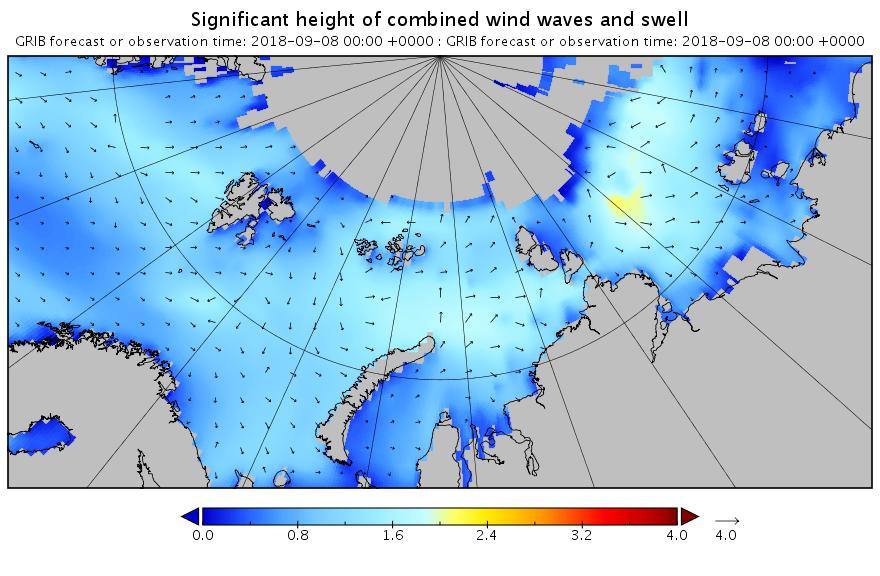
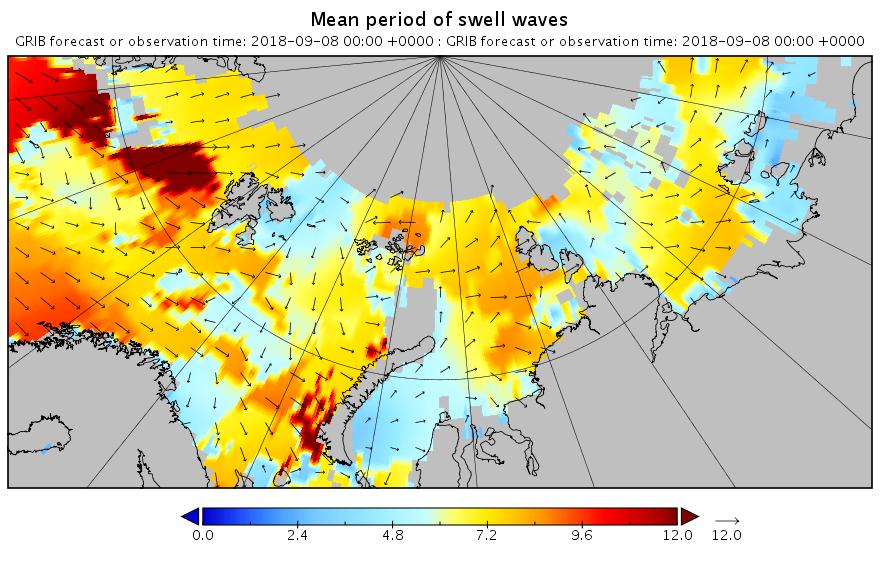
[Edit – September 8th]
All the wave activity in the Laptev Sea is diminishing. Here’s the hindcast from midnight:
Meanwhile things are warming up in the Chukchi and Beaufort Seas. Here’s the forecast for midnight tonight:
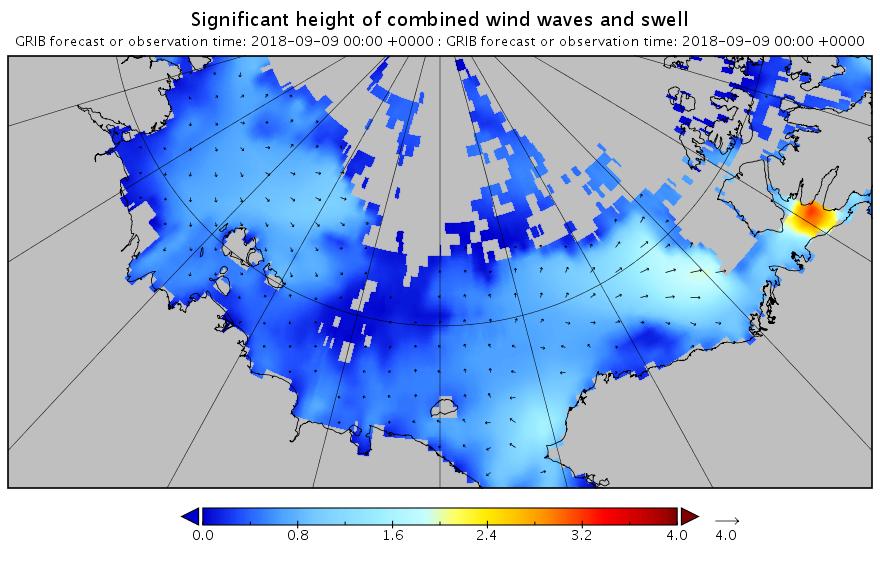
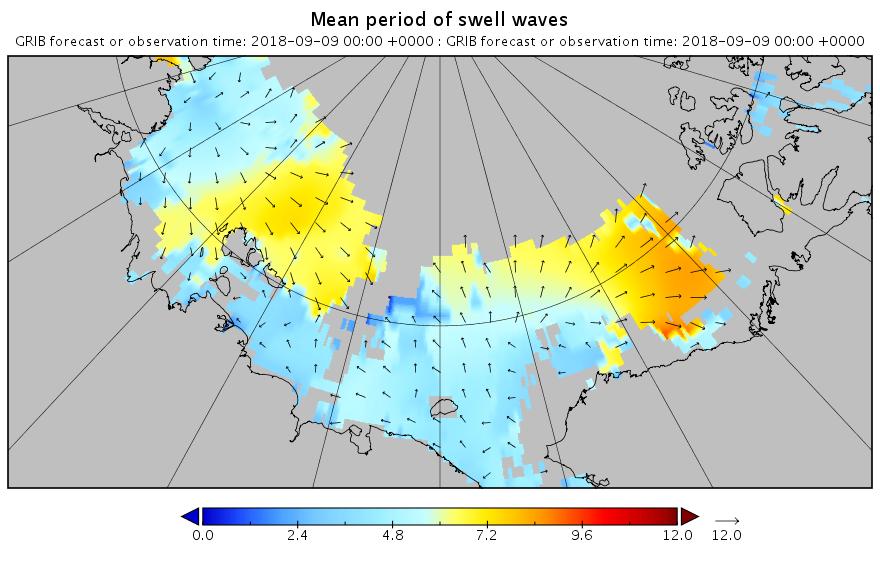
[Edit – September 9th]
Here’s the hindcast for this morning’s swell in the Beaufort Sea:
This is currently a long way into the future and hence may not verify in practice. However any pulse of swell is currently forecast for September 13th:
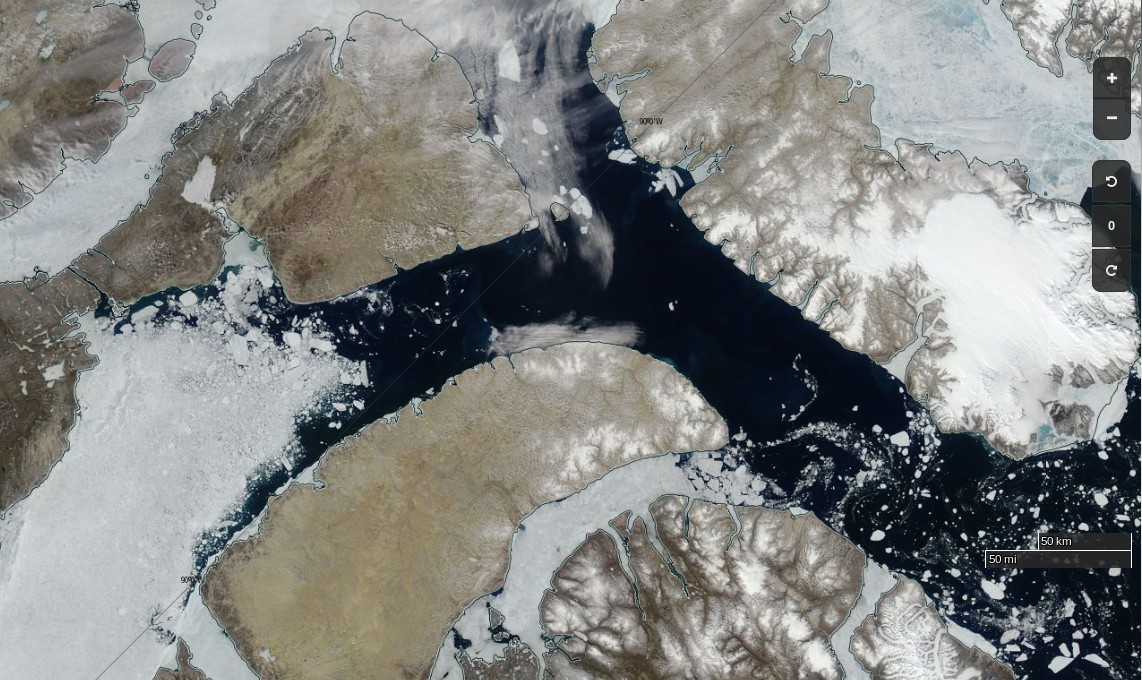
The time has come to start speculating about if, and when, the Northwest Passage will become navigable for the host of small vessels eager to traverse it this summer. Almost one month later than in 2017!
Whilst the eastern and western entrances to the assorted routes through the Canadian Arctic Archipelaga have been empty of sea ice for quite some time, the central section between Bellot Strait and Gjoa Haven and/or Cambridge Bay is still chock a block:
In the east here is a drone’s eye view of Cumming Inlet, courtesy of the Polish team of Michał and Ola Palczyński aboard S/V Crystal:
created by dji camera
It’s not entirely clear when that picture was taken, since according to Michał’s blog:
The waters beyond the Bellot Strait are covered with impassable ice, and the ice in the Beaufort Sea has 90% concentration in some places and reaches up to the shore. In this difficult situation, by 15th August two yachts have already given up and turned back to Greenland (including Blue Peter from our cove).
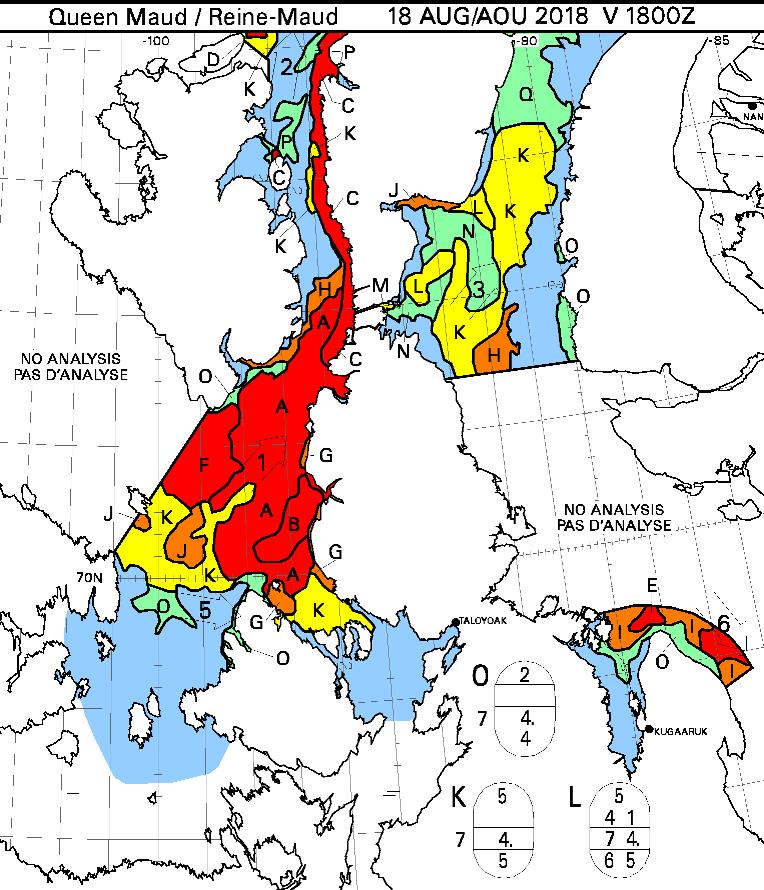
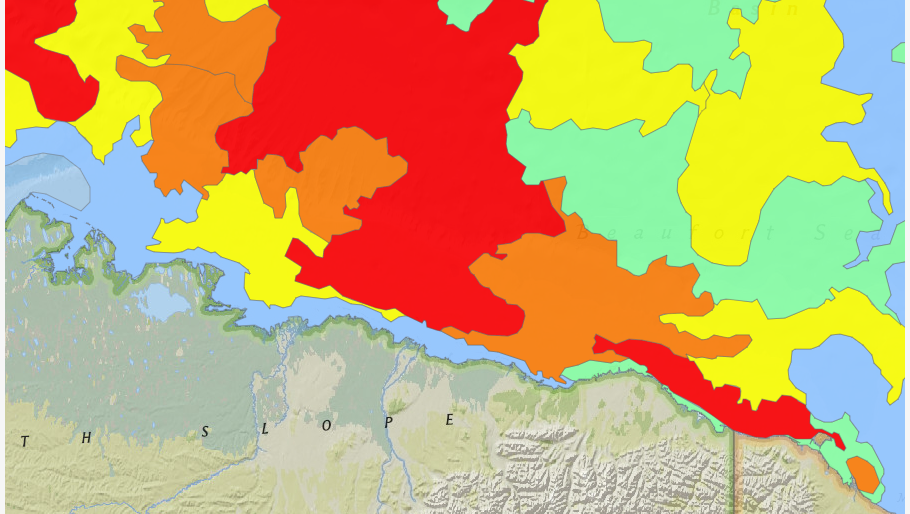
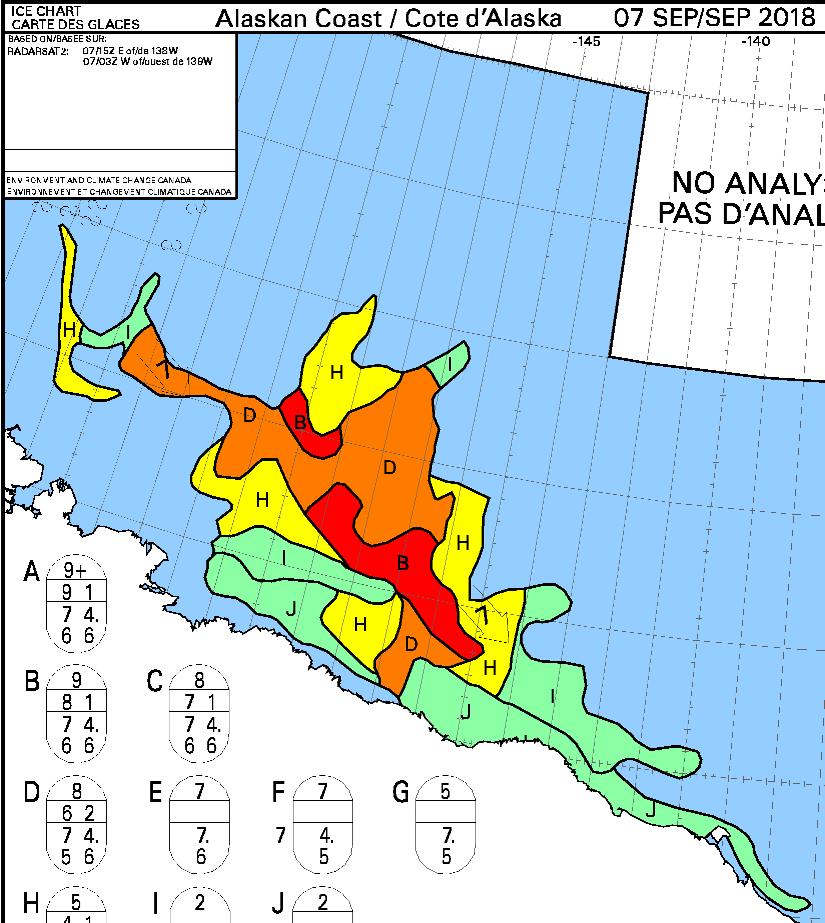
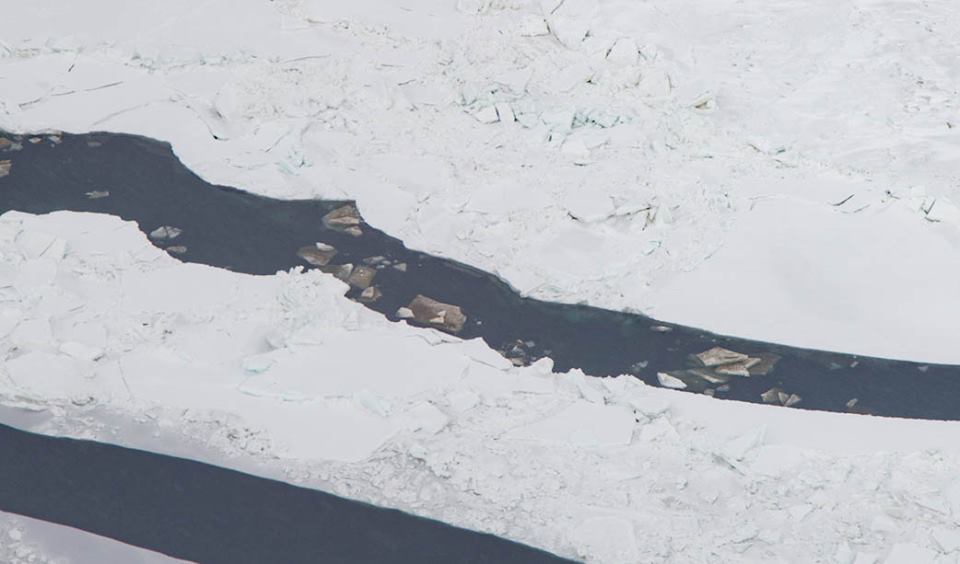
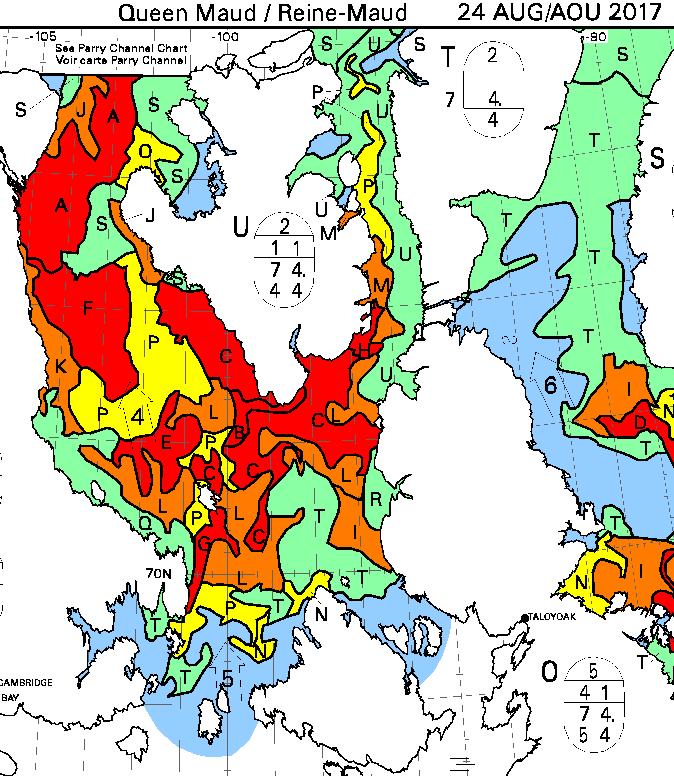
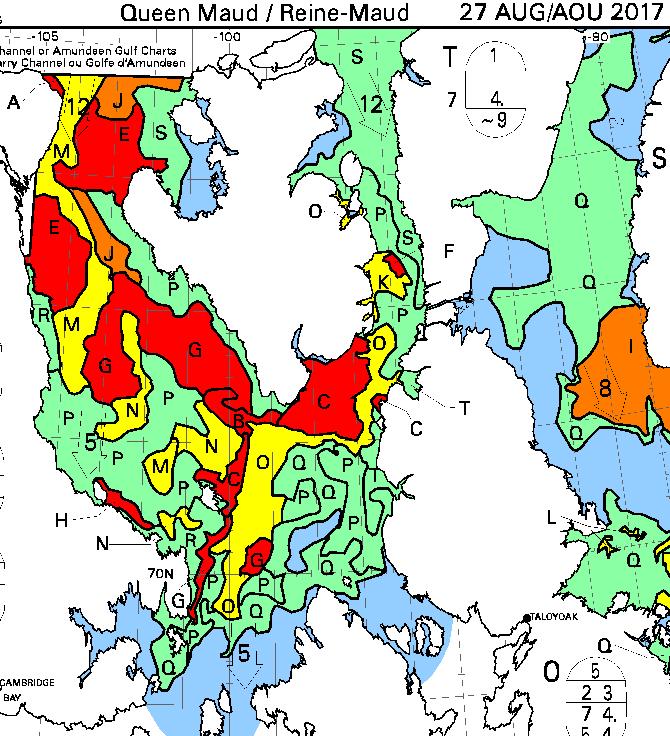
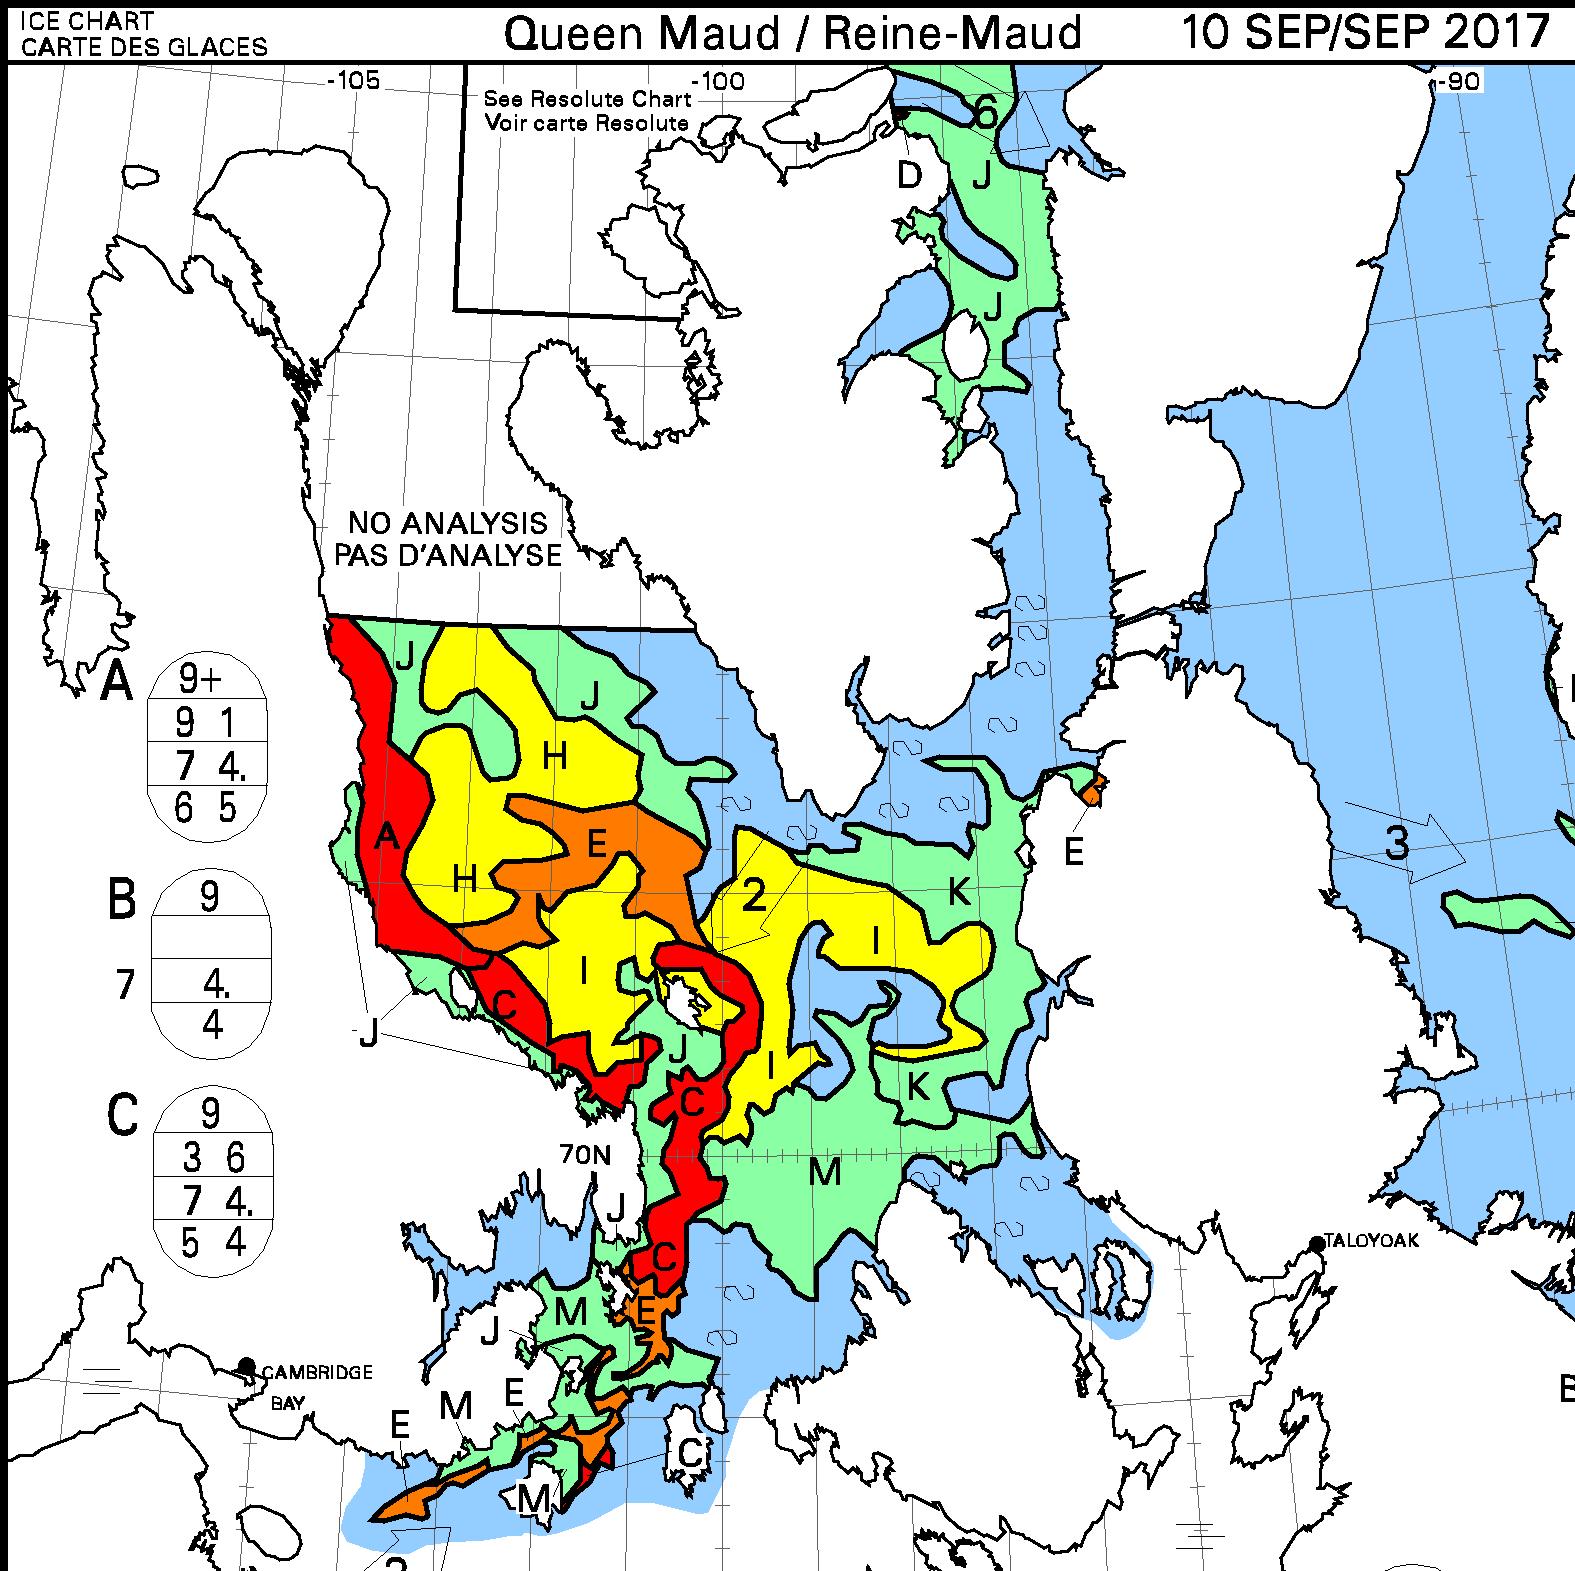
Here’s what lies ahead of Crystal and her remaining companions, according to the Canadian Ice Service:
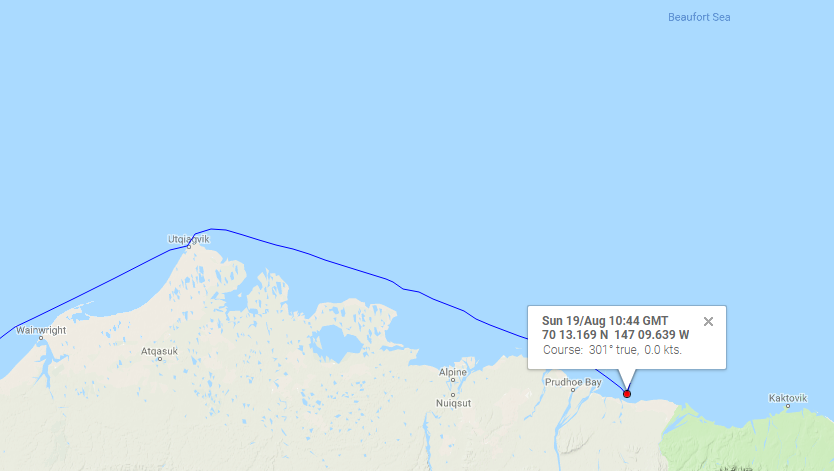
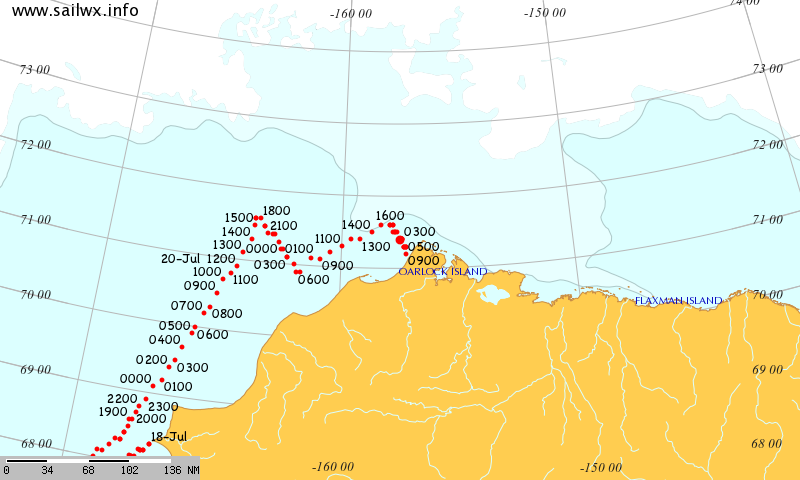
Meanwhile in the Beaufort Sea S/V Dogbark has been battling her way through that “90% concentration” sea ice. Dogbark has now made it as far as Mikkelsen Bay, just past Prudhoe Bay in Alaska:
What does 7/10ths ice mean? We don’t want to know! It is more ice than we want to try and pass, that’s for sure. But the ice charts we look at refer to ice by % of sea coverage, so 7/10ths would look like water mostly covered by large, immovable objects. 5/10ths was as much as we have seen, and we got out of there as fast as we could with some help from our flying eyeball. See Dogbark’s Facebook page for a quick snippet of less dangerous ice.
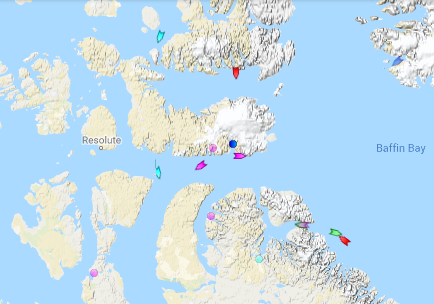
Meanwhile the Canadian icebreaker CCGS Amundsen has sailed past Arctic Bay and Resolute:
I cannot help but wonder what vessels might be closely following in his wake?
[Edit – September 7th]
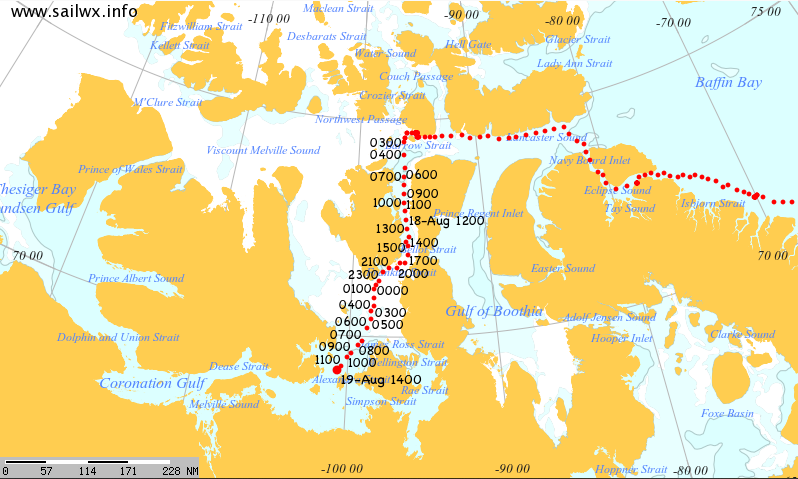
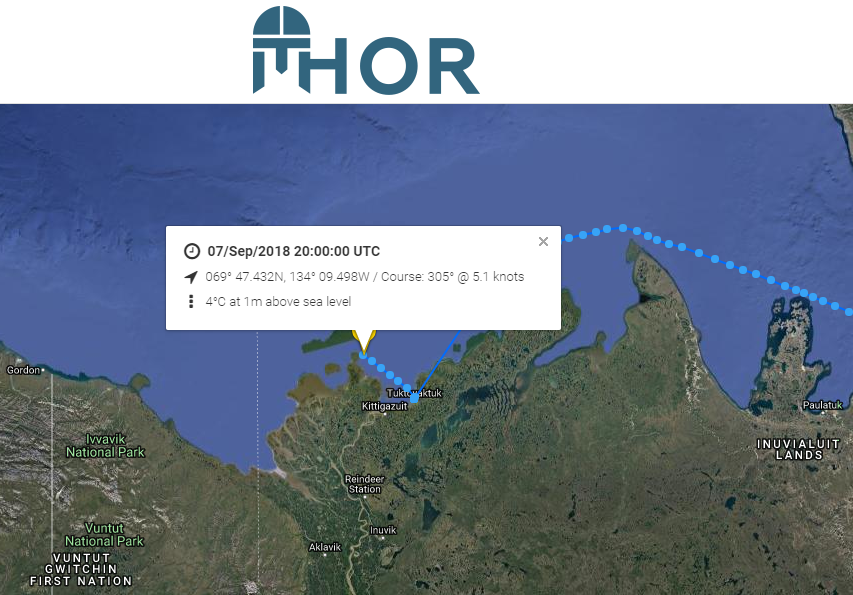
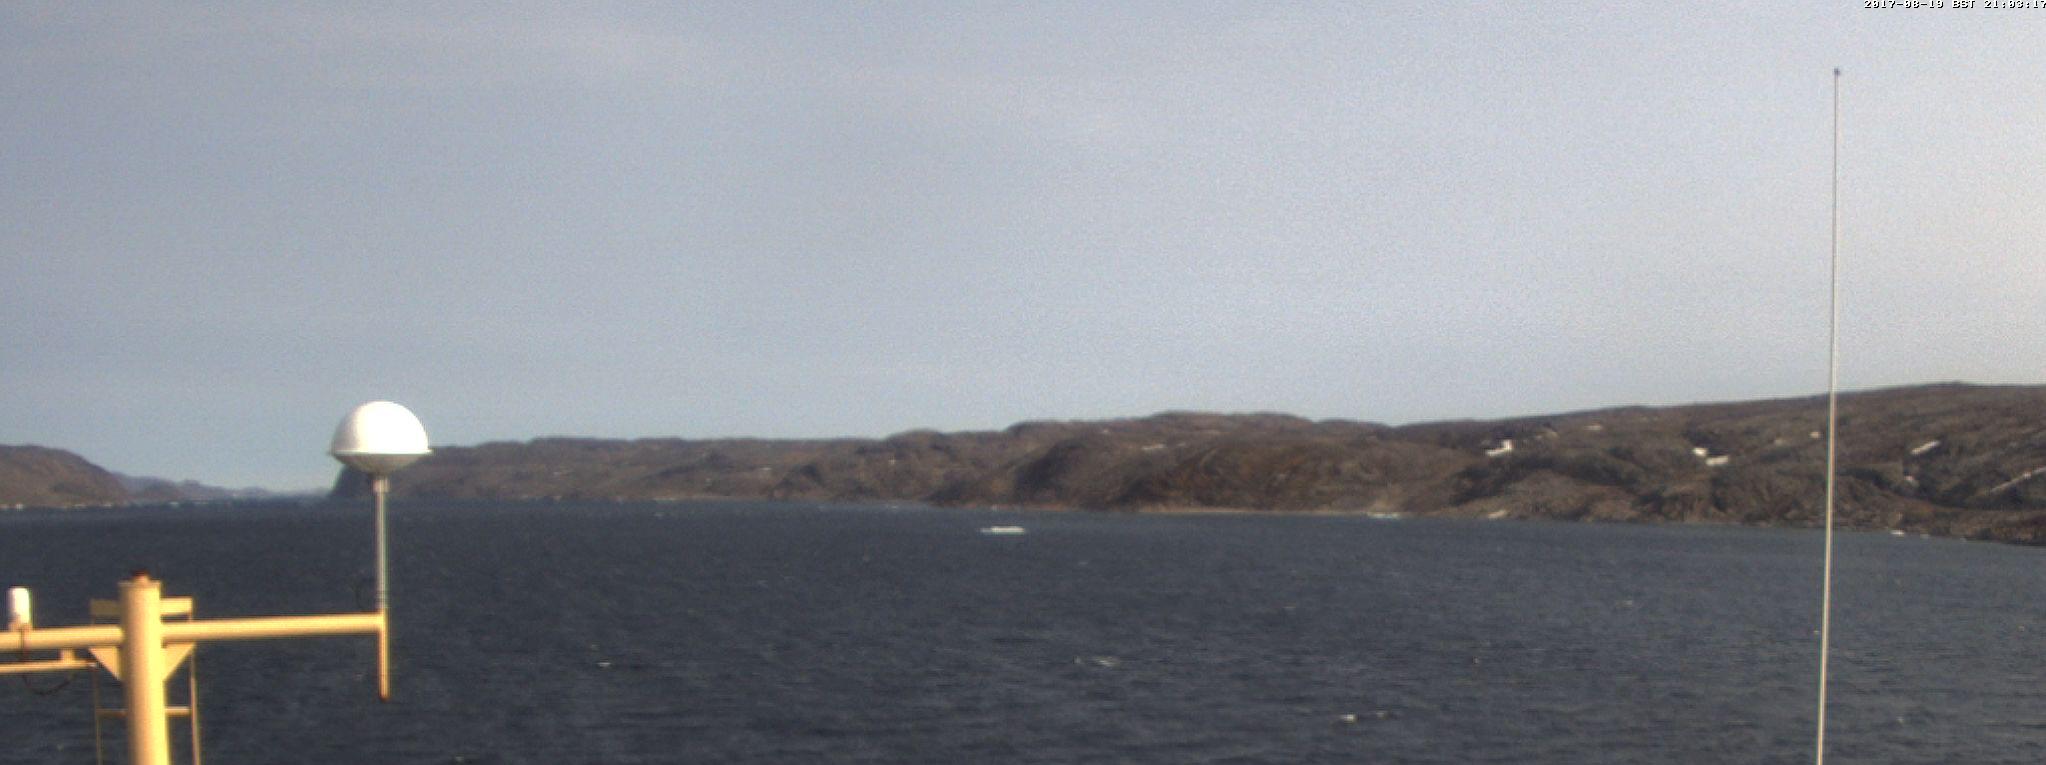
Finally there comes news that a “pleasure craft” has made it through the Canadian Arctic Archipelago from east to west as far as Tuktoyaktuk. I’d been wondering which vessel it was that seemed immobile near the western end of the Bellot Strait on the MarineTraffic maps. This one’s from August 19th:
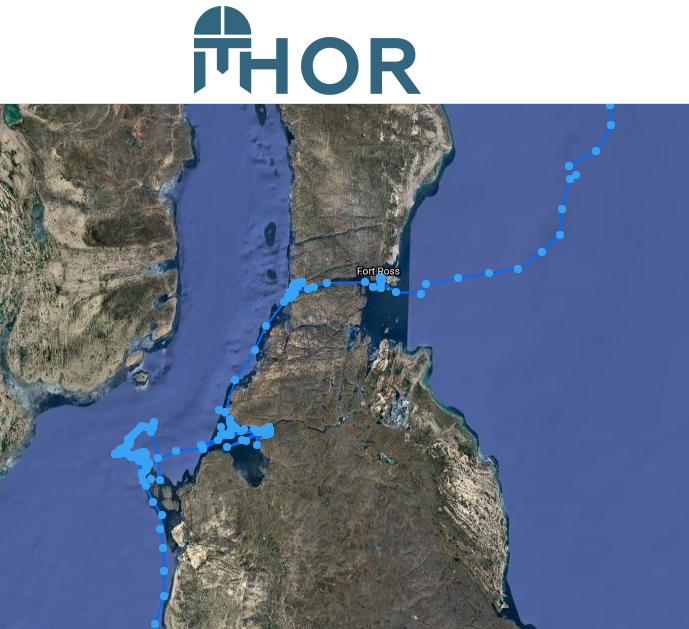
Now I know! Thanks to a heads up on the Arctic Sea Ice Forum I’ve discovered that it’s the S/V Thor. Here’s the tracking map of his efforts to get through all the old ice in the vicinty.
The map reveals that Thor made it through the Bellot Strait on August 6th, but didn’t manage to make significant headway out of the Franklin Strait until August 28th.
In certain quarters it is being claimed in slightly strange English that:
The British Navy takes part in ICEX exercises that take place every two years and last for several weeks. Royal Navy submarine HMS Trenchant broke through the Arctic ice about seven days ago to join two US submarines for the exercise. At the same time, US submarines Hartford and Connecticut were stuck in the Arctic ice as they were training an attack on Russia. According to the legend of the exercises, the US submarines were supposed to surface and strike conditional targets in Russia, but the thick ice prevented them from fulfilling the scenario of the exercise.
Royal Navy submarine HMS Trenchant has broken through the metre-thick ice of the Arctic Ocean to join two US boats on major exercise.
Ice Exercise 18 (ICEX) is a series of demanding trials in the frigid climate of the Arctic Circle, designed to test submariners’ skills in operating under the Arctic ice cap.
HMS Trenchant joins US submarines USS Connecticut and USS Hartford for the drills, co-ordinated by the US Navy’s Arctic Submarine Laboratory.
This combined team of military staff and scientists run the testing schedule from an ice camp established on an ice floe in the Arctic Ocean, north of Alaska.
Here is a video recording of HMS Trenchant getting “stuck in the Arctic ice”:
https://youtu.be/3EF3_plp8NQ
Here are some US Navy videos that reveal exactly how USS Connecticut and USS Hartford also became “stuck in the Arctic ice”:
Ice Camp Skate is a temporary ice camp that was established on a sheet of ice in the Arctic Ocean, known as an ice floe. Skate will serve as a temporary command center for conducting submarine operations, including under-ice navigation and torpedo exercises. The camp consists of shelters, a command center, and infrastructure to safely house and support more than 50 personnel at any one time.
The camp gets its namesake from USS Skate, the first submarine to surface through open water surrounded by ice in 1958, and the first submarine to surface through the Arctic ice at the North Pole in March 1959. Since the success of Skate’s surfacing, Arctic operations have been a crucial part of the missions conducted by nuclear submarines.
For more than 70 years, submarines have conducted under-ice operations in the Arctic regions in support of interfleet transit, training, cooperative allied engagements and routine operations.
The U.S. submarine force has completed more than 27 Arctic exercises.
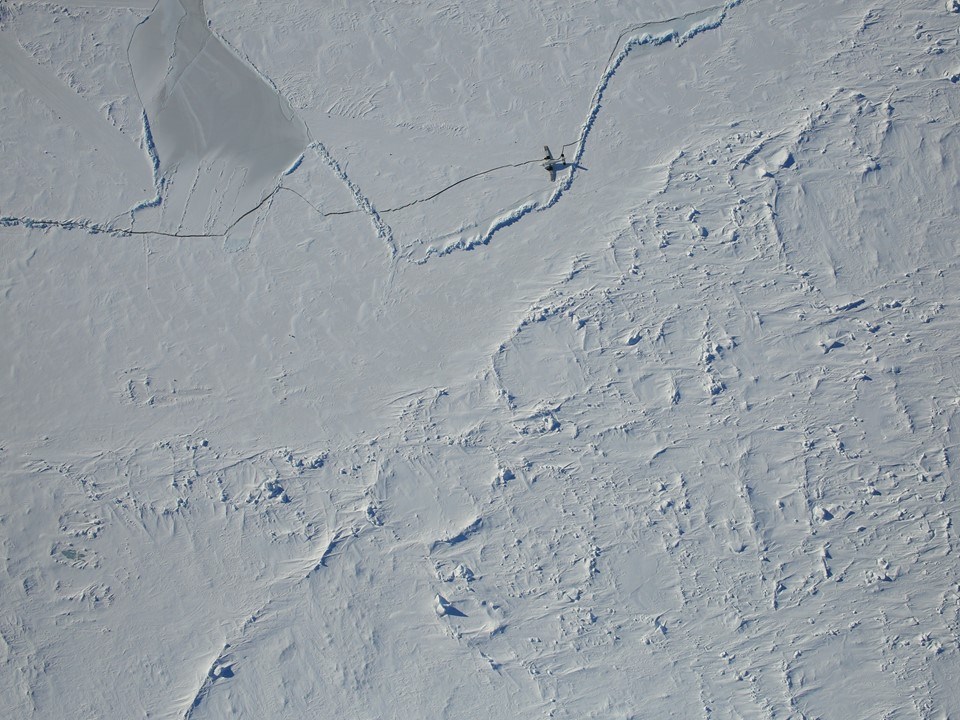
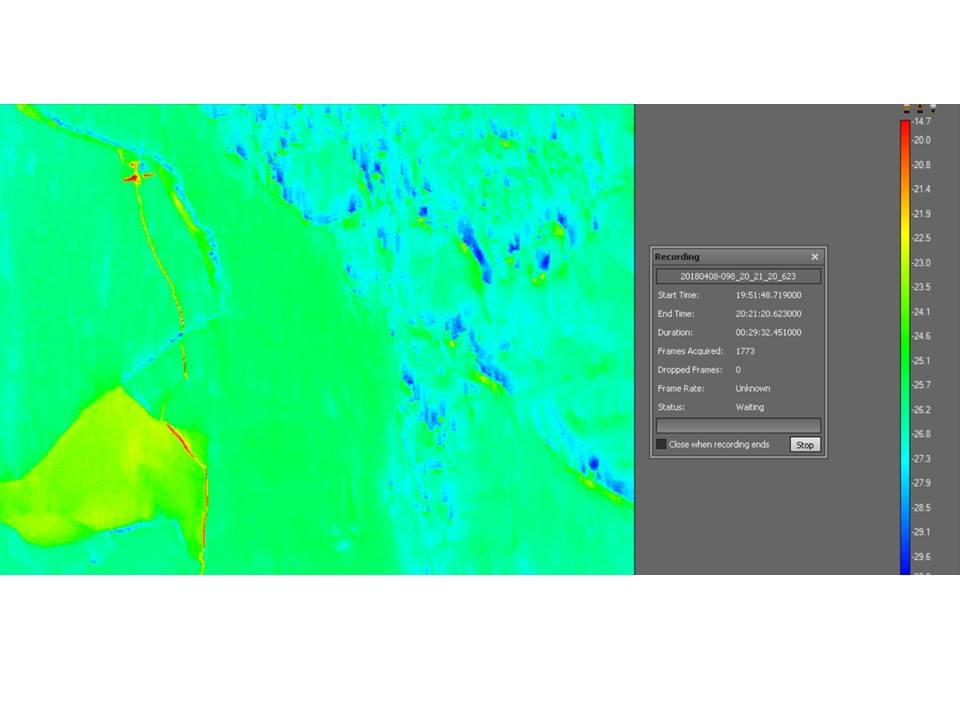
[Edit – April 10th]
NASA’s Operation IceBridge have released some images of the now abandoned ICEX 2018 site on their Facebook page. They include a damaged and apparently abandoned Twin Otter aircraft:
The time has come to start speculating about if, and when, the Northwest Passage will become navigable for the host of small vessels eager to traverse it this summer. The west and east entrances are clearing early this year. Lancaster Sound and Prince Regent inlet already reveal only a few area of white amongst the deep blue open water:
NASA Worldview “true-color” image of Lancaster Sound and Prince Regent Inlet on July 8th 2017, derived from the MODIS sensor on the Aqua satellite
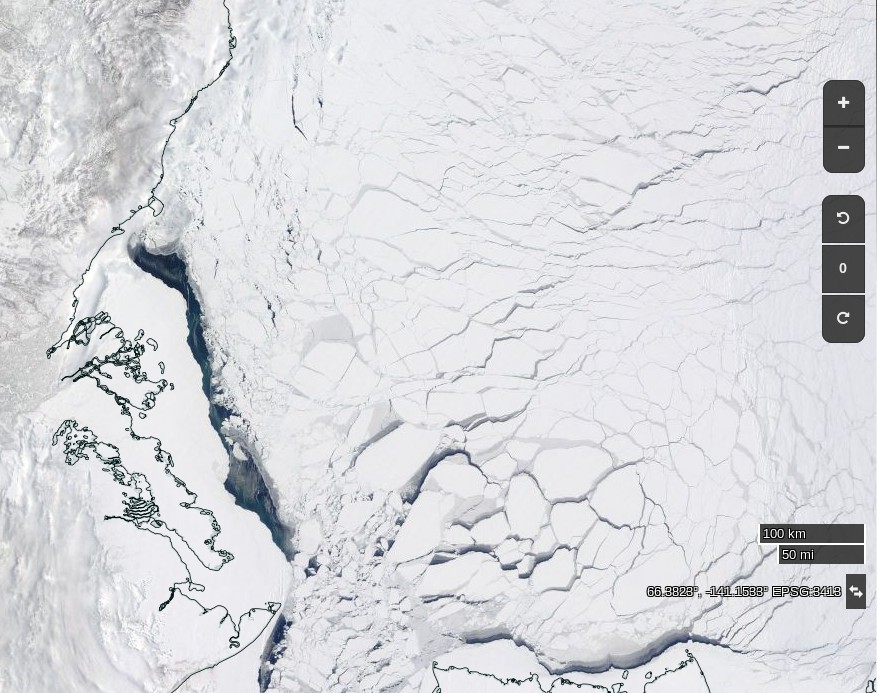
To the west the route is already opening up all the way from the Chukchi Sea to Cambridge Bay:
NASA Worldview “true-color” image of the Beaufort Sea on July 12th 2017, derived from the MODIS sensor on the Terra satellite
The problems on the southern route seem likely to arise in the central section this year, where far more old ice is present this year than in 2016:
The remaining sea ice in Queen Maud Gulf doesn’t look like it will last long, but the ice in Victoria Strait and Larsen Sound is made of much sterner stuff:
NASA Worldview “true-color” image of Victoria Strait and Larsen Sound on July 10th 2017, derived from the MODIS sensor on the Terra satellite
The cruise liner Crystal Serenity is anticipating navigating those waters once again this year, on August 29th. However much smaller craft are already heading for the Northwest Passage. Celebrate and Alkahest are already sailing north along the west coast of Greenland. Meanwhile Yvan Bourgnon is due to depart Nome, Alaska tomorrow, sailing his catamaran single handed in the opposite direction.
The crew of the Coast Guard Cutter Maple, a 225-foot seagoing buoy tender home ported in Sitka, Alaska, departed [July 12th] on a historic voyage through the Northwest Passage.
This summer marks the 60th anniversary of the three Coast Guard cutters and one Canadian ship that convoyed through the Northwest Passage. The crews of the U.S. Coast Guard Cutters Storis, SPAR and Bramble, along with the crew of the Canadian ice breaker HMCS Labrador, charted, recorded water depths and installed aids to navigation for future shipping lanes from May to September of 1957. All four crews became the first deep-draft ships to sail through the Northwest Passage, which are several passageways through the complex archipelago of the Canadian Arctic.
The crew of the cutter Maple will make a brief logistics stop in Nome, Alaska, to embark an ice navigator on its way to support marine science and scientific research near the Arctic Circle. The cutter will serve as a ship of opportunity to conduct scientific research in support of the Scripps Institution of Oceanography.
The Maple crew will deploy three sonographic buoys that are used to record acoustic sounds of marine mammals. A principal investigator with the University of San Diego embarked aboard the cutter will analyze the data retrieved from the buoys.
The Canadian Coast Guard Ship Sir Wilfrid Laurier will rendezvous with the Maple later this month to provide icebreaking services as the Maple makes it way toward Victoria Strait, Canada. The Maple has a reinforced hull that provides it with limited ice breaking capabilities similar to Coast Guard 225-foot cutters operating on the Great Lakes.
There doesn’t seem to be any up to date tracking information for the Maple, but CCGS Sir Wilfrid Laurier has recently arrived off Utqiaġvik (Barrow as was):
[Edit – August 18th]
Another article by Chris Mooney in the Washington Post includes this image of the eastern entrance to Bellot Strait on August 11th:
According to Chris:
After we’d passed through safely, Claude Lafrance, the ship’s commanding officer, took some time to explain how the strait worked with the help of a navigational chart. In the process, he lent credence to some of the observations made by Larsen over 70 years ago, while also explaining how modern knowledge has made navigating it safe with a proper tidal understanding.
The essence is that depending on when you are in Bellot Strait, the waters can be flowing either westward or eastward at and around high or low tide, respectively. So timing your crossing makes a great deal of difference.
The danger is that if you’re coming from the west (as we were) with the current to your back, you can be moving too fast, and have difficulty steering your vessel as you approach rocks at the end of the strait.
“We always want to go through where it’s more difficult, with the current against you, because it’s a lot easier to control the movement of your ship,” Lafrance said.
Therefore, the two-hour wait was quite intentional: The CCGS Amundsen stayed put until the tide began to shift and the waters to flow back westward, in effect neutralizing the current. Then the ship steamed out easily. “We just passed at the ideal time to go through,” Lafrance said.
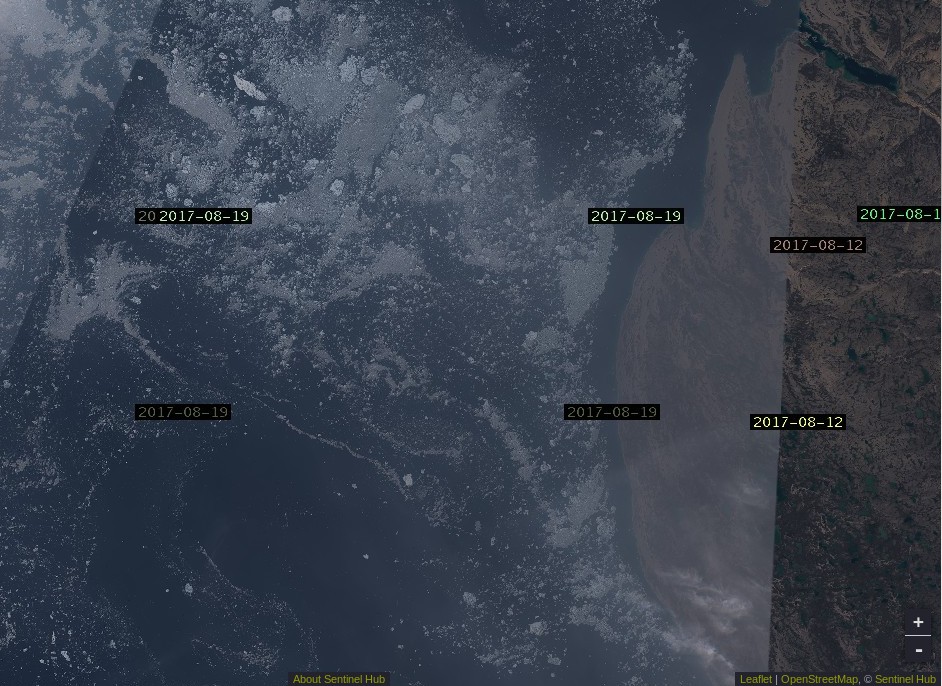
Here’s Sentinel 2A’s view of what he should expect to see in Larsen Sound after emerging at the other end:
[Edit – August 21st]
From the RRS Ernest Shackleton in Franklin Strait or thereabouts:
[Edit – August 22nd]
From the C3 expedition, also in the Franklin Strait area by the look of things:
Yesterday, we broke through ice that was two metres thick. Thank you to the Canadian Ice Service for ensuring our safe passage! #CanadaC3pic.twitter.com/2nCgalwPOo
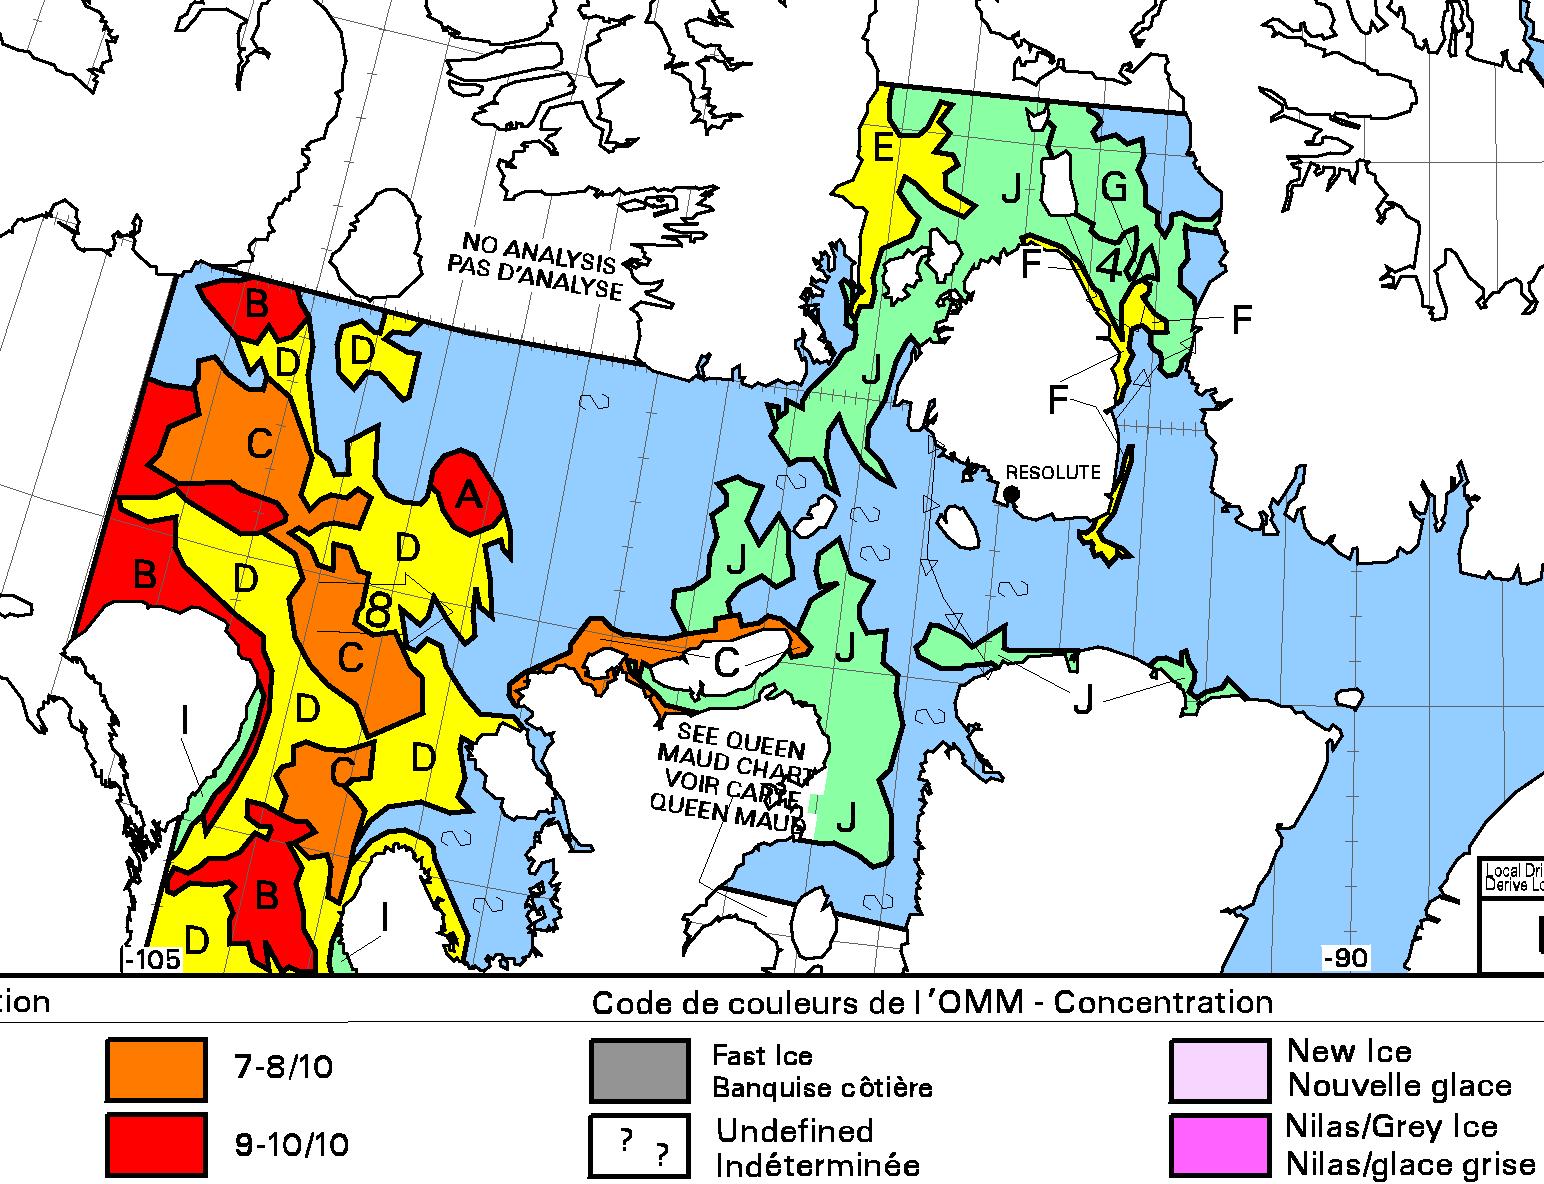
The latest CIS ice chart reveals a circuitous route via McClintock Channel that is ALMOST <= 6/10 concentration. Meanwhile Larsen Sound is still refusing to open up for the imminent arrival of the Crystal Serenity:
[Edit – August 27th]
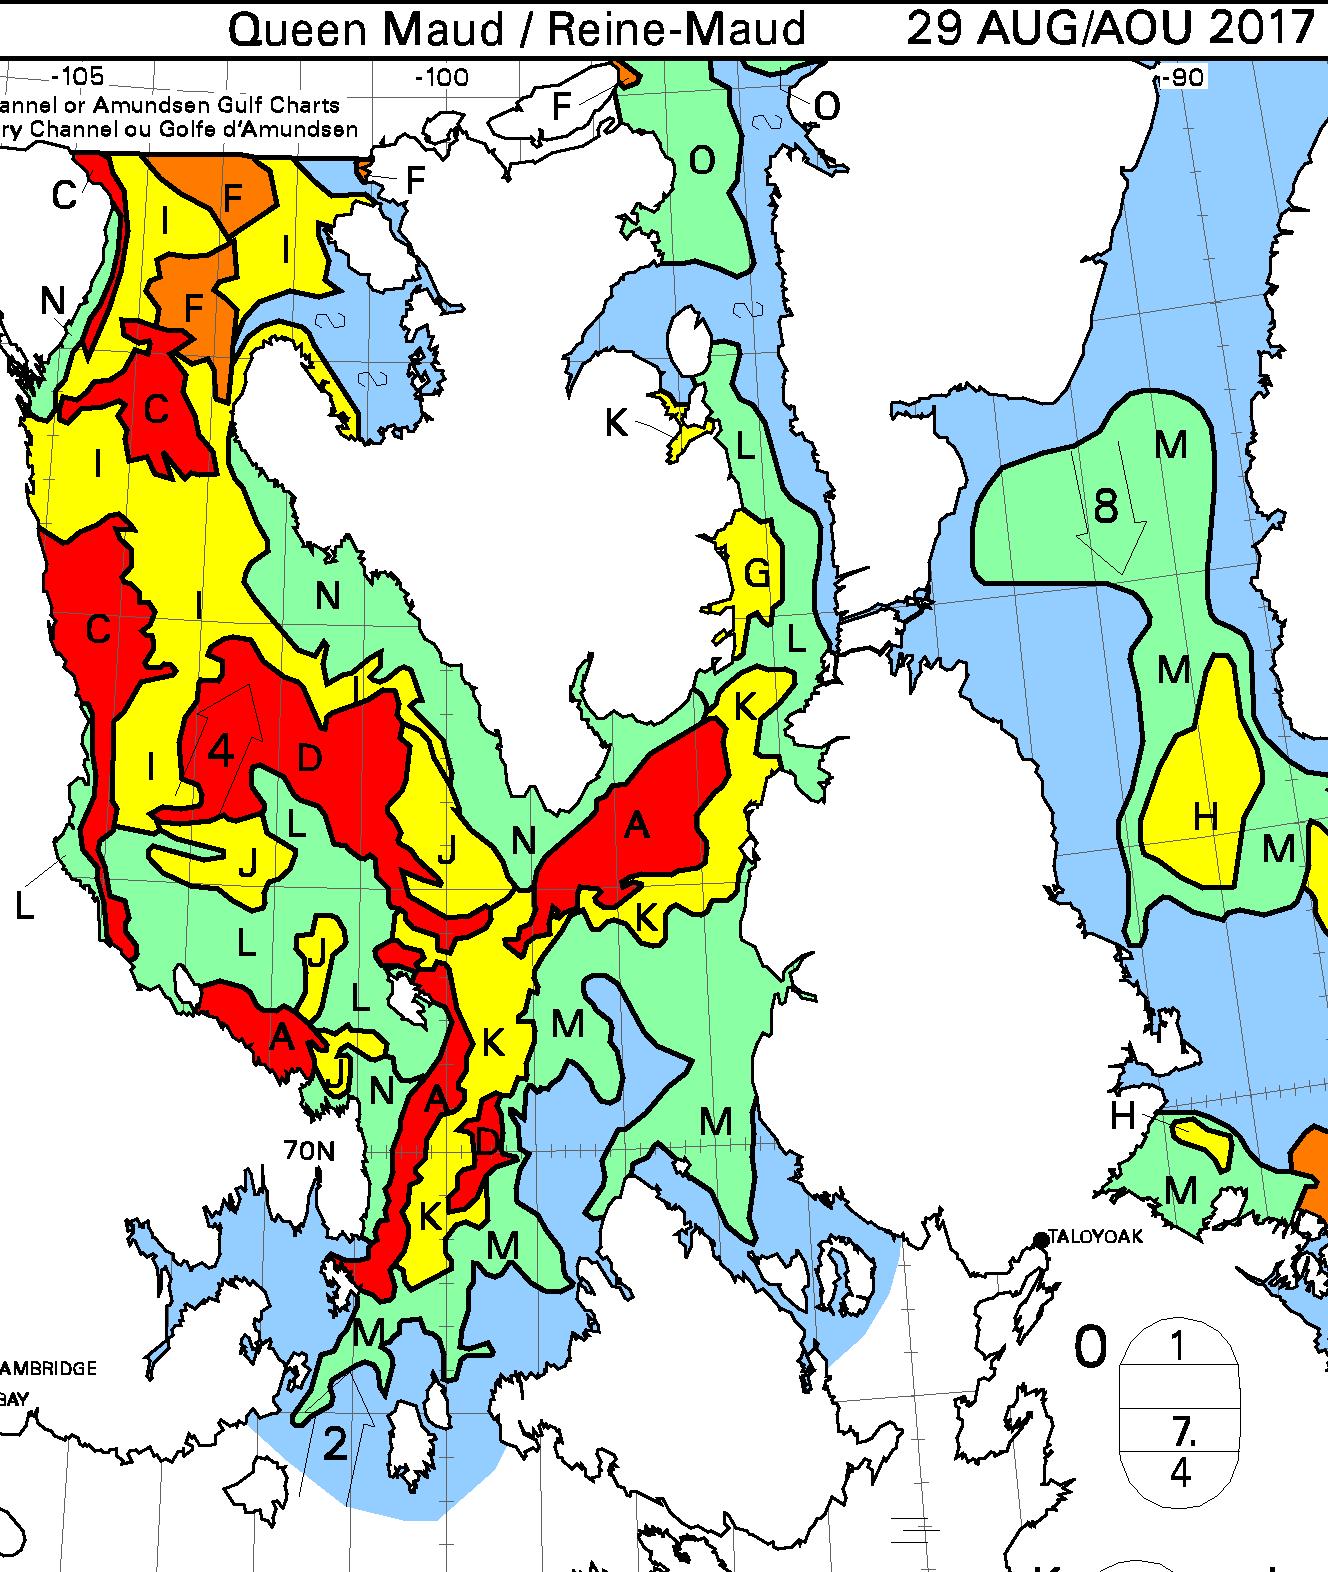
At long last the CIS concentration map reveals a <= 6/10 concentration path along the entire southern route via Bellot Strait:
[Edit – August 29th]
It is now possible to squeeze through Roald Amundsen’s route through the Northwest Passage without encountering over 6/10 concentration sea ice:
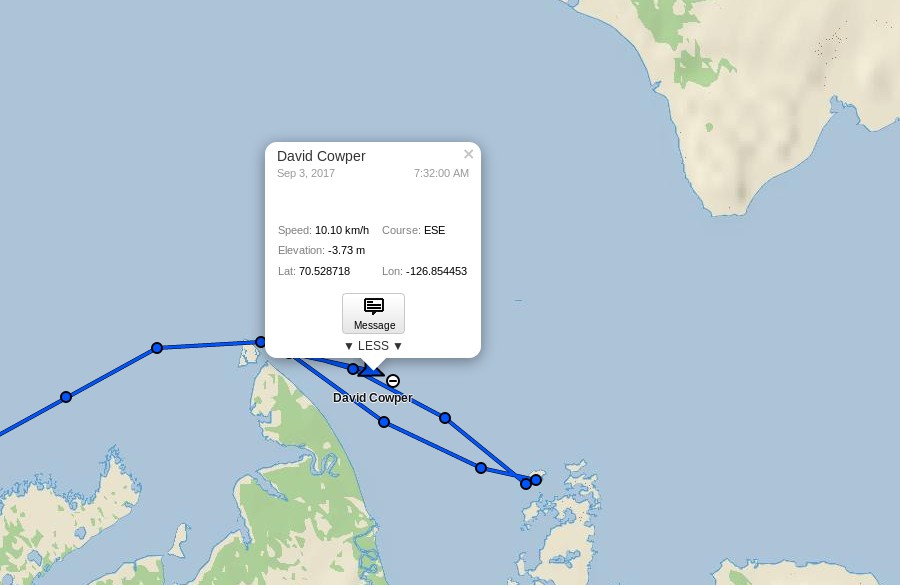
David Scott Cowper sought shelter for Polar Bound in the welcoming arms of Booth Island for a couple of days. Now they’re off again and have taken another close look at Cape Bathurst, but which route will they take now?
[Edit – September 10th]
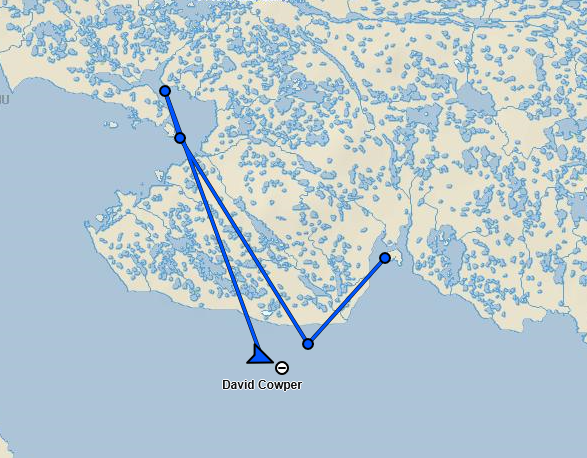
David Scott Cowper has left Cambridge Bay in Polar Bound and is heading east:
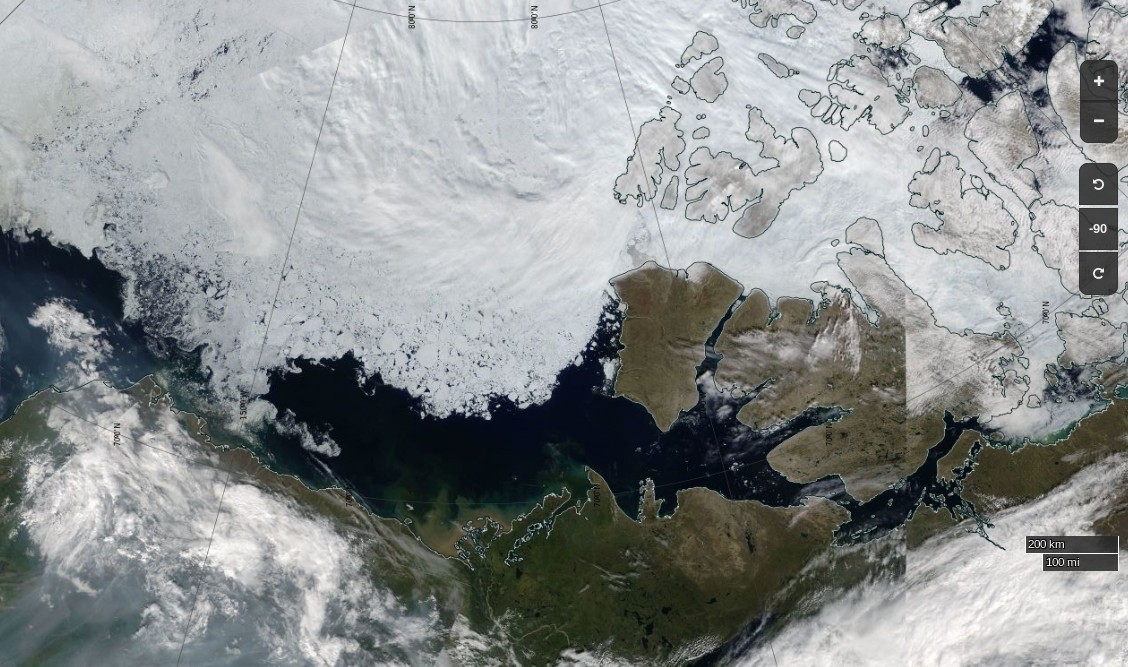
Before we got on to the more usual Arctic metrics let’s bear in mind that the beginning of May is the time when the ice on the mighty Mackenzie River begins to break up, ultimately sending a surge of (comparatively!) warm water rushing into the Beaufort Sea. The patches of open water visible in the Beaufort Sea off the Mackenzie Delta in early April refroze, but have recently opened up once again:
NASA Worldview “true-color” image of the Beaufort Sea on May 2nd 2017, derived from the MODIS sensor on the Terra satellite
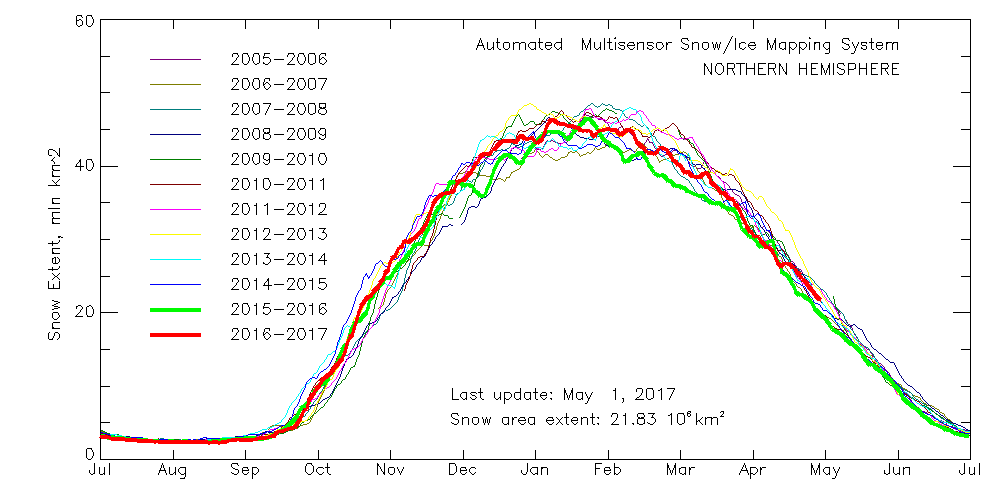
Meanwhile Northern Hemisphere snow cover is falling fast, albeit still above last year’s levels:
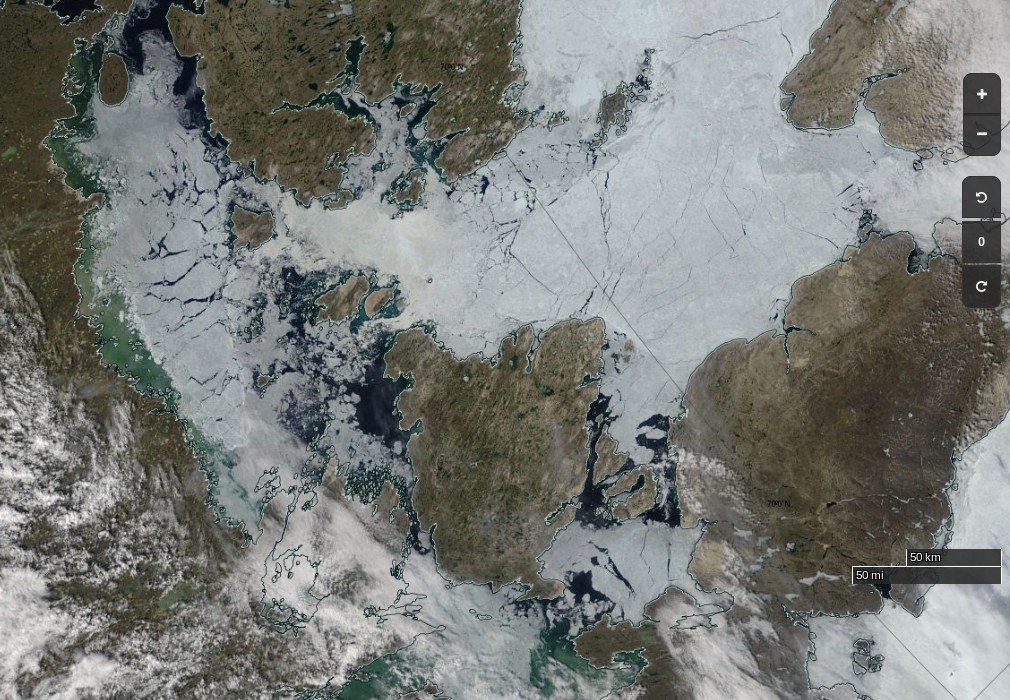
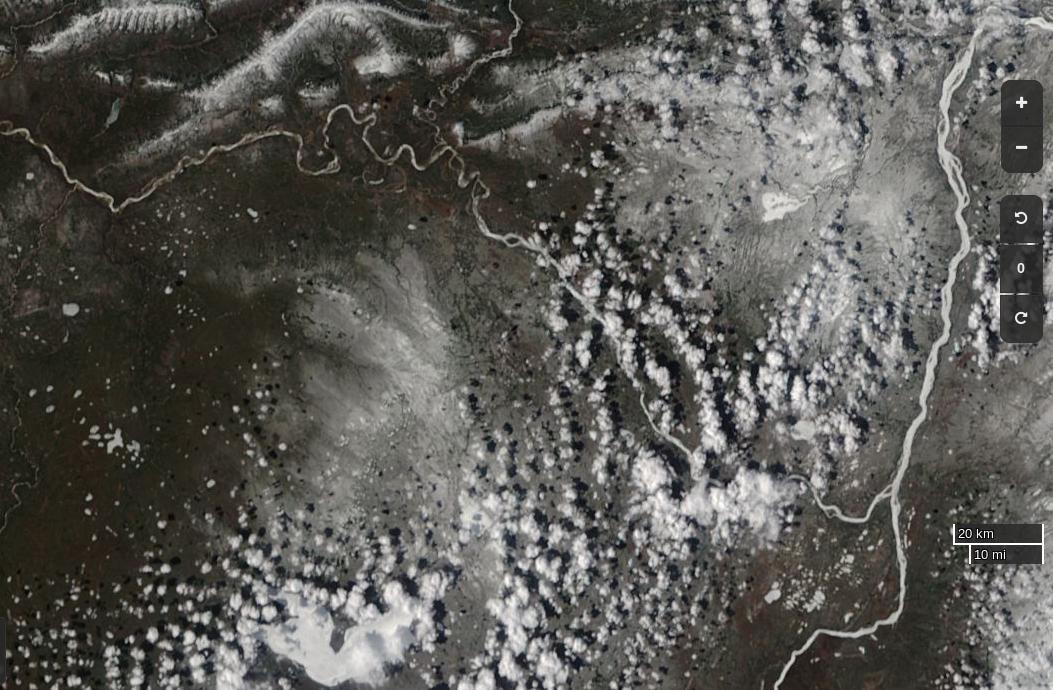
Here’s the current view of the Liard River in northern Canada, with the Mackenzie River running bottom to top on the right hand side:
NASA Worldview “true-color” image of the Liard and Mackenzie Rivers on May 2nd 2017, derived from the MODIS sensor on the Terra satellite
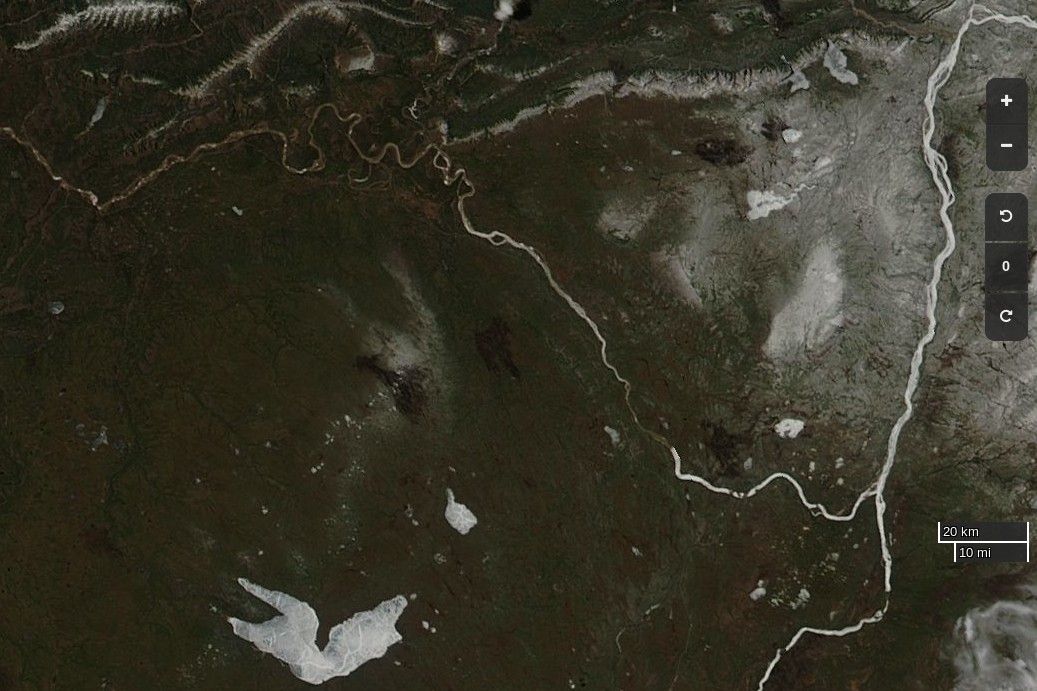
The break-up of the Liard leads the Mackenzie, and taking a look at last year’s view of the same area it’s apparent that this year there’s somewhat more snow on the ground, and that this years Mackenzie break-up will therefore be a few days later than last year:
NASA Worldview “true-color” image of the Liard and Mackenzie Rivers on May 2nd 2016, derived from the MODIS sensor on the Aqua satellite
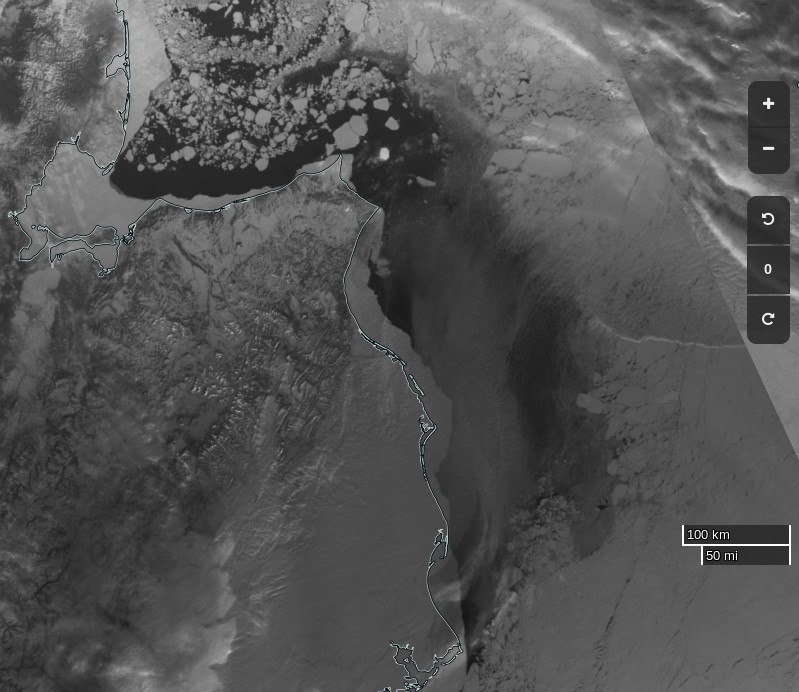
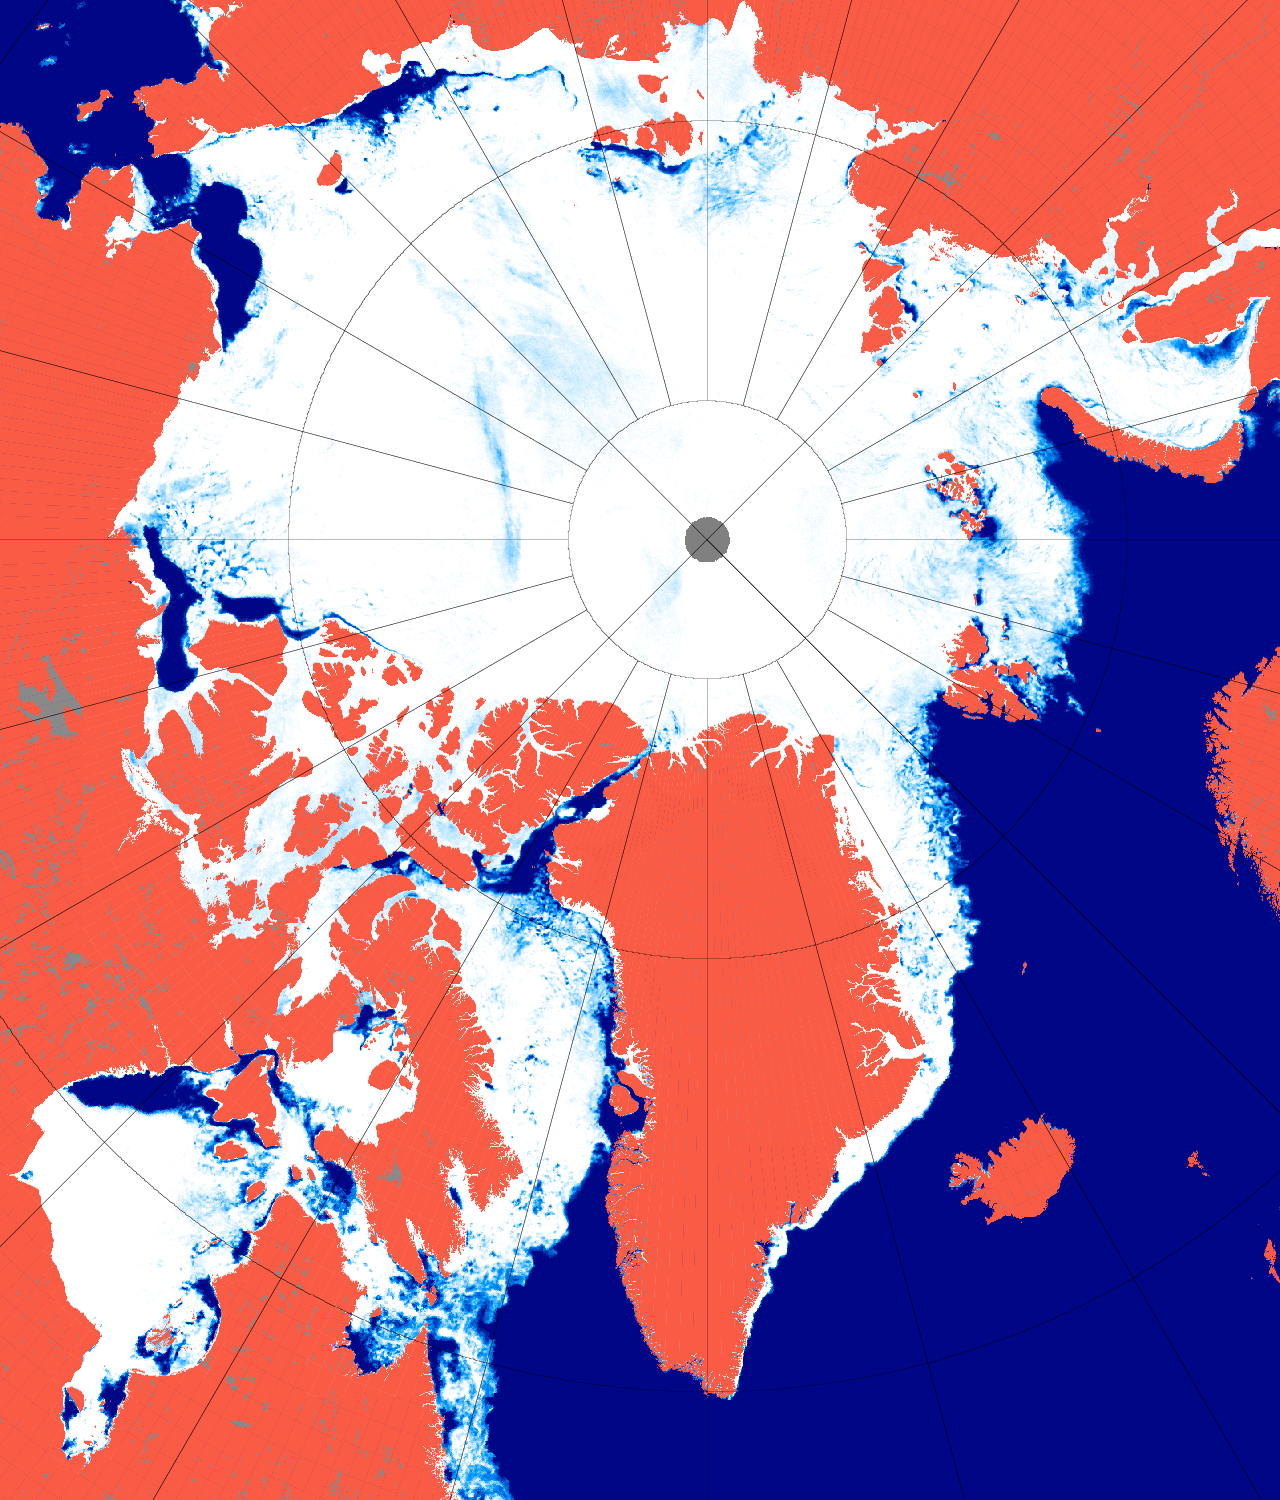
Whilst early melt in the Beaufort Sea is currently behind last year, the reverse is most certainly the case next door in the Chukchi Sea. The skies are rather cloudy there at the moment, but using the Suomi NPP day/night band to peer through the gloom reveals this:
NASA Worldview “day/night band” image of the Chukchi Sea on May 2nd 2017, derived from the VIIRS sensor on the Suomi satellite
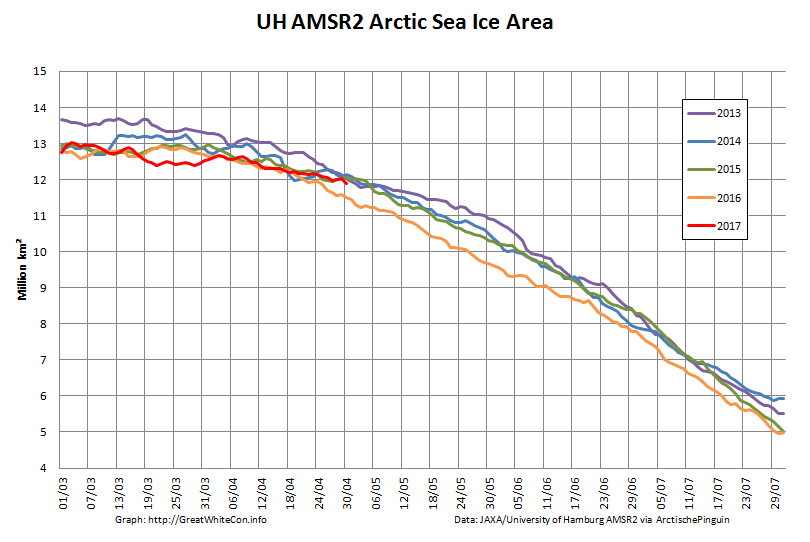
Whilst sea coverage on the Pacific periphery has continued to fall, extent on the Atlantic side has not been following suit. Hence overall Arctic sea ice area is no longer lowest in the satellite record:
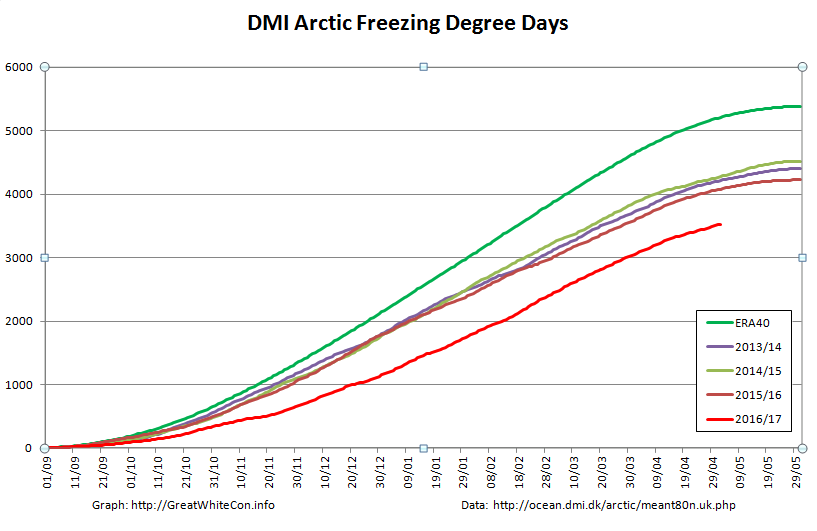
Finally, until the new PIOMAS numbers are released at least, here’s how DMI freezing degree days look at the moment:
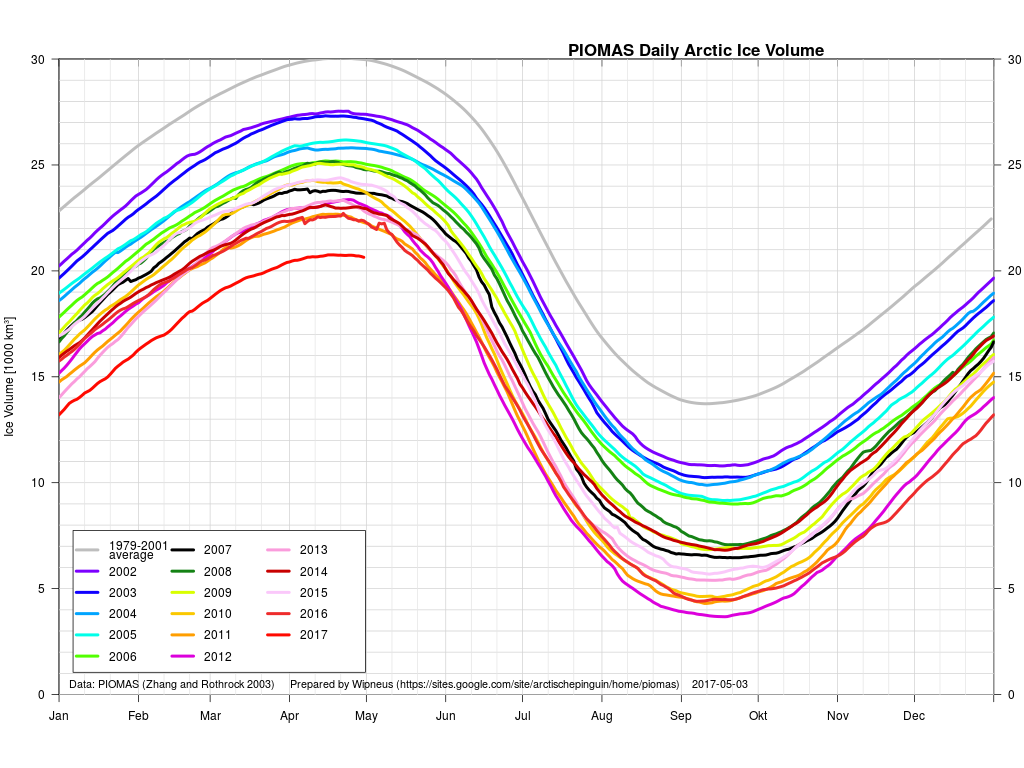
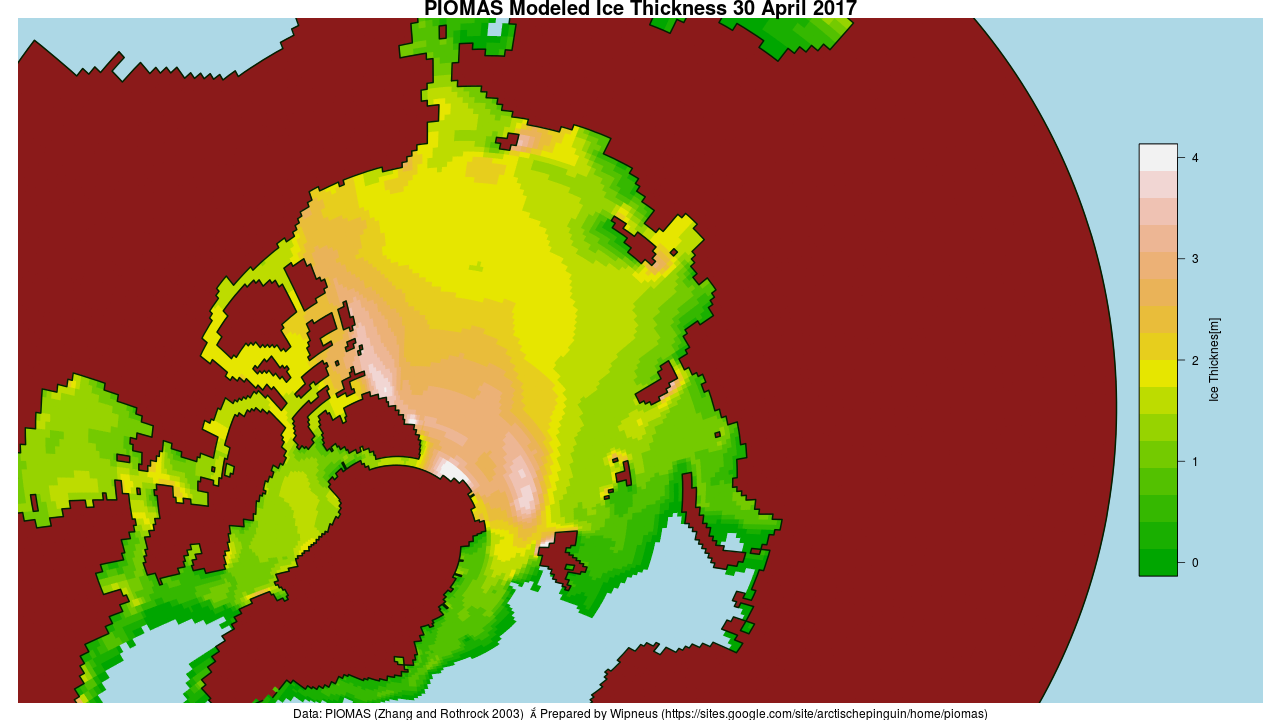
[Edit – May 4th]
The April PIOMAS numbers have been published: Arctic sea ice volume is yet again by far the lowest on record:
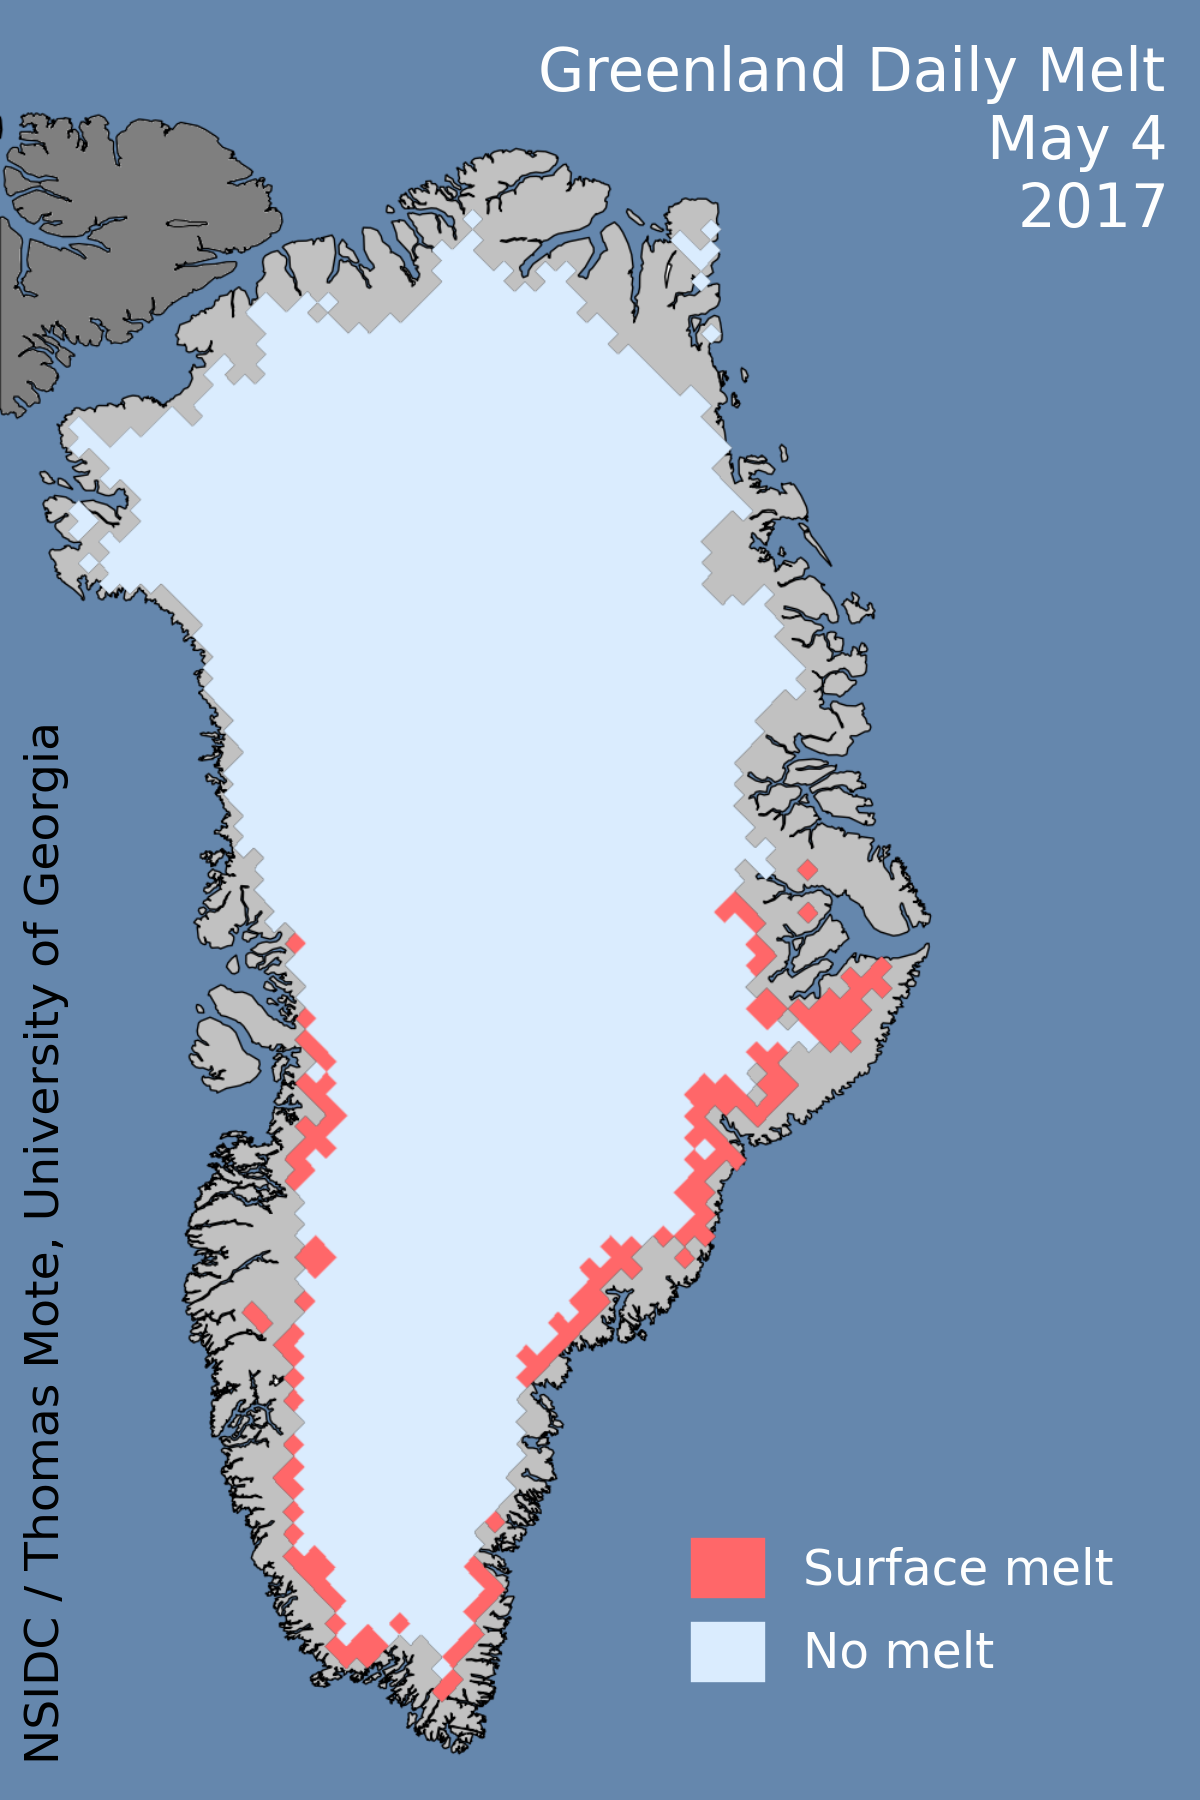
[Edit – May 5th]
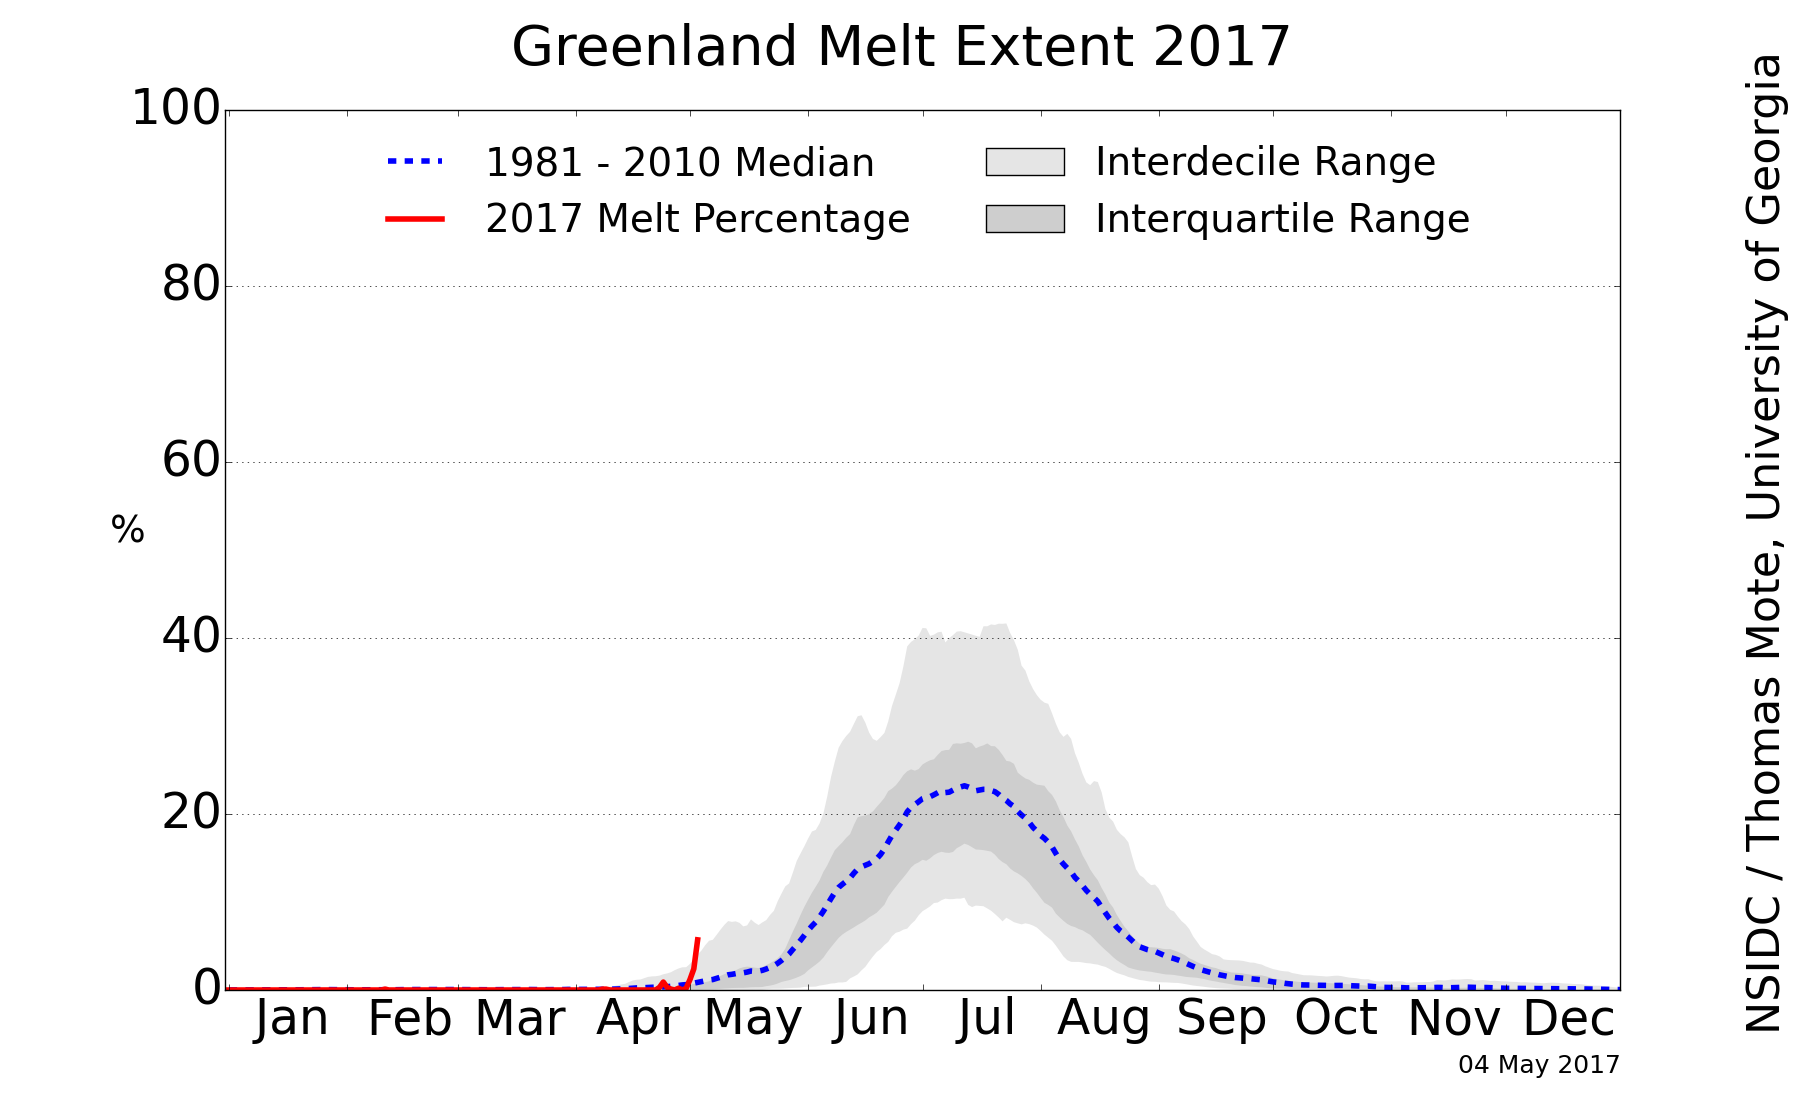
Greenland ice sheet surface melt has started early this year:
[Edit – May 12th]
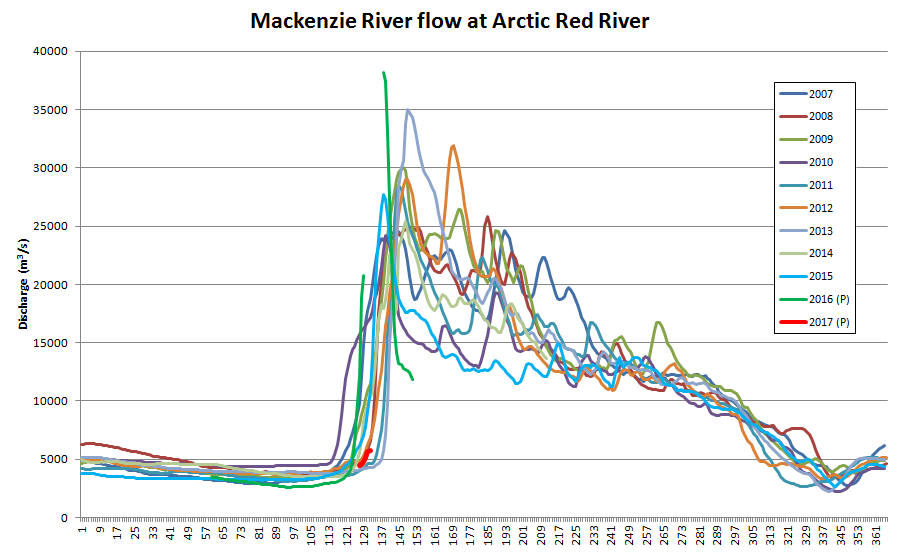
The ice break-up of the Mackenzie River is now visible as increased flow at the junction with Arctic Red River just south of the delta:
Mackenzie River flow at Arctic Red River up to May 12th 2017
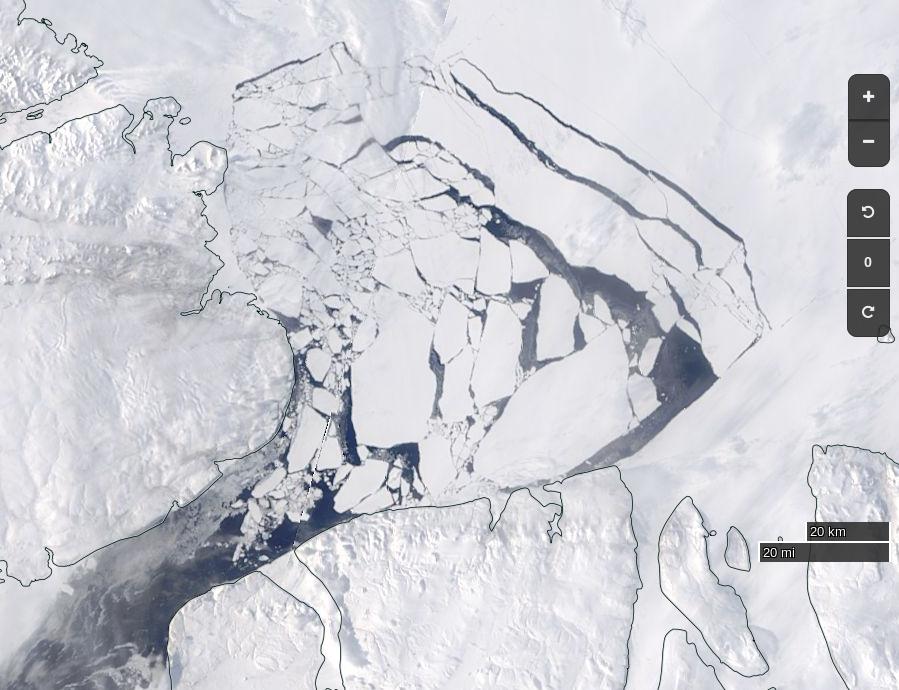
Meanwhile the sea ice in the Lincoln Sea north the Nares Strait is coming apart at the seams:
NASA Worldview “true-color” image of the Lincoln Sea on May 12th 2017, derived from the MODIS sensor on the Terra satellite
[Edit – May 17th]
May seems to be shaping up as month of two halves, both spatially and temporally. Here’s an overview of the current state of play:
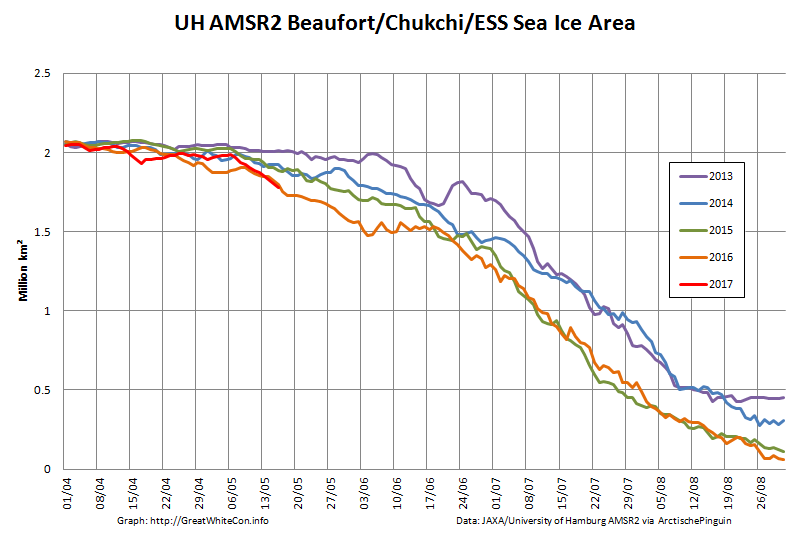
On the Pacific side of the Arctic sea ice area has been declining rapidly courtesy of the expanding areas of open water visible in the Beaufort, Chukchi and East Siberian Seas. It’s currently tracking below other recent years:
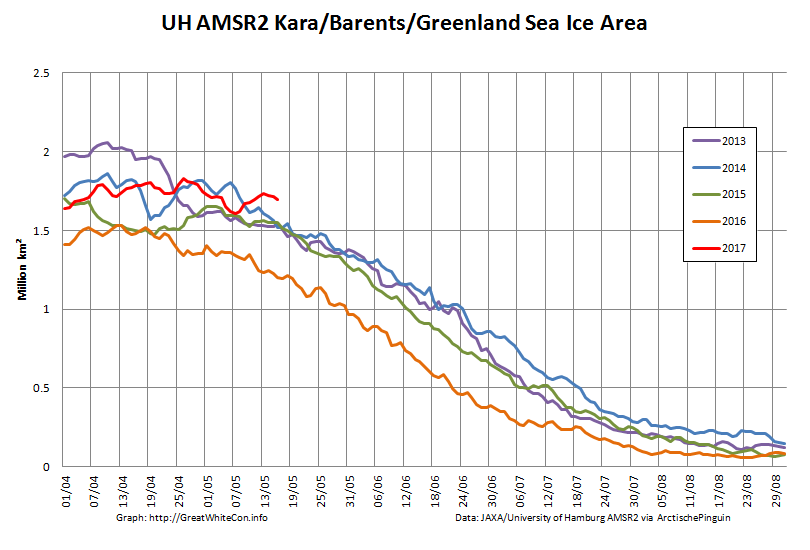
However over on the Atlantic side area has been flatlining, and is currently above other recent years:
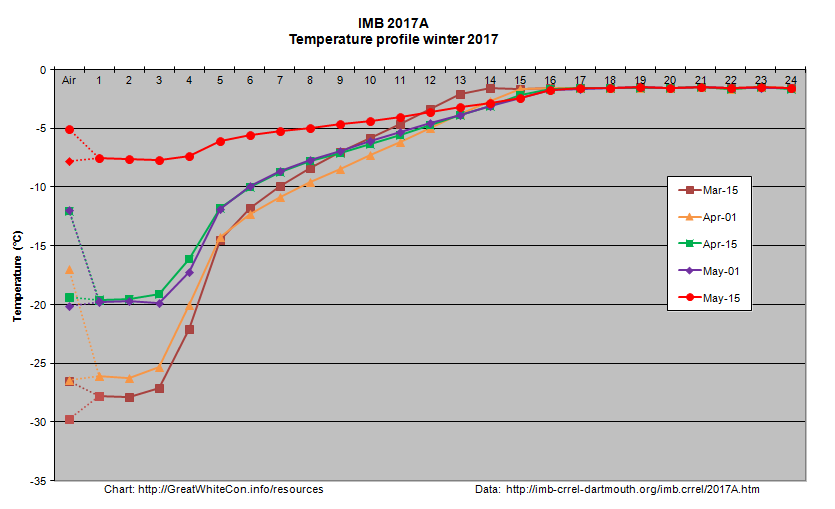
Ice mass balance buoy 2017A is now located near the boundary between the Beaufort and Chukchi Seas and as the melting season in that vicinity rapidly approaches it reveals that thermodynamic thickening has thus far achieved a mere 119 cm:
Arctic wide sea ice area has recently started to decline at an increasing rate:
During the second half of the month it will be interesting to see whether the forecast high temperatures produce significant melt ponding. If so it’s conceivable that 2017 area could drop below 2016 again by the beginning of June. There already signs of surface melt at places as far apart as Franklin Bay, Chaunskaya Bay and even the Great Bear Lake!
Watch this space!
References
Muhammad, P., Duguay, C., and Kang, K.-K.: Monitoring ice break-up on the Mackenzie River using MODIS data, The Cryosphere, 10, 569-584, doi:10.5194/tc-10-569-2016, 2016.
Rood S. B., Kaluthota S., Philipsen L. J., Rood N. J., and Zanewich K. P. (2017) Increasing discharge from the Mackenzie River system to the Arctic Ocean, Hydrol. Process., 31, 150–160. doi: 10.1002/hyp.10986.
Kwok, R., L. Toudal Pedersen, P. Gudmandsen, and S. S. Pang (2010), Large sea ice outflow into the Nares Strait in 2007, Geophys. Res. Lett., 37, L03502, doi:10.1029/2009GL041872.
The Central Arctic has of course already been battered by the Great Arctic Cyclone(s) of August 2016. The minimum sea ice extent has been called by the NSIDC, with a slight proviso:
Arctic sea ice appears to have reached its seasonal minimum extent for 2016 on September 10. A relatively rapid loss of sea ice in the first ten days of September has pushed the ice extent to a statistical tie with 2007 for the second lowest in the satellite record. September’s low extent followed a summer characterized by conditions generally unfavorable for sea ice loss.
Please note that this is a preliminary announcement. Changing winds or late-season melt could still reduce the Arctic ice extent, as happened in 2005 and 2010. NSIDC scientists will release a full analysis of the Arctic melt season, and discuss the Antarctic winter sea ice growth, in early October.
On September 10, Arctic sea ice extent stood at 4.14 million square kilometers (1.60 million square miles).
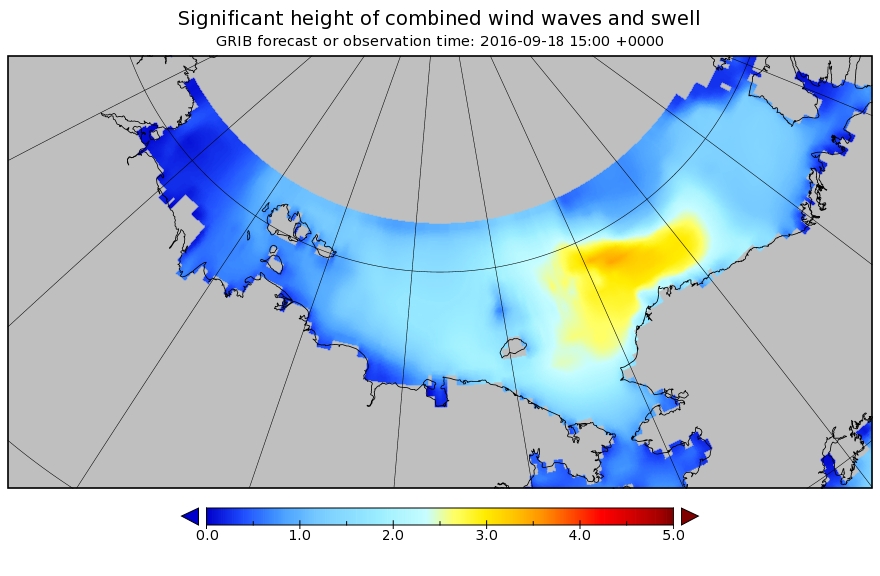
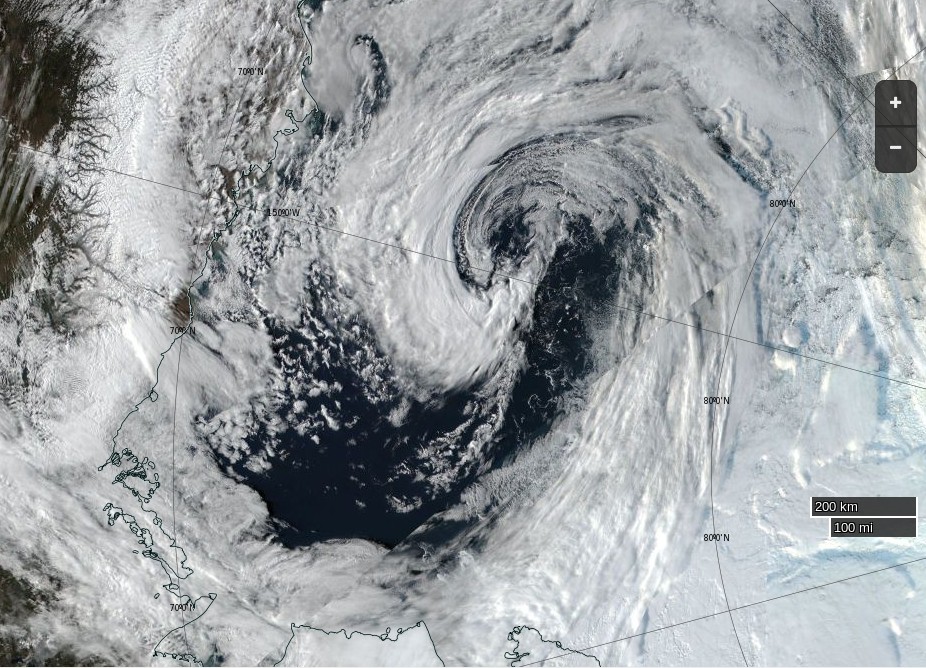
Now, however, yet another cyclone is raging in the Central Arctic. According to Environment Canada this one is already down to a mean sea level pressure of 975 hPa:
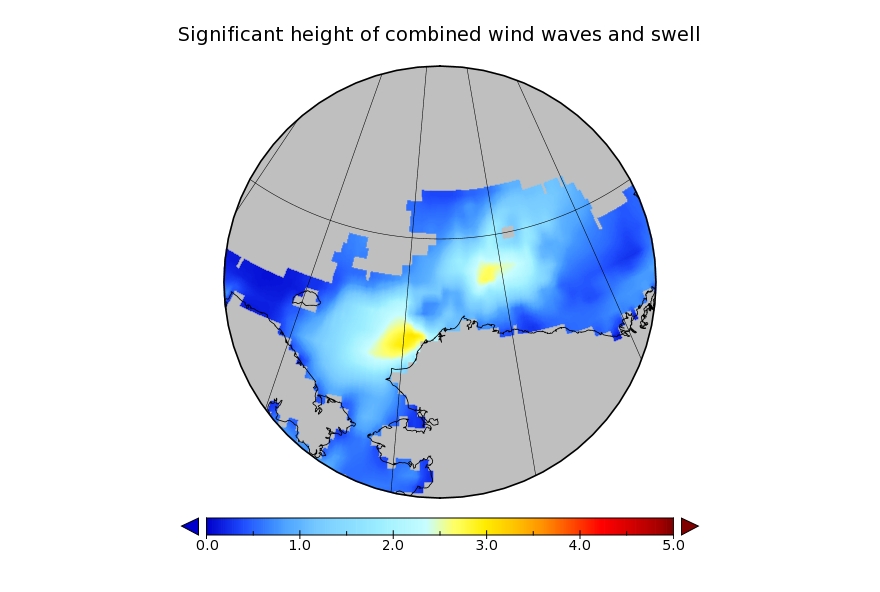
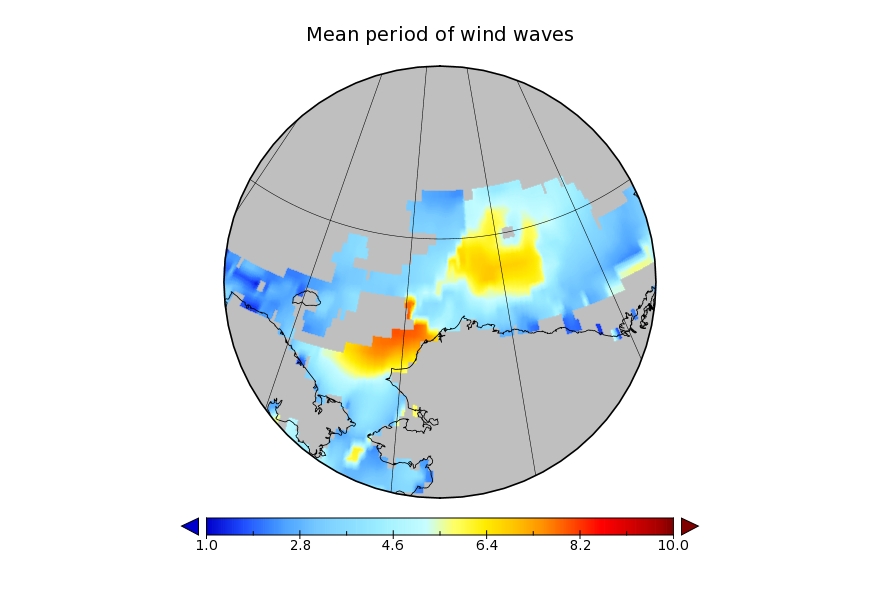
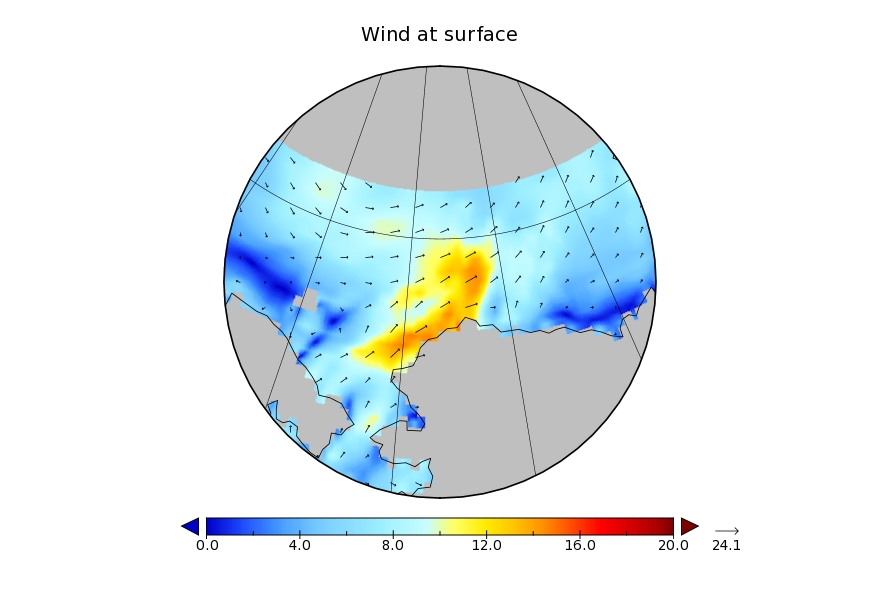
As our regular readers will be well aware, at this time of year strong winds beget large swells. On this occasion it looks as though Barrow will get another battering, as well as the remaining and refreezing sea ice. Here’s the current WaveWatch III significant wave height forecast for September 18th:
Such large swells on the surface of the Arctic Ocean don’t only physically break up the sea ice. Last September scientists aboard the University of Alaska’s research icebreaker Sikuliaq observed the effects of a similar storm in the Beaufort Sea. According to Jennifer MacKinnon, Chief Scientist on the ArcticMix voyage:
One of the funny things about the Arctic is that there’s a reservoir of heat beneath the surface here.
So the more the wind is blowing on the ocean, the more it’s mixing this heat upwards. Which is bringing warmer water to the surface at a pretty rapid rate, warming the surface and accelerating the rate at which this ice is melting.
And if storms like this continue, as there’s more open water, more storms mean more exposed surface. It will not only melt the ice in the summer, but delay the onset of fall ice formation and accelerate the onset of spring ice melting.
In October 2015 the Sikuliaq was back in the Beaufort Sea observing the effect of storm swells on refreezing sea ice. Here’s a report from Chief Scientist Jim Thomson:
A strong easterly wind event came through that built large waves — waves that got to almost five meters in height. And the winds were something like up to thirty knots. And these waves were coming into the newly forming ice and making pancake ice.
There was a very warm layer of water 20 meters down beneath the surface. And these waves coming in were enough to drive additional mixing and bring that warm water up from the subsurface and that warm water melted the ice and changed that balance happening at the surface.
As if all that wasn’t already enough to worry about look who’s waiting in the wings. Tropical Storm Ian is heading towards the Arctic Circle at a rate of knots, even as we speak:
SURF ZONE FORECAST
NATIONAL WEATHER SERVICE BARROW AK
0500 AM AKDT SAT SEP 17 2016
AKZ202-171230-
NORTHERN ARCTIC COAST
INCLUDING THE BEACHES OF BARROW…PITT POINT…NULAVIK
0500 AM AKDT SAT SEP 17 2016
.TODAY AND TONIGHT…
.WIND… WESTERLY 20 TO 35 MPH.
.SURF HEIGHT… 2 TO 5 FT.
.SURF TEMP… 36 DEGREES F.
.TIDES… LOW SAT 0826 AM -0.03
HIGH SAT 0230 PM 0.38
LOW SAT 0846 PM -0.02
HIGH SUN 0250 AM 0.38
…HIGH SURF ADVISORY REMAINS IN EFFECT UNTIL 6 AM AKDT MONDAY…
* WAVES AND SURF…WAVES TO 10 FEET BREAKING JUST OFFSHORE COMBINED WITH TIDES UP TO 1 FOOT ABOVE NORMAL WILL CAUSE HIGH SURF CONDITIONS.
* ICE…WITH ICE JUST OFF SHORE FROM BARROW…IT IS POSSIBLE THAT CHUNKS OF SEA ICE WILL WASH UP ON SHORE EVEN WITH WINDS PREDICTED TO BE AT NEARLY PARALLEL TO THE SHORE.
* WINDS…WEST 20 TO 30 MPH FROM THIS AFTERNOON THROUGH EARLY MONDAY MORNING.
* TIMING…HIGH SURF IS EXPECTED TO BEGIN LATE THIS AFTERNOON AND CONTINUE THROUGH EARLY MONDAY.
* IMPACTS…HIGH SURF WILL WASH TO THE TOP OF THE BEACH AND CAUSE BEACH EROSION. MINOR FLOODING OF LOW LYING AREAS IS POSSIBLE AND SURF COULD WASH ONTO LOW LYING ROADS NEAR THE BEACH.
PRECAUTIONARY/PREPAREDNESS ACTIONS…
A HIGH SURF ADVISORY MEANS THAT LOCALIZED BEACH EROSION IS EXPECTED. SURF COULD WASH ONTO LOW LYING ROADS NEAR THE BEACH LIMITING TRAVEL NEAR THE BEACH. PEOPLE SHOULD MOVE BOATS AND PERSONAL PROPERTY INLAND FROM THE BEACH.
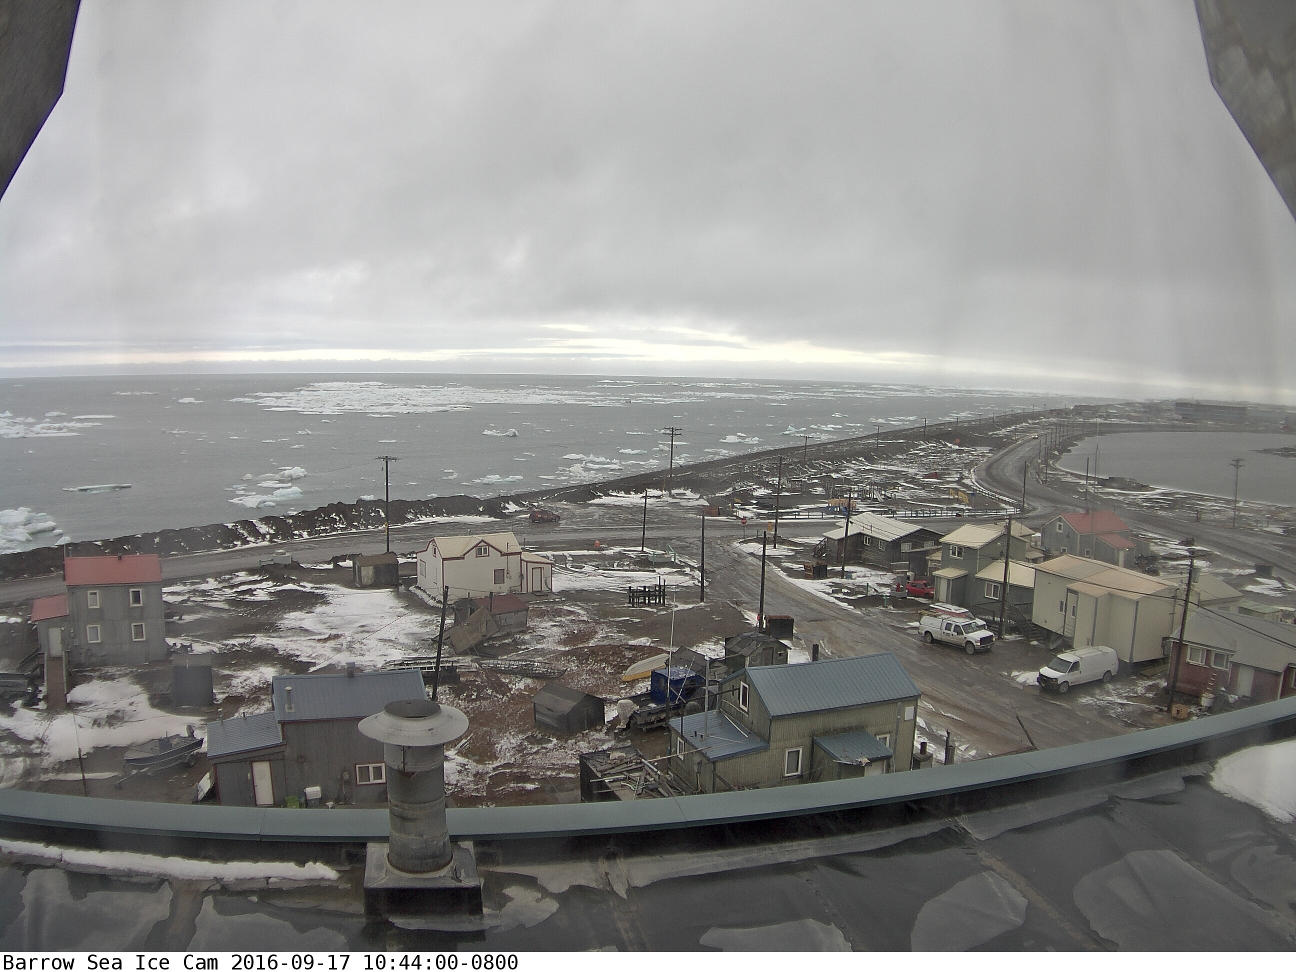
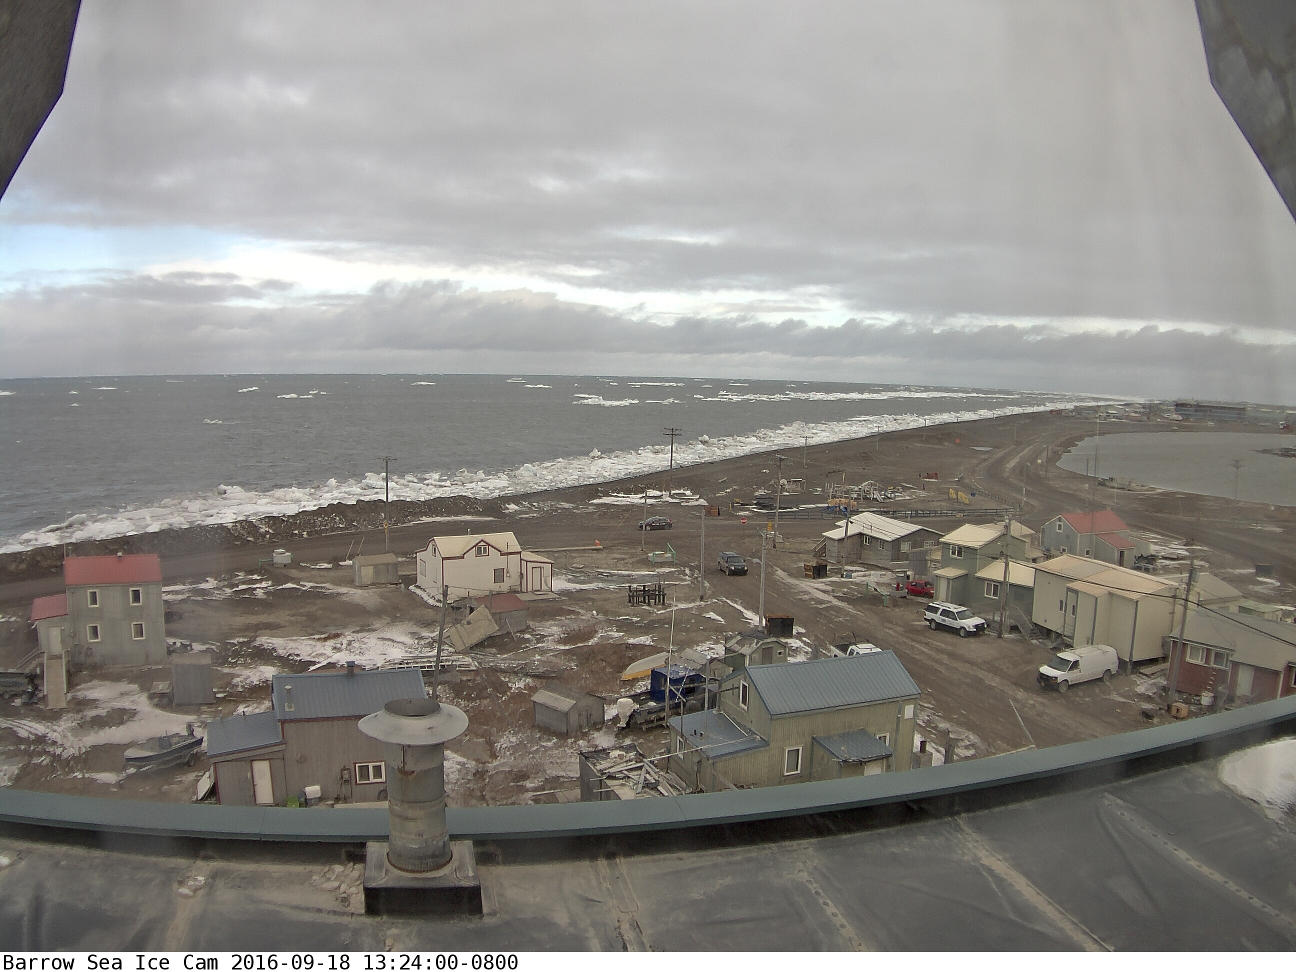
[Edit – September 19th]
Somewhat belatedly, before:
and after:
the storm images from the Barrow webcam, which has just burst back into life. Plus an image of the cyclone from on high:
NASA Worldview “true-color” image of the Beaufort Sea on September 18th 2016, derived from the VIIRS sensor on the Suomi satellite
It looks like a storm is brewing in the Arctic. The long range weather forecasts for the Arctic have been remarkably unreliable recently, but this one is for a mere three days from now. WaveWatch III suggests there will be some significant waves in the Chukchi and Beaufort Seas this coming weekend, travelling in the direction of the ice edge:
WaveWatch III wave height forecast for July 17thWaveWatch III wave period forecast for July 17thWaveWatch III wind forecast for July 17th
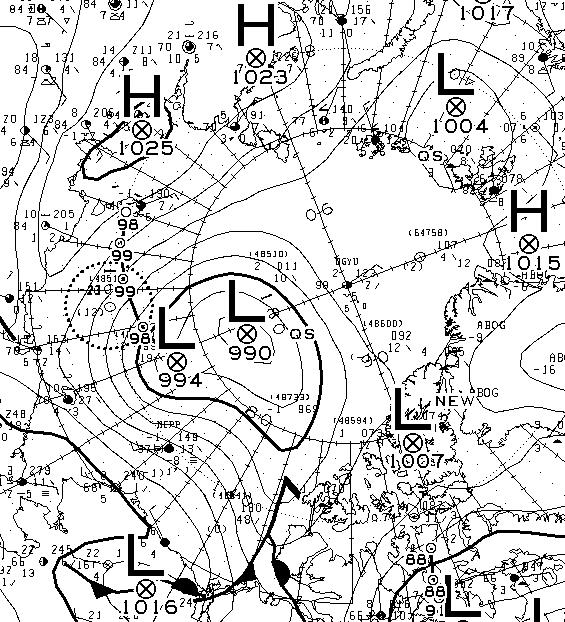
Another day has dawned, and the Environment Canada synoptic chart shows that the low pressure system currently over the Arctic has reached a central pressure of 990 hPa:
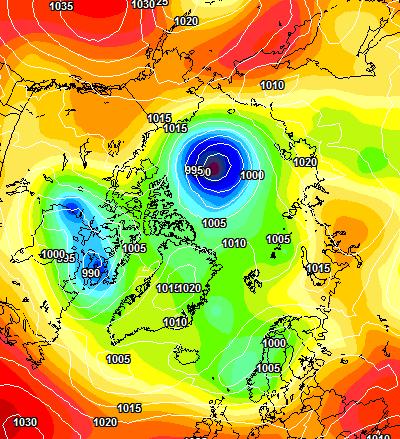
The latest ECMWF SLP forecast for tomorrow is firming up:
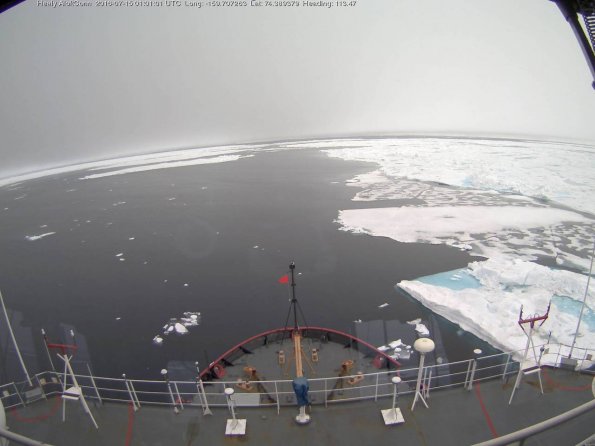
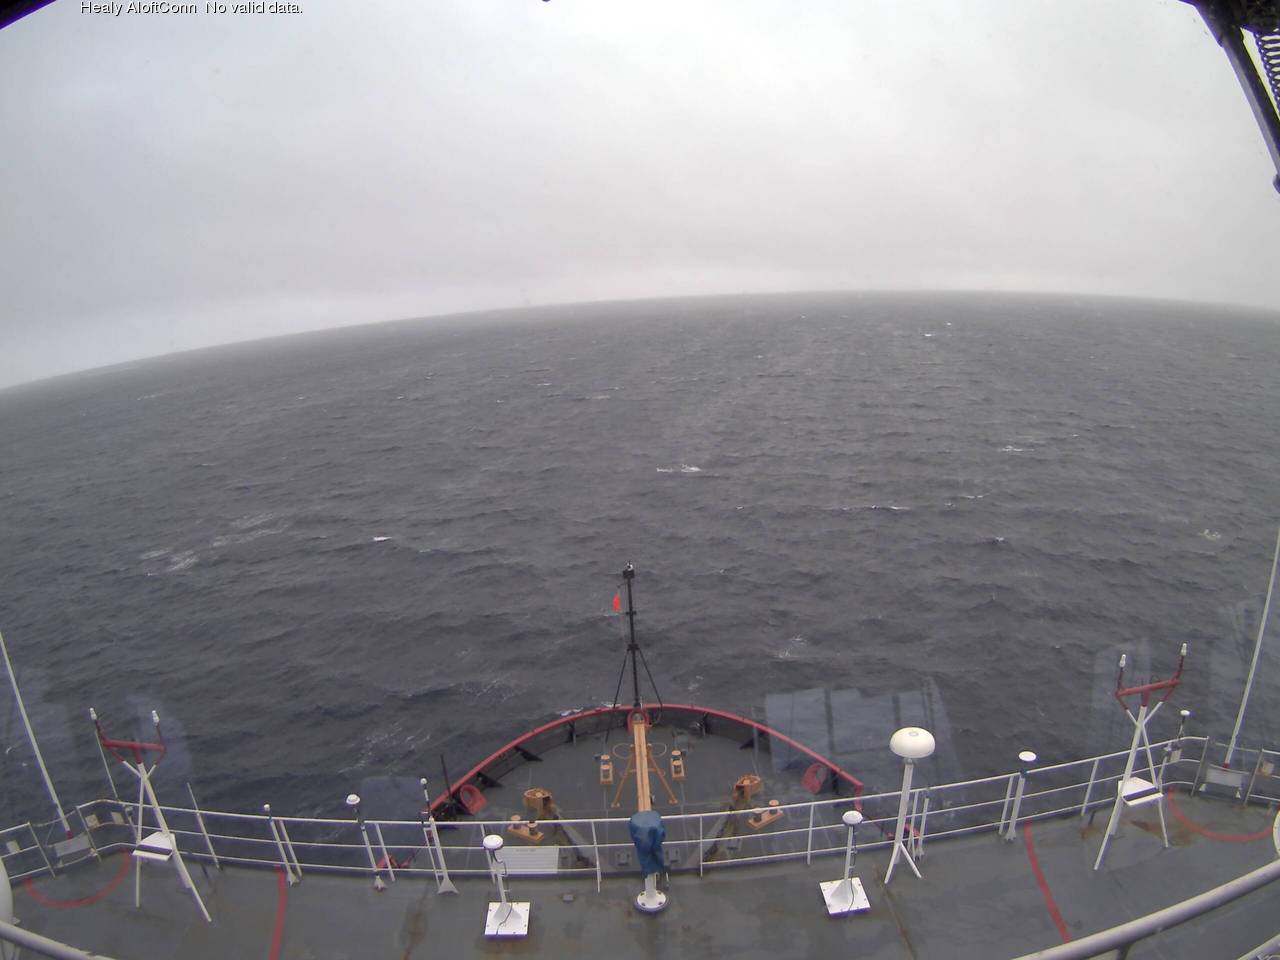
A modest swell is now visible from USCGC Healy’s “AloftCon” webcam:
whilst the WaveWatch III forecast for tomorrow has dropped off to a significant wave height of around 2 metres with an average period of 7 seconds:
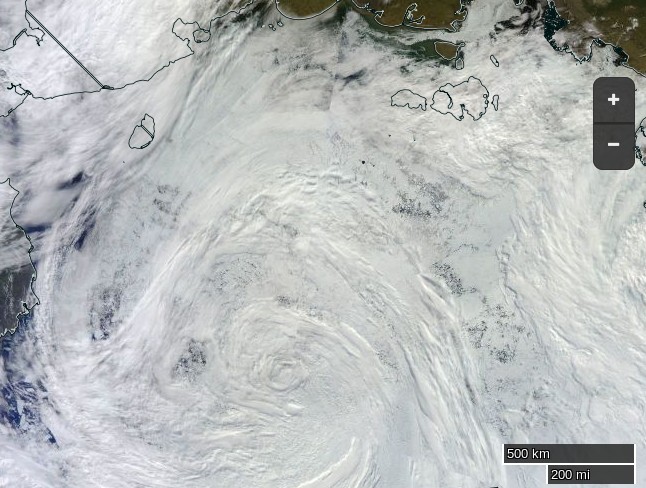
Meanwhile an image from the VIIRS instrument on the Suomi NPP satellite reveals the current storm in all its glory, together with confirmation that the “Big Block” multi-year ice floe north of Barrow has split asunder overnight:
[Edit July 17th 2016]
Sunday morning has now arrived. The storm in the Arctic looks to have bottomed out at 986 hPa central pressure. Here’s the Environment Canada synoptic chart for 00:00 this morning:
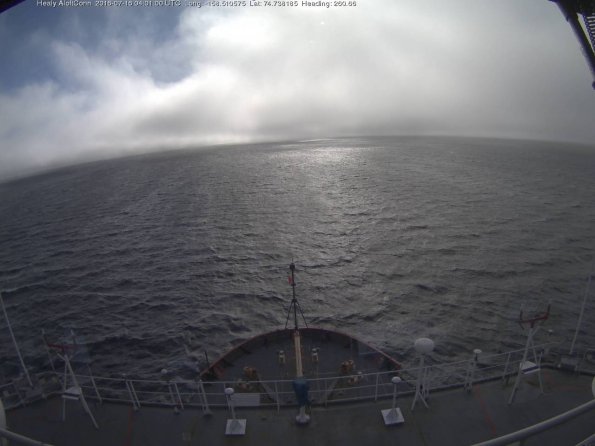
This is how the resultant swell looked from USCGC Healy at 06:00:
[Edit July 18th 2016]
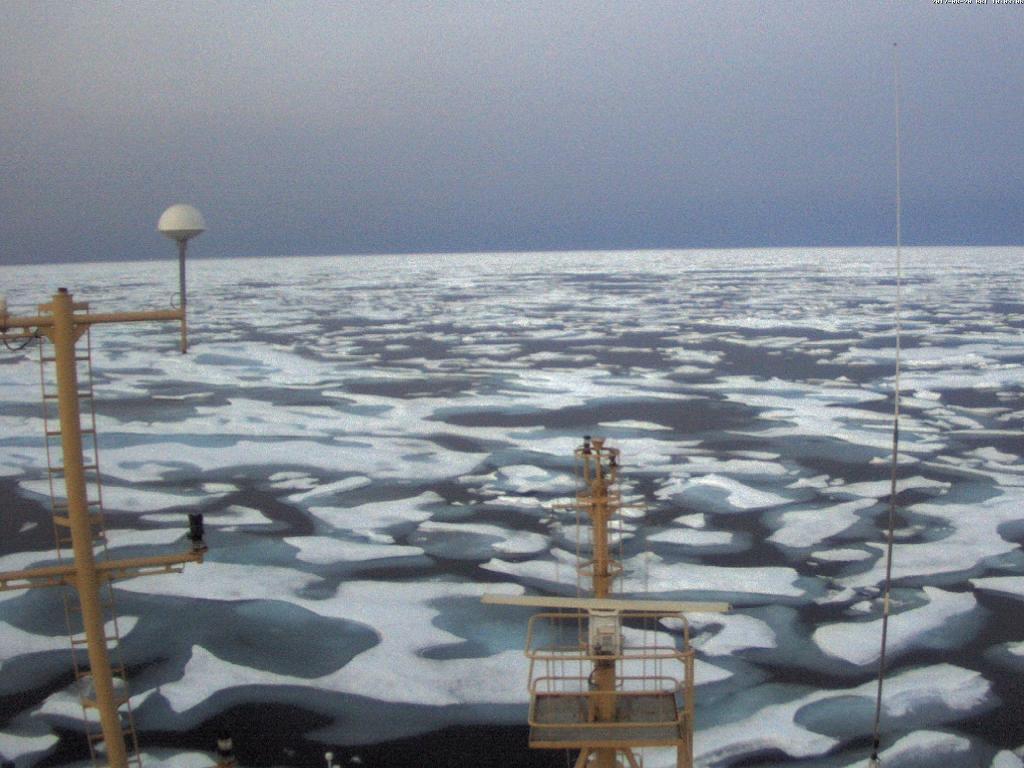
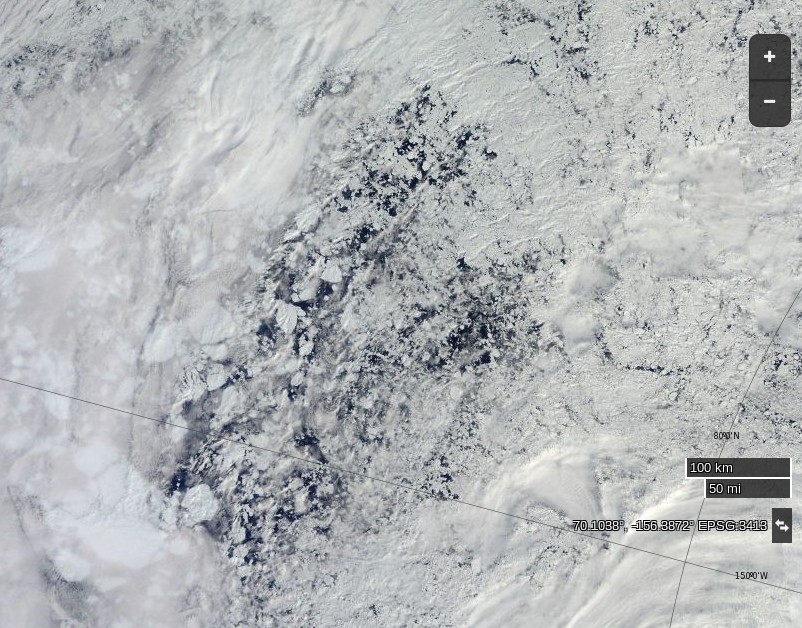
Here’s what the Beaufort and Chukchi Sea north of Barrow look like this morning through the clouds:
NASA Worldview “true-color” image of the Beaufort Sea on July 18th 2016, derived from the MODIS sensor on the Terra satellite
The remains of the now not so “Big Block” can just be made out in the bottom left. For a cloud free image here’s the latest AMSR2 passive microwave imagery of the area from the University of Hamburg:
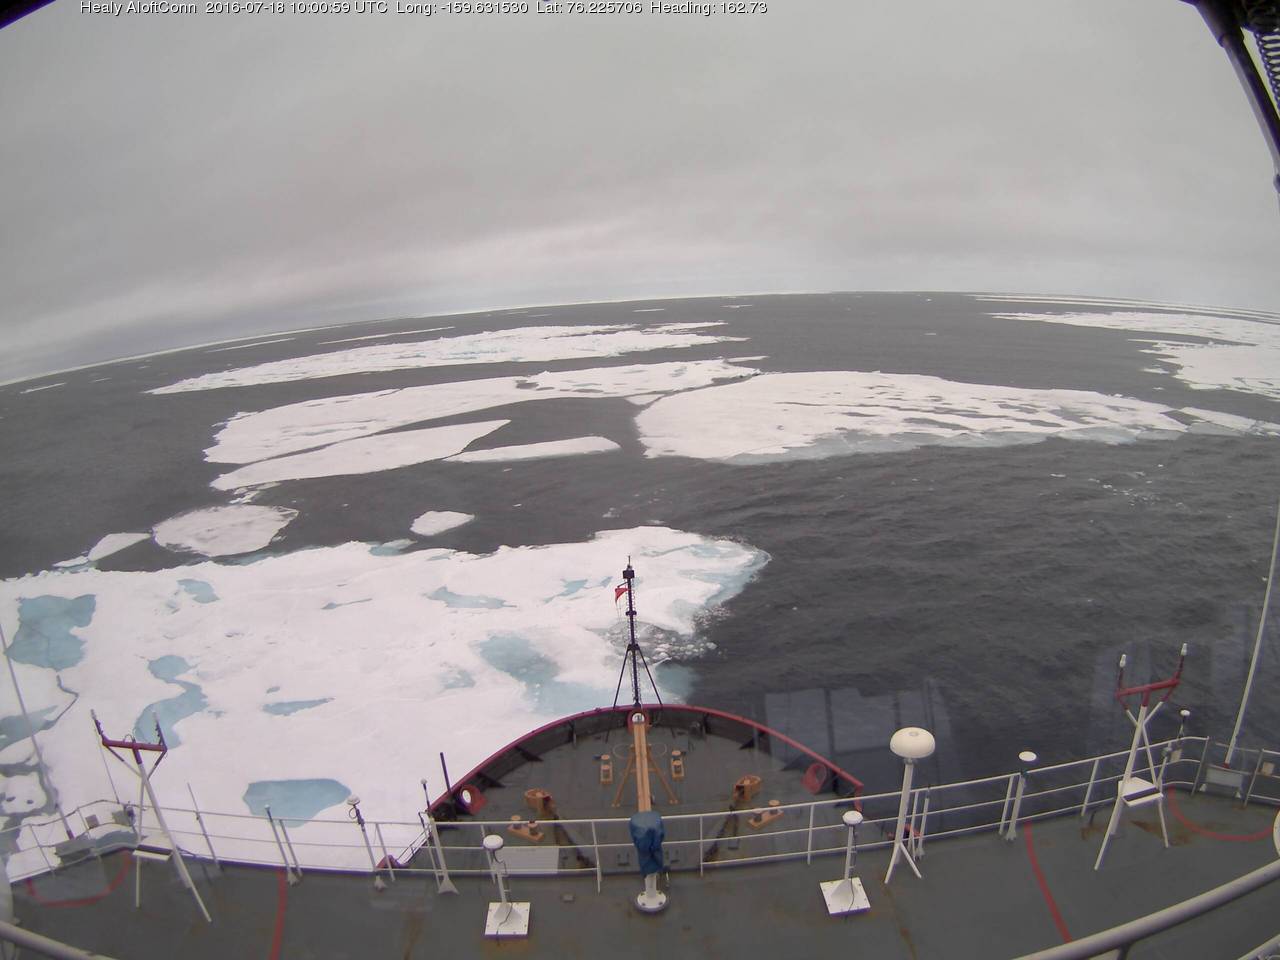
The USCGC Healy and the remnants of the swell are in amongst the ice:
[Edit July 20th 2016]
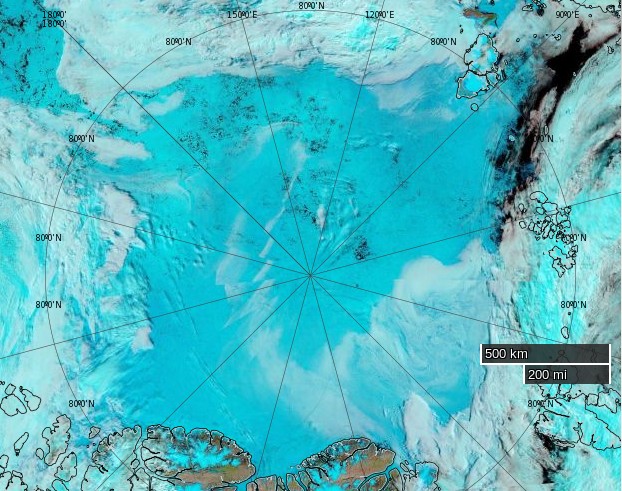
As the remnants of the storm head off across the Canadian Arctic Archipelago here is what it has left in its wake in the Central Arctic Basin:
NASA Worldview “false-color” image of the Central Arctic Basin on July 19th 2016, derived from the MODIS sensor on the Aqua satelliteUniversity of Hamburg AMSR2 concentration visualisation of the Central Arctic on July 19th 2016
[Edit July 21st 2016]
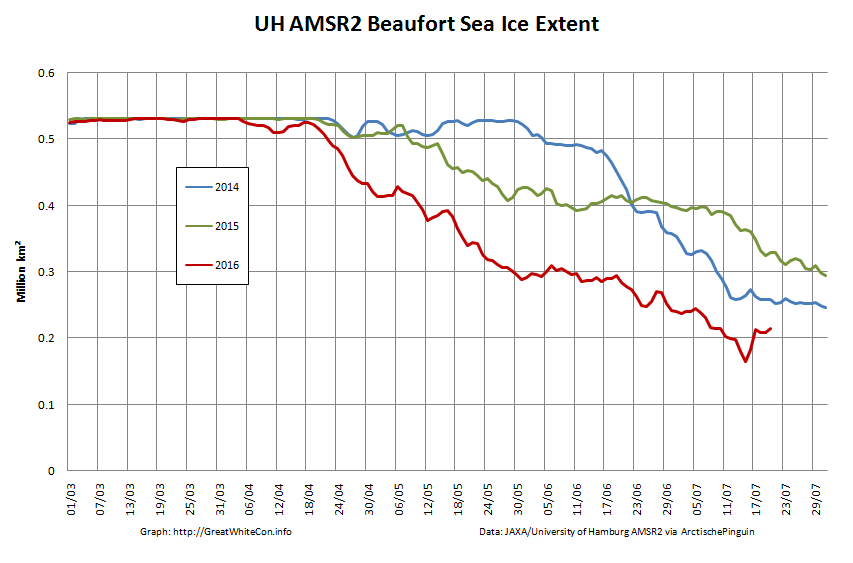
The storm has dispersed the remaining ice in the Beaufort Sea over the last few days:
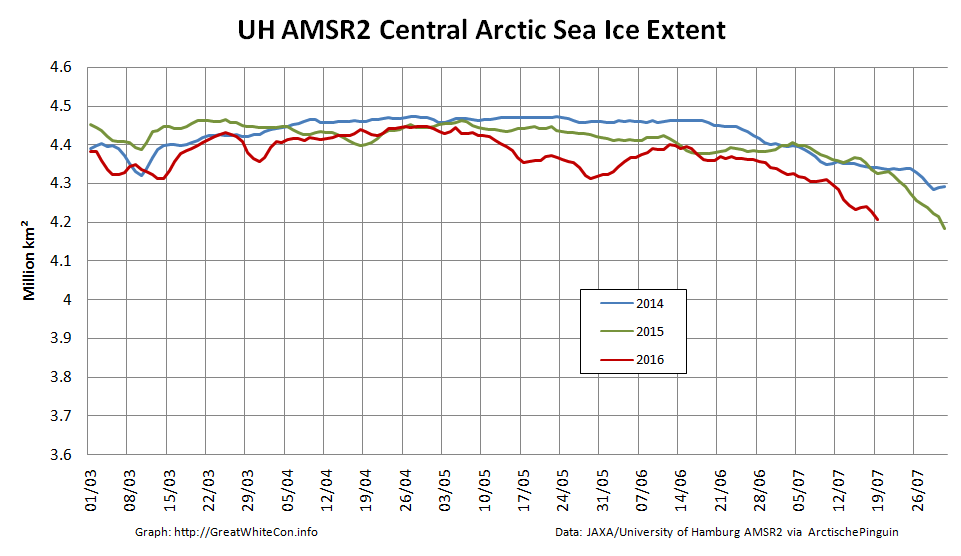
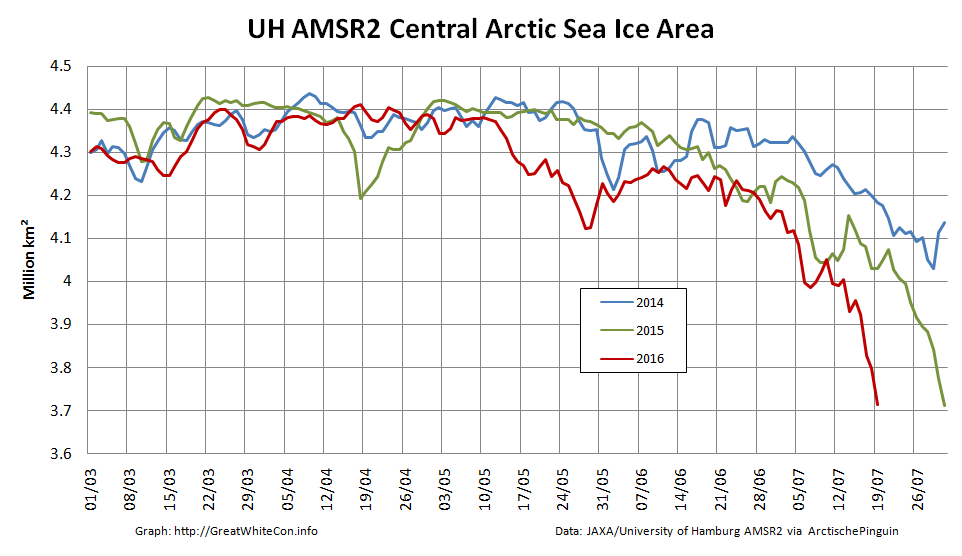
However across the Arctic as a whole sea ice area continues its downward trend:
This website uses cookies to improve your experience. We'll assume you're ok with this, but you can opt-out if you wish. Cookie settingsACCEPT
Privacy & Cookies Policy
Privacy Overview
This website uses cookies to improve your experience while you navigate through the website. Out of these, the cookies that are categorized as necessary are stored on your browser as they are essential for the working of basic functionalities of the website. We also use third-party cookies that help us analyze and understand how you use this website. These cookies will be stored in your browser only with your consent. You also have the option to opt-out of these cookies. But opting out of some of these cookies may affect your browsing experience.
Necessary cookies are absolutely essential for the website to function properly. This category only includes cookies that ensures basic functionalities and security features of the website. These cookies do not store any personal information.
Any cookies that may not be particularly necessary for the website to function and is used specifically to collect user personal data via analytics, ads, other embedded contents are termed as non-necessary cookies. It is mandatory to procure user consent prior to running these cookies on your website.