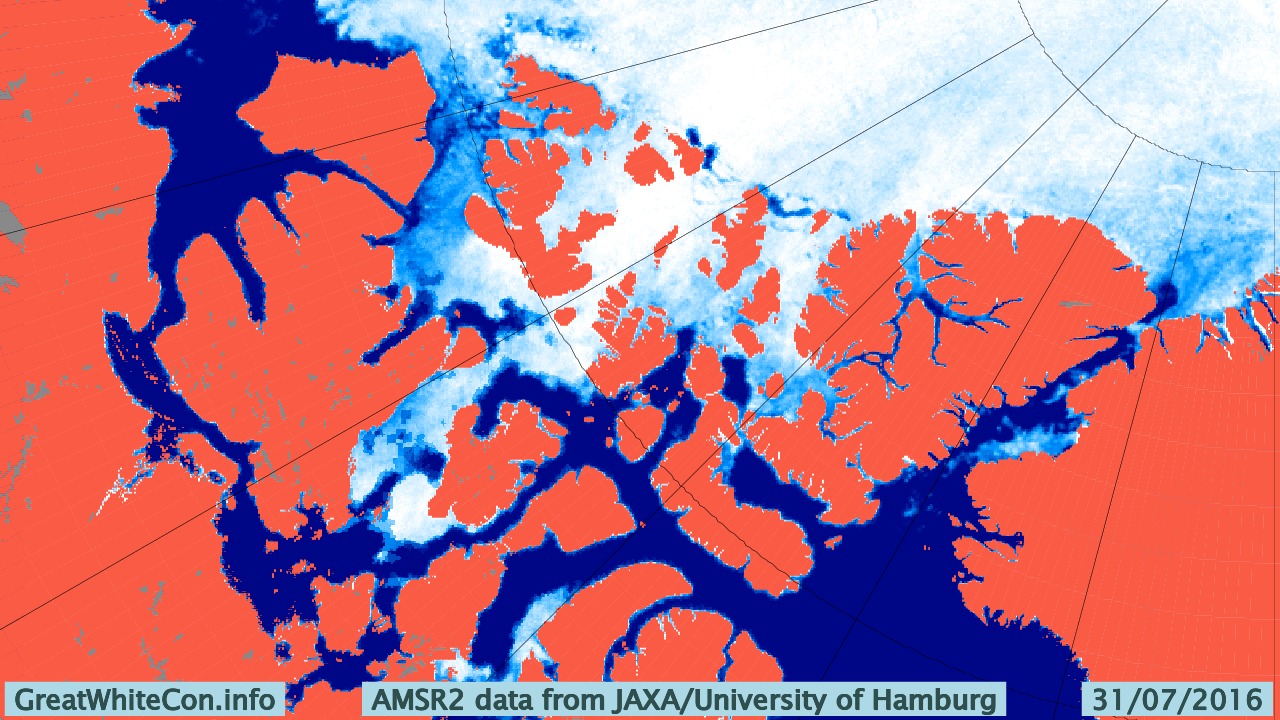
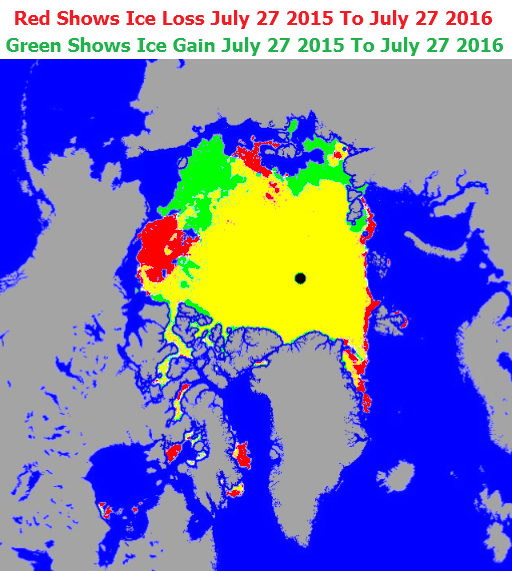
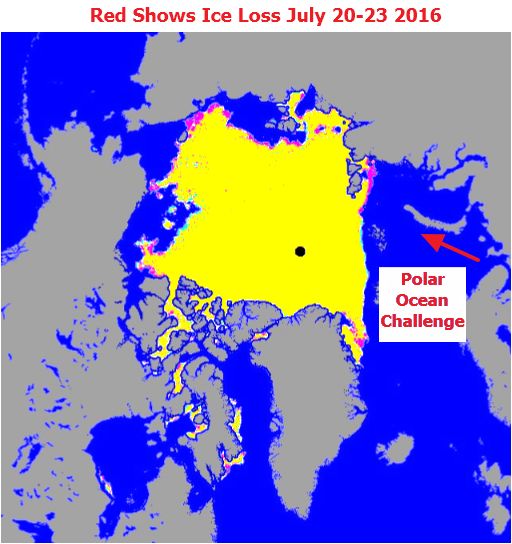
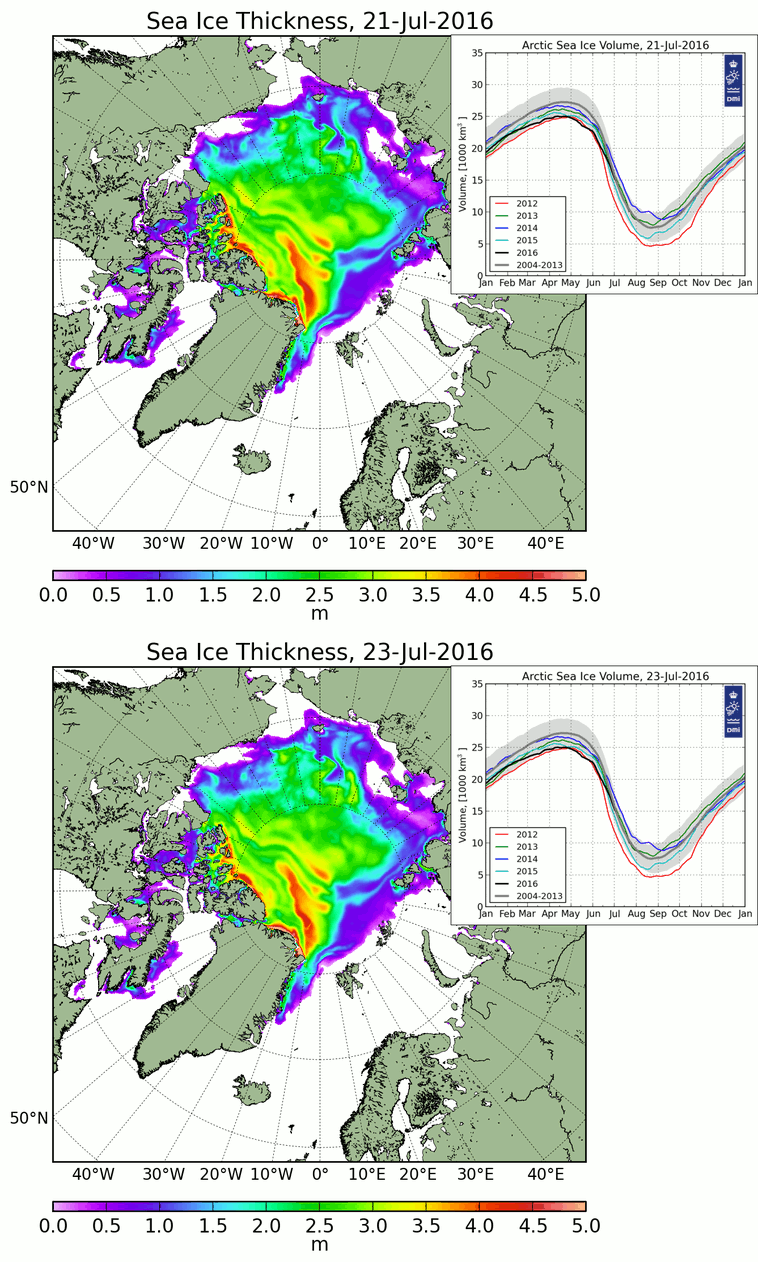
We asked this question last year, albeit a couple of weeks later. It looks like it is if you only peruse passive microwave visualisations such as this one:
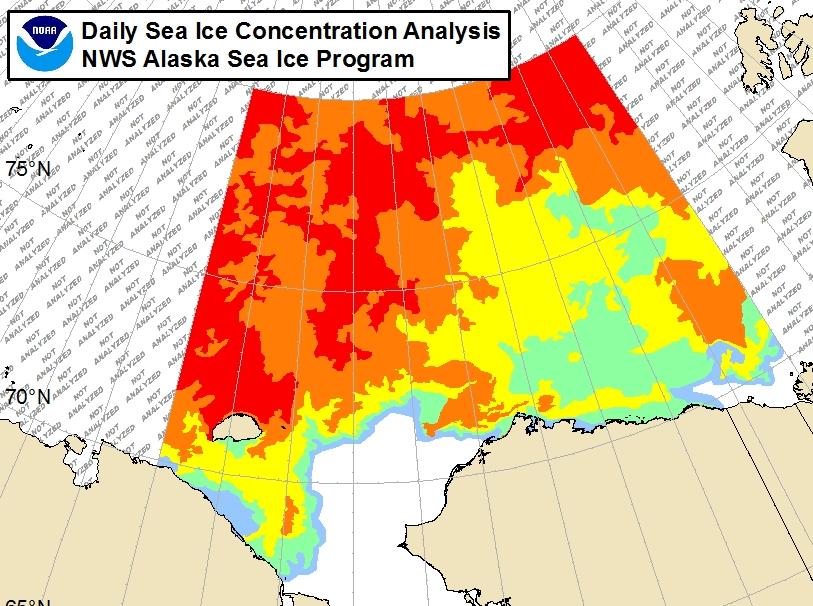
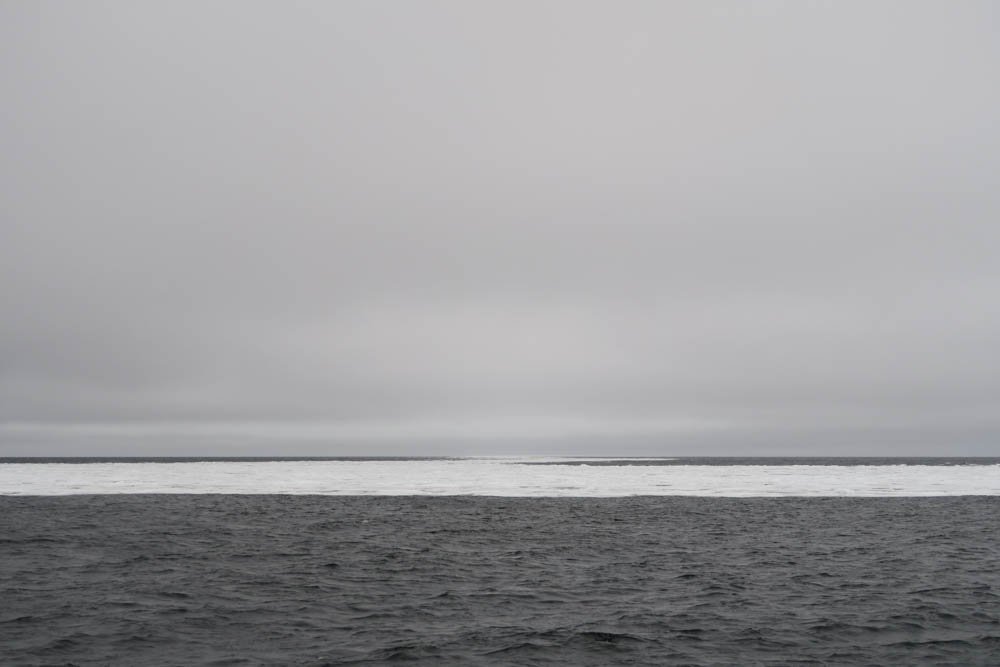
However if you were the captain of a yacht attempting to sail through the Northwest Passage this year you might well have some reservations. For example, the Barrow webcam (currently stuck on July 31st) reveals this:
Discretion being the better part of valour, in all the circumstances waiting a day or two longer before casting off might prove prudent:
[Edit – August 3rd]
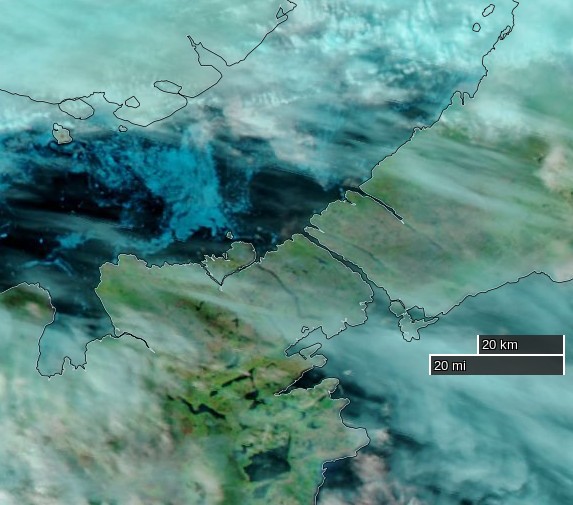
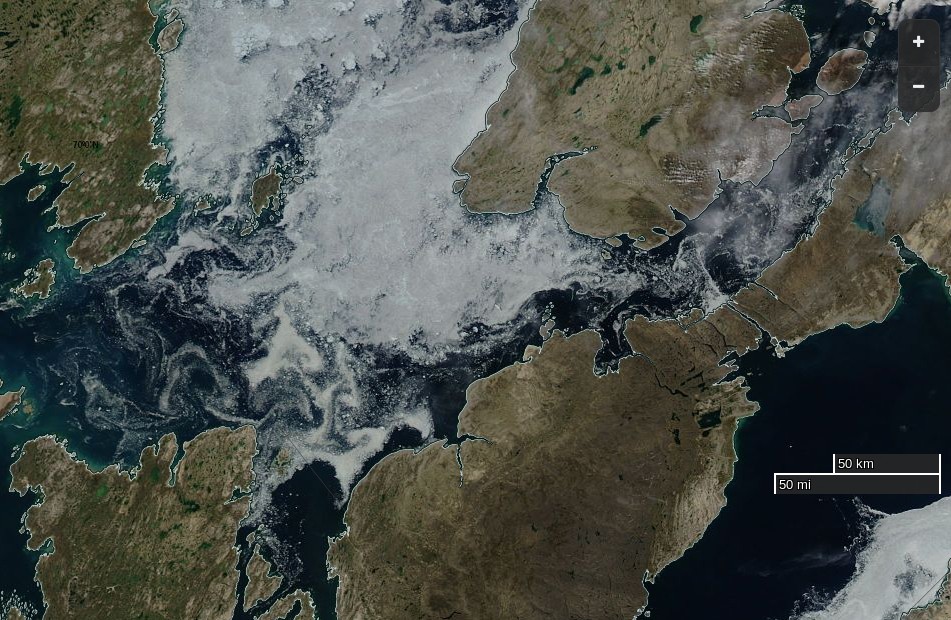
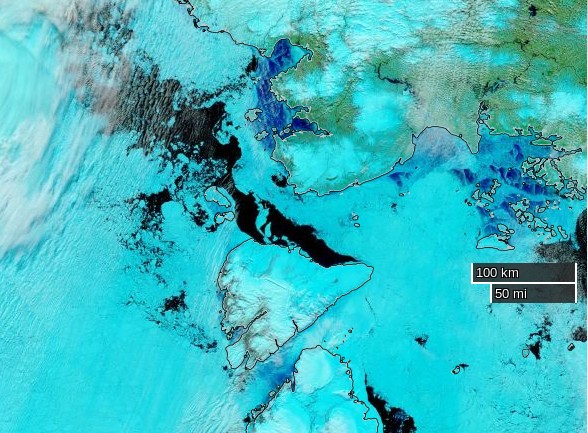
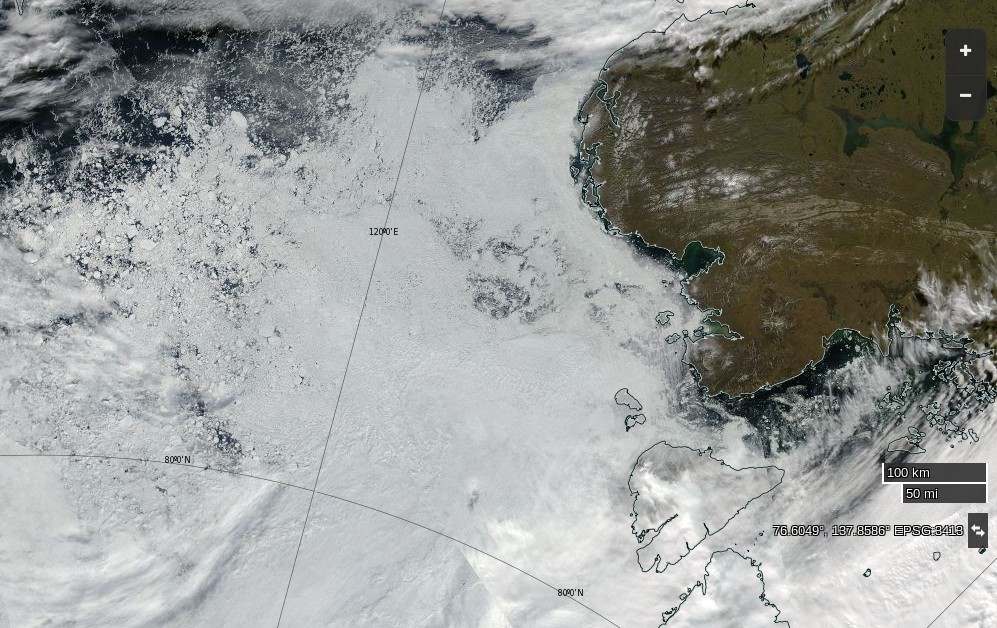
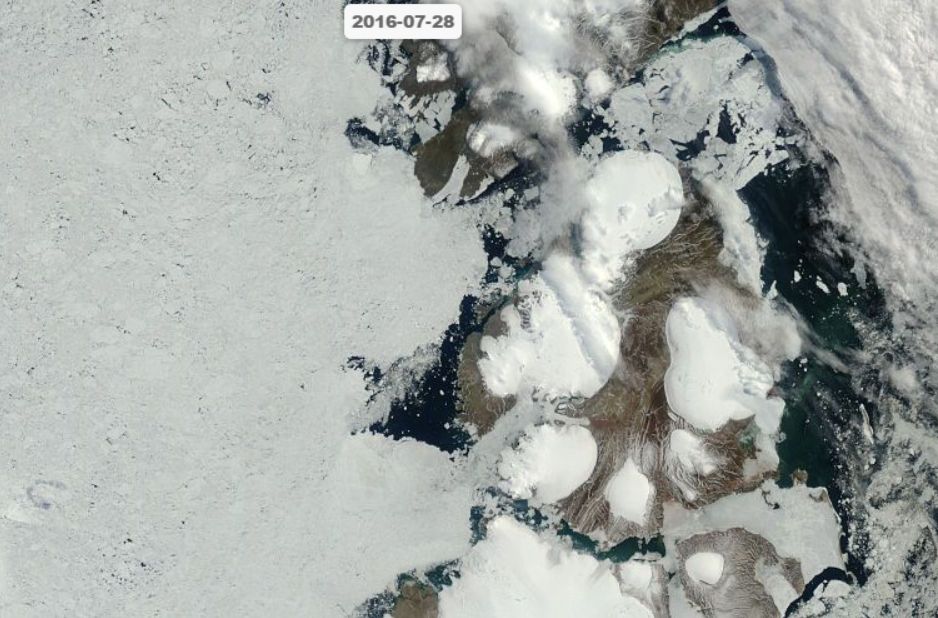
Clearer skies over the Northwest Passage yesterday reveal the remaining ice:
NASA Worldview “true-color” image of Larsen Sound on August 2nd 2016, derived from the MODIS sensor on the Aqua satellite
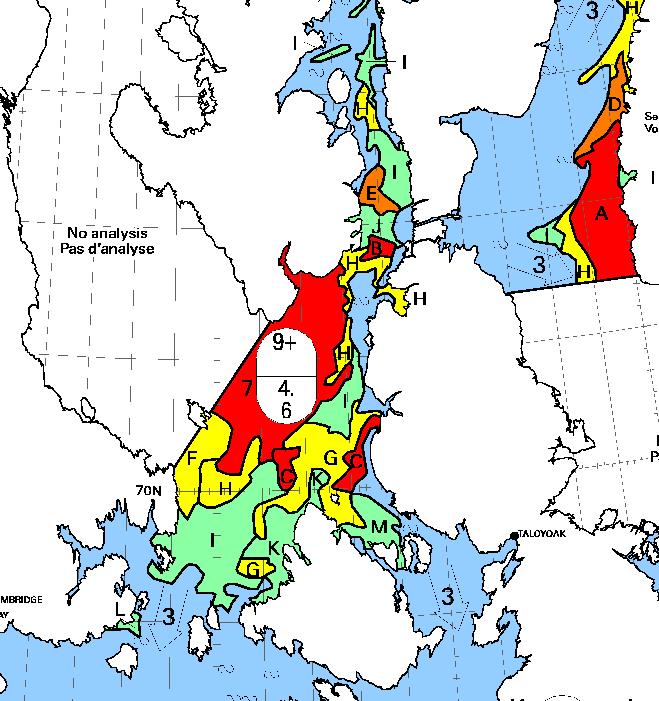
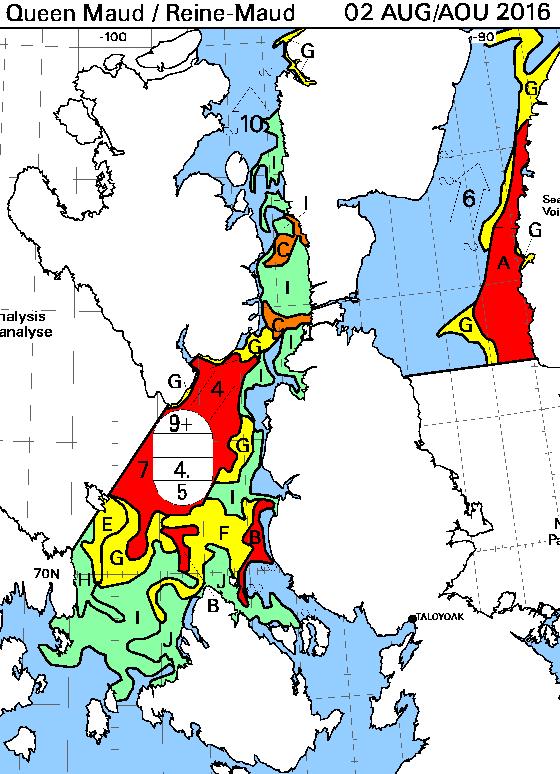
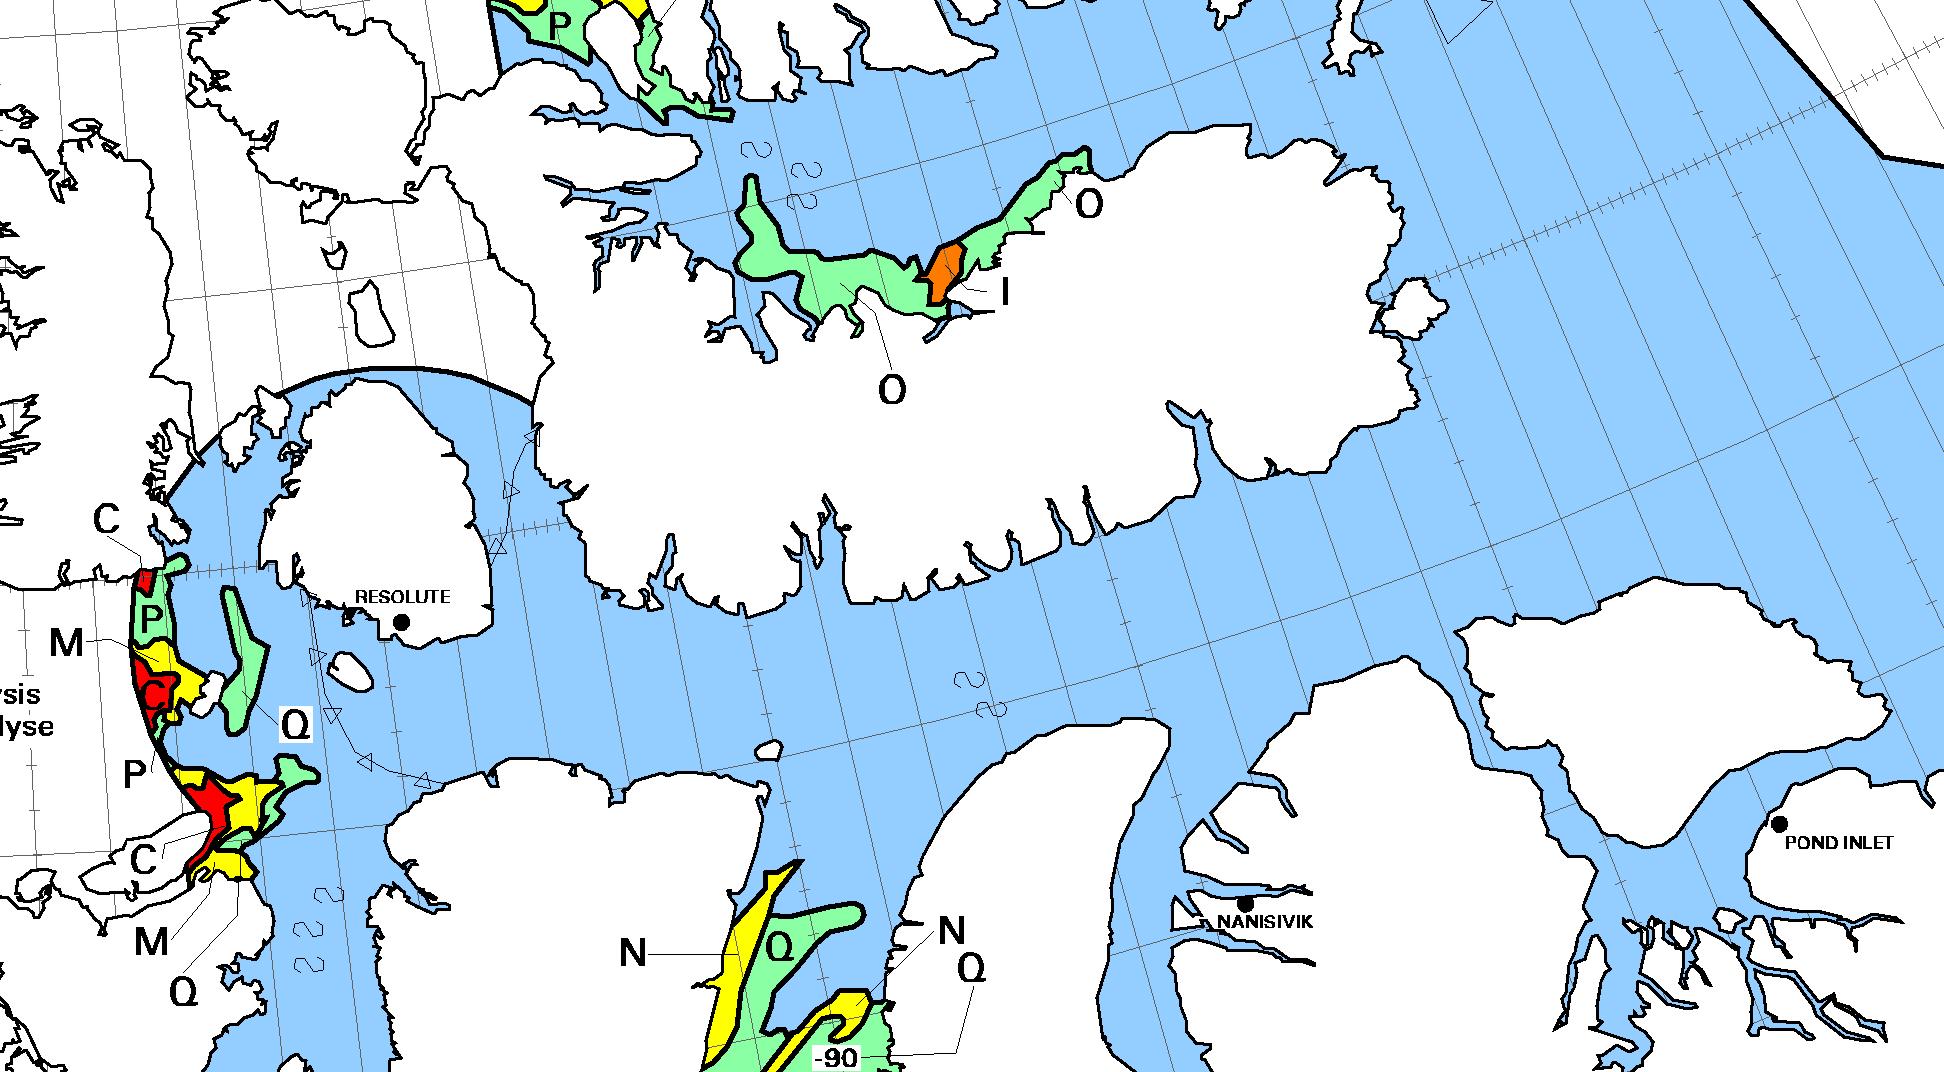
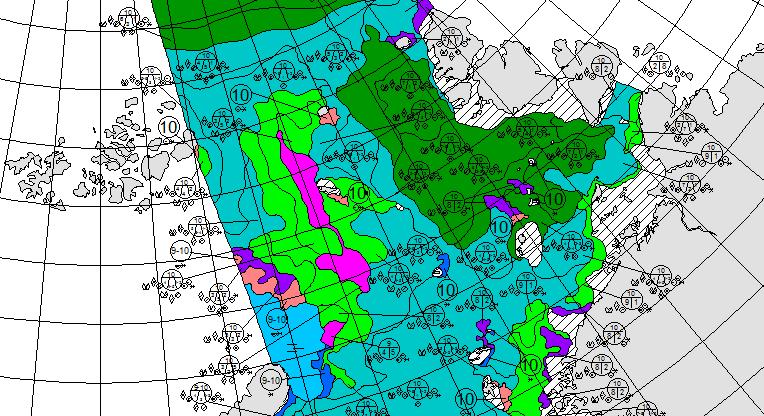
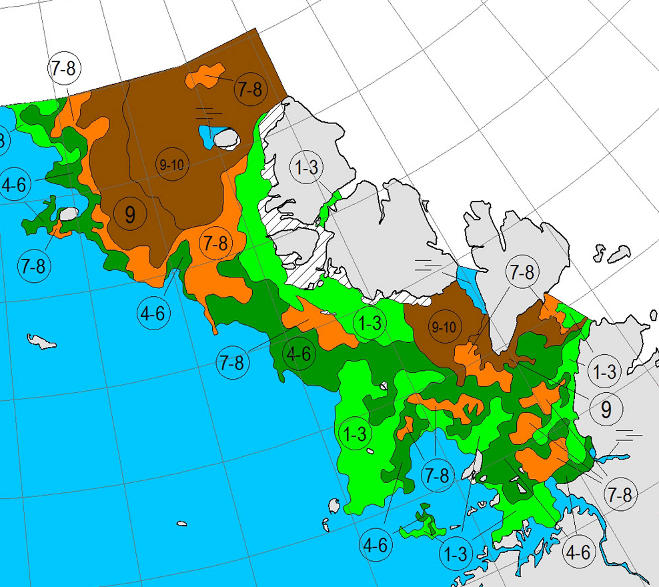
Here’s the CIS chart of the area from yesterday evening:
[Edit – August 7th]
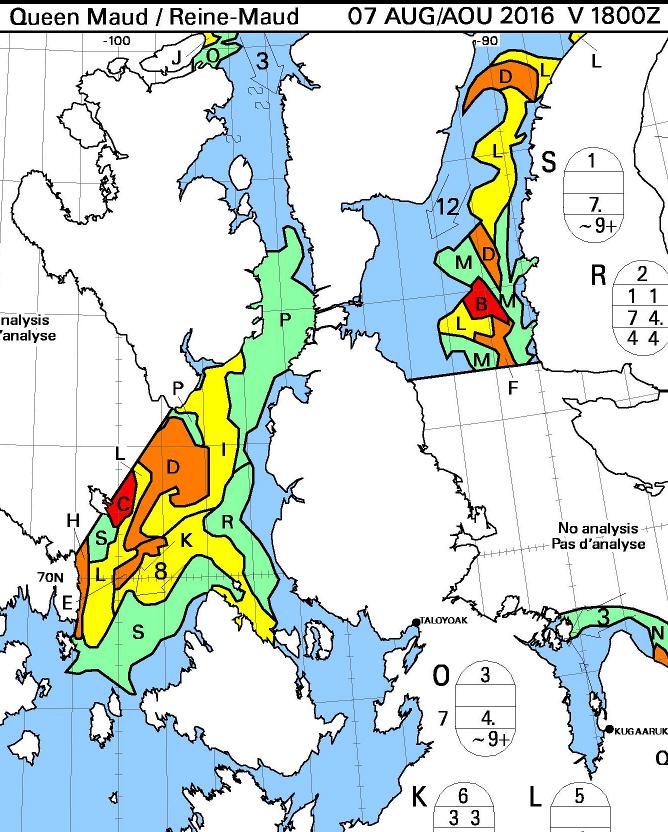
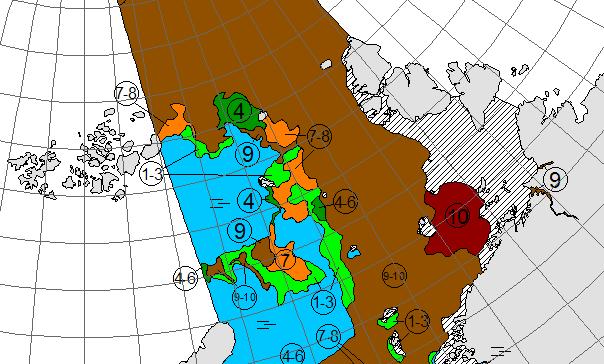
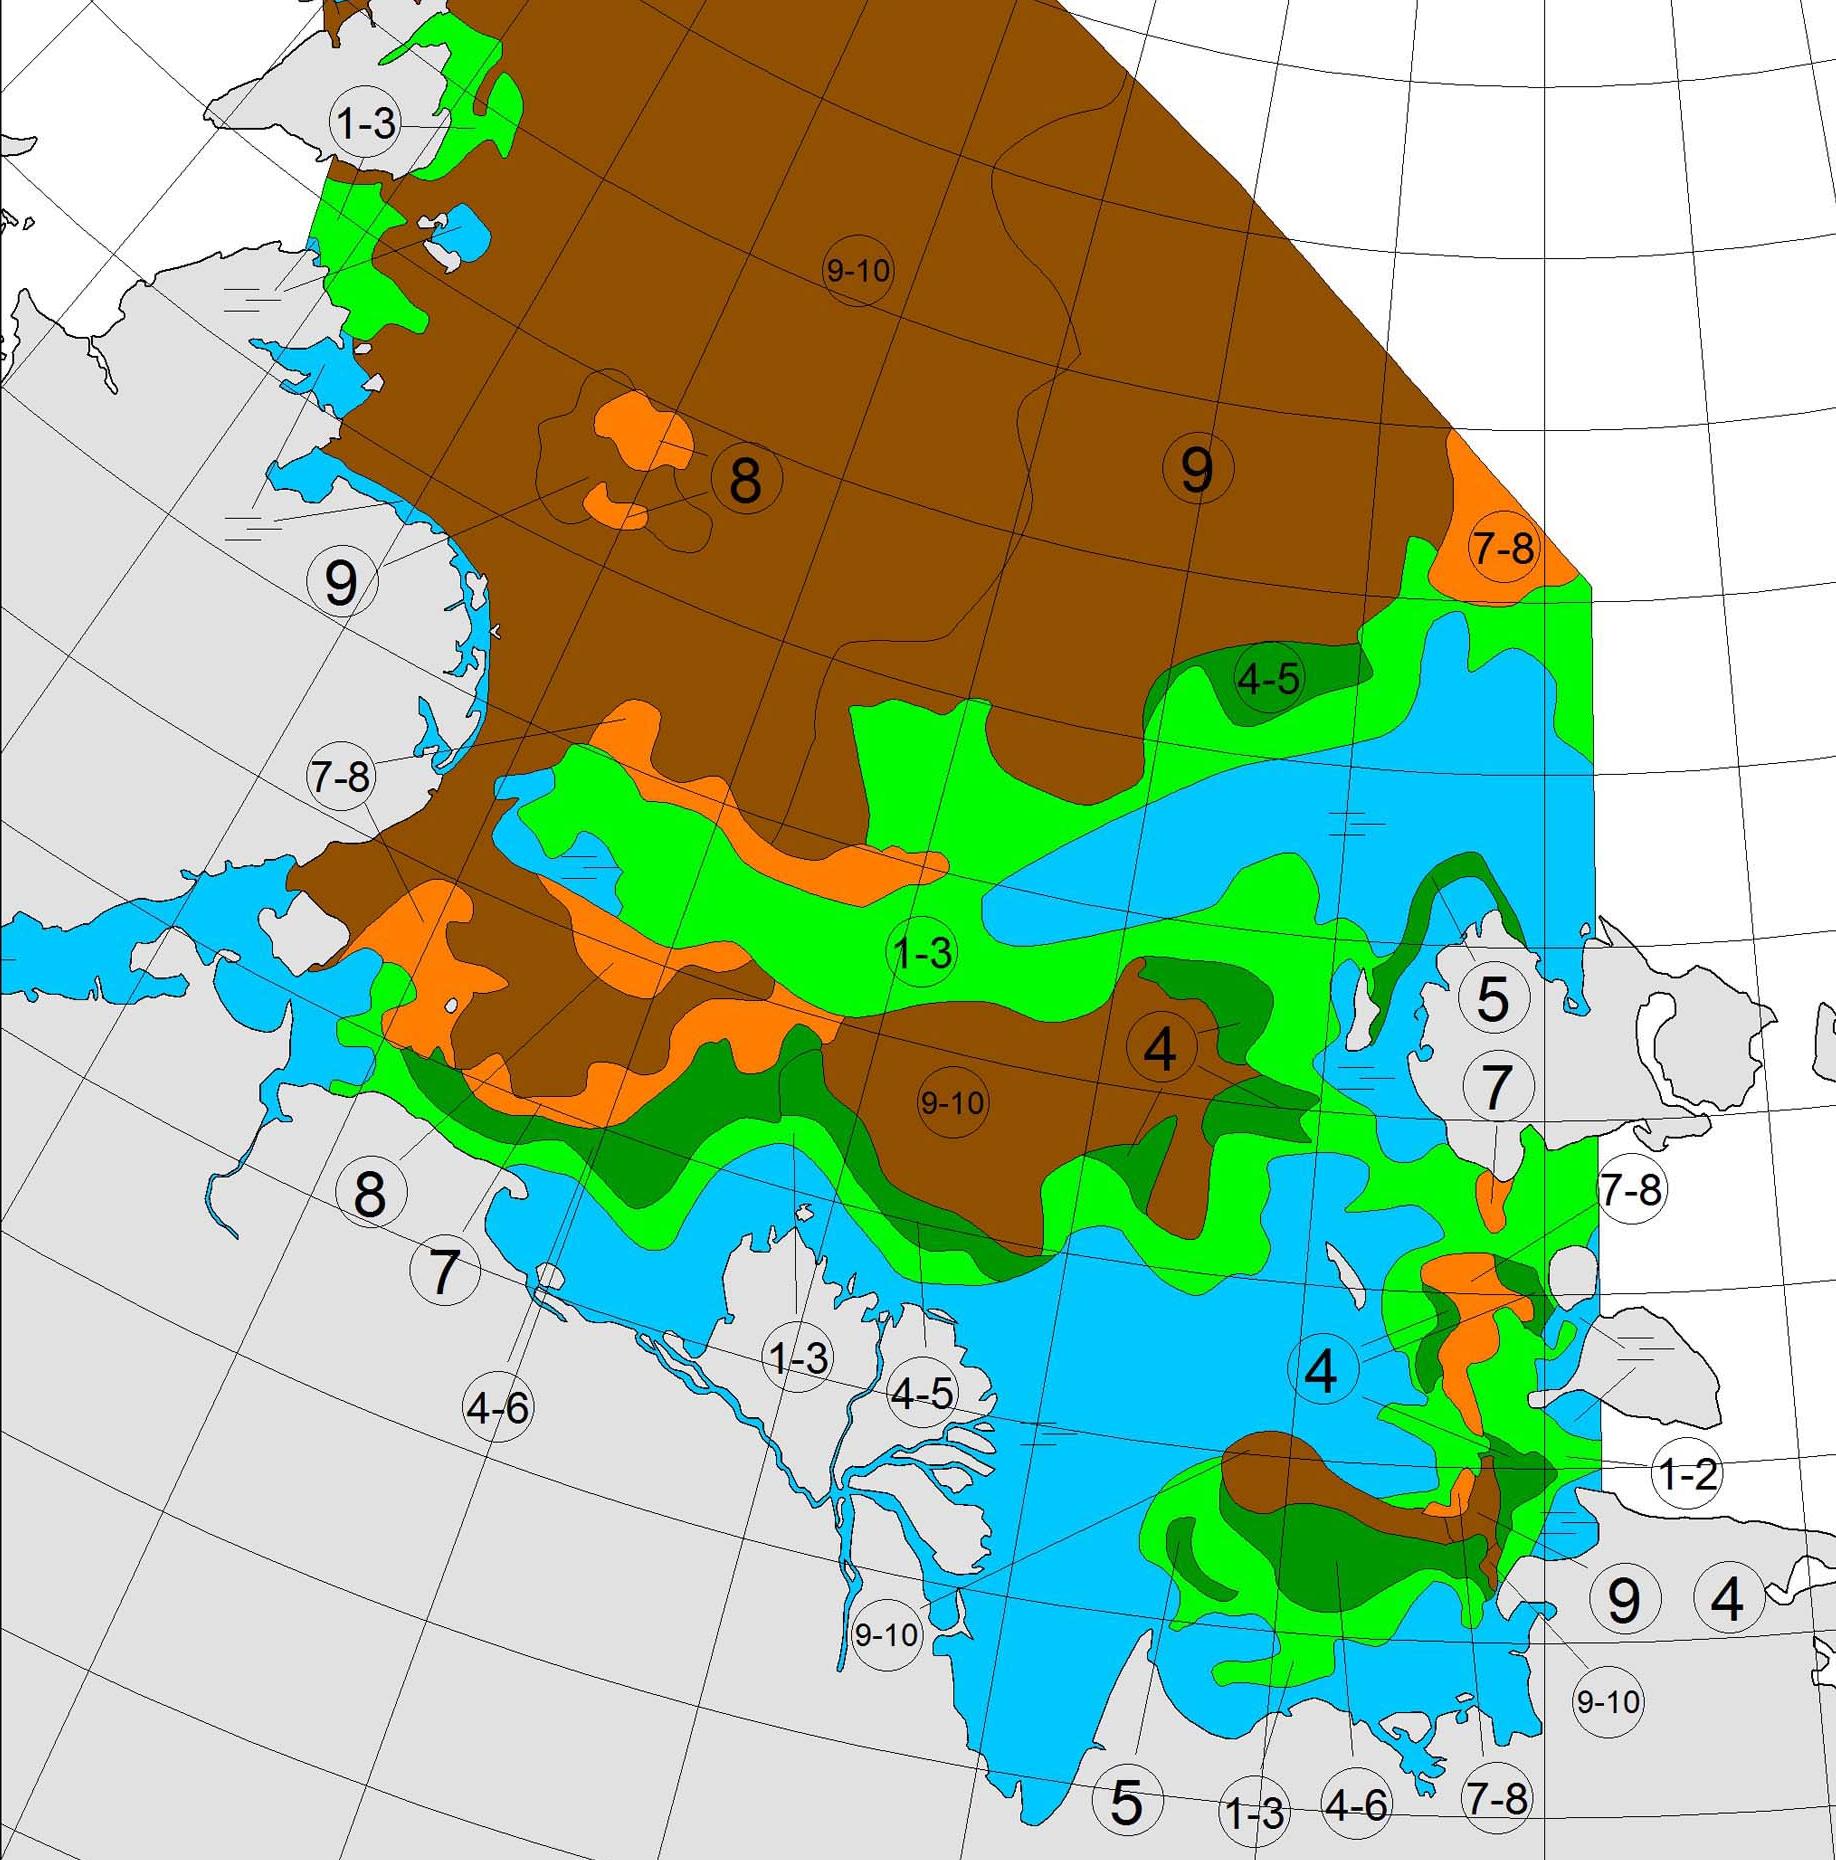
Here’s the August 7th CIS chart for the Queen Maud Gulf and points north:
Today there looks to be a route past Gjoa Havn and through Bellot Strait that doesn’t involve negotiating more than 3/10 concentration sea ice. The ice has been pushed back from Point Barrow too, so by my reckoning we can now declare one route through the Northwest Passage “open”, for the moment at least.
[Edit – August 10th]
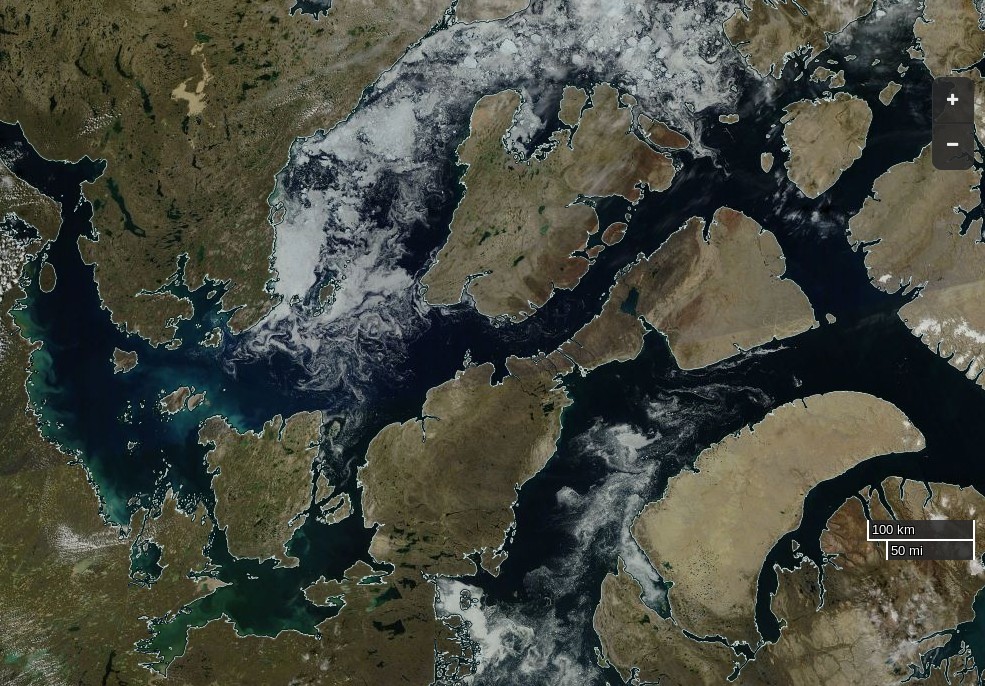
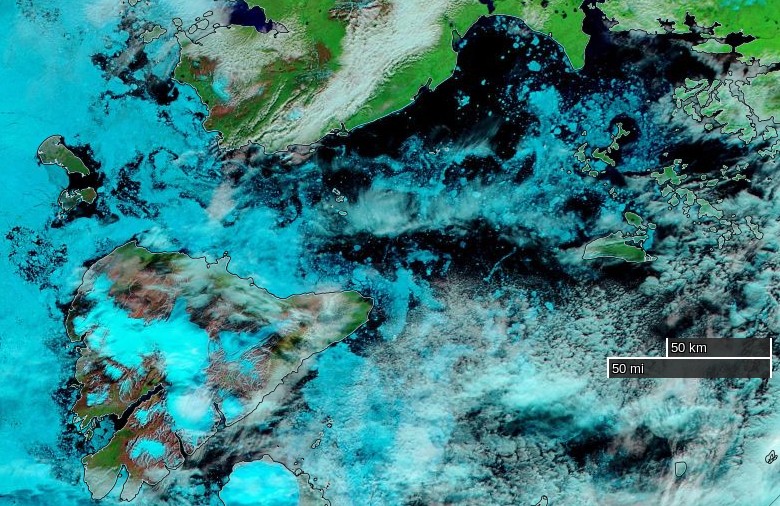
A nice clear MODIS image of the Northwest Passage yesterday:
NASA Worldview “true-color” image of the Northwest Passage on August 9th 2016, derived from the MODIS sensor on the Terra satellite
I had an interesting watch this morning. Just crawled out of bed, rocking and rolling getting ready. I even put my second thermals on, checked the log to see what was happening. clipped on before leaving the saloon, and clipped on behind the wheel.
Just sitting down, put my leg up for stability and a wave came across the boat. Didn’t see it or hear it. For a fraction of a second, my whole body was under water, and it was only my leg stopping me going out of the side, and hopefully my tether would have stopped me going over completely.
I actually had a mouth full of sea water which was novel. Nikolai thought it was hilarious. I’m just very pleased it was me and not one of the lighter ladies.
Here’s brief video showing some slightly smaller waves:
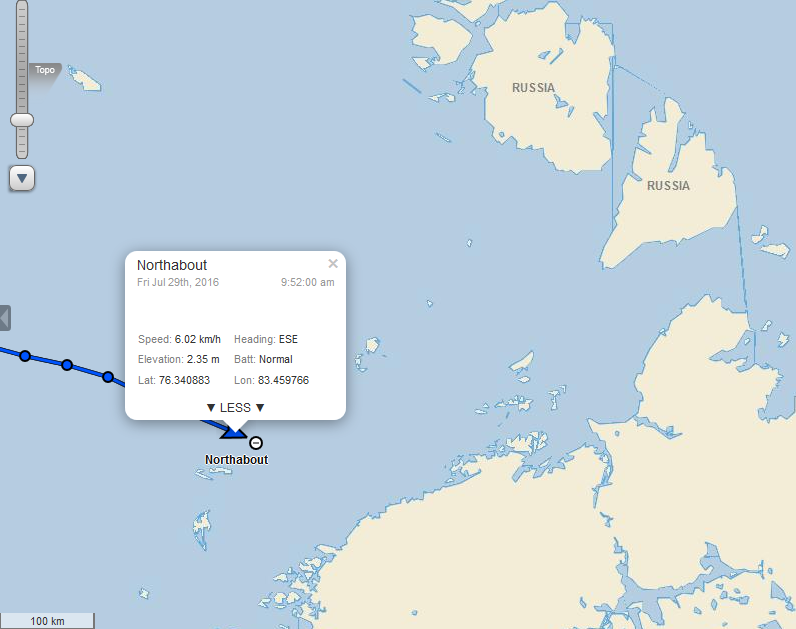
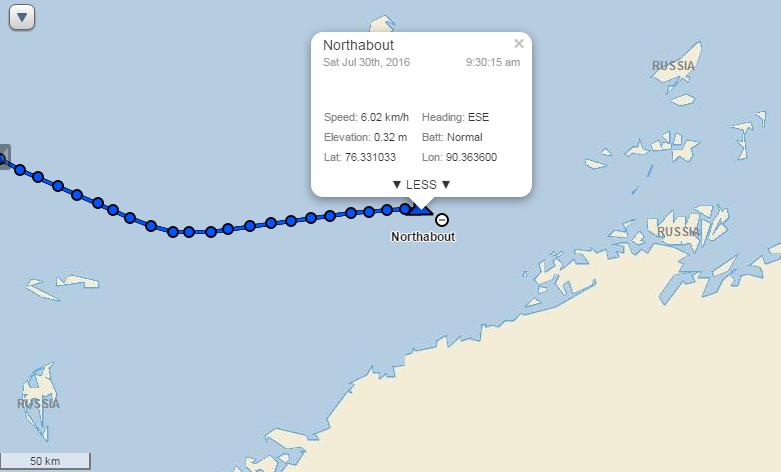
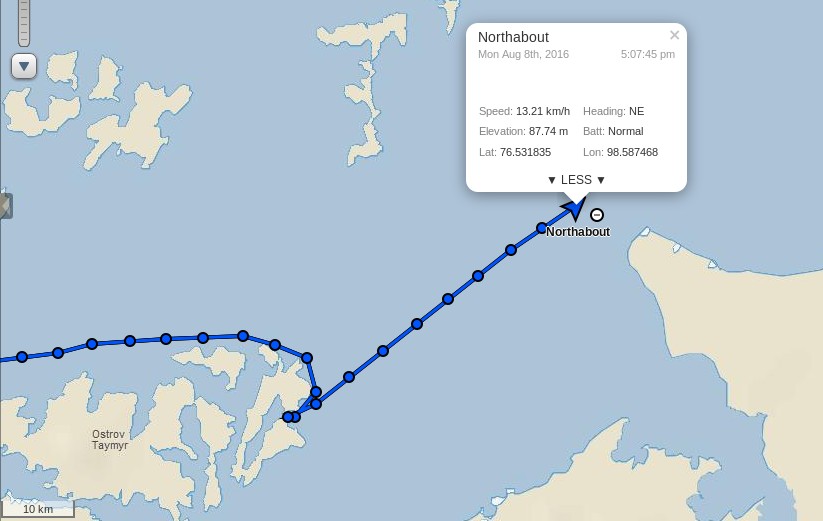
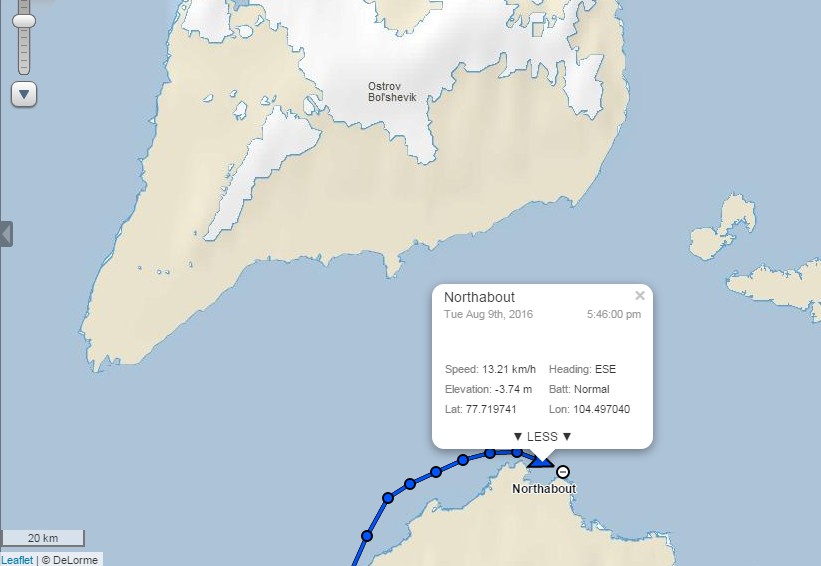
Their live tracking map reveals that they have passed Ostrov Troynoy and are now heading east in the general direction of the Nordenskiöld Archipelago:
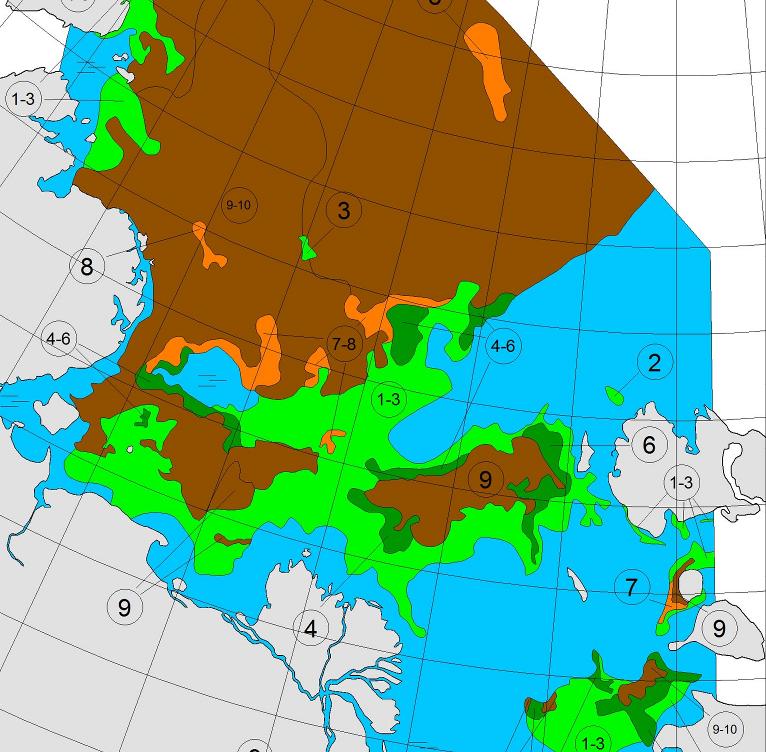
The latest sea ice map of the north eastern Kara Sea reveals some open water in the Vilkitsky Strait, but as yet no way through for a small yacht like Northabout:
A bit further afield the University of Hamburg’s AMSR2 imagery reveals the current ice conditions along the rest of the Northern Sea Route:
All in all it doesn’t look as though Northabout’s crew will beaming videos back to us from the Laptev Sea over the next few days, but never say “never” in the Arctic!
N76 20 E083 28 Pressure 998 water temp 4 outside temp 5 cloud 6/8 sea state 3 winds 15 knots.
Making steady progress east. I always love it when we click over degree of longitude. Of course, they are pretty close together up here. ( I have been dreaming of the 180 long), for weeks.
The winds will slowly take us north east today and tomorrow. Hopefully find our island with the Palm trees and wait for the Ice to break up. Looking forward to seeing an Ice update today and see if this storm has changed anything. Fingers crossed.
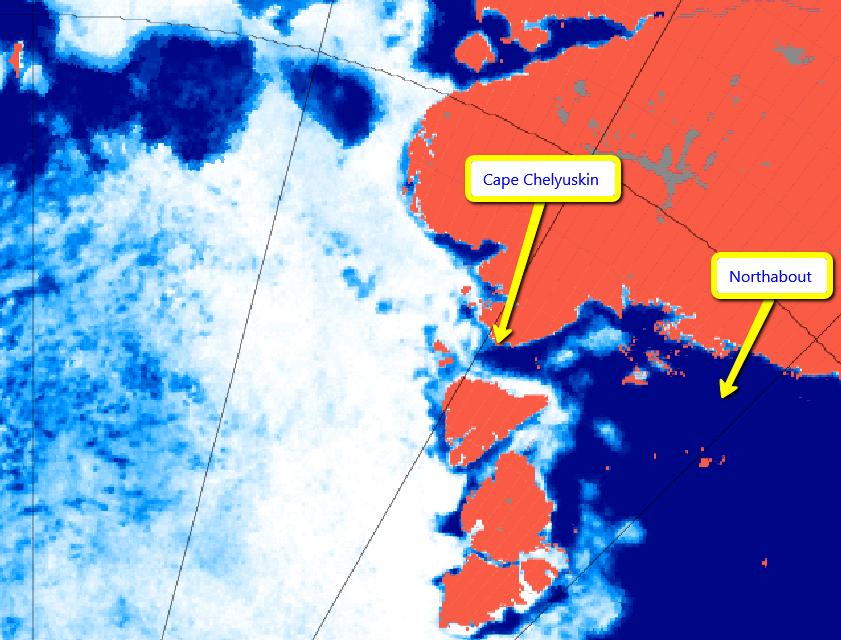
The Vilkitsky Strait is covered in thick clouds this morning, so here once again is the view from on high using passive microwaves:
Today’s sea ice update is that concentration in the Nordenskiöld Archipelago and Vilkitsky Strait seems to be falling fast. Visual confirmation of that is eagerly awaited.
Making steady progress East. We had the latest ice charts for the Vilkitskogo straight. Still blocked and the Laptev still blocked, but big changes from the last set of charts, and encouraging.
Nikolai and Dennis are having bets. Nikolai thinks it will be free on his birthday, the 9th Aug, and Dennis on his, 6th Aug . Either way, would mean a few days rest. We are heading for a small sheltered Island. Different to the first choice, as the ice from the North has come down and blocked it, so trying for another Island closer to shore and closer to the straight. So if anything dramatic changed quickly, we would be close to react. Ie, A strong southerly taking the ice from the shore.
Saw our first ICE today on my watch, just an hour ago. What is slightly worrying, it didn’t show up on the Radar. It’s probably good for the big icebergs, but not low ice in the water. I think we will see a lot more of that before the trip is out. You can’t beat that old eyeball.
[Edit – July 31st]
In a brief update this morning the crew of Northabout report they are:
Anchored! for rest repairs and to wait for favourable ice conditions in the NE passage and for the new ice charts. Proper shipslog update coming later with some photos (which take ages to upload) But for now we’re getting a bit of a rest & having a cuppa.
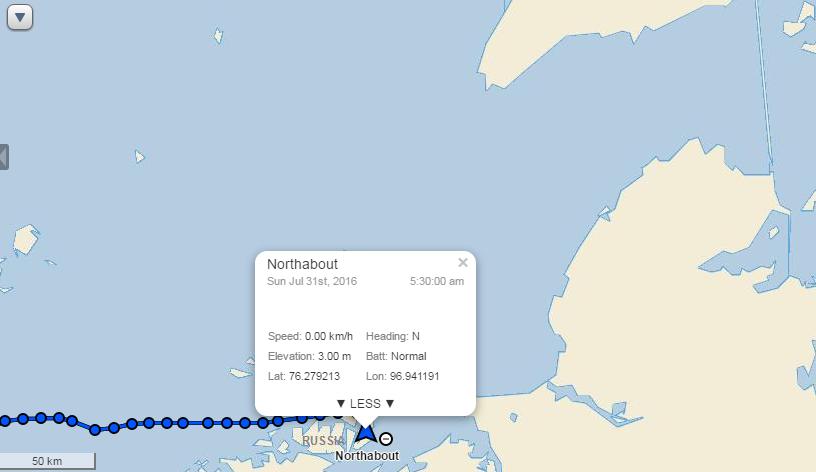
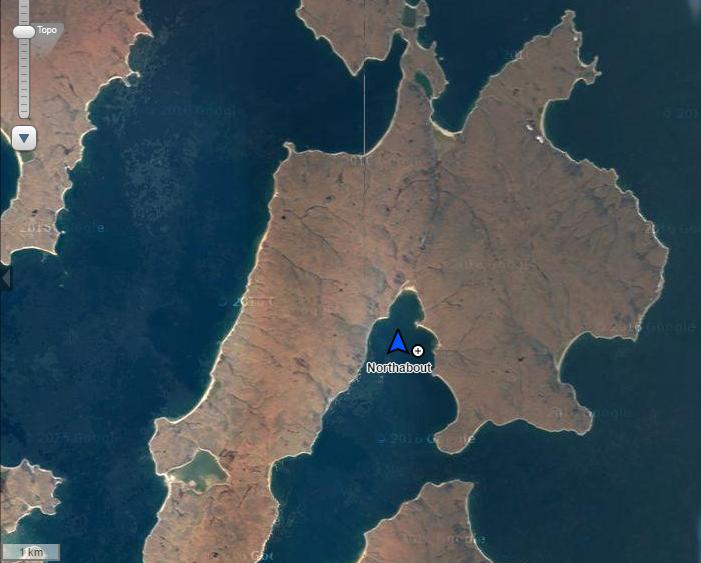
They have found some shelter in the convoluted coastline of Ostrov Pilota Makhotkina, just off the shores of Siberia and within striking distance of their exit from the Kara Sea:
As Reggie points out below, the sea ice in the Vilkitsky Strait broke up remarkably early this year. Here’s his view from June 23rd:
NASA Worldview “false-color” image of the Vilkitsky Strait on June 23rd 2016, derived from the VIIRS sensor on the Suomi satellite
and if you watch our latest Northern Sea Route animation carefully you’ll note that the ice was already mobile at the beginning of June:
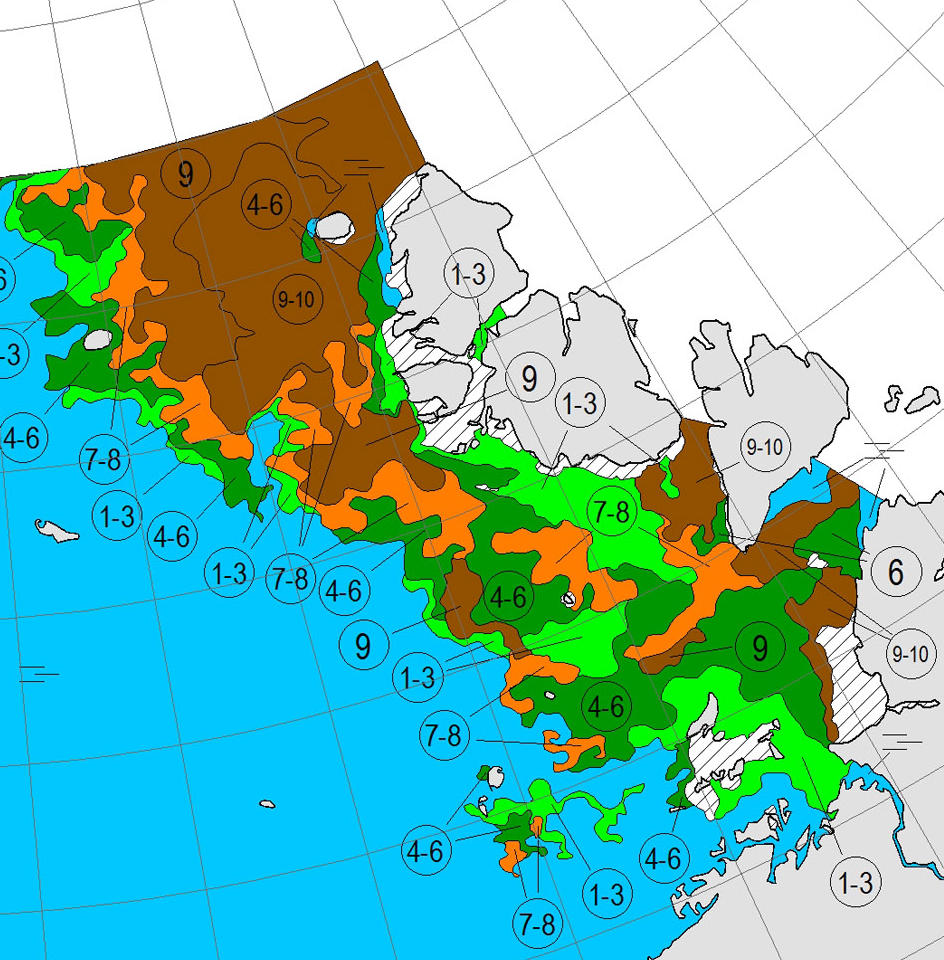
In actual fact the Vilkitsky Strait never became blocked with land-fast ice last winter. Compare this ice chart from the Russian Arctic and Antarctic Research Institute for May 4th 2016:
Three years ago the island where Northabout is now sheltering was still encased in land fast ice at the beginning of July, as was the Vilkitsky Strait itself. By August 25th when the yacht Tara passed around Cape Chelyuskin into the Laptev Sea on her own Polar circumnavigation the Strait looked like this:
[Edit – August 1st]
The latest video from the crew of Northabout reveals them anchoring off Ostrov Pilota Makhotkina:
The skies have cleared over the Vilkitsky Strait this morning! Here’s a “false colour” image from the MODIS instrument aboard the Aqua satellite:
NASA Worldview “false-color” image of the Vilkitsky Strait on August 1st 2016, derived from the MODIS sensor on the Aqua satellite
On “true colour” images sea ice looks white, and so do clouds. Using a different set of wavelengths reveals the ice in pale blue, with the clouds still white. Northabout remains anchored, and it’s easy to see why!
[Edit – August 2nd]
The latest AARI ice charts are out, but don’t reveal a way through to the Laptev Sea for Northabout just yet:
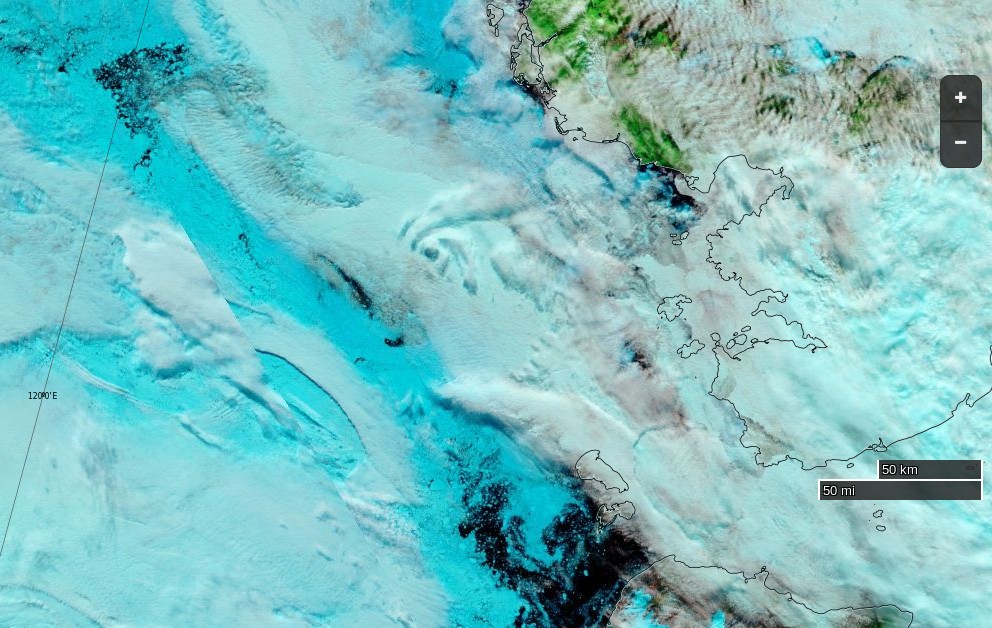
Here’s a fairly cloud free satellite image of what lies ahead:
NASA Worldview “true-color” image of the Laptev Sea on August 2nd 2016, derived from the MODIS sensor on the Aqua satellite
The crew of Northabout report that some of that ice has made its way into their anchorage:
Whilst at anchor we have a respite from our normal watch routine and it is replaced with Anchor Watch, which is an hour and half slot, mine is from 12.30am to 2am. The other crew and Northabout are in a deep slumber, perfect quiet interspersed with gentle snoring from contented crew! Last night was an exception, as the wind picked up and changed direction, resulting in some bits of drifting ice coming into the bay, ‘crashing’ into the boat at about 4am, giving all the crew an alarming wake up call. There was no danger, it was simply the deafening noise of ice and aluminium in the still of the night! Dennis was soon on the job with the ice poles, keeping all at bay!
[Edit – August 8th]
As Bill points out below, Northabout is now heading in the direction of Vilkitsky Strait:
Perhaps they’ve had an early look at the latest AARI ice charts of the Laptev Sea? The Northern Sea Route Administration web site is still displaying the ones from August 5th, which showed the route blocked by 9/10 ice coverage in places:
Satellite imagery at visual frequencies is rather cloudy again today:
NASA Worldview “false-color” image of the Laptev Sea on August 8th 2016, derived from the VIIRS sensor on the Suomi satellite
but there’s still no obvious way through to the East Siberian Sea that I can see.
[Edit – August 9th]
Northabout has just rounded Cape Chelyuskin and is now heading into the Laptev Sea!
Here’s the new ice chart for the Laptev Sea:
A navigable strip does seem to be opening up around the coast, but there’s still a stubborn patch of 9/10 concentration sea ice blocking Northabout’s way.
Please forgive my mixing of metaphors this morning, but the interminable stream of piss poor propaganda from Tony Heller grows ever more voluminous. Not only has he reprised his “DMIGate” nonsense but he is also posting pictures of the wrong bit of the Arctic yet again. Exhibit A:
DMI shows Arctic sea ice extent well below last year, and near a record low.
In fact, there is more ice than last year, and it likely that 2016 will end considerably higher than last year. This is because the big red spot (below) in the Beaufort Sea disappeared in a storm during the second week of August last year.
The forecast is for very cold air over the Beaufort Sea the next two weeks, so it is unlikely that a lot of melting is going to occur there. This is shaping up to be a disastrous year for Arctic alarmists, and it will be interesting to see how the graphs progress, and if and when they catch up with reality.
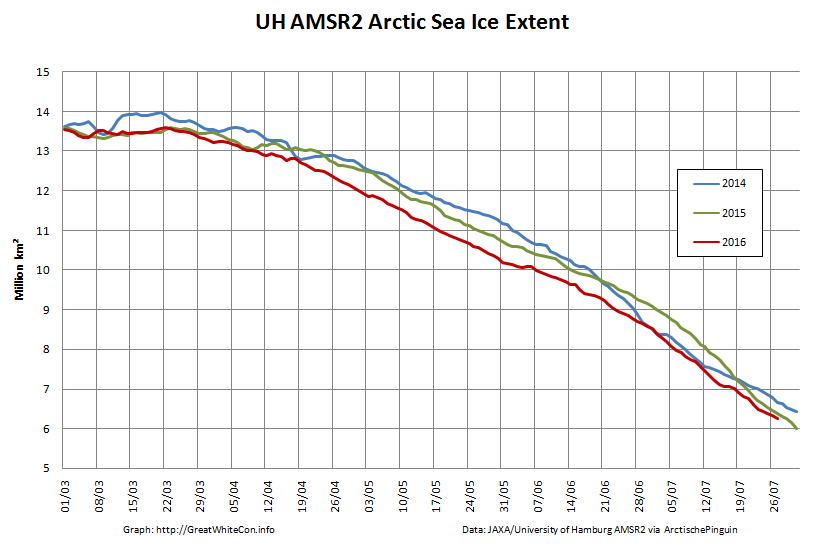
DMI aren’t the only ones that “show Arctic sea ice extent well below last year”:
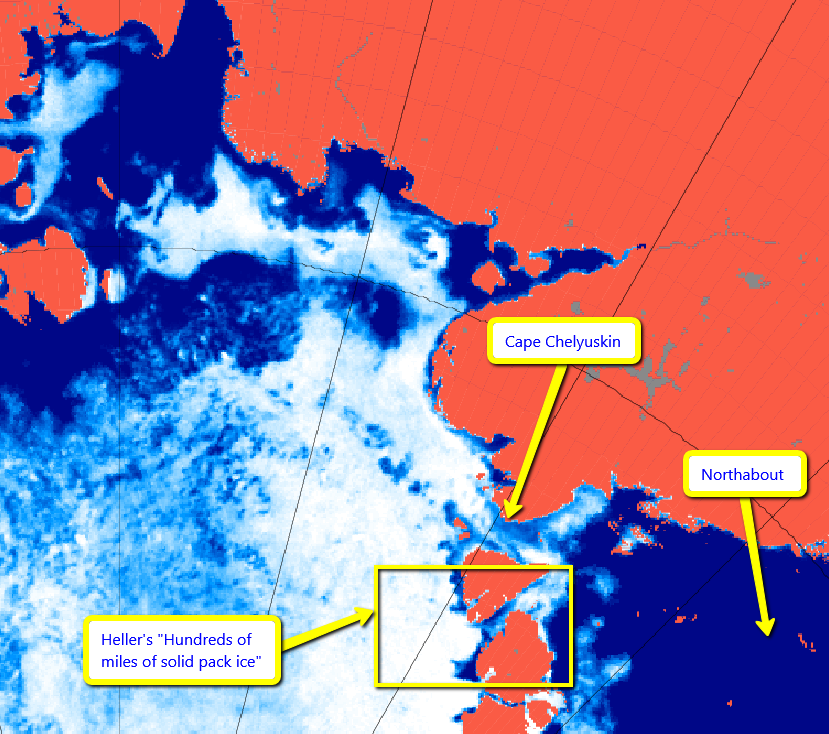
The clouds over the Northeast Passage have finally cleared, and you can now see what our intrepid explorers are up against. Hundreds of miles of solid pack ice.
I pointed out the error of his ways to him yesterday, but for some strange reason Tony is still posting pictures of the wrong place. Here is an overview of the actual facts, as assessed by AMSR2:
It is if you believe Tony Heller, which I humbly suggest is not a particularly wise course of action at the best of times. In his umpteenth article on Northabout’s Great Adventure over the last four days he dares to take your humble scribe’s name in vain as he loudly proclaims:
I cannot help but think that sorting the wheat from the unReal Scientific chaff will be required as the “debate” proceeds, and so:
Them
Jim Hunt (and Blowtorch Reggie) are egging the ship of fools on to disaster, telling them that the ice is receding. And the intrepid fools are listening to them.
It has been persistently cloudy in the Northeast Passage, and the ice is not melting.
[Cloudy image redacted]
The ice edge has pushed back slightly due to winds.
The animation below shows how the wind has shifted the ice over the last couple of days, and how the route is blocked with hundreds of miles of 1-2 meter thick ice.
Reggie also egged the 2013 Arctic rowers on to near disaster, before they had to abandon their boat.
Now please explain to me precisely how “Snow White” is “egging on” anybody by posting the satellite visualisation that you have kindly reproduced above?
It does after all reveal that the ice edge at the Kara Sea end of the Vilkitsky Strait has recently receded, as predicted.
Them
They aren’t going anywhere without an icebreaker. Why are you giving them false hope?
Us
I’m not “giving them false hope”. I’m reporting on some interesting (IMHO) Arctic facts, as per usual. In this instance it seems a few other people find them interesting also.
It seems we’re all agreed that “The ice edge has pushed back slightly due to winds” since your map above shows that too, albeit with reduced resolution?
FYI “Snow White” is sobbing uncontrollably into her snow white hanky as we speak. She’s still blocked by “Steve Goddard”
Whilst we’re on the subject, I thought you were of the view that those who block polite enquirers on Twitter are “probably attempting to pull off a Michael Mann sized fraud on the public.”?
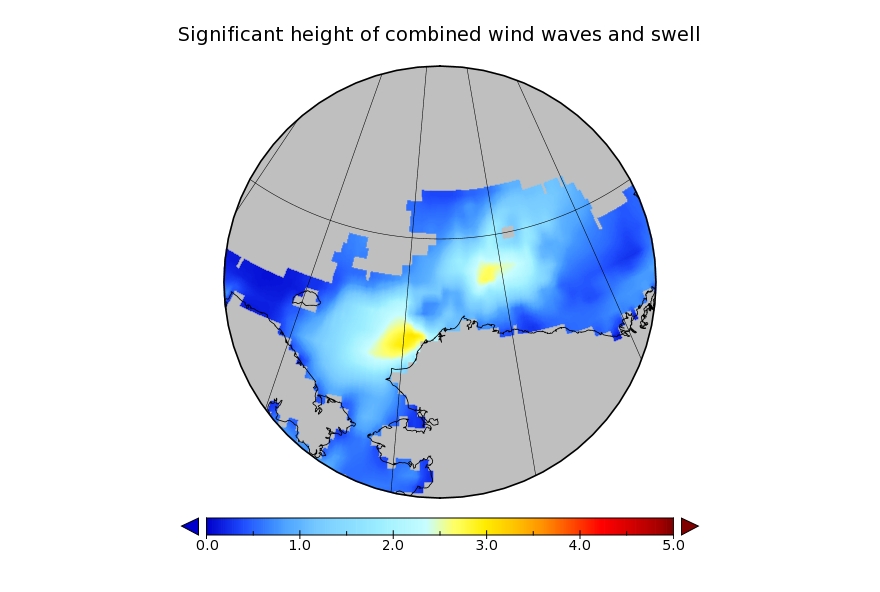
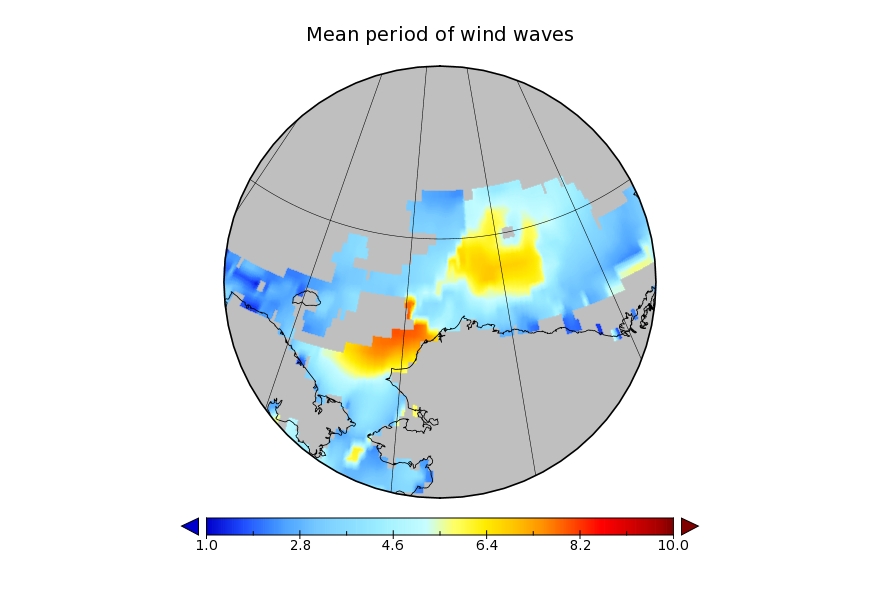
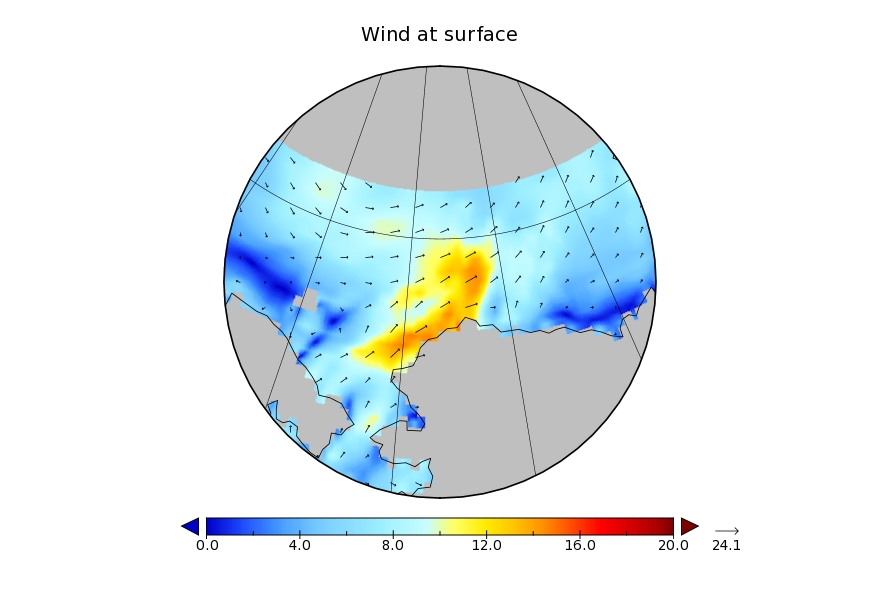
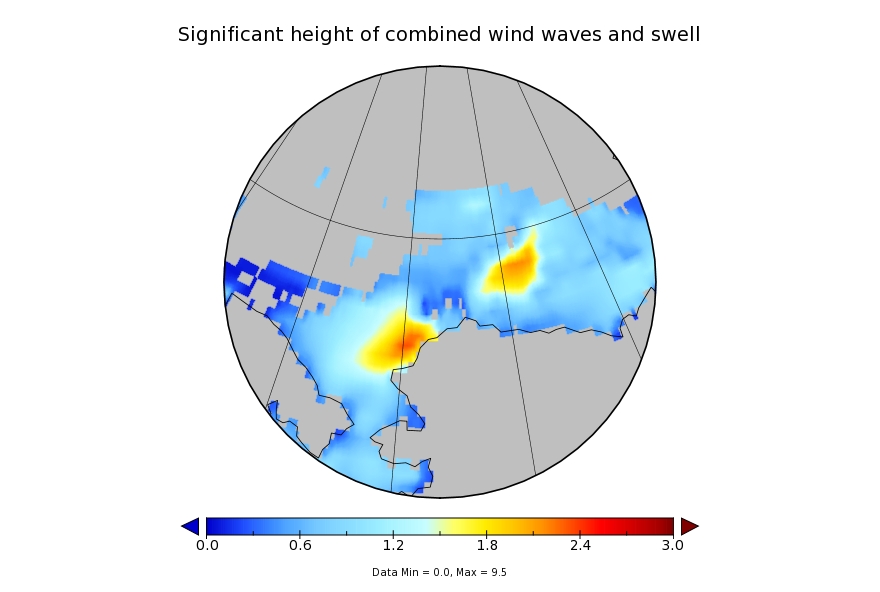
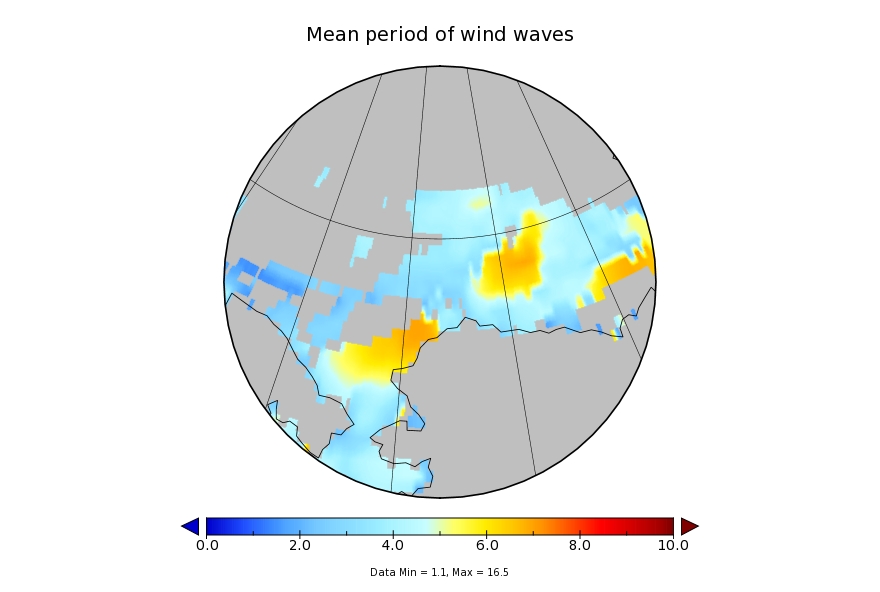
It looks like a storm is brewing in the Arctic. The long range weather forecasts for the Arctic have been remarkably unreliable recently, but this one is for a mere three days from now. WaveWatch III suggests there will be some significant waves in the Chukchi and Beaufort Seas this coming weekend, travelling in the direction of the ice edge:
WaveWatch III wave height forecast for July 17thWaveWatch III wave period forecast for July 17thWaveWatch III wind forecast for July 17th
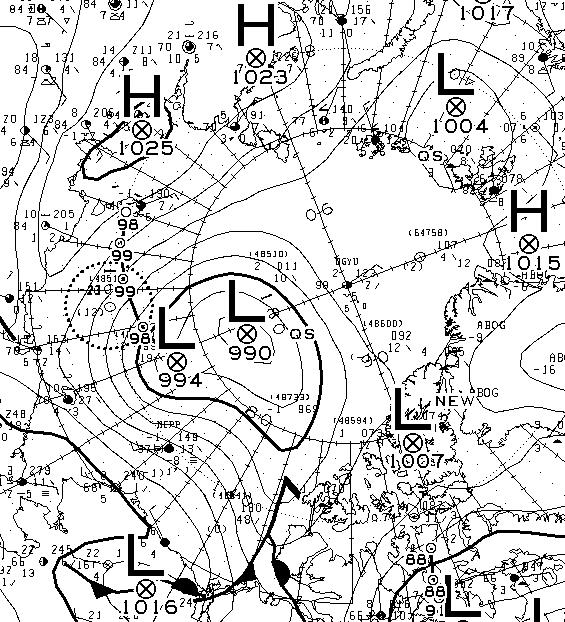
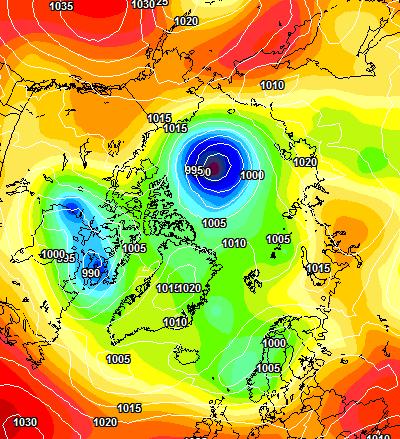
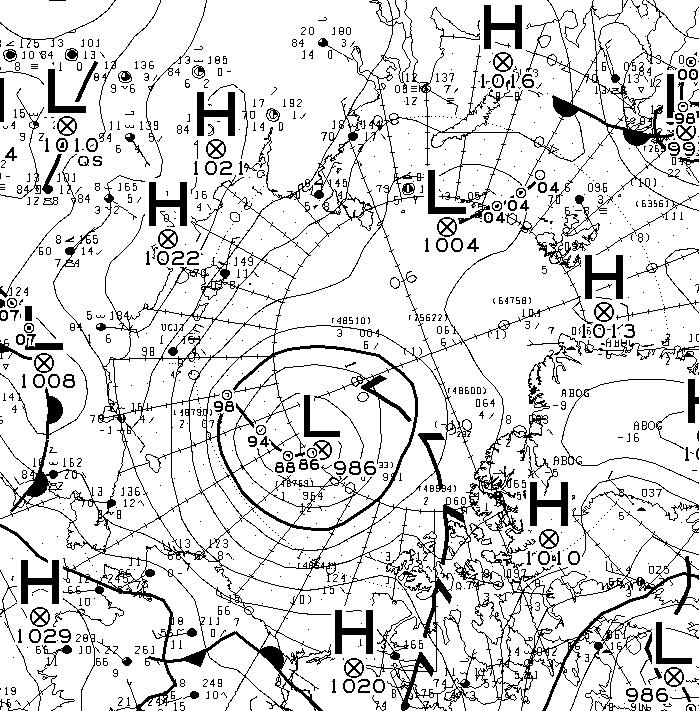
Another day has dawned, and the Environment Canada synoptic chart shows that the low pressure system currently over the Arctic has reached a central pressure of 990 hPa:
The latest ECMWF SLP forecast for tomorrow is firming up:
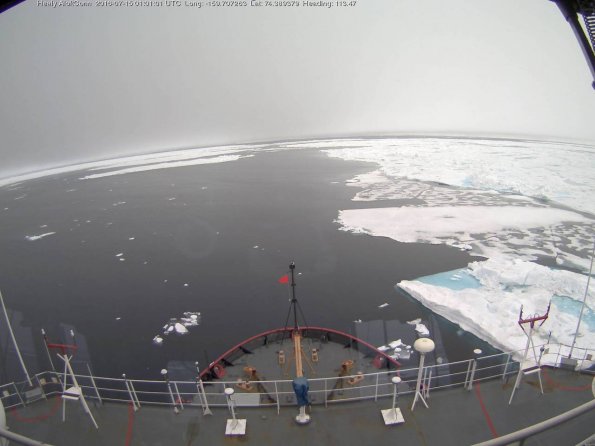
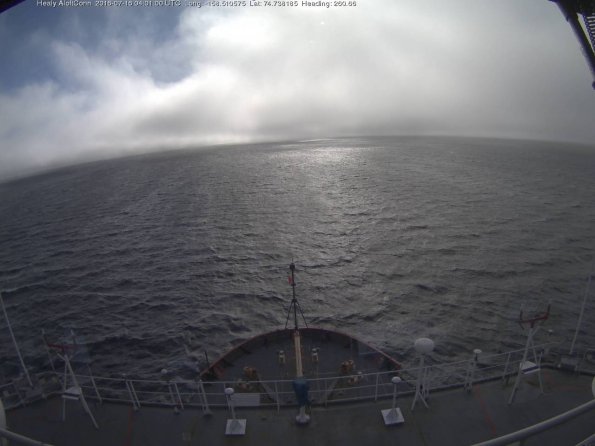
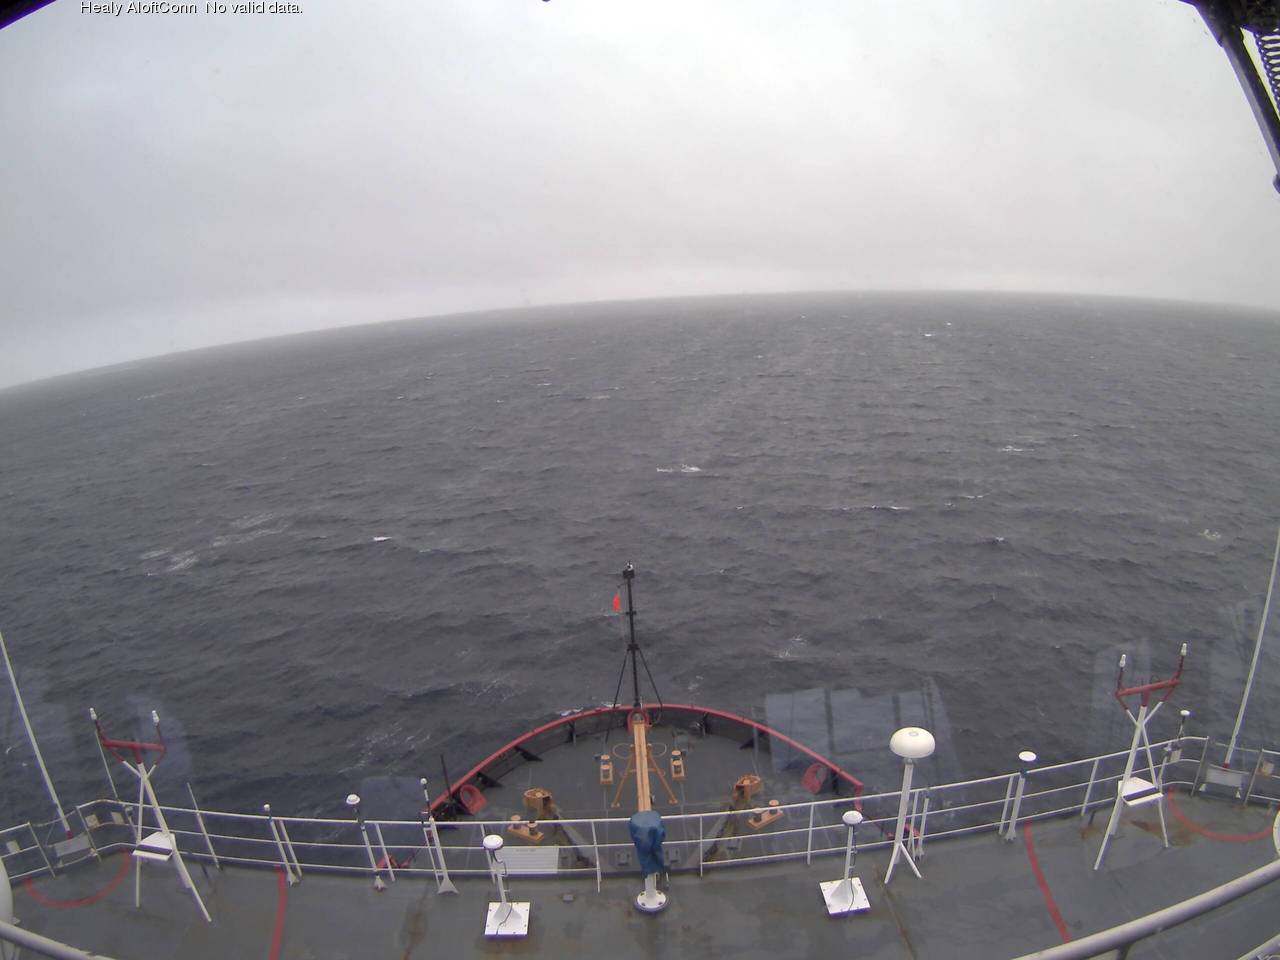
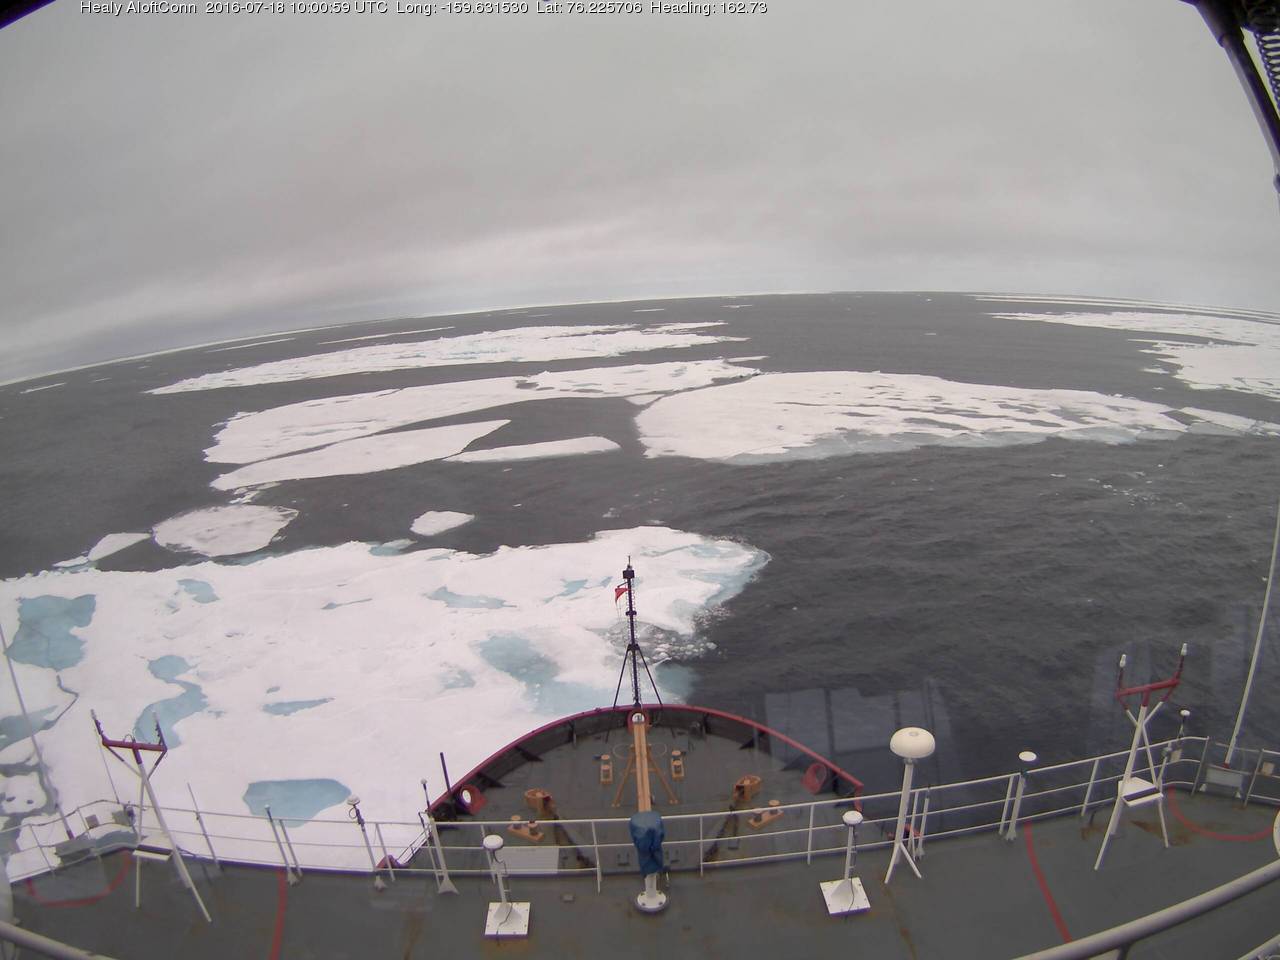
A modest swell is now visible from USCGC Healy’s “AloftCon” webcam:
whilst the WaveWatch III forecast for tomorrow has dropped off to a significant wave height of around 2 metres with an average period of 7 seconds:
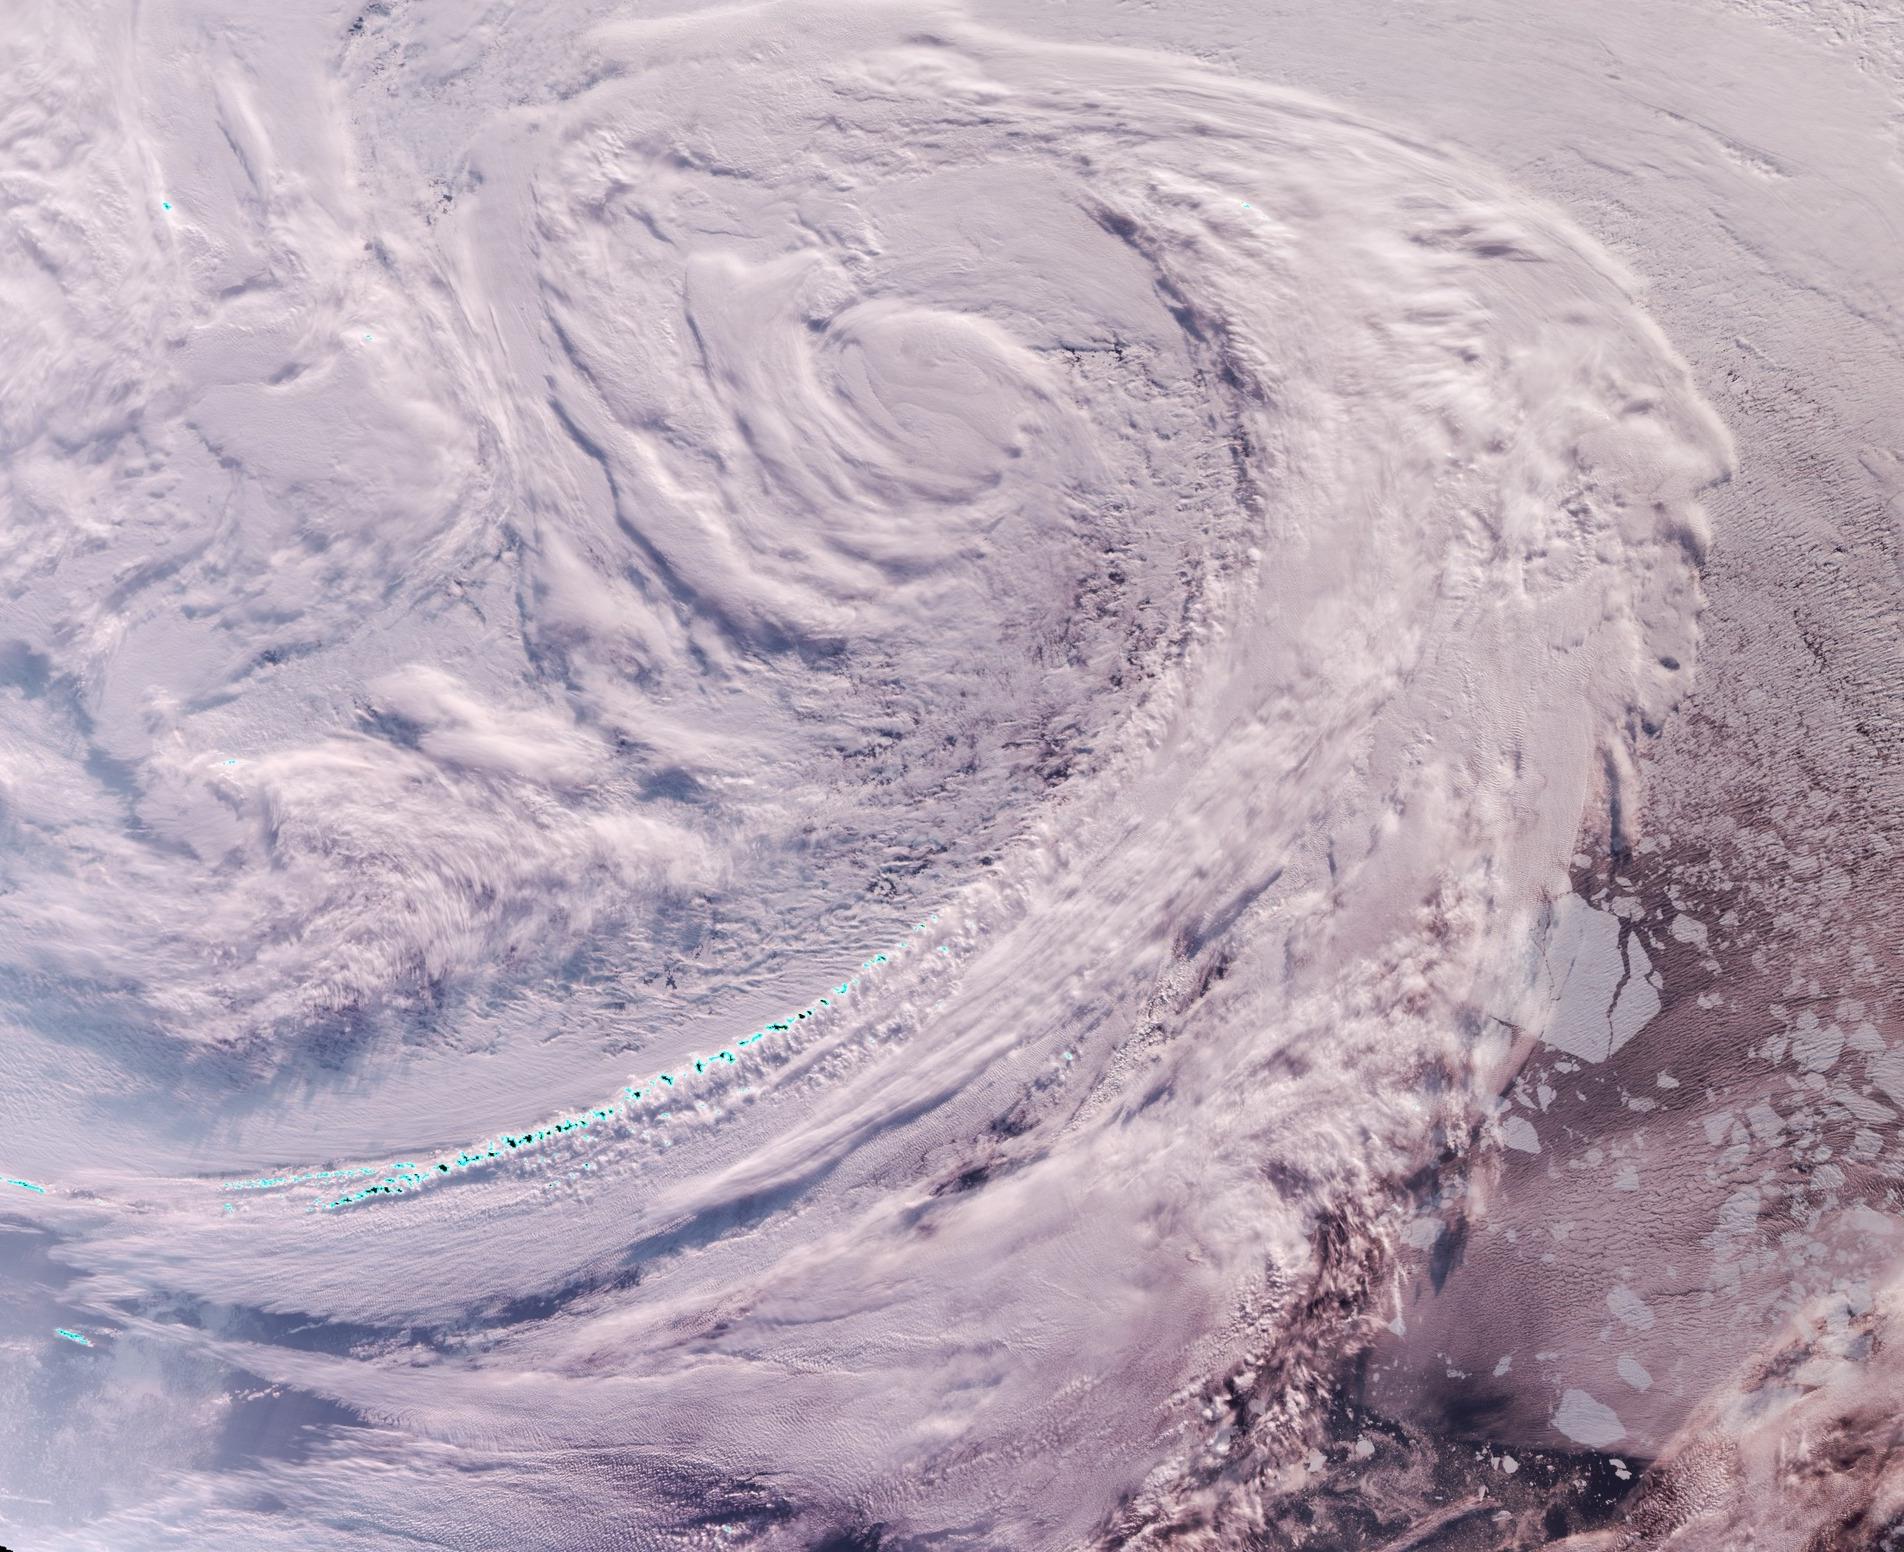
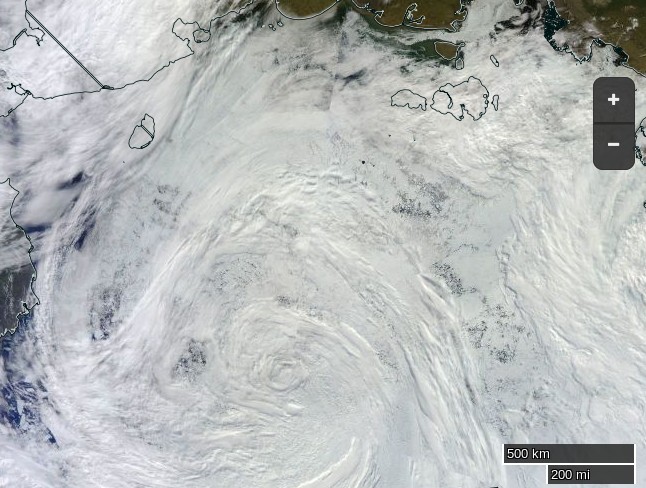
Meanwhile an image from the VIIRS instrument on the Suomi NPP satellite reveals the current storm in all its glory, together with confirmation that the “Big Block” multi-year ice floe north of Barrow has split asunder overnight:
[Edit July 17th 2016]
Sunday morning has now arrived. The storm in the Arctic looks to have bottomed out at 986 hPa central pressure. Here’s the Environment Canada synoptic chart for 00:00 this morning:
This is how the resultant swell looked from USCGC Healy at 06:00:
[Edit July 18th 2016]
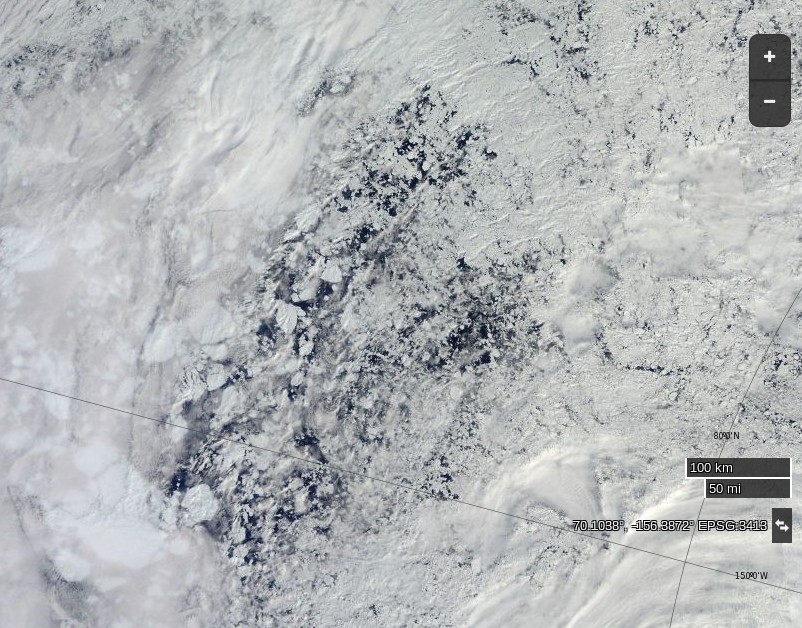
Here’s what the Beaufort and Chukchi Sea north of Barrow look like this morning through the clouds:
NASA Worldview “true-color” image of the Beaufort Sea on July 18th 2016, derived from the MODIS sensor on the Terra satellite
The remains of the now not so “Big Block” can just be made out in the bottom left. For a cloud free image here’s the latest AMSR2 passive microwave imagery of the area from the University of Hamburg:
The USCGC Healy and the remnants of the swell are in amongst the ice:
[Edit July 20th 2016]
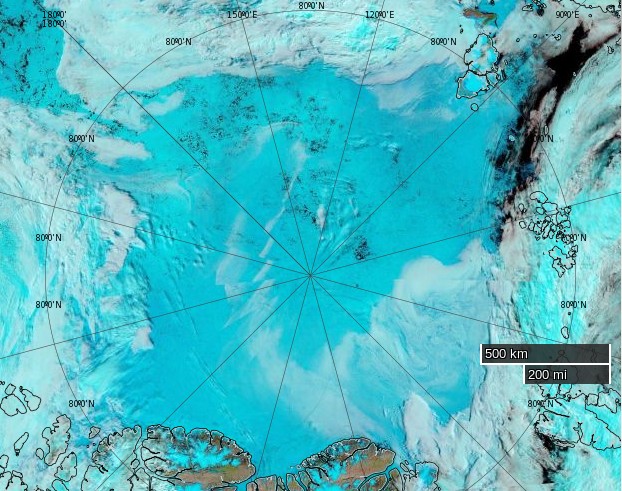
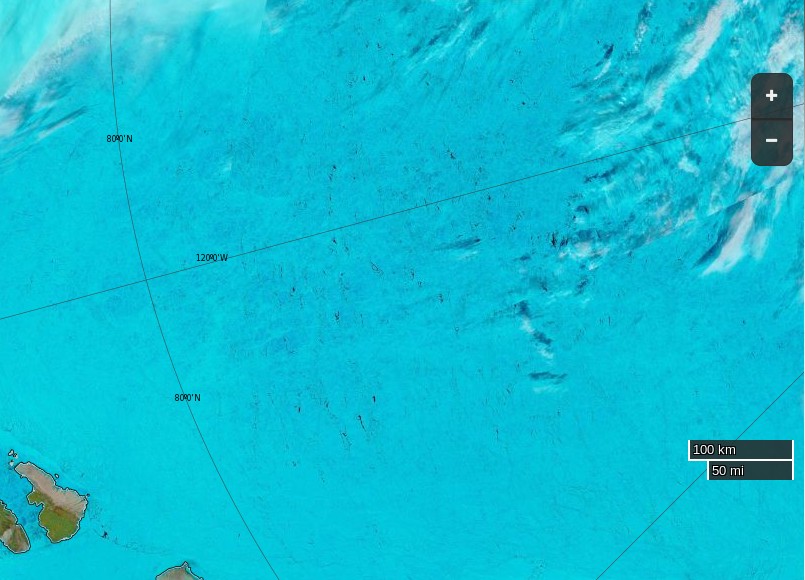
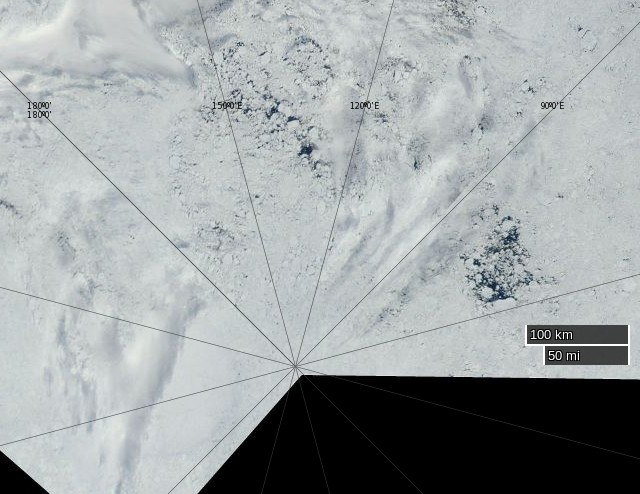
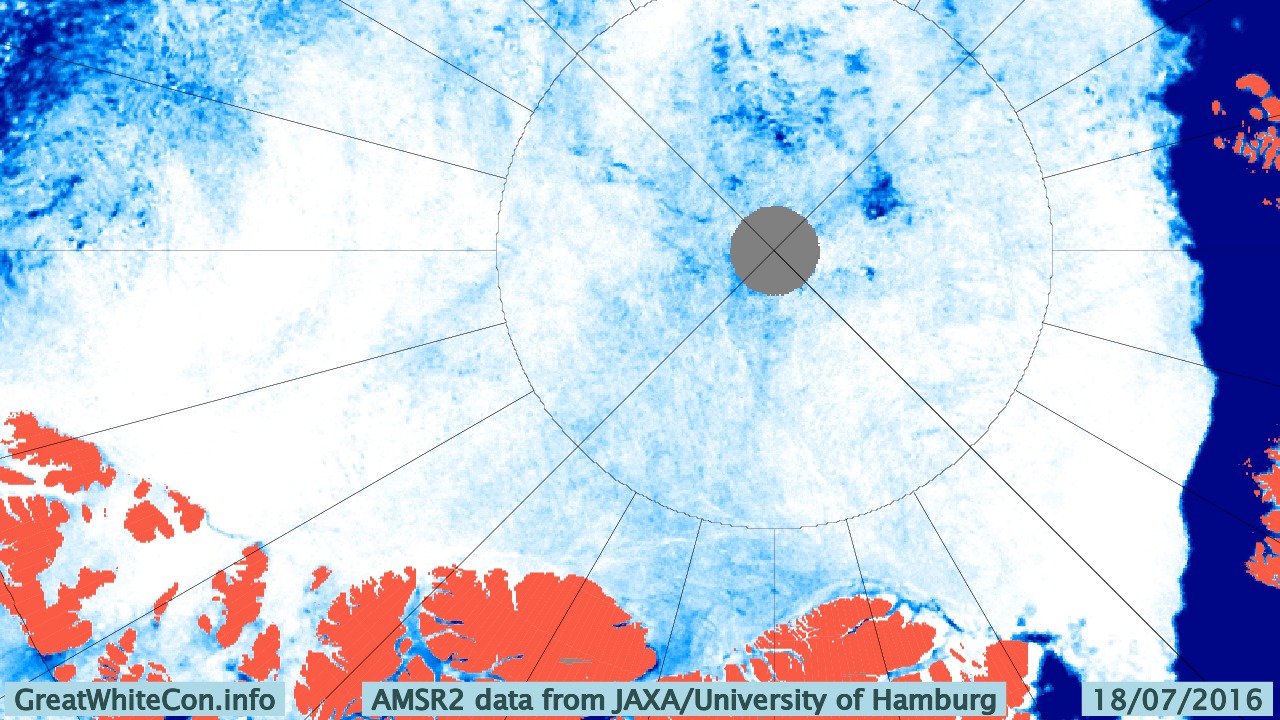
As the remnants of the storm head off across the Canadian Arctic Archipelago here is what it has left in its wake in the Central Arctic Basin:
NASA Worldview “false-color” image of the Central Arctic Basin on July 19th 2016, derived from the MODIS sensor on the Aqua satelliteUniversity of Hamburg AMSR2 concentration visualisation of the Central Arctic on July 19th 2016
[Edit July 21st 2016]
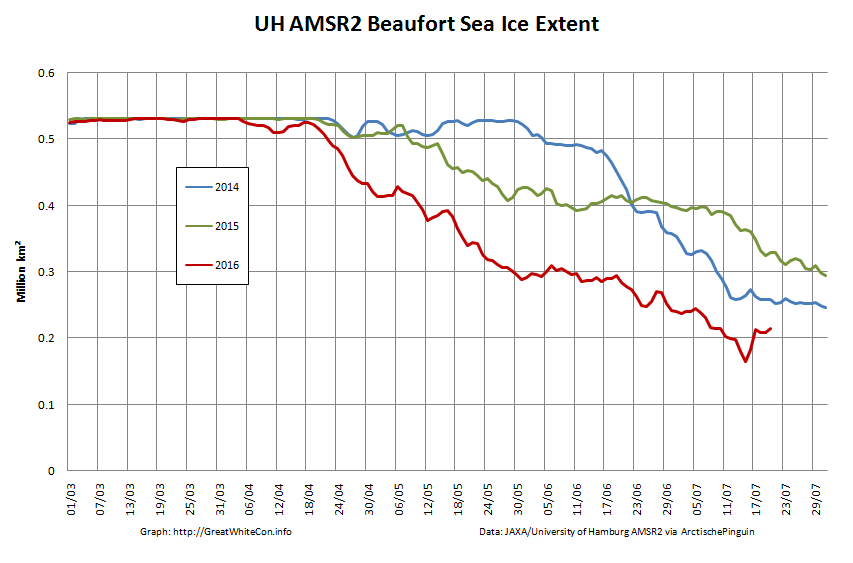
The storm has dispersed the remaining ice in the Beaufort Sea over the last few days:
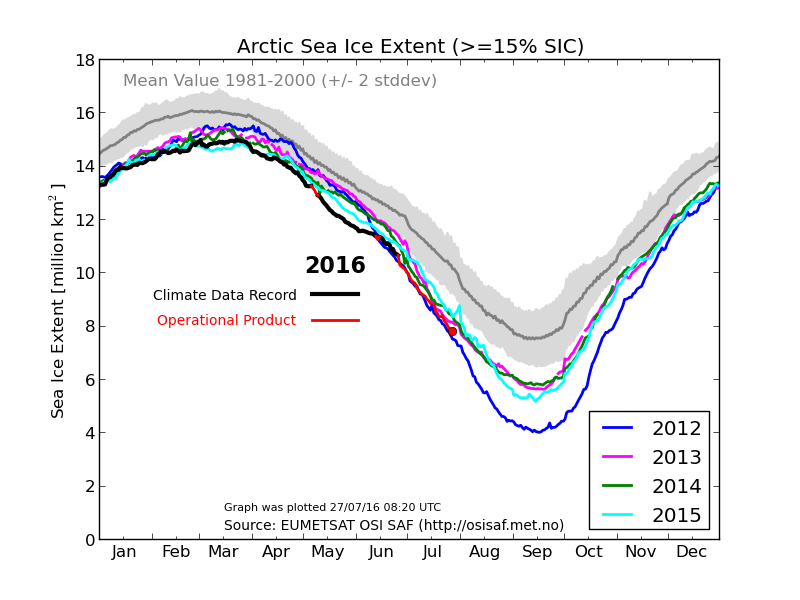
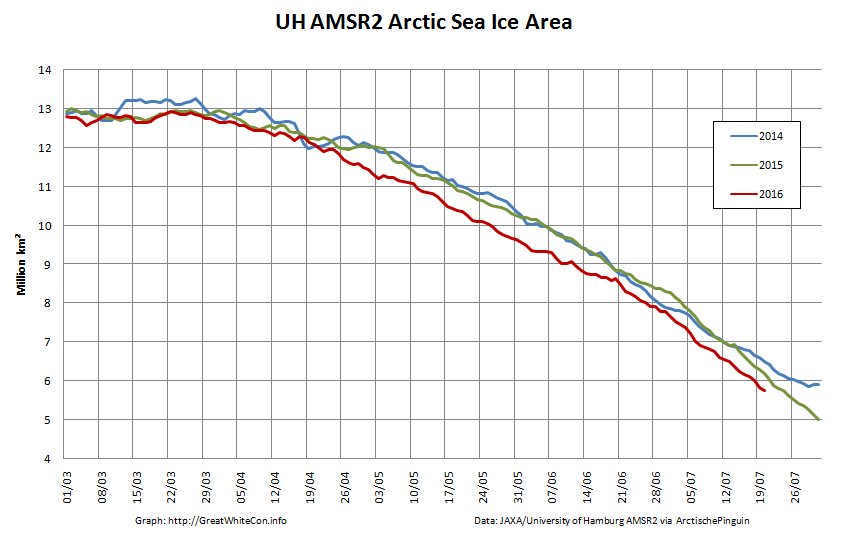
However across the Arctic as a whole sea ice area continues its downward trend:
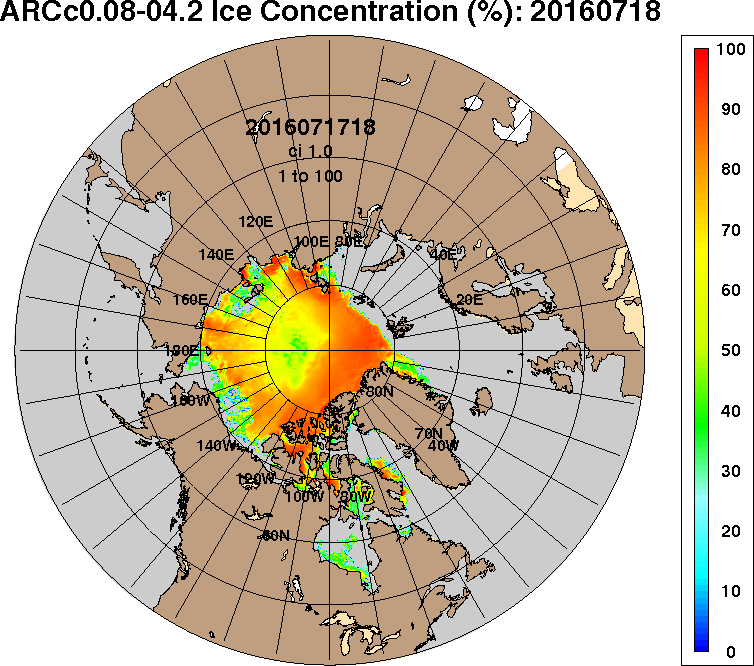
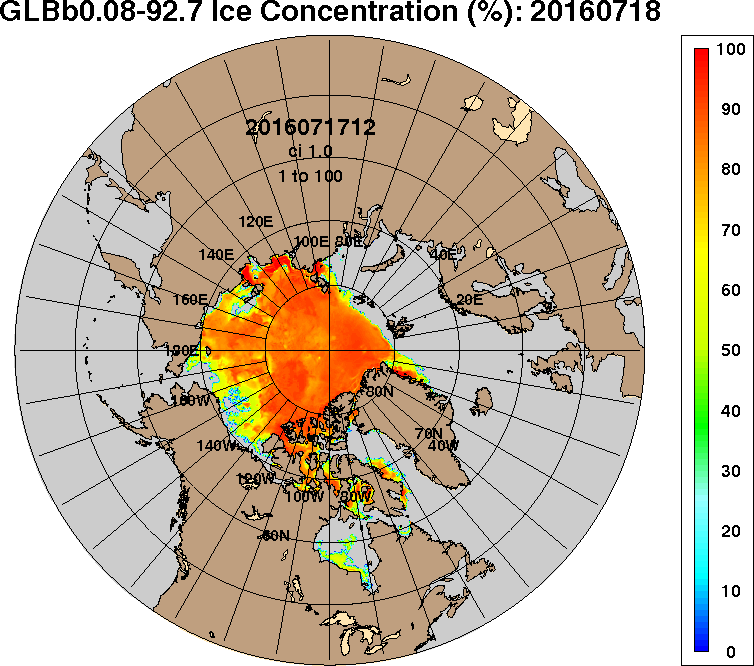
In the spirit of providing some spurious “balance” to the contentious Arctic sea ice “debate” our quote for today comes fairly fresh from the Arctic Sea Ice Forum:
idk how people are confusing the gaping fissures that span from Siberia to Canada with melt ponds but it seems like half the people here have blinders on to what is ongoing.
I know HYCOM gets a lot of flak but instead of projecting out, let’s look at the last five days.
[Superfluous image redacted]
The ice has clearly broken completely in two now, and the recent ~970mb low did a major whomping to the ice in the “cleavage” between what’s stuck against Siberia and the main CAB.
Intriguingly this was in response to an informed comment on June 23rd to the effect that:
As we have seen recently, these large area drops in the middle of the pack do not mean the ice is gone, just that its top is wet/ponded. In a couple of days some of these drops might be reversed. Of course the ice has suffered in the meantime, but still it’s risky to simply extrapolate these numbers.
Even more intriguingly our headline for today is remarkably like the inverse of a phrase in a Mail on Sunday article that led us to create this site in the first place!
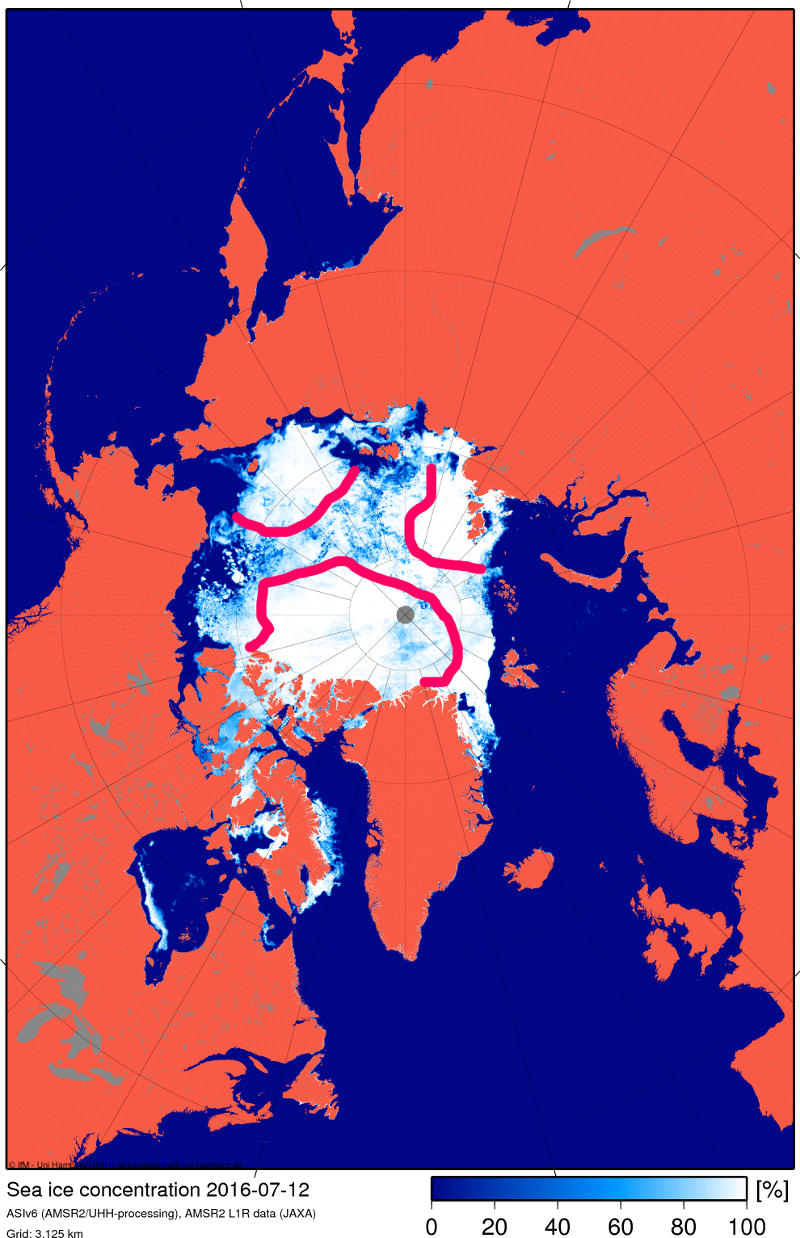
Nearly three weeks have passed since those “gaping fissures that span from Siberia to Canada” were announced, and you may well (like me) be wondering how they have been coming along? In partial answer to that question here is our very latest video based on the University of Hamburg’s AMSR2 concentration visualisations:
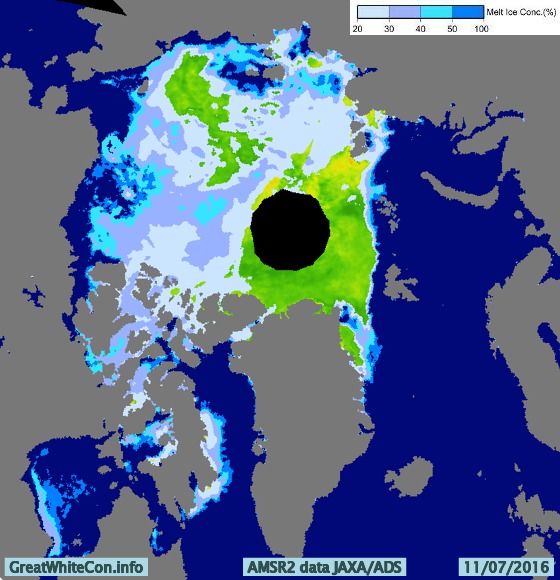
In my own humble opinion this doesn’t really count as a “gaping fissure” but MODIS imagery does now show a fair bit of open water between Siberia and the North Pole:
A “gaping fissure” between the Pole and Canada (and/or Greenland) is however conspicuous only by its absence:
NASA Worldview “false-color” image of the Central Arctic Basin on July 11th 2016, derived from the MODIS sensor on the Aqua satellite
I do think that I can spot some melt ponds in the area at the moment though. How about you?
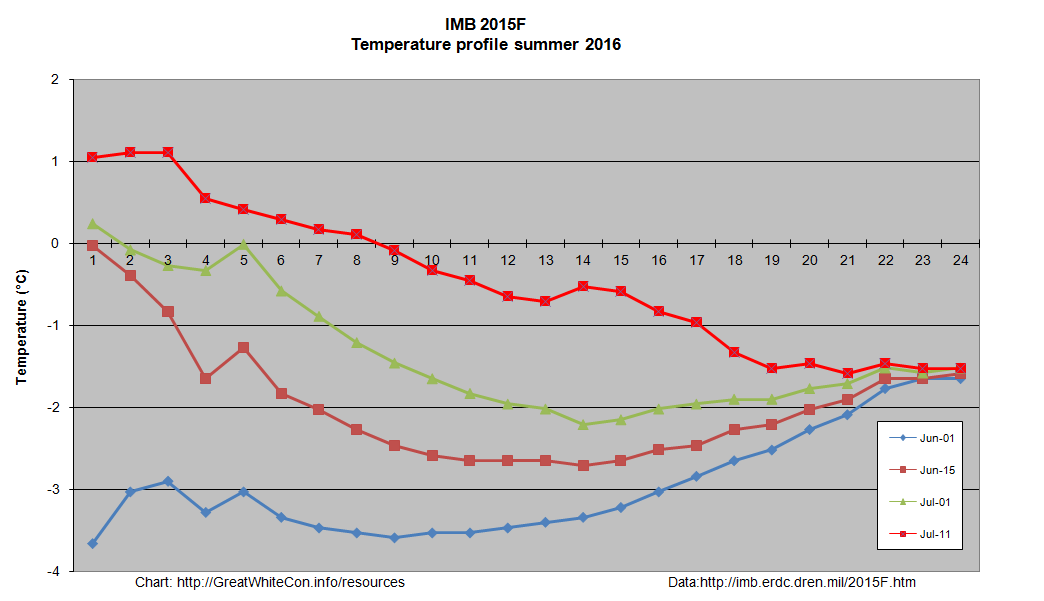
The one CRREL/ERDC ice mass balance buoy still reporting reveals that both surface and bottom melting have started at around 83 degrees north:
The 2016 multi-year ice melting season has evidently now begun, and the floe upon which buoy 2015F is sitting still has ~1.9 metres of melting to go. It’s not beyond the bounds of possibilty that a “gaping fissure” from the Atlantic to the Pacific will ultimately emerge this year. However based on the evidence thus far I’ll be extremely surprised if there is one “from Siberia to Canada”, unless of course you count the Chukchi & Beaufort Seas. That route is already open to intrepid Arctic seafarers, as can be seen at the bottom of the animation above and on the current JAXA/ADS Arctic sea ice surface melt map:
I have taken lots of flack I will stand by my prediction that we are heading for sub-1M KM2 come September (or early October).
Structurally [the ice] has actually now broken into three pieces, one is attached to the islands N of Siberia/NE of Svalbard, one is near Wrangel/ESS, and the “bulk” is pushed against the CAA/Greenland.
The lower concentrations in CAB are clearly open water and not melt ponds.
I felt compelled to explain to (presumably) him that:
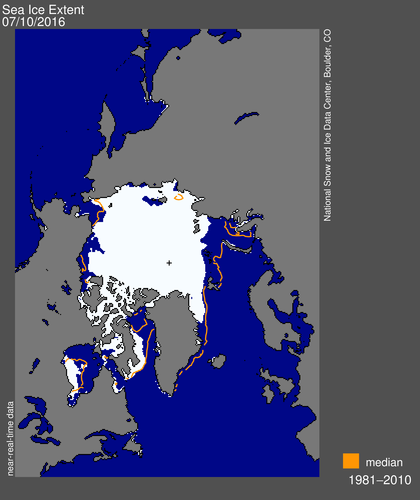
Here’s the NSIDC’s view of those “gaping fissures” of yours:
Despite some faults I think both ARC and GLB are onto the truth. Satellite grabs over the past few days show failure on all three fronts (ATL, PAC, and the Russian side especially), but the Russian side doesn’t present as a solid front (nor does the Beaufort melt), and the leads keep getting absorbed into the slush of the main pack (which is why the ‘slush’ keeps expanding, and why most of the CAB has now evolved into this state). The only solid regions of ice are those bordering the steaming ATL waters as well as some remnants north of the CAA (no coincidence the latter was chosen as ‘evidence’).
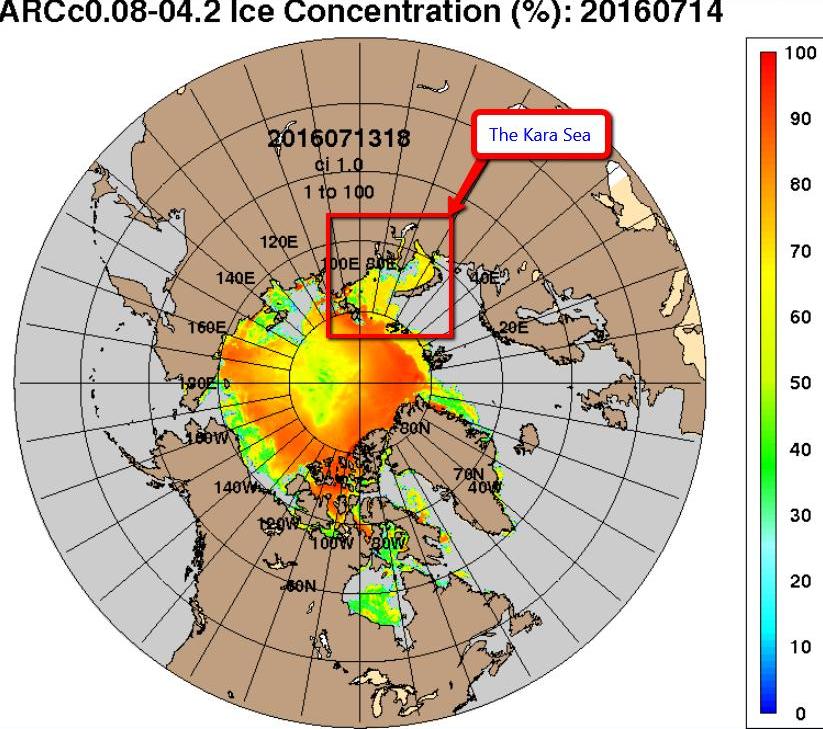
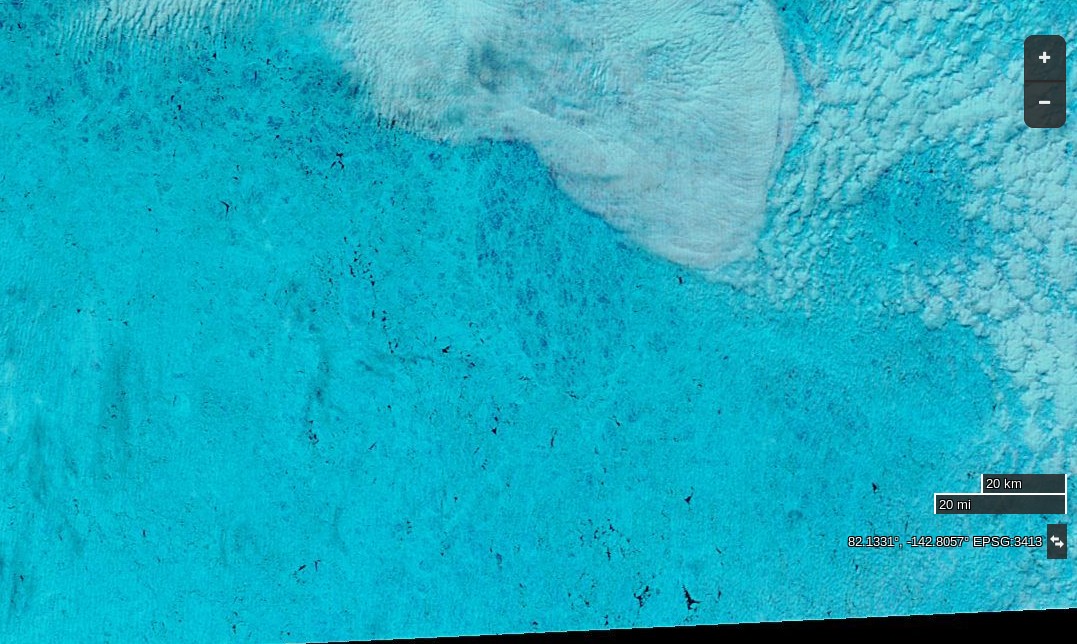
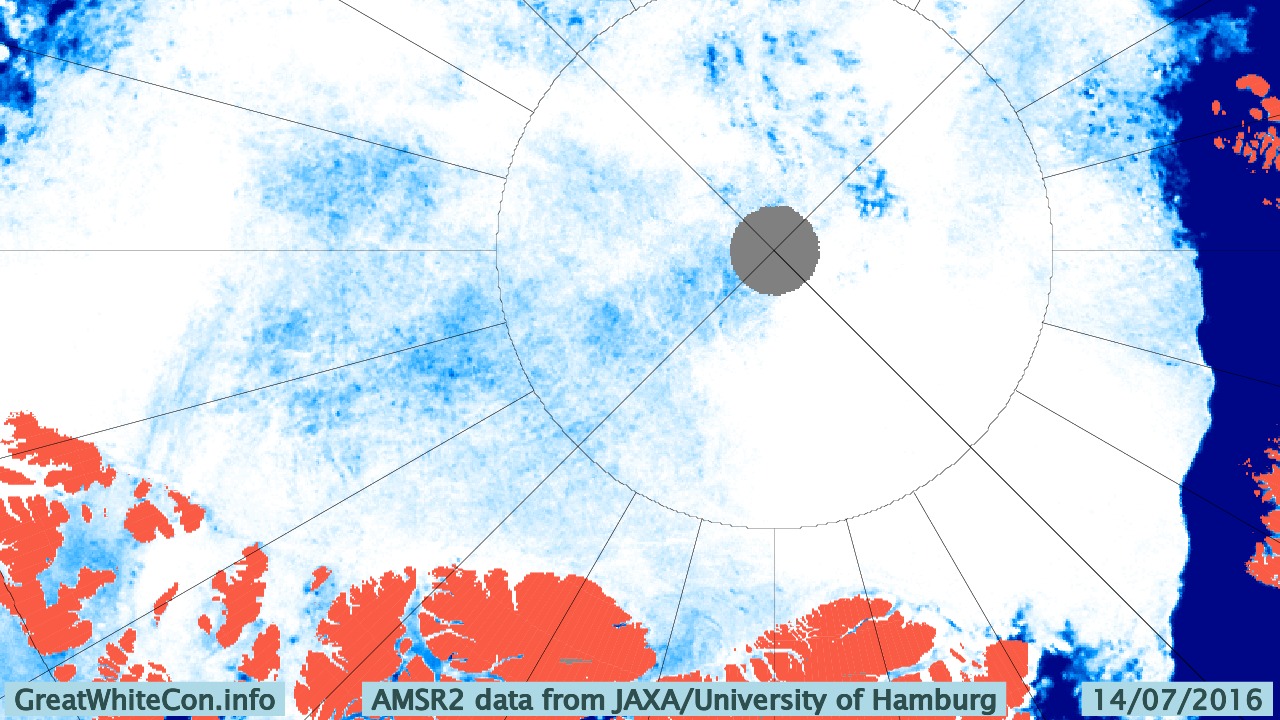
Yesterday the Kara Sea didn’t suddenly become covered in sea ice, and today the area of the Central Arctic Basin around 82 N, 135 W looks like this to the MODIS instrument on board the Terra Satellite:
NASA Worldview “false-color” image of the Central Arctic Basin on July 15th 2016, derived from the MODIS sensor on the Terra satellite
and like this to the University of Hamburg’s ARTIST sea ice concentration algorithm:
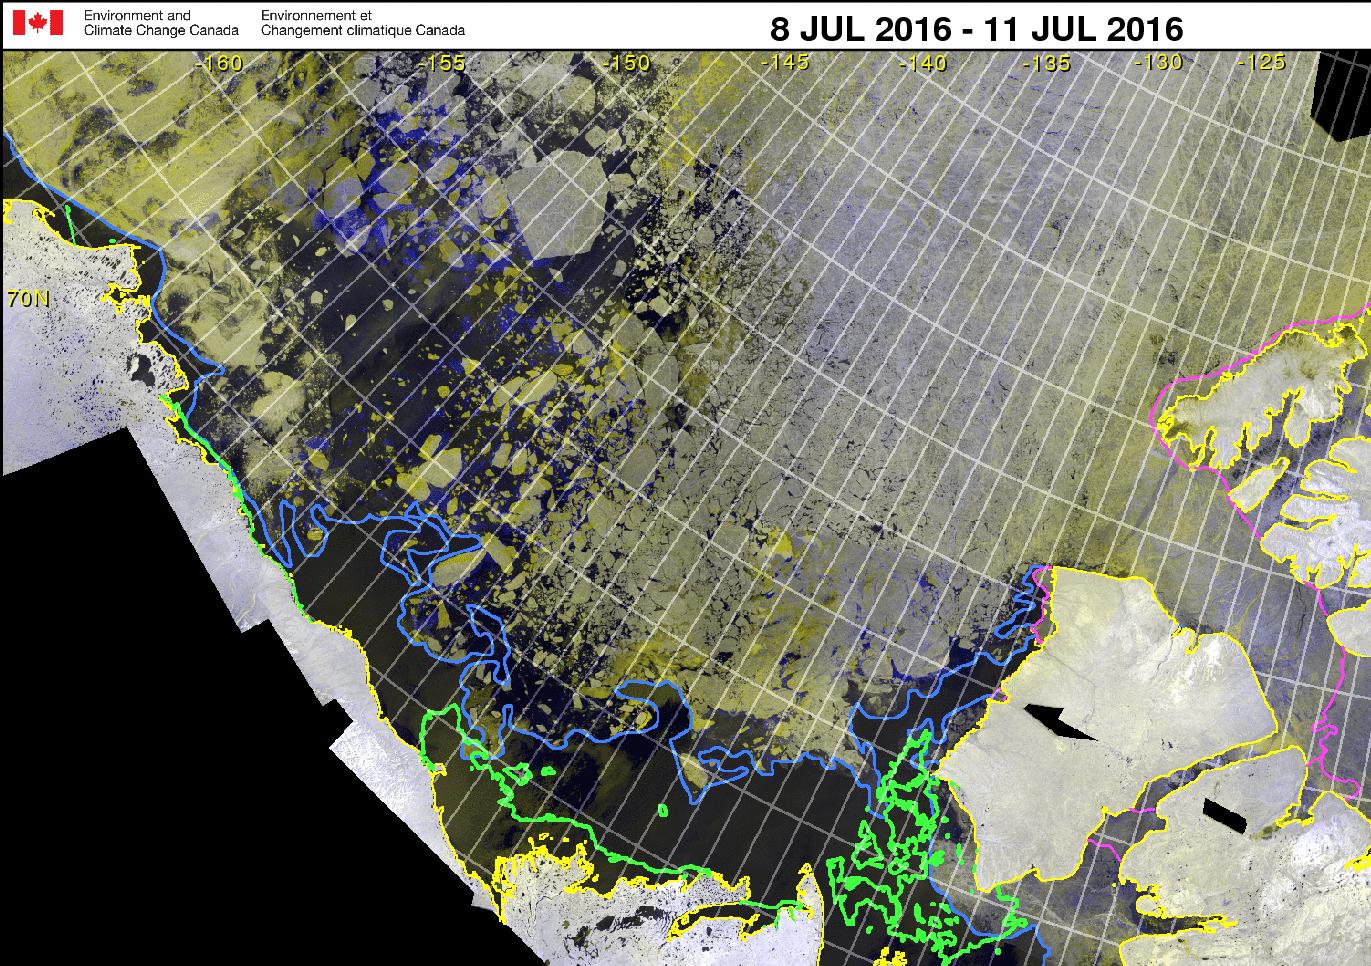
whilst here’s the latest Canadian Ice Service RadarSat mosaic for the Western Arctic:
Canadian Ice Service Western Arctic RadarSat mosaic for 8-11 July 2016
Current Buoy Data (07/15/2016):
Pos: 82.89 N, 137.34 W
Air Temp: -0.76 C
Air Pres: 1011.16 mb
Ice thickness : 185 cm
[Edit July 16th 2016]
The Arctic Sea Ice Forum management have banished “Flack Jacket” to the sin bin for a month.
I’m fed up with the personal insults because a model that has a history of errors is showing something spectacular that no other data source does. Come back in a month if you still feel like it.
Meanwhile in answer to my enquiry on the HYCOM support forum Alan Wallcraft tells me:
We now use the National Ice Center’s IMS sea ice extent product in our assimiltion, see http://www.natice.noaa.gov/ims/. This is manually produced every day, and generally avoids the artifacts and deficiencies of satellite sea ice concentrations. However yesterdays IMS fields were not good, and that is where the spurious sea ice came from. Today’s IMS field is good, and we may rerun the 2016/07/13-18Z nowcast/forecast to clear this up.
After a brief “pause” ACNFS is back in action, and here is its latest Arctic sea ice concentration “nowcast”:
Yesterday the skies were clear once again over the corner of the Arctic where buoy 2015F is located:
NASA Worldview “false-color” image of the Central Arctic Basin on July 15th 2016, derived from the MODIS sensor on the Aqua satellite
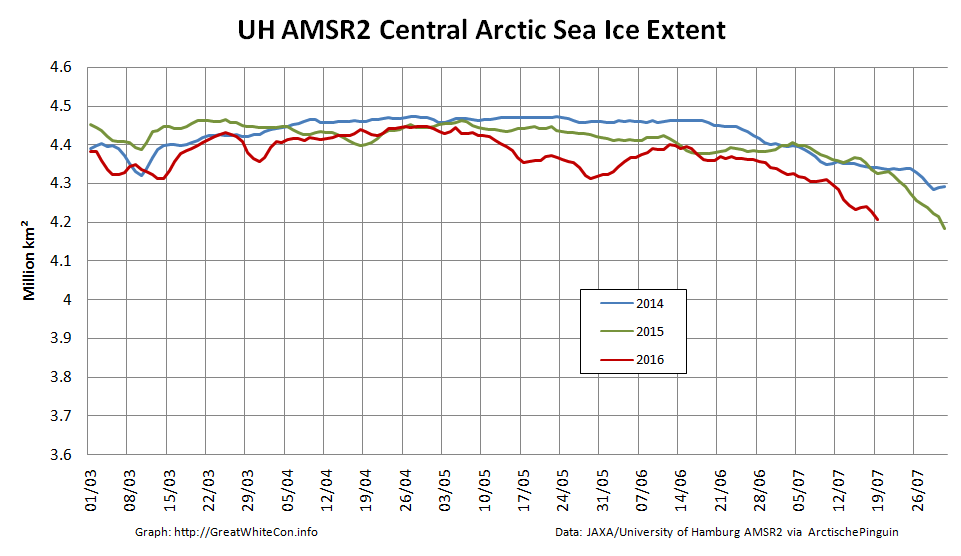
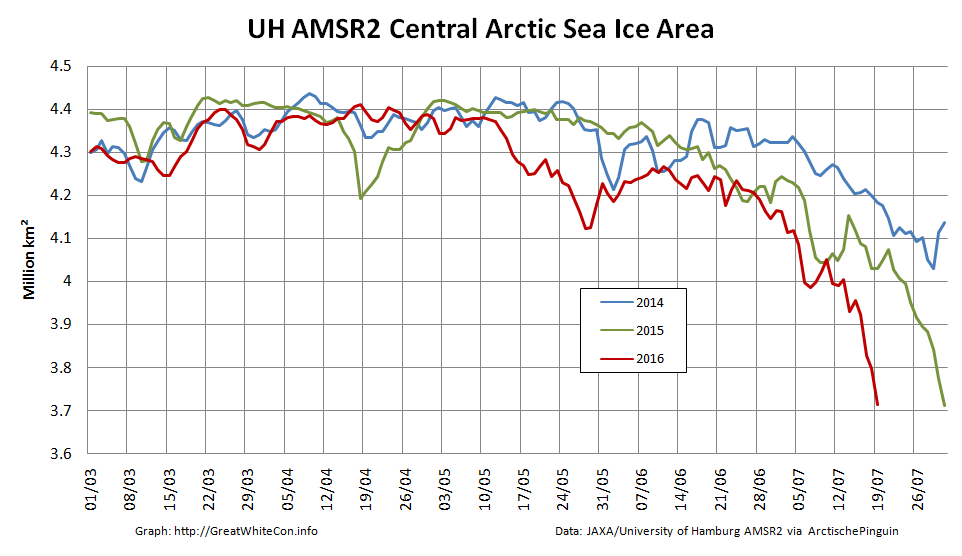
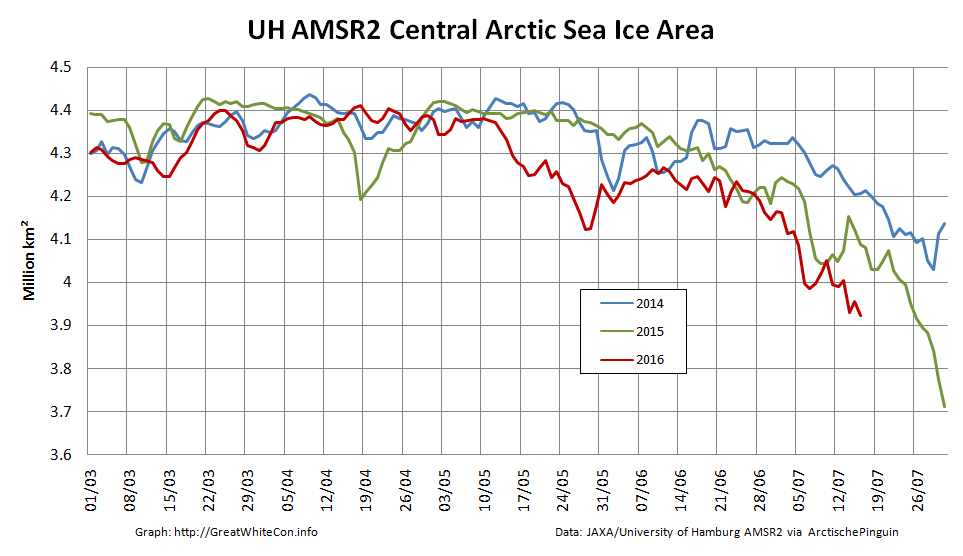
Here’s how the sea ice area in the Central Arctic Basin has been faring recently:
[Edit July 19th 2016]
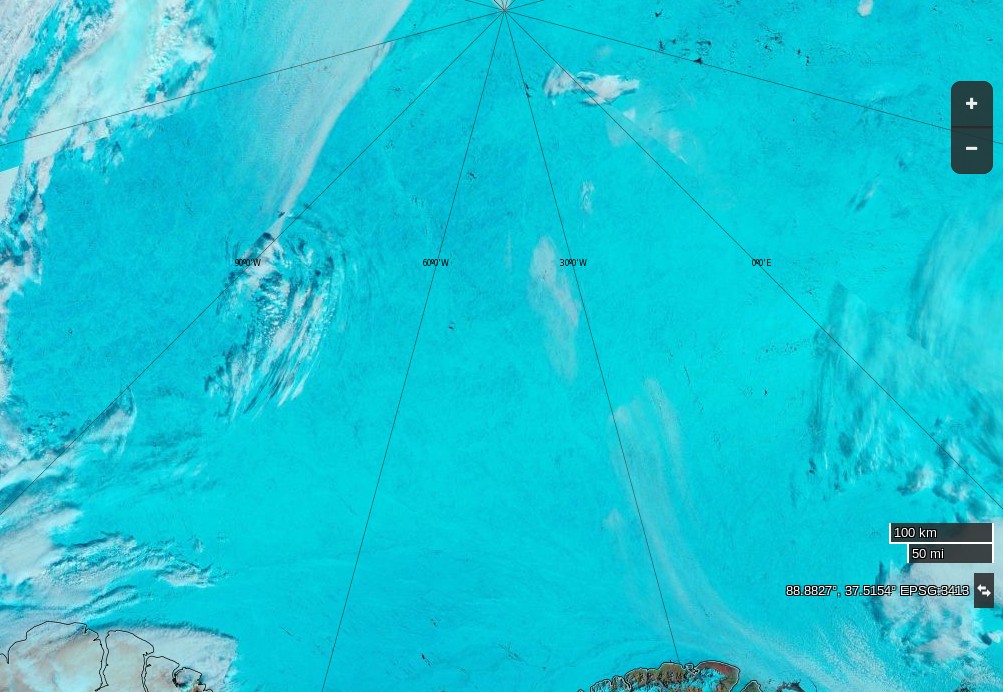
Here’s an early image of the North Pole from the Aqua satellite this morning, recorded for posterity in case it changes later:
NASA Worldview “true-color” image of the North Pole at 09:00 UTC on July 19th 2016, derived from the MODIS sensor on the Aqua satellite
and as the recent Arctic storm heads towards the Canadian Arctic Archipelago here’s the latest Hamburg AMSR2 concentration map:
I attach the ACNFS plot you referenced and the corresponding plot from our next global real-time system (GOFS 3.1), which will likely replace our current global analysis (and ACNFS) once NAVGEM 1.4 is operational (it is running here with NAVGEM 1.3, like ACNFS). They assimilate the same observations, but ACNFS only does so near the ice edge while GOFS 3.1 assimilates sea ice concentration everywhere (but with higher error bounds in the ice interior). The reason for ACNFS only assimilating near the edge is in part due to that being the most important area for navigation but also because SSMI satelite ice concentrations tend to “over saturate” in the summer. We switched GOFS 3.1 to “believe” the observations because they are generally better in recent years.
The two are quite different in the interior of the sea ice and GOFS 3.1 is certainly better there. We did not see the low concentrations near the North Pole in ACNFS this time last year, so something has happened to make the free running model produce low concentrations this summer. We are looking into it.
According to the US National Snow and Ice Data Center, the Beaufort Gyre is:
A clockwise circulation (looking from above the North Pole) in the Beaufort Sea, north of Alaska. This circulation results from an average high-pressure system that spawns winds over the region.
Such a high pressure system has been in place over the Arctic Ocean for a few days now, and the effect of the clockwise circulation on the sea ice in the Beaufort Sea is already evident in these recent satellite images:
NASA Worldview “true-color” image of the Beaufort Sea on April 9th 2016, derived from the MODIS sensor on the Terra satelliteNASA Worldview “false-color” image of the Beaufort Sea on April 12th 2016, derived from the MODIS sensor on the Terra satellite
as well as in this animation of sea ice movement since February:
The high pressure is forecast to continue for several more days. Here’s the GFS forecast for April 20th, courtesy of MeteoCiel:
Northern Hemisphere surface pressure forecast for April 20th 2016
which shows a large system with a central pressure of 1040 hPa still sitting over the Northern Beaufort Sea. Next here’s an animation from the US Navy which forecasts ice thickness until April 19th:
April 13th 2016 ACNFS Beaufort Sea thickness forecast until April 19th
Note in particular the large area of open water forecast to be produced in the Chukchi sea off Barrow, Alaska by the end of the period. The continuing clockwise winds have already started reducing the area of sea ice in the Beaufort Sea at an unusually early date:
Amongst other things we’ll be keeping a close eye on the ice area in the Chukchi Sea over the next few days. The sun is already starting to bathe that area of our planet with its rays, and open ocean soaks up that heat much more readily than bright white ice.
[Edit – 16/04/2016]
Here’s an animation of the effect on sea ice of the Beaufort Gyre in overdrive from Neven at the Arctic Sea Ice Blog:
Notice how towards the end of the animation another huge part of the ice pack, north of the Canadian Arctic Archipelago is pulled into the Gyre. This is mostly multi-year ice.
Skeptical sorts across the cryoblogosphere are in meltdown mode at the moment. They seem to be unaware that satellites don’t last forever in the harsh environment of space, and the individual scientific instruments carried by a satellite don’t either. Some failures are more spectacular than others however. By way of illustration here’s one recent report from Space.com:
The February [2015] explosion of an American military satellite may cause some problems for orbiting spacecraft after all, a new study reports.
The U.S. Air Force’s 20-year-old Defense Meteorological Satellite Program Flight 13 (DMSP-F13) craft blew apart on Feb. 3 after experiencing a power-system faillure. Analyses by the European Space Agency and other organizations found that the cloud of space junk generated by the explosion shouldn’t pose much of a threat to their missions, but the new research suggests that not all spacecraft are in the clear.
Another DMSP satellite started pushing up the metaphorical daisies earlier this year. Last month Space Flight Now reported that:
The U.S. Air Force has been unable to send commands to the service’s newest weather satellite for nearly a month, and engineers are trying to determine if the spacecraft can be salvaged, officials said last week.
The polar-orbiting Defense Meteorological Satellite Program Flight 19, or DMSP F19, spacecraft stopped responding to orders from the ground Feb. 11, the Air Force said in a March 3 press release.
“At this time, it is not known what caused the anomaly or if the satellite will be recovered, and the anomaly is under investigation,” the Air Force said. “There are no other known issues with the satellite.”
Designed for a five-year service life, DMSP F19 launched April 3, 2014, from California atop a United Launch Alliance Atlas 5 rocket. It is the newest in the Air Force’s series of DMSP weather observatories designed to help forecasters predict storms, clouds, fog and dust storms that could inhibit global military operations.
The data provided by the Special Sensor Microwave Imager/Sounder (SSMIS) instrument carried aboard several of the DMSP series of satellites is used by the National Snow and Ice Data Center to calculate their Sea Ice Index metric of Arctic sea ice extent. However suddenly Boulder has a problem. As we reported earlier this week the SSMIS sensor carried by DMSP F17 appears to be malfunctioning. This can be seen in this visualisation of the data from the European Ocean and Sea Ice Satellite Application Facility(OSI-SAF):
Look closely at the top centre of the image to see a large patch of spurious “sea ice”. Here’s the resulting SII extent graph from the NSIDC:
Anthony Watts reported this news in typically fanciful fashion:
There is this small notice on the NSIDC page:
“The daily sea ice extent images are currently displaying erroneous data. NSIDC is investigating.”
It looks to be a problem with the DMSP F17 satellite.
Makes you wonder how long this has been going on and if the anomalously low readings we’ve seen for awhile are due to a slow sensor degradation.
Time will tell.
For a more realistic interpretation of the facts we suggest that instead of reading the propaganda perpetrated at WUWT you instead examine this graph derived using data from the AMSR2 sensor on board the Japanese SHIZUKU satellite:
Mr. Watts evidently takes a very US centric view of these matters, since he neglected to report this timely news bulletin from the OSI-SAF:
Due to the previously reported problems with one of the channels on SSMIS onboard DMSP F17, OSI SAF is now working on replacing DMSP F17 with DMSP F18 in our sea ice products.
Currently, the switch to F18 has been implemented for the ice concentration product (OSI-401). The product dated 20160410 has been reprocessed and is available on our FTP server, ftp://osisaf.met.no/prod/ice/conc/ and ftp://osisaf.met.no/archive/ice/conc/2016/04
The ice edge and type products (OSI-402 and OSI-403) will be updated to use F18 tomorrow, 2016-04-12.
It seems Willis Eschenbach, the current Watts Up With That resident sea ice expert, is already beavering away endeavouring to prove Anthony’s case for him:
We have no way to know if this has been a gradual decrease followed by a failure, so yes, it’s certainly possible that the previous data is bad. Doesn’t mean it is, but we’d be fools not to check.
We suggested a simple check:
Why not compare the NSIDC’s SSMIS data from F-17 with JAXA’s AMSR2 data from Shizuku? Wouldn’t that do the trick?
Willis replied:
I meant that just from the bad reading alone, we don’t know if the previous data is bad. Yes, we can check it in the way you suggest and other ways … which is why I said we’d be fools not to check.
We think that if he does his due diligence he will find that he is in actual fact engaged on a fool’s errand, but time will indeed tell. Let’s wait and see what Willis n Willard can come up with, shall we? Meanwhile we also cannot help but wonder what the dynamic duo might make of our own due diligence replicating the results of another collaboration of theirs:
We’ve now entered the month of September, the month in which Arctic sea ice extent and area reach their annual minimum levels, historically at least. To set the scene, here’s the extent graph from the Japan Aerospace Exploration Agency (JAXA) for September 1st, based on data from the AMSR2 sensor on board their SHIZUKU satellite.:
As you can see, the 2015 curve has just dropped below 2007 and is now at the second lowest level for the date in JAXA’s records. As the month progresses we’ll be taking a look at a variety of other metrics as they start to report their numbers for September.
To set the scene, here’s the University of Hamburg’s map of Arctic sea ice concentration for September 1st, again based on AMSR2 data:
Here’s a video showing how that map has changed over the last two months:
Notice in particular the effect of the recent Arctic cyclone on the sea ice in the lower left quadrant. Note also our comment that:
[There is] a large potential fetch across the East Siberian, Chukchi and Beaufort Seas should any further cyclones occur in the area over the next few weeks. The conditions now exist for an even more damaging swell to be generated before the 2015 minimum Arctic sea ice extent is reached.
By now you may be wondering if we have a prediction to make? Well, we predict it still all depends on the weather! However here’s how the “probabilistic” 50 day ahead prediction from Andrew Slater of the NSIDC looks at the moment:
If I were a betting man I’d say that the red line will ultimately put in a lower low than the dark blue one.
Finally, for the moment at least, take a look at the GFS surface level pressure forecast for later today, courtesy of MeteoCiel:
Can you see the 1000 hPa central pressure low spinning over the Laptev Sea? It’s currently not very deep, and it’s not over the East Siberian Sea either, but watch that space along with us as we wait to discover where and when the assorted Arctic sea ice metrics reach their minima for 2015.
[Edit – September 3rd 2015]
The latest edition of the US National Snow and Ice Data Center’s Arctic Sea Ice News has just been published. In the section on the imminent minimum they show this graph:
and say that:
Starting with the ice extent observed on August 31 and then applying 2006 loss rates, the slowest rate in recent years, results in the highest extrapolated minimum for 2015 of 4.50 million square kilometers (1.74 million square miles), and a September monthly average extent of 4.59 million square kilometers (1.77 million square miles). The lowest daily minimum comes from using the 2010 pace, yielding an estimated 4.12 million square kilometers (1.67 million square miles) for the daily minimum, and a September monthly average extent of 4.33 million square kilometers (1.67 million square miles).
Using an average rate of ice loss from the most recent ten years gives a one-day minimum extent of 4.38 ± 0.11 million square kilometers (1.79 million square miles), and a September monthly average of 4.49 ± 0.09. As of August 31, the 5-day running daily average extent is 4.72 million square kilometers. If no further retreat occurred, 2015 would already be the sixth lowest daily ice extent in the satellite record.
The forecast places the upcoming daily sea ice minimum between third and fourth lowest, with fourth more likely. There is still a possibility that 2015 extent will be lower than 4.3 million square kilometers, the third lowest sea ice extent, surpassing the 2011 sea ice extent minimum, and a small chance of surpassing 2007, resulting in the second-lowest daily minimum. This assumes that we continue to have sea ice loss rates at least as fast as those of 2010. This was indeed the case for the final ten days of August 2015.
Somewhere between 2nd and 6th then! We felt compelled to enquire on Twitter:
You can of course argue that this is mere cherry picking on our part, not to mention the slight economy with the truth in our necessarily punchy headline today. Nonetheless it is an actual fact that the IARC-JAXA Information System AMSR2 Arctic sea ice extent metric for February 17th 2015 reads 13,770,330 km² which is the lowest ever for the day of the year in a record going back to 2003. This follows a remarkably large fall (for the time of year) of 113,505 km² from yesterday’s reading of 13,883,835 km². Here’s our evidence:
If you prefer to look at numbers instead of pictures then by all means try here instead for proof of the latest shock news from the Arctic.
If instead you prefer moving pictures, here’s an animation based on high resolution AMSR2 data from the University of Hamburg that may provide a few clues about how all this came about:
Can you see how the recent storms in the North Atlantic have “pulled” and then “pushed” the sea ice to thisese new record lows?
Please also note this warning message on the IJIS “Arctic Sea Ice Monitor” web page:
Thank you for visiting our website.
This site will be closed on February 22, and might be unstable from February 15, 2015.
New sea ice monitor website will be coming soon. Stay tuned.
Meanwhile, almost equivalent information can be available at:
This website uses cookies to improve your experience. We'll assume you're ok with this, but you can opt-out if you wish. Cookie settingsACCEPT
Privacy & Cookies Policy
Privacy Overview
This website uses cookies to improve your experience while you navigate through the website. Out of these, the cookies that are categorized as necessary are stored on your browser as they are essential for the working of basic functionalities of the website. We also use third-party cookies that help us analyze and understand how you use this website. These cookies will be stored in your browser only with your consent. You also have the option to opt-out of these cookies. But opting out of some of these cookies may affect your browsing experience.
Necessary cookies are absolutely essential for the website to function properly. This category only includes cookies that ensures basic functionalities and security features of the website. These cookies do not store any personal information.
Any cookies that may not be particularly necessary for the website to function and is used specifically to collect user personal data via analytics, ads, other embedded contents are termed as non-necessary cookies. It is mandatory to procure user consent prior to running these cookies on your website.