Tag Archives: AMSR2

Facts About the Arctic in September 2025

At the beginning of last month JAXA/ViSHOP extent was third lowest for the date in the satellite era. With the date of the 2025 minimum extent rapidly approaching that is no longer the case:

Whilst JAXA extent is now 10th lowest, PIOMAS volume remains second lowest for the date:

Here’s the associated thickness map. Note the change of scale from last month

Compare and contrast that map with the AWI’s sea ice concentration map, particularly in the Beaufort Sea area:

Continue reading Facts About the Arctic in September 2025

Facts About the Arctic in July 2025

At the beginning of July JAXA/ViSHOP Arctic sea ice extent is still “lowest for the date” in their record going back to 1979:

The PIOMAS sea ice thickness map for June 30th reveals that the previously thick ice in the Chukchi Sea has been noticeably thinning:

The associated volume graph shows that the 2025 curve has entered the pack of other recent years. and is now 4th lowest for the date:

Continue reading Facts About the Arctic in July 2025

Facts About the Arctic in June 2025

I’ve been away on a “road trip” during the first part of June, so this month’s initial update is a trifle tardy.

After a 100k “break” yesterday JAXA/ViSHOP extent is currently in a tie with 2024 for 4th lowest for the date, and still slightly below 2012.

The PIOMAS sea ice thickness map for May 31st continues to show plenty of thick ice in the Beaufort and Chukchi Seas:

However, the associated volume graph shows the 2025 curve only slightly above the previous low for the date in 2017:

I have recently received a disturbing email from the NSIDC, which reads as follows:

Continue reading Facts About the Arctic in June 2025

Facts About the Arctic in May 2025

JAXA/ViSHOP extent is no longer “lowest for the date”! After “flatlining” for most of April the metric is now in the midst of a close knit group of the other years in the 2020s:

The high pressure area over the Central Arctic persisted through the second half of April, and so did the consequent drift of ice from the Pacific side of the Arctic to the Atlantic periphery:

AWI’s sea ice area for the Greenland Sea is currently “highest for the date” in the AMSR2 record that started in July 2012:

The offshore winds along the Laptev Sea coast have continued, and sea ice area is now “lowest for the date”:

The first signs of a break in the high pressure dominance are appearing. GFS currently forecasts that a low pressure area will enter the Central Arctic, bring above zero temperatures over the Kara Sea on Sunday:

Continue reading Facts About the Arctic in May 2025

Facts About the Arctic in January 2025

The New Year began with JAXA/ViSHOP extent lowest for the date in the satellite era, just below 2018 . Since then extent has reduced, and there is now a large gap:

The primary reason for this is the remaining open water in Hudson Bay:

In previous years Hudson Bay has been covered by sea ice by this time of year, but in 2025 a large area remains unfrozen in early January!

Due to the way PIOMAS handles the leap years the last gridded thickness data of 2024 is dated December 30th:

By December 30th Arctic sea ice volume had increased to 13.61 thousand km³, 2nd lowest for the date in the PIOMAS record:

Continue reading Facts About the Arctic in January 2025

Facts About the Arctic in October 2024

The JAXA extent graph is currently not updating, so let’s begin this month with the latest AMSR2 sea ice concentration map from the Alfred Wegener Institute. Click the image to see a ~10 Mb animation of the last four weeks:

Note in particular the restart of export into the East Greenland Sea via the Fram Strait:

and the movement of ice within the Canadian Arctic Archipelago:

The PIOMAS gridded thickness data for September 2024 has been released:

Continue reading Facts About the Arctic in October 2024

Facts About the Arctic in September 2024

At the beginning of September JAXA/ViSHOP extent was 4th lowest for the date in the satellite era:

For much more detail on sea ice extent for the next few weeks please see the dedicated 2024 minimum thread. However, note that as extent has been flatlining sea ice area is still declining:

The latest AMSR2 sea ice concentration map from the Alfred Wegener Institute reveals that the area of thick ice in the Chukchi Sea has still not melted:

The most recent sea ice age map currently available dates from the beginning of August. Comparison with the concentration map shows that most of the remaining first year ice is highly fragmented, even close to the North Pole:

Continue reading Facts About the Arctic in September 2024

Facts About the Arctic in June 2024

The JAXA/ViSHOP web site is currently down, so here is the current OSI SAF extent graph for the end of May:

2012’s “June cliff” is almost upon us, and if 2024’s current trajectory continues extent will cross above 2012 for the first time since February in a week or so.

Here’s the GFS model’s current map of snow depth:

Melt ponds are now visible on the ice in the Laptev Sea:

Continue reading Facts About the Arctic in June 2024

Facts About the Arctic in March 2024

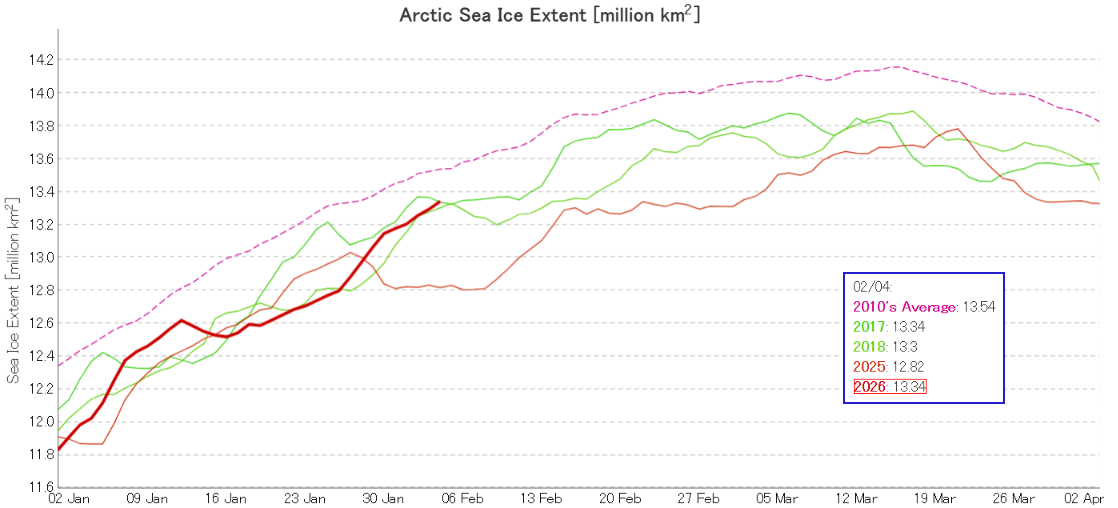
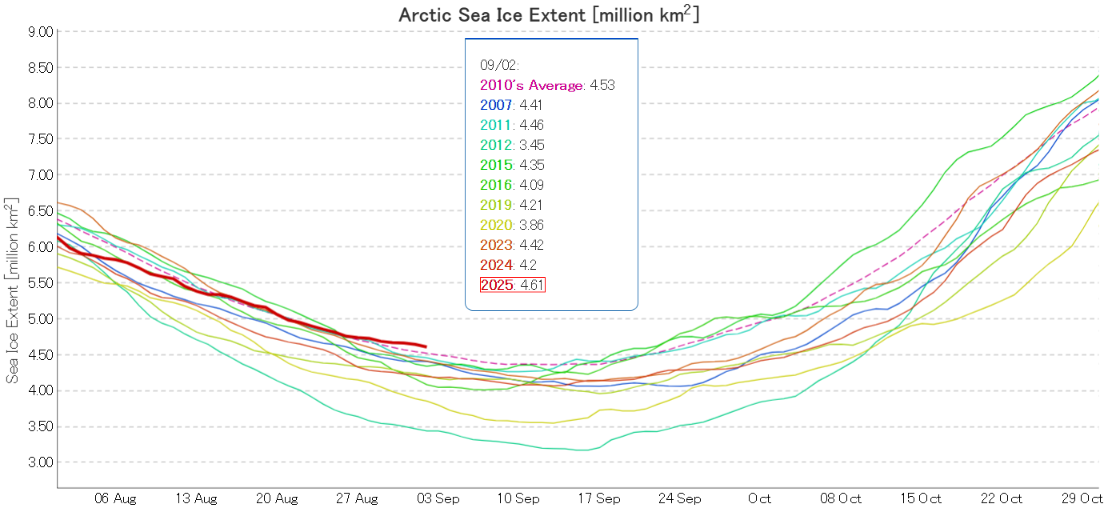
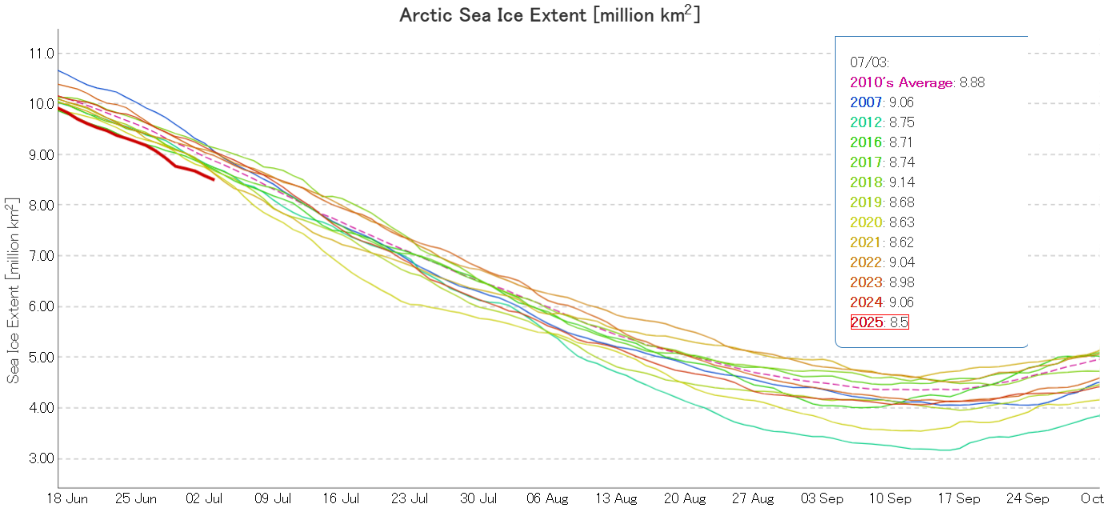
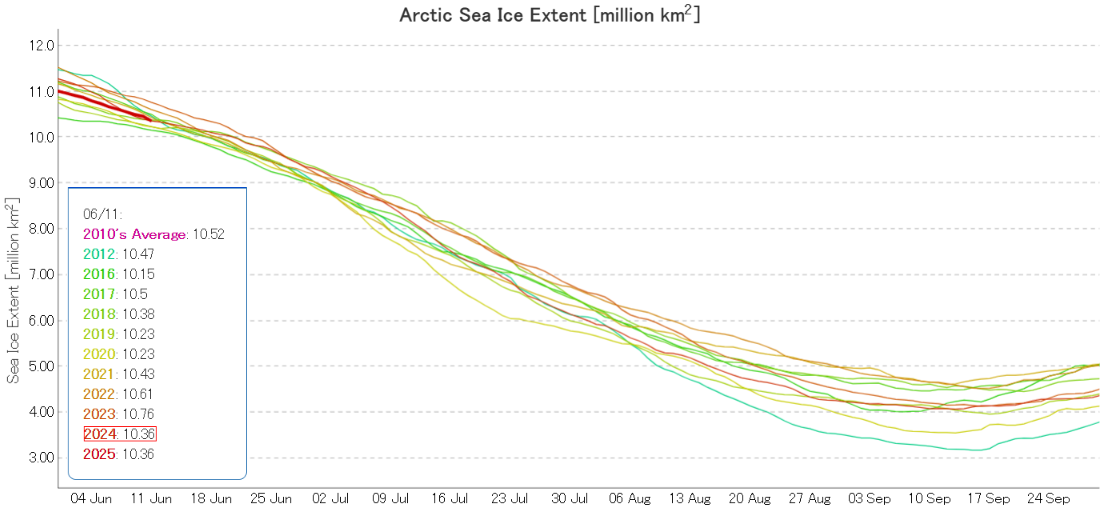
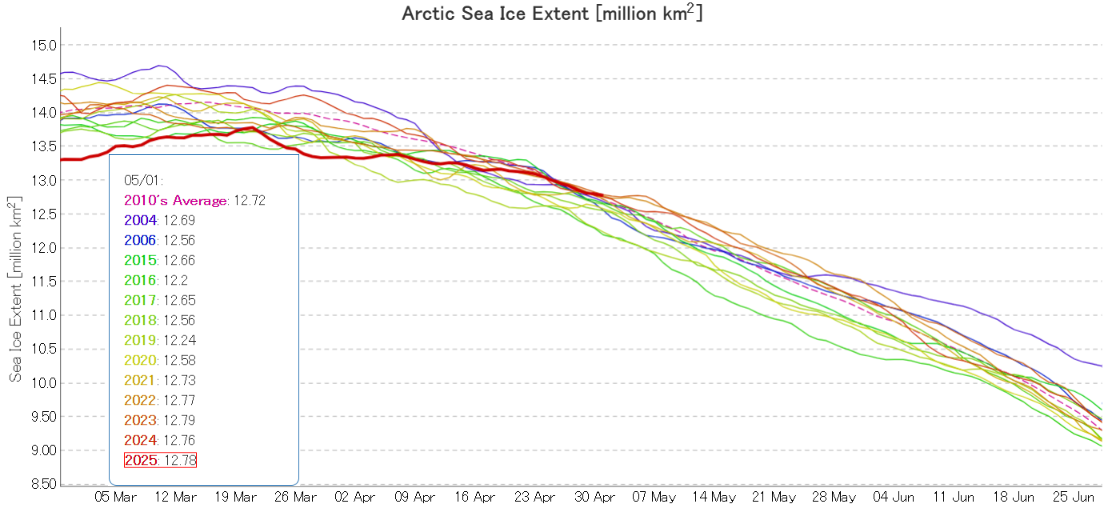
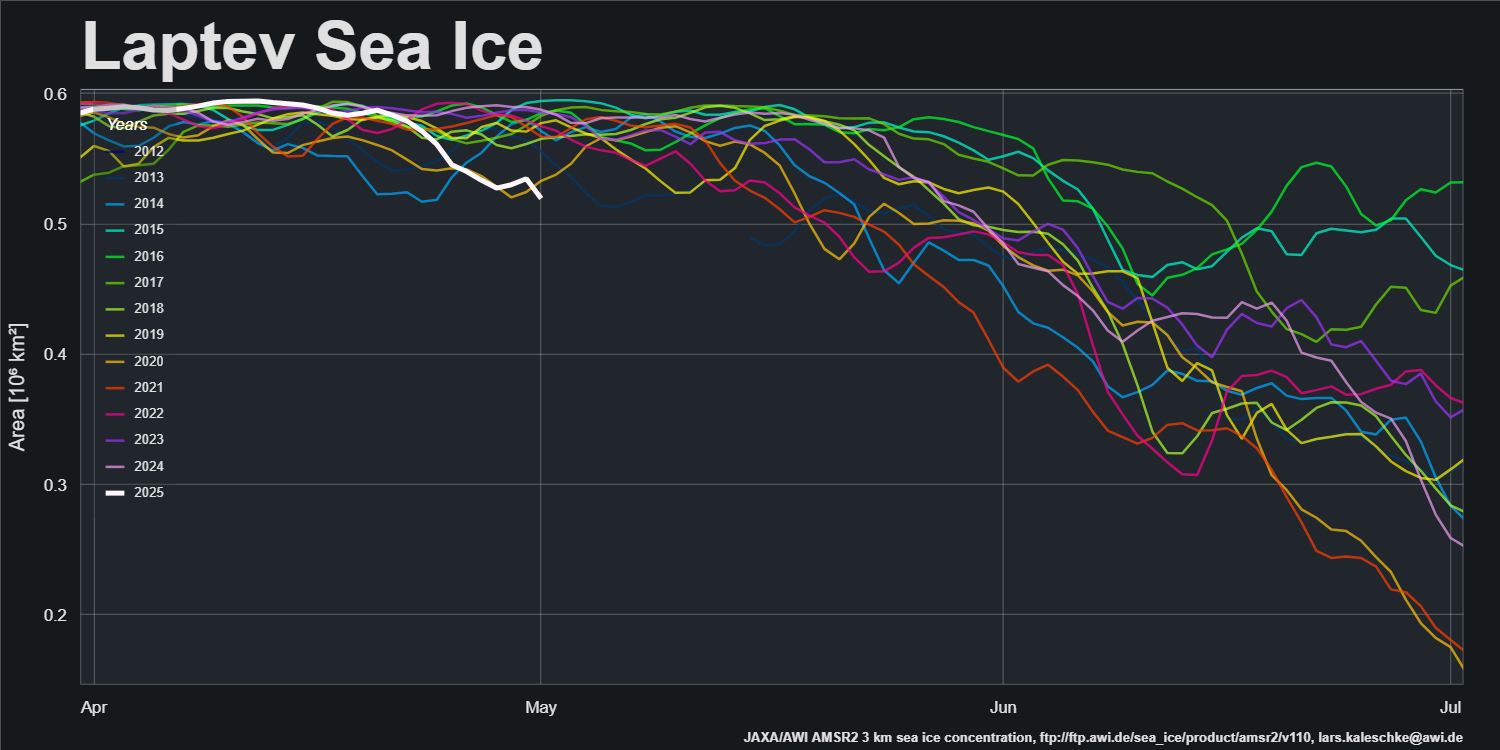
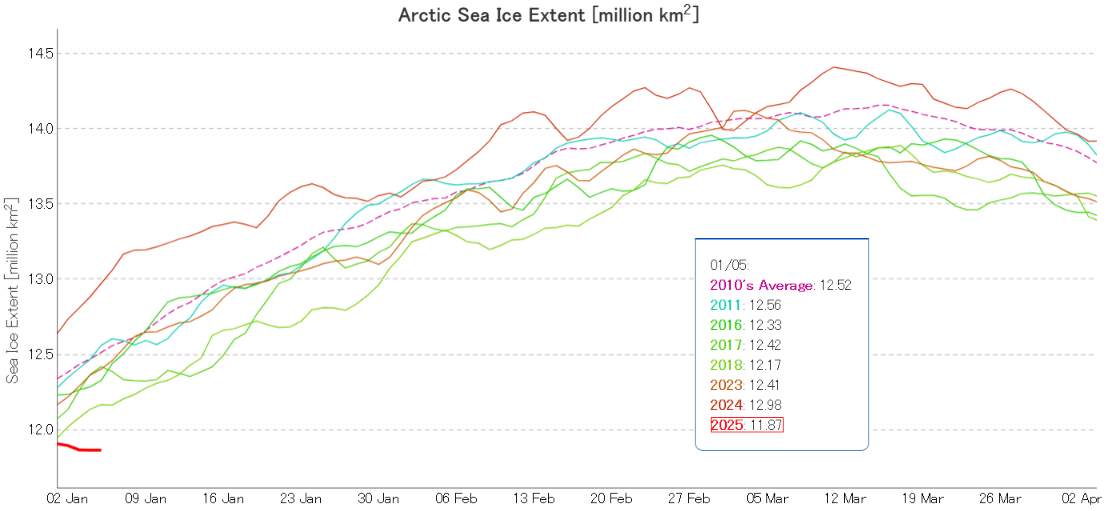
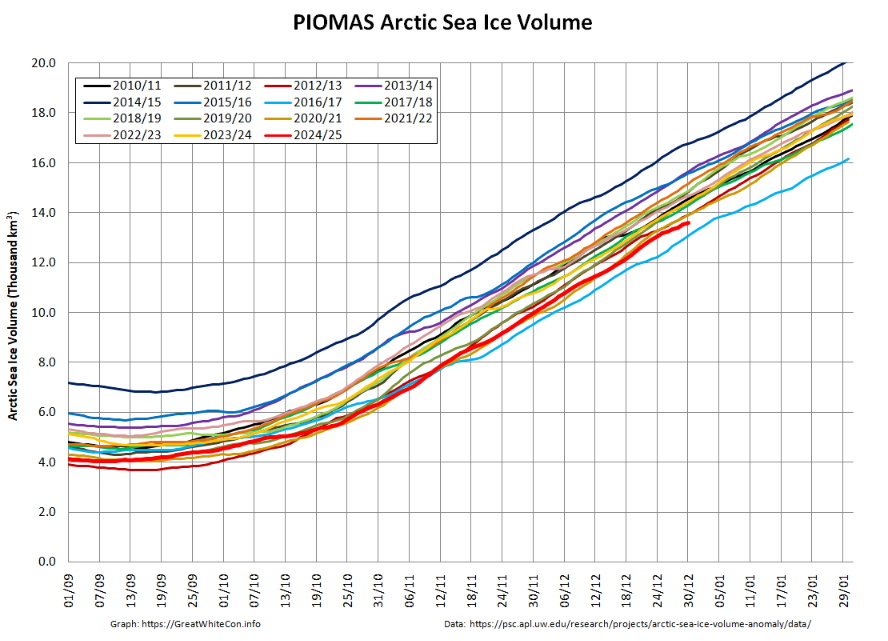
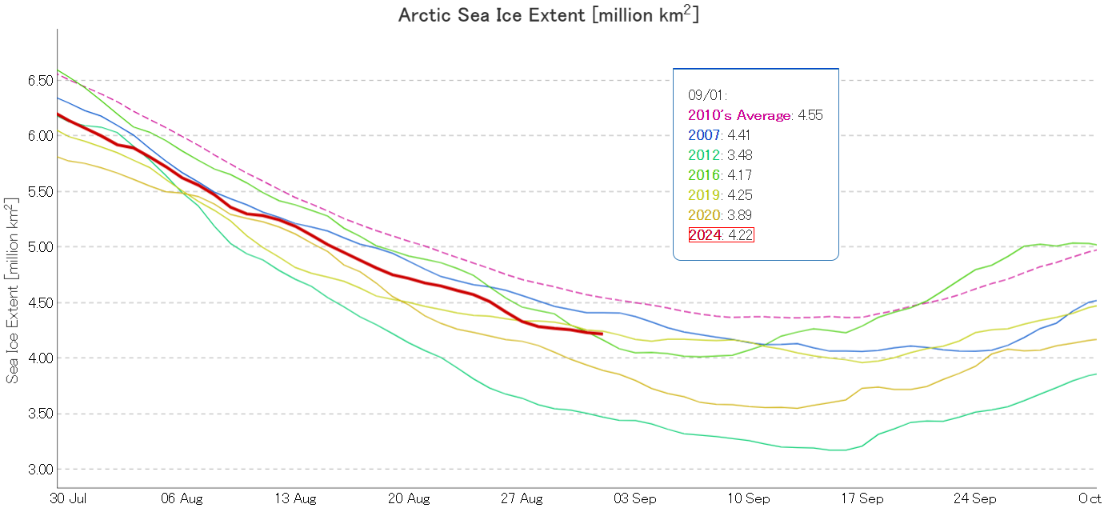
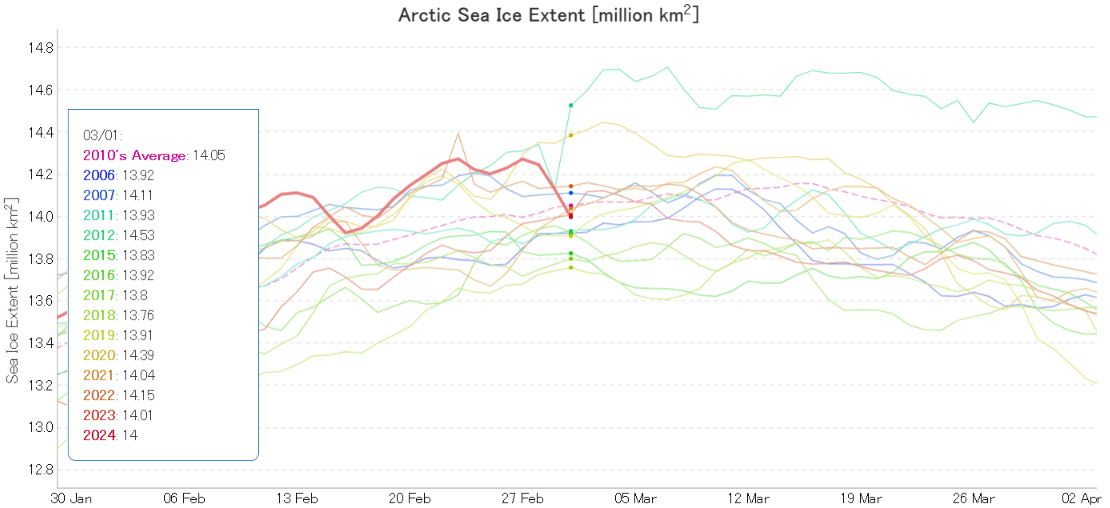
It looks as though the 2024 Arctic sea ice melting season has begun. For much greater detail see the 2024 maximum extent thread. However, here’s the latest JAXA Arctic sea ice extent graph:

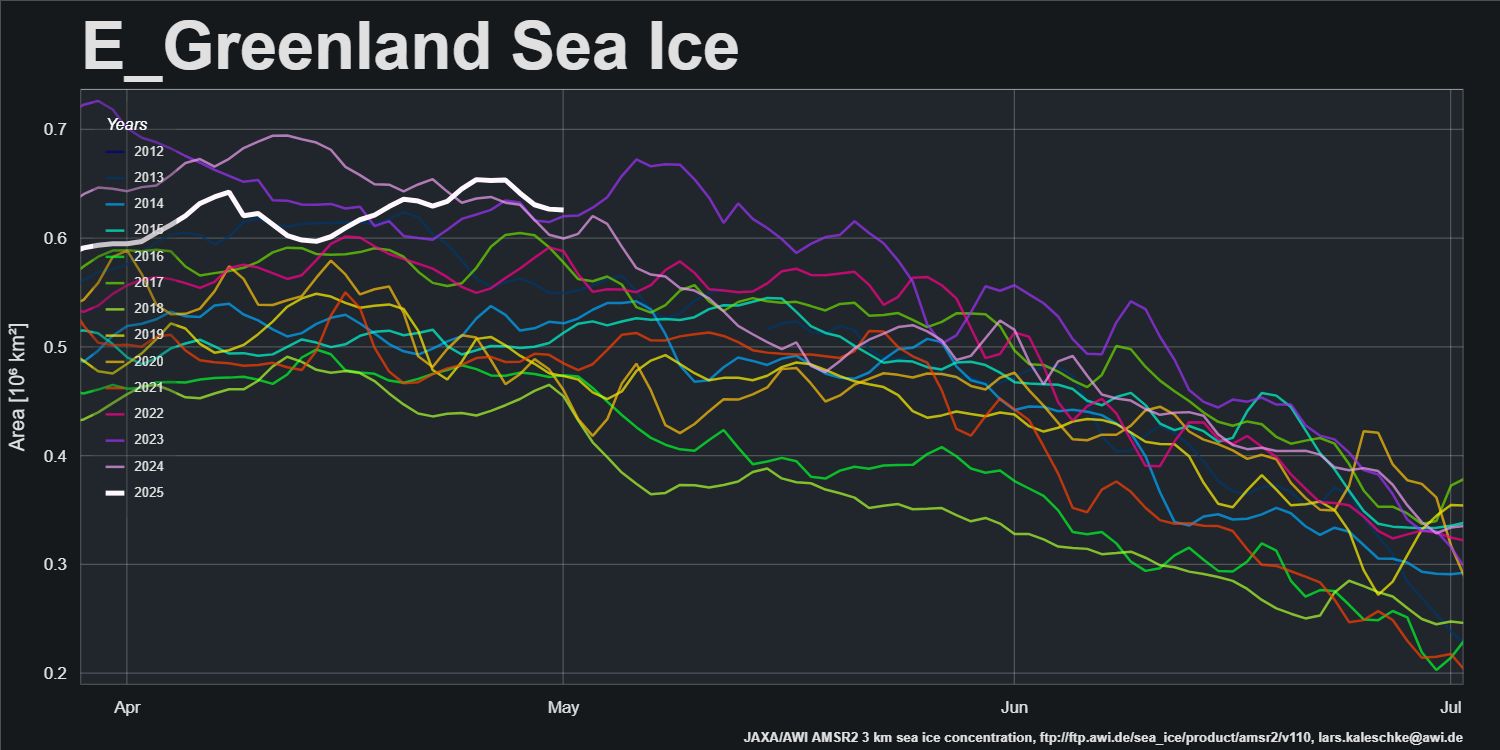
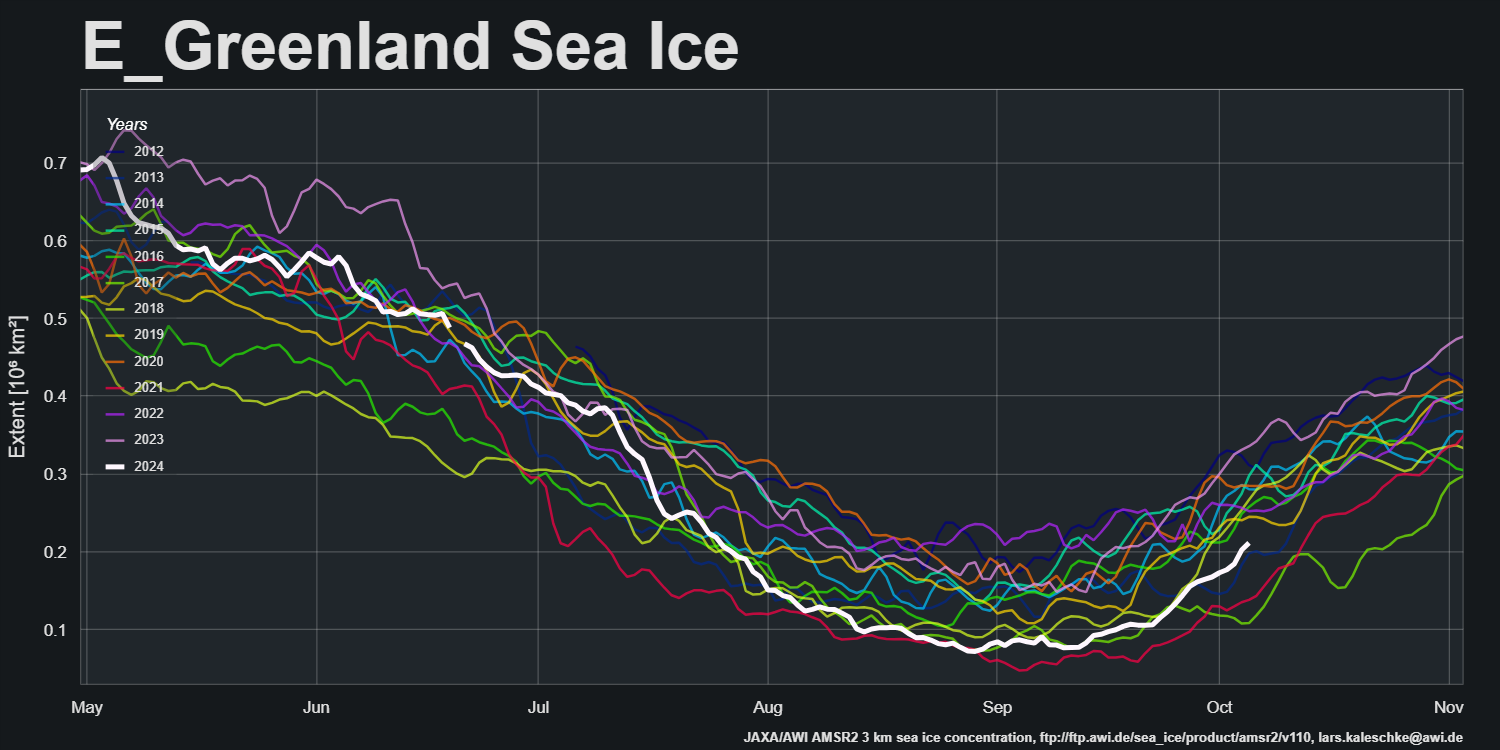
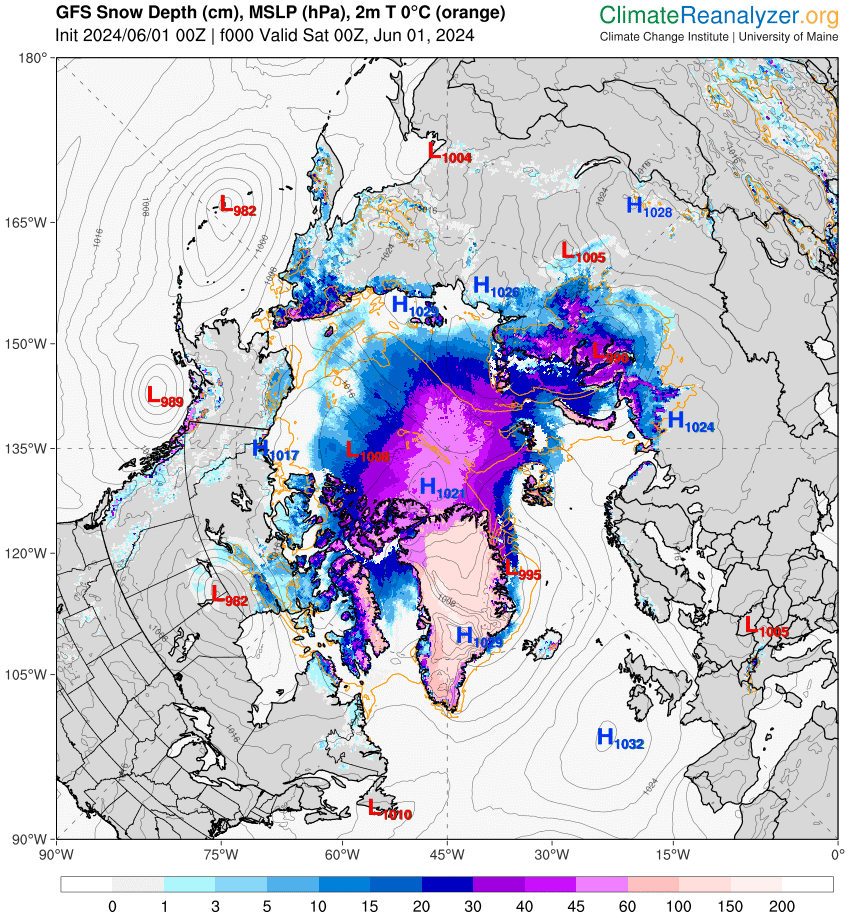
Here too is an animation of sea ice motion on the Atlantic periphery, showing the effect of the passage of several Arctic cyclones through the area over the past 5 weeks or so:

[Update – March 4th]

My usual start of month processing hasn’t gone according to plan. Thanks to Lars Kaleschke at the Alfred Wegener Institute for the following information:

SMOS went into safe mode on 22 February 2024 at 05:10 UTC for reasons that are still under investigation.

The spacecraft has been back in nominal mode since 25 February 2024 and on 27 February 2024, the MIRAS instrument was switched on and is currently performing well.

The reload of the nominal acquisition planning is underway, and if all science data quality checks are positive, nominal data production and dissemination will resume in the coming days.

Continue reading Facts About the Arctic in March 2024

The 2024 Maximum Arctic Sea Ice Extent

“The time has come”, the Walrus said, “to talk of many things… Of why the sea is boiling hot, and whether pigs have wings“.

And also about the assorted different Arctic sea ice extent metrics, and in particular their respective maxima for 2024.

Here is Zack Labe’s overview of previous years’ maxima from a few days ago:

Zack’s graph displays the JAXA/ViSHOP version of Arctic extent, so here too is JAXA’s own graph of the current sea ice extent:

JAXA extent is based on data from the AMSR2 instrument on the GCOM-W satellite, and shows no evidence yet of a local maximum, let alone an annual one for 2024.

However see also AWI’s “high resolution” AMSR2 area metric:

Continue reading The 2024 Maximum Arctic Sea Ice Extent