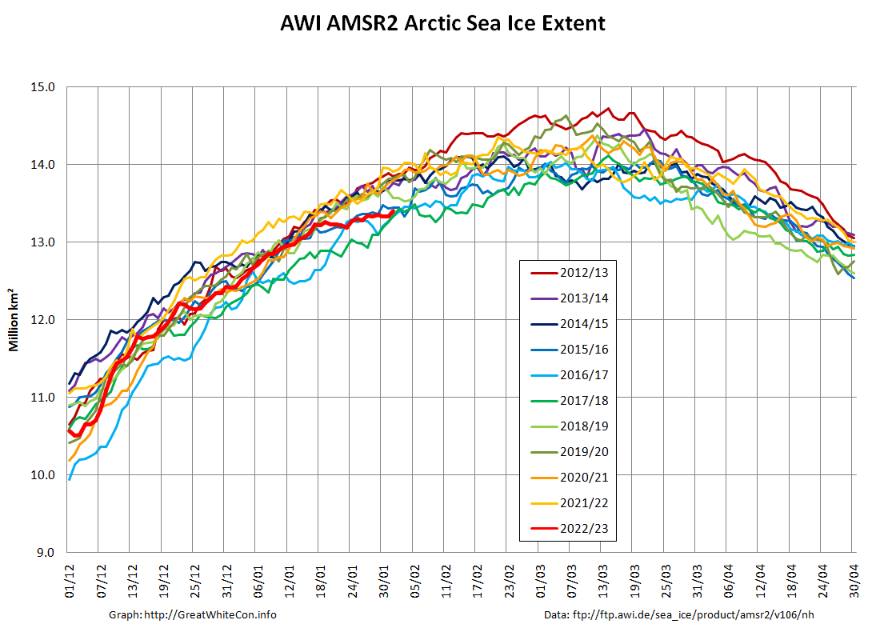
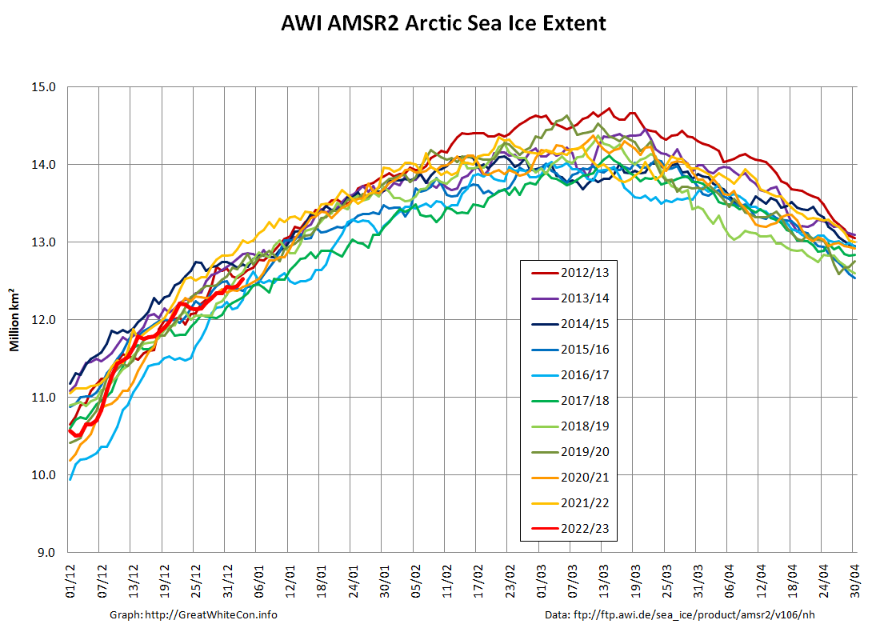
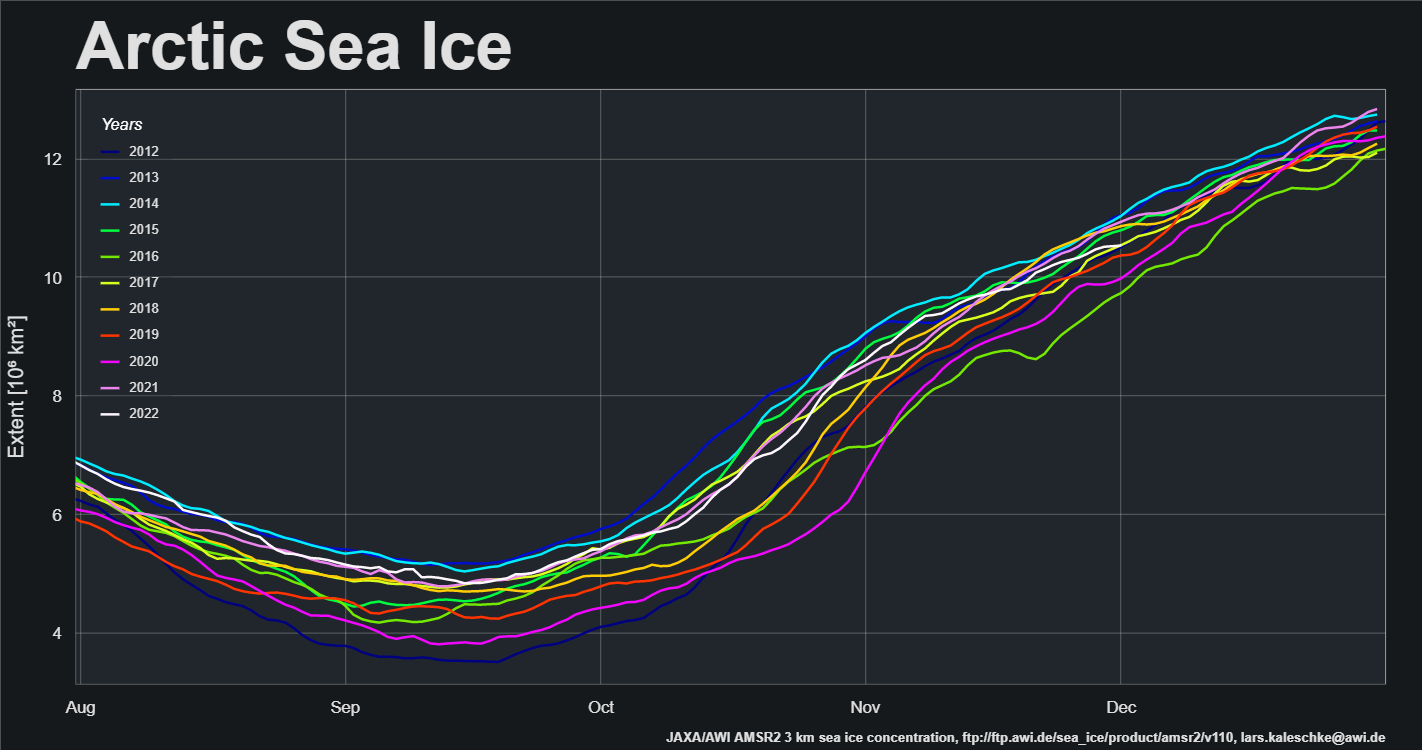
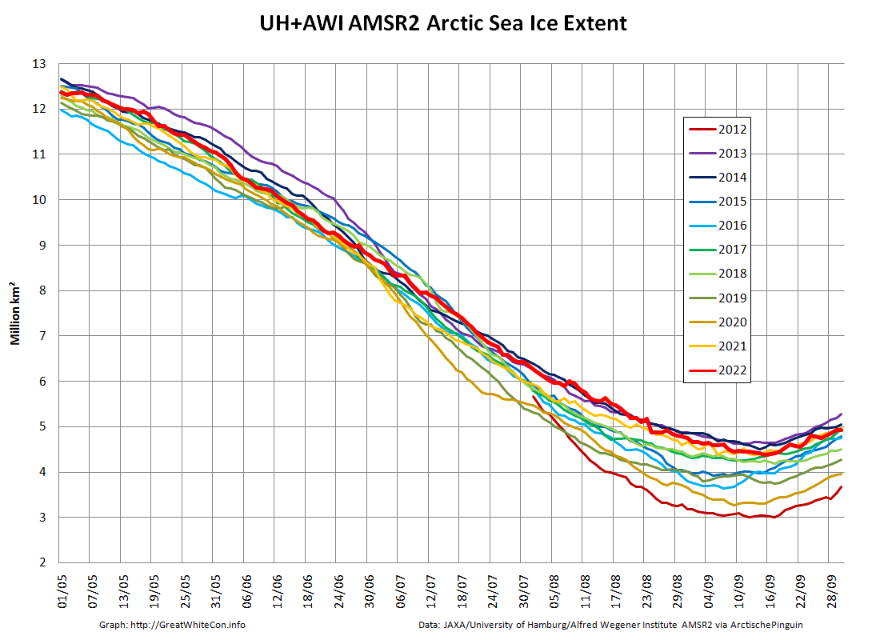
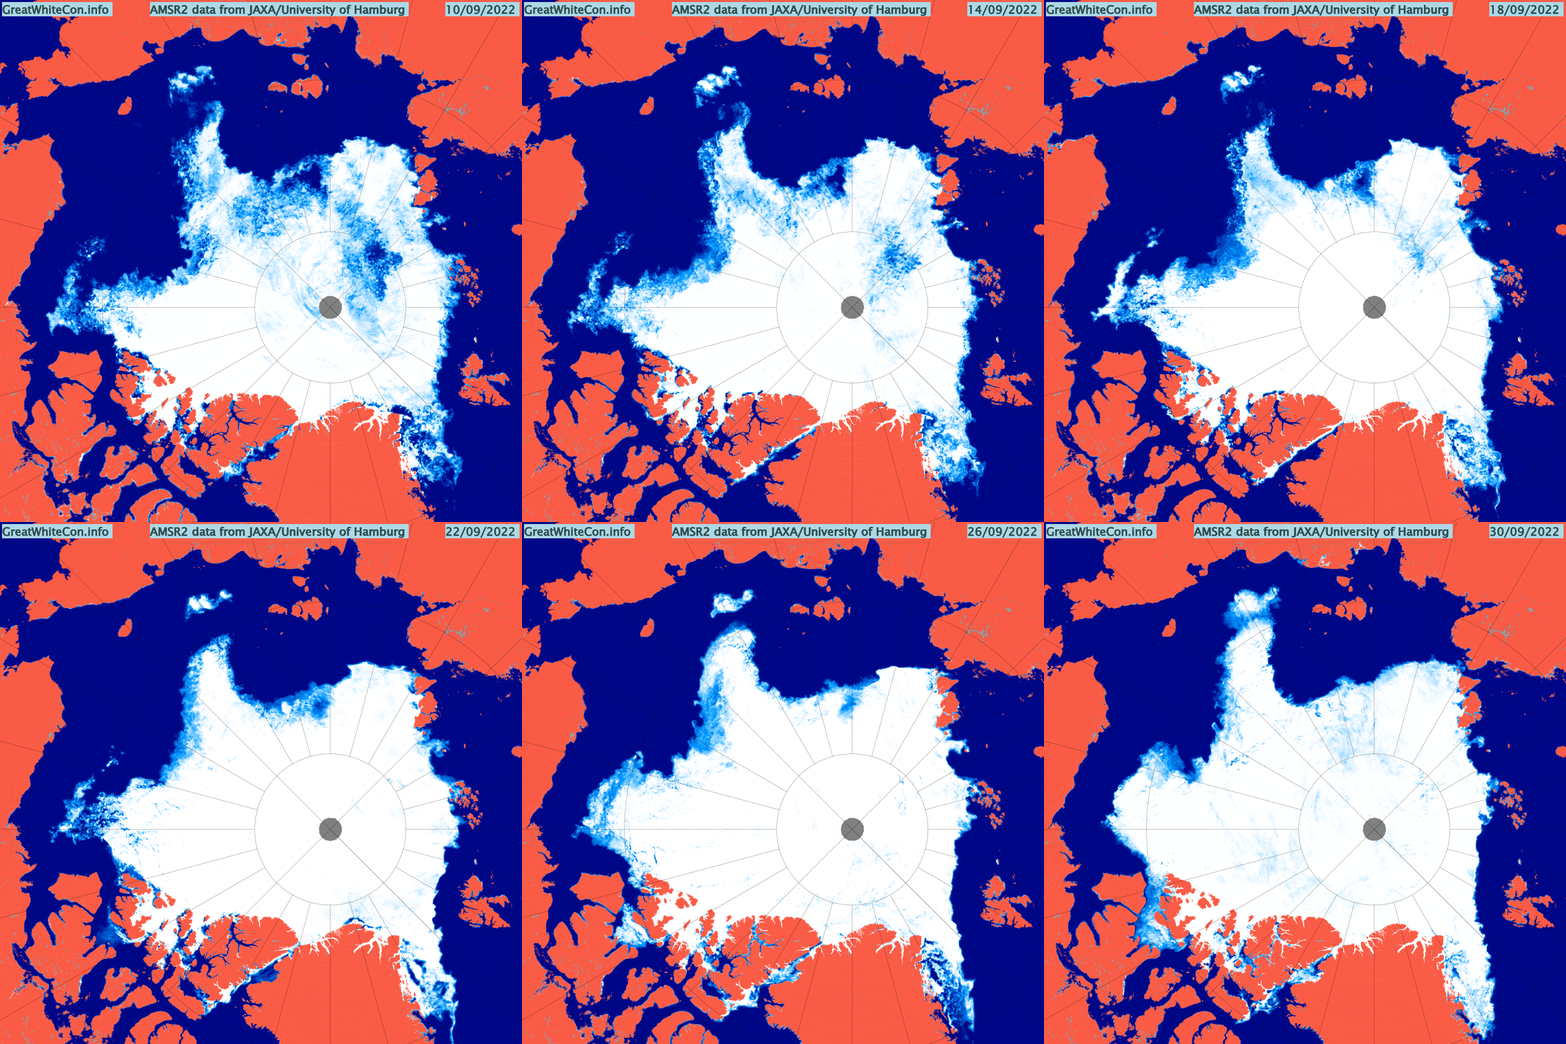
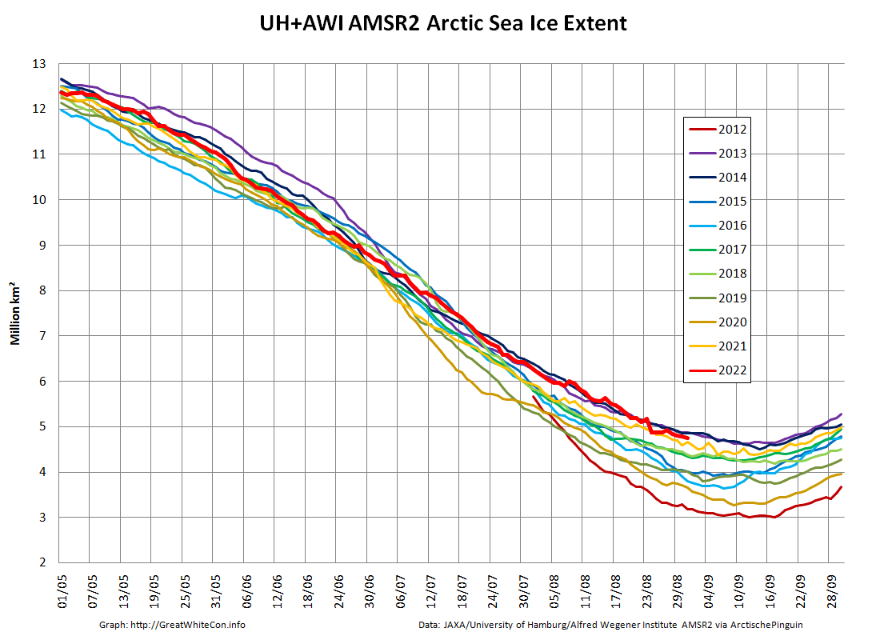
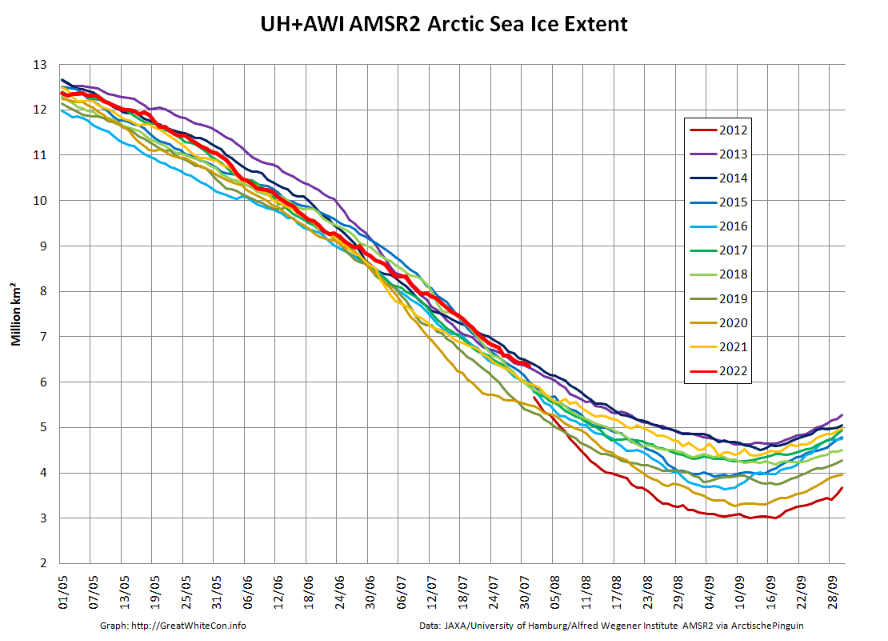
A new month has arrived, and during January several Arctic sea ice metrics have been drifting towards the bottom of their respective decadal ranges. To begin with here is AWI’s high resolution AMSR2 extent graph, which is currently very close to being lowest for the date in the AMSR2 record:
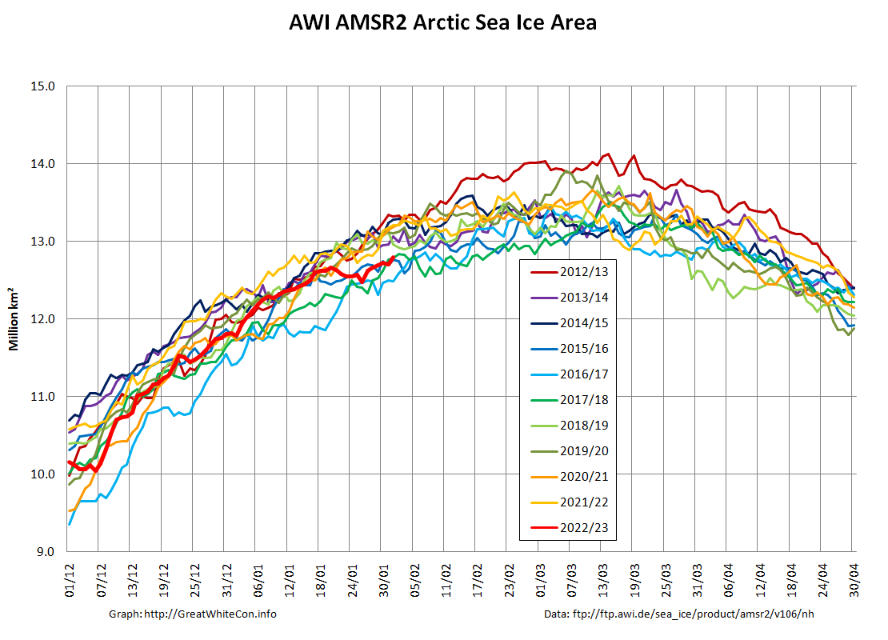
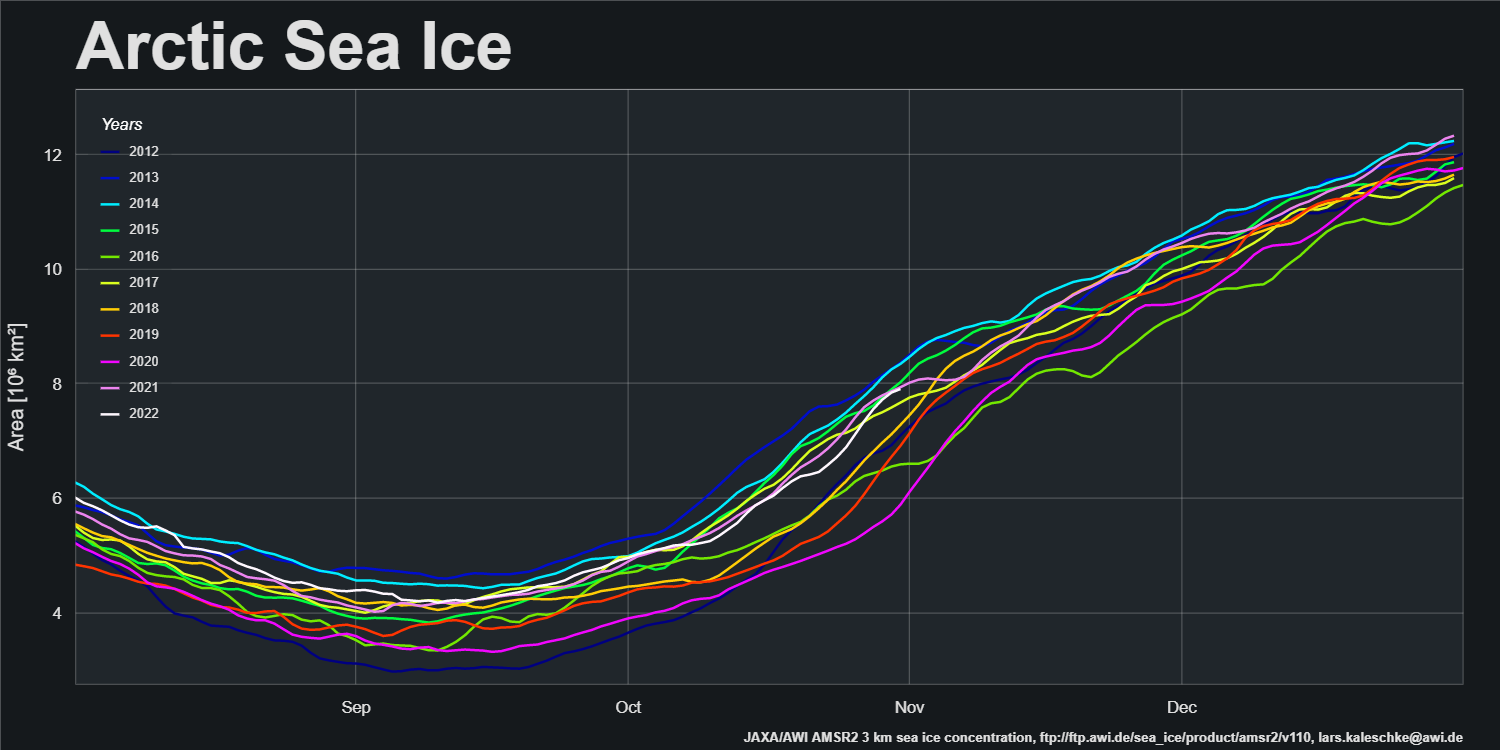
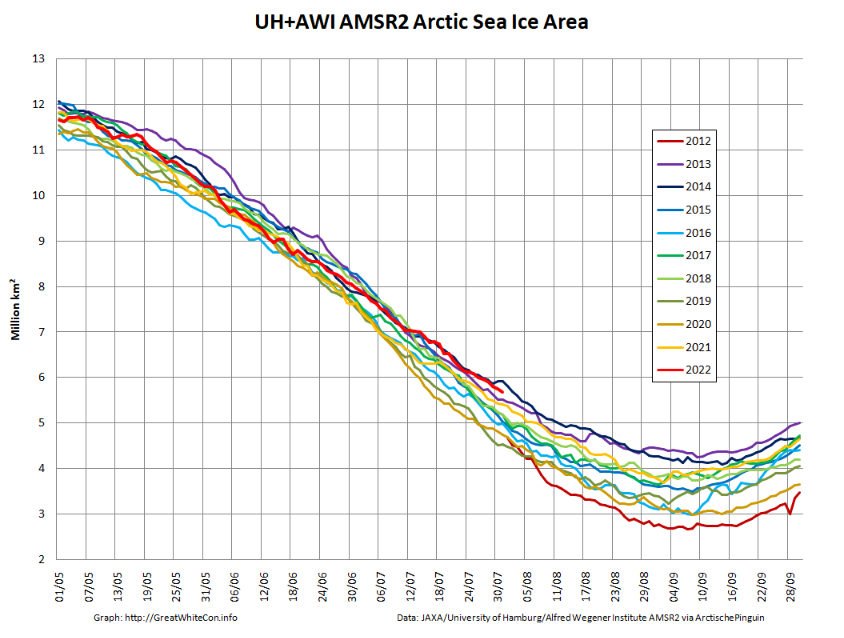
However that is less the case for area:
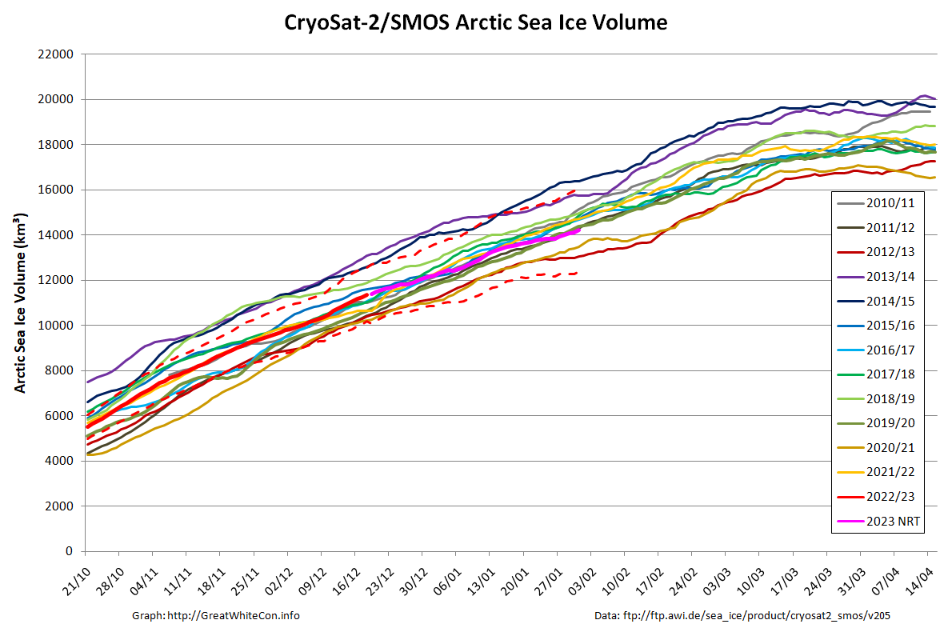
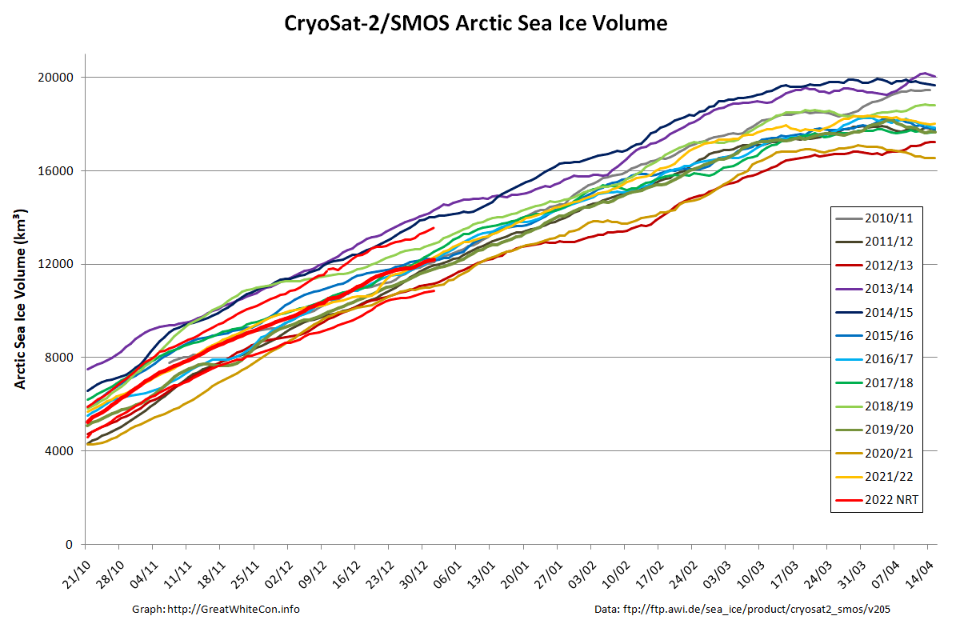
Taylor is keen to see the PIOMAS volume data for January, but whilst we wait for the latest Polar Science Center update here is the CryoSat-2/SMOS volume graph, which now includes a couple of month’s worth of reanalysed results as well as more recent near real time numbers:
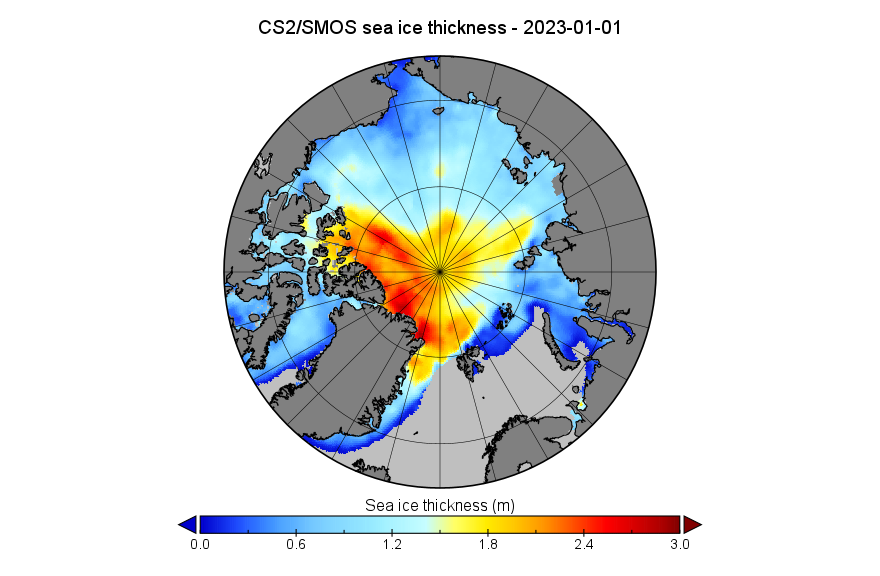
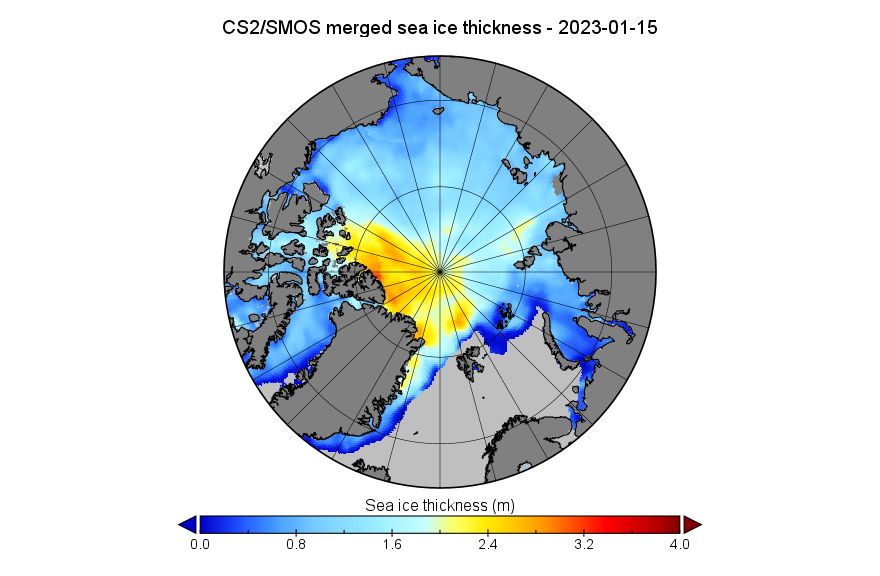
Here too is the start of month CS2/SMOS thickness map:
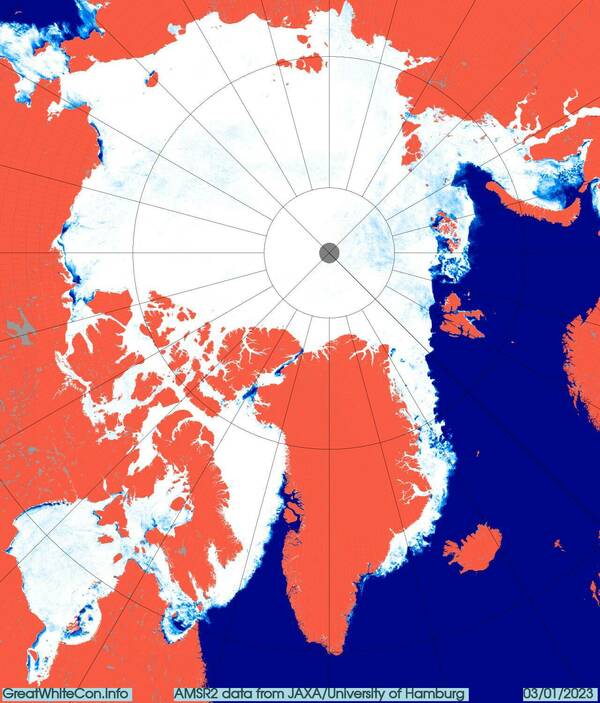
At the beginning of the New Year all the central regions of the Arctic are now refrozen apart from a small area of the Kara Sea:
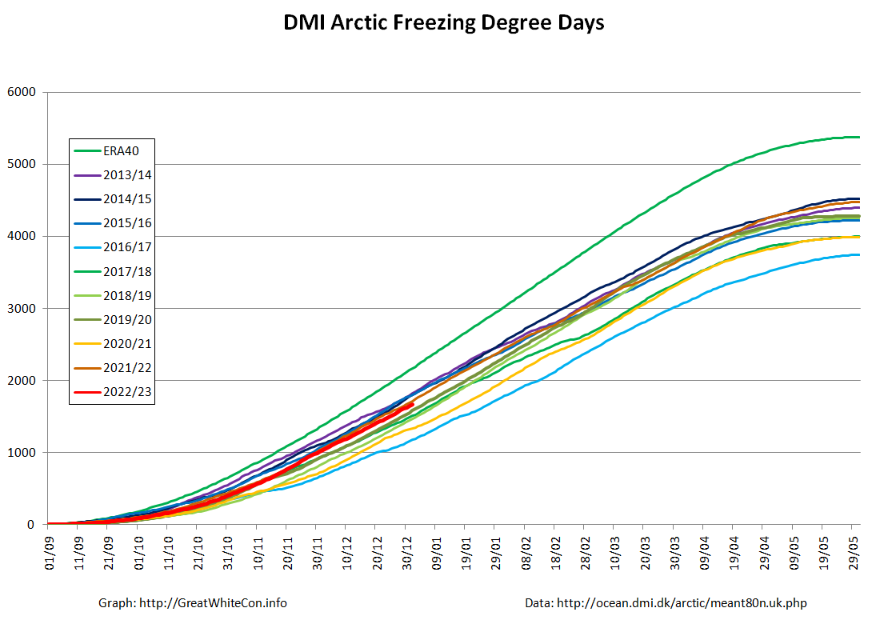
Most Arctic sea ice metrics are near the middle of their respective ranges over the last decade. By way of example, here is a graph of Arctic Freezing Degree Days based on the Danish Meteorological Institute’s temperature data for the area north of 80 degrees latitude:
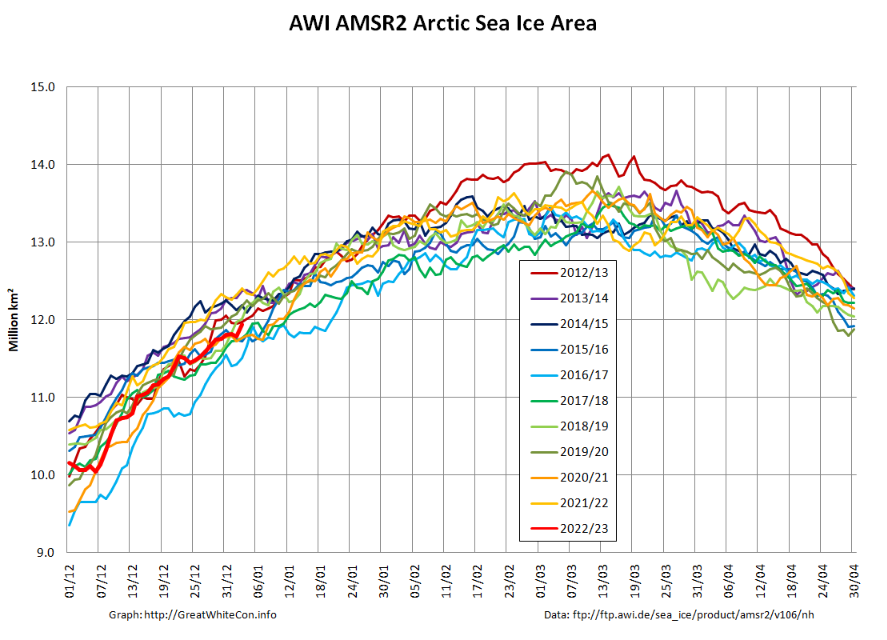
Here too are the high resolution AWI AMSR2 area and extent graphs:
The latest AWI CryoSat-2/SMOS volume graph tells a similar story:
Although overall volume is in the middle of the pack, the associated thickness map:
and the thickness anomaly map from the Finnish Meteorological Institute reveal an unusual distribution of thicker ice:
A considerable volume of ice currently situated between Svalbard and North East Greenland seems destined to exit the Central Arctic Basin via the Fram Strait over the coming months.
[Edit – January 24th]
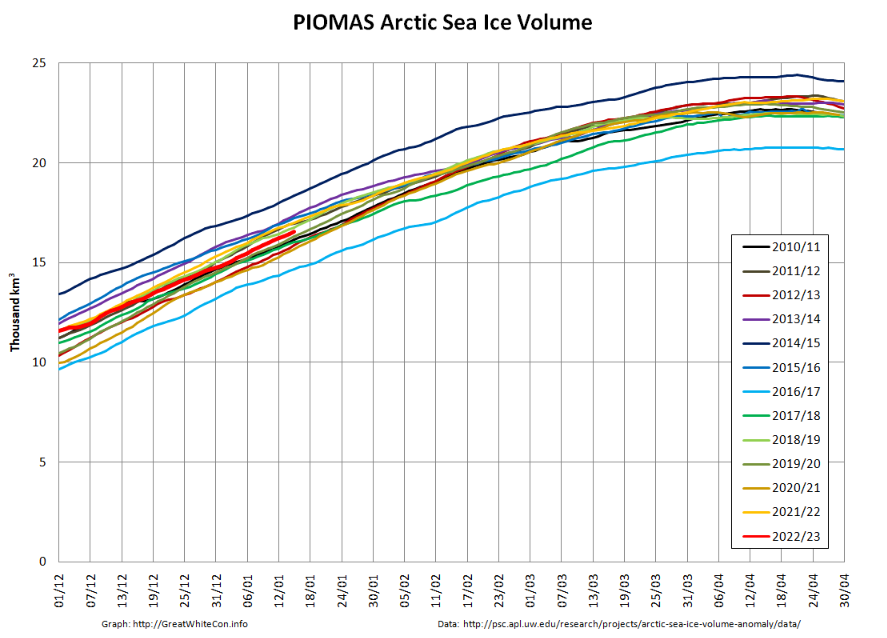
In a somewhat belated mid month update, here’s the PIOMAS daily Arctic sea ice volume graph:
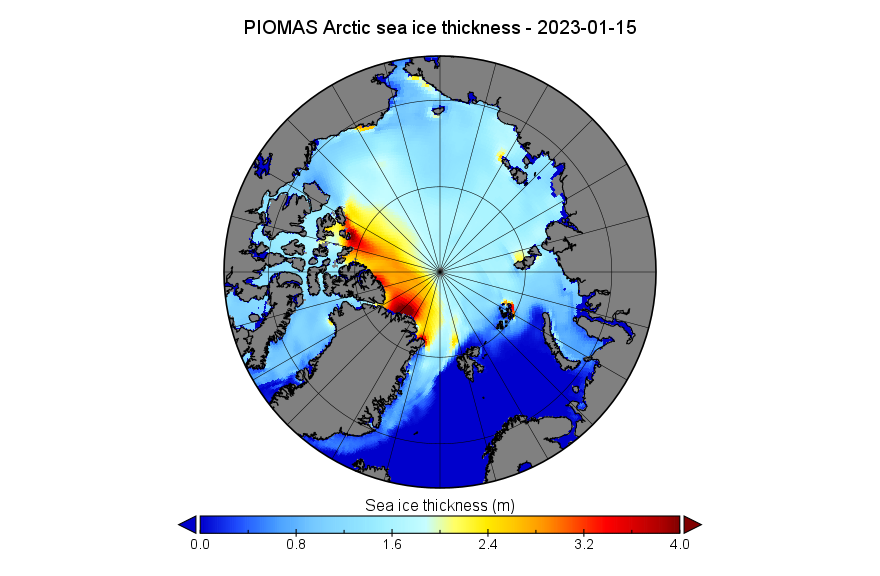
together with the PIOMAS thickness map on January 15th:
For comparison purposes here’s the AWI CryoSat-2/SMOS thickness map using the same scale:
Note the change of scale from the beginning of the month CS2/SMOS map at the top.
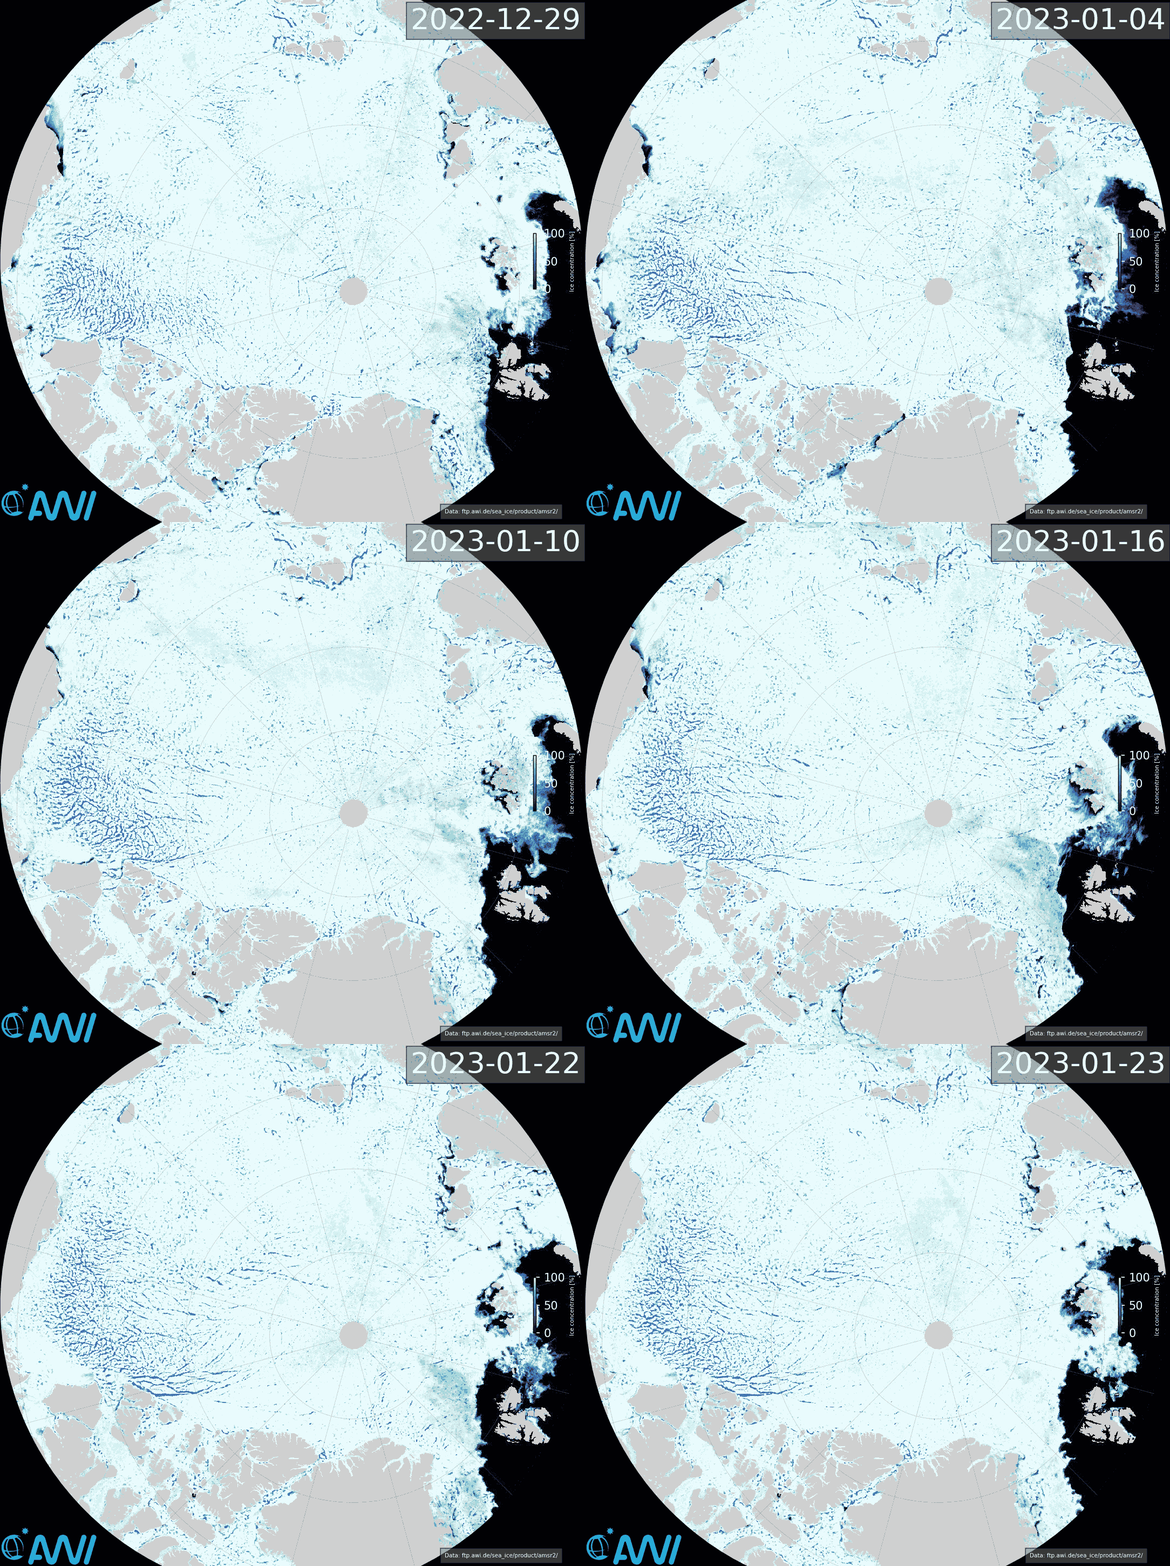
Here too is Lars Kaleschke’s animation of recent Arctic sea ice concentration, with the width of leads exaggerated to reveal ice motion:
Click to animate (10 Mb!)
Evidently sea ice export from the so called “last ice area” is continuing via the Nares Strait and in particular via the Fram Strait between Greenland and Svalbard.
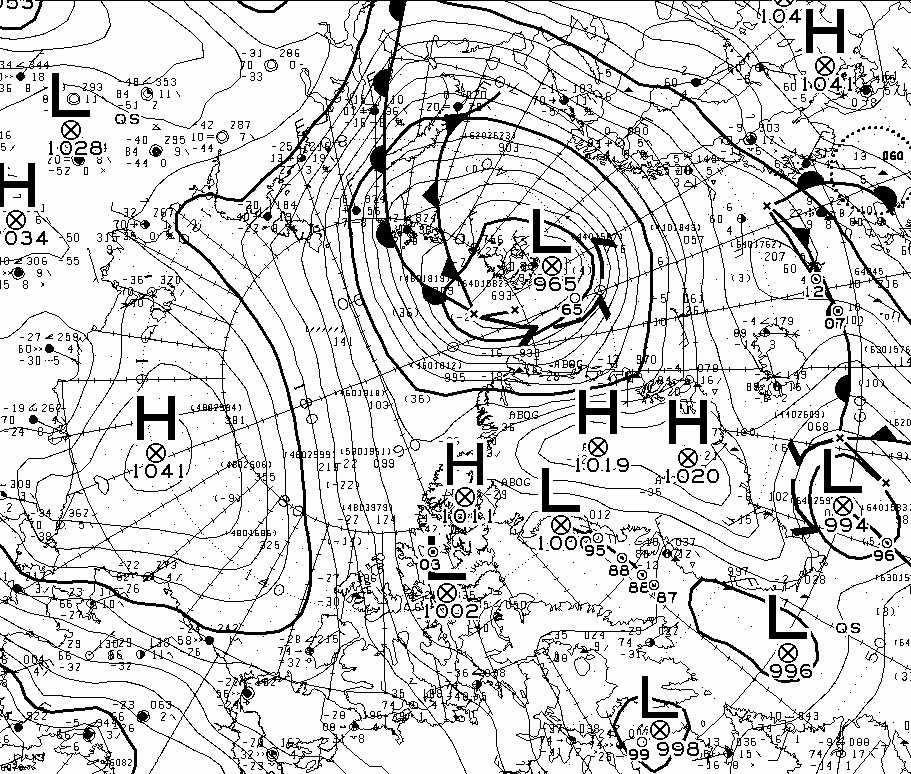
Although not on the same scale as the cyclone at around the same time last year, surface pressure of a storm near Svalbard bottomed out at 965 hPa yesterday:
It will be interesting to see what effect the storm has on the ice on the Atlantic periphery over the next few days.
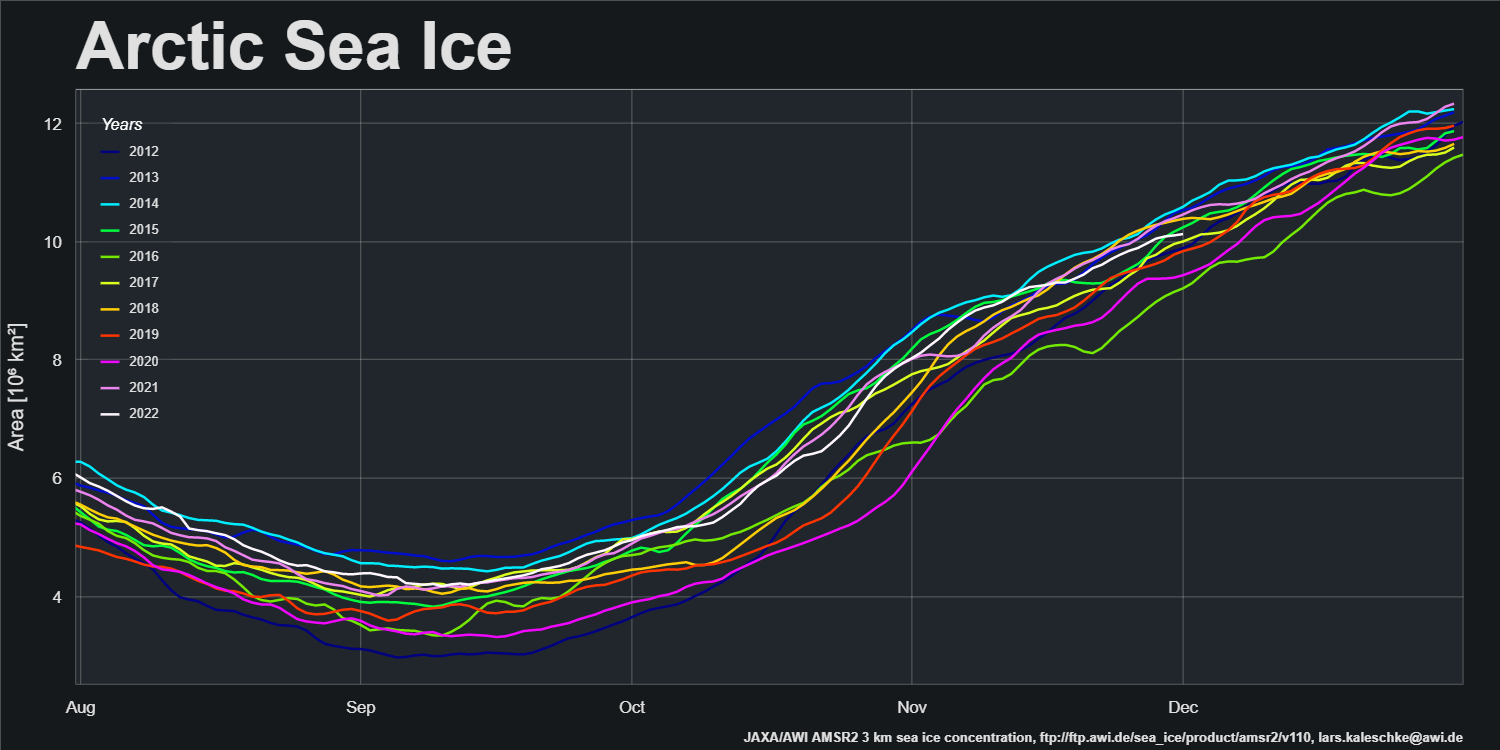
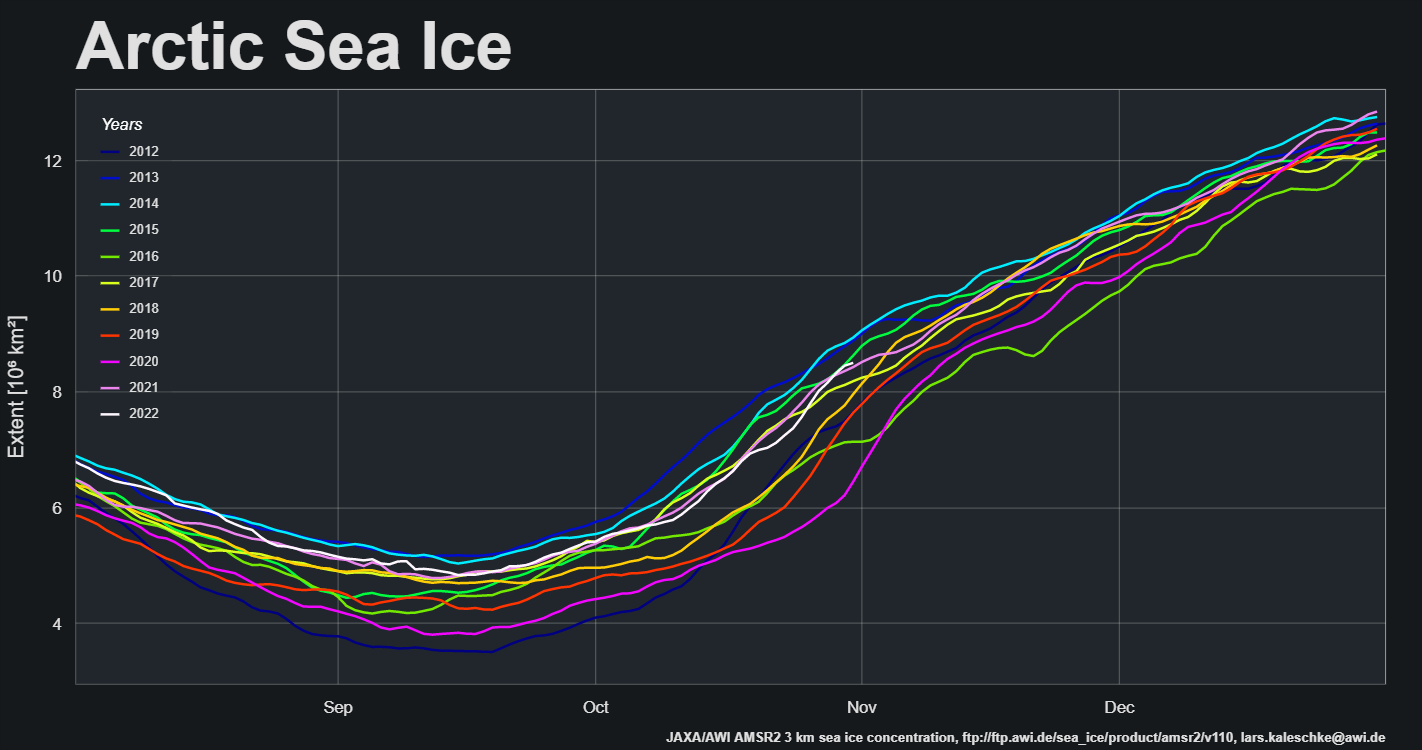
A new month is upon us and Christmas is coming! Here’s another look at Lars Kaleschke’s high resolution AMSR2 area and extent graphs for the Arctic as a whole:
Extent increase stalled for the last few days of November, and as a result extent is now in a “statistical tie” with 2017 for 4th lowest extent for the date in the AMSR2 record.
A change is allegedly as good as a rest, so here’s an alternative view of high resolution AMSR2 area and extent created using the experimental tools provided by the AWI’s Lars Kaleschke at: https://sites.google.com/view/sea-ice/
After a brief pause mid-month the refreeze has accelerated again. Both metrics are in the upper half of the decadal range, with extent this year just above 2021 and area just below last year.
Next let’s take a look at sea ice concentration at the end of October:
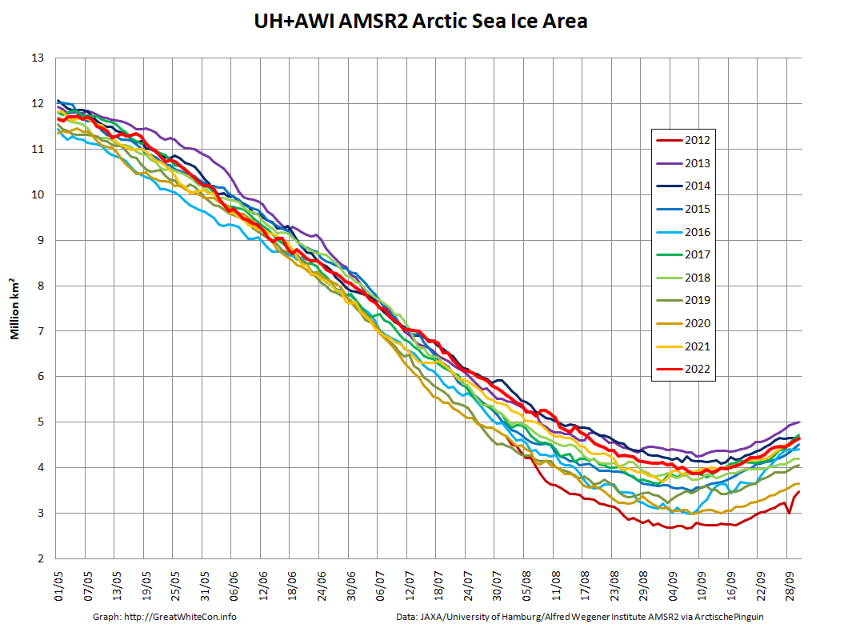
The 2022/23 freezing season has begun, so to begin with here are Arctic sea ice area and extent during its early stages:
Both metrics are currently tracking 2021 quite closely.
Here too is an AMSR2 animation of the transition from melting to freezing in the Central Arctic. Click to animate, and be warned that the file size is almost 10 Mb:
[Edit – October 4th]
Another big storm is heading for the Chukchi Sea. The GFS forecast currently shows a sub 960 hPa low developing on Thursday:
As in previous years there is already a thread devoted to this year’s minimum extent. By way of a summary here are the end of August numbers for our favourite “high resolution” AMSR2 area and extent metrics:
Extent is currently near the top of the range of the last 10 years.
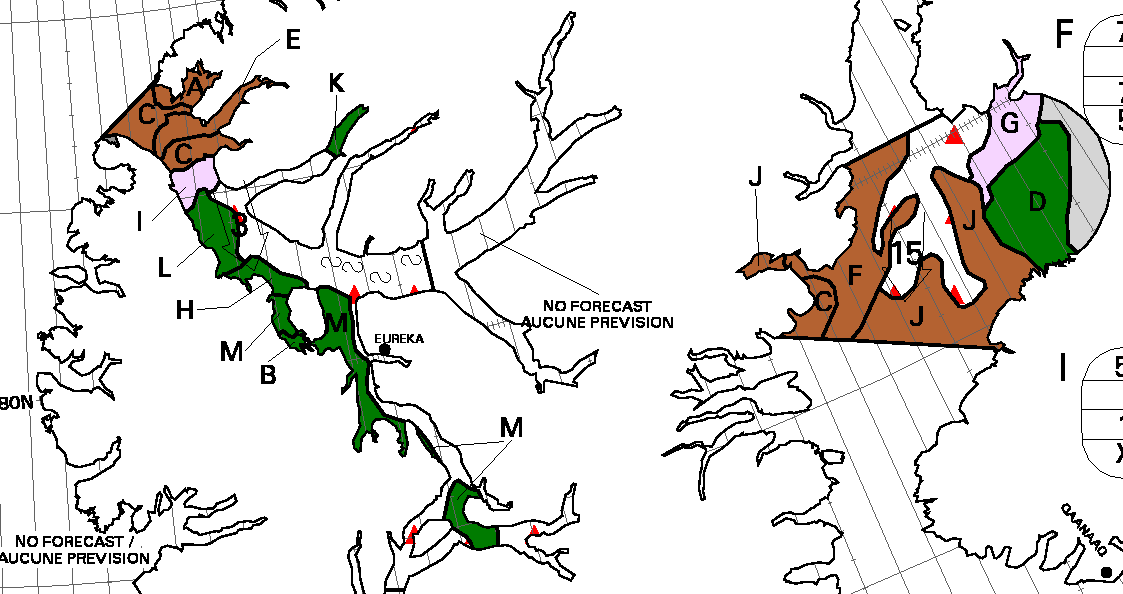
We have now reached the stage of the “melting season” when “refreezing” has started in the Central Arctic but melting at the periphery is outpacing it. However the Canadian Ice Service stage of development charts now show the arrival of new ice in the high latitudes of the Canadian Arctic Archipelago:
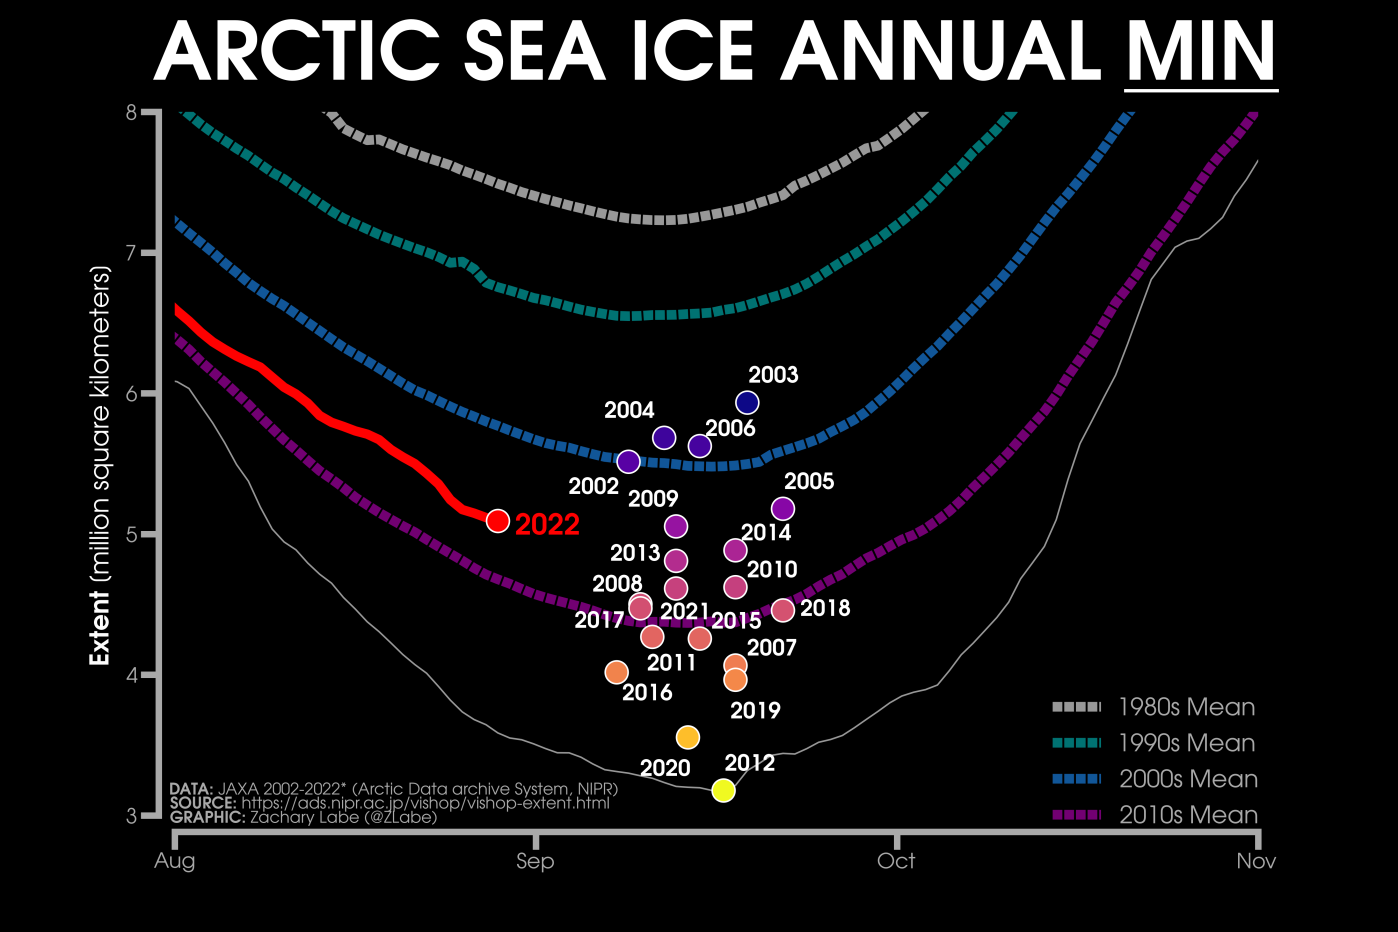
September has arrived and it’s time to start speculating about when and at what level this summer’s minimum Arctic sea ice extent will occur. Here’s a helpful summary of previous years’ JAXA AMSR2/AMSR-E extent minima courtesy of Zack Labe:
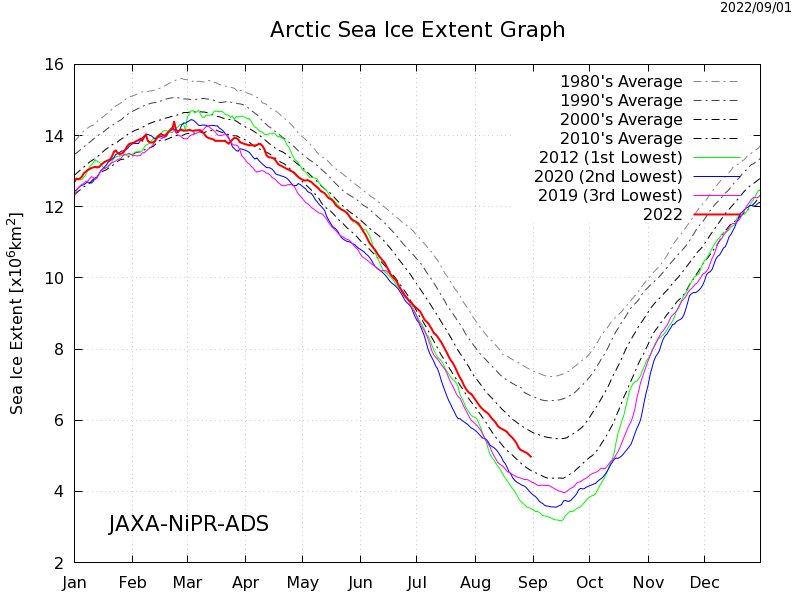
Here too is JAXA’s current graph of extent, including a selection of previous years:
JAXA extent on August 31st was 4.96 million km2, marginally below last year’s value of 4.99 million km2 on the same date.
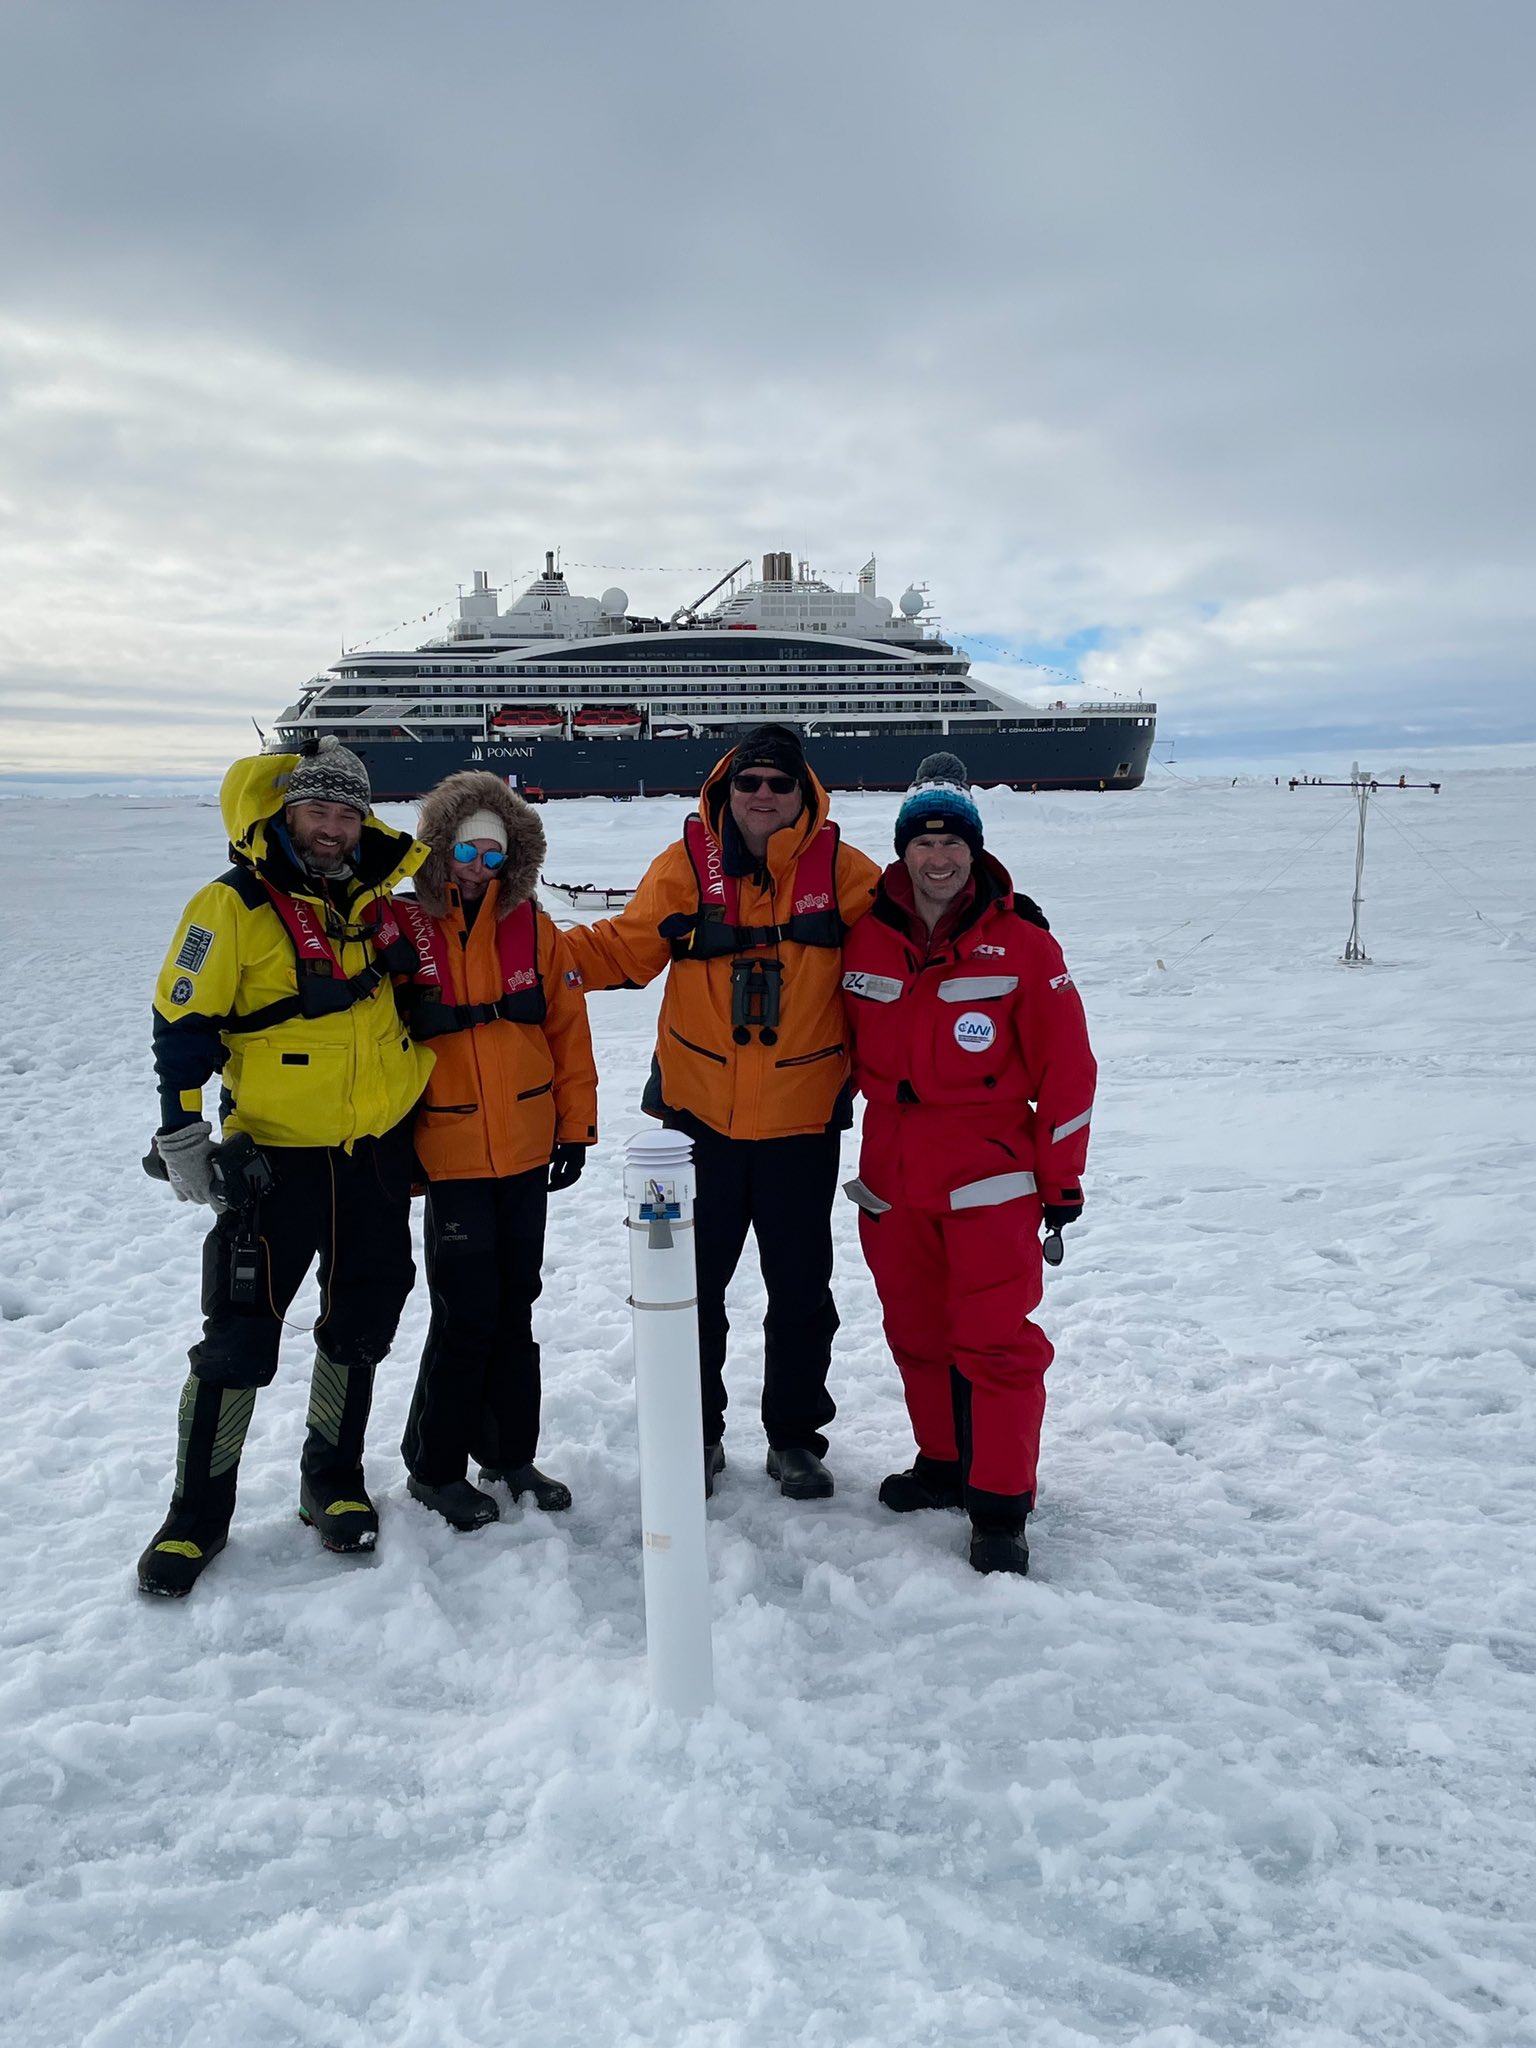
After a long hiatus courtesy of the demise of the annual Barneo ice camp and the Covid-19 pandemic we are pleased to be able to report that an ice mass balance buoy has once again been installed on a floe in the vicinity of the North Pole. Here’s the evidence:
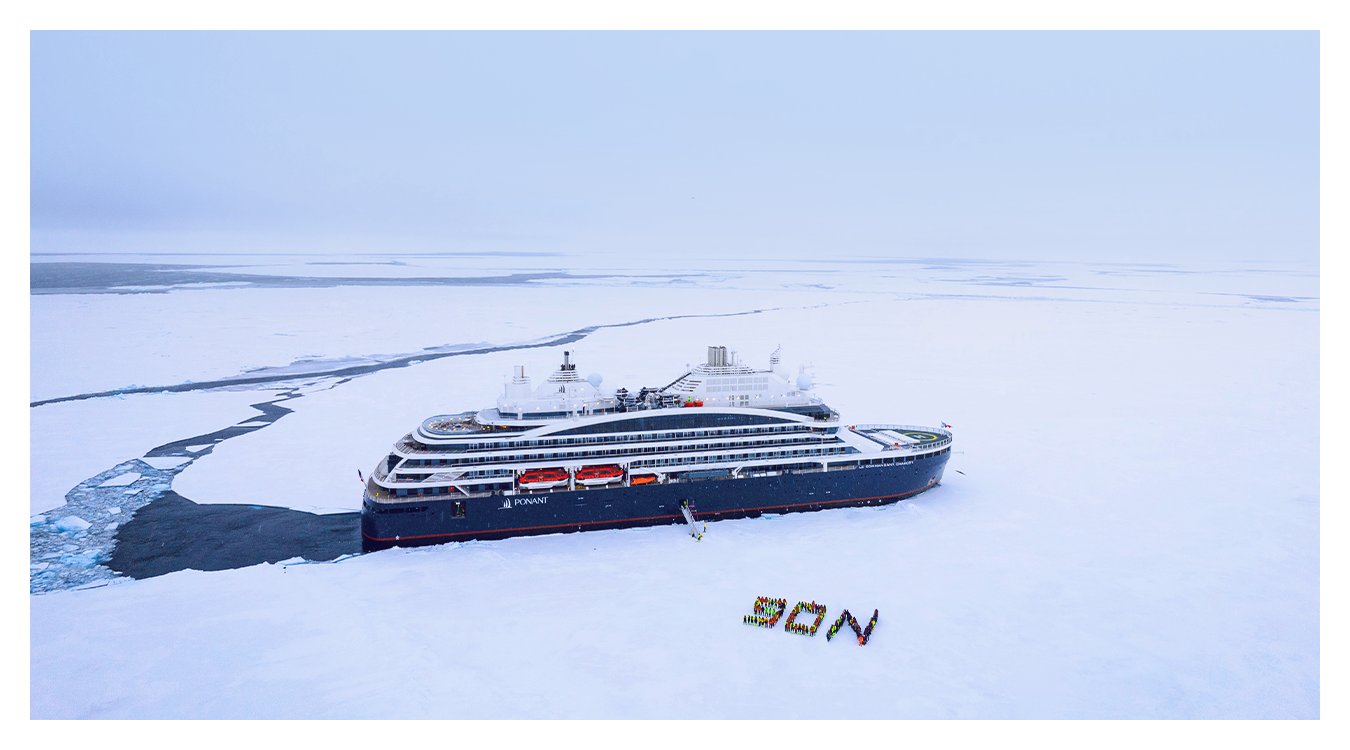
The ship in the background is not a traditional research icebreaker. It is Ponant Cruises’ Le Commandant Charcot, one of a number of new ice hardened cruise ships voyaging across the Arctic Ocean and adjacent seas. Le Commandant Charcot reached 90N on July 13th:
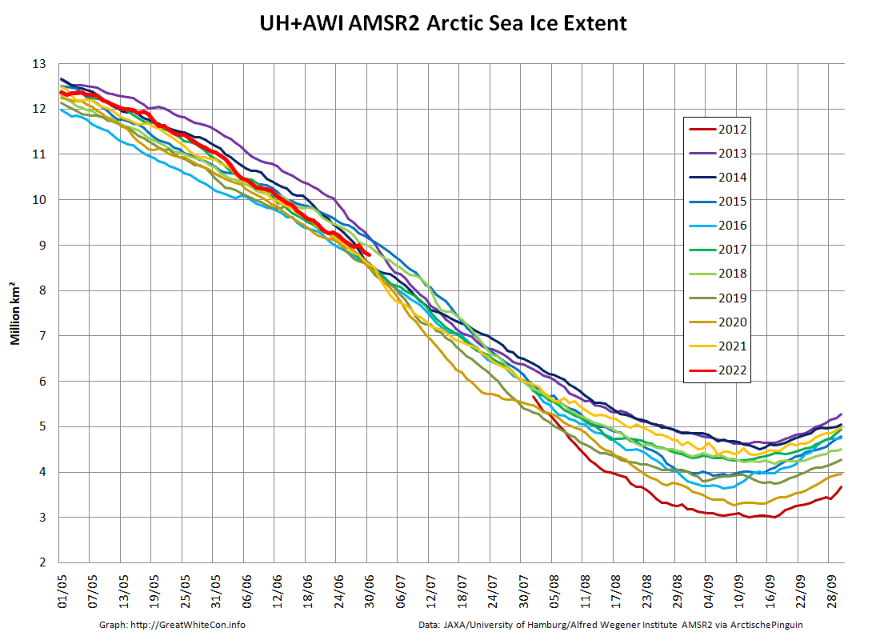
After a relatively rapid decline at the beginning of June Arctic sea extent is now very close to the 2010s average:
Both 2020 and 2021 began relatively rapid declines of their own at the beginning of July, so it will be interesting to see if 2022 follows suit.
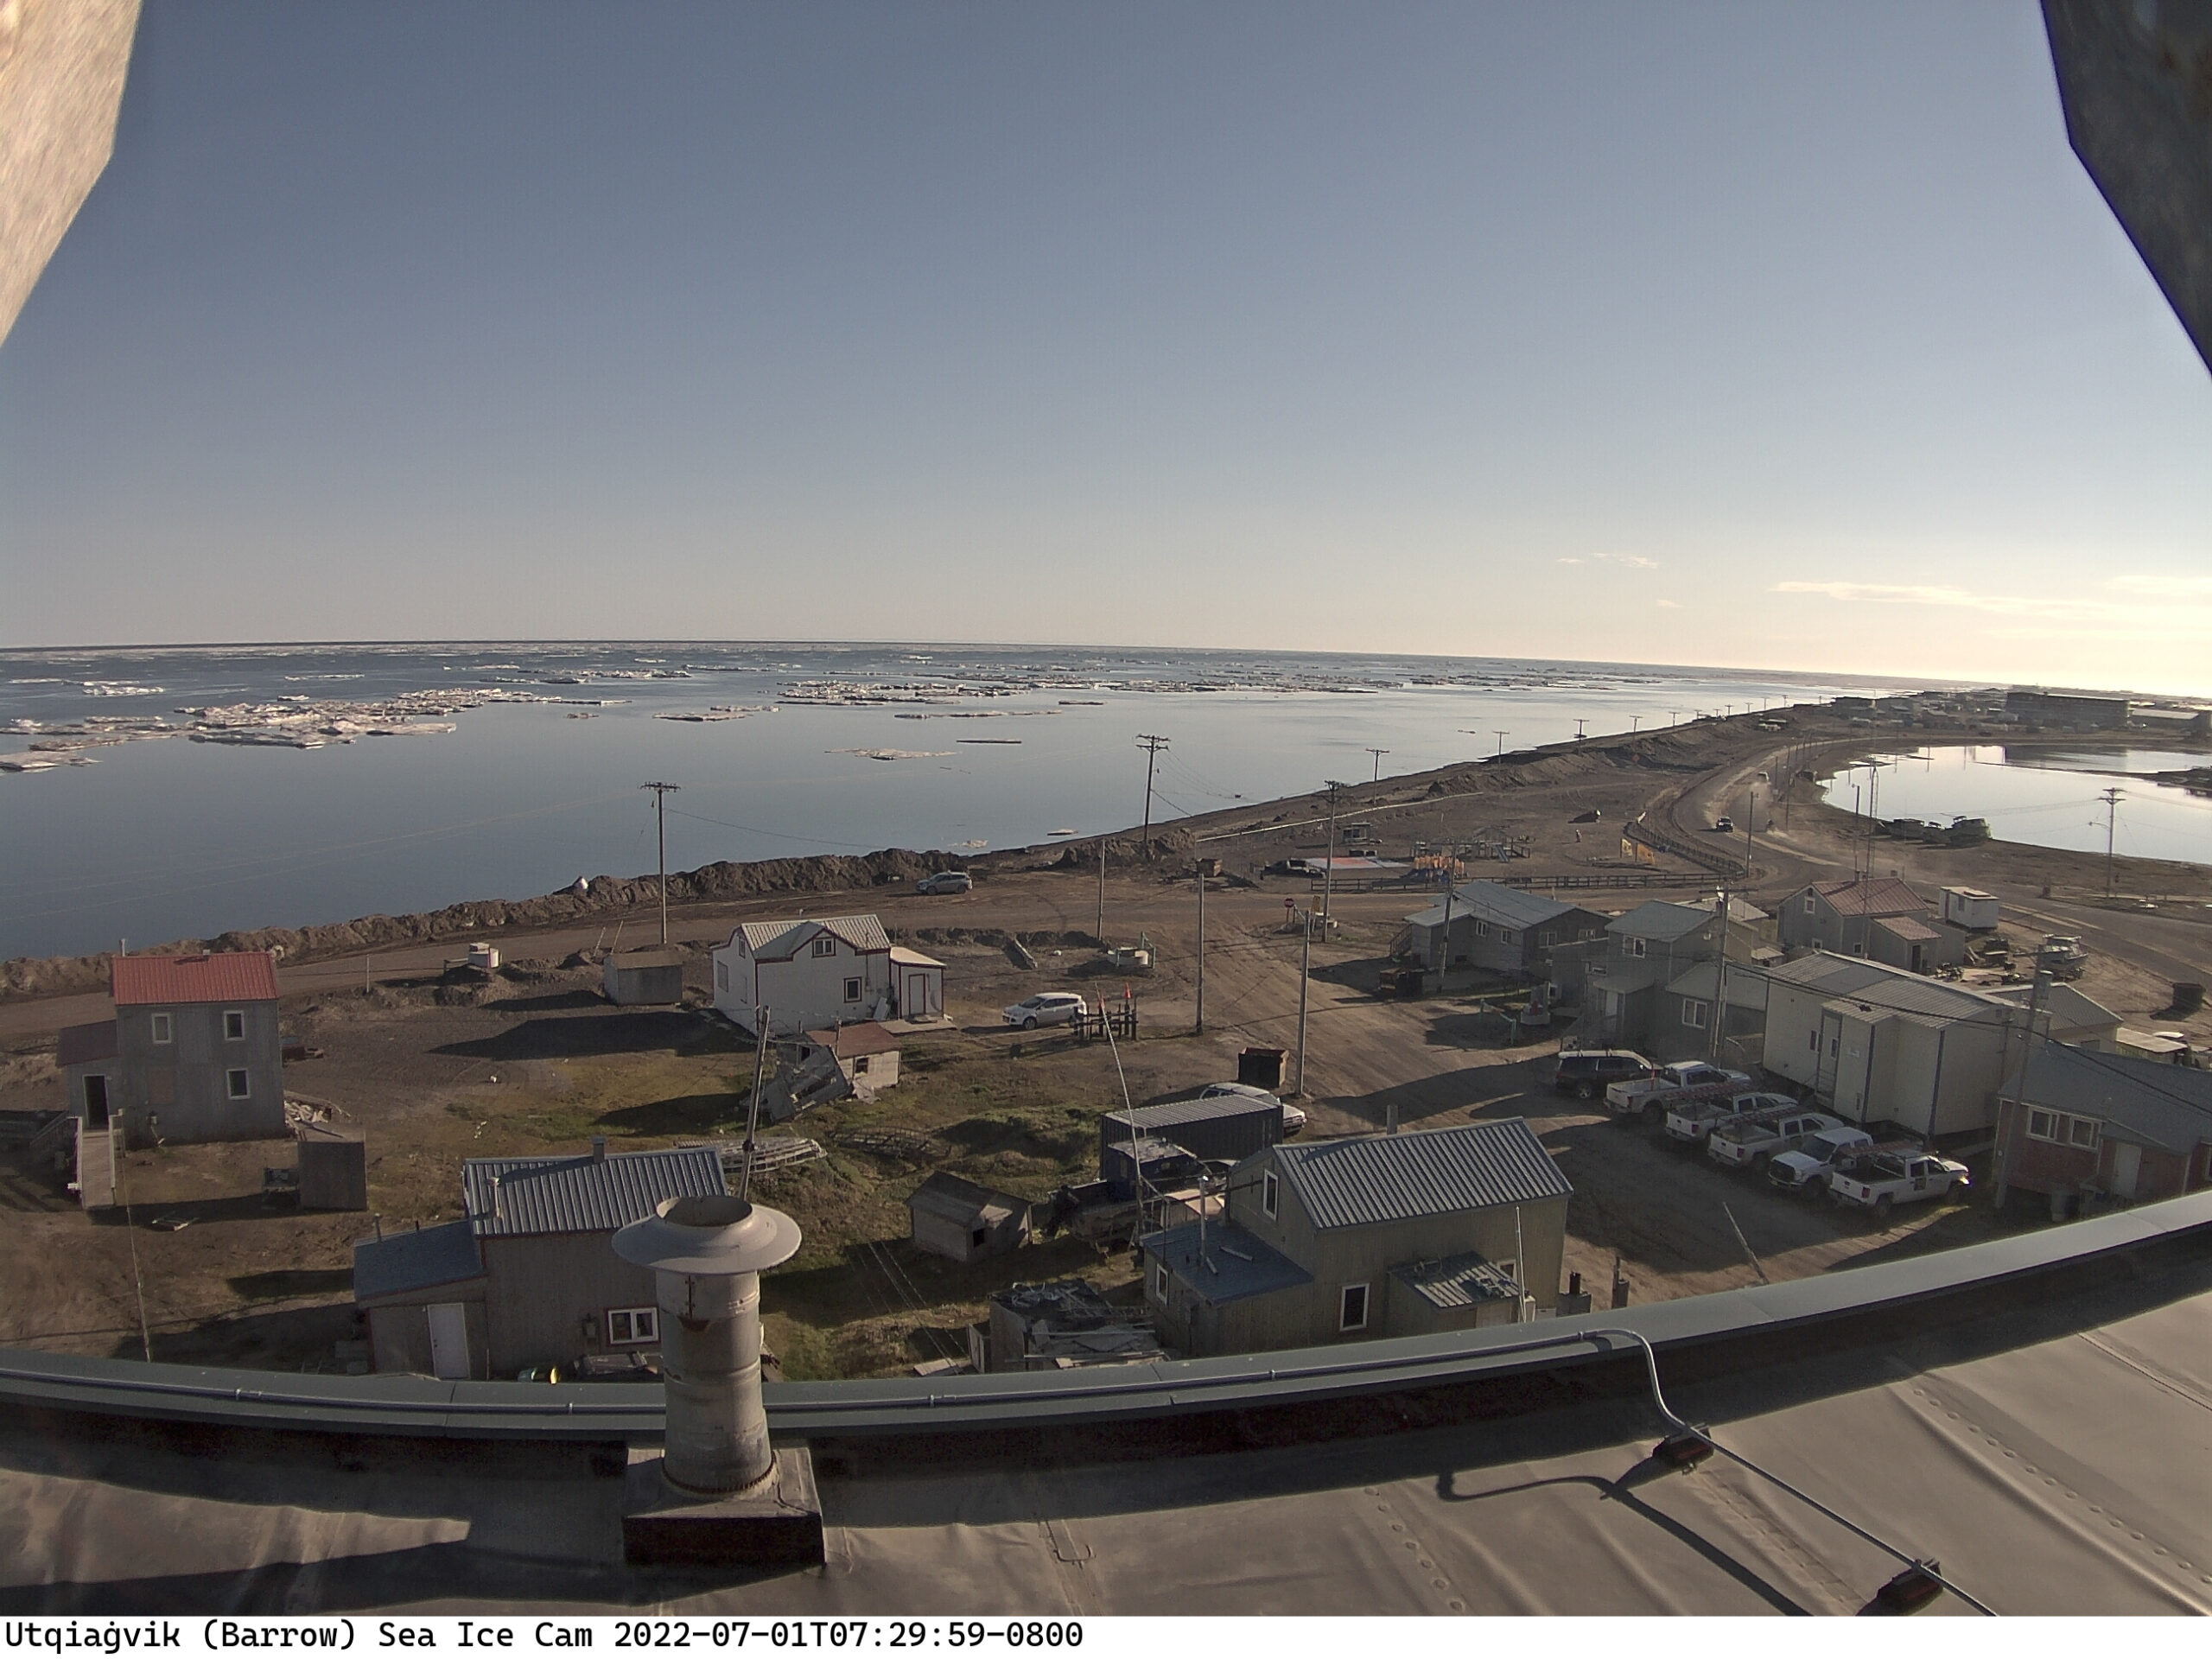
Most of the fast ice off Utqiaġvik has recently disappeared:
Meanwhile further out into the Chukchi Sea the sea ice looks to be in poor shape at the moment, with surface melting apparent across the entire region:
This website uses cookies to improve your experience. We'll assume you're ok with this, but you can opt-out if you wish. Cookie settingsACCEPT
Privacy & Cookies Policy
Privacy Overview
This website uses cookies to improve your experience while you navigate through the website. Out of these, the cookies that are categorized as necessary are stored on your browser as they are essential for the working of basic functionalities of the website. We also use third-party cookies that help us analyze and understand how you use this website. These cookies will be stored in your browser only with your consent. You also have the option to opt-out of these cookies. But opting out of some of these cookies may affect your browsing experience.
Necessary cookies are absolutely essential for the website to function properly. This category only includes cookies that ensures basic functionalities and security features of the website. These cookies do not store any personal information.
Any cookies that may not be particularly necessary for the website to function and is used specifically to collect user personal data via analytics, ads, other embedded contents are termed as non-necessary cookies. It is mandatory to procure user consent prior to running these cookies on your website.