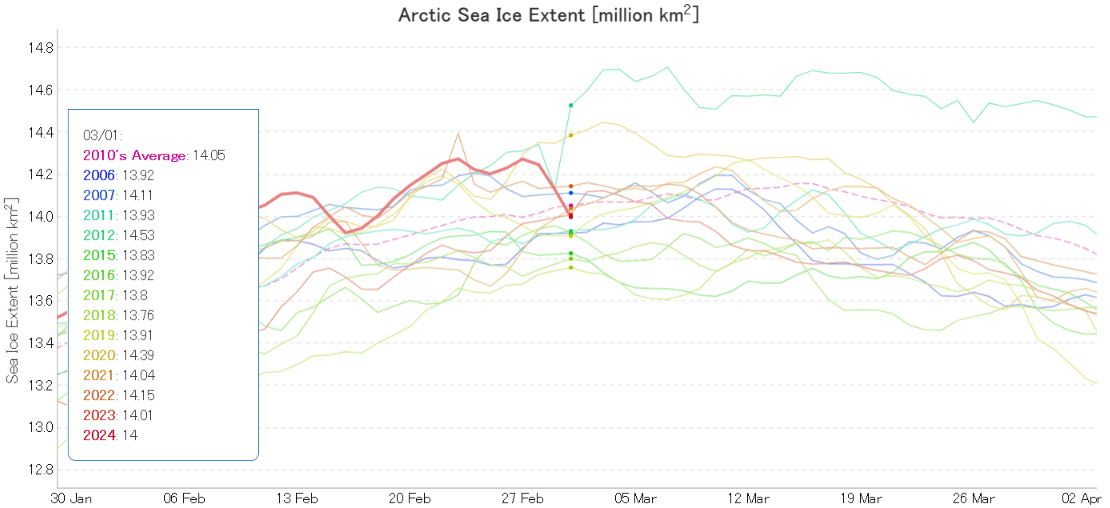
It looks as though the 2024 Arctic sea ice melting season has begun. For much greater detail see the 2024 maximum extent thread. However, here’s the latest JAXA Arctic sea ice extent graph:
Here too is an animation of sea ice motion on the Atlantic periphery, showing the effect of the passage of several Arctic cyclones through the area over the past 5 weeks or so:
My usual start of month processing hasn’t gone according to plan. Thanks to Lars Kaleschke at the Alfred Wegener Institute for the following information:
SMOS went into safe mode on 22 February 2024 at 05:10 UTC for reasons that are still under investigation.
The spacecraft has been back in nominal mode since 25 February 2024 and on 27 February 2024, the MIRAS instrument was switched on and is currently performing well.
The reload of the nominal acquisition planning is underway, and if all science data quality checks are positive, nominal data production and dissemination will resume in the coming days.
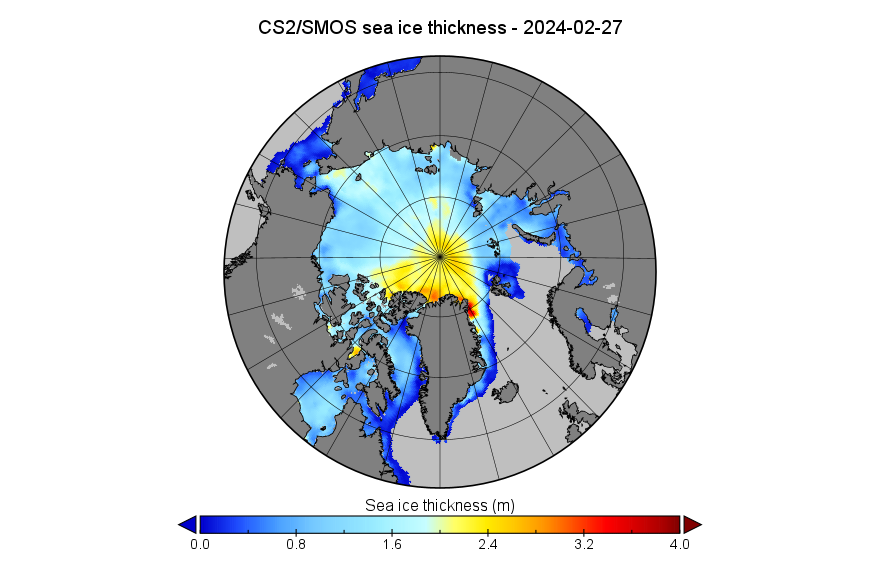
Hence here is the latest currently available CryoSat-2/SMOS merged near real time Arctic sea ice thickness map:
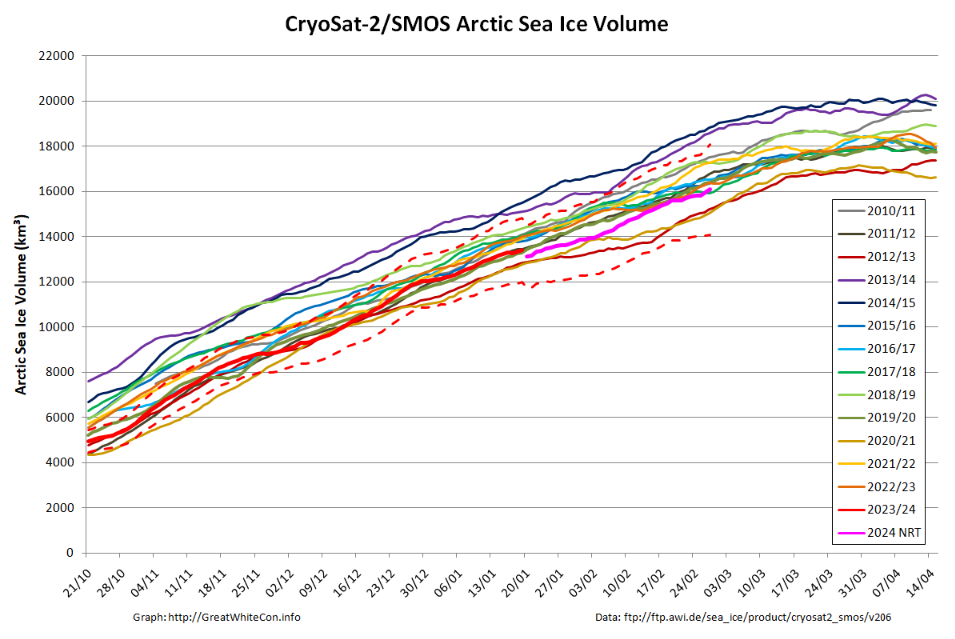
and the associated volume graph:
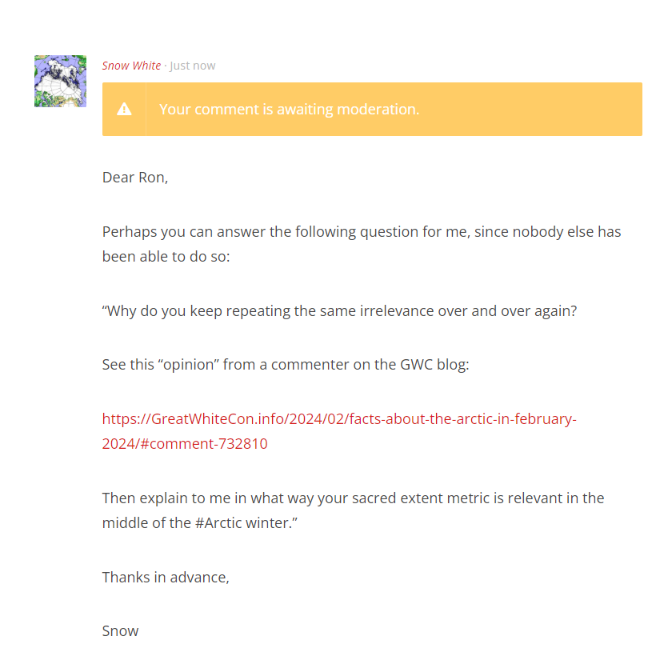
For comparison purpose here too are the PIOMAS “modelled” equivalents, this time dated February 29th:
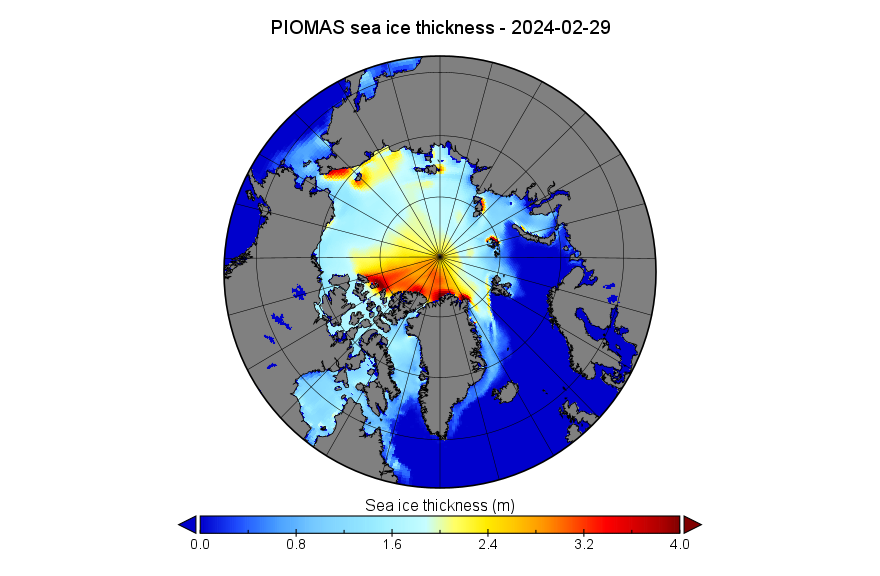
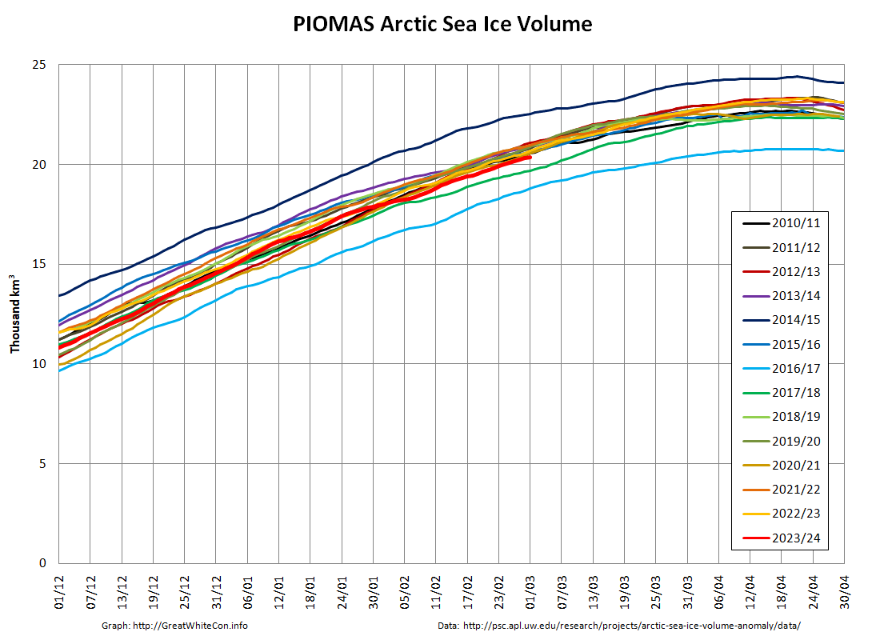
PIOMAS volume is still 3rd lowest in the satellite era by a whisker.
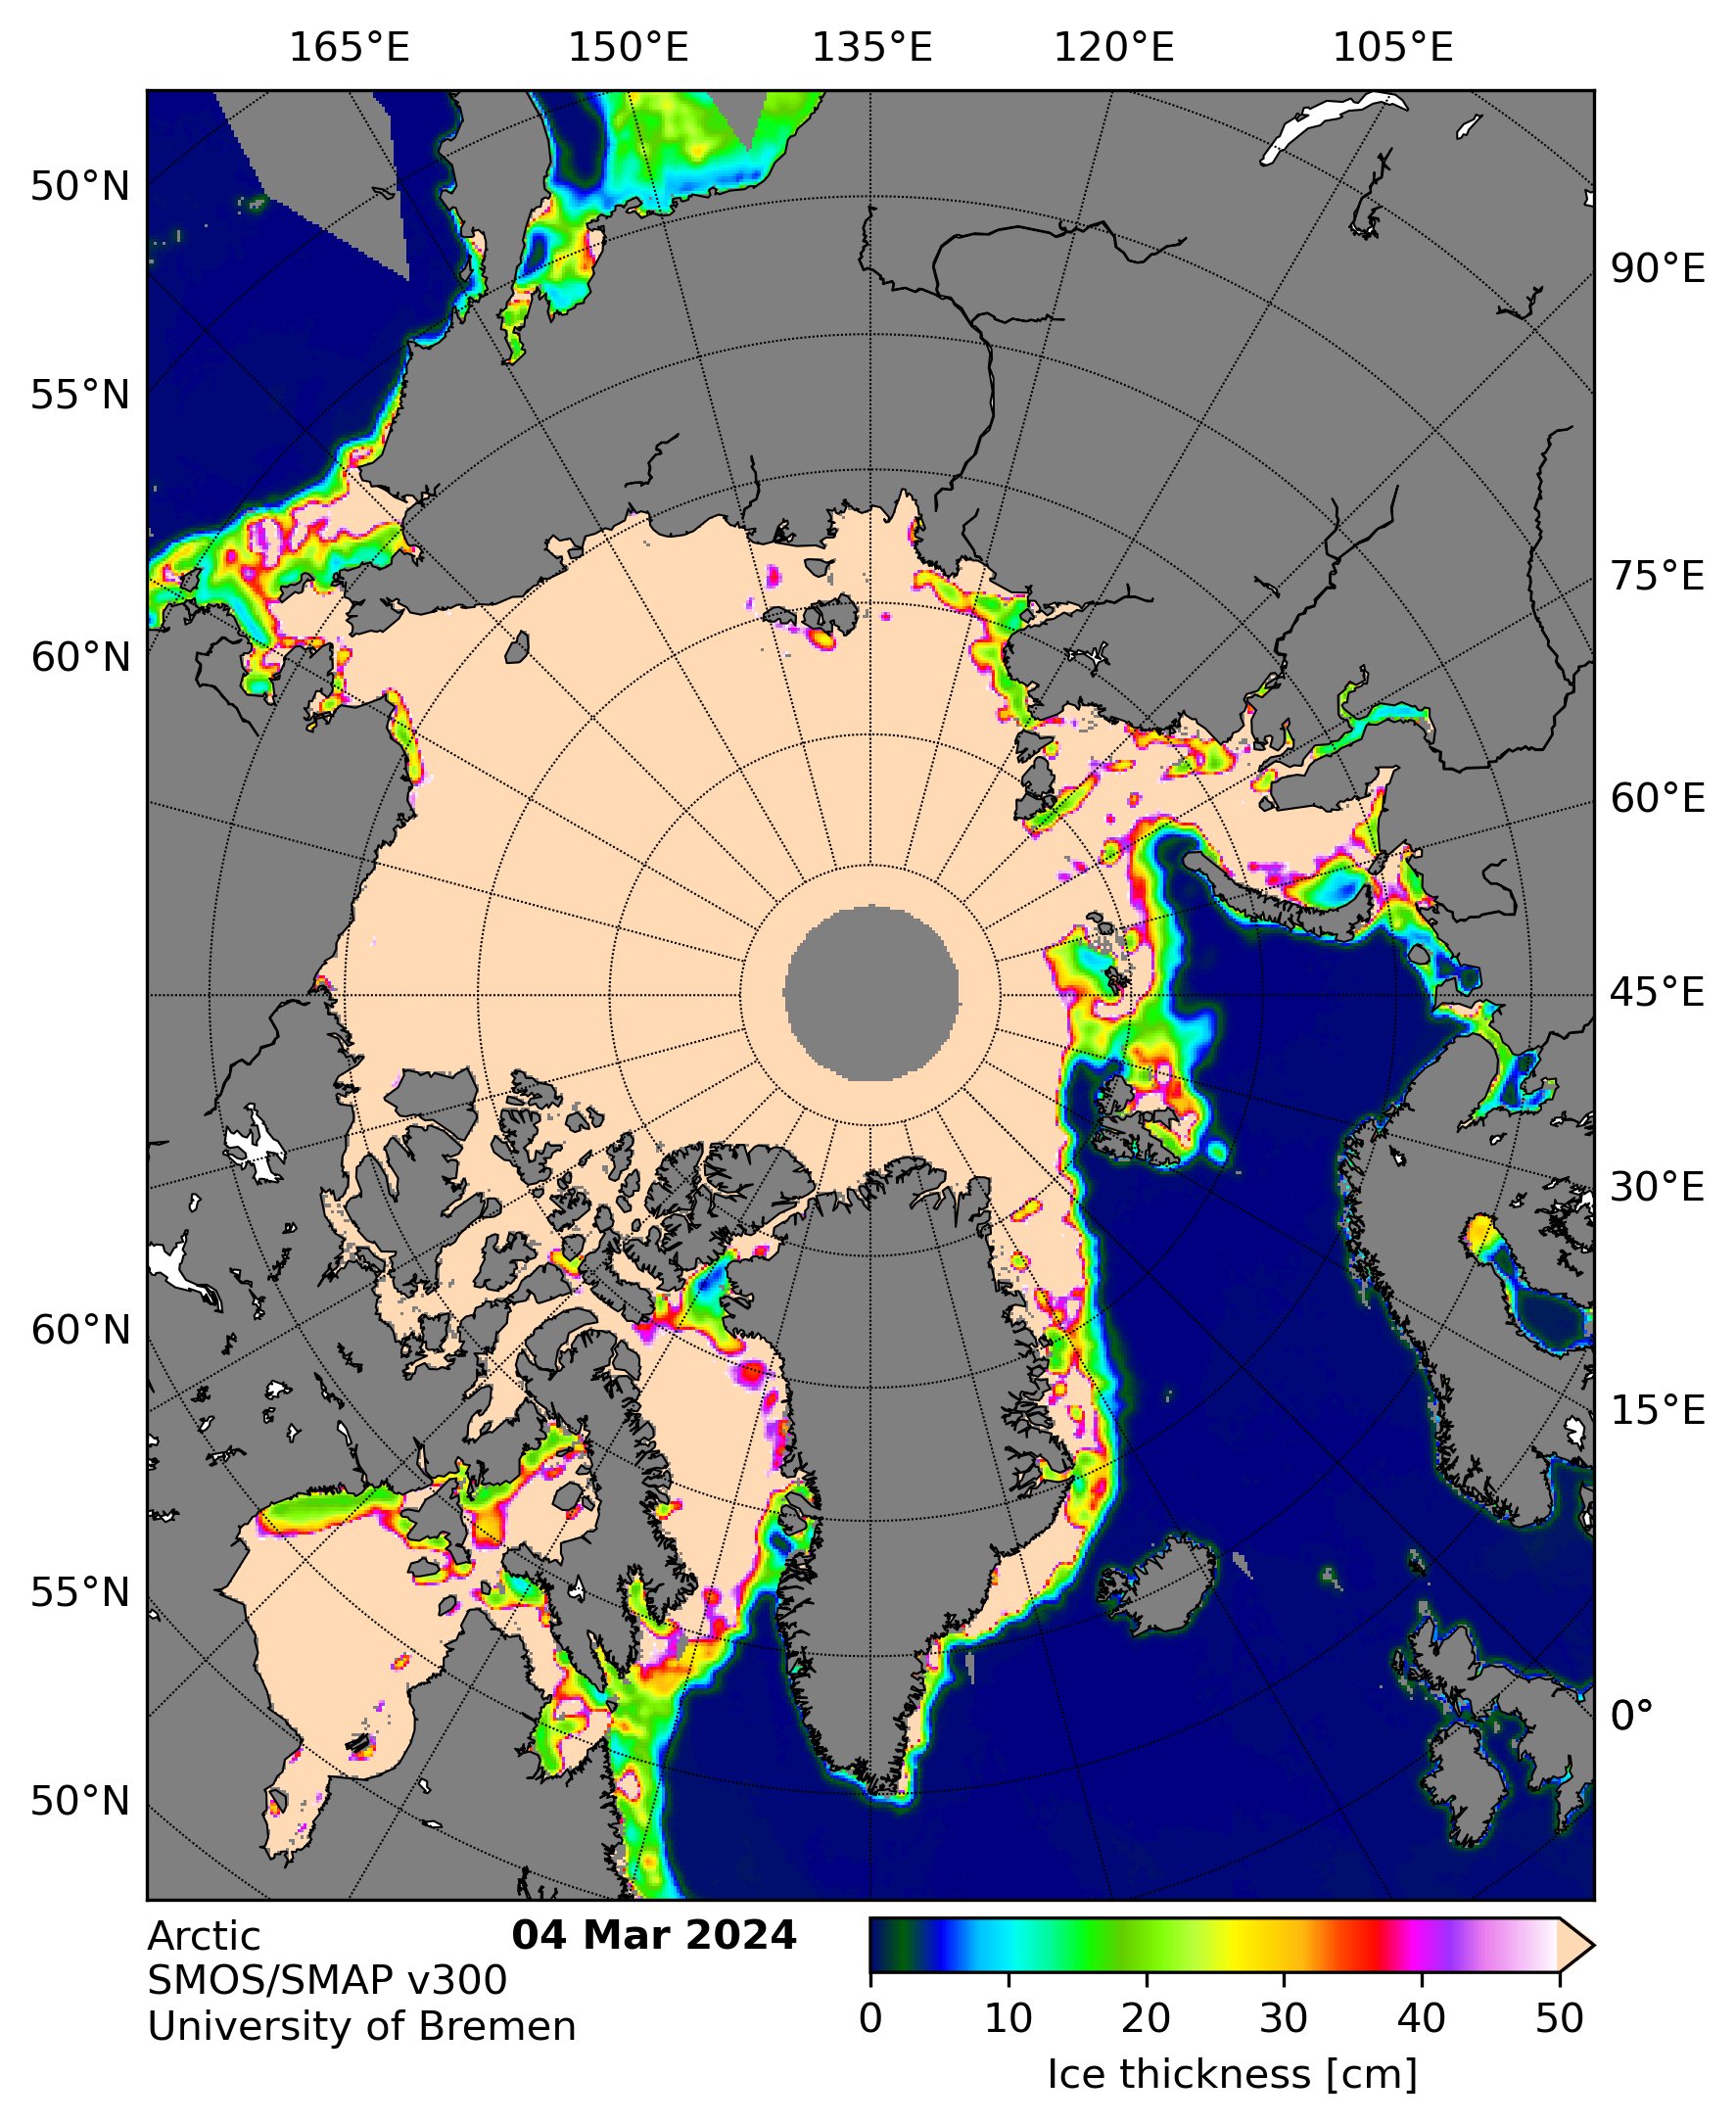
[Update – March 5th]The University of Bremen tell me that SMOS went back in to “safe mode” on Sunday.
Despite the label, this graph was generated using SMAP data only:
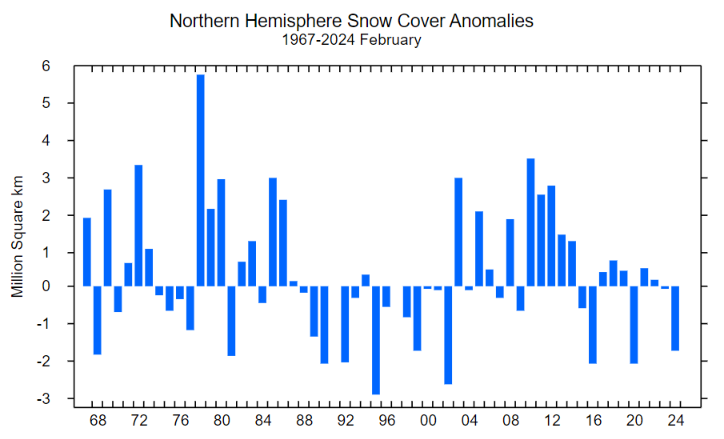
The February Rutgers Global Snow Lab anomaly chart has been published:
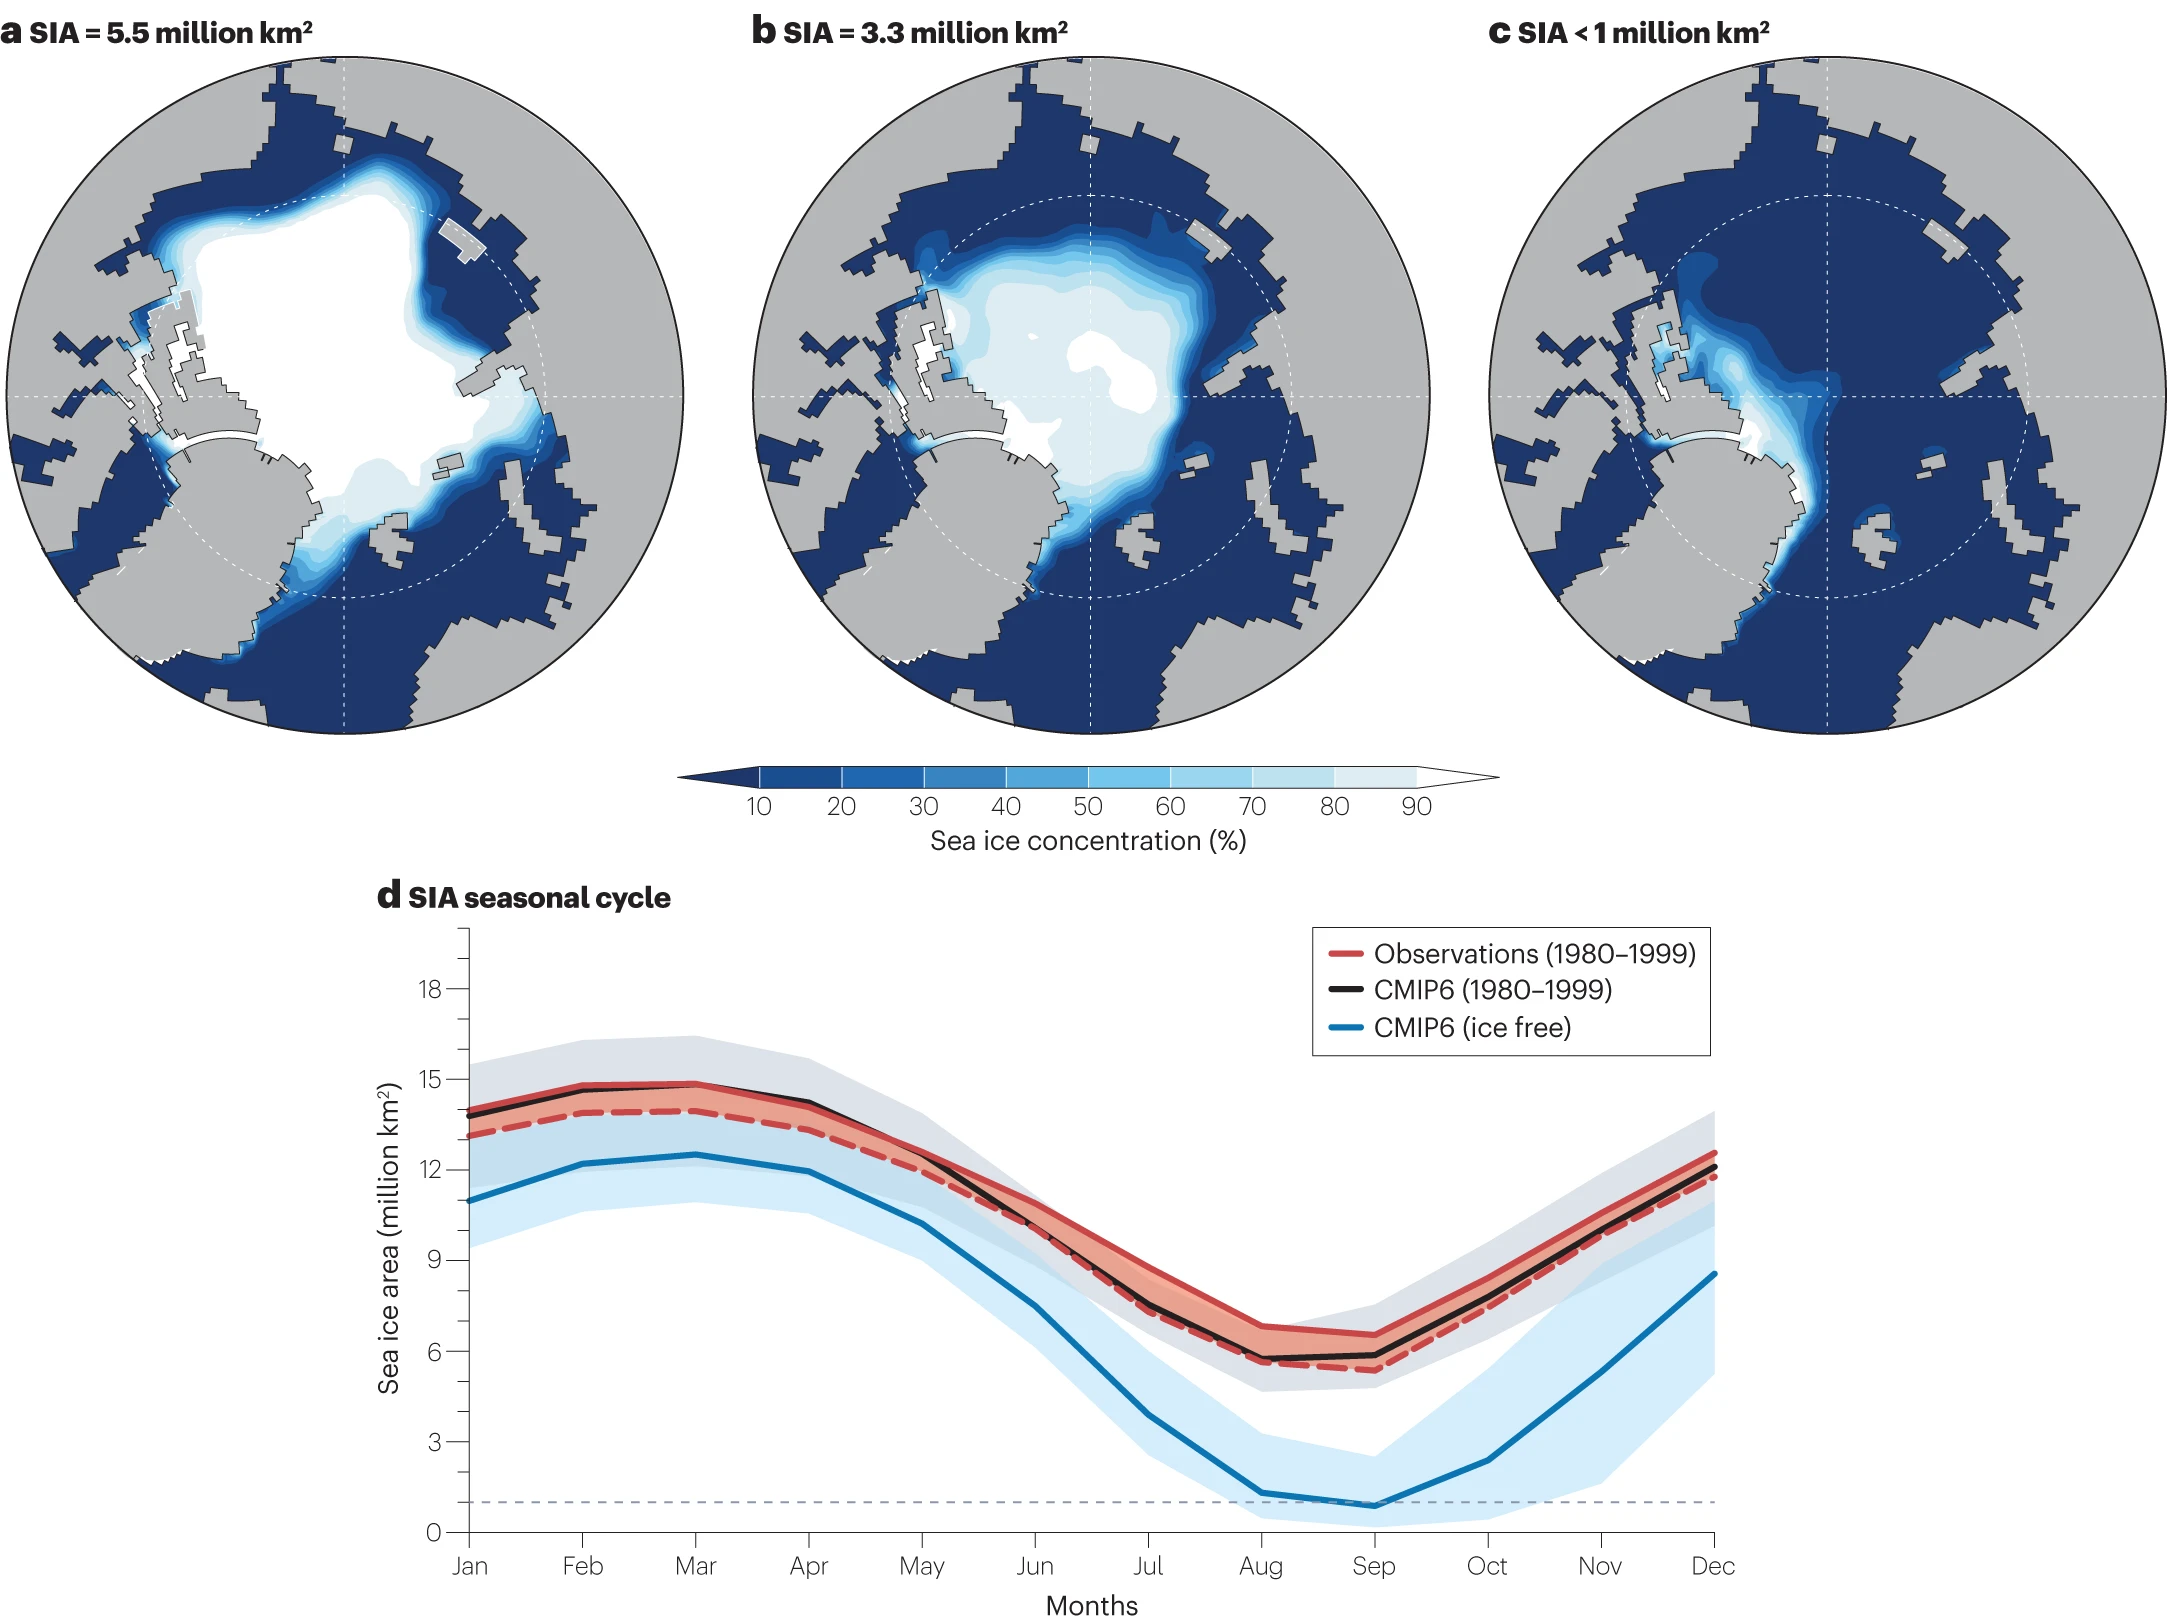
A new review paper is causing much excitement in certain quarters of the cryodenialosphere. According to the abstract of “Projections of an ice-free Arctic Ocean” in Nature Reviews:
Observed Arctic sea ice losses are a sentinel of anthropogenic climate change. These reductions are projected to continue with ongoing warming, ultimately leading to an ice-free Arctic (sea ice area <1 million km2). In this Review, we synthesize understanding of the timing and regional variability of such an ice-free Arctic. In the September monthly mean, the earliest ice-free conditions (the first single occurrence of an ice-free Arctic) could occur in 2020–2030s under all emission trajectories and are likely to occur by 2050. However, daily September ice-free conditions are expected approximately 4 years earlier on average, with the possibility of preceding monthly metrics by 10 years. Consistently ice-free September conditions (frequent occurrences of an ice-free Arctic) are anticipated by mid-century (by 2035–2067), with emission trajectories determining how often and for how long the Arctic could be ice free. Specifically, there is potential for ice-free conditions in May–January and August–October by 2100 under a high-emission and low-emission scenario, respectively. In all cases, sea ice losses begin in the European Arctic, proceed to the Pacific Arctic and end in the Central Arctic, if becoming ice free at all. Future research must assess the impact of model selection and recalibration on projections, and assess the drivers of internal variability that can cause early ice-free conditions.
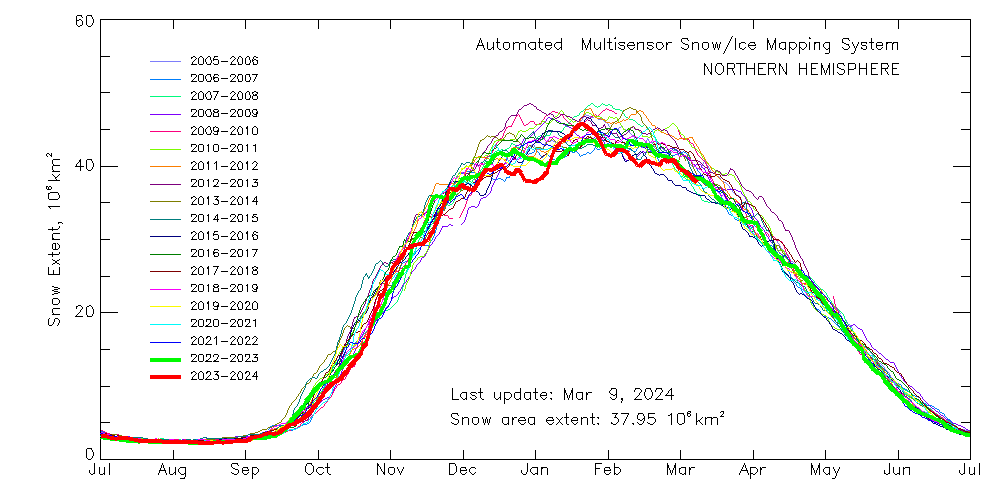
Since Matt has graced us with his presence once again, here too is the latest Multisensor NH snow extent graph:
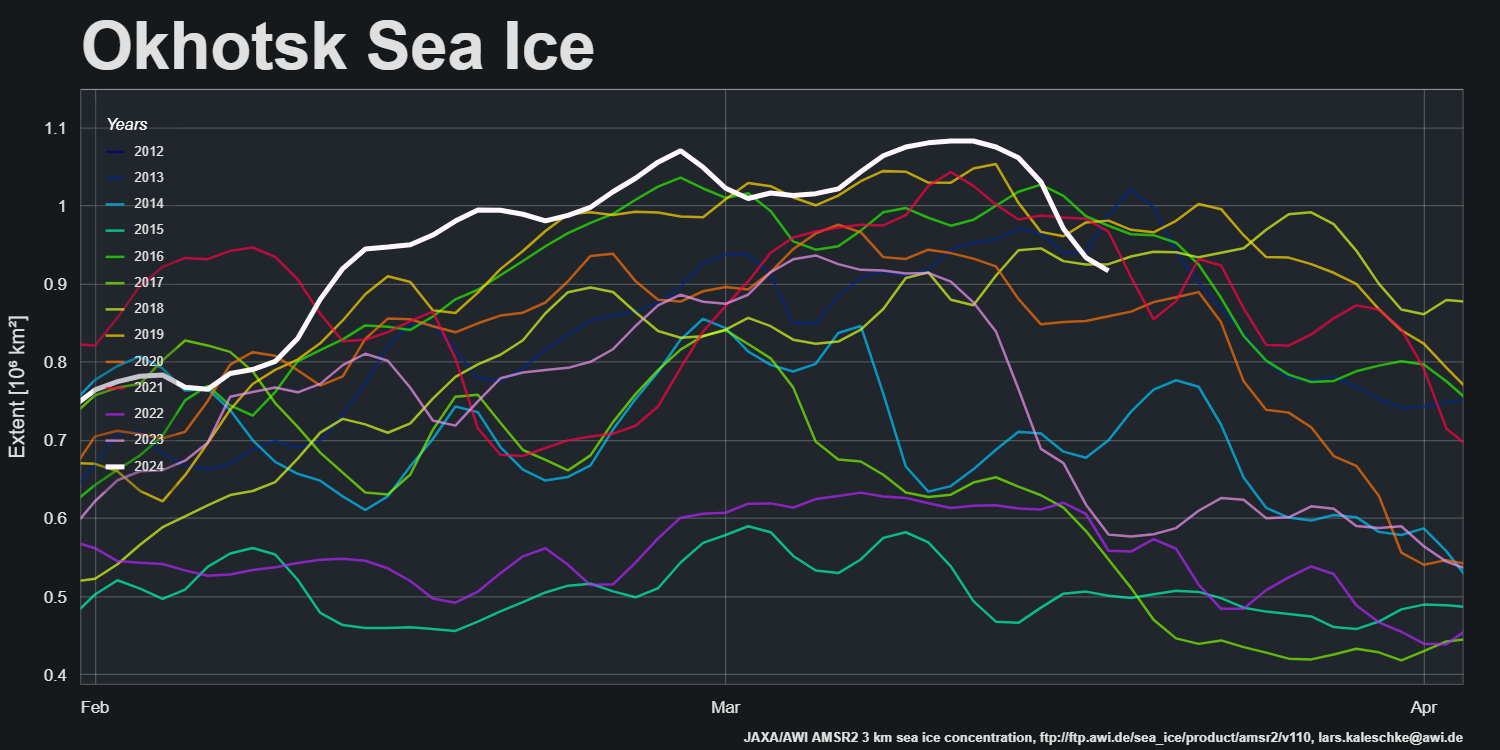
The sea ice extent in the Sea of Okhotsk, has finally taken a bit of a tumble:
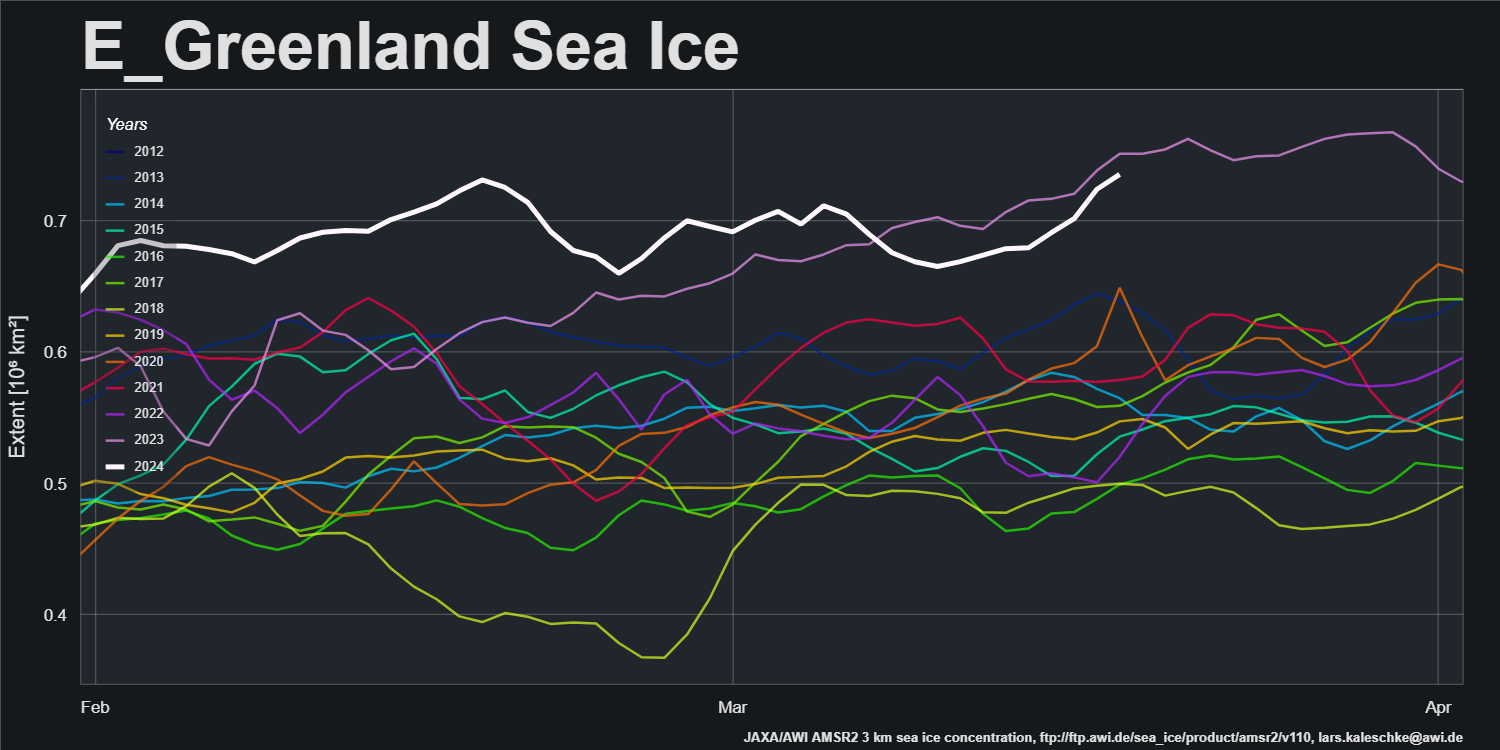
Meanwhile shark jumping climate clown Tony Heller claims that the thick ice exiting the Arctic Ocean via the Fram Strait to melt out in the far North Atlantic is “largely meaningless”:
whilst Ron Clutz eponymously refuses to answer a simple question:
The mid month PIOMAS gridded thickness data has been released. Volume is currently 4th lowest in the post 1979 record:

Here too is the PIOMAS thickness map. There is still no thick ice in the Beaufort Sea, and the sun has peeked above the horizon at the North Pole :
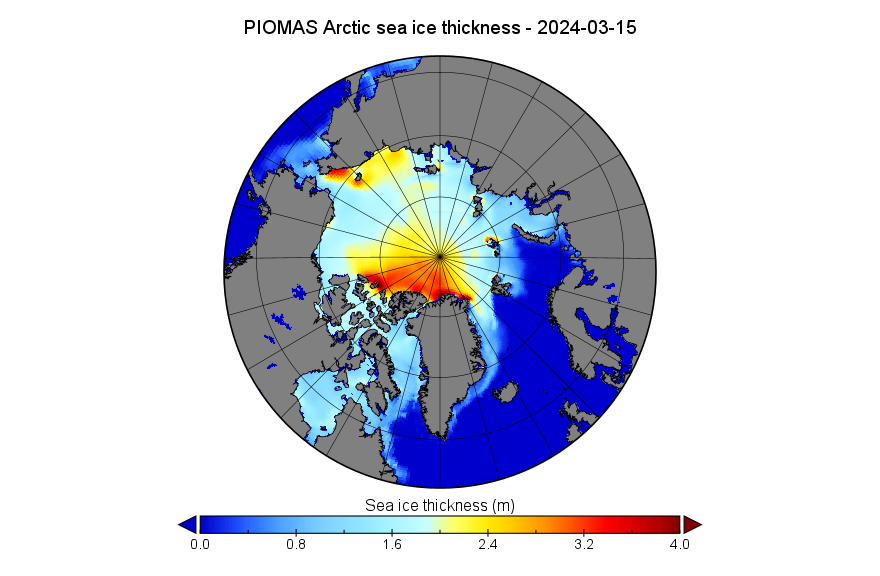
The feed of near real time CryoSat-2/SMOS data has just restarted after the recent problem with the SMOS satellite. Hence the gap on the volume graph:

Here’s the CS2/SMOS thickness map for March 16th, the day the feed restarted:
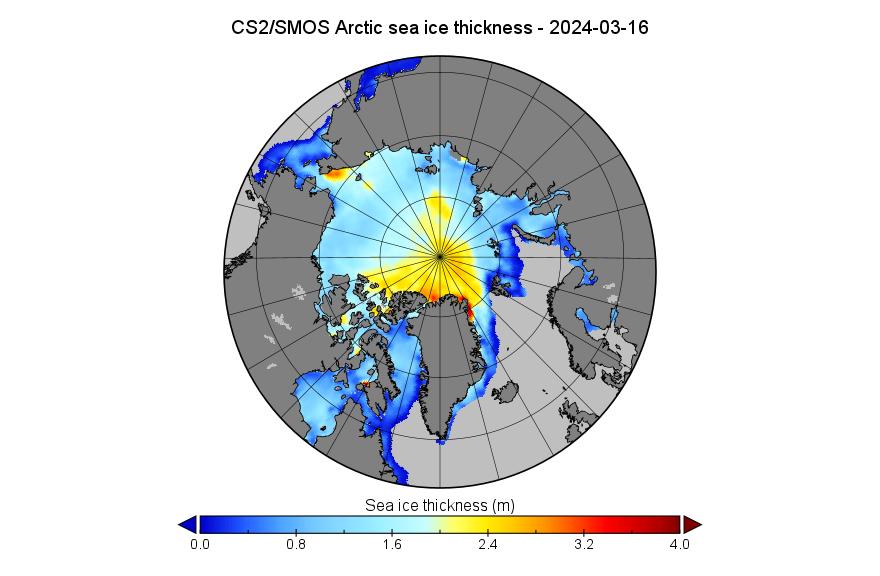
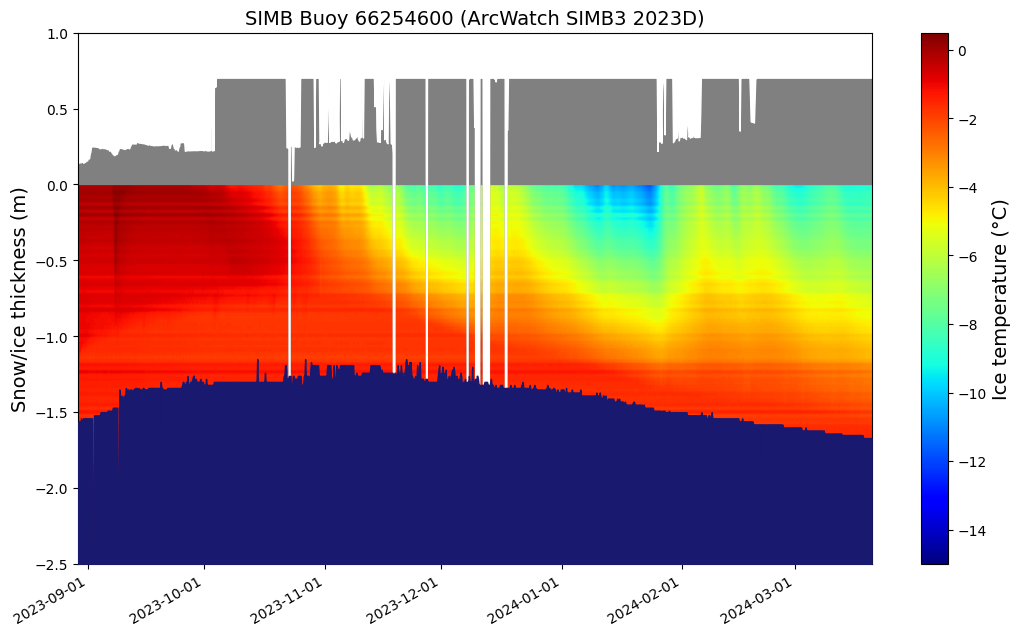
Ice mass balance buoy 2023D has been floating around the central Arctic all winter. It’s current position is 59.85 E, 87.93 N, and the ice floe it’s on is still only 1.67 meters thick:
The conversation continues over on the April open thread.
check out arctic-news blog – the 60 N latitude sea surface temperature kept climbing from January (70 F.) through February to new records and will keep climbing. Not surprising the volume is record low also.
Strictly speaking 0-60 N, 0-80 W for the “North Atlantic”, which has unsurprisingly been falling so far this year:
“Climate Reanalyzer registered a record high daily temperature of 21.2°C for the sea surface (60°S-60°N, 0-360°E) on March 3, 2024, with daily records going back to 1981. ”
that’s from the blog.
Sure, but it’s hard to imagine how abnormally warm surface water at 60S, 180E is going to adversely affect sea ice in the Arctic?
thanks for clarifying or hinting that it’s a global average. “For example, if World 60S-60N is selected, then each daily SST value on the chart represents the average of all ocean gridcells between 60°S and 60°N across all longitudes, and accounts for the convergence of longitudes at the poles.”
Well, I see PIOMAS is out, and for the last few years, our friends there have noted that the trend is roughly zero for the past 13 years.
As much as you’re upset in this forum with those who challenge mainstream climate science, the fact remains that predictions on the health of the Arctic (and its polar bear inhabitants) have been profoundly wrong. Are there recent papers which do not have these issues, and, if so, what are the new predictions that you now support?
Hello again Taylor,
In actual fact PIOMAS has been “out” for a few days. See above.
As I keep on pointing out, apparently necessarily ad infinitum, there are some ancient papers that “do not have these issues”. Here you go, yet again:
https://GreatWhiteCon.info/2022/02/facts-about-the-arctic-in-february-2022/#comment-544708
Which “recent papers” have “the issues” to which you refer? And in particular, what do the IPCC reports and their extensive reference lists have to say on the matter?
Funny you should ask, Jim! I note with interest this very recent survey paper in Nature. Although all comparison model runs use a form of RCP 8.5, the predictions are truly all over the map. Here’s a summary table from the piece. As you can see, the science is hardly ‘settled’.
https://www.nature.com/articles/s43017-023-00515-9/tables/1
I am astounded that they continue to use RCP 8.5
These are some of its assumptions
We do not use any natural gas ONLY coal,
We do not use any nuclear power ONLY coal,
We do not use any wind and solar ONLY coal.
All cars continue to run on petrol & diesel
In other words we ONLY use oil & coal
By 2100 it assumes we will be using 6 times more coal than we are using at present !!
This is a WORST POSSIBLE CASE and just won’t happen!
Yet they continue to call it “business as usual”
Taylor – That’s the paper I reported on just above. Perhaps you might try scrolling up from time to time?
Neil – Contrary to the disinformation you may have read in numerous places elsewhere on the worldwide interweb, the paper in question is a review paper and discusses all sorts of “scenarios”, including SSP1–1.9 to SSP5-8.5 for CMIP6. See for example:
Evidently it will surprise you to learn that it does not mention the word “business”, let alone the phrase “business as usual”.
Thanks very much Jim.
I always follow your recommendations.
I will read the full report.
I was of course referring to the table which Taylor refers to.
https://www.nature.com/articles/s43017-023-00515-9/tables/1
I notice they were careful to refer to RCP 8.5 as “the high-emission scenario”
My pleasure Neil.
Jim,
My apologies – I was responding to your question without reading the entire post. Unfortunately I have to respond here, since replies aren’t enabled for your comment.
Interesting though that the graphs you posted show RCP 1.9 as having the a strong probability of early ice-free conditions. I suspect this is a typical flaw in a survey paper. Likely there were a lot more runs with 8.5, so that might have led to a broader set of results.
Two other quick comments
1. Agree completely with Neil. Reviewers should reject any papers which base any conclusions on it.
2. The paper refers to ‘selected models’. I wasn’t clear how they were selected, except that some models apparent produce nonsensical results on Arctic Ice. I wonder if those ‘non-selected’ models also produce other nonsensical results? I also wonder if the selected models also produce reasonable results on the rest of the globe? This does not inspire confidence…
I’m afraid you’ve lost me Taylor.
“Agree completely with Neil. Reviewers should reject any papers which base any conclusions on it.”
When did Neil say anything even approximating that?
What’s more it’s a “review paper” including a list of 141 references. The bit about “selected models” is from reference 10. Should reviewers reject any papers than mention that one as well? And also reject any papers that mention any of the long list of references?
My agreement with Neil (essentially) is that RCP8.5 and its equivalents is junk, and only designed to produce results that scare the kids. I added my opinion that papers which rely for their conclusions on RCP8.5 are junk science and should be rejected by reviewers.
Thanks for expanding on your point. I do at least see what you were getting at now.
However RCP8.5 wasn’t “designed to produce results that scare the kids”. Here is a very verbose explanation about what it was actually designed for:
“The creators of RCP8.5 had not intended it to represent the most likely “business as usual” outcome, emphasising that “no likelihood or preference is attached” to any of the specific scenarios. Its subsequent use as such represents something of a breakdown in communication between energy systems modellers and the climate modelling community.
While modelling potential worst-case outcomes is important, there is also a need to examine the wider range of no-policy baseline outcomes – the majority of which result in lower future emissions.”
“ Its [RCP8.5] subsequent use as such [business as usual scenario] represents something of a breakdown in communication…”. Call me a cynic, but I believe some of that ‘breakdown’ is deliberate, since modeling lower emission, more realistic scenarios often doesn’t produce the kind of headline-grabbing results desired by activist segments of the climate community. Hence my ‘scare the kids’ comment.
The question is.. when will the maximum be achieved?
History would suggest soon, I’d say when that low pressure hits the Sea of Okhotsk!
New maximum. When will it start to melt?
Hi Matt,
Future such questions should be addressed to the dedicated 2024 maximum thread
In the meantime you seem like the perfect person to answer this question:
Why is your metric sacred during the height of summer when the minimum was over 12 years ago? Despite an apparent warming world, in which the arctic is warming four times faster.
1) I look at lots of different metrics Matthew, and none of them are sacred.
However when the sun is high in the sky in the High Arctic, sea ice area is a reasonable proxy for albedo. When the sun is below the horizon, albedo is irrelevant.
2) At the risk of repeating myself, here you go. Yet again:
https://GreatWhiteCon.info/2022/02/facts-about-the-arctic-in-february-2022/#comment-544708
Nahel Belgherze
@WxNB_
I can’t believe I’m actually writing this.
The North Atlantic sea surface temperature has been at record warm levels for an entire year now, setting daily record highs every day for 365 consecutive days and counting.
A report from the relevant part of Planet ‘A’!
Not exactly on topic, but I notice ice thickness for Nenana Ice Classic is 50 inches.
The ice on the river has not been so thick since 2013.
Expect a late breakout day
I think river ice is most definitely on topic Neil:
https://www.nenanaakiceclassic.com/ice
Back on the real world, there has been no significant change in average Arctic ice extent since 2008.
Hello again Peter,
Long time no see!
And as the DMI points out:
Your JAXA image above shows no change since 2006
And it continues to show that Arctic sea ice extent is still well below the same date in 2012. If you recall that year went on to record the lowest extent in the satellite record?
Since Neil, Matt and Ron still haven’t got around to it, perhaps you wouldn’t mind explaining at long last:
“In what way your sacred metric is relevant in the middle of the Arctic winter”?
Thanks in advance.
Well Peter himself has posted a graph illustrating the Arctic sea ices slow steady decline!
The relevance of high extent in the middle of winter?..
Every bit of ” extra extent” at this time of year is in seas that invariably melt out by the end of summer, even earlier… nearly all having drifted from the central Arctic.
Exactly 2012.. 12 years ago despite recent “global boiling”
[Irrelevant image redacted – Mod]
I suggest that you answer this question instead of posting irrelevant images:
https://GreatWhiteCon.info/2024/03/facts-about-the-arctic-in-march-2024/#comment-742940
I See you have now deleted 3 posts all of which were just data series.
[Repetition redacted – Mod]
I haven’t “deleted 3 posts” Peter.
You seem to have forgotten that all your comments are subject to moderation, not least because they are remarkably repetitive. As you yourself point out.
I suggest that instead of repeating yourself ad nauseam you answer this question:
https://GreatWhiteCon.info/2024/03/facts-about-the-arctic-in-march-2024/#comment-742940
How many mistakes (if that’s what they are) are you able to find? Source is University of Washington and their March sea ice volume update:
“March 2024 Monthly Update
Average Arctic sea ice volume in March 2024 was 22.4 km3. This value is the 4th lowest on record for March, about 1.8 km3 above the low record set in 2017 with a lot of recent years clustered around 22.5 km3.”
Whiff of Collapse, reading this.
yes thickness is really the key since the extent can hide the accelerating loss of ice and therefore even though volume is going down, it’s the thickness aspect that is the key factor.