“The time has come”, the Walrus said, “to talk of many things… Of why the sea is boiling hot, and whether pigs have wings“.
And also about the assorted different Arctic sea ice extent metrics, and in particular their respective maxima for 2024.
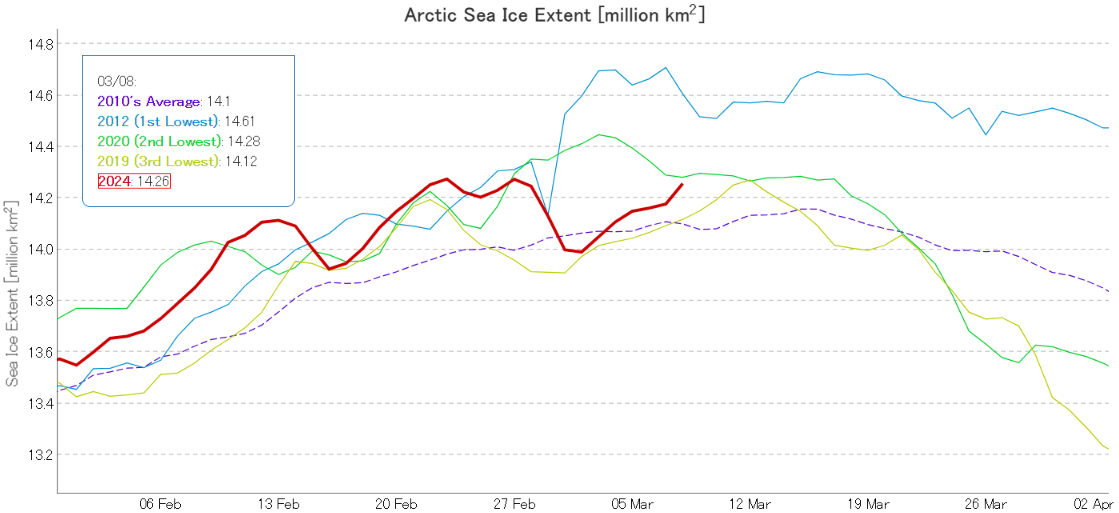
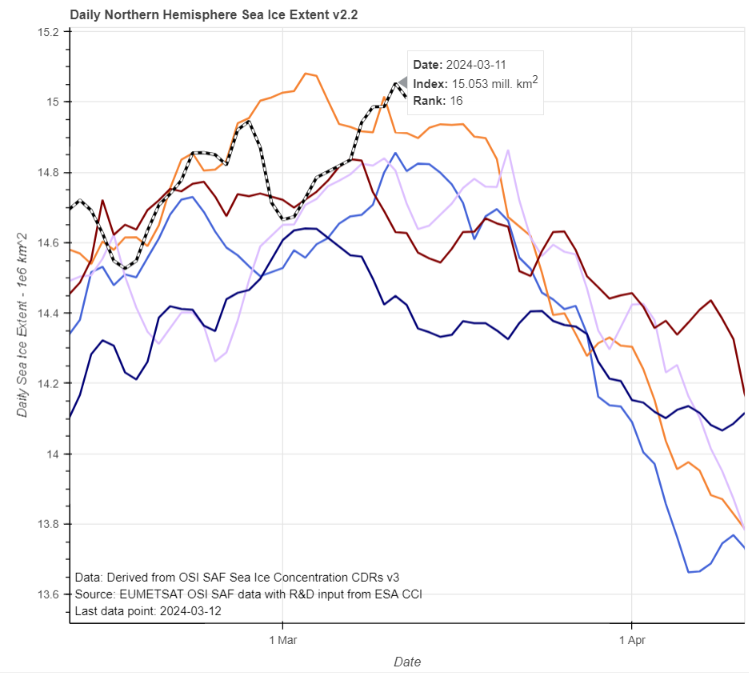
Here is Zack Labe’s overview of previous years’ maxima from a few days ago:
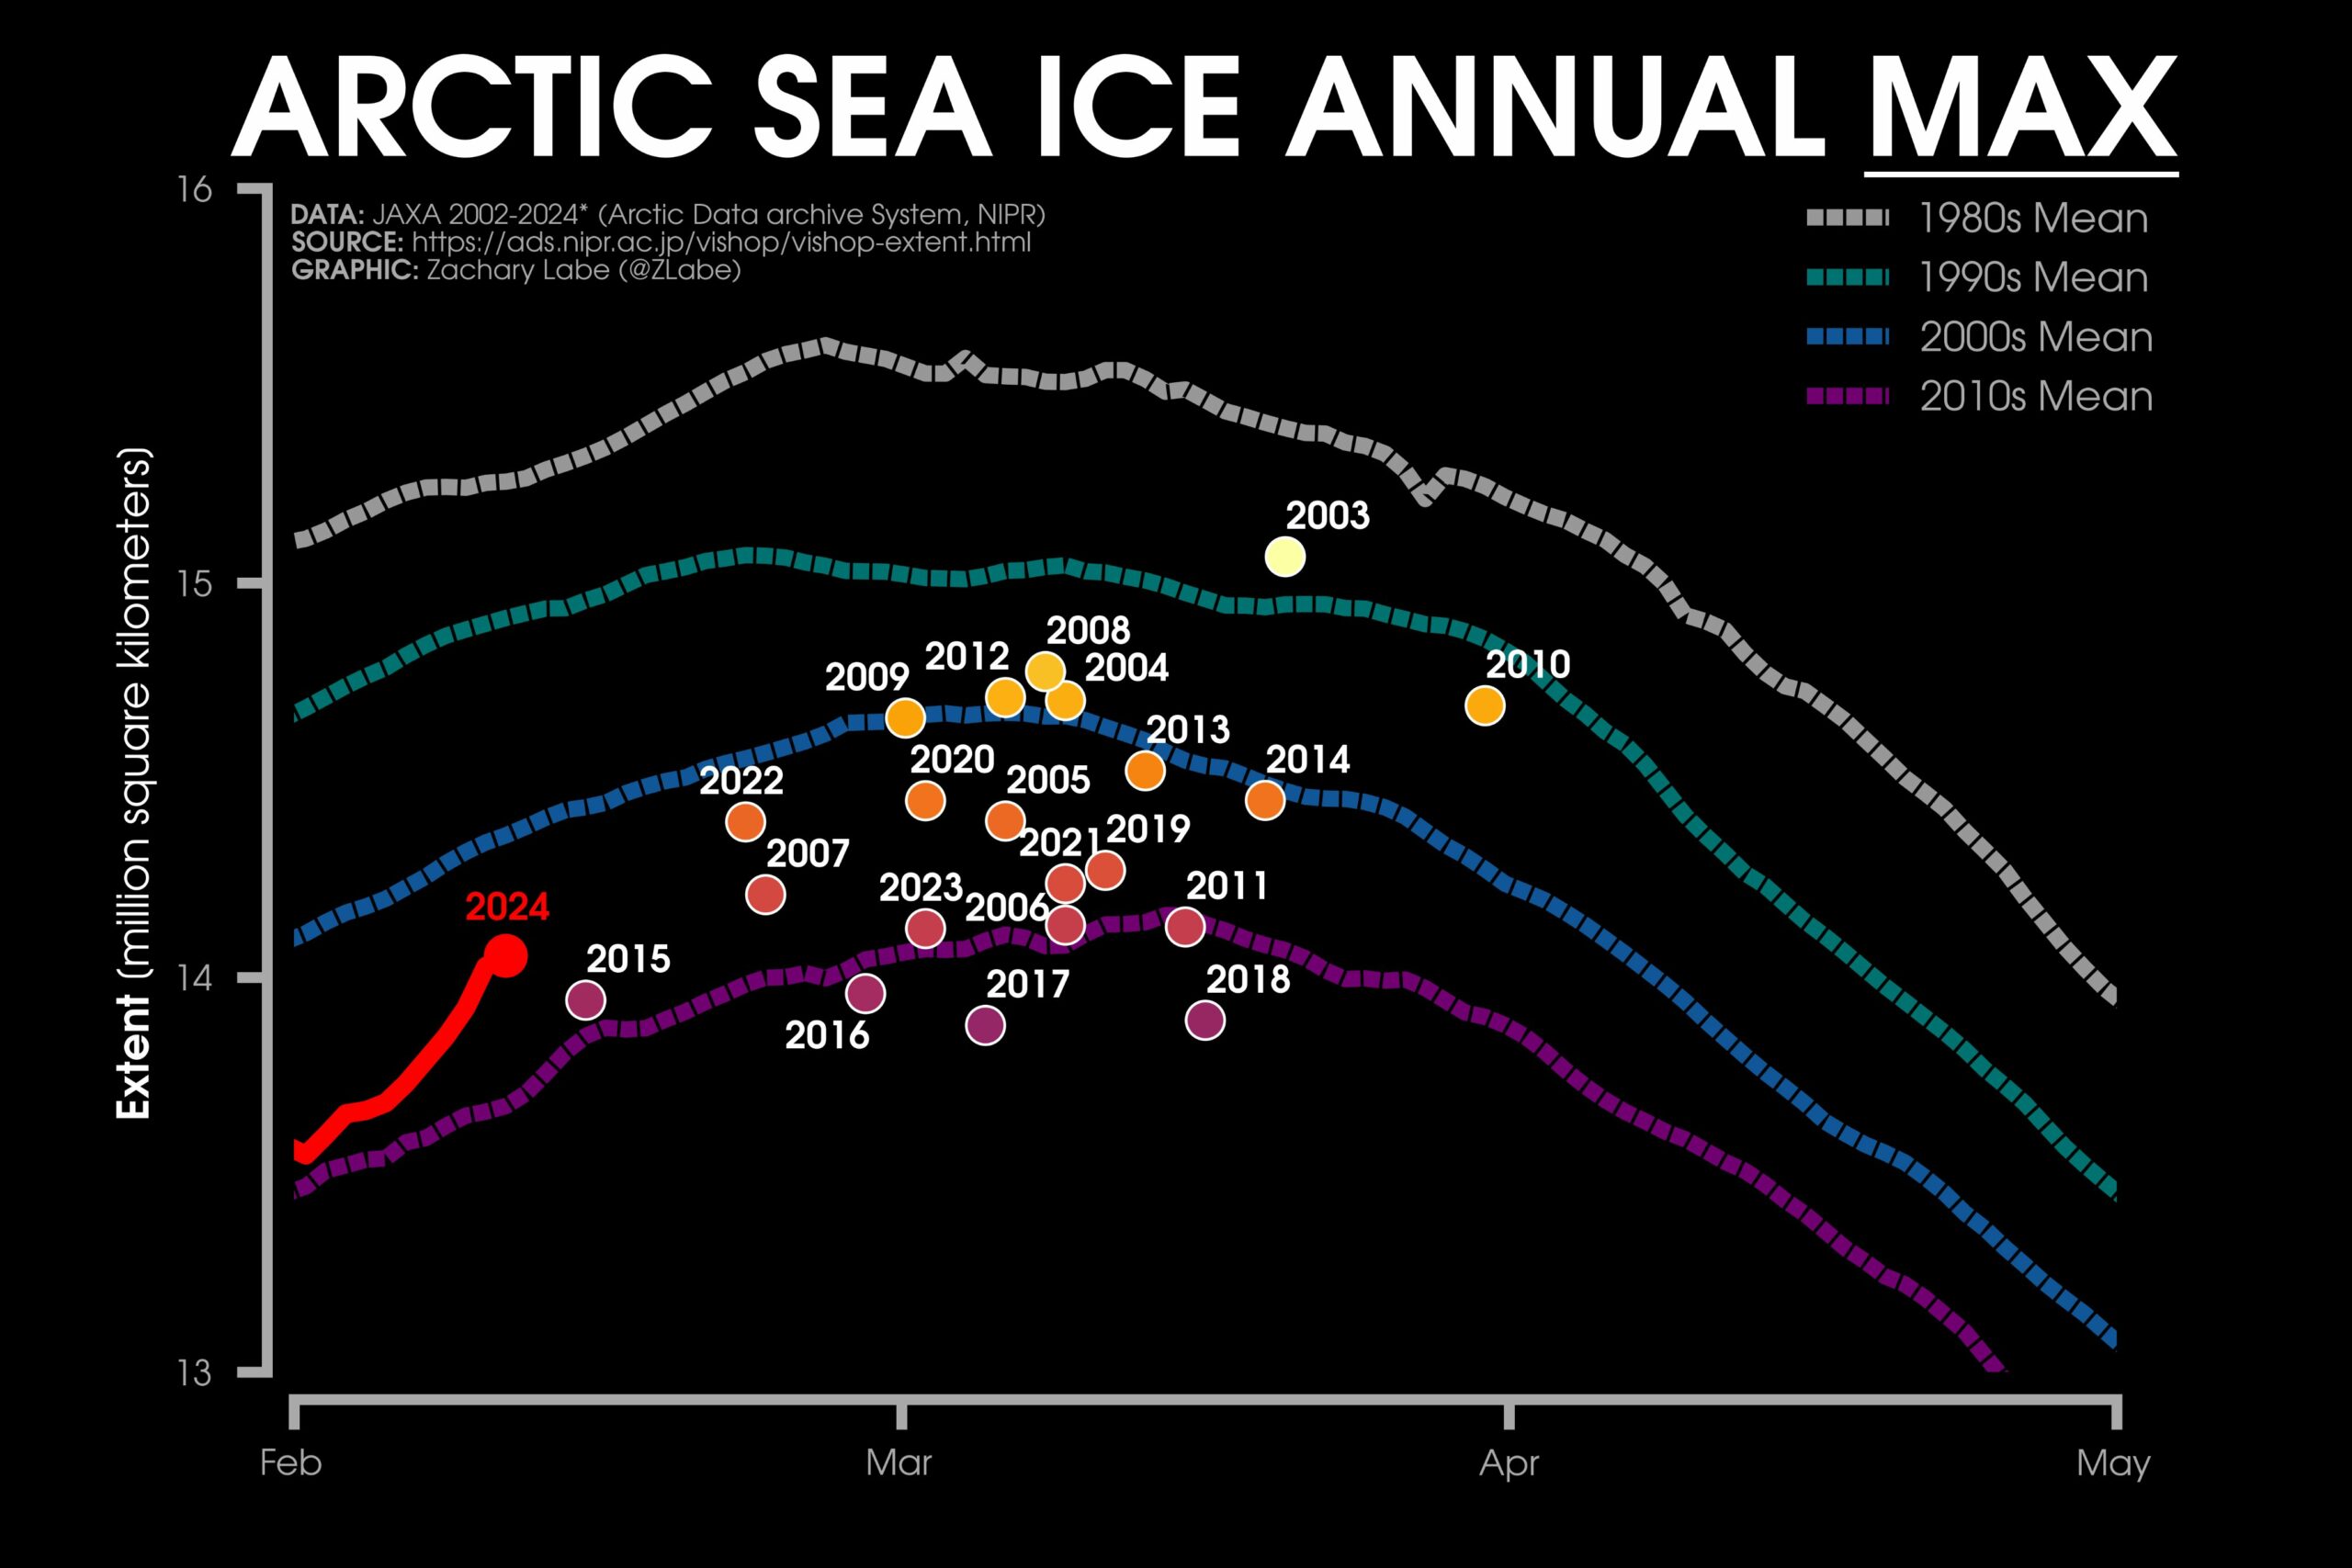
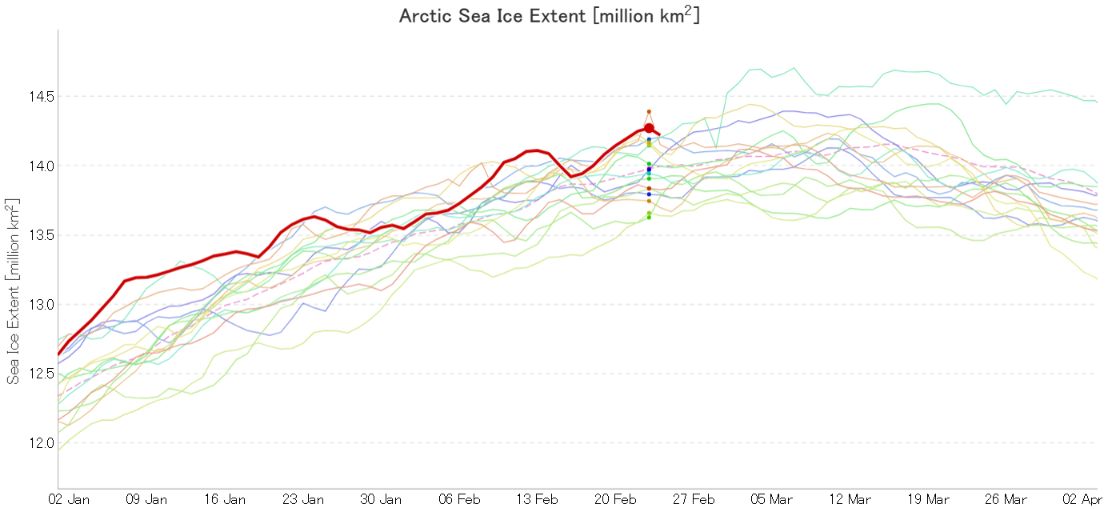
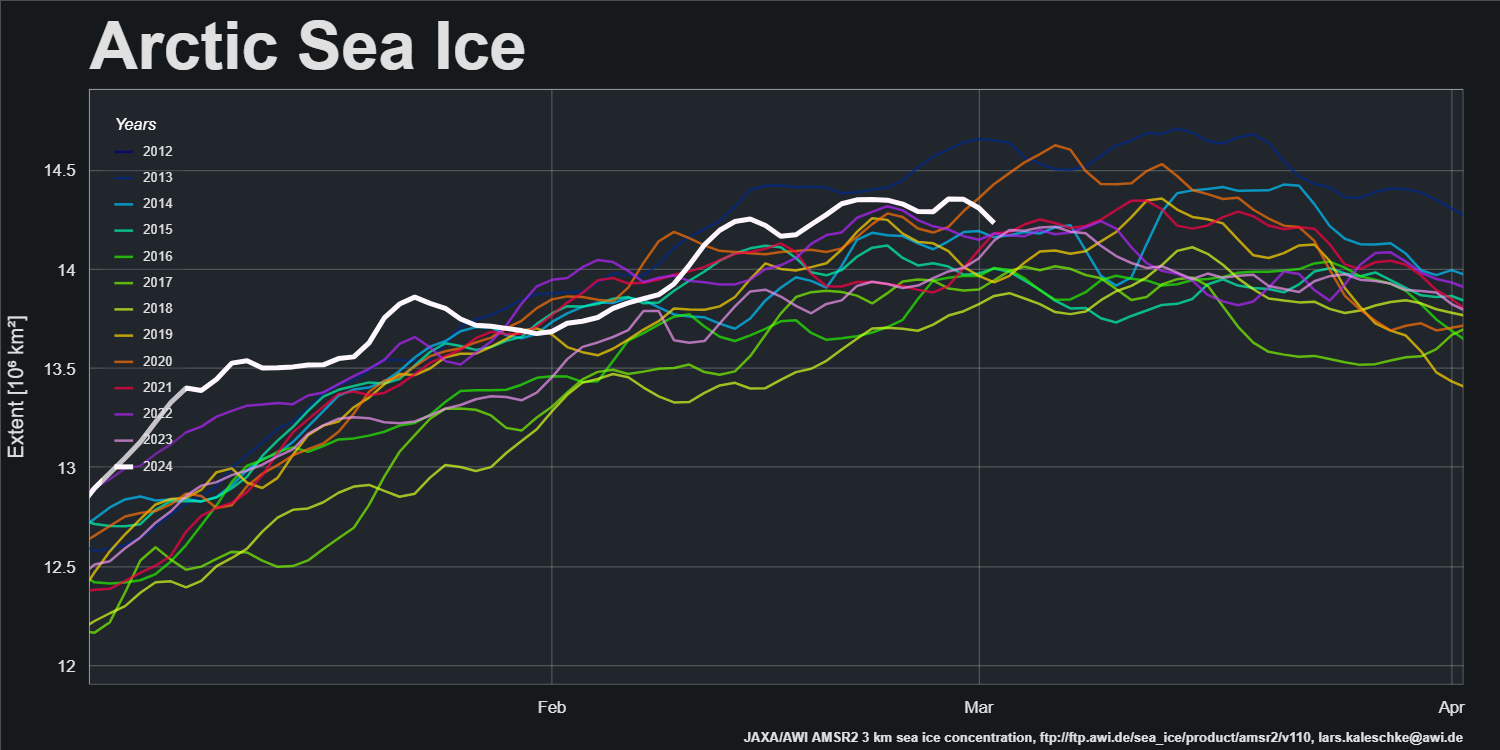
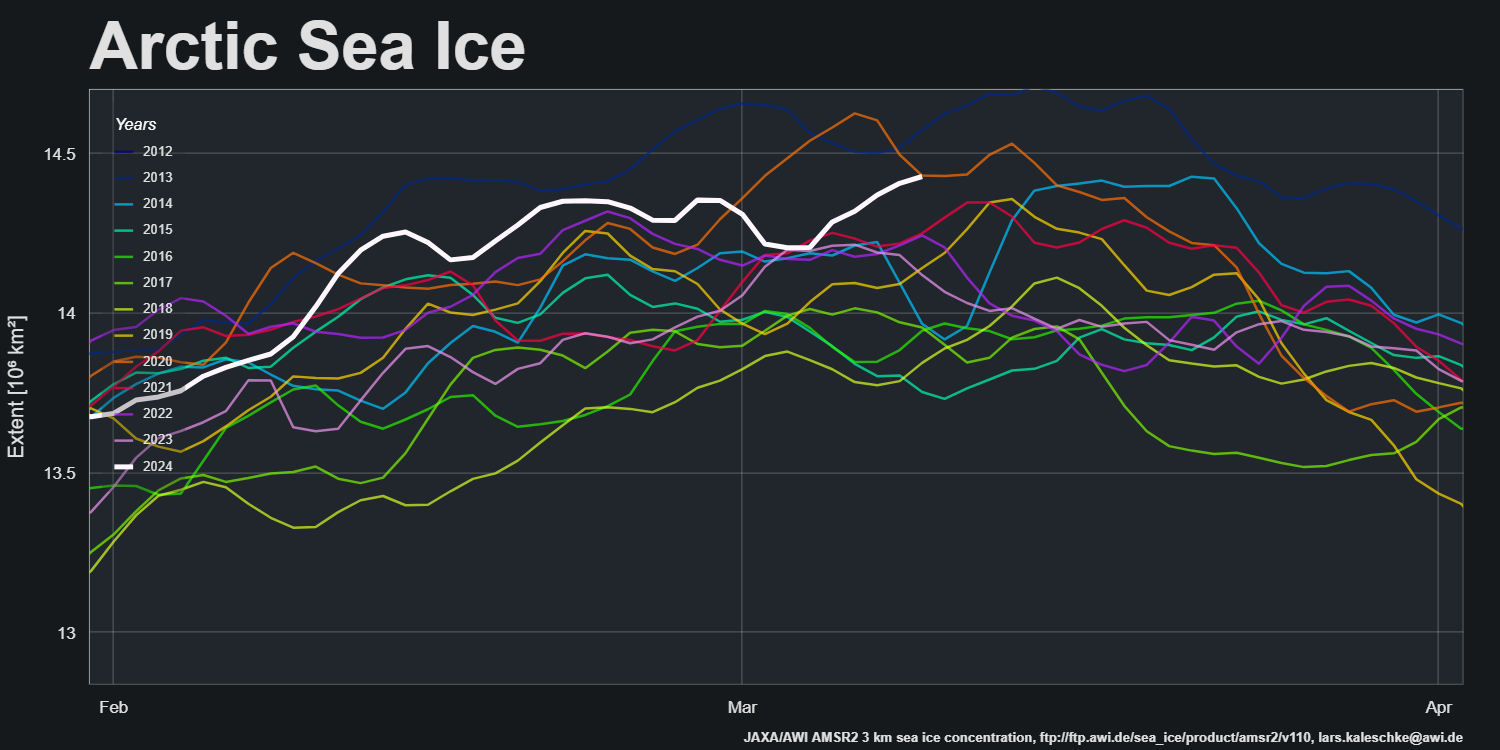
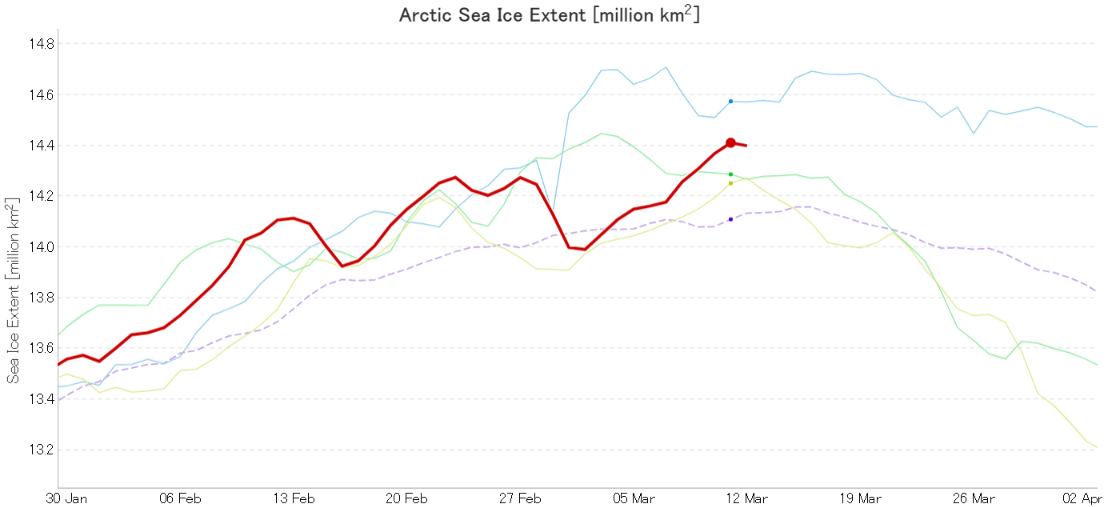
Zack’s graph displays the JAXA/ViSHOP version of Arctic extent, so here too is JAXA’s own graph of the current sea ice extent:
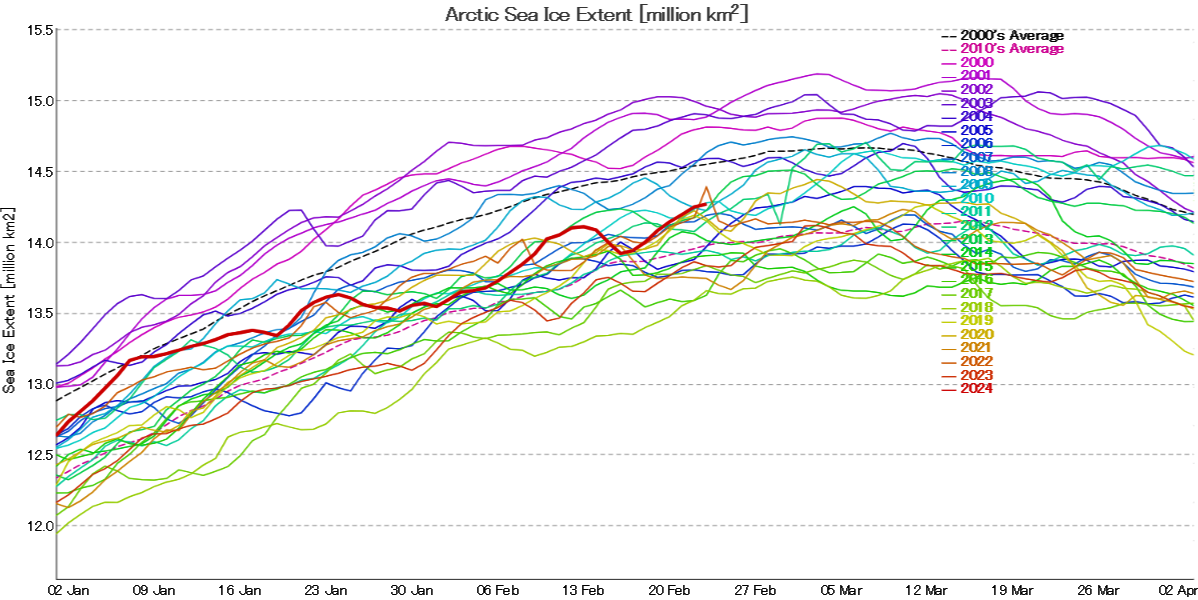
JAXA extent is based on data from the AMSR2 instrument on the GCOM-W satellite, and shows no evidence yet of a local maximum, let alone an annual one for 2024.
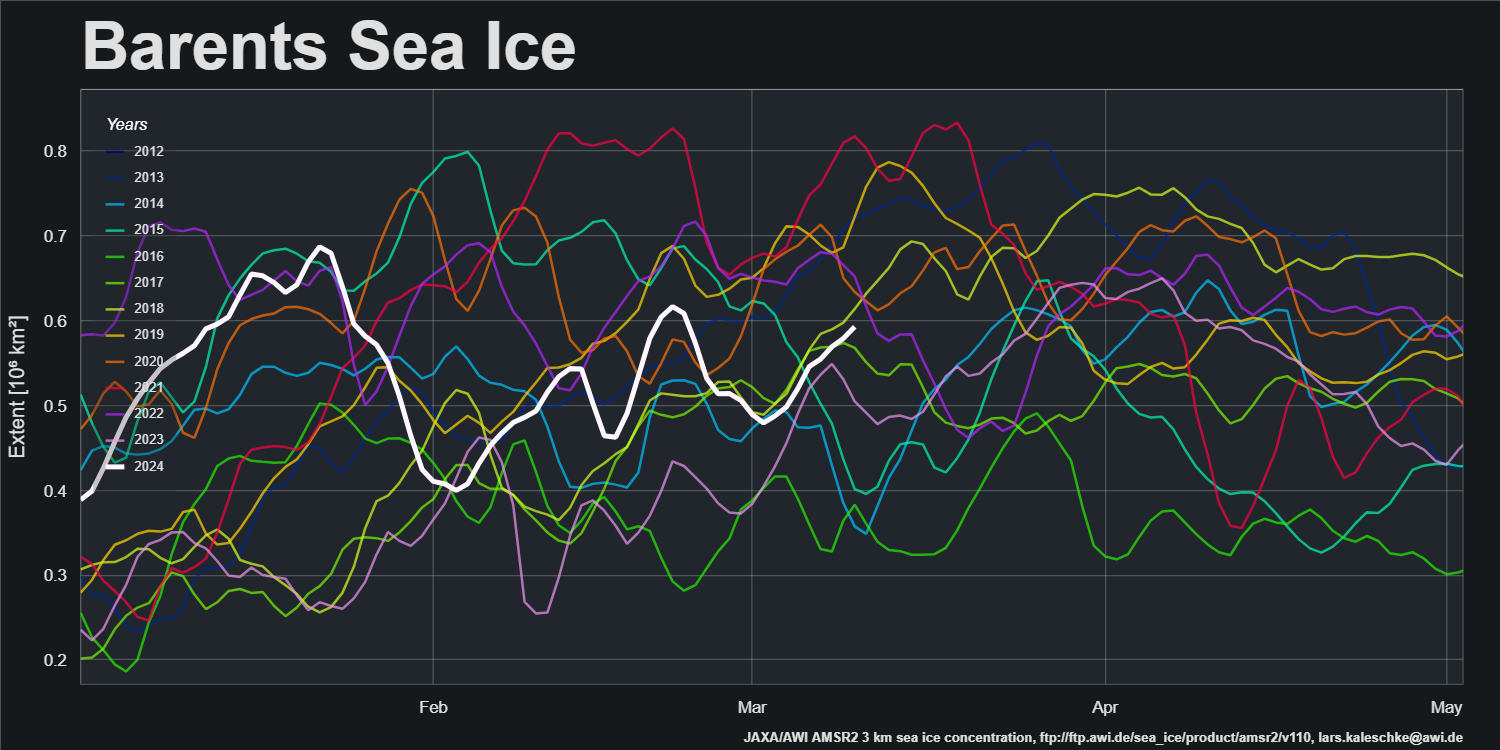
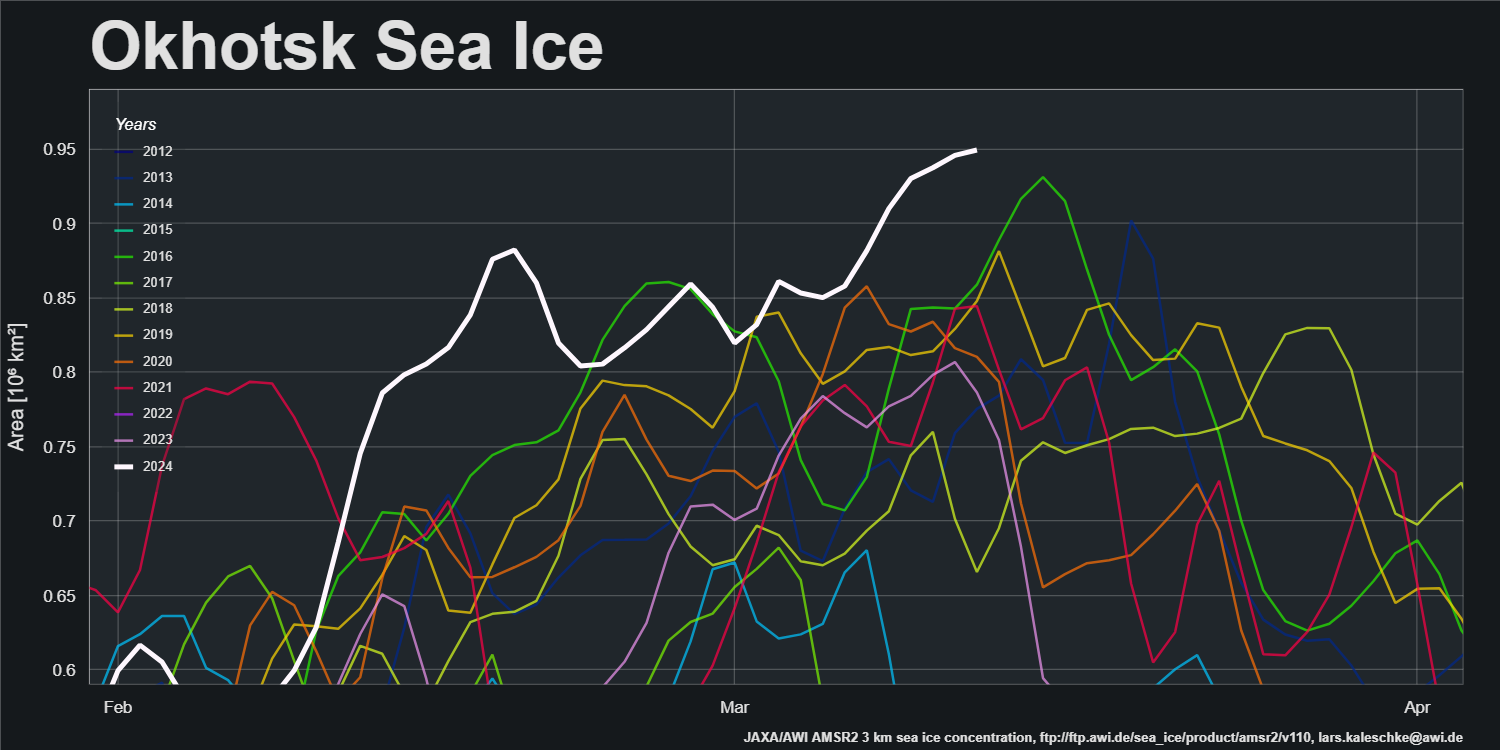
However see also AWI’s “high resolution” AMSR2 area metric:
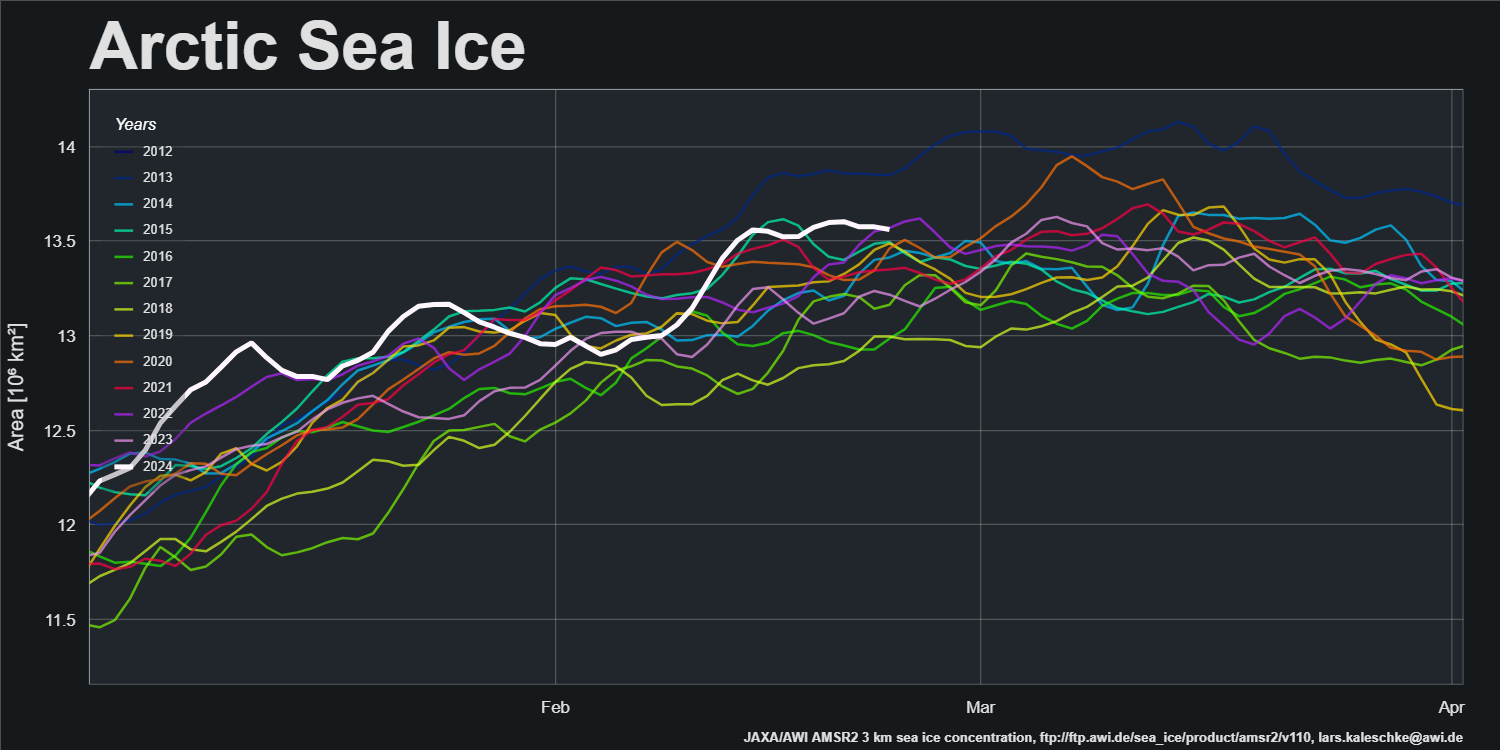
That has been declining since February 20th, and extent started declining yesterday:
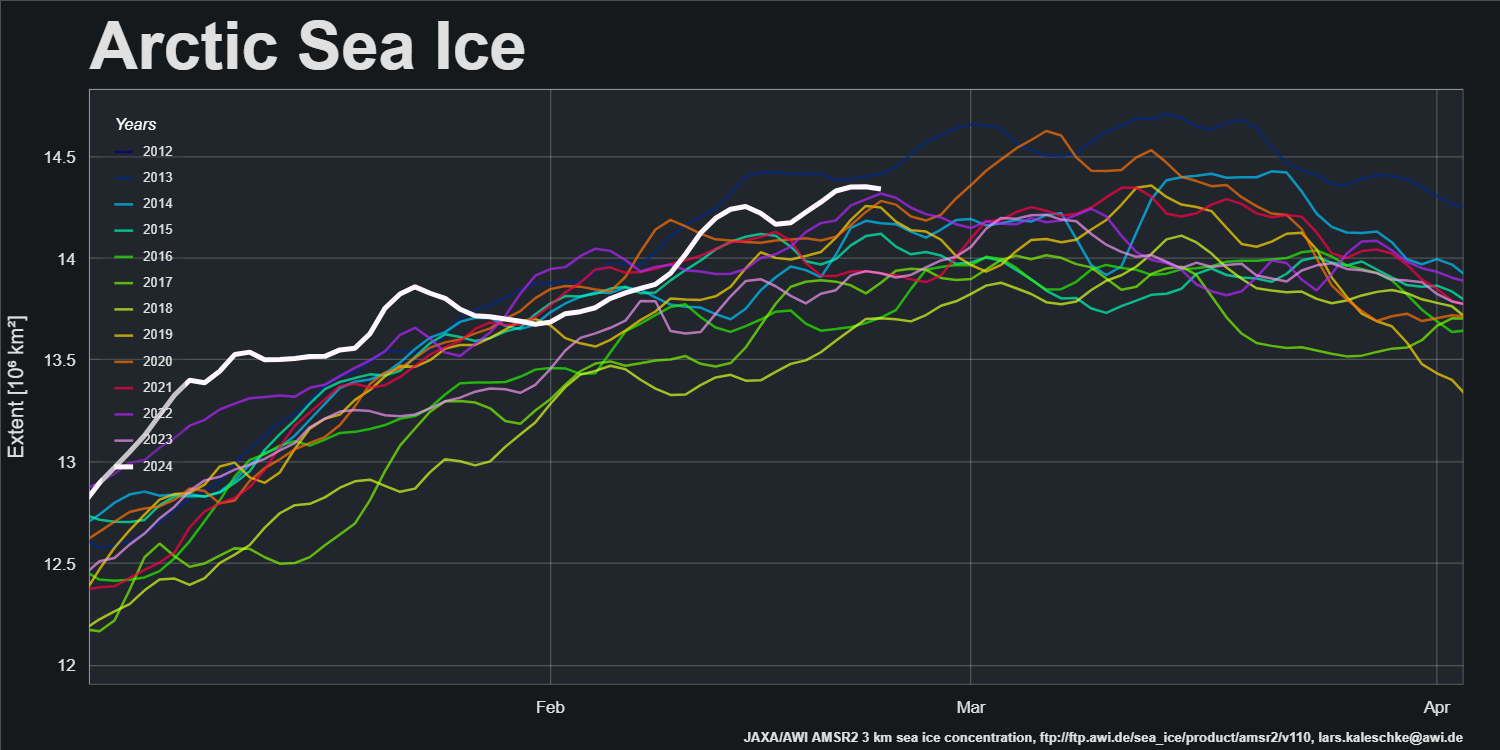
With some more storms set to shake up the Atlantic periphery over the next few days, could the 2024 maximum have already been reached for at least one of the many metrics?
[Update – February 25th]JAXA extent has posted (at least!) a local maximum of 14.27 million km2 on February 23rd:
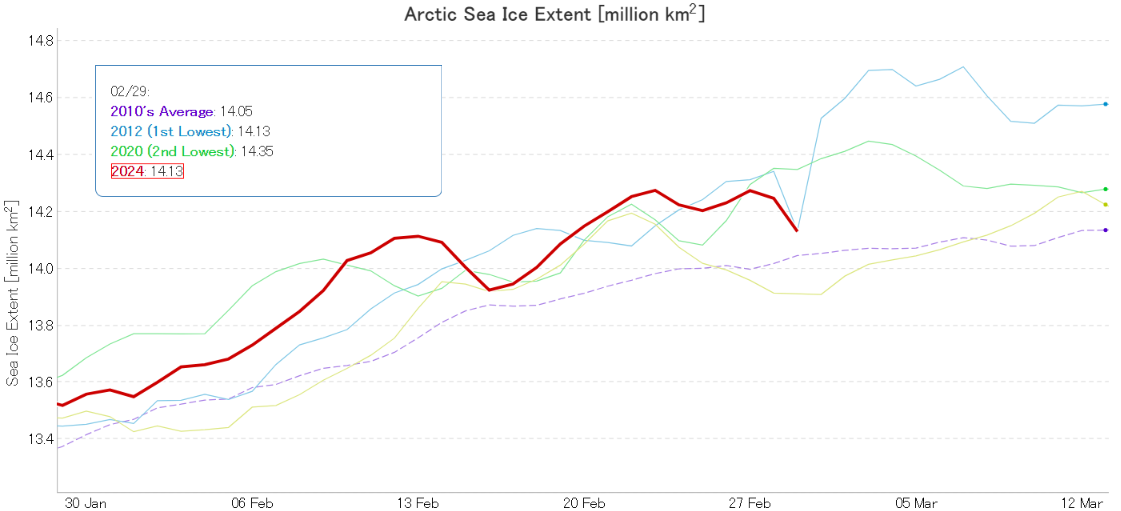
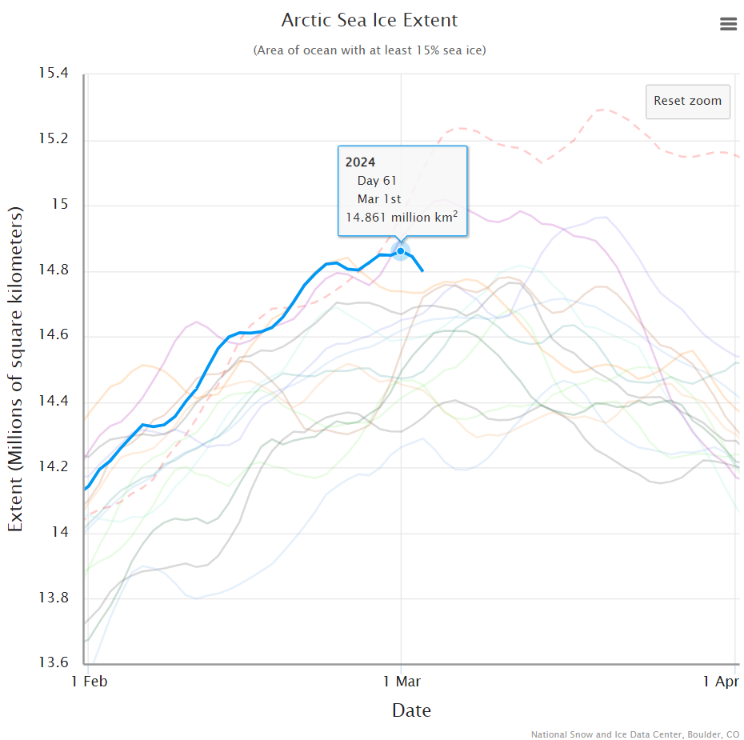
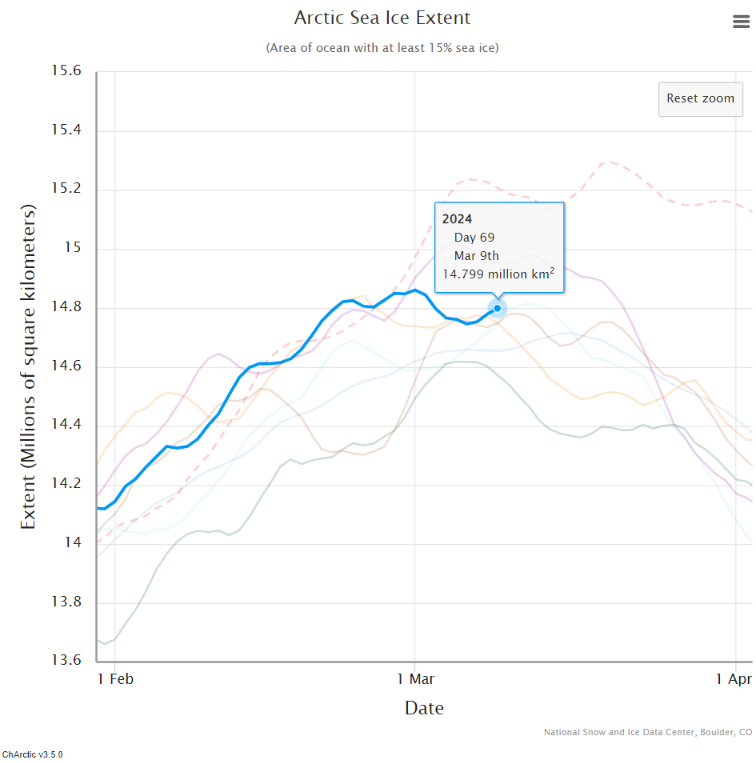
The National Snow & Ice Data Center’s 5 day averaged Arctic sea ice extent has posted a local maximum of 14.83 million km2, on February 24th:
Make of this what you will, but 2024 is also currently in a “statistical tie” with 2020 and 2012. Those years went on to produce the two lowest summer minimum extents in the satellite era.
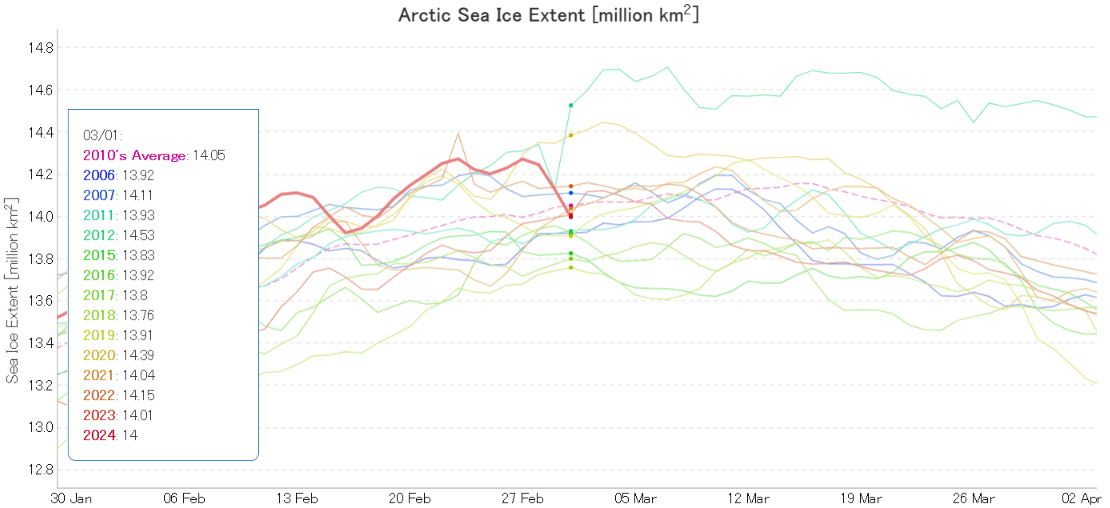
[Update – March 1st]Yesterday JAXA extent posted a century break to the downside:
In case you’re wondering, the non leap year is 2019 (3rd lowest). And 14.27 million km2 is suddenly looking like a much better bet for the 2024 JAXA maximum extent!
[Update – March 2nd]JAXA extent fell by over 100,000 km2 again yesterday:
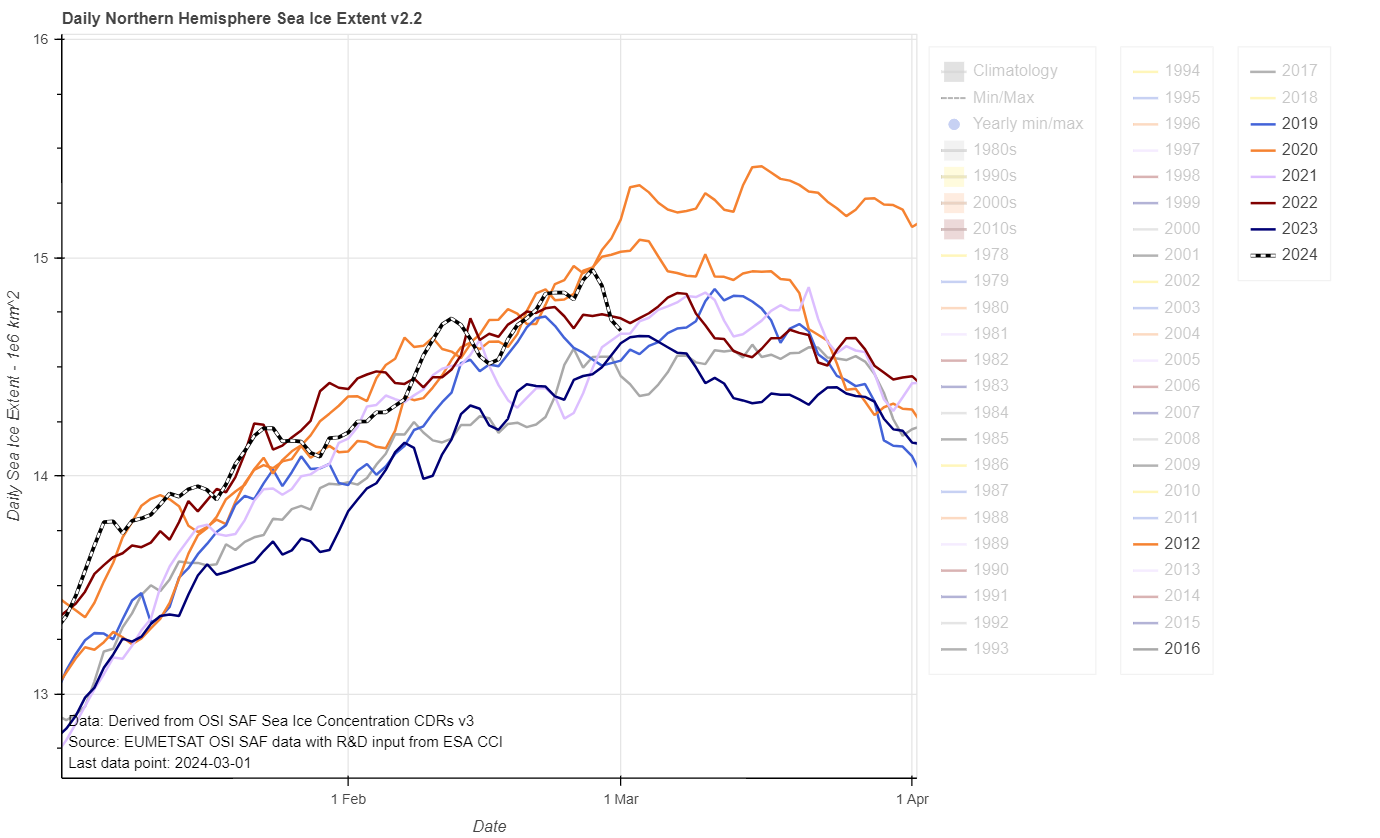
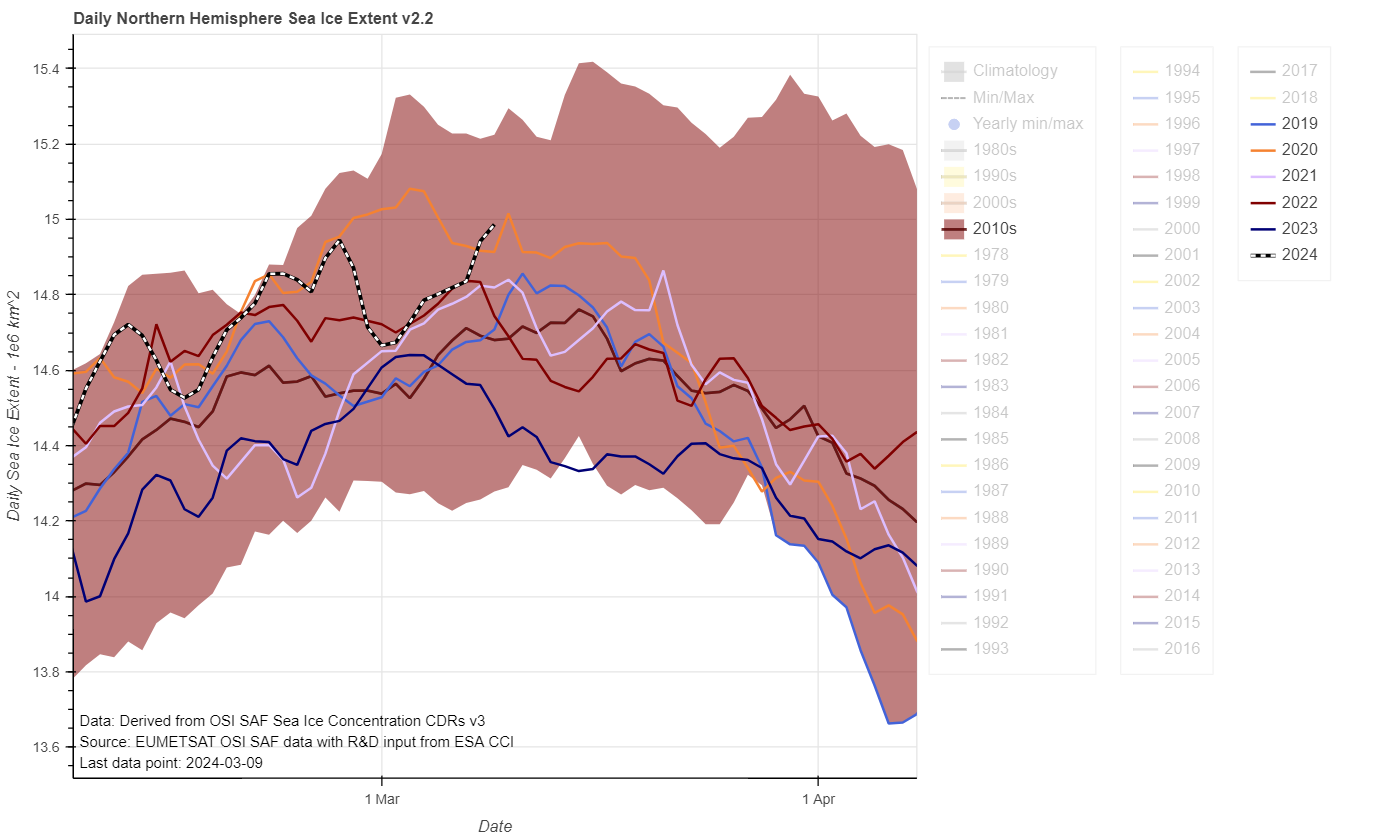
OSI SAF extent has also fallen a lot recently, with the current maximum at 14.95 million km2, on February 27th:
The fall in AWI’s “high resolution” AMSR2 based extent metric hasn’t been nearly as spectacular as JAXA’s own version:
The AWI maximum is currently at 14.36 million km2, also on February 27th
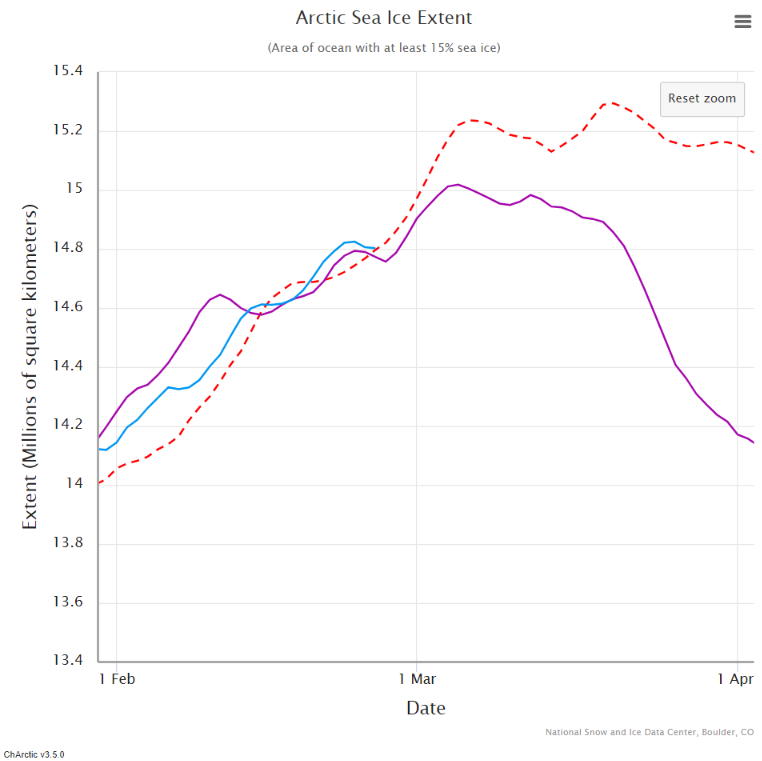
[Update – March 4th]The NSIDC’s 5 day averaged Arctic “Charctic” sea ice extent rose further after February 24th. However, it has now declined substantially from a tentative 2024 maximum of 14.86 million km2 on March 1st:
AWI’s “high resolution” AMSR2 area metric has posted a new maximum for the year, but none of the assorted extent metrics have done the same as yet:
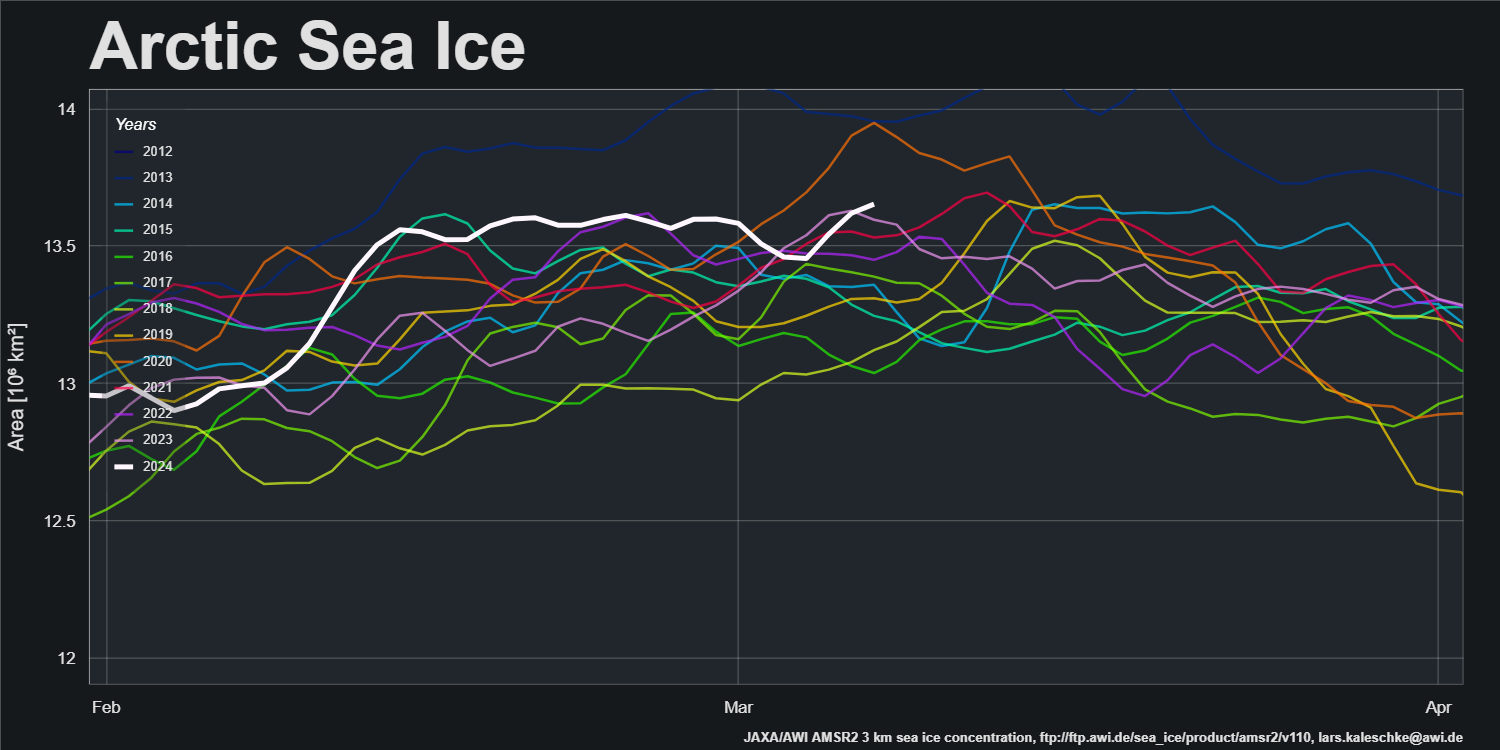
In part that’s because the area of open water in the Kara Sea has now refrozen:
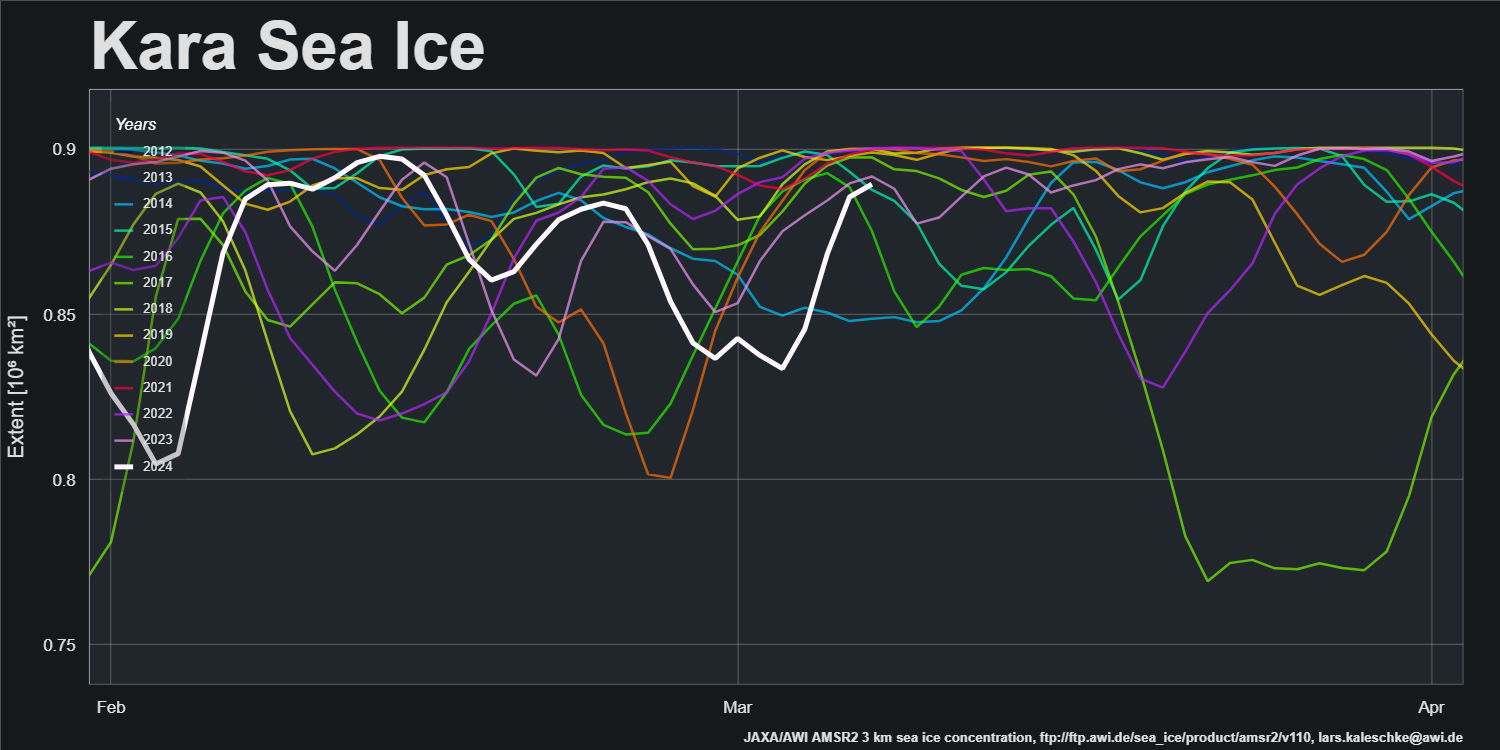
JAXA extent is a whisker away from posting a new maximum for 2024:
AWI AMSR2 extent has already done so:
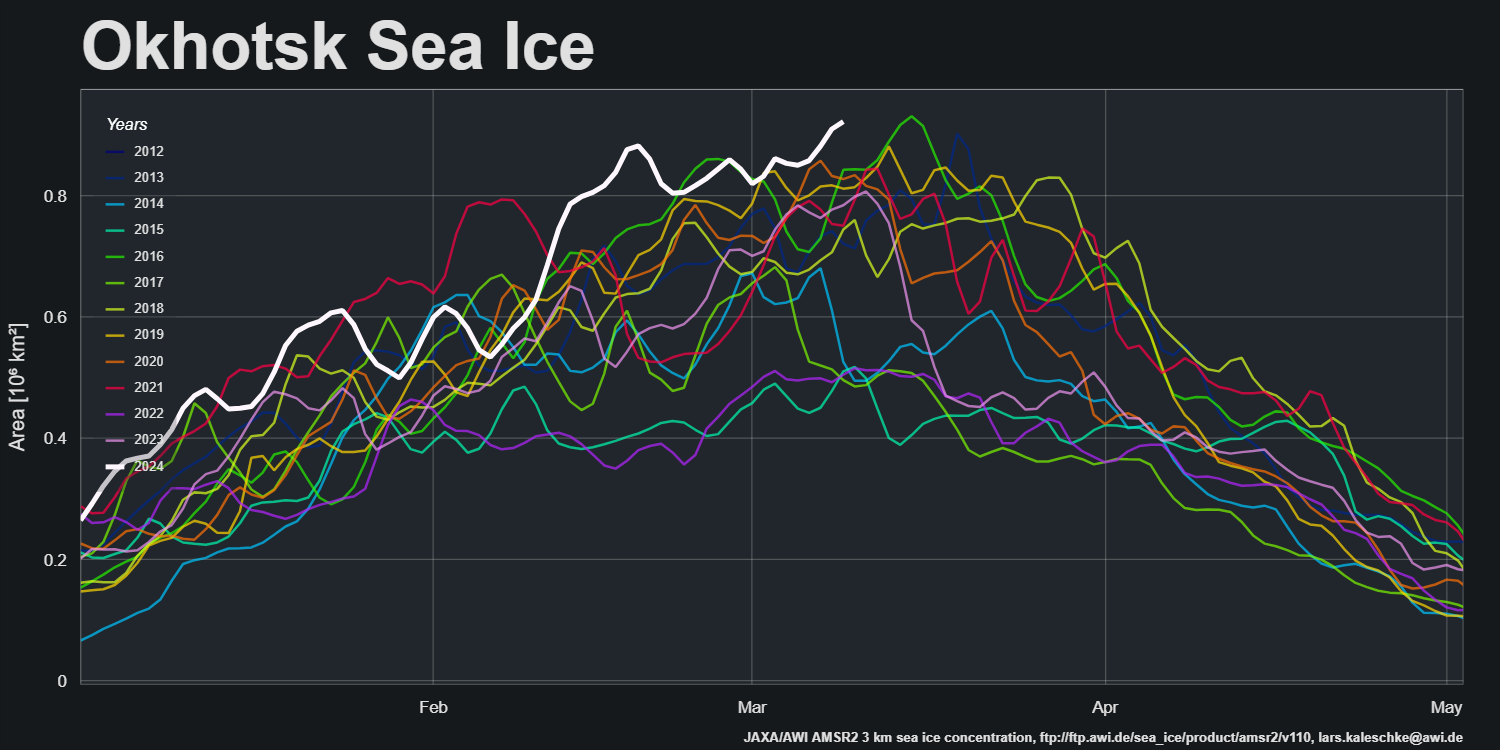
Apart from the Kara Sea, the main suspect is the Sea of Okhotsk:
The Barents Sea has also put on something of a spurt in extent over the last few days:
Hence JAXA extent has posted a new maximum extent for 2024, and so has OSI SAF extent:
However the NSIDC’s 5 day average extent still has some way to go:
The last domino has fallen, and NSIDC 5 day averaged extent has reached a new high for 2024:
I wonder when the apparently ever expanding sea ice in the Sea of Okhotsk will go into reverse?
As Tom mentions below, JAXA extent fell yesterday:
So did the OSI SAF’s flavour:
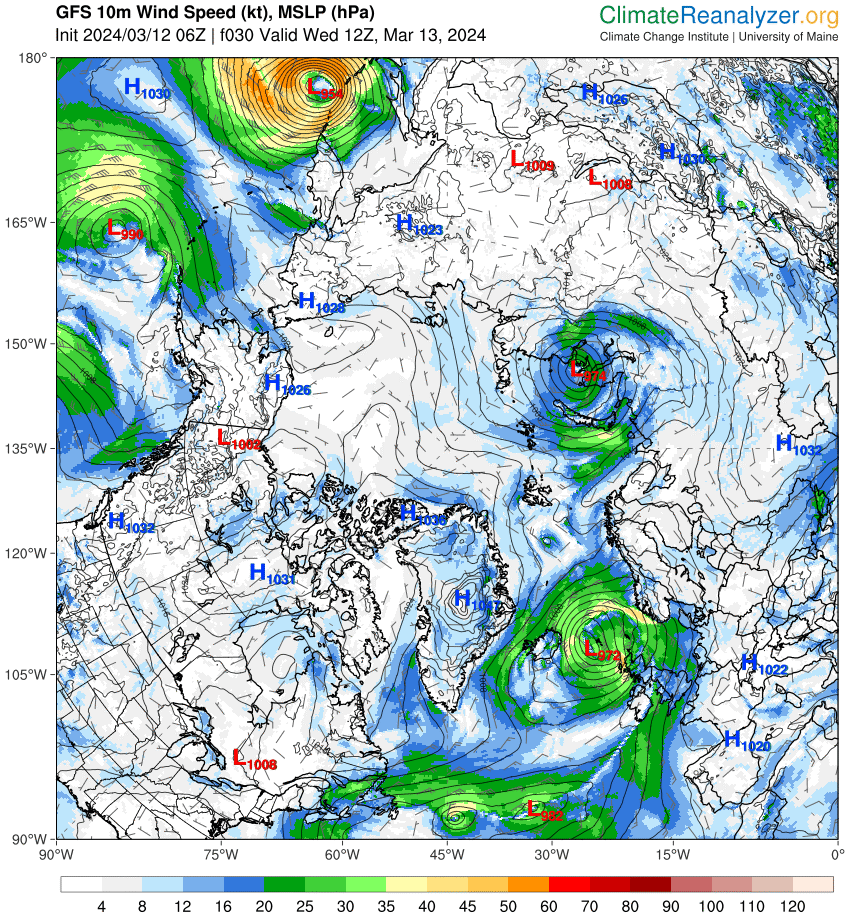
However the same does not apply to the AWI or NSIDC 5 day metrics. Let’s wait and see what the North Pacific cyclone does to the ice in the Sea of Okhotsk:
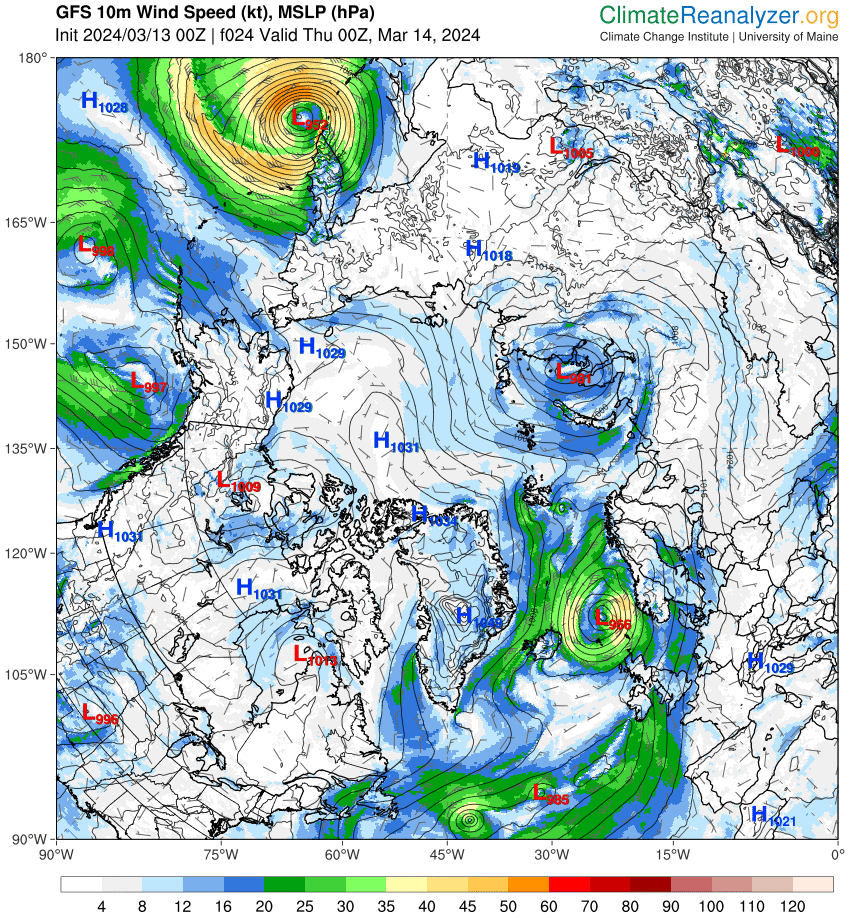
There’s a more modest one in the far north Atlantic too.
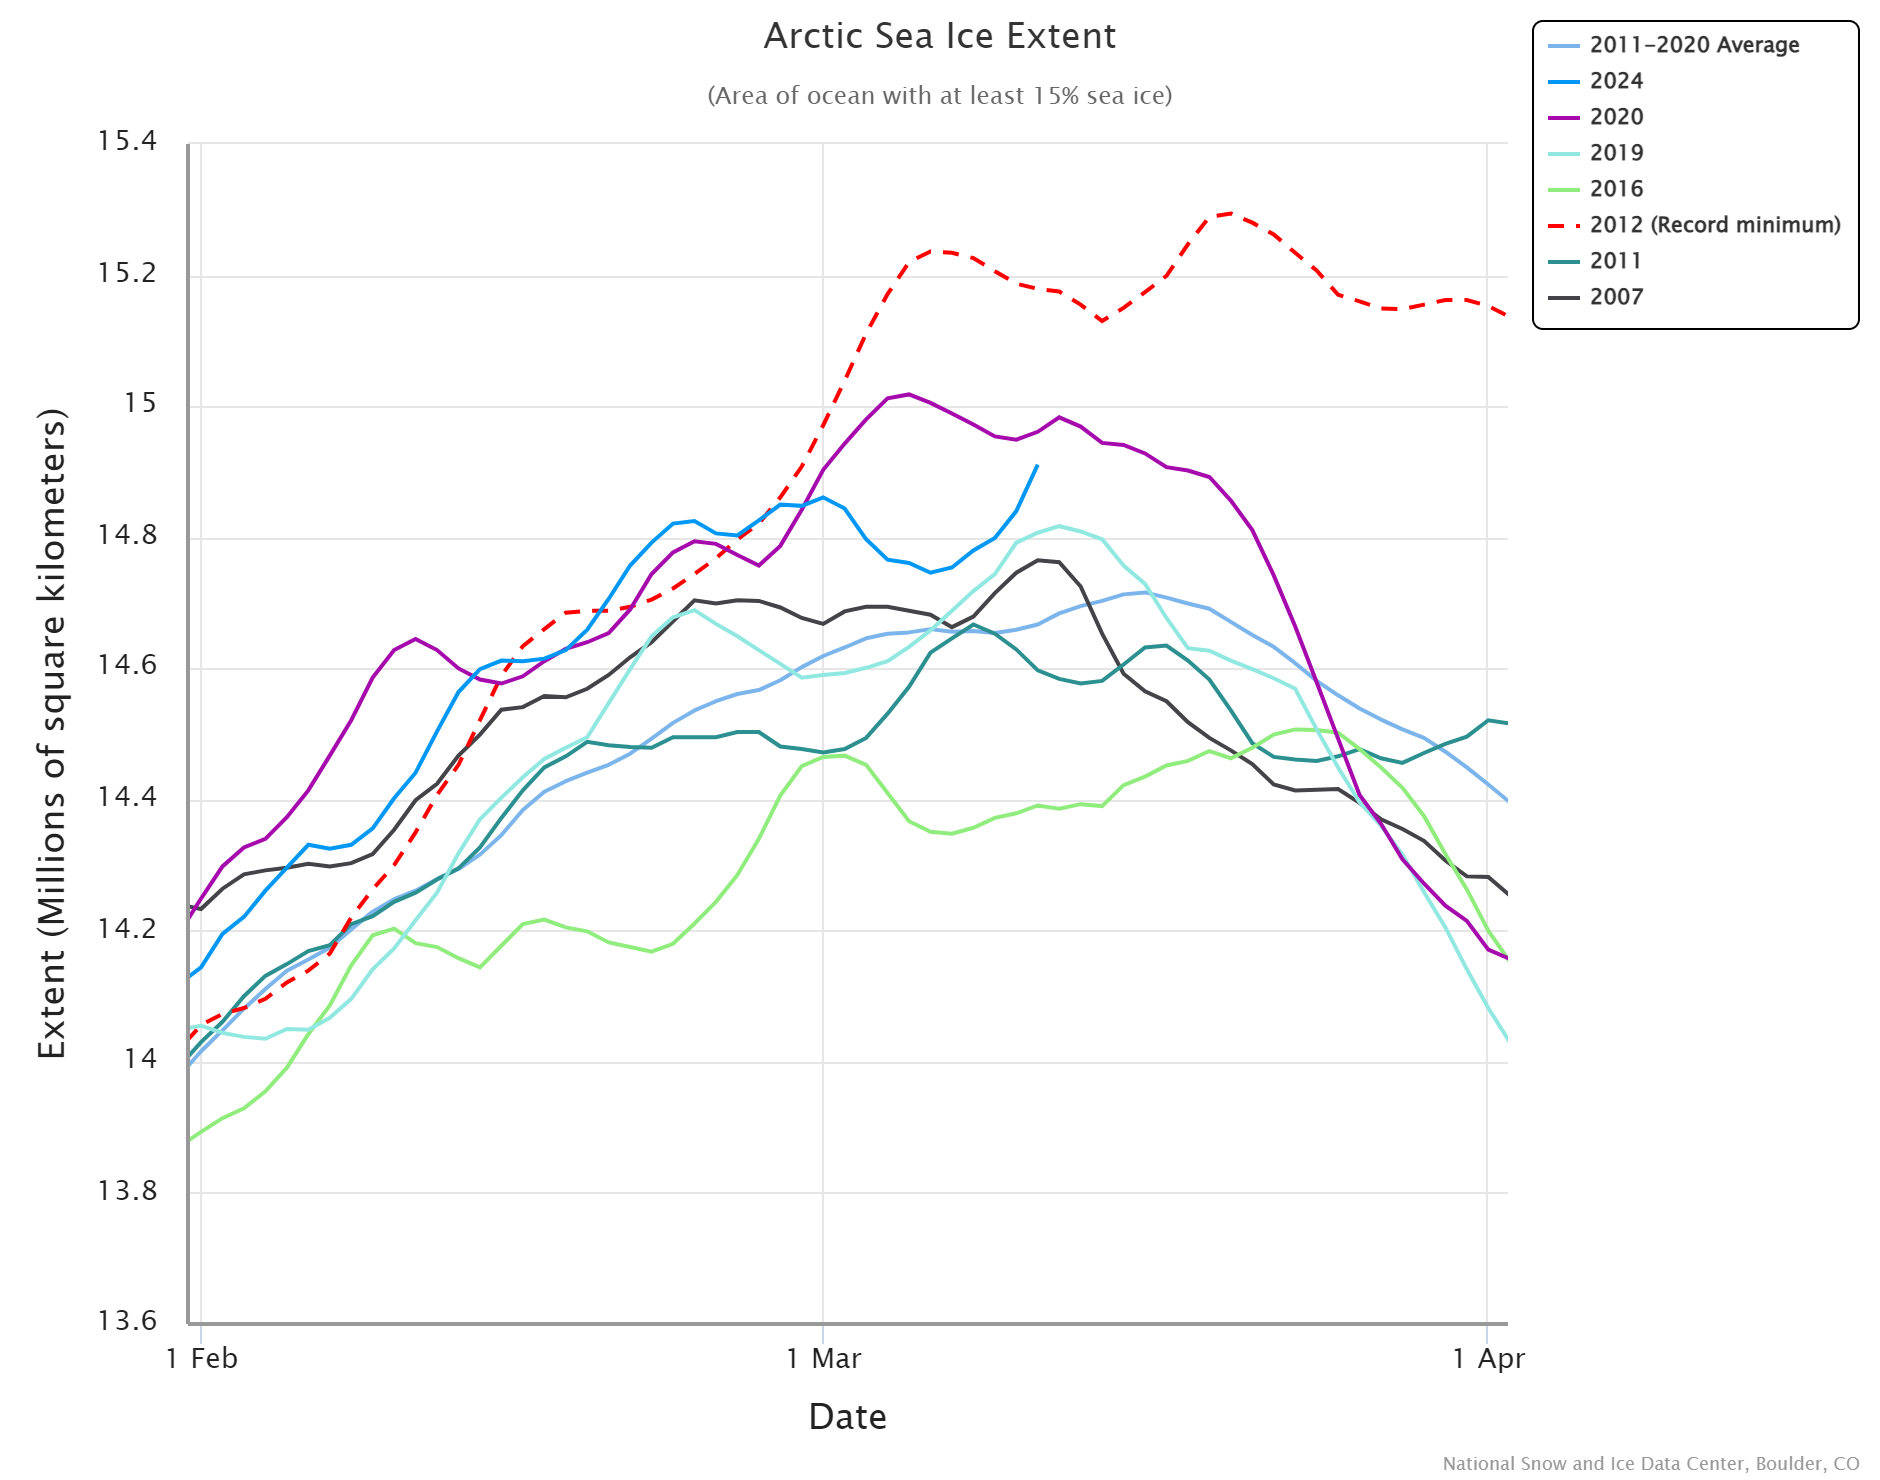
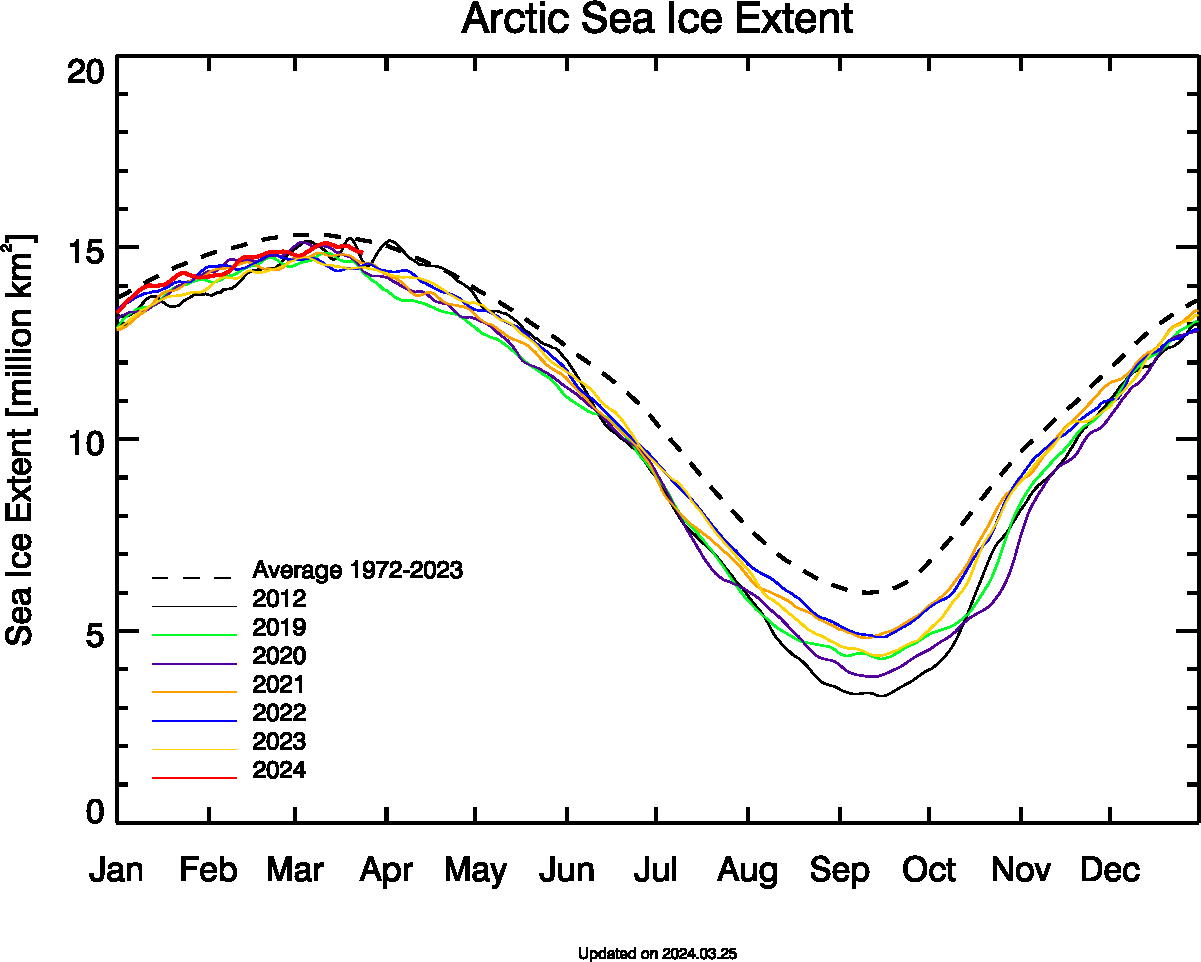
[Update – March 25th]In familiar fashion the NSIDC has called the 2024 maximum Arctic sea ice extent:
On March 14, 2024, Arctic sea ice likely reached its maximum extent for the year, at 15.01 million square kilometers, the fourteenth lowest extent in the satellite record. This year’s maximum extent is 640,000 square kilometers below the 1981 to 2010 average maximum of 15.65 million square kilometers and 600,000 square kilometers above the lowest maximum of 14.41 million square kilometers set on March 7, 2017.
The date of the maximum this year, March 14, was two days later than the 1981 to 2010 average date of March 12.
The tentative maxima identified above have survived. The JAXA maximum was 14.41 million km2 on March 11th, the same date as the OSI SAF maximum of 15.05 million km2.
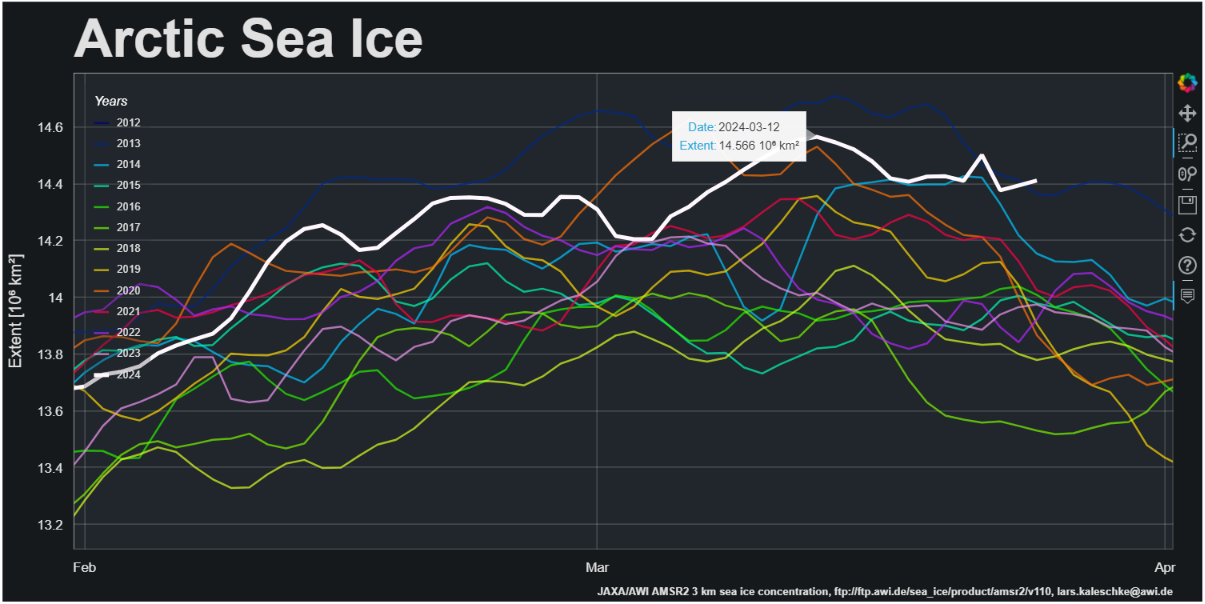
The AWI maximum was 14.57 million km2 on March 12th:
Matt’s favourite metric from the University of Bremen is a bit harder to tie down. According to the “smoothed” data text file the initial peak of 15.13 million km2 on March 11th was surpassed by one of 15.19 million km2 on March 19th. However it doesn’t look that way on their graph:
The Bremen web site explains that:
The data are smoothed by a 5-day running mean. Consequently, the current day and the day before are only averaged over three respectively four days and might still vary slightly for two (resp. one) days.
Perhaps the supposedly “smoothed” text file is averaged in a different way to the graph, or even contains the raw daily data?
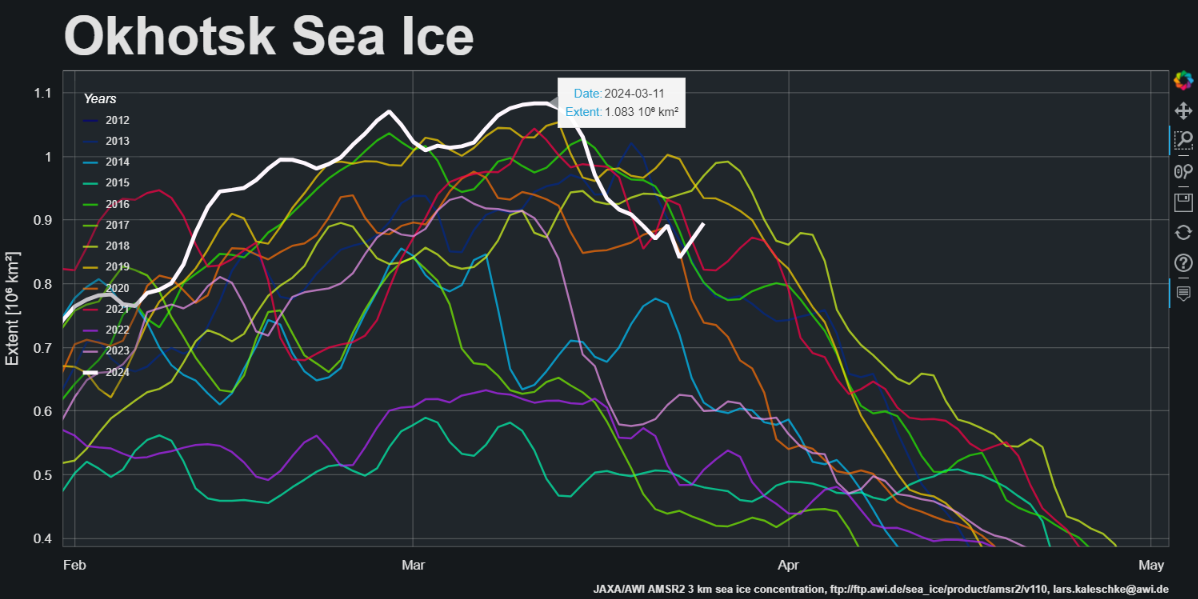
Here’s the latest AWI extent data from the Sea of Okhotsk, which also peaked on March 11th:
Watch this space!
I start each year from the maximum.
So this year was definitely recovery.
Extent is, currently, the 18th lowest in the 45 year satellite record.
Zack’s graph a bit out of date, Jim.
Now nearing the end of Feb and close to 2007 extent level.
As my previous post suggests, there are 17 out of 45 years with lower extent maxima than 2024.
In which case my Arctic alter ego will ask you this question too Neil:
https://twitter.com/GreatWhiteCon/status/1761696783241986053
Hi Jim,
You know a lot more about the Arctic than I do.
I’m just a straightforward, uncomplicated guy.
I just try to follow the data.
This suggests to me that we may beginning to see the start of a recovery in Arctic sea ice.
I find Snow White’s off the wall comments about crickets chirping too difficult to follow.
Neil so you think Peter Wadhams, the Cambridge Professor who went to the arctic 50 times studying the ice, then authored “Farewell to Ice” as a book – Peter Wadhams is wrong and you’re correct? Must be nice to align with Big Oil.
‘…Peter Wadhams is wrong…?’. The good Professor, whose name some wag used as a metric for sea ice (1 Wadham = 1 million sq Kilometers of ice extent) has been serially and spectacularly wrong about the end of Arctic Sea Ice, such that I don’t think anybody but hysterics has any faith in his predictions. This is not to dismiss his other scientific or instructional accomplishments, but frankly ‘’One Wadham’ (as a metric) has become an inside joke.
Recovery? That’s good to hear!
Piomas being 3rd lowest for the time of year had me worried for a bit there, last week!
Tom,
Could you please advise where your “3rd. lowest” figure comes from.
Laest PIOMAS report I look at states:-
“January 2024 adds another month to the record of CS2 data which now spans 13 years. Neither CS2 nor PIOMAS show any discernible trend over that time period underlining the importance of internal variability at decadal timescales.”
February mid month update,
See facts About The Arctic In February, 19 of February update.
Granted you could point the finger that I’ve picked a moment when the volume is lower relative to most recent years, it doesn’t seem to be recovering.
Extent being up + volume being lower = thinner ice?
Thinner ice!
Particularly in the Beaufort Sea currently
So who do you believe?
Hi Neil,
“I find Snow White’s off the wall comments about crickets chirping too difficult to follow.”
In which case please see:
https://www.merriam-webster.com/wordplay/words-were-watching-crickets-silence
Crickets + tumbleweed = Deathly silence
Hi Neil,
While perhaps a bit obtuse, Ms. White says that extent doesn’t mean much at all during the height of winter, but volume (and snow cover) means a whole heck of a lot.
So by extension, those who proclaim the end of arctic sea ice decline by way of extent alone have no evidence on which to base their assertions.
Hopefully I wasn’t too obtuse for assorted “skeptics” one might name to comprehend when I first posed the question on (anti)social media.
However after several weeks/months/years of similar nonsense being propagated by their assorted porky pie production lines frustration/sarcasm does eventually set in!
In actual fact at the height of winter snow covered ice provides a nice, cosy blanket insulating the (comparatively!) warm sea water from the cold air above it.
What happens outside the Arctic circle does impact what happens inside of it.
Having all time record lows of ice and snow inn the Great Lakes region is a problem. This will result in more big forest fires in the summer. Ash and smoke is very bad for ice.
A brother lives in New Brunswick. They have not had 1 day to fall to -20°C all winter. That does not happen in that region. Pretending that things are getting better? I feel very bad for those who will have to live with the legacy of my generation.
14,308k on JAXA for 9 of March.. we have a new late Maximum!
Only on JAXA though.
So far!
A small fall on JAXA to 14,399k on Tuesday 12 of March… history suggests we are close!
New maximum.
Not for OSI SAF extent though:
Amongst others.
Another new maximum
In fact. Its at the 1972-2023 average despite “global boiling”
At the risk of repeating myself:
“You keep repeating the same irrelevance over and over again.
See this “opinion” from a commenter on the GWC blog:
https://GreatWhiteCon.info/2024/02/facts-02/facts-about-the-arctic-in-february-2024/#comment-732810
Then explain to me in what way your sacred metric is relevant in the middle of the Arctic winter.
Thanks in advance.”
Not on the rejuvenated JAXA metric though:
According to uni bremen we’re very near levels seen in 1974 on this date. 50 years ago. I’m just showing you their data. If you have issues with it I suggest you take it up with them.
I have no particular issue with the University of Bremen’s data, although I would like to know where they got their daily data for 1974 from. The main point of this thread from my perspective is to illustrate how assorted combinations of satellite instruments and sea ice concentration algorithms lead to a spread in “sea ice extent” metric data from different sources.
What I would like to know is what you think the relevance is of one particular extent metric being “very near levels seen in 1974 on this date”. Bear in mind that on the JAXA graph current extent is well below 2012 on the same date.
It seems yesterdays data from uni bremen has been altered.
Bremen not withstanding, I did note this today from DMI. It’s a bit hard to follow the ups and downs of the various measurements/estimates/models for the extent metric. Is there a consolidated critique/commentary somewhere that would help illuminate this? For example, you seem to favor JAXA, Jim, but I’m not sure exactly why.
Here’s DMI:
https://ocean.dmi.dk/arctic/icecover.uk.php
JAXA’s “advantage” from my perspective is that the ‘J’ stands for Japan. Which means that the data is already available first thing in the morning here on the Greenwich meridian.
As I must have mentioned, the NSIDC Sea Ice Index offers “a source for consistent, up-to-date sea ice extent and concentration images and data values from November 1978 to the present.”
DMI use data from the OSI SAF, based on the same SMMR, SSM/I, SSMIS series of instruments as the NSIDC. However MET Norway provide a more flexible user interface for viewing the same data:
JAXA, Bremen and AWI use the higher resolution AMSR2 instrument, and Lars Kaleschke provides readily accessible regional graphs based on the latter:
Horses for courses?
JAXA rising for the last few days, not quite to a new high yet. Looks to be a lot of ice being blown into the Barents and Greenland seas.
Mostly balanced by a decline in the Okhotsk