World renowned climate scientist Roger Pielke Jr. has just published an interesting paper in the highly respected academic journal the New York Post. It is entitled:
When it comes to climate change, to invoke one of Al Gore’s favorite sayings, the biggest challenge is not what we don’t know, but what we know for sure but just isn’t so.
Two new studies show that the Earth’s climate is far more complex than often acknowledged, reminding us of the importance of pragmatic energy and climate policies.
One of them, led by researchers at China’s Tongji University, finds that after years of ice sheet decline, Antarctica has seen a “surprising shift”: a record-breaking accumulation of ice…
Roger then heads for the far north, where he assures his learned readers that:
A second new paper, a preprint now going through peer review, finds a similar change at the opposite end of the planet.
“The loss of Arctic sea ice cover has undergone a pronounced slowdown over the past two decades, across all months of the year,” the paper’s US and UK authors write.
They suggest that the “pause” in Arctic sea ice decline could persist for several more decades.
Together, the two studies remind us that the global climate system remains unpredictable, defying simplistic expectations that change moves only in one direction.
I feel compelled to point out to Roger that apart from the fact that they both include the word “ice”, Arctic sea ice and the Antarctic ice sheet are approximately as similar as chalk and cheese.
Roger neglects to provide NY Post readers with a reference or helpful link to the preprint he is referring to. However luckily for my own reader(s) I have already done so. Hence I am able to quote the authors’ own words, which read as follows:
According to these climate model simulations, this pause in the loss of Arctic sea ice could plausibly continue for the next 5-10 years.
I have already emailed the authors of the preprint asking them to justify their use of the term “pause”. I’ll let you know what they have to say on the matter in due course. In the meantime I suggest that Dr. Pielke consults an English dictionary. In pseudo code:
"pause" != "rebound"
I also suggest that he directs Post readers to more recent activity of yours truly’s virtual pen:
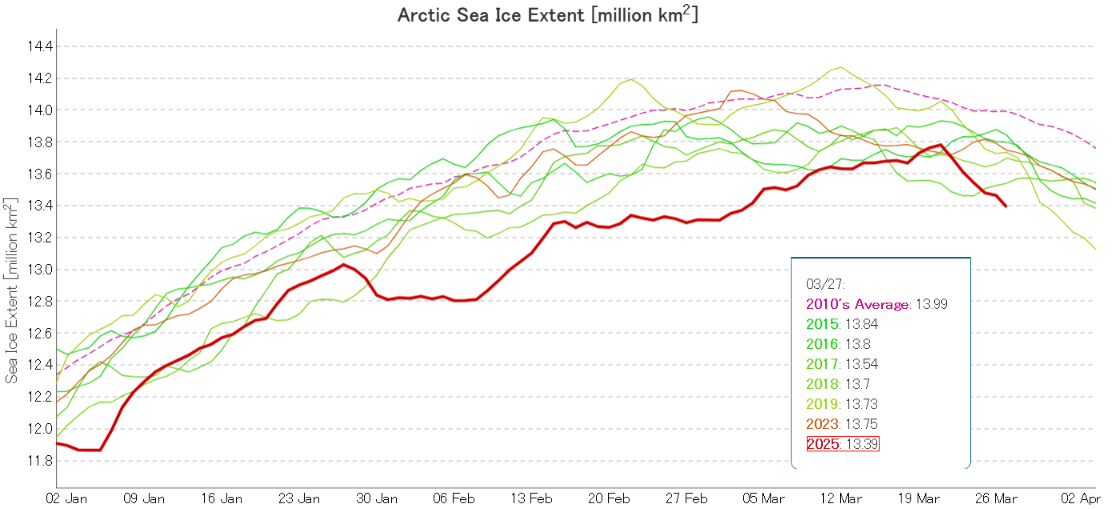
This year’s maximum extent is 1.31 million square kilometers below the 1981 to 2010 average maximum of 15.64 million square kilometers and 80,000 square kilometers below the previous lowest maximum that occurred on March 7, 2017:
Perhaps he also wouldn’t mind asking the Post’s online editor(s) to reveal this explanatory video to their viewers?
The Laptev and East Siberian Seas have now refrozen. Consequently Arctic sea ice extent is now increasing more slowly, and JAXA/ViSHOP extent is 3rd lowest for the date in the satellite era:
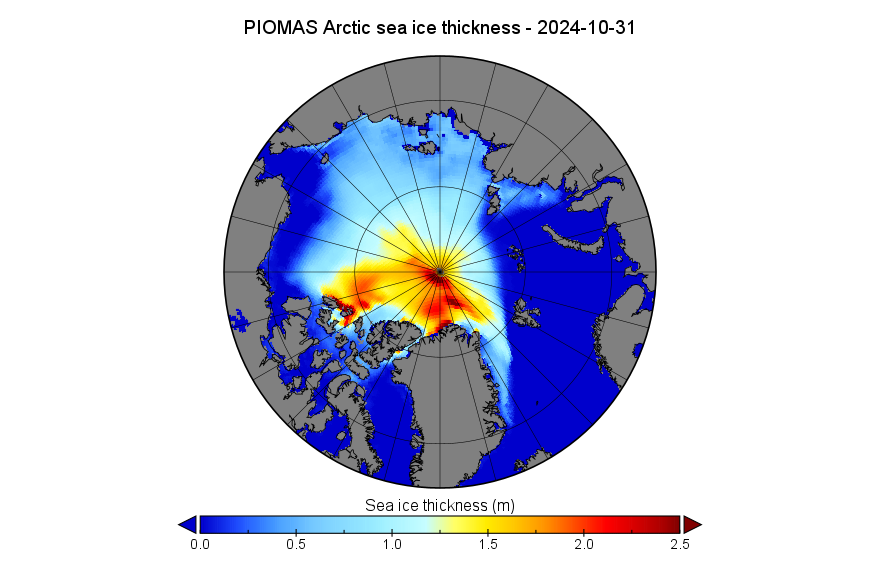
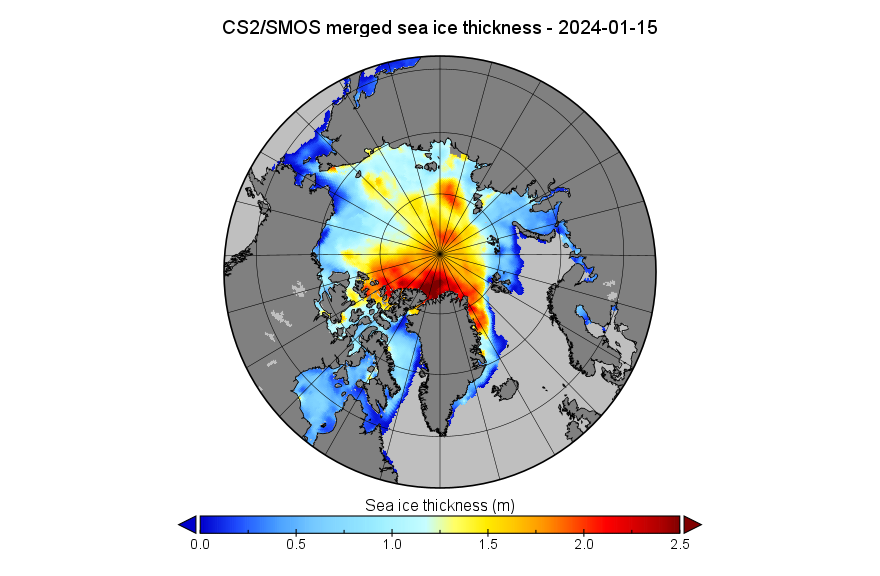
Note the change in scale from previous months, to allow for easier comparison with the “near real time” CryoSat-2/SMOS merged thickness data from the Alfred Wegener Institute:
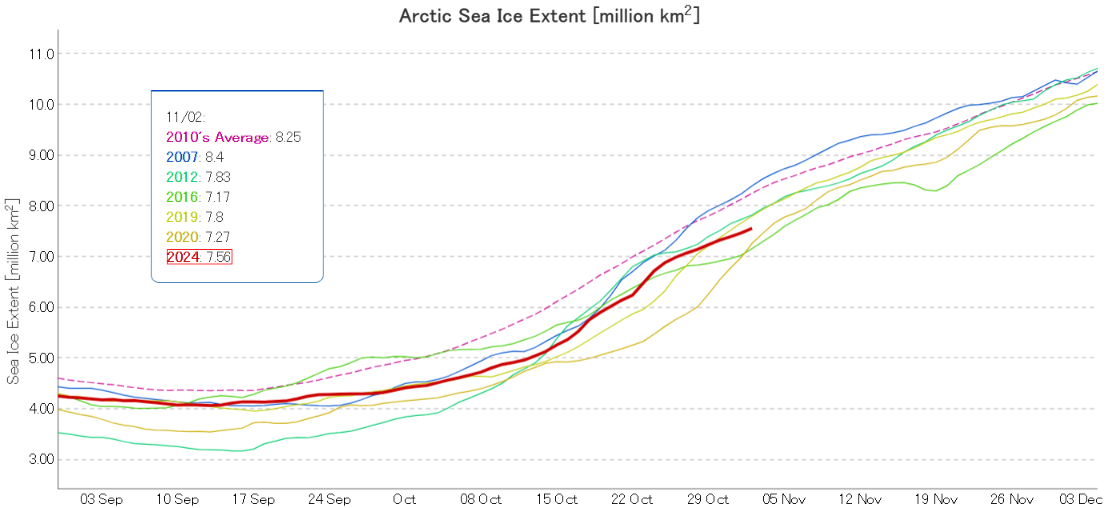
At the beginning of September JAXA/ViSHOP extent was 4th lowest for the date in the satellite era:
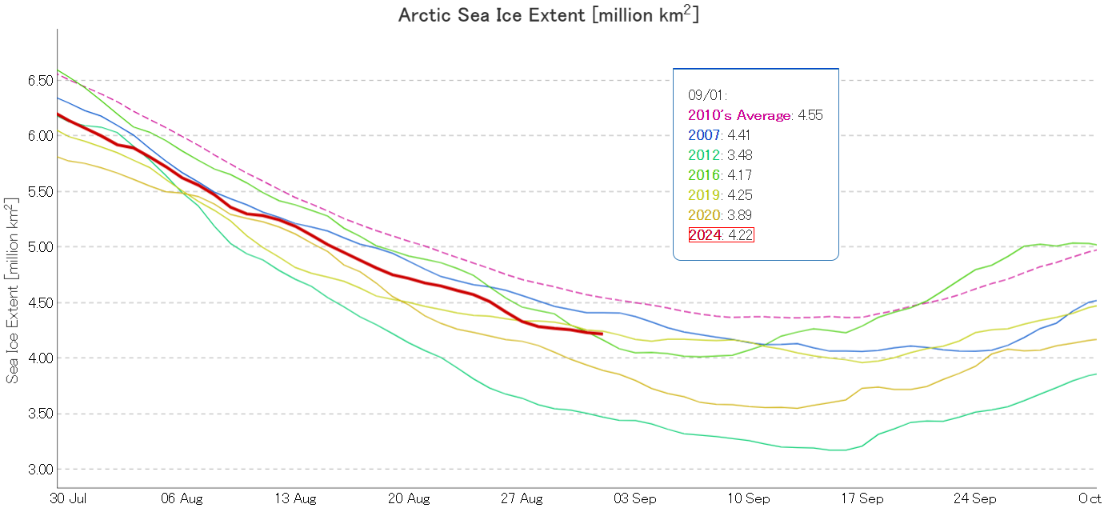
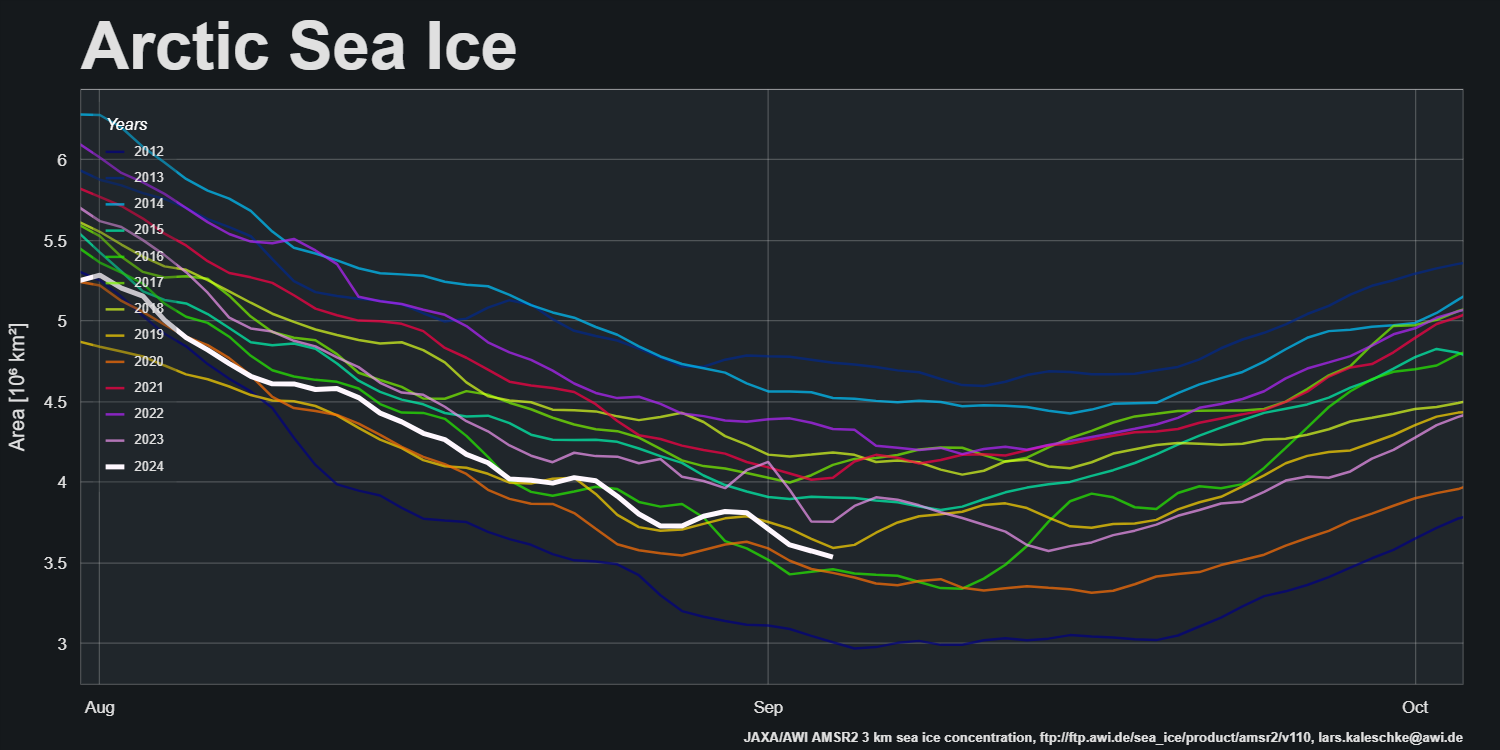
For much more detail on sea ice extent for the next few weeks please see the dedicated 2024 minimum thread. However, note that as extent has been flatlining sea ice area is still declining:
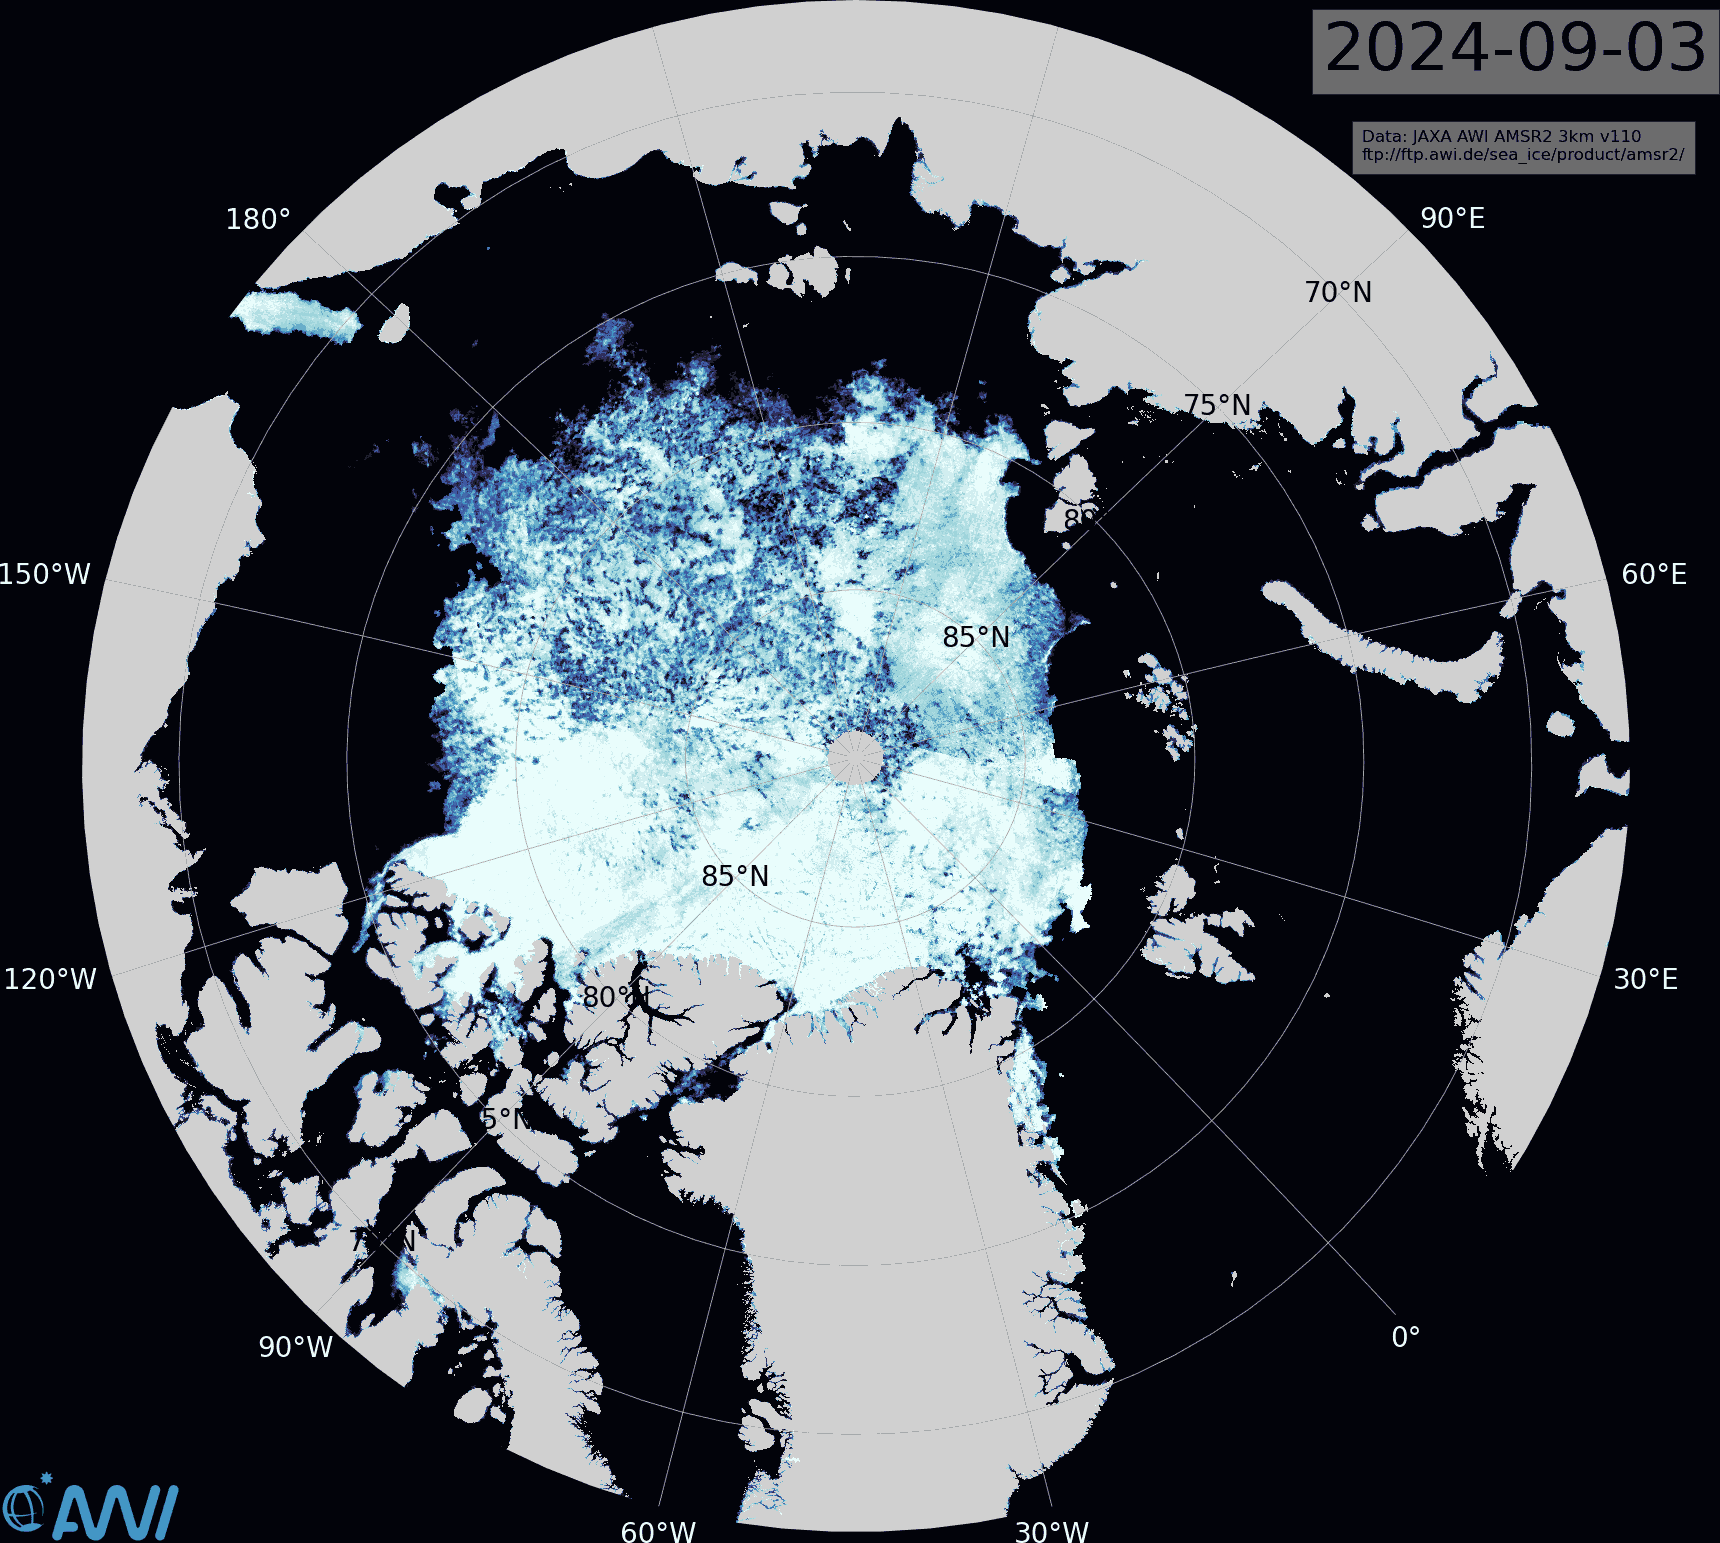
The latest AMSR2 sea ice concentration map from the Alfred Wegener Institute reveals that the area of thick ice in the Chukchi Sea has still not melted:
The most recent sea ice age map currently available dates from the beginning of August. Comparison with the concentration map shows that most of the remaining first year ice is highly fragmented, even close to the North Pole:
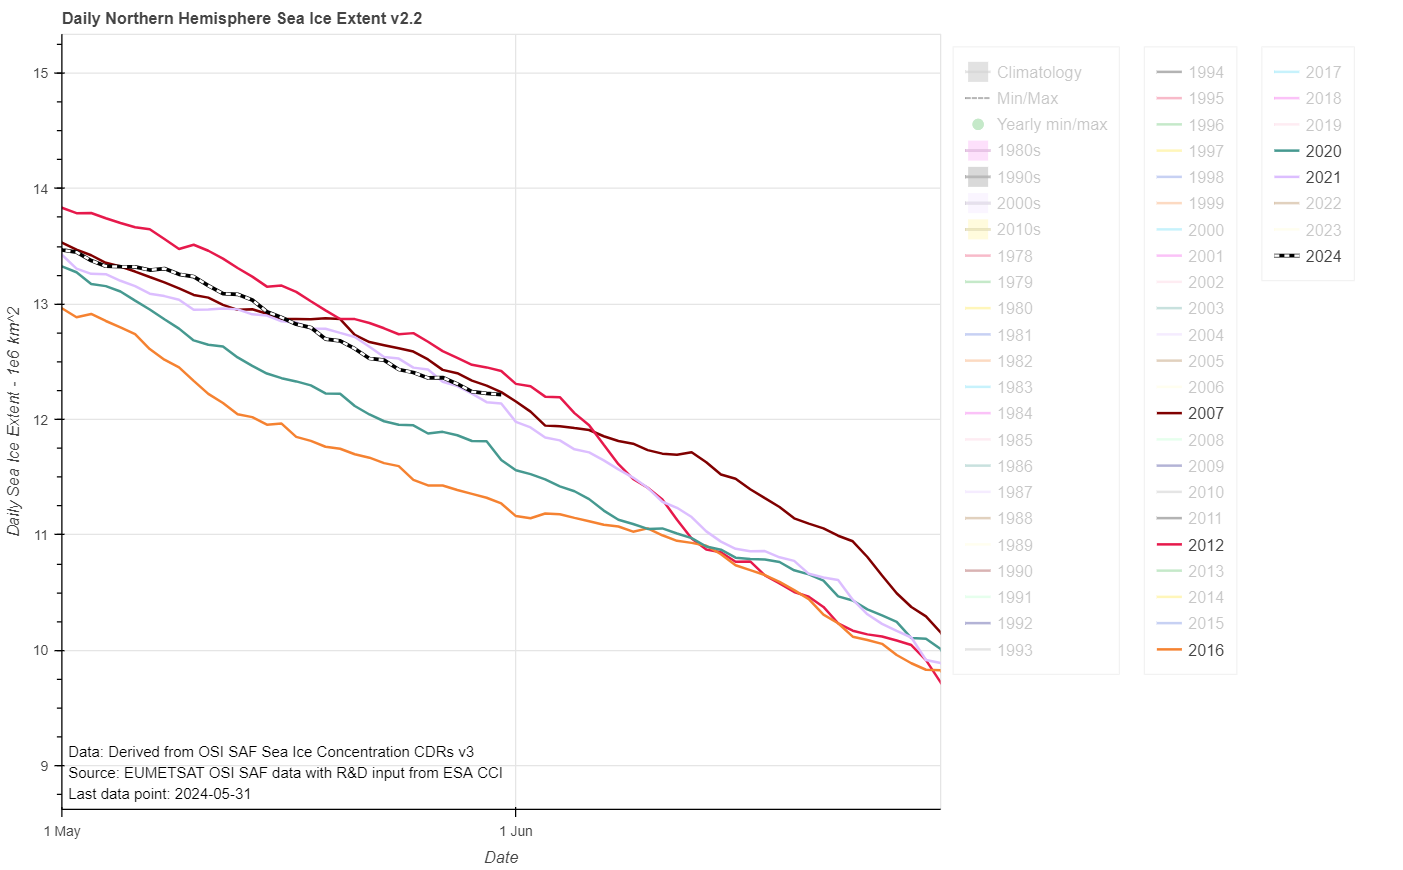
The JAXA/ViSHOP web site is currently down, so here is the current OSI SAF extent graph for the end of May:
2012’s “June cliff” is almost upon us, and if 2024’s current trajectory continues extent will cross above 2012 for the first time since February in a week or so.
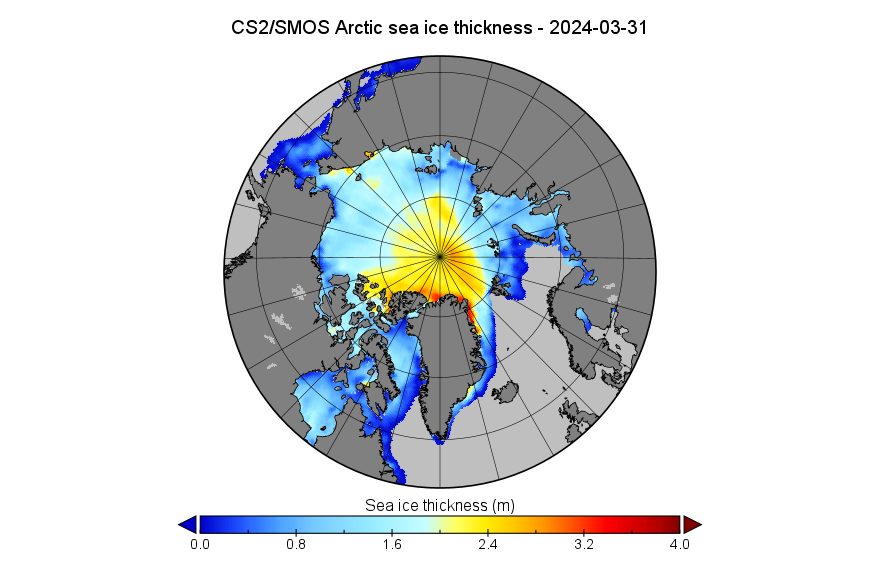
Starting this month with a look at assorted volume/thickness data, here is the CryoSat-2/SMOS merged Arctic sea ice thickness map for March 31st:
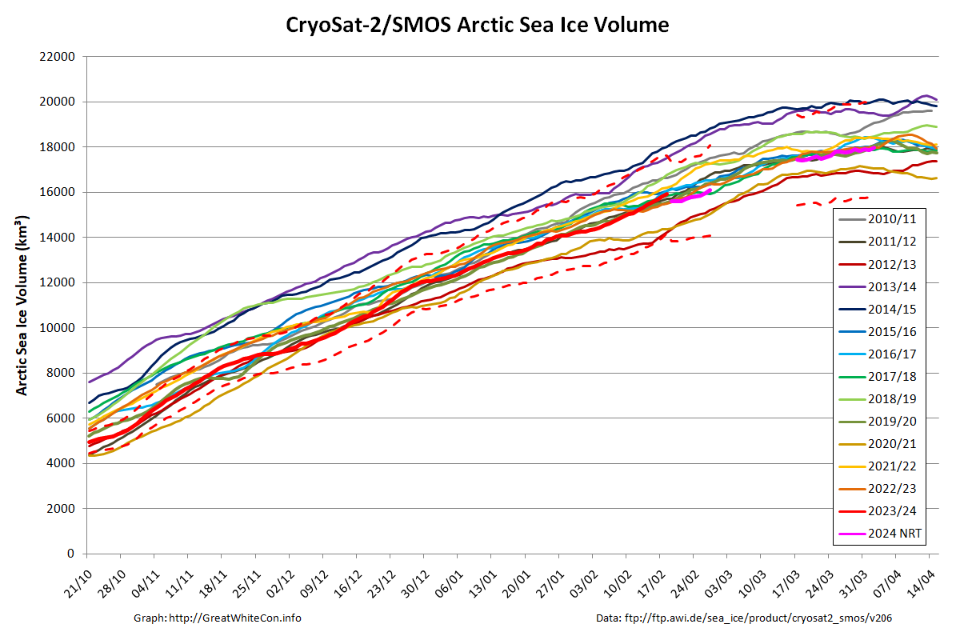
Plus the associated volume graph, which still suffers from a gap in the near real time data due to the problem with the SMOS satellite during the first half of March:
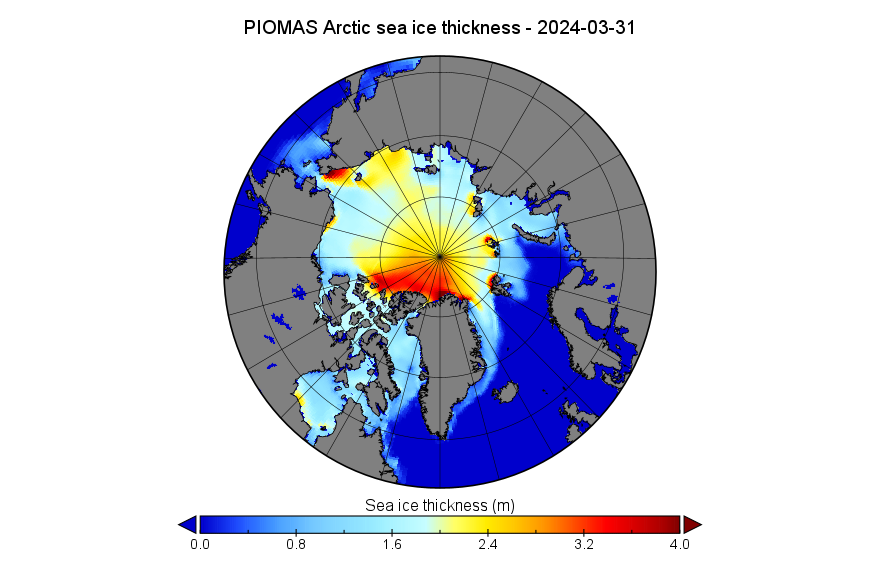
The PIOMAS gridded thickness data for March 2024 is also available. Here’s the end of month thickness map:
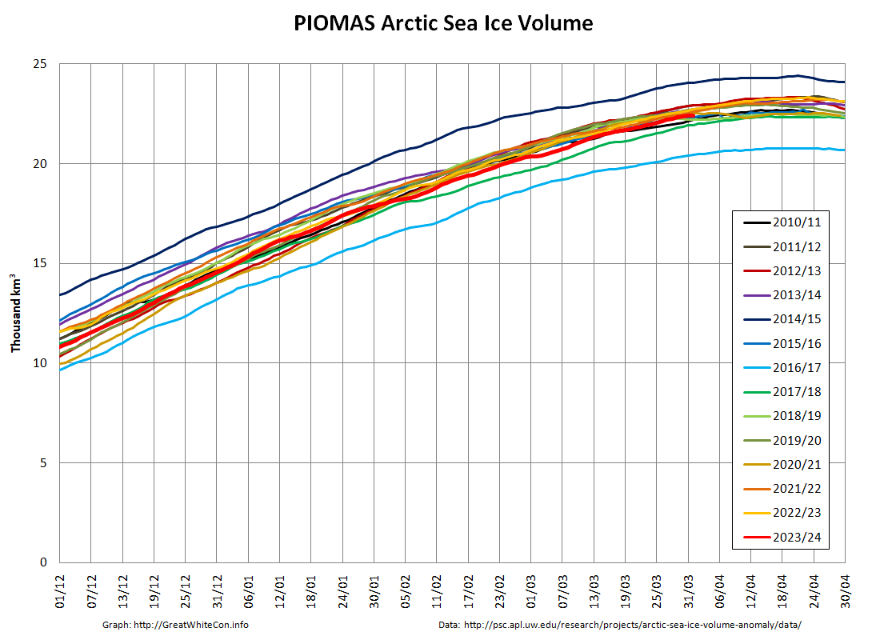
Plus the calculated volume graph:
Especially for Peter, here too is the DMI’s chart of monthly Arctic sea ice volume for March:
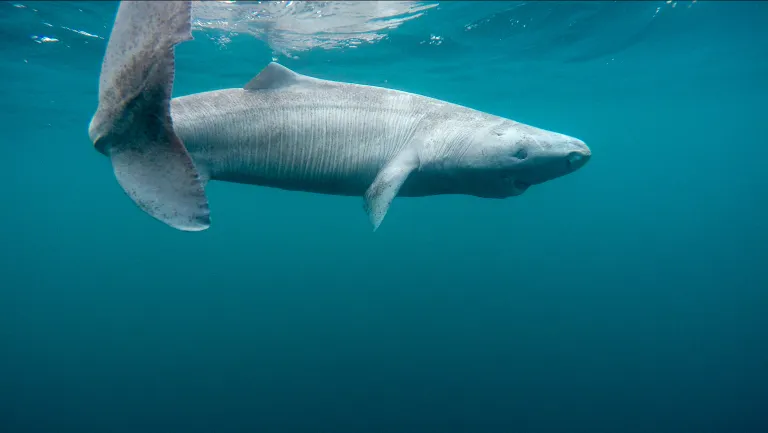
You will no doubt be astonished to learn that shark jumping supremo Tony Heller has just jumped over the entire East Greenland population of this long lived but officially vulnerable species. Without harming a single one!
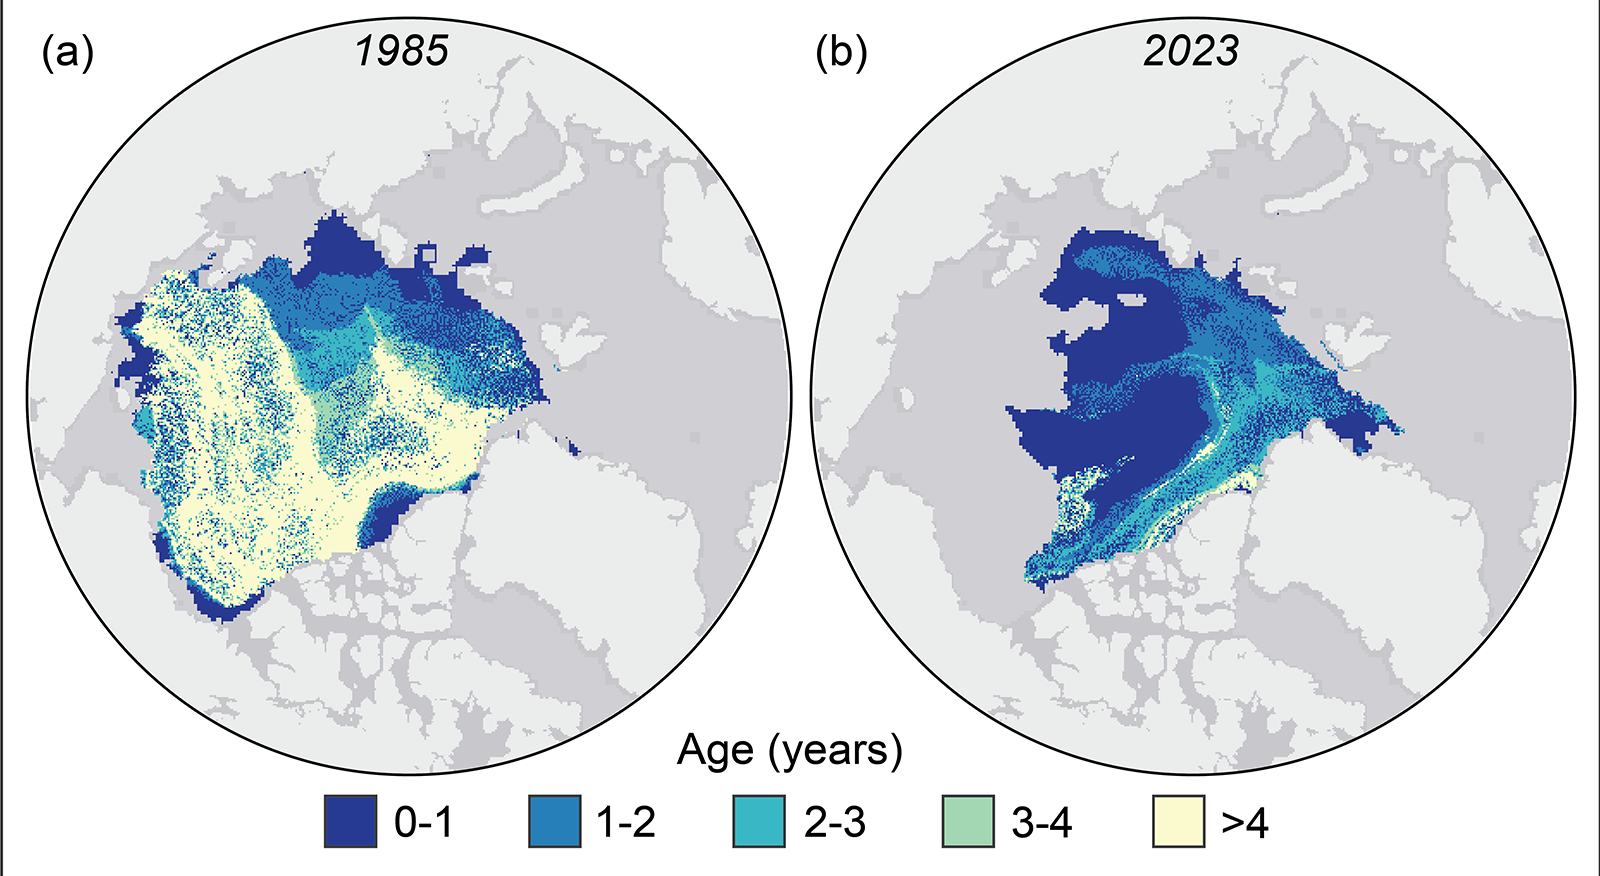
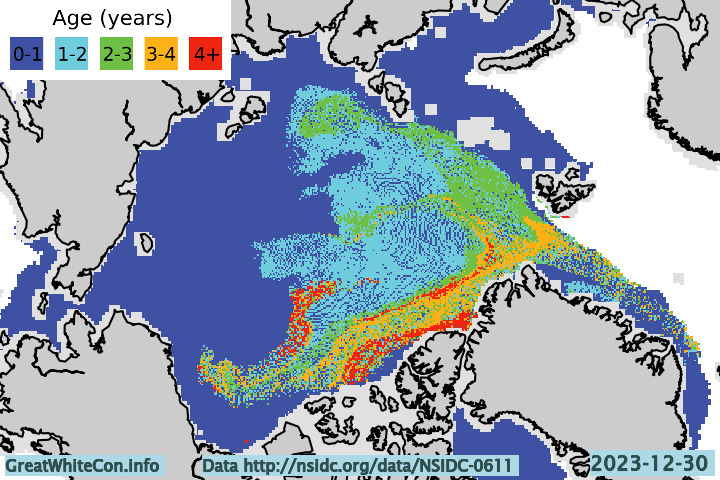
Over on XTwitter “Steve”/Tony was recently shown this video which graphically reveals the declining age of the sea ice in the Arctic Ocean:
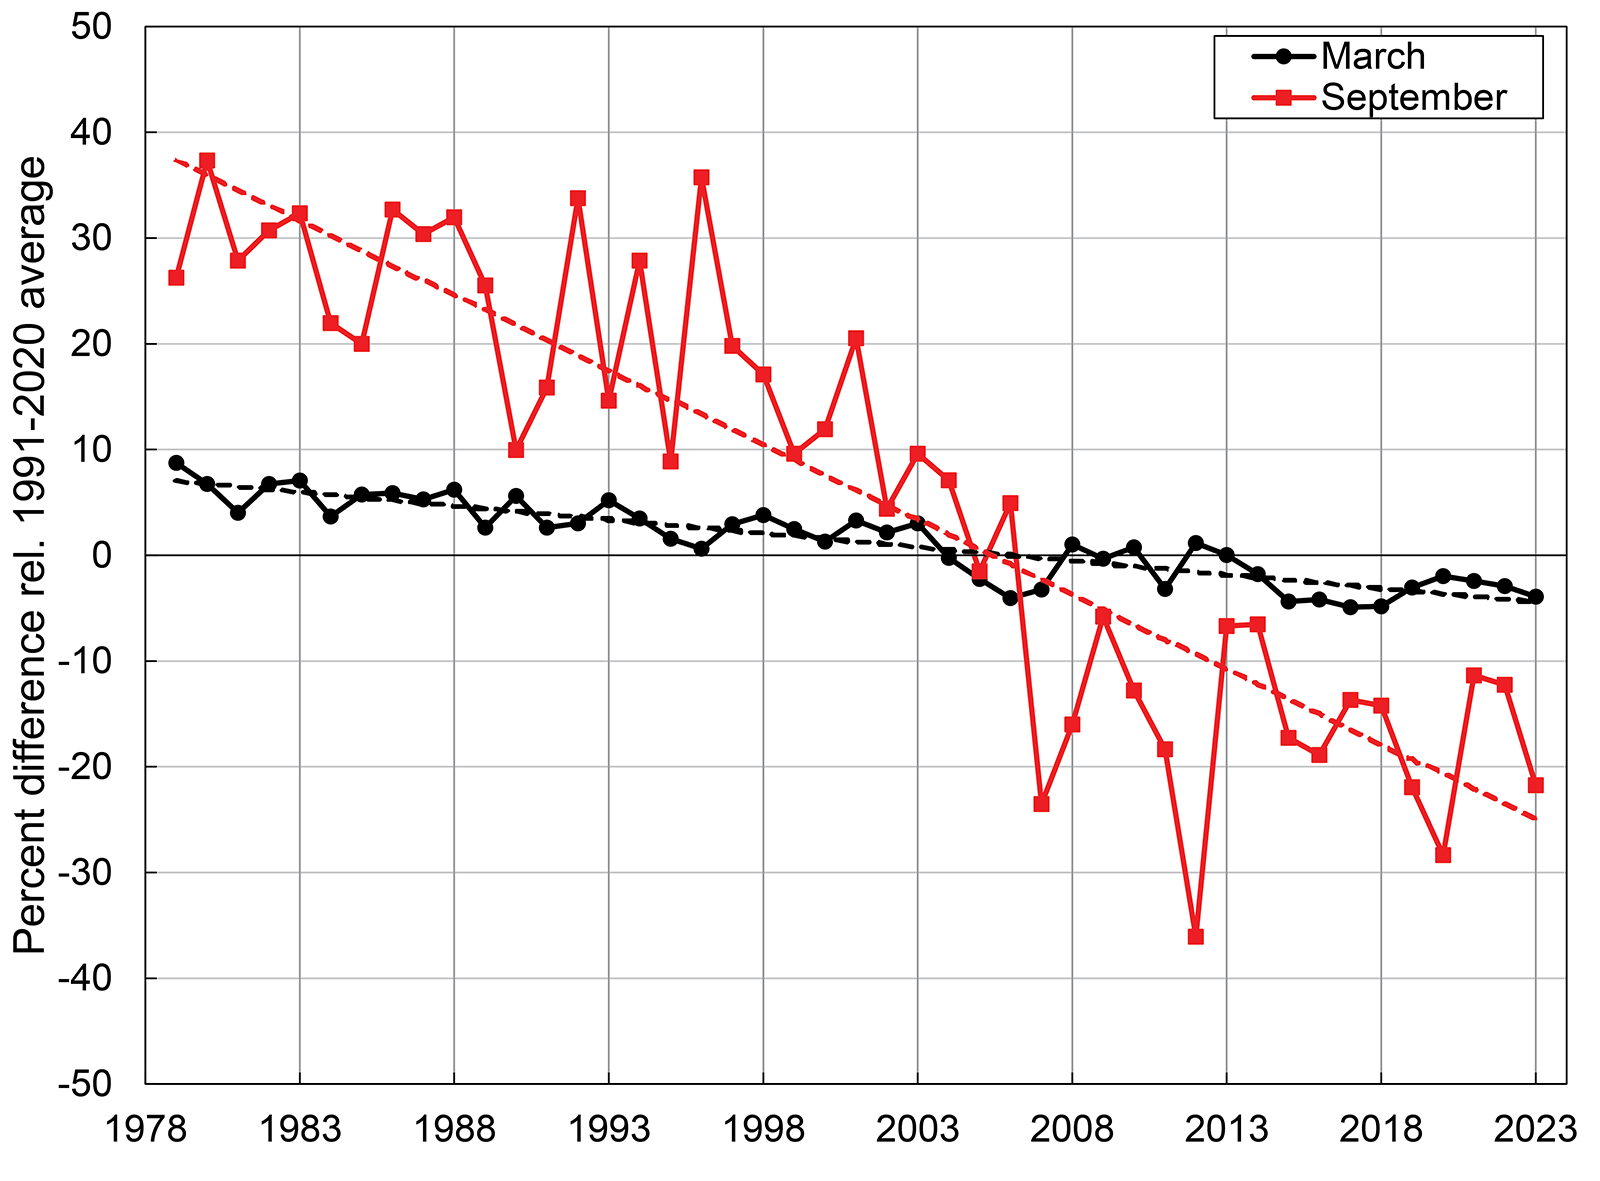
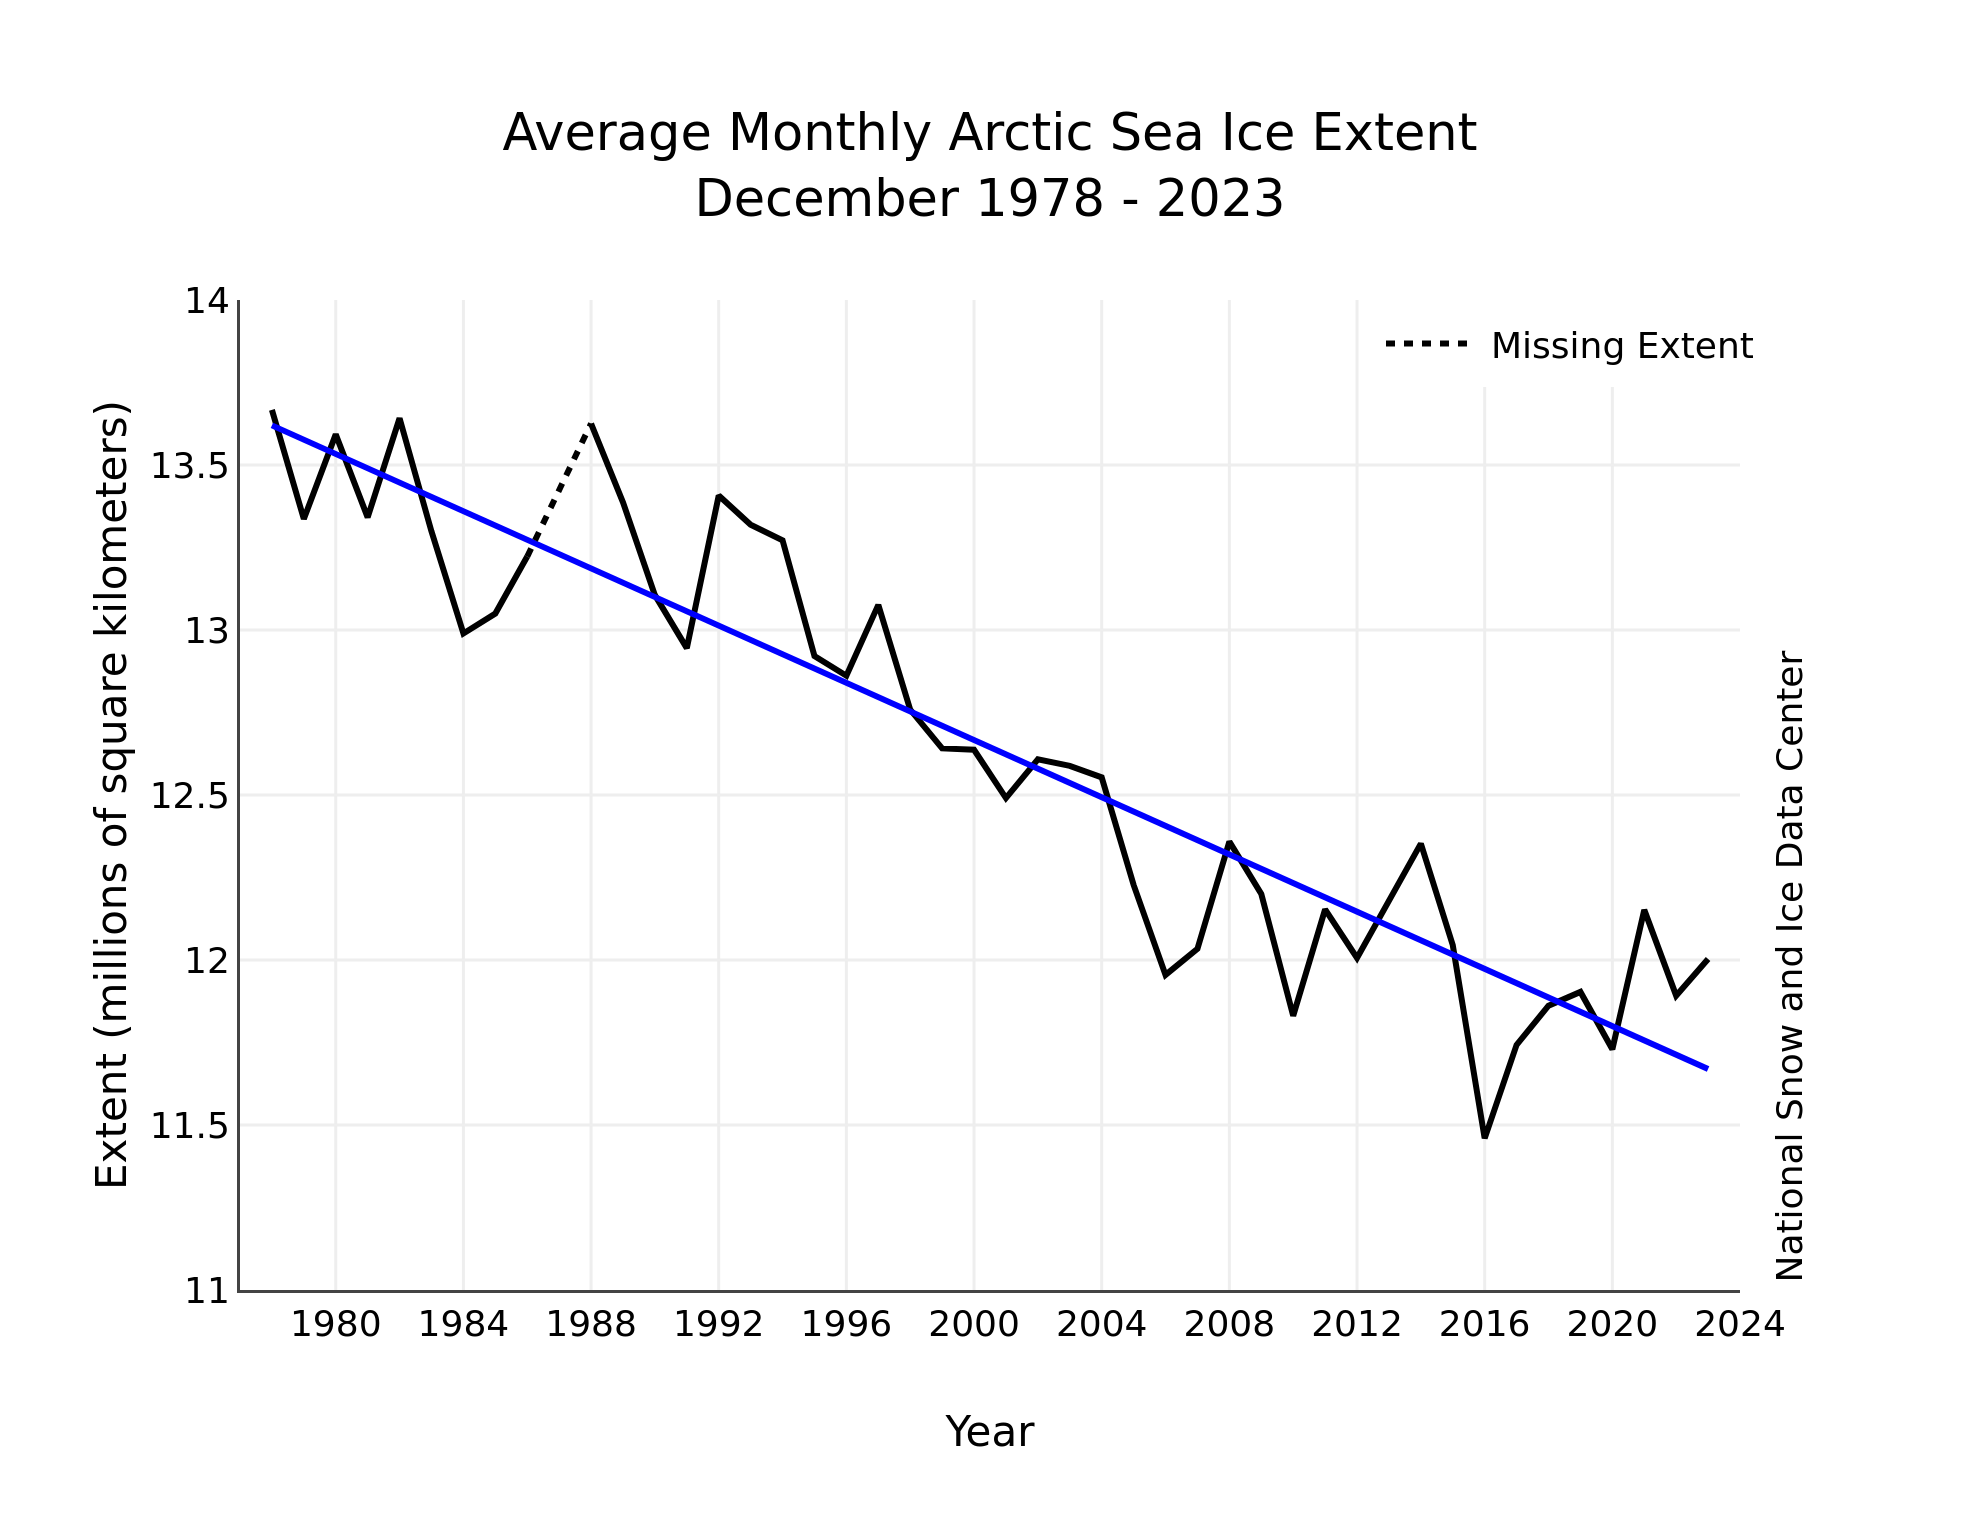
The 2023 Arctic Report Card has been published by the US National Oceanic and Atmospheric Administration (NOAA). All sorts of things are discussed in the report, but sticking to Snow White’s speciality of sea ice here’s an extract:
This satellite record tracks long-term trends, variability, and seasonal changes from the annual extent maximum in late February or March and the annual extent minimum in September. Extents in recent years are ~50% lower than values in the 1980s. In 2023, March and September extents were lower than other recent years, and though not a new record low, they continue the long-term downward trends:
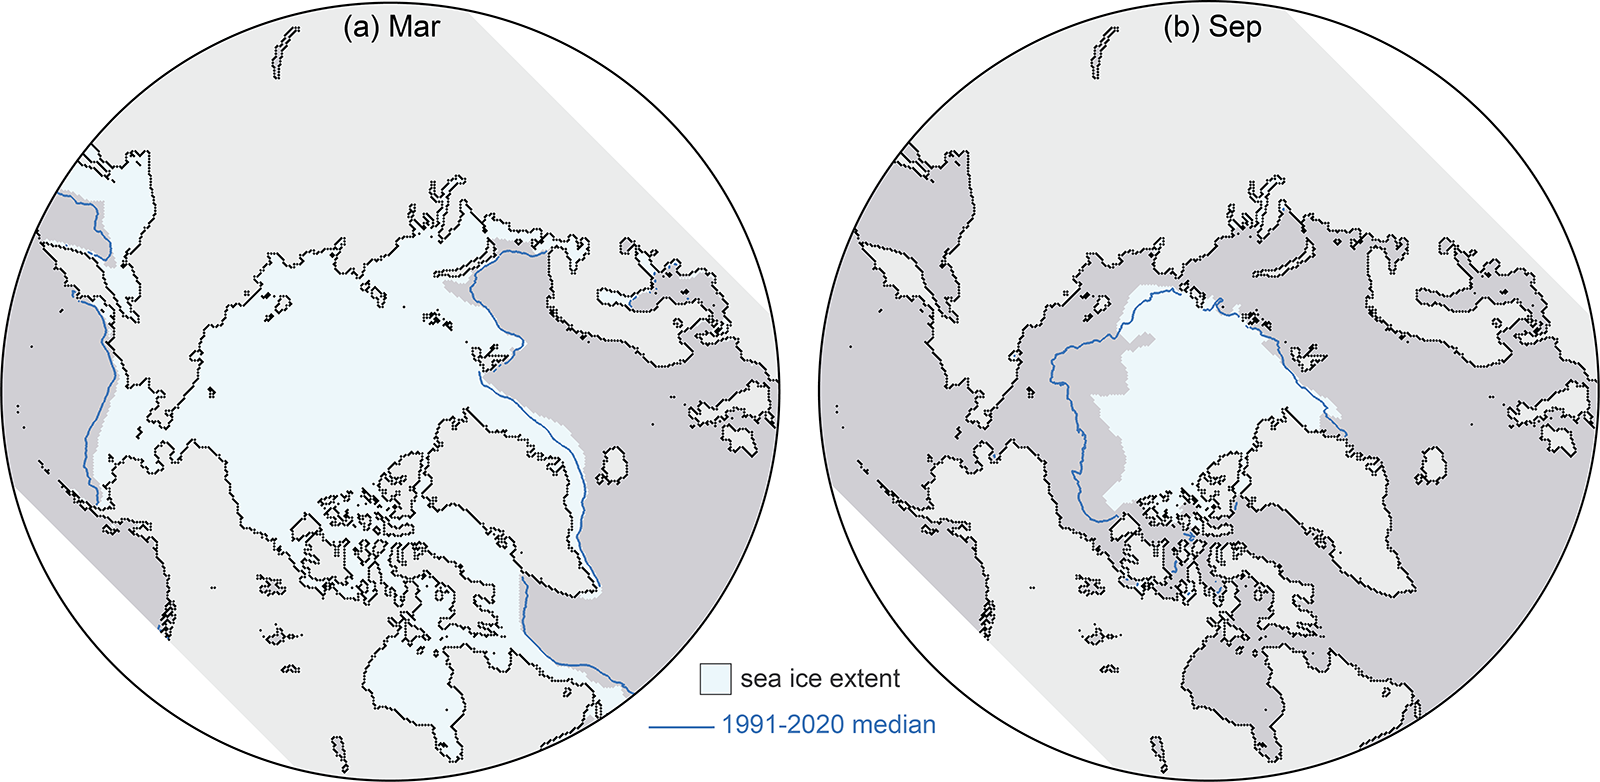
March 2023 was marked by low sea ice extent around most of the perimeter of the sea ice edge, with the exception of the East Greenland Sea where extent was near normal. At the beginning of the melt season, ice retreat was initially fairly slow through April. In May and June, retreat increased to a near-average rate, and then accelerated further through July and August. By mid-July, the ice had retreated from much of the Alaskan and eastern Siberian coast and Hudson Bay had nearly melted out completely. In August, sea ice retreat was particularly pronounced on the Pacific side, opening up vast areas of the Beaufort, Chukchi, and East Siberian Seas. Summer extent remained closer to average on the Atlantic side, in the Laptev, Kara, and Barents Seas
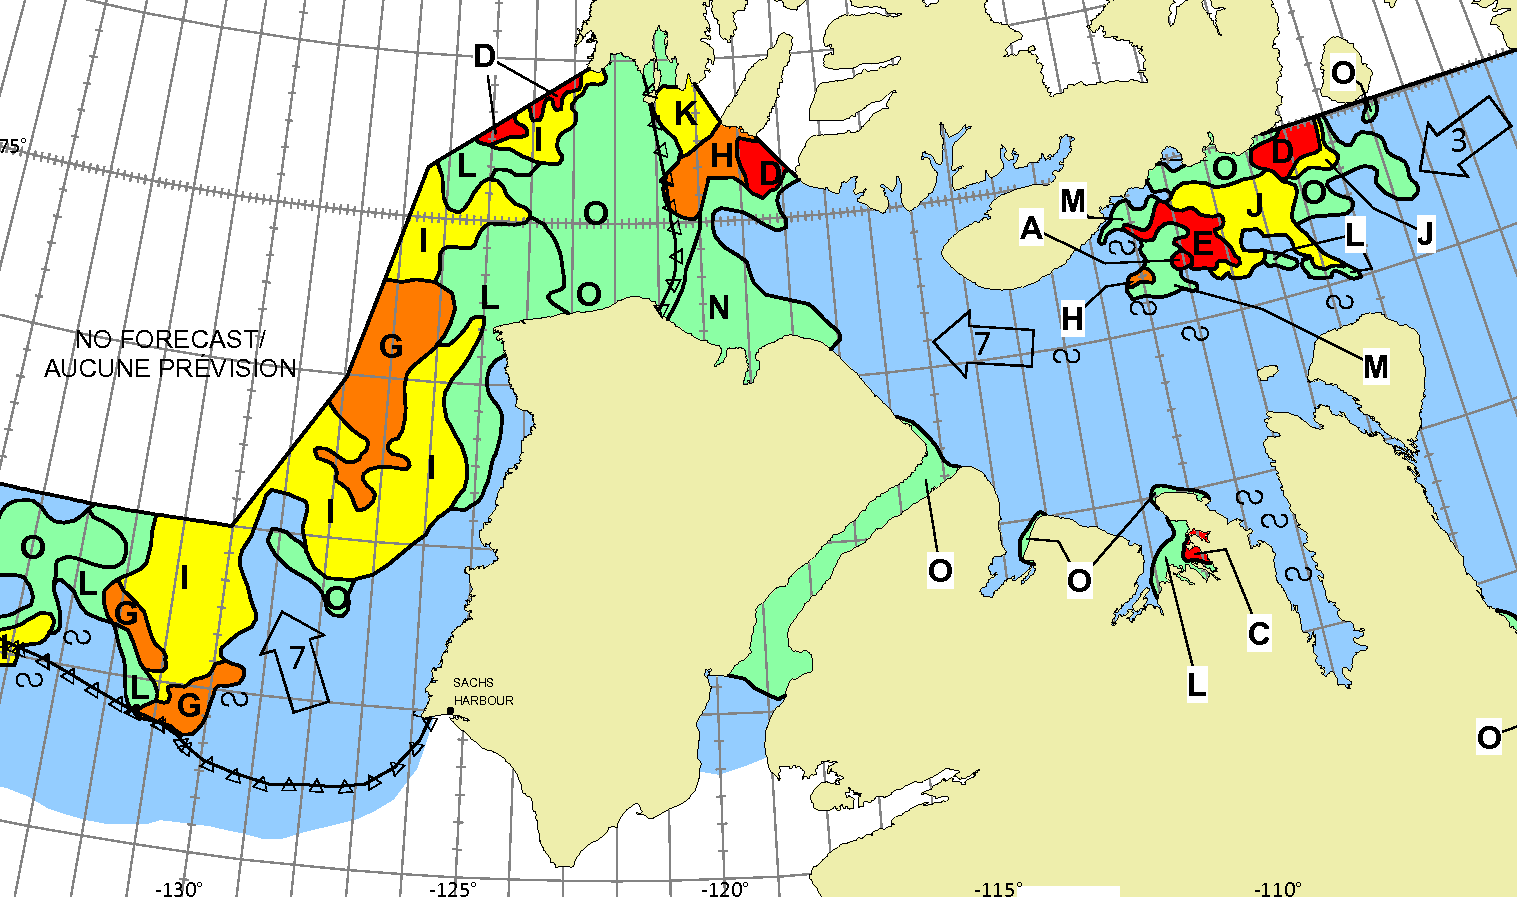
The Northern Sea Route, along the northern Russian coast, was relatively slow to open as sea ice extended to the coast in the eastern Kara Sea and the East Siberian Sea, but by late August, open water was found along the coast through the entire route. The Northwest Passage through the Canadian Archipelago became relatively clear of ice, though ice continued to largely block the western end of the northern route through M’Clure Strait through the melt season. Nonetheless, summer 2023 extent in the Passage was among the lowest observed in the satellite record, based on Canadian Ice Service ice charts.
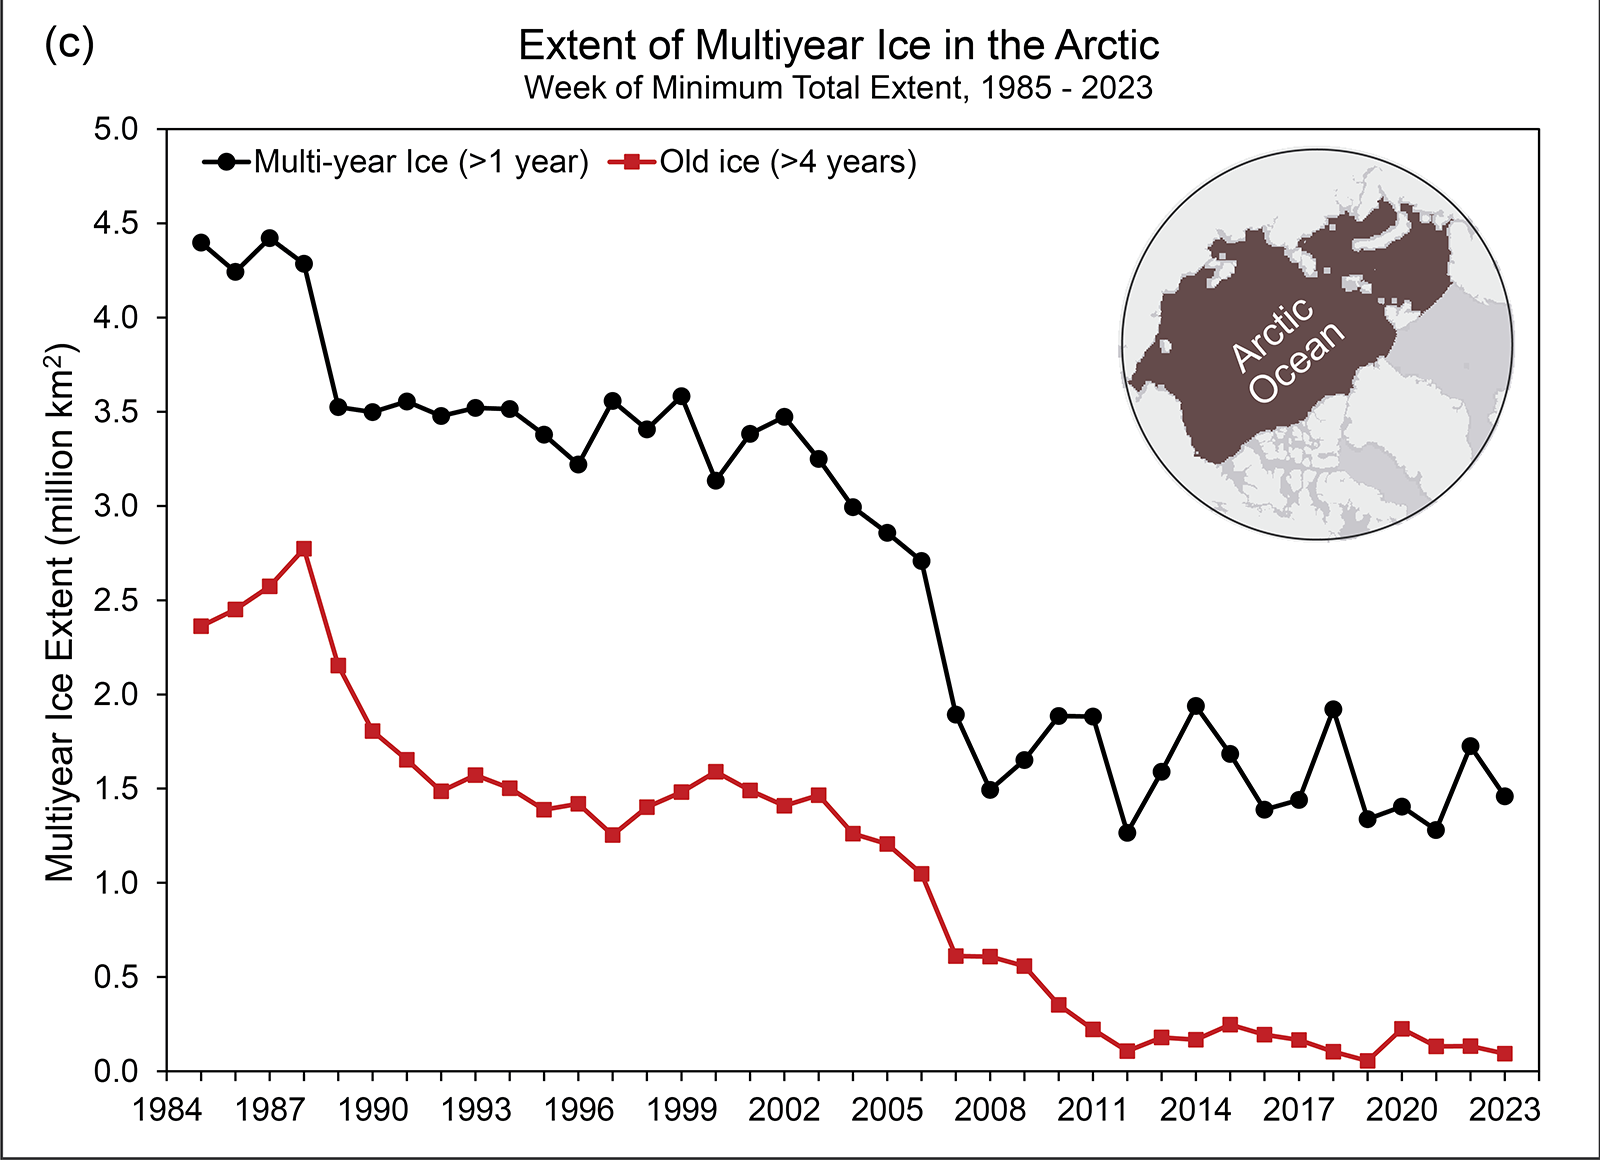
Tracking the motion of ice in passive microwave imagery using feature tracking algorithms can be used to infer sea ice age. Age is a proxy for ice thickness because multiyear ice generally grows thicker through successive winter periods. Multiyear ice extent has shown interannual oscillations but no clear trend since 2007, reflecting variability in the summer sea ice melt and export out of the Arctic. After a year when substantial multiyear ice is lost, a much larger area of first-year ice generally takes its place. Some of this first-year ice can persist through the following summer, contributing to the replenishment of the multiyear ice extent:
However, old ice (here defined as >4 years old) has remained consistently low since 2012. Thus, unlike in earlier decades, multiyear ice does not remain in the Arctic for many years. At the end of the summer 2023 melt season, multiyear ice extent was similar to 2022 values, far below multiyear extents in the 1980s and 1990s:
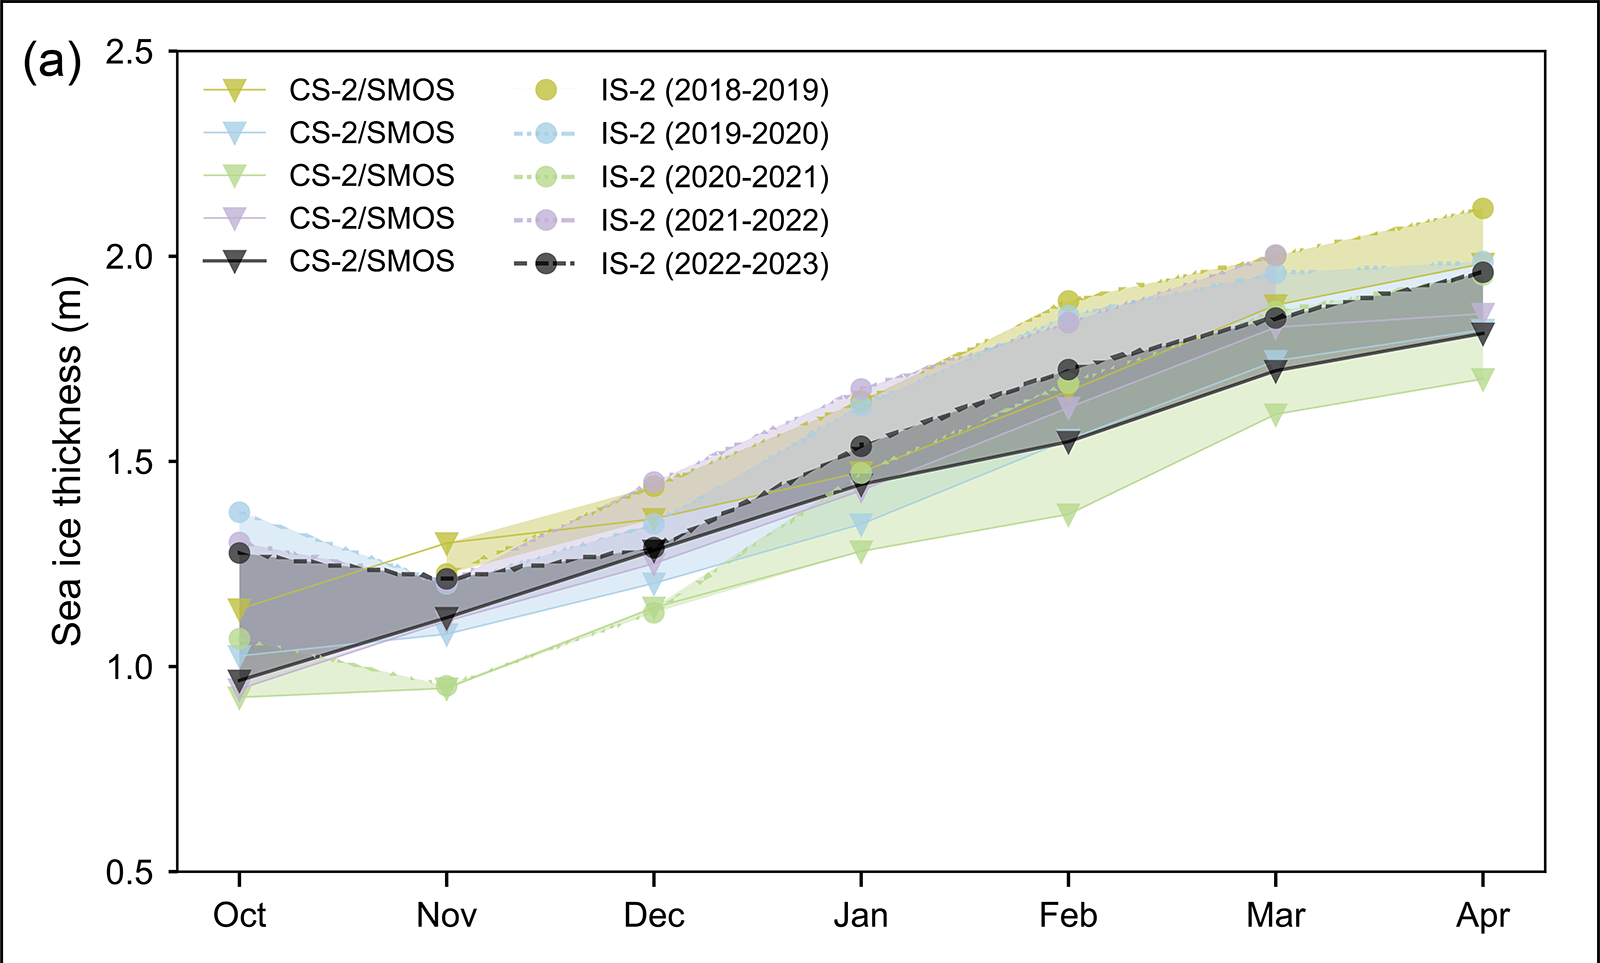
Estimates of sea ice thickness from satellite altimetry can be used to more directly track this important metric of sea ice conditions, although the data record is shorter than for extent and ice age. Data from ICESat-2 and CryoSat-2/SMOS satellite products tracking the seasonal October to April winter ice growth over the past four years (when all missions have been in operation) show a mean thickness generally thinner than the 2021/22 winter but with seasonal growth typical of recent winters:
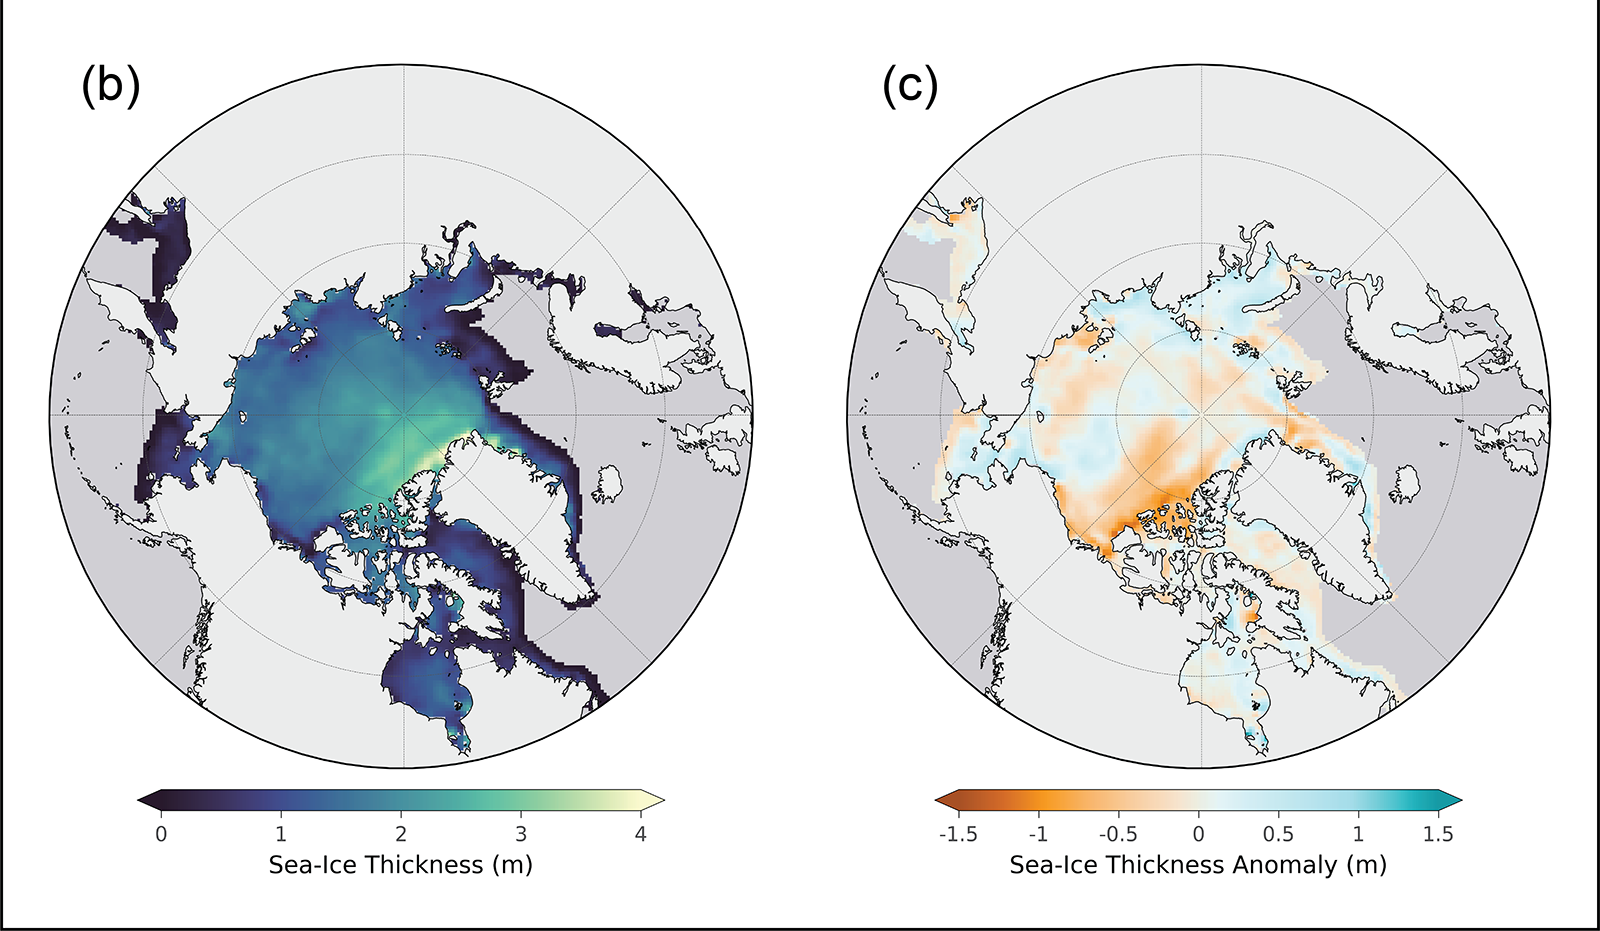
April 2023 thickness from CryoSat-2/SMOS relative to the 2011-22 April mean shows that the eastern Beaufort Sea and the East Siberian Sea had relatively thinner sea ice than the 2011-22 mean, particularly near the Canadian Archipelago. Thickness was higher than average in much of the Laptev and Kara Seas and along the west and northwest coast of Alaska, extending northward toward the pole. The East Greenland Sea had a mixture of thicker and thinner than average ice:
An excellent analysis (IMHO!), but I do have one quibble. I was following events in the Northwest Passage very closely last summer, and according to the Canadian Ice Service on September 1st:
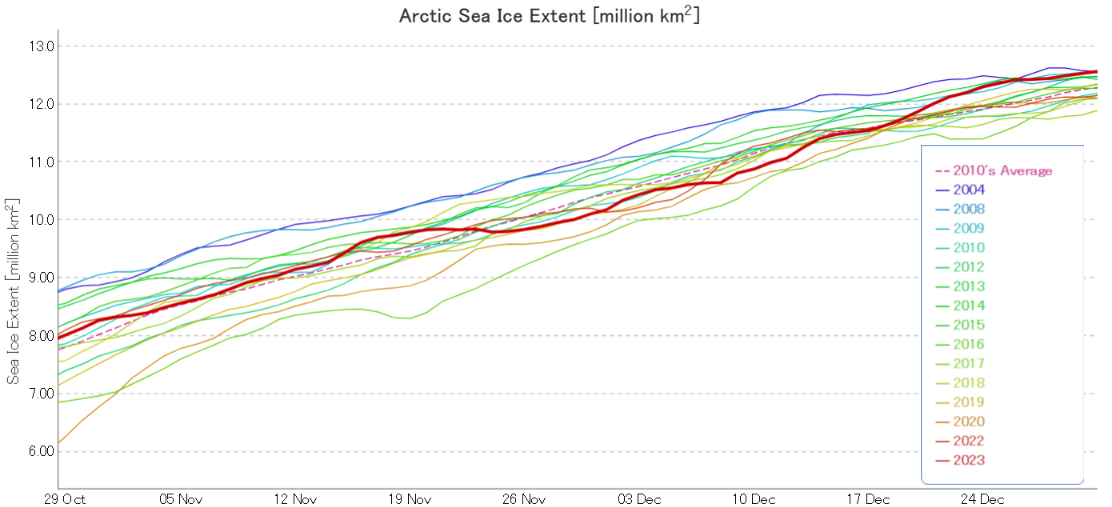
Whilst waiting for the all important thickness and volume data to arrive, we’ll start the new year in traditional fashion with a graph of JAXA extent:
The 2023 calendar year finished with this particular extent metric sitting at 15th lowest in the satellite era.
From Niall Dollard on the Arctic Sea Ice Forum comes evidence via the Sentinel 1A satellite that an arch formed in the Nares Strait between Greenland and Ellesmere Island in late December:
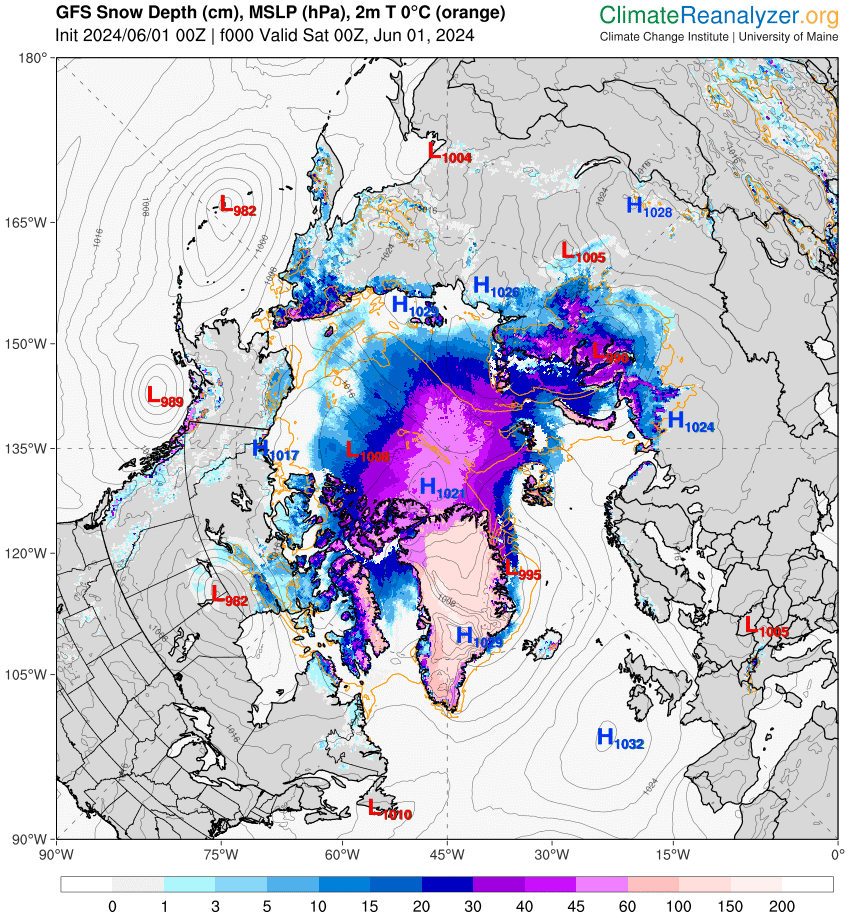
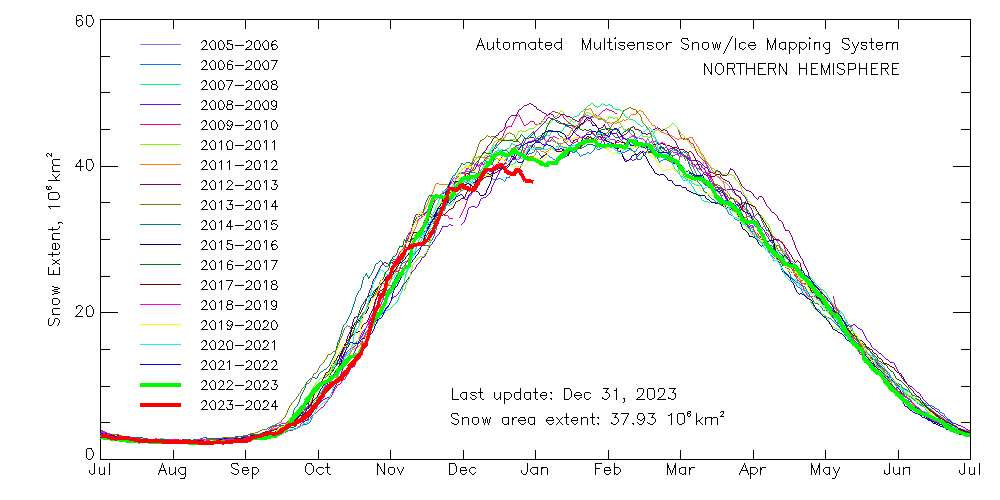
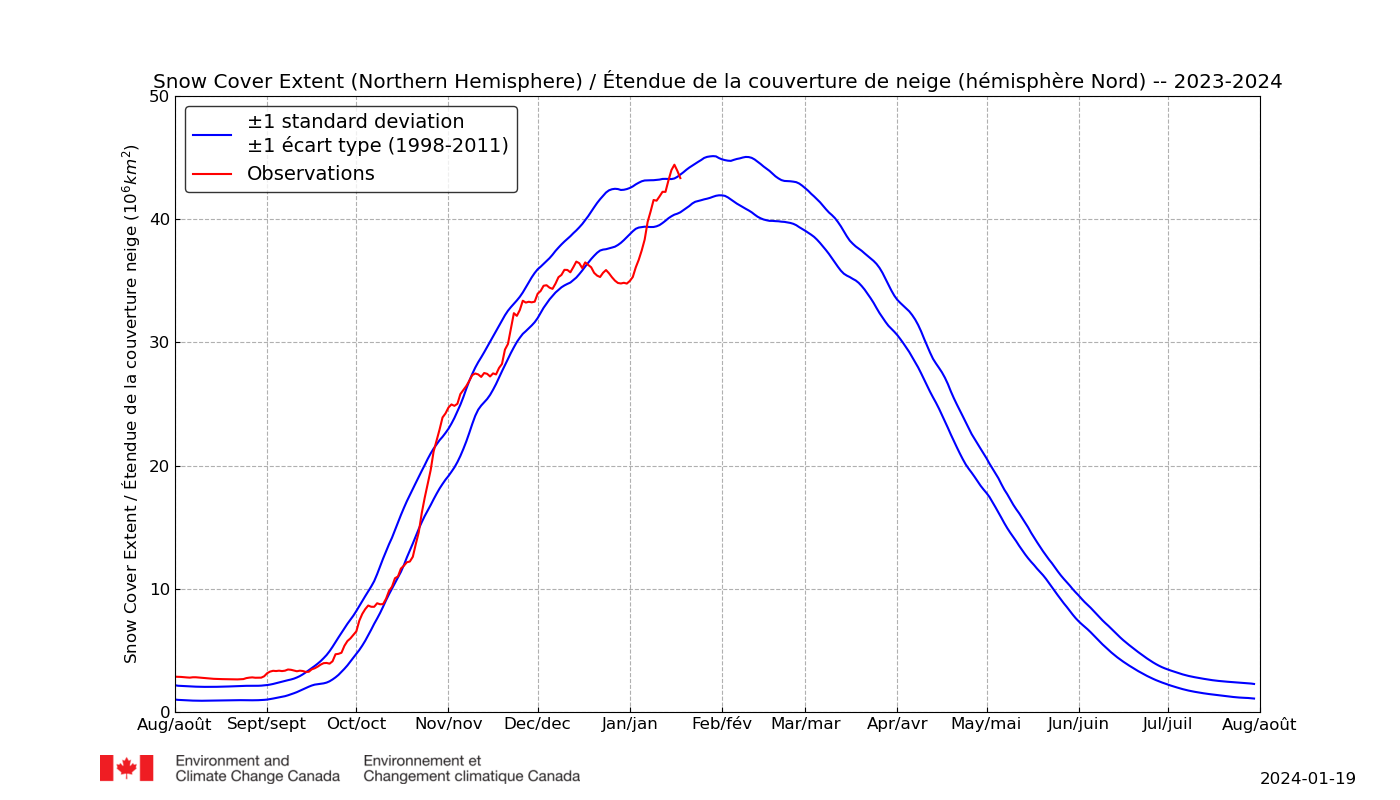
Please note the current record low NH snow extent. Matt predicts all that is about to change:
How sure? And in what way "totally different"?
Have you pointed out to Tony yet that the current daily snow cover data you cite utterly negates his recent assertion that "Autumn/Winter snow cover has been increasing for almost 60 years"?
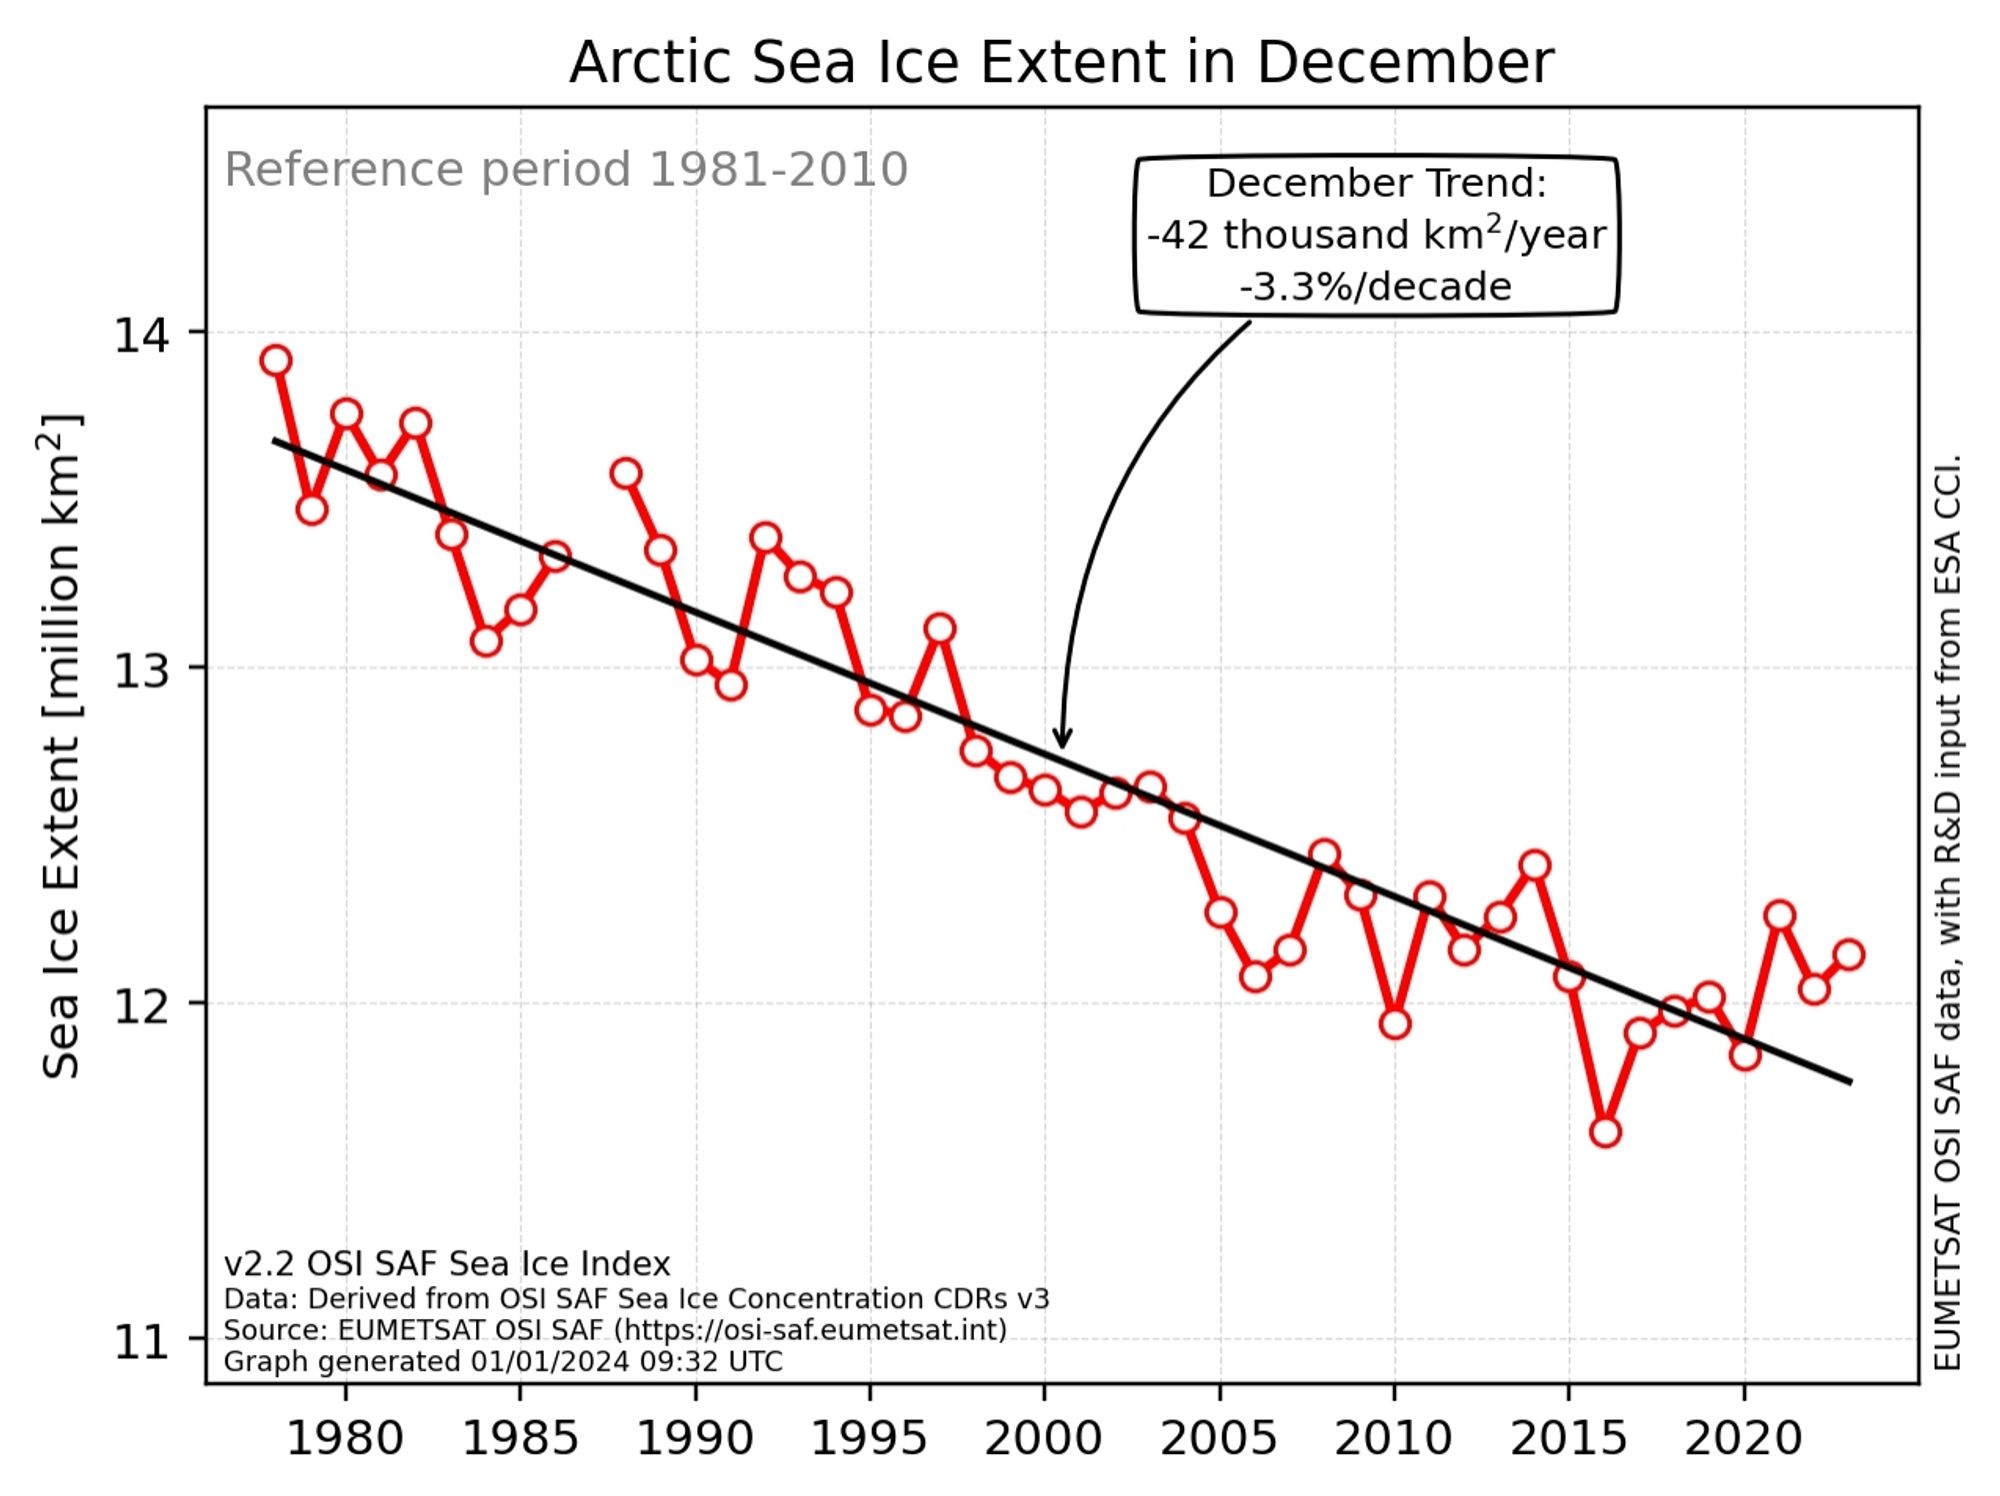
Hot off the Scandinavian virtual printing presses, here is the official December Arctic sea ice extent trend graph from the OSI SAF:
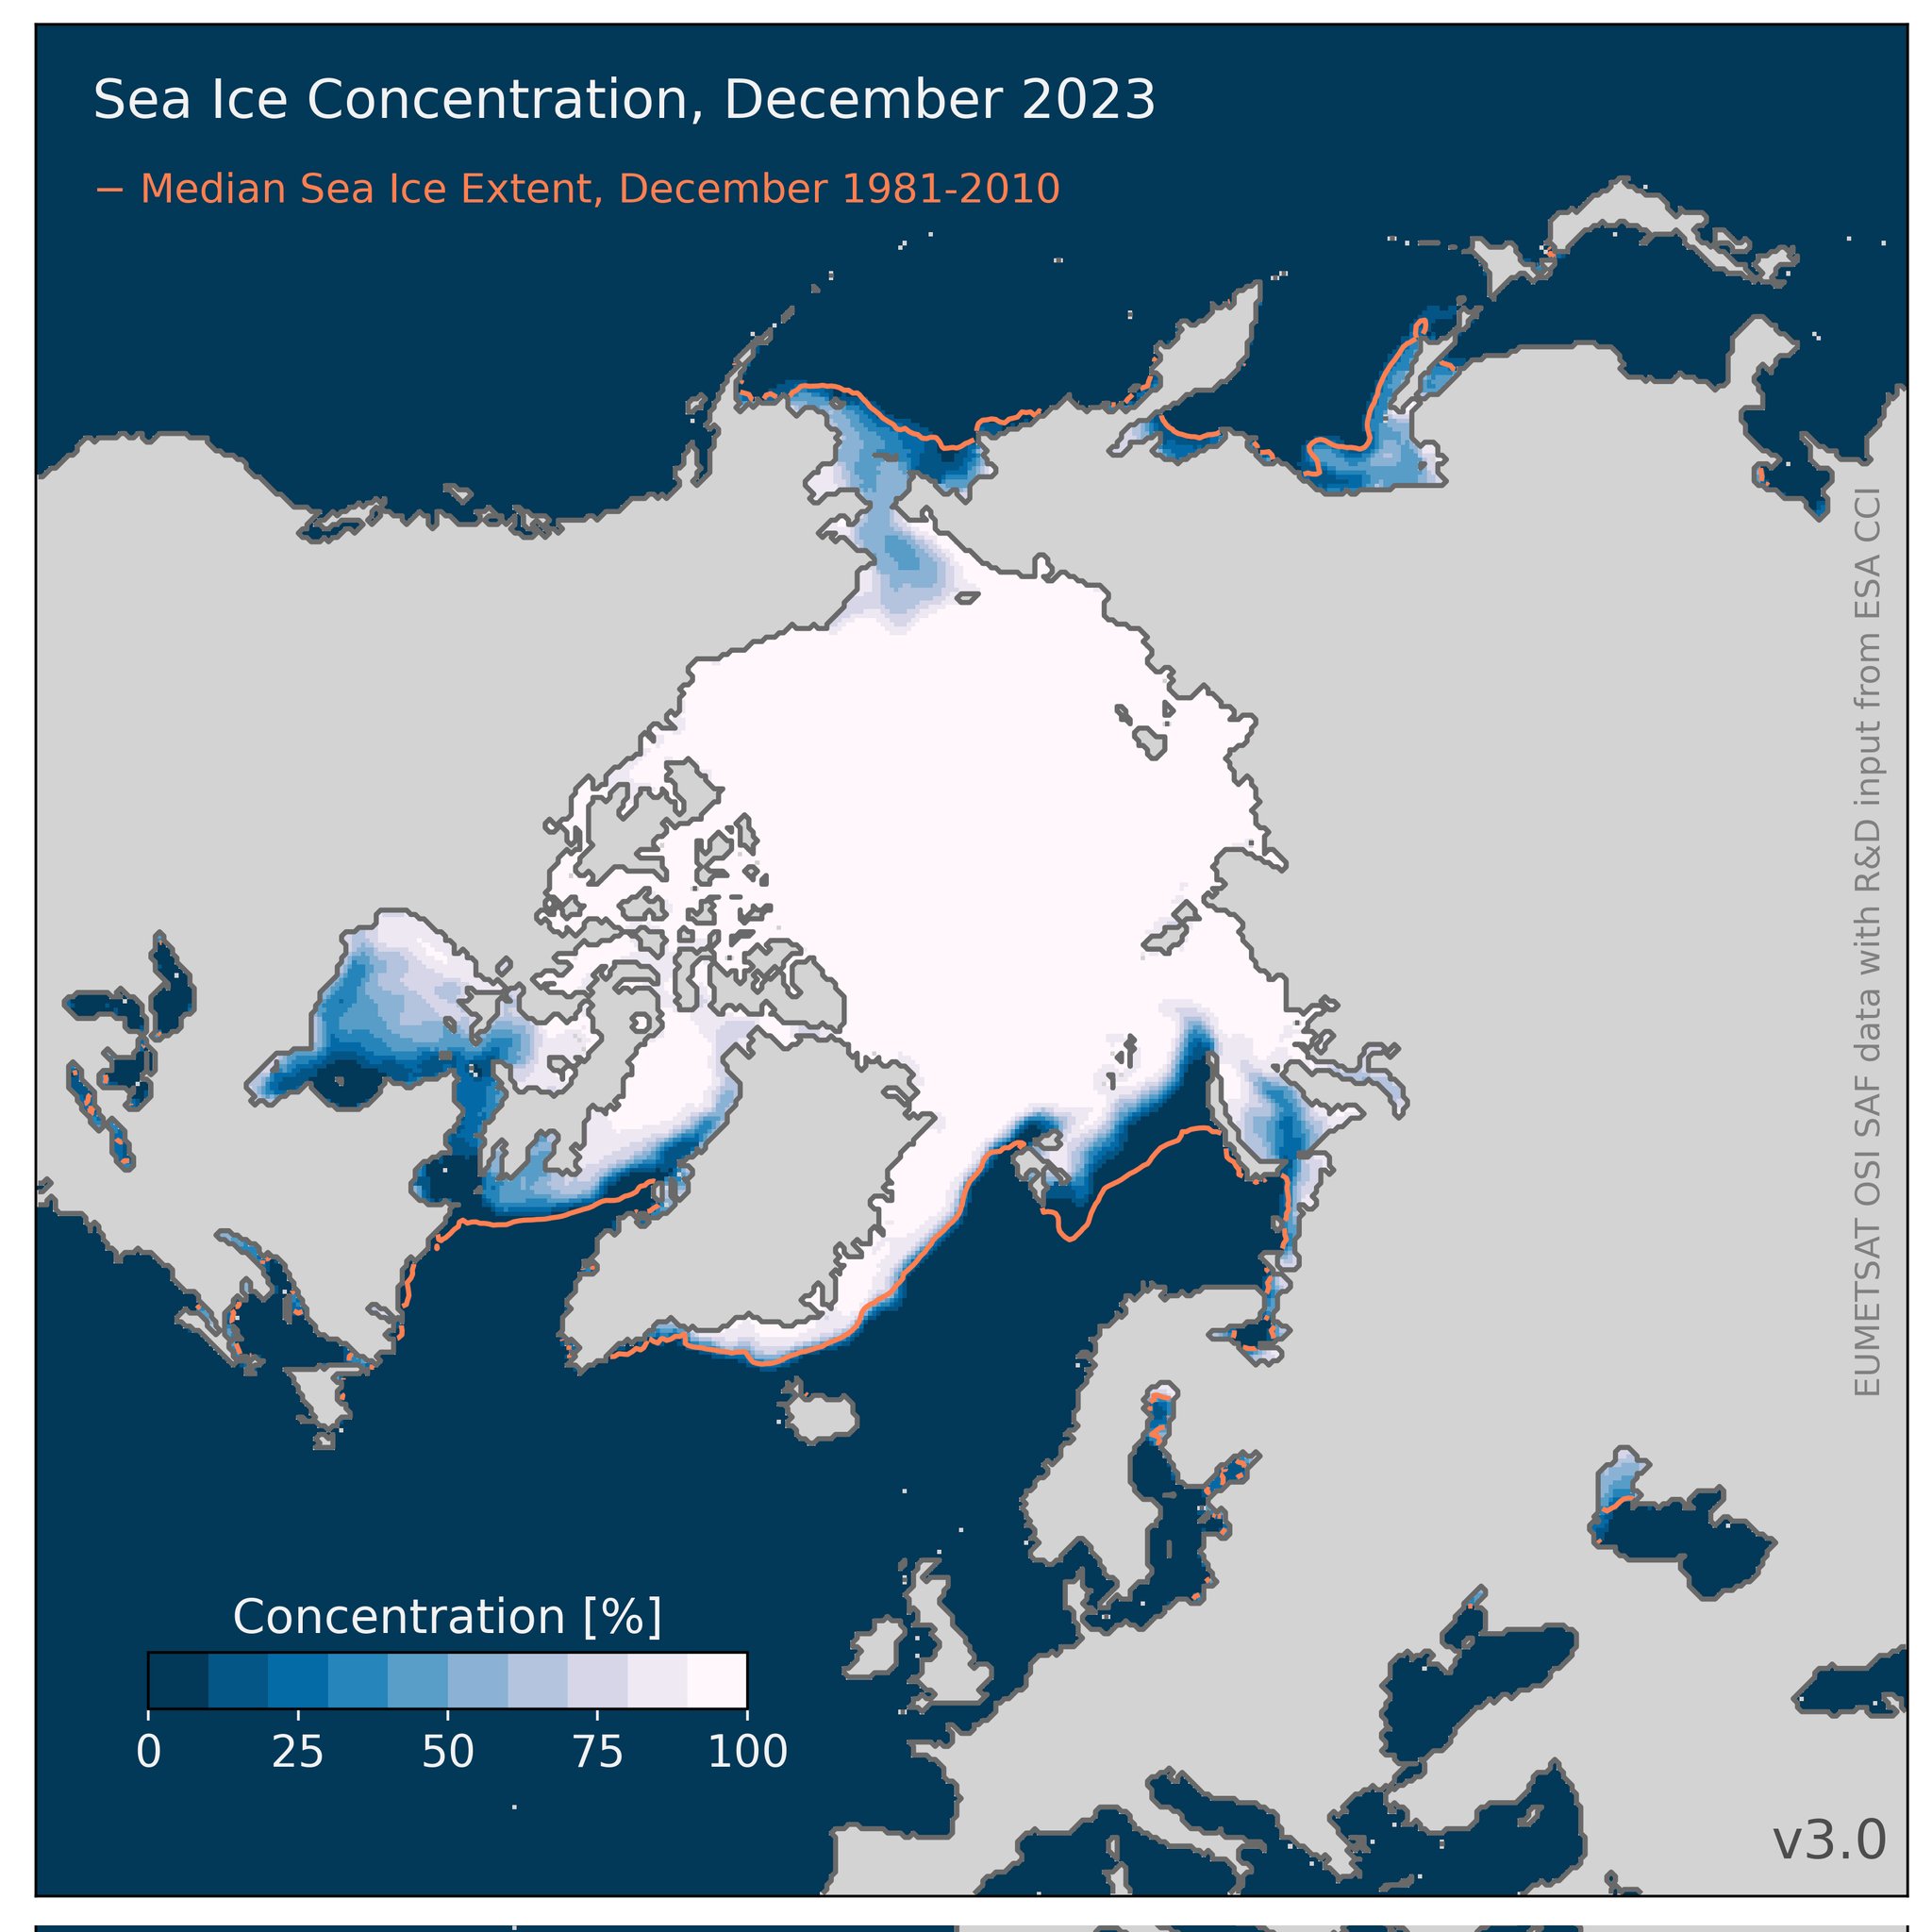
That’s “Steve”/Tony’s current metric du jour. When do you suppose he will bring it to the attention of his horde of regular readers? It’s accompanied by this matching concentration map:
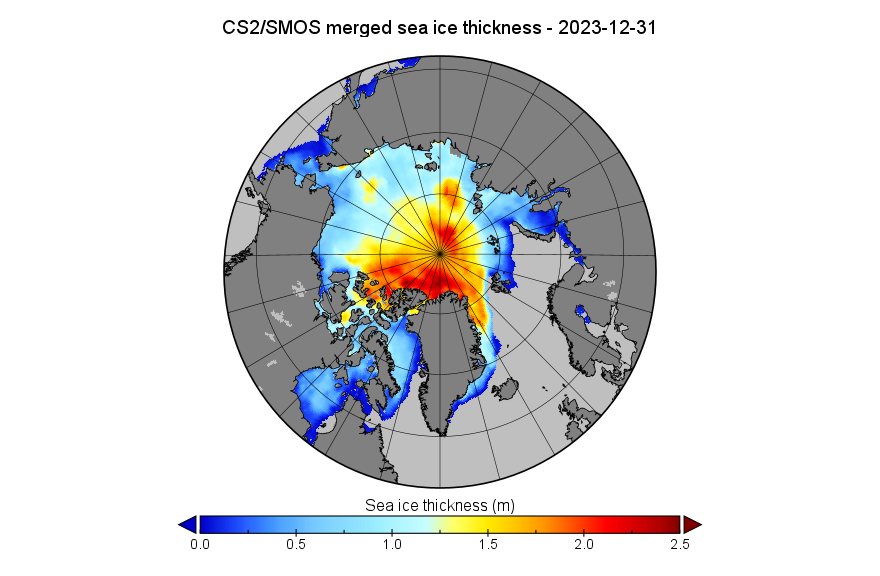
Here too is the CryoSat-2/SMOS thickness map for December 31st, in a different format to the one usually used here:
[Update – January 3rd]
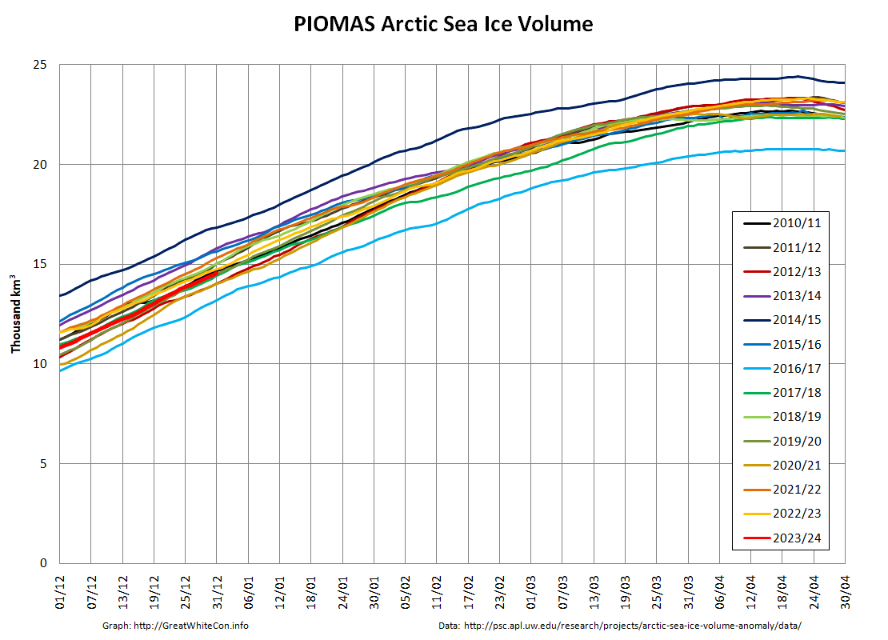
The December PIOMAS modelled gridded thickness data has been released. The calculated volume is 6th lowest in the satellite era:
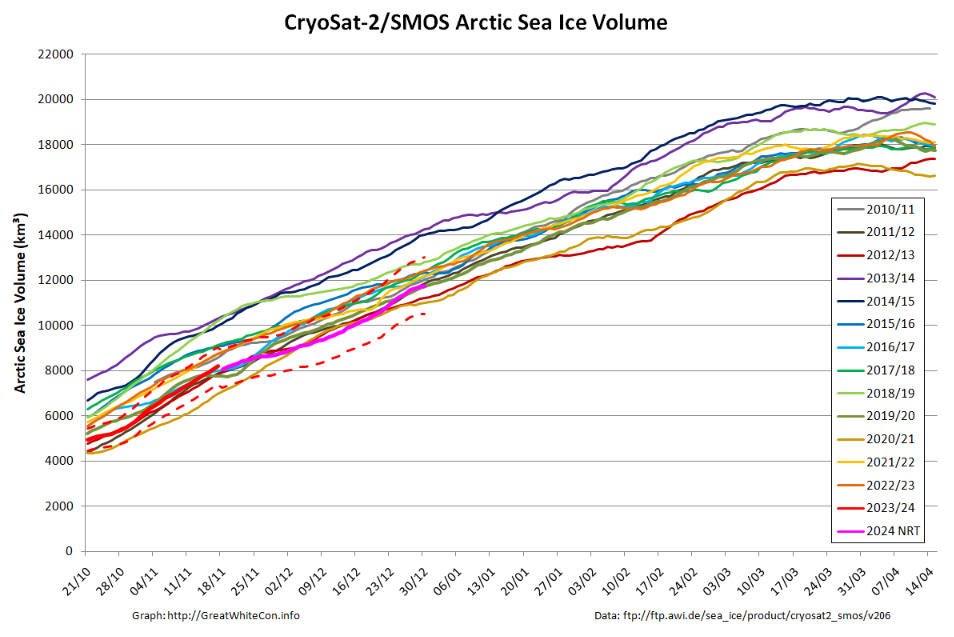
Here is the equivalent CS2/SMOS volume graph
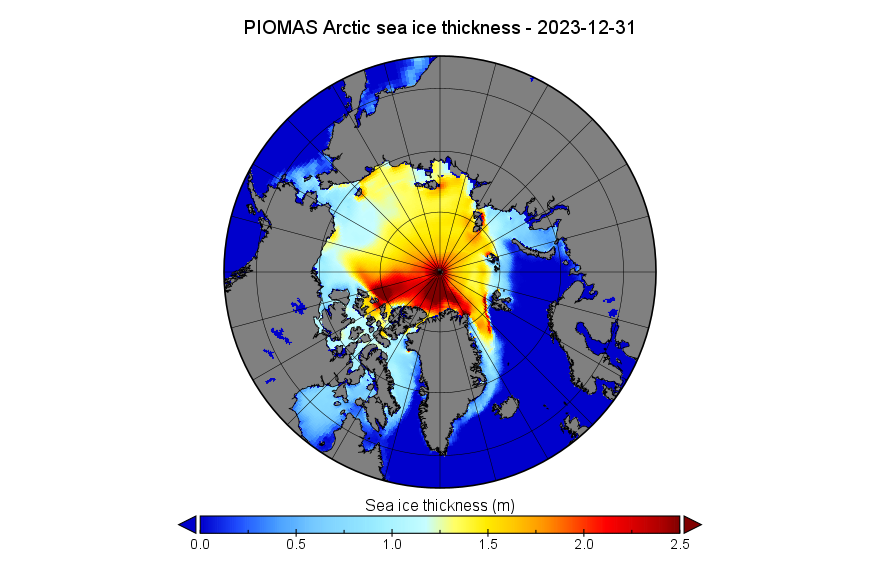
Here too is the PIOMAS thickness map for December 31st:
This uses the same Greenland down orientation and 2.5 meter maximum scale value as the CS2/SMOS map above.
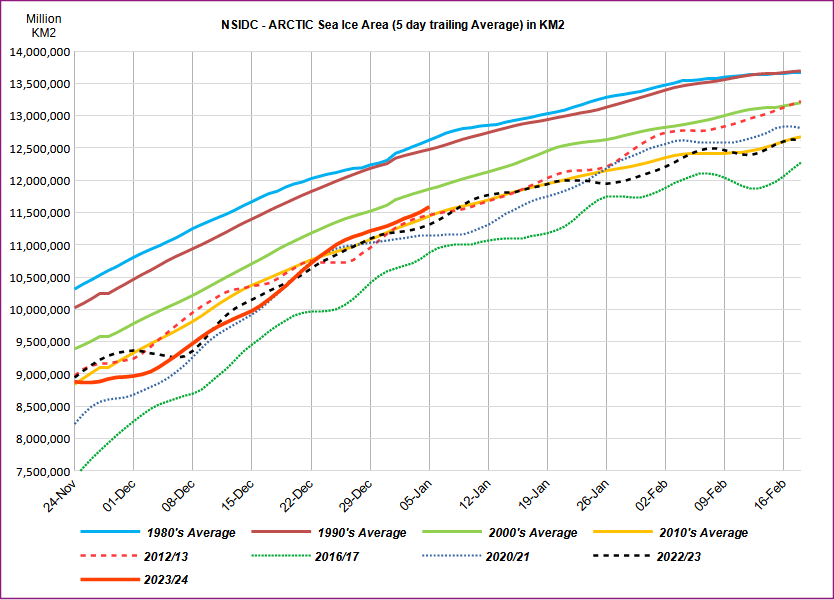
The end of 2023 had above average sea ice growth, bringing the daily extent within the interdecile range, the range spanning 90 percent of past sea ice extents for the date. Rapid expansion of ice in the Chukchi and Bering Seas and across Hudson Bay was responsible.
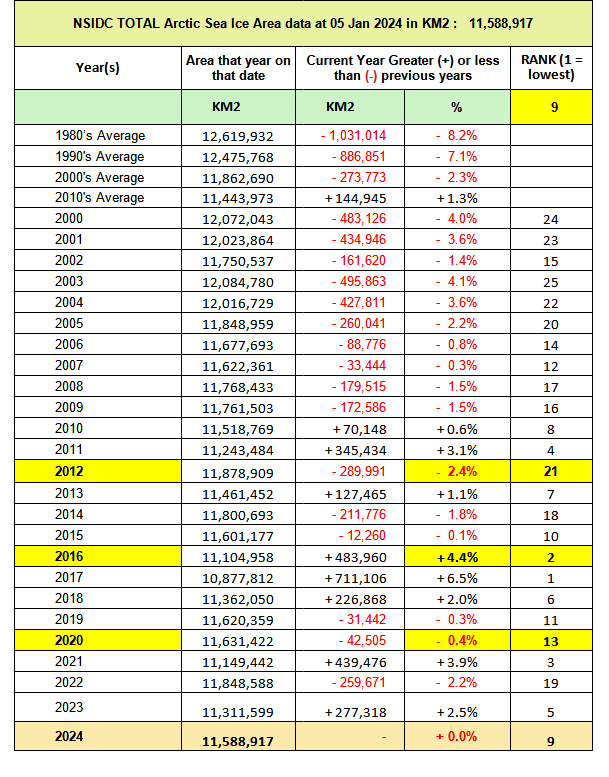
Average Arctic sea ice extent for December 2023 was 12.00 million square kilometers, ninth lowest in the 45-year satellite record . Sea ice extent increased by an average of 87,400 square kilometers per day, markedly faster than the 1981 to 2010 average of 64,100 square kilometers per day.
After a delayed start to the freeze-up in Hudson Bay, sea ice formed quickly from west to east across the bay, leaving only a small area of open ocean near the Belcher Islands at month’s end. In the northern Atlantic, sea ice extent remained below average extent, as has been typical for the past decade.
For December overall, 2023 had the third highest monthly gain in the 45-year record at 2.71 million square kilometers, behind 2006 at 2.85 million square kilometers and 2016 at 2.78 million square kilometers.
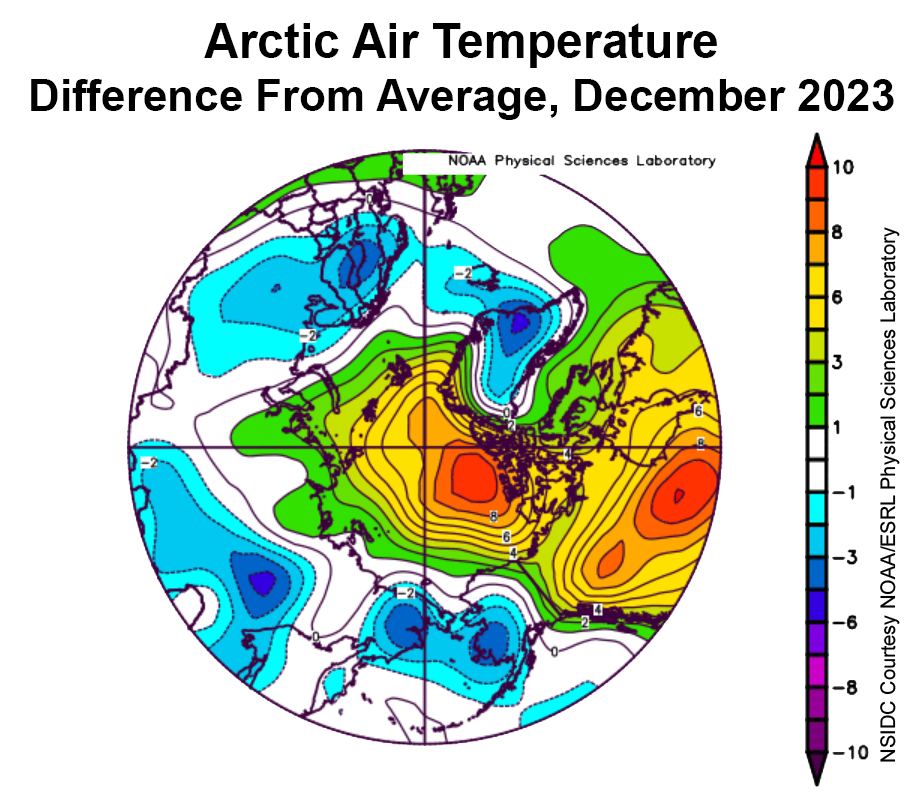
Moving on to the “Conditions in context” section:
Warm conditions prevailed over the central Arctic Ocean and Beaufort Sea regions, as well as over Hudson Bay and much of northern Canada, with air temperatures at the 925 millibar level (around 2,500 feet above sea level) 8 to 9 degrees Celsius above the 1991 to 2020 average. Elsewhere, relatively cool conditions prevailed, with air temperatures 2 to 4 degrees Celsius below average in southwestern Alaska, easternmost Russia, Scandinavia, and southeast Greenland. Cool conditions in the Bering and southern Chukchi Seas explain the rapid ice growth there. By contrast, the warm conditions over Hudson Bay, continuing since November, explain its delayed start of ice formation there.
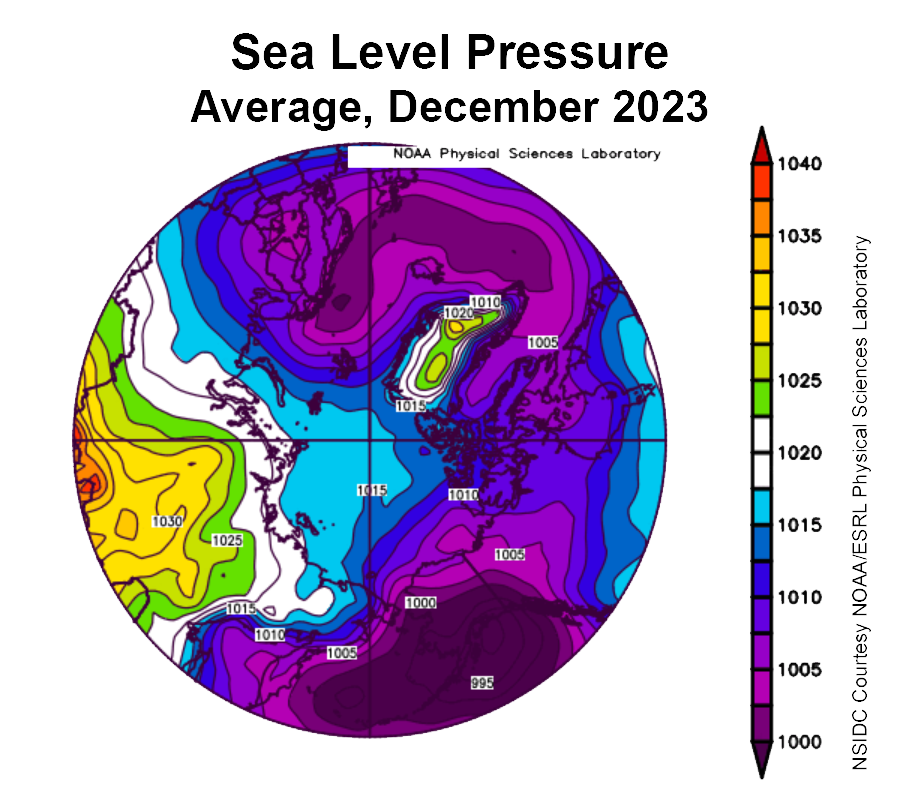
The atmospheric circulation pattern for December was marked by low sea level pressure over the Gulf of Alaska and northern Europe and high sea level pressure over central Russia. This pattern led to cold Arctic air flowing across the Chukchi Sea and into the Bering Sea as well as advection of relatively warm air across Canada into the Beaufort Sea:
Here’s a taste, but there’s much more at the dedicated article linked to above:
[Update – January 12th]
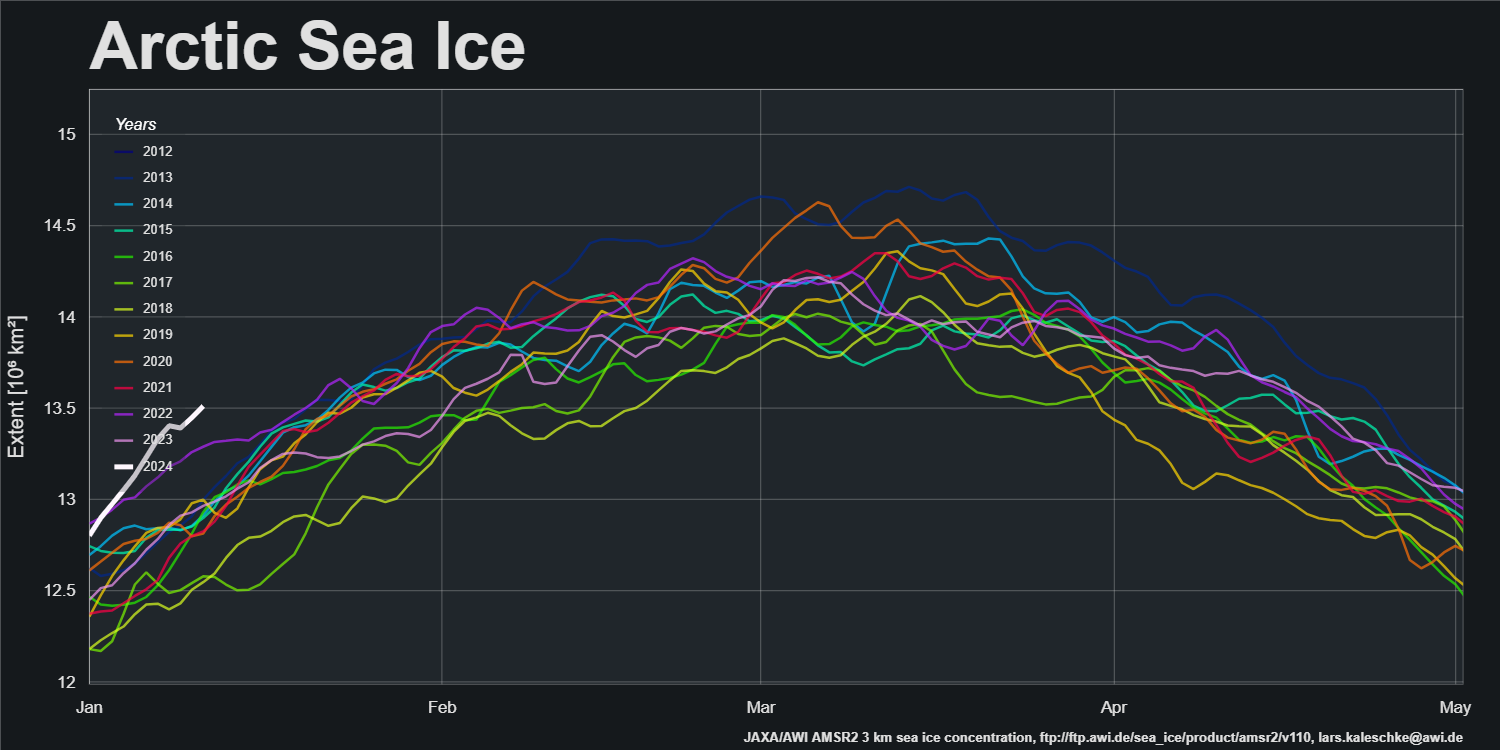
A change is as good as a rest, so here’s the AWI “high resolution” AMSR2 Arctic wide sea ice extent graph
It’s currently highest for the date in the AMSR2 era by a significant margin.
Here too is the ice age map for the end of 2023:
[Update – January 19th]
Something seems to have gone wrong with the processing of the mid-month PIOMAS gridded thickness data. For the moment we’ll have to make do with just the CryoSat-2/SMOS thickness map:
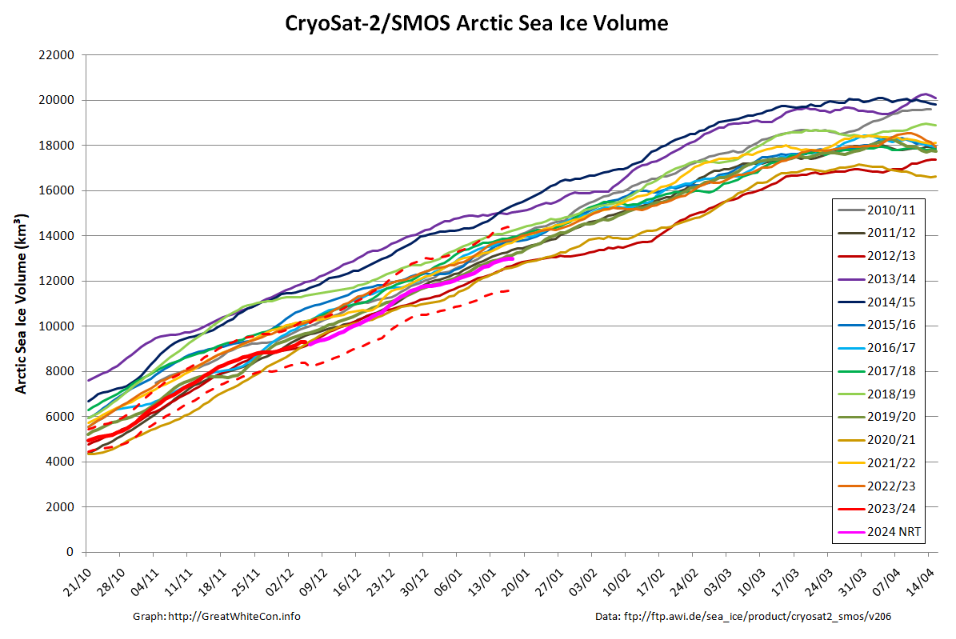
and volume graph:
With the perennial caveat of a probable upward revision when the reanalysed data is released, Arctic sea ice volume is still close to the bottom of the range during the CryoSat-2 era.
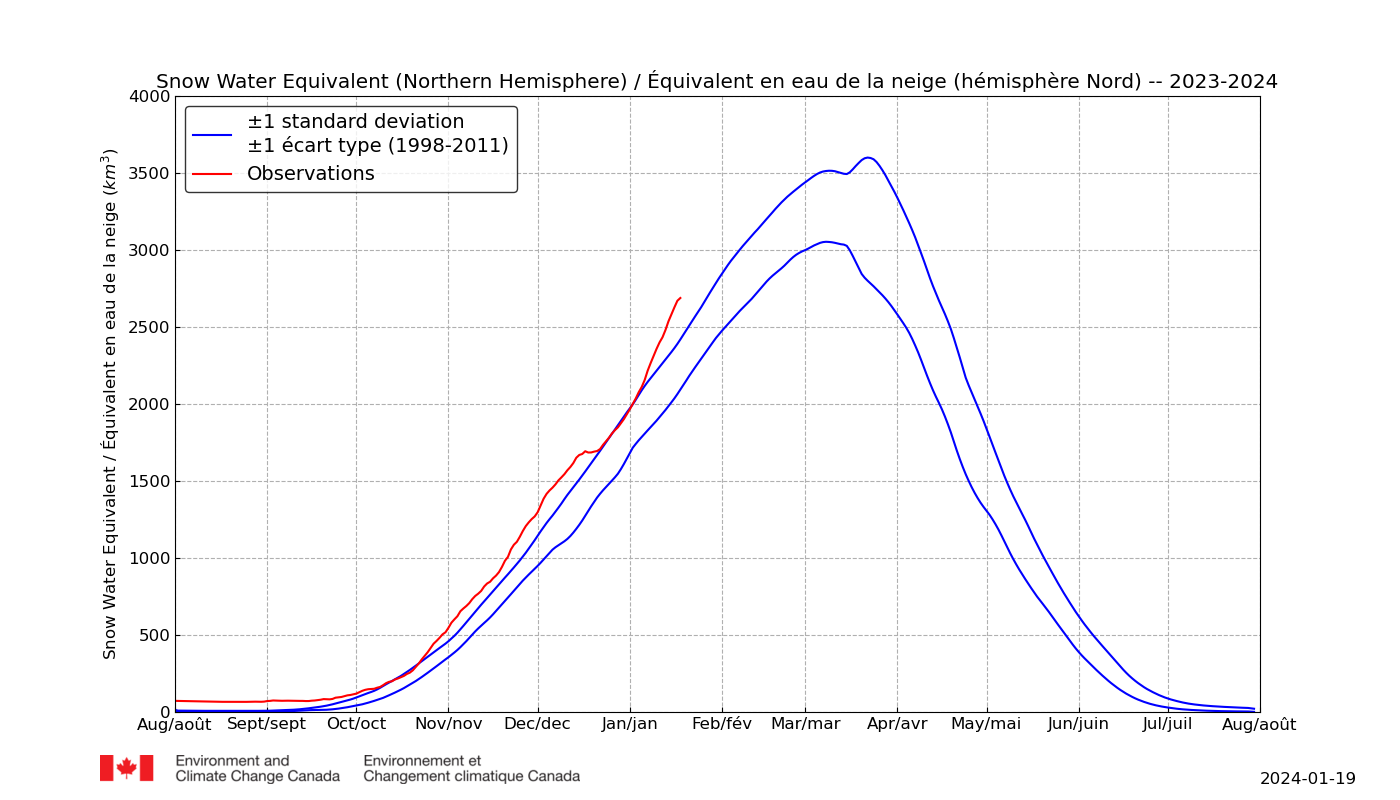
In addition especially for Matt, “Steve”/Tony and numerous others of a “skeptical” persuasion, here are the latest Environment & Climate Change Canada snow extent and snow water equivalent graphs for the northern hemisphere:
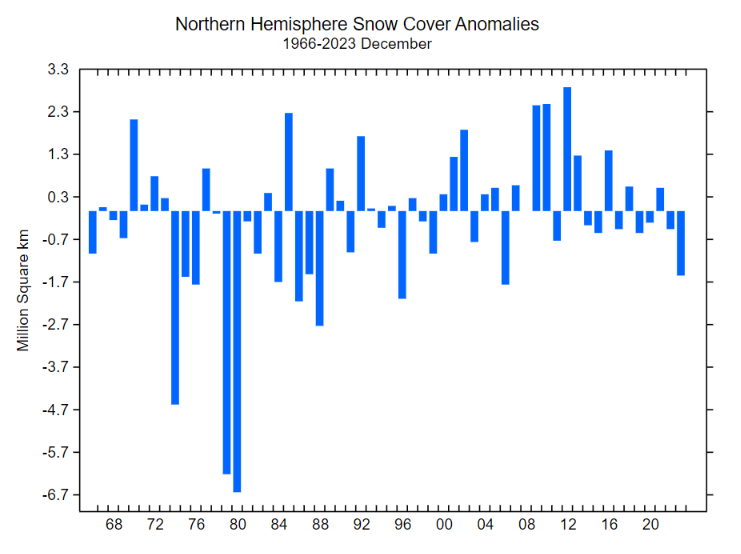
Last but certainly not least is the Rutgers Global Snow Lab northern hemisphere snow cover anomaly chart for December:
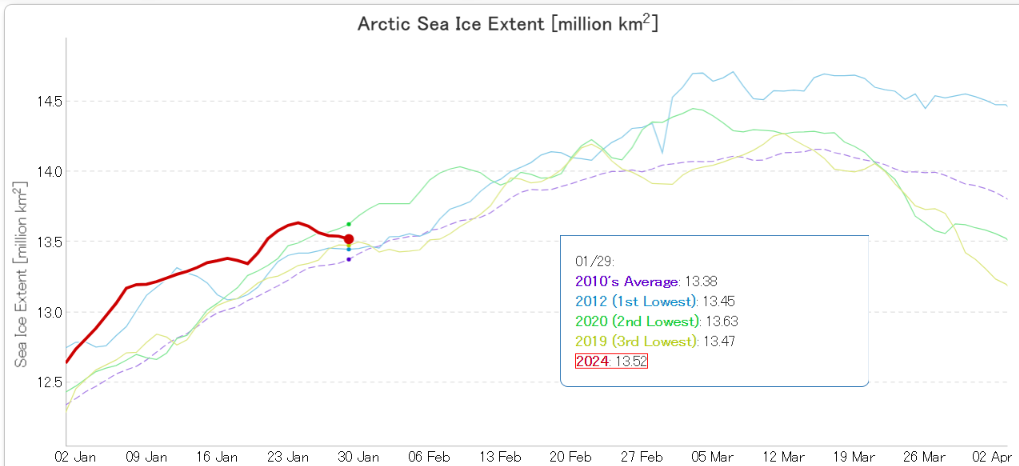
[Update – January 29th]
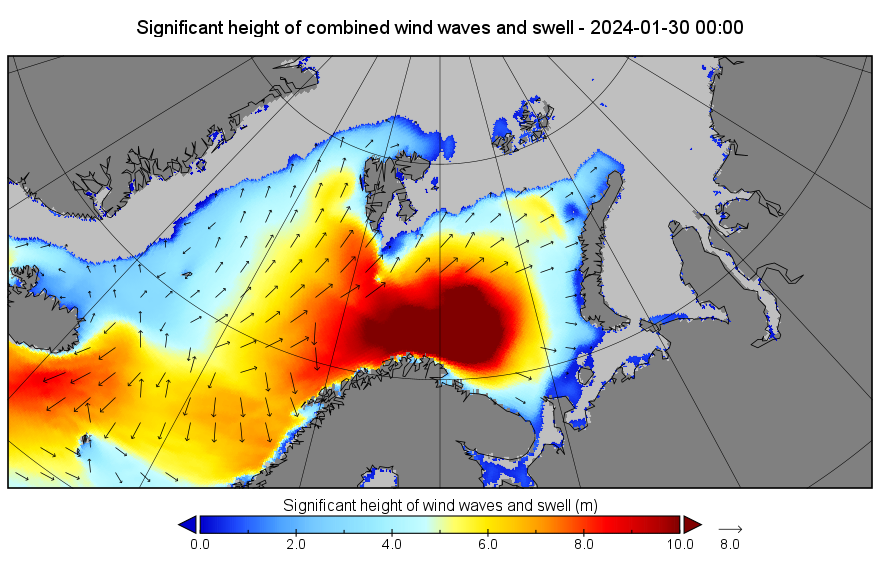
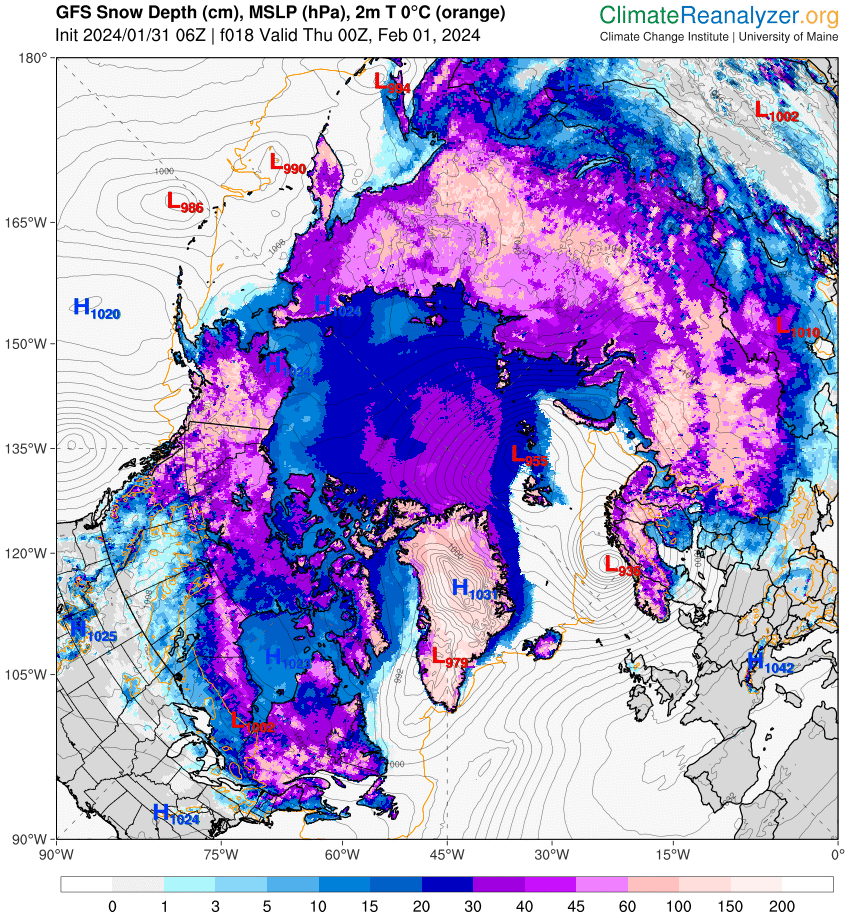
A winter cyclone is stirring up the far North Atlantic. It’s currently forecast to bottom out later today with a minimum MSLP of 937 hPa:
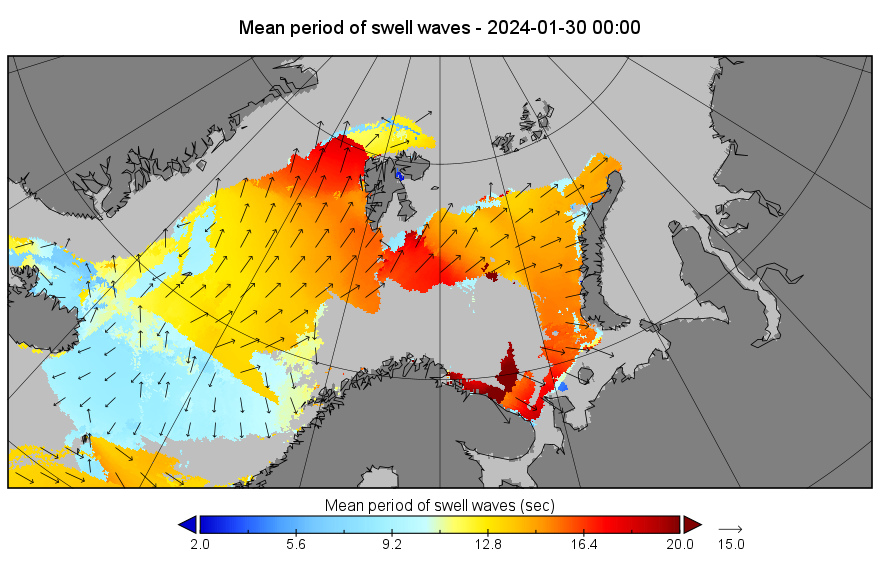
The storm has been creating a long period swell directed at the ice edge in the Barents Sea. By midnight that swell will be battering the ice in the Fram Strait too:
[Update – January 30th]
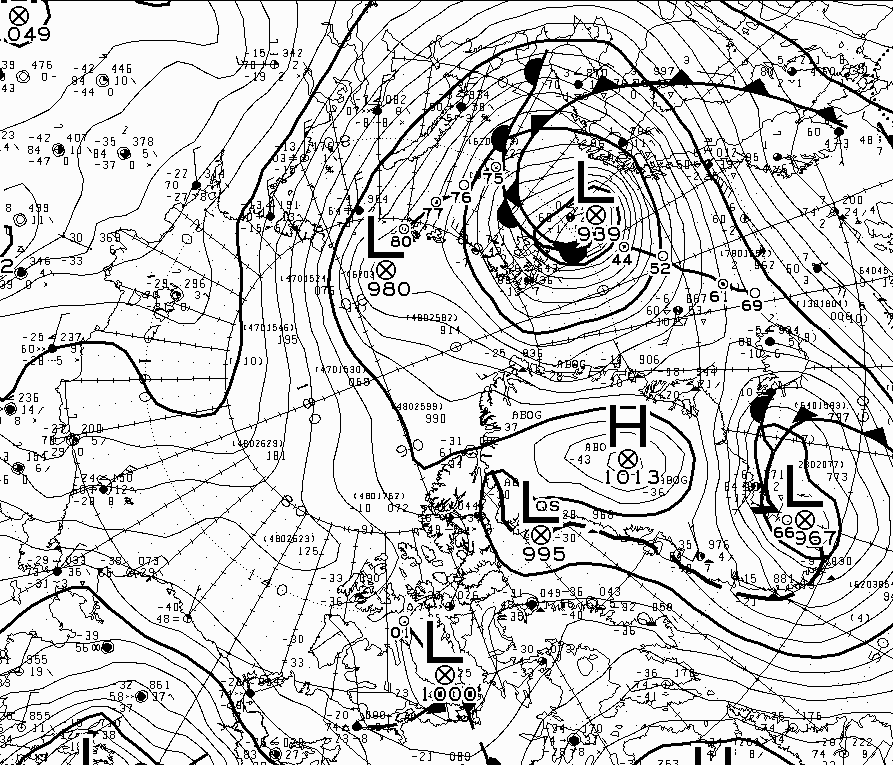
According to Environment Canada the cyclone bottomed out with an MSLP of 939 hPa at 12 PM UTC yesterday:
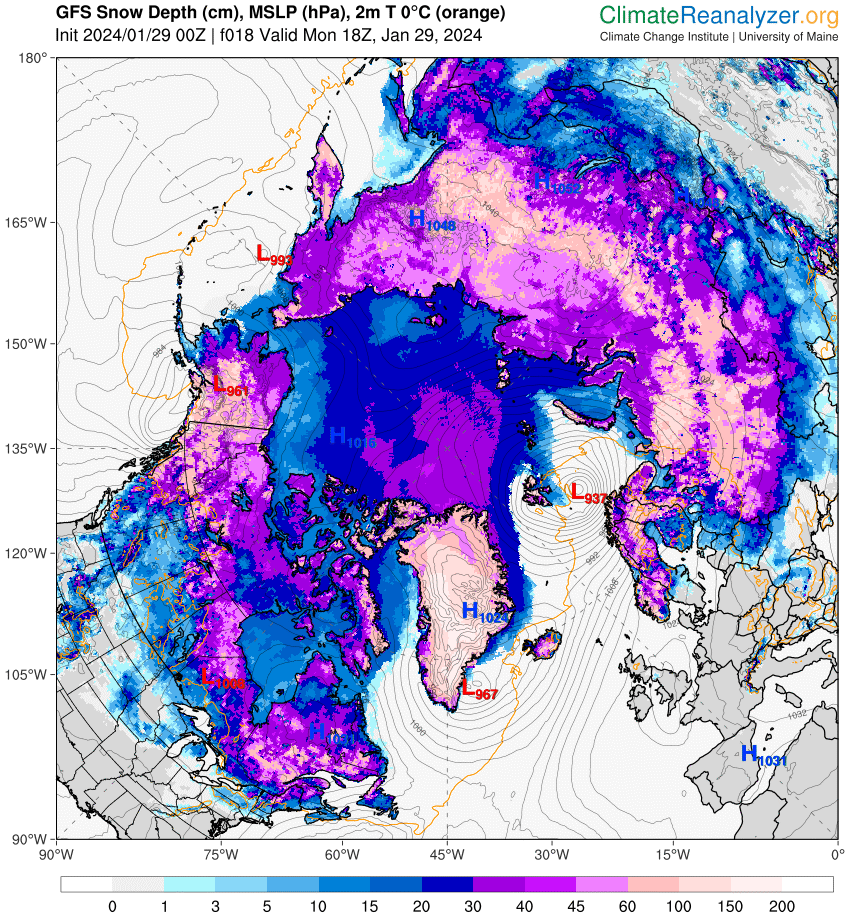
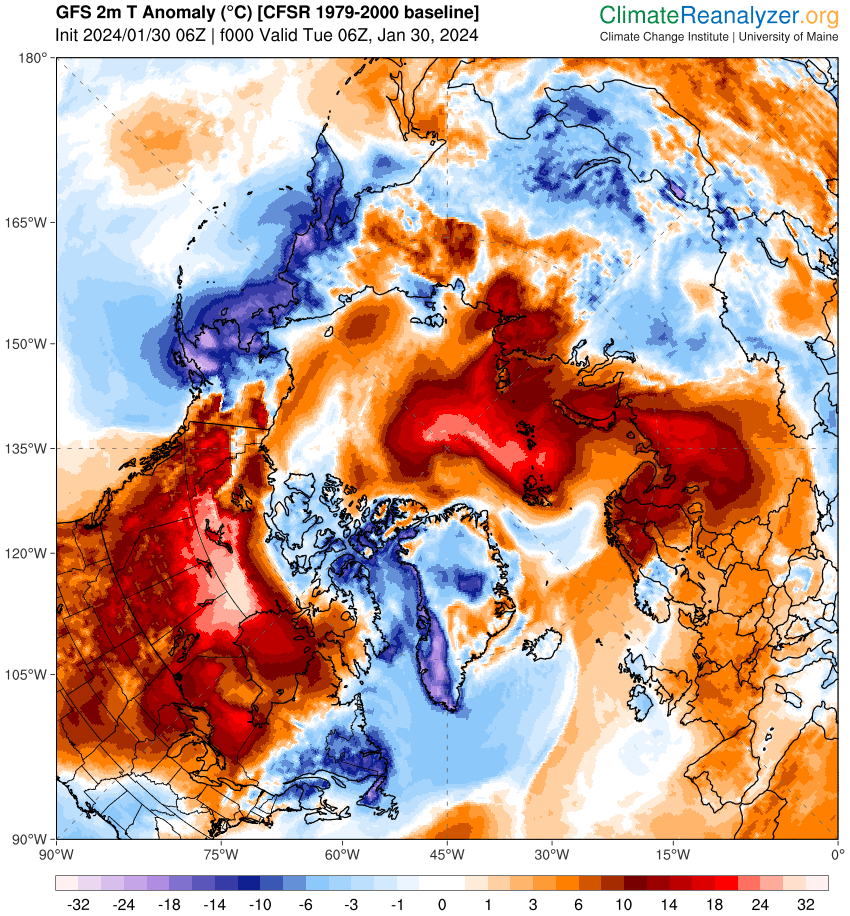
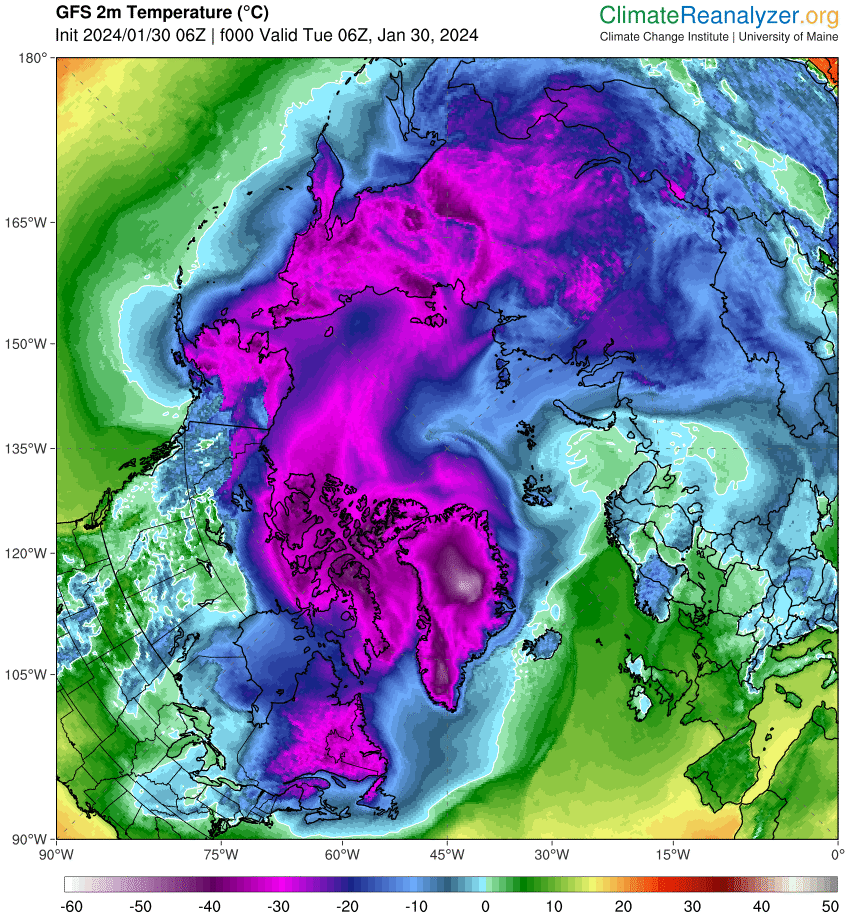
Associated with the storm is a pulse of abnormally warm air reaching to the North Pole and beyond:
Here’s how JAXA extent looks as the big swell arrives:
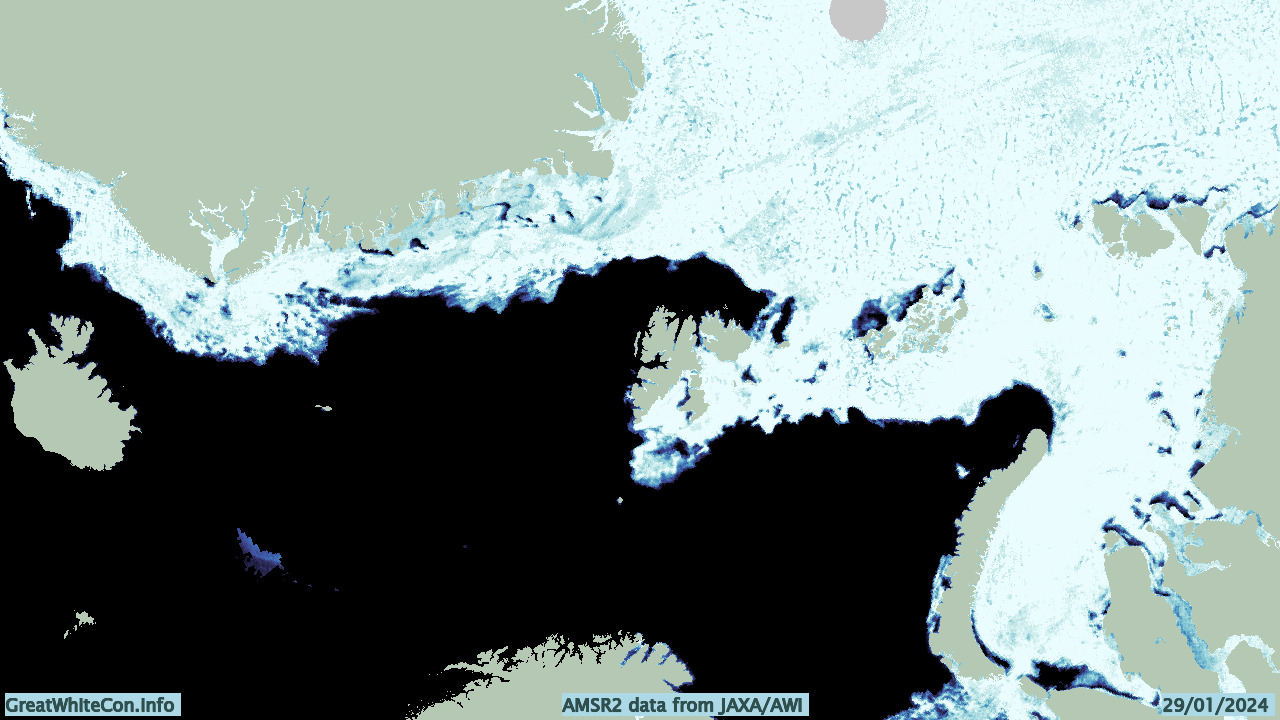
And here’s the lead enhanced AWI AMSR2 concentration map of the Atlantic periphery:
Let’s see how things change over the next few days.
[Update – January 31st]
Here’s a preliminary look at the effect of the recent Arctic cyclone and other “weather” on the sea ice in the Fram Strait and Barents & Kara Seas:
There is also another cyclone heading for the Barents Sea. This one is forecast to bottom out at 936 hPa at around midnight tonight near the Norwegian coast:
P.S. The cyclone mentioned just above has been named Storm Ingunn by the Norwegian Meteorological Institute:
👀 This swirl of cloud is #StormIngunn – an intense area of low pressure that's still rapidly deepening
😮 Wind gusts of over 120 mph have been reported in the Faroe Islands with the storm now moving towards Norway pic.twitter.com/TNuo52L7MW
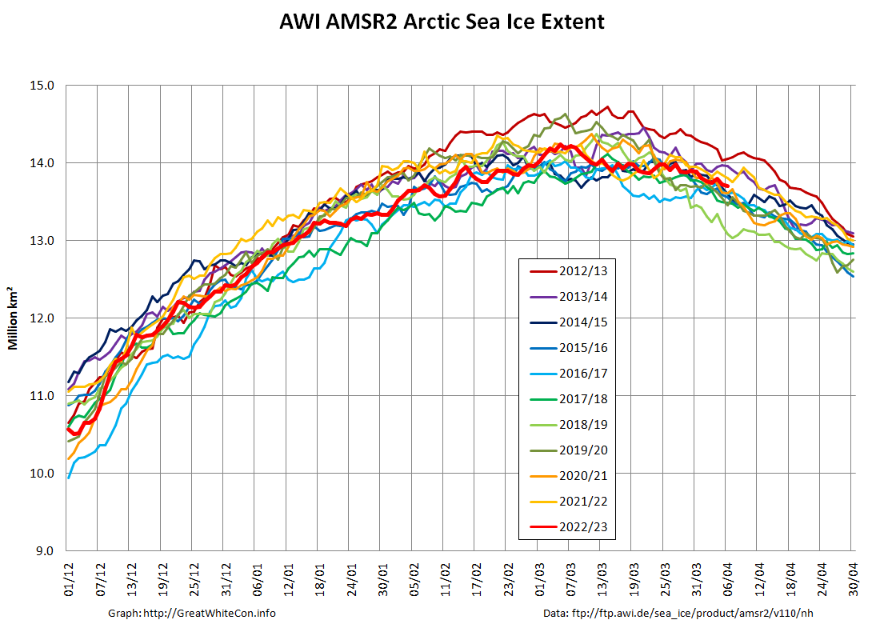
Arctic sea ice extent in early April is singularly unexceptional. Here’s the AWI AMSR2 version:
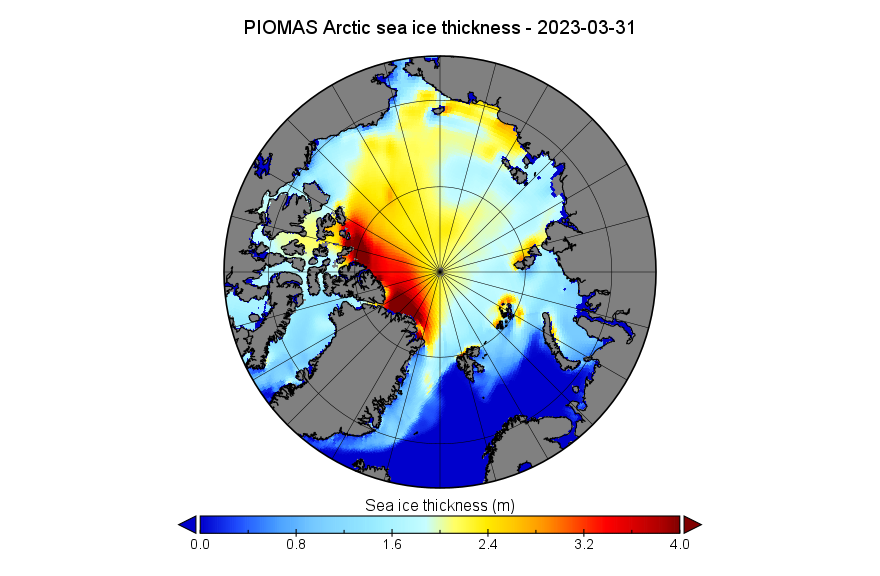
Things start to become more interesting when looking at the third dimension. Here’s the PIOMAS gridded thickness map for March 31st:
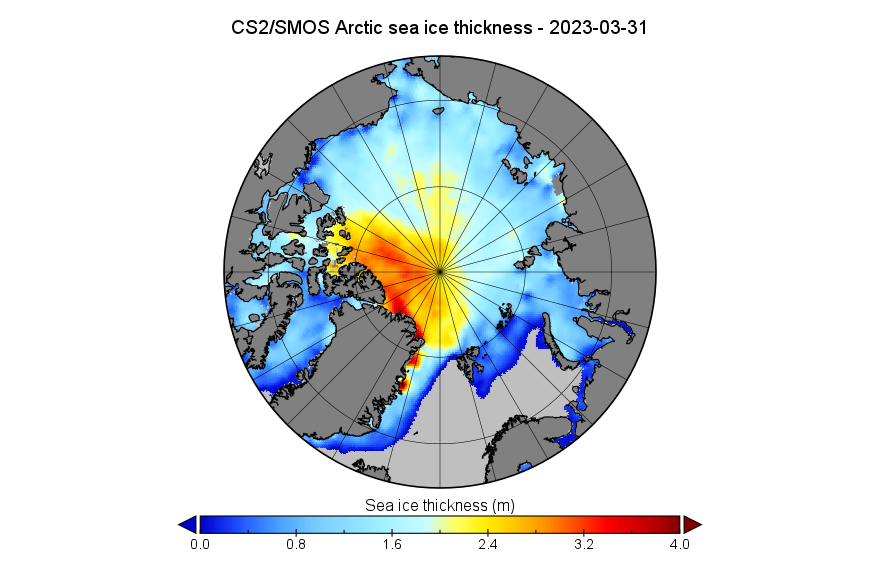
and the CryoSat-2/SMOS map for the same date:
Note the differing distribution of thick ice north of Greenland and the Canadian Arctic Archipelago between the two maps. Note also the area of thinner ice along the coast of the Beaufort Sea visible on the CS2/SMOS map.
By way of explanation for that phenomenon see the March sea level pressure map from the latest edition of the NSIDC’s Arctic Sea Ice News:
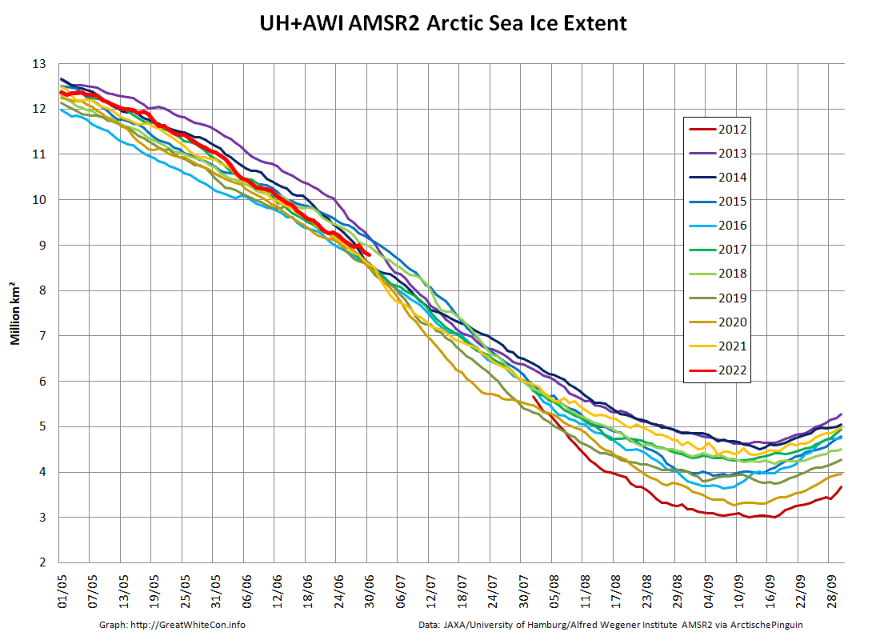
After a relatively rapid decline at the beginning of June Arctic sea extent is now very close to the 2010s average:
Both 2020 and 2021 began relatively rapid declines of their own at the beginning of July, so it will be interesting to see if 2022 follows suit.
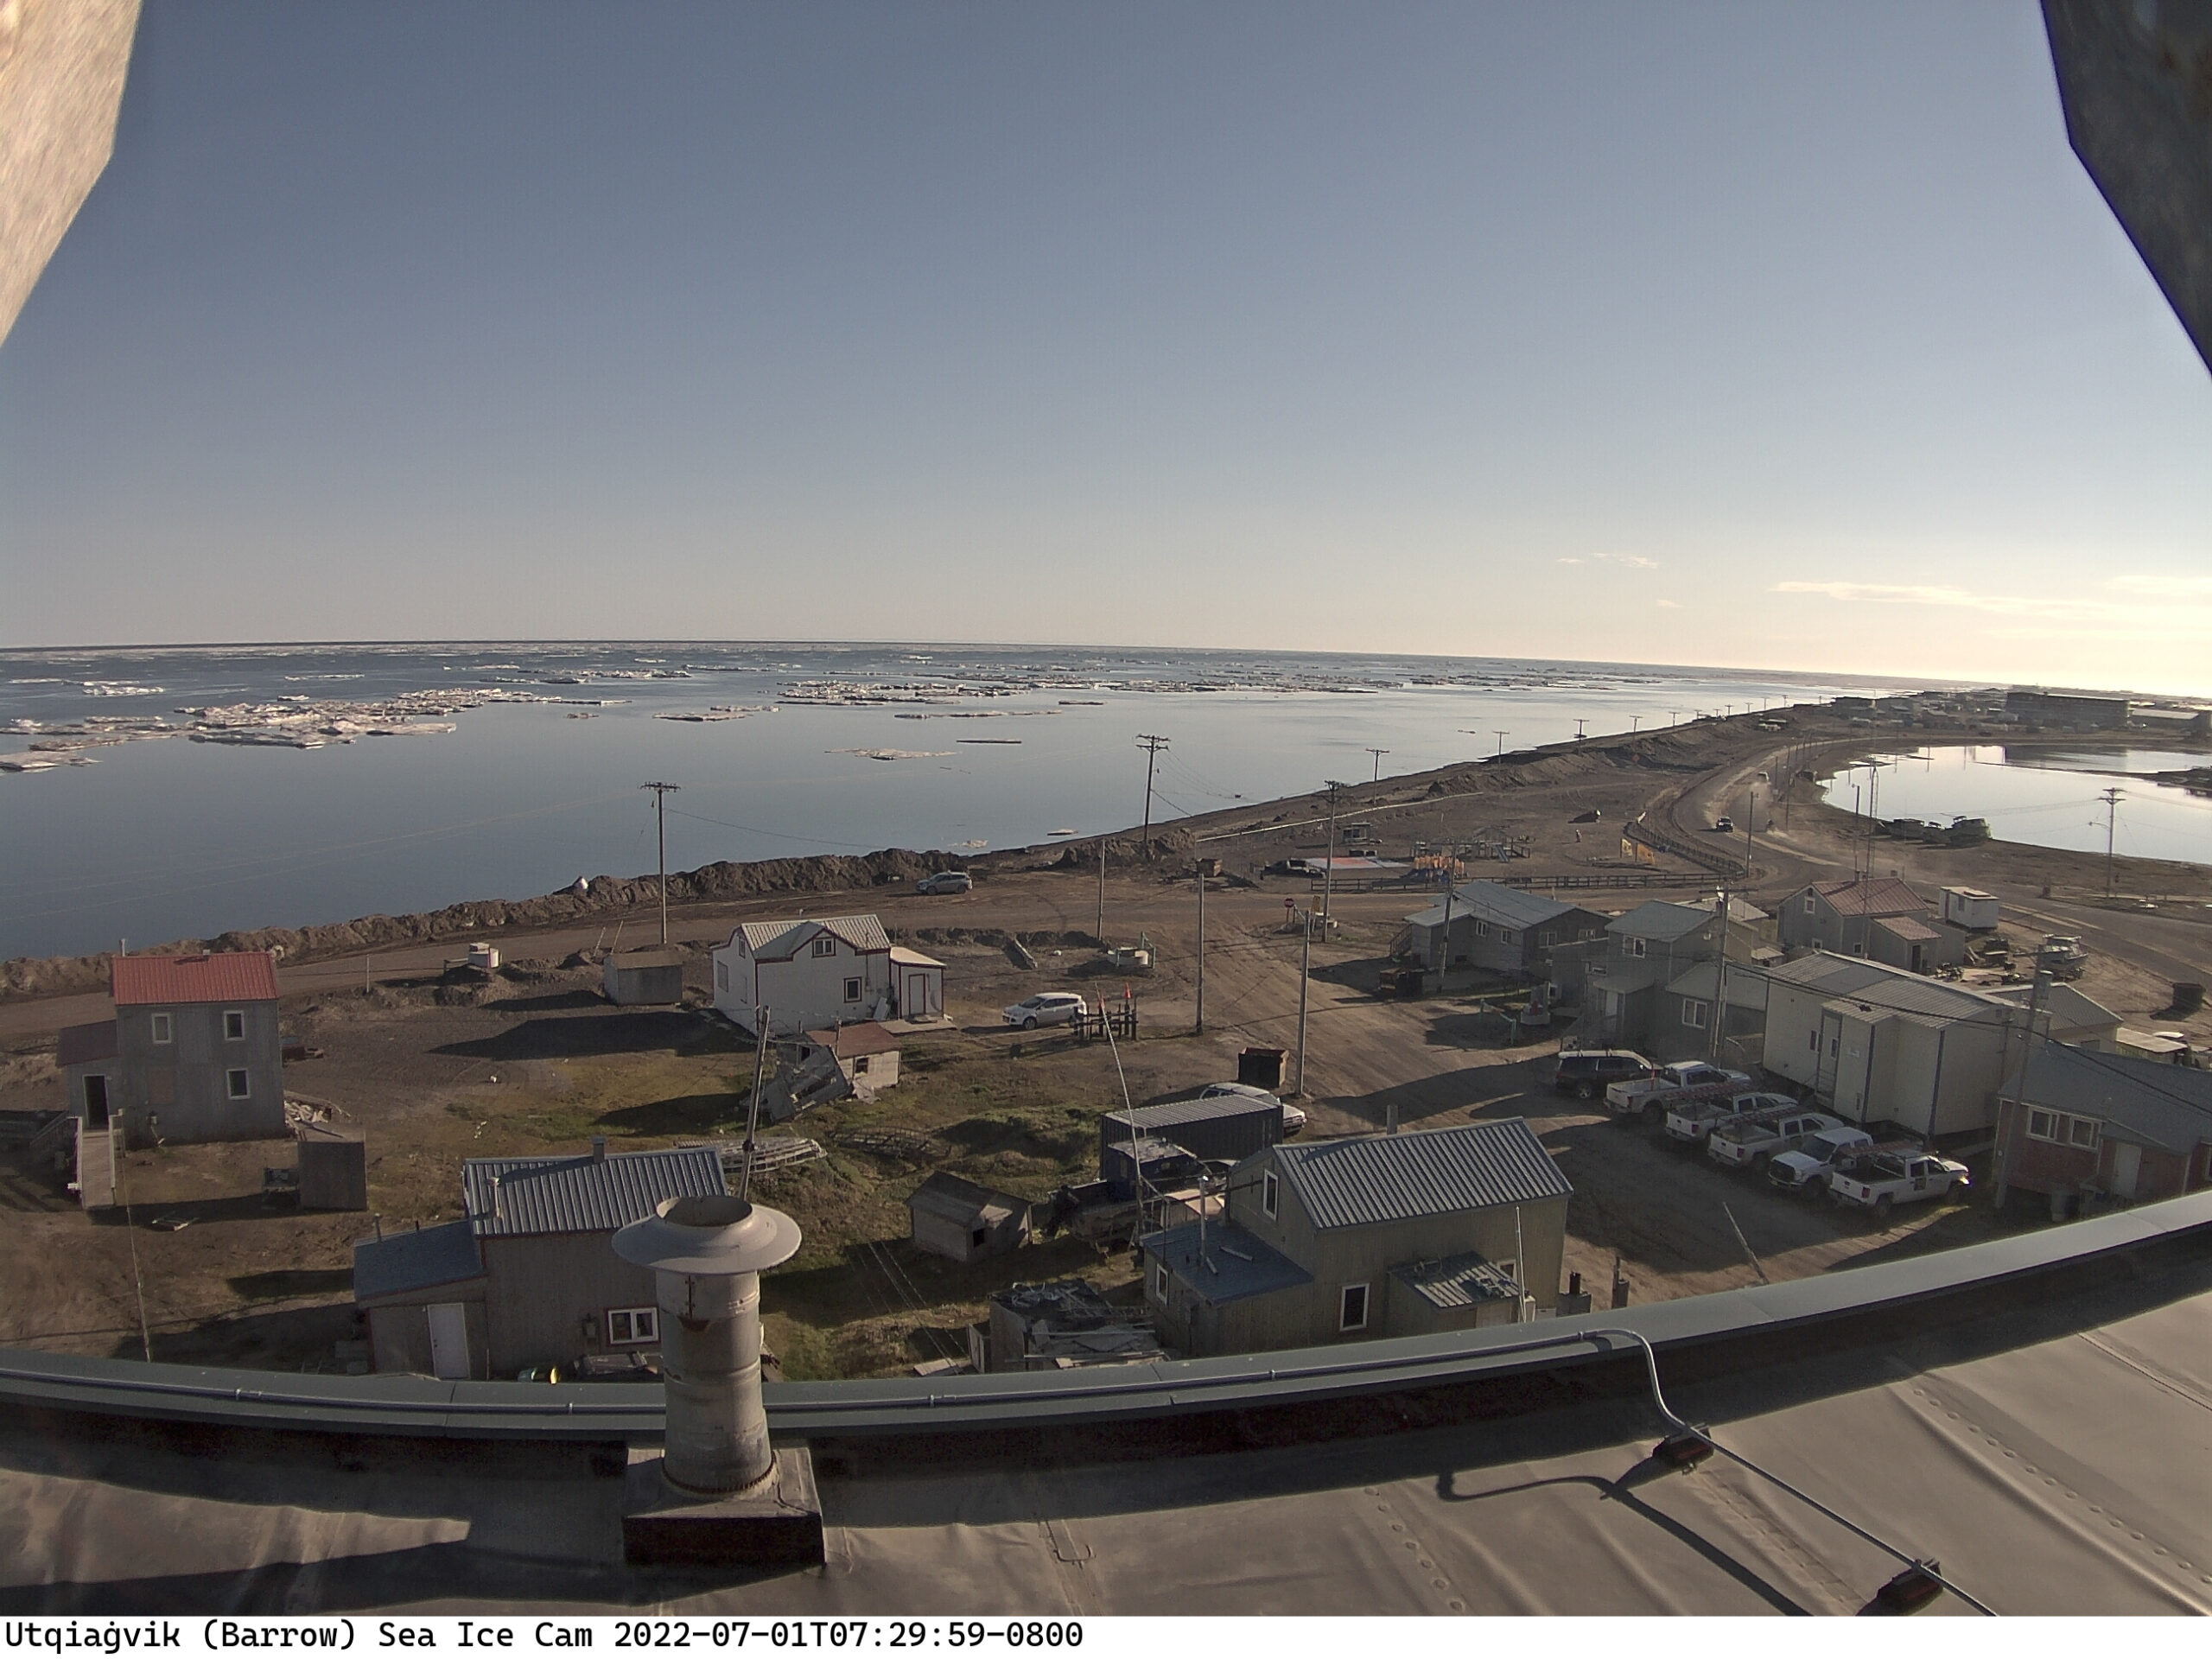
Most of the fast ice off Utqiaġvik has recently disappeared:
Meanwhile further out into the Chukchi Sea the sea ice looks to be in poor shape at the moment, with surface melting apparent across the entire region:
This website uses cookies to improve your experience. We'll assume you're ok with this, but you can opt-out if you wish. Cookie settingsACCEPT
Privacy & Cookies Policy
Privacy Overview
This website uses cookies to improve your experience while you navigate through the website. Out of these, the cookies that are categorized as necessary are stored on your browser as they are essential for the working of basic functionalities of the website. We also use third-party cookies that help us analyze and understand how you use this website. These cookies will be stored in your browser only with your consent. You also have the option to opt-out of these cookies. But opting out of some of these cookies may affect your browsing experience.
Necessary cookies are absolutely essential for the website to function properly. This category only includes cookies that ensures basic functionalities and security features of the website. These cookies do not store any personal information.
Any cookies that may not be particularly necessary for the website to function and is used specifically to collect user personal data via analytics, ads, other embedded contents are termed as non-necessary cookies. It is mandatory to procure user consent prior to running these cookies on your website.