According to The Spectator magazine “Toby Young is associate editor of The Spectator”
According to Toby’s article in tomorrow’s edition of The Spectator:
On Sunday, the BBC did something unusual. It invited Luke Johnson, a climate contrarian, to join a panel with Laura Kuenssberg to discuss net zero. As followers of this debate will know, the BBC’s editorial policy unit issued guidance to staff in 2018 saying: ‘As climate change is accepted as happening, you do not need a “denier” to balance the debate.’ Although it did allow for exceptions to this rule: ‘There are occasions where contrarians and sceptics should be included within climate change and sustainability debates.’ Presumably this was one such occasion.
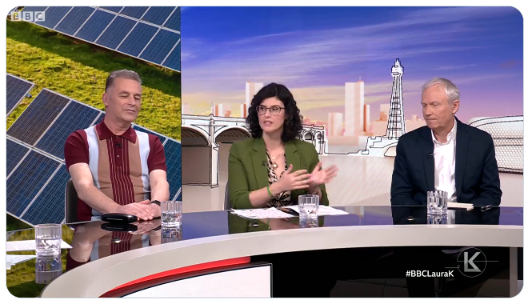
Here’s a picture of the “panel” he refers to:
Toby continues:
The other two people on the panel – Chris Packham and Layla Moran – are members of the climate emergency camp, so there was no pretence of ‘balance’. At one point, the exchange between Johnson and Packham became heated and when the latter invoked the recent downpour in Dubai as well as extensive wildfires in the ‘global south’, as evidence of the effect of anthropogenic global warming, Johnson challenged him to come up with evidence that extreme weather was caused by carbon emissions.
‘It doesn’t come from Toby Young’s Daily Septic [sic], which is basically put together by a bunch of professionals with close affiliations to the fossil fuel industry,’ replied Packham. ‘It comes from something called science.’
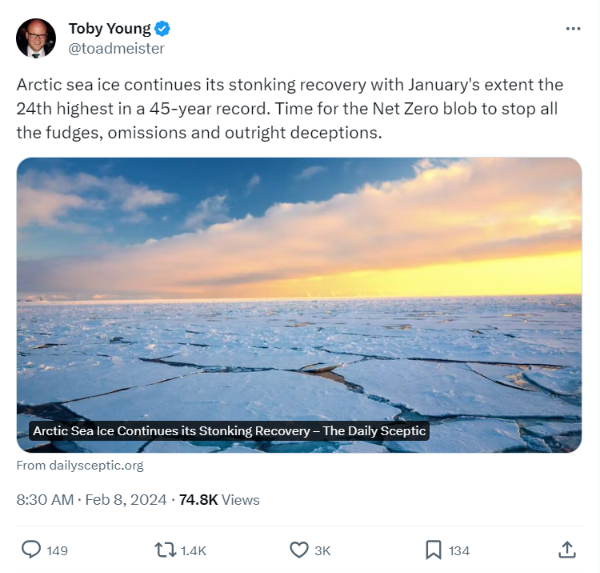
According to Mr. Young on X (formerly Twitter) yesterday:
Continue reading Does Toby Young Have “Close Affiliations to the Fossil Fuel Industry”?