We have grandchildren visiting this week, so it seems prudent to get the new open thread started a day early, and before they wake up!
The ARCUS Sea Ice Prediction Network July report has recently been published. Here’s the graphic overview of the 30 predictions for September sea ice monthly average extent:
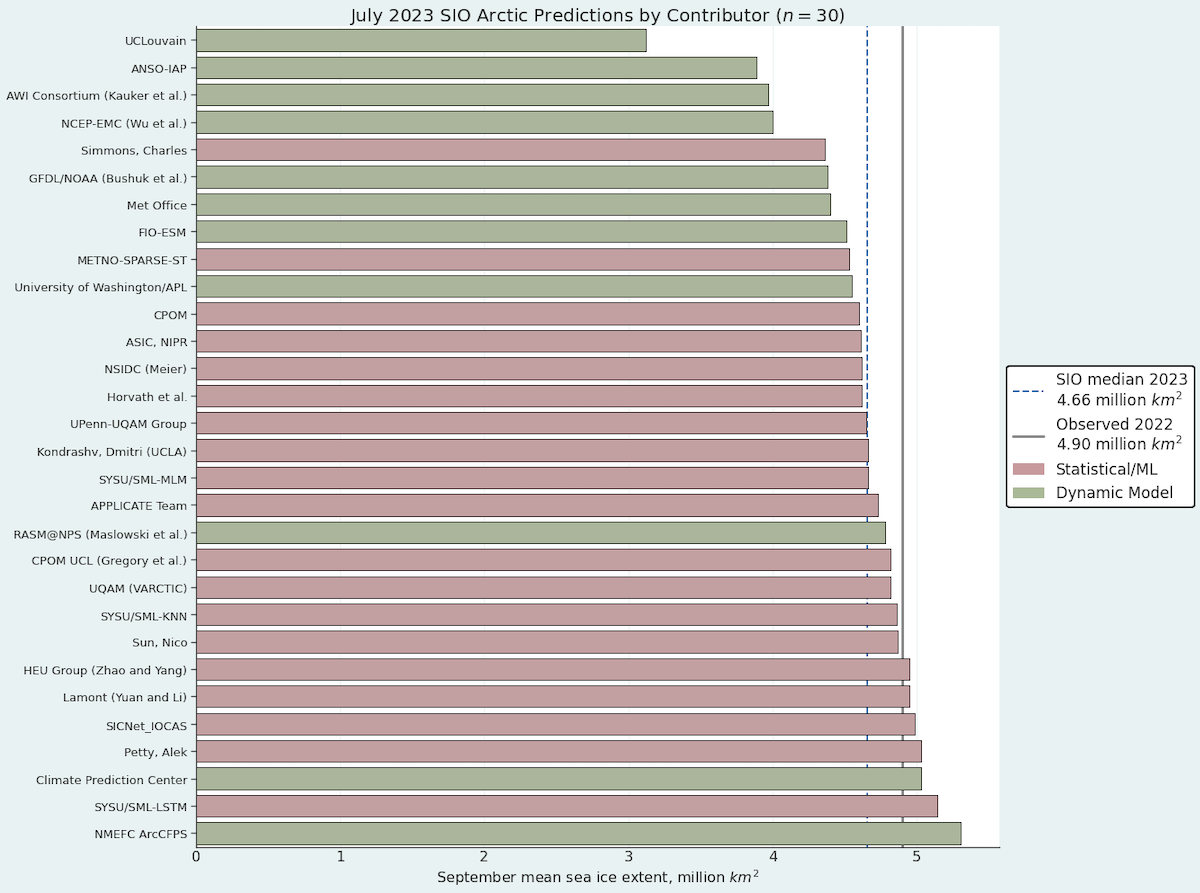
The July median forecasted value for pan-Arctic September sea-ice extent is 4.66 million square kilometers with interquartile values of 4.51 and 4.87 million square kilometers, while individual forecasts range from 3.12 and 5.30 million square kilometers. We note the lowest forecast is an outlier, and the only forecast that predicts a new record September sea-ice extent value (current record is September 2012, with a sea-ice extent of 3.57 million square kilometers).
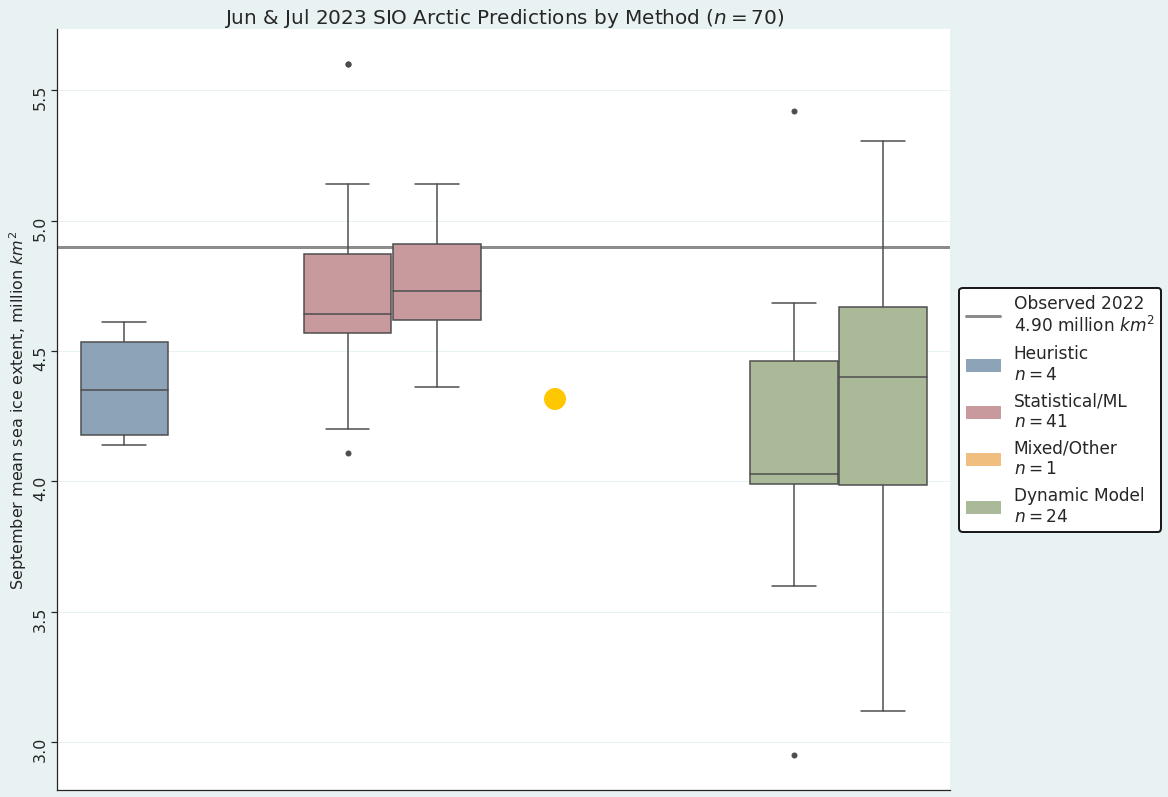
Compared to the June SIO forecasts, the July median forecast is slightly higher (4.66 million square kilometers vs 4.54 million square kilometers), and the interquartile range is narrower (0.36 million square kilometers compared to 0.56 million square kilometers ), illustrating a lower inter-model uncertainty in the forecasts.
What do you suppose the odds are of the “outlier” prediction of 3.12 million km² becoming reality? How about the next lowest “dynamic model” prediction of 3.89 million km² ?
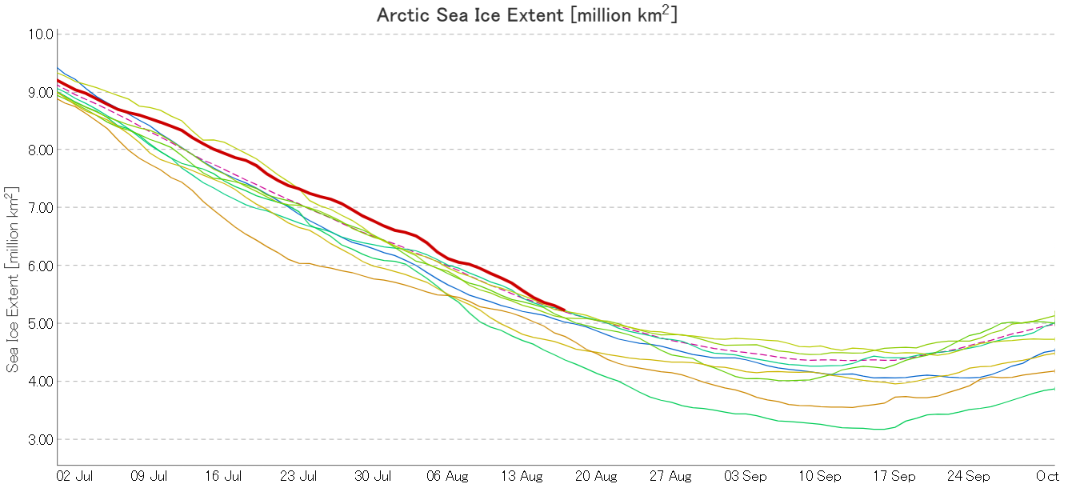
[Edit – August 1st]This graph of the current JAXA AMSR2 based extent metric will almost certainly appear in the current “Arctic disinformation” thread too, so it’s formatted a bit differently to usual:
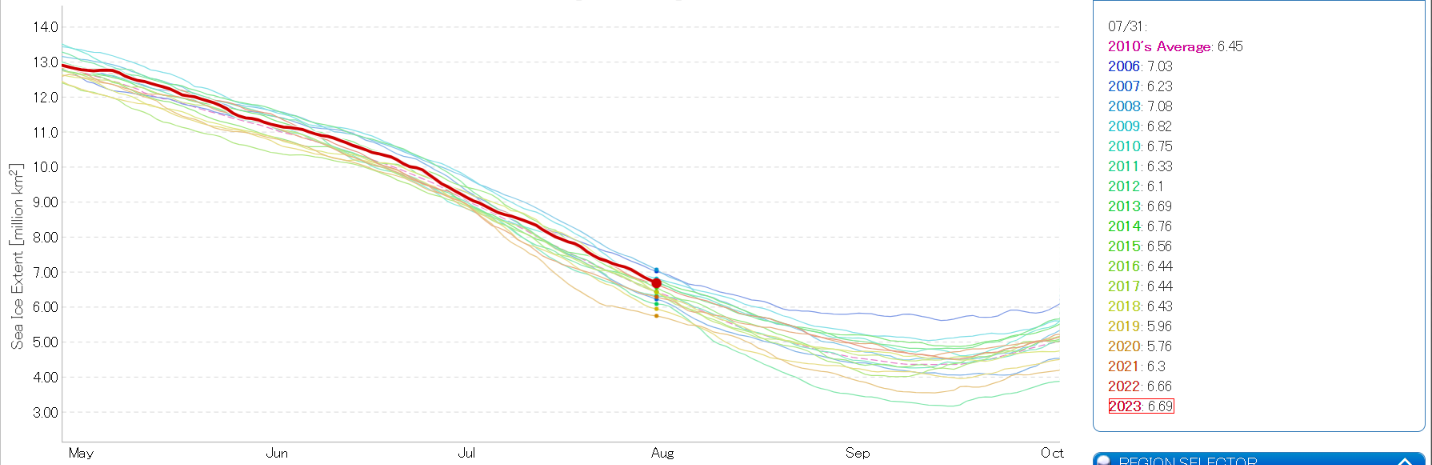
Extent is 13th lowest in the entire 44 year satellite record.
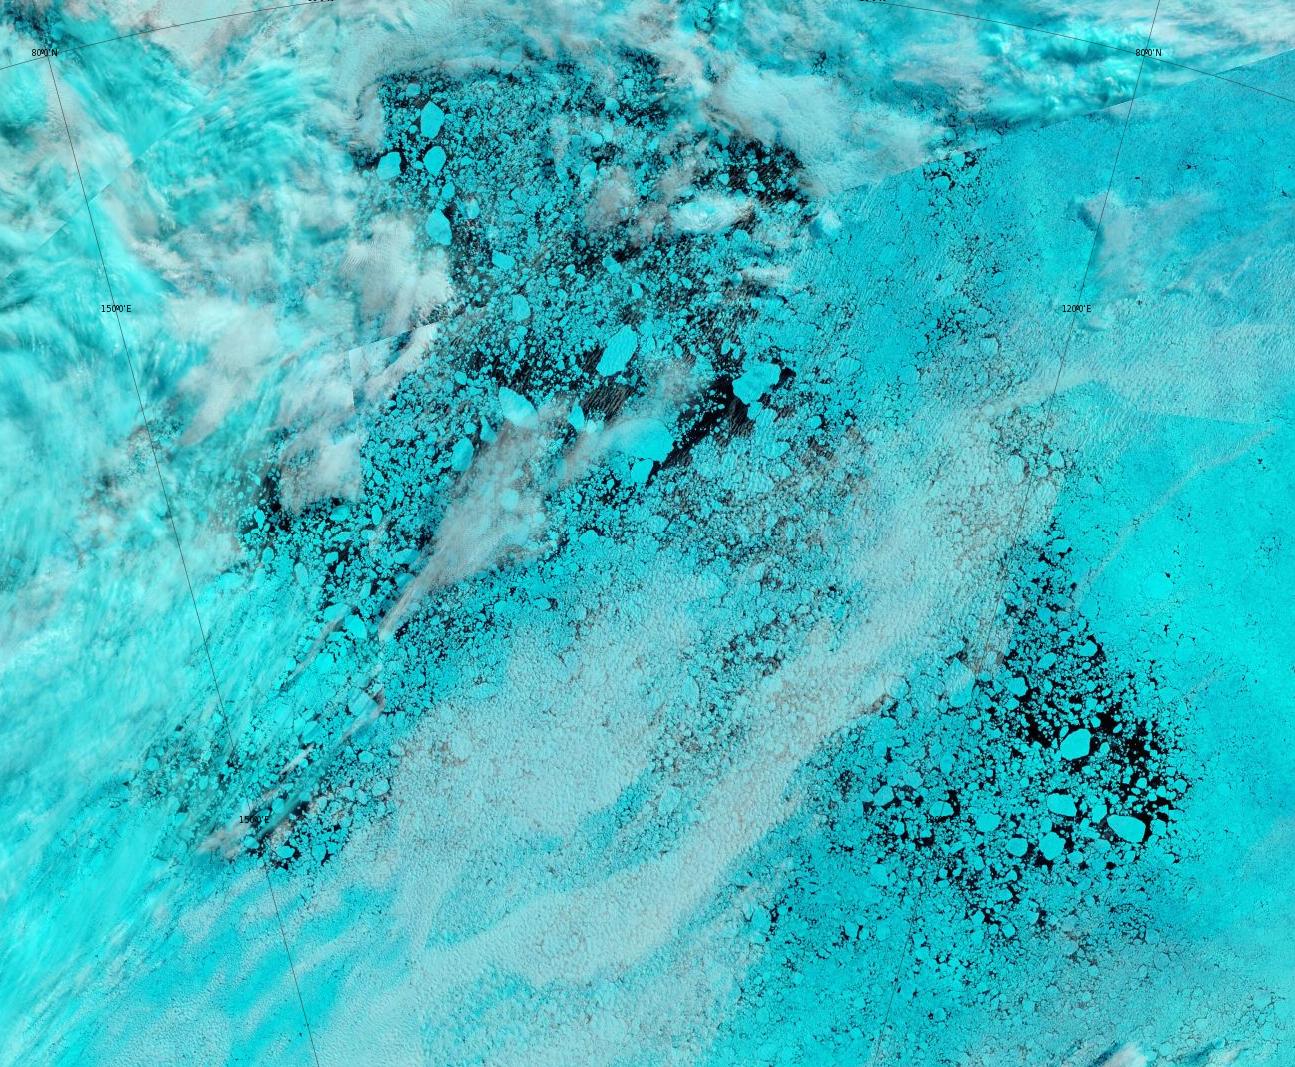
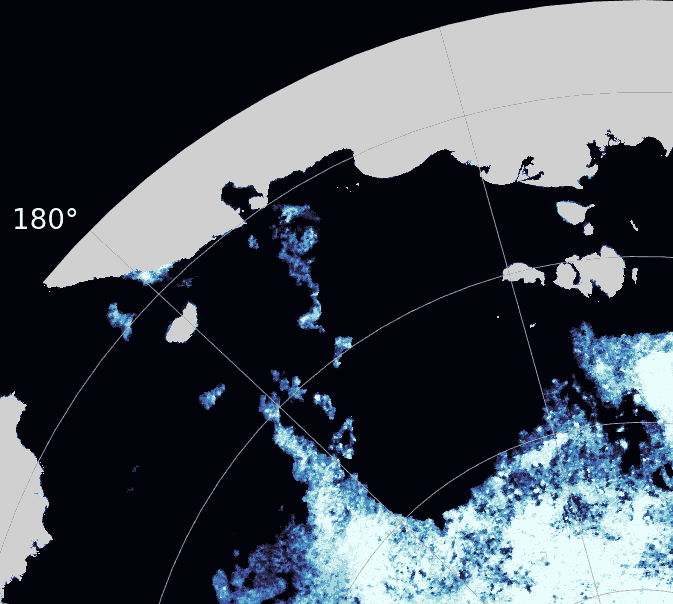
[Edit – August 2nd]The beginnings of this years “Laptev Bite” are now hazily visible from space:
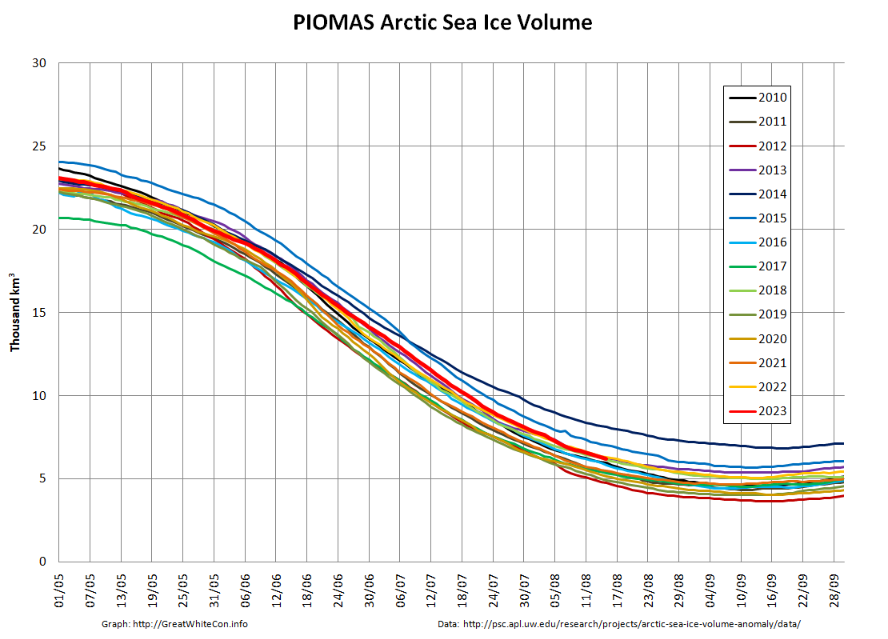
The PIOMAS gridded thickness data hasn’t been released yet, but the main PIOMAS web page now has July’s graphs proudly on display:
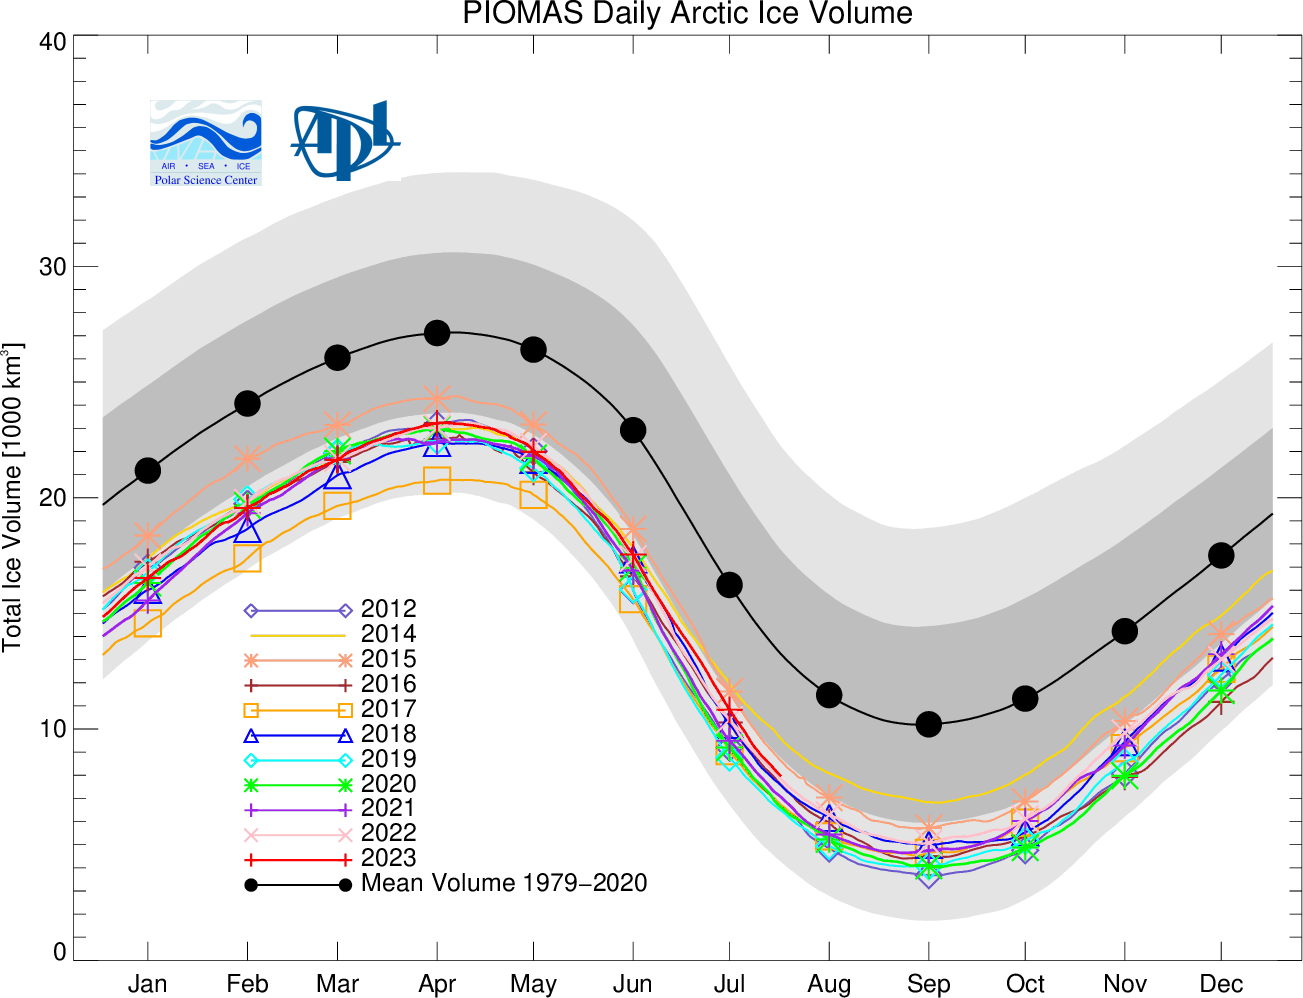
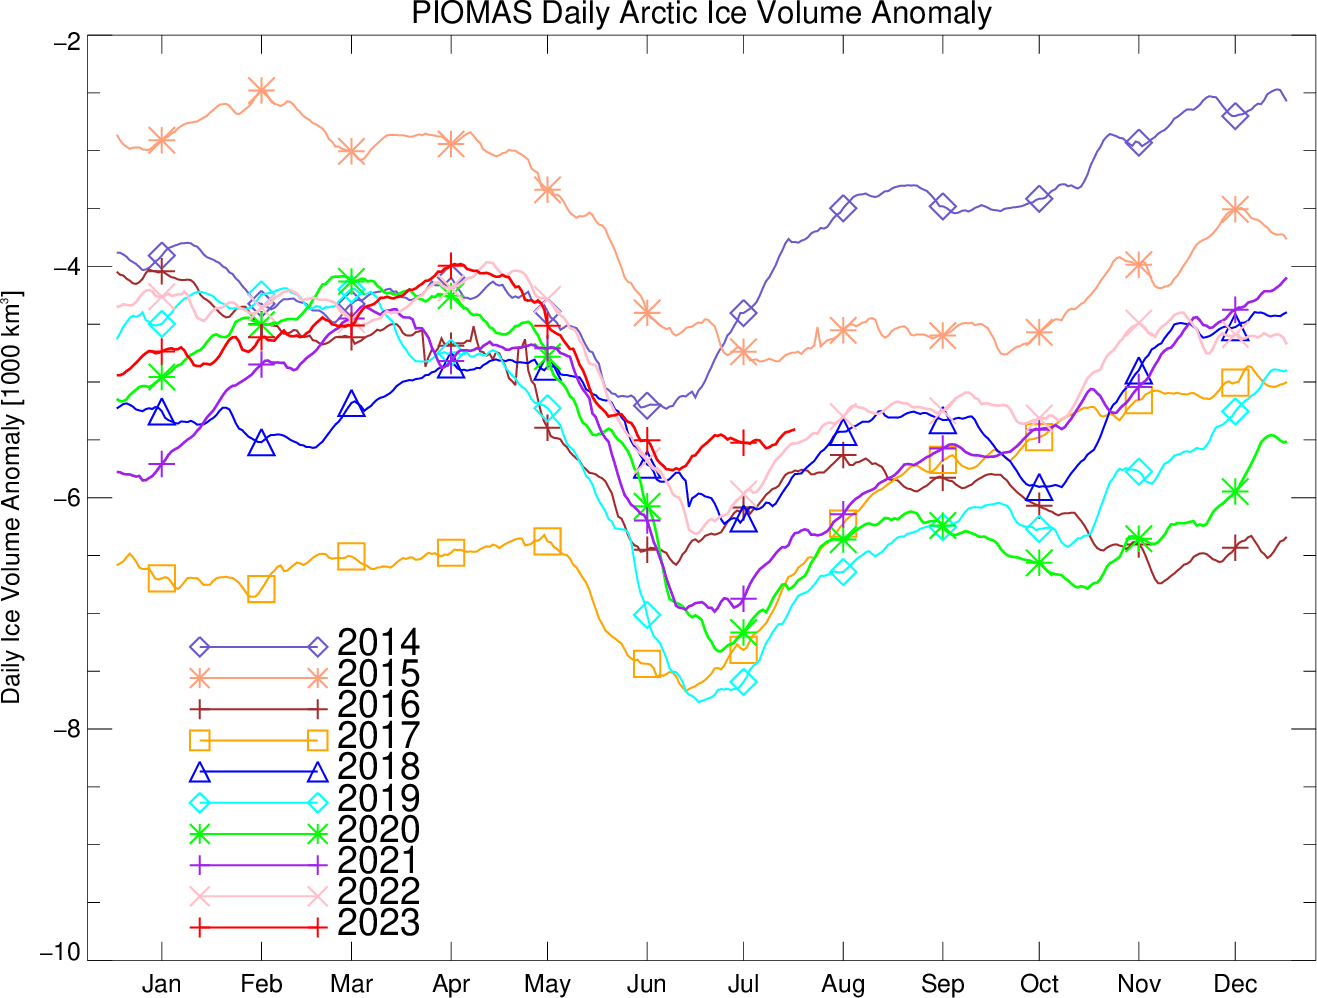
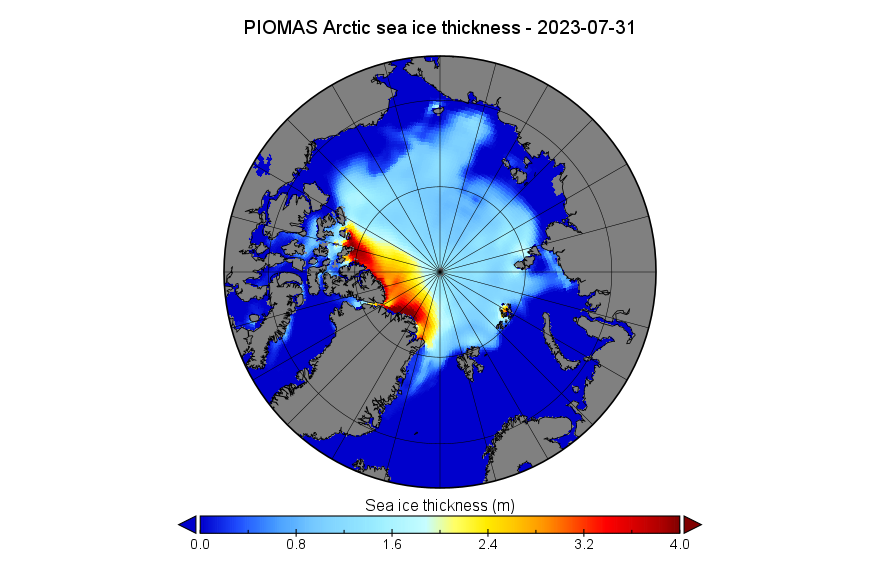
[Edit – August 6th]Average Arctic sea ice volume in July 2023 was 10,800 km3. This value is the 12th lowest on record for June, about 1900 km3 above the low record set in 2019. Monthly ice volume was 62% below the maximum in 1979 and 45% below the mean value for 1979-2022. Average July 2023 ice volume was 1.5 standard deviations above the 1979-2022 trend line. Ice growth (loss) for July 2023 was fairly normal for the recent decade, giving a mean ice thickness (above 15 cm thickness) in the middle of recent values. The ice thickness anomaly map for July 2023 relative to 2011-2022 shows more positive anomalies than negative ones.
CryoSat-2 has gone into its summer hiatus, though recent work (Landy et al. 2023) shows promised for summer retrievals. We’ll look at those at a later time.
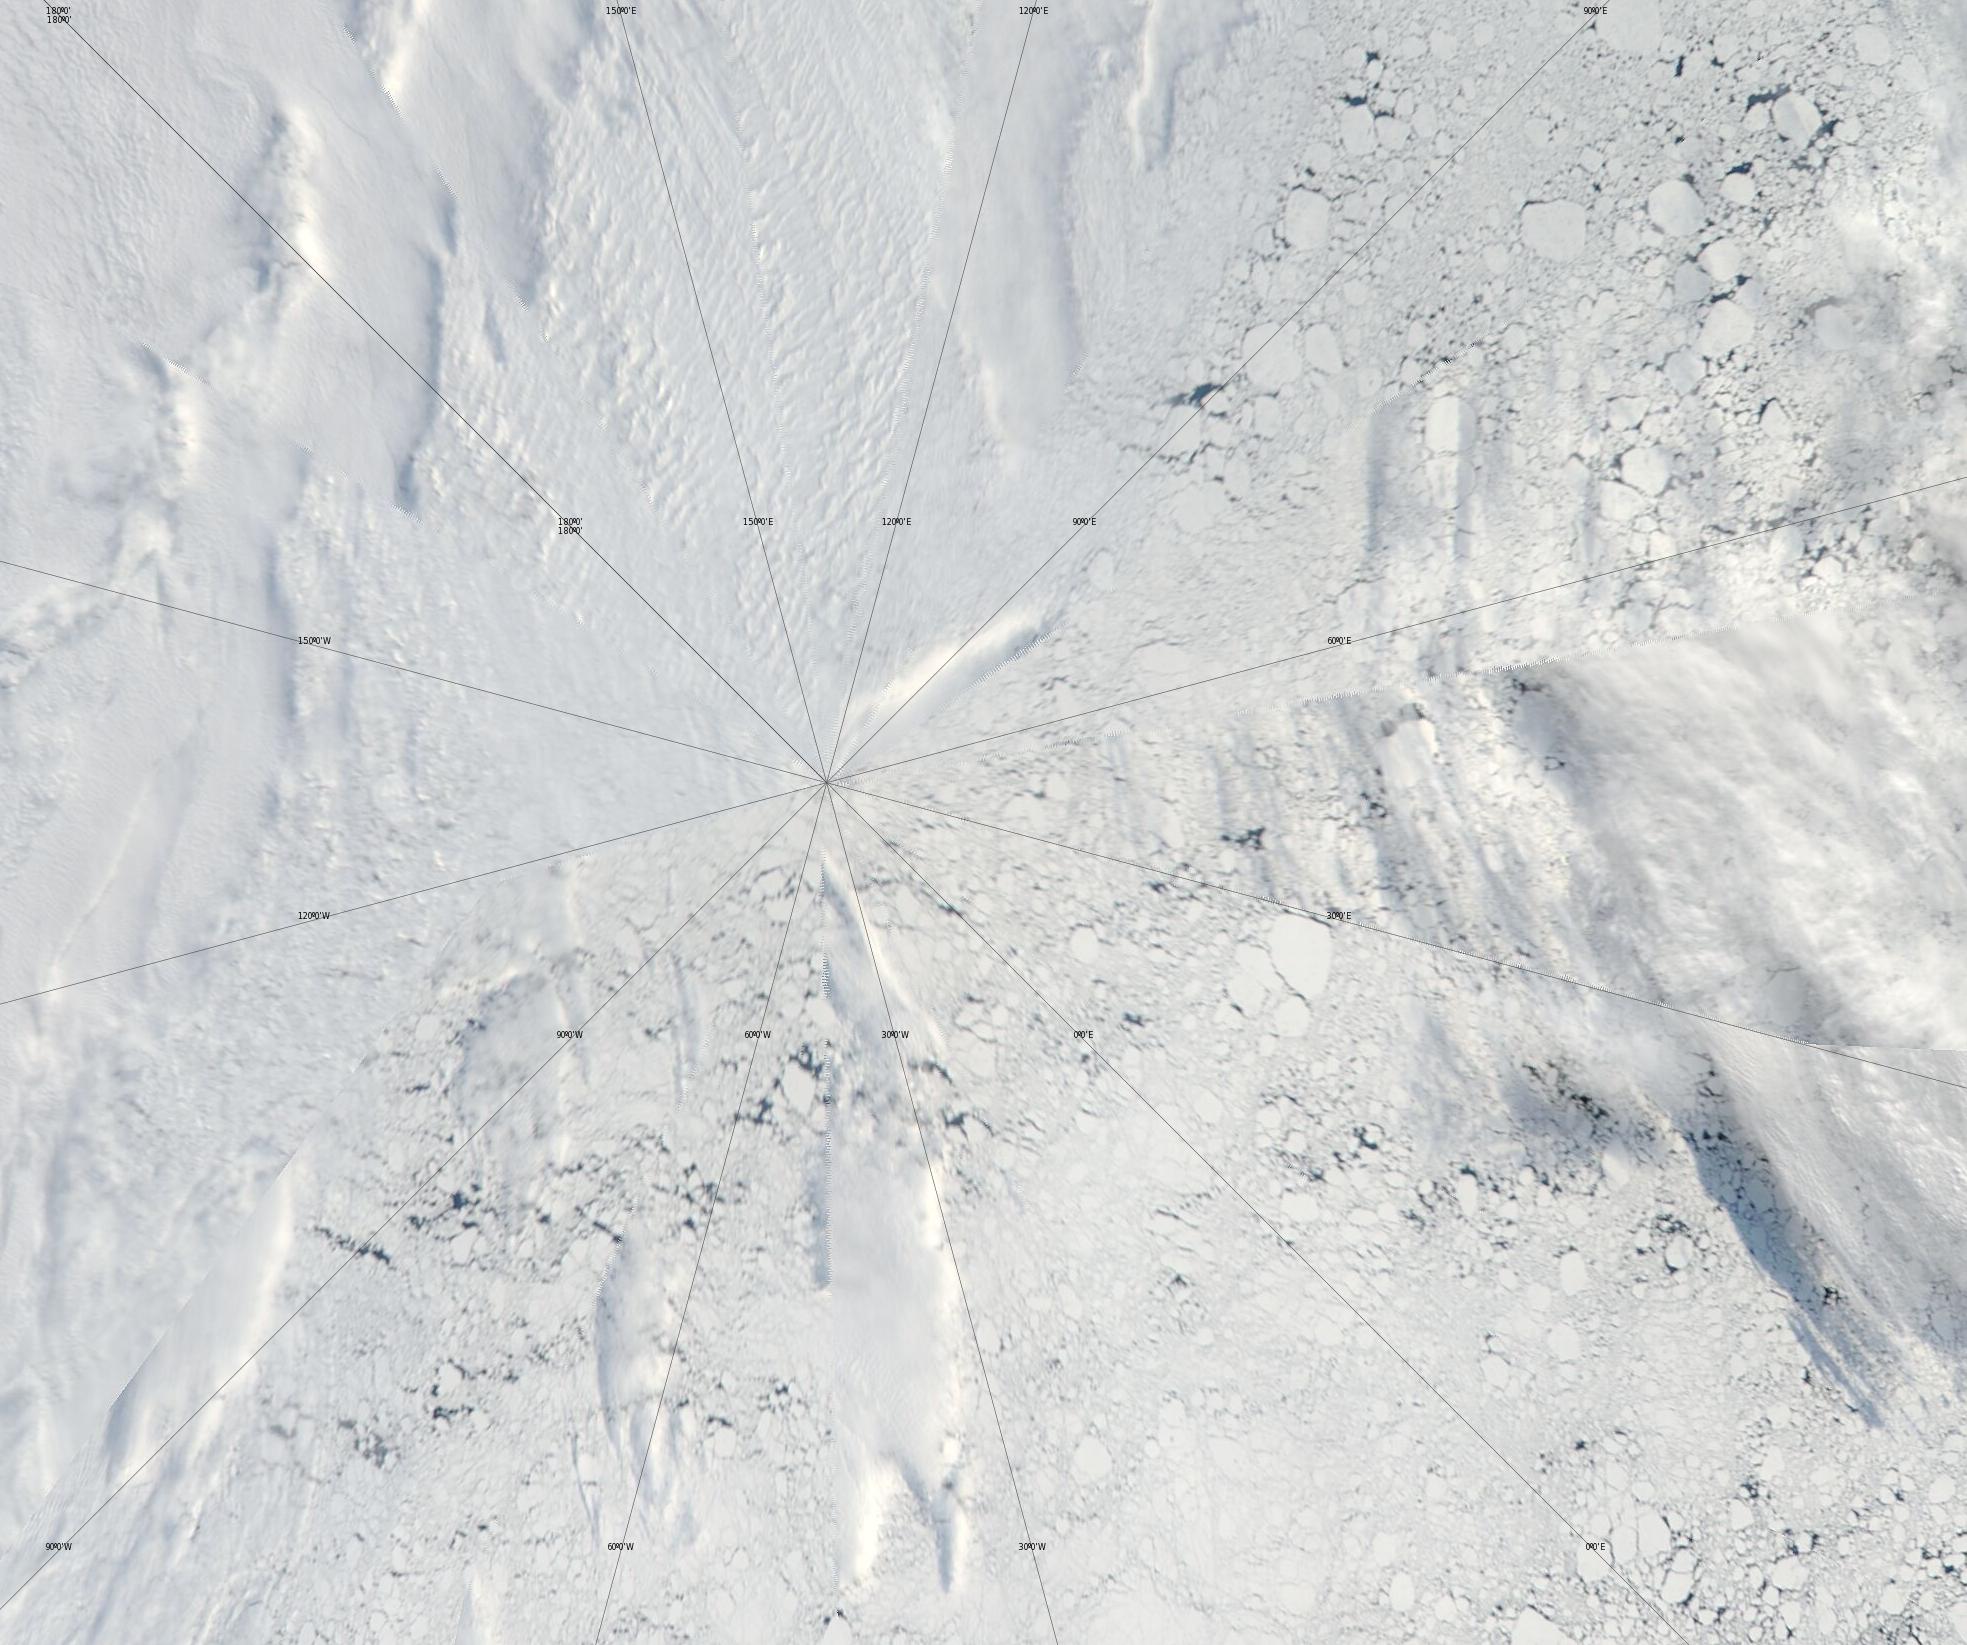
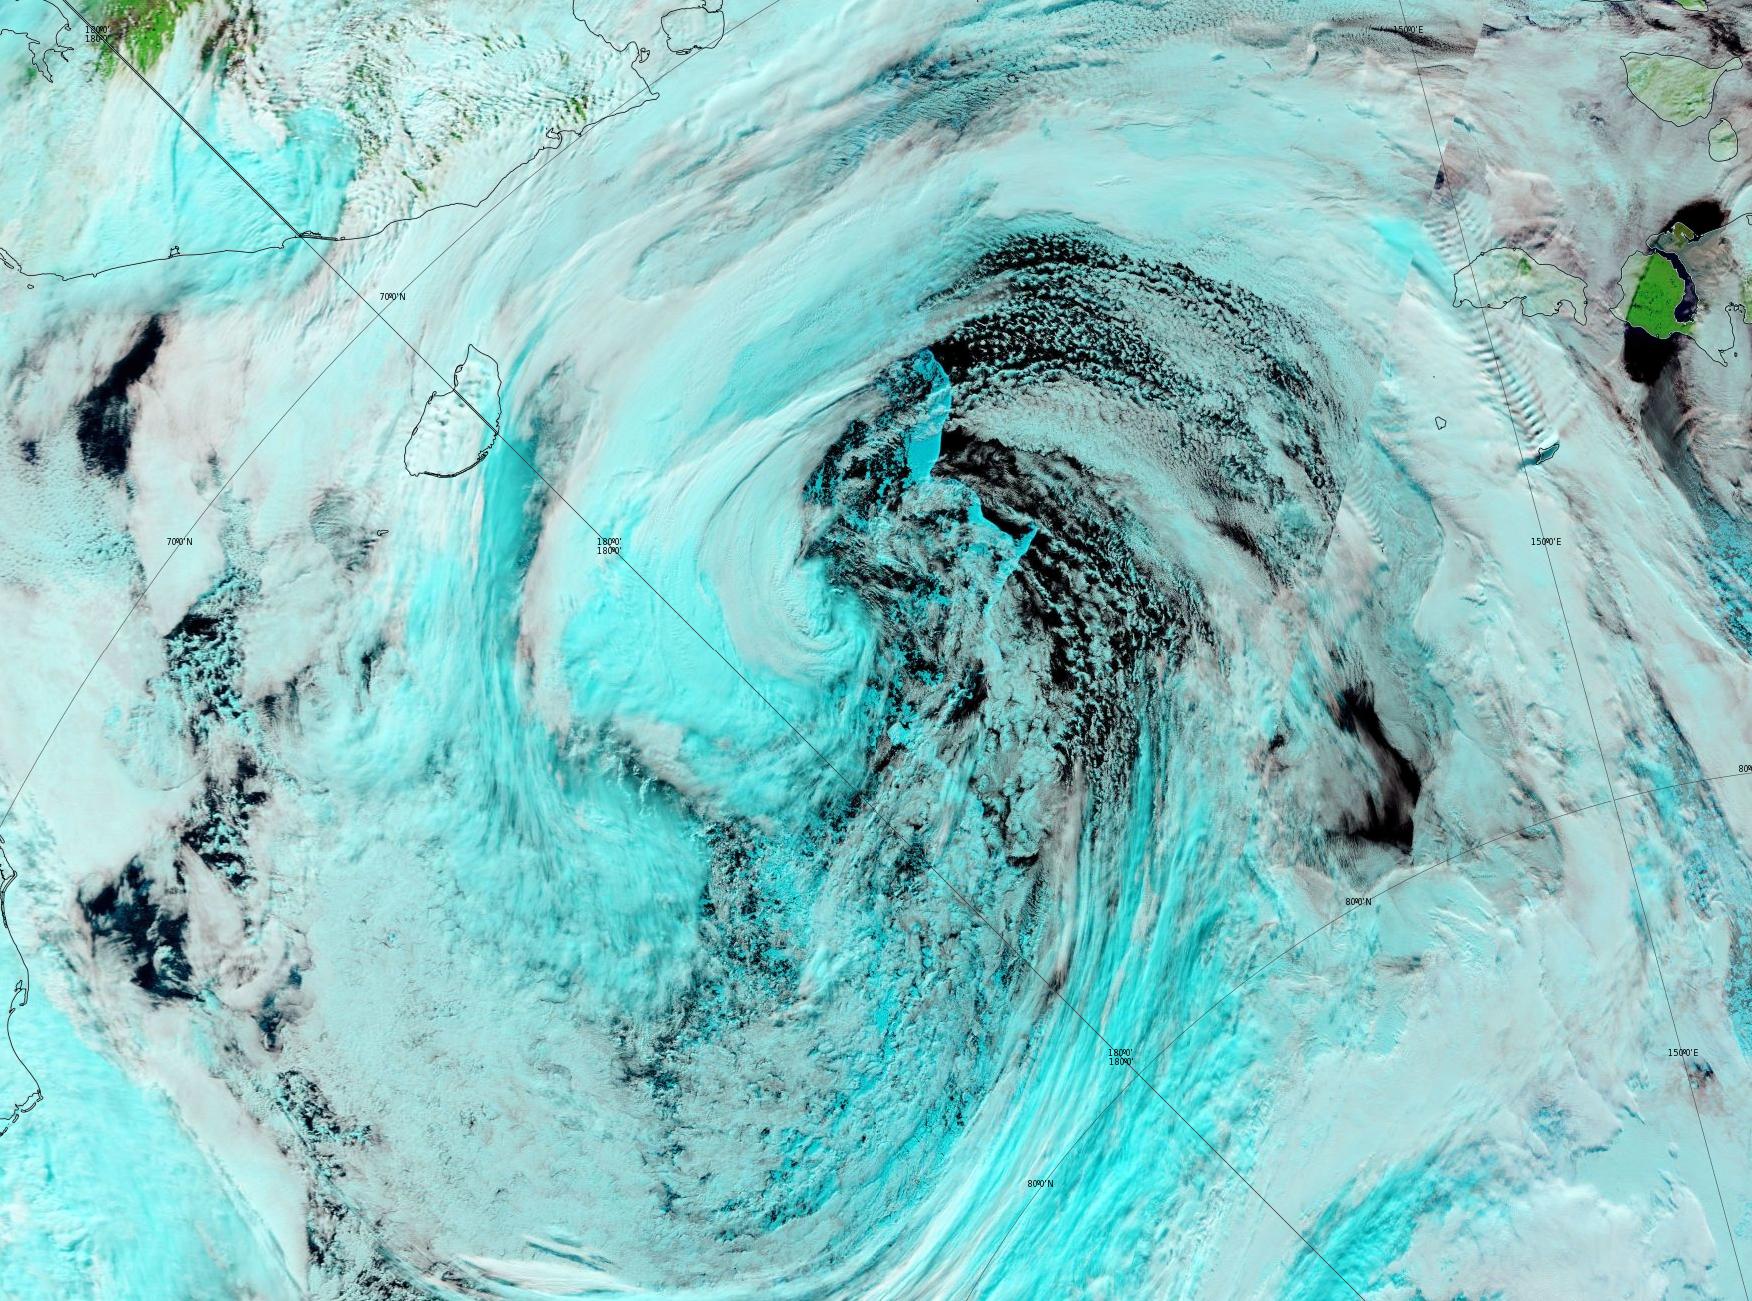
Here’s a rare glimpse through the clouds of the fractured state of the sea ice around the North Pole:
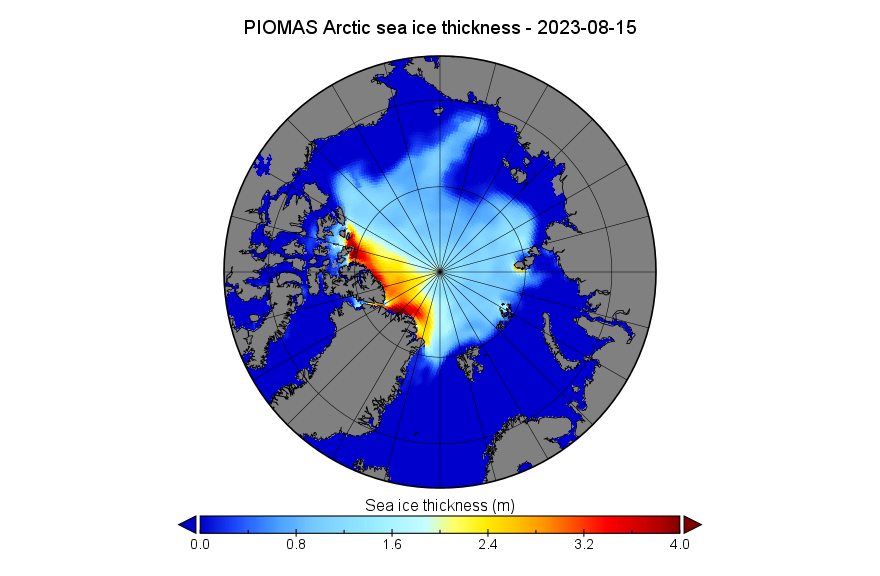
The PIOMAS gridded thickness data for July has been released, so here’s the latest modelled thickness map:
Here too is the latest AMSR2 concentration animation:
There is now enough open water within the Arctic basin to allow storms to generate waves of a significant size.
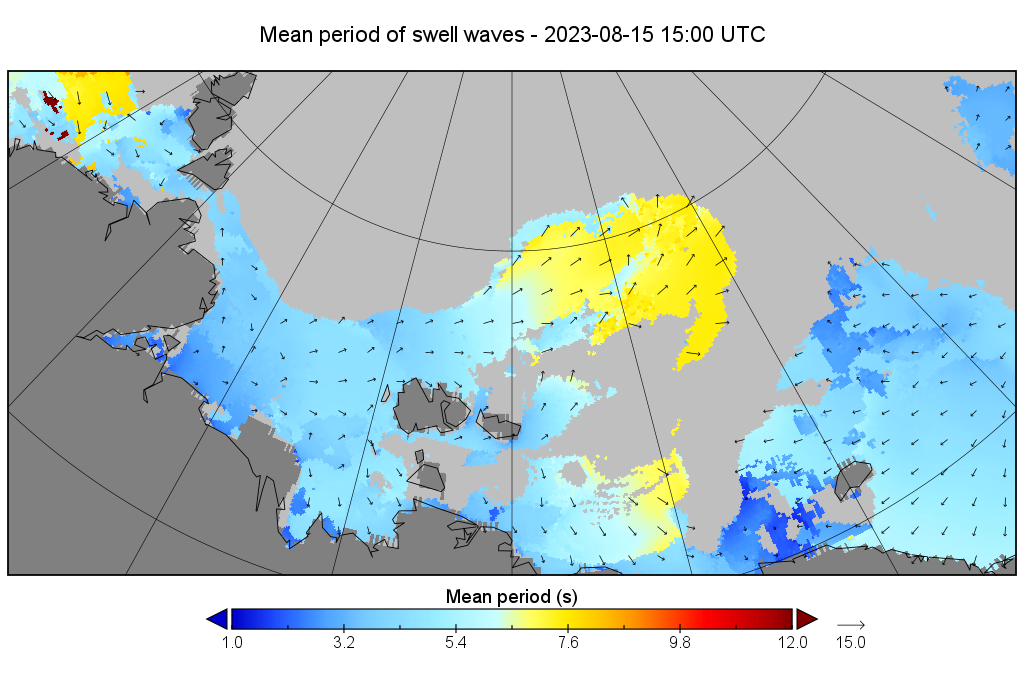
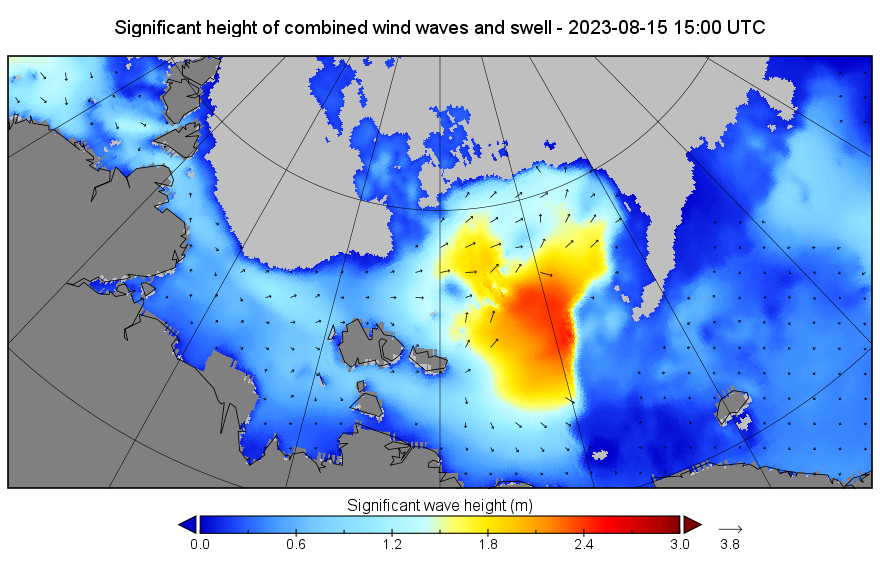
[Edit – August 15th]There is now a storm spinning over the East Siberian Sea. It is creating significant waves which are directed at the ice edge to the north. Here is the surf forecast for 15:00 UTC today:
Here is the view from on high this morning:
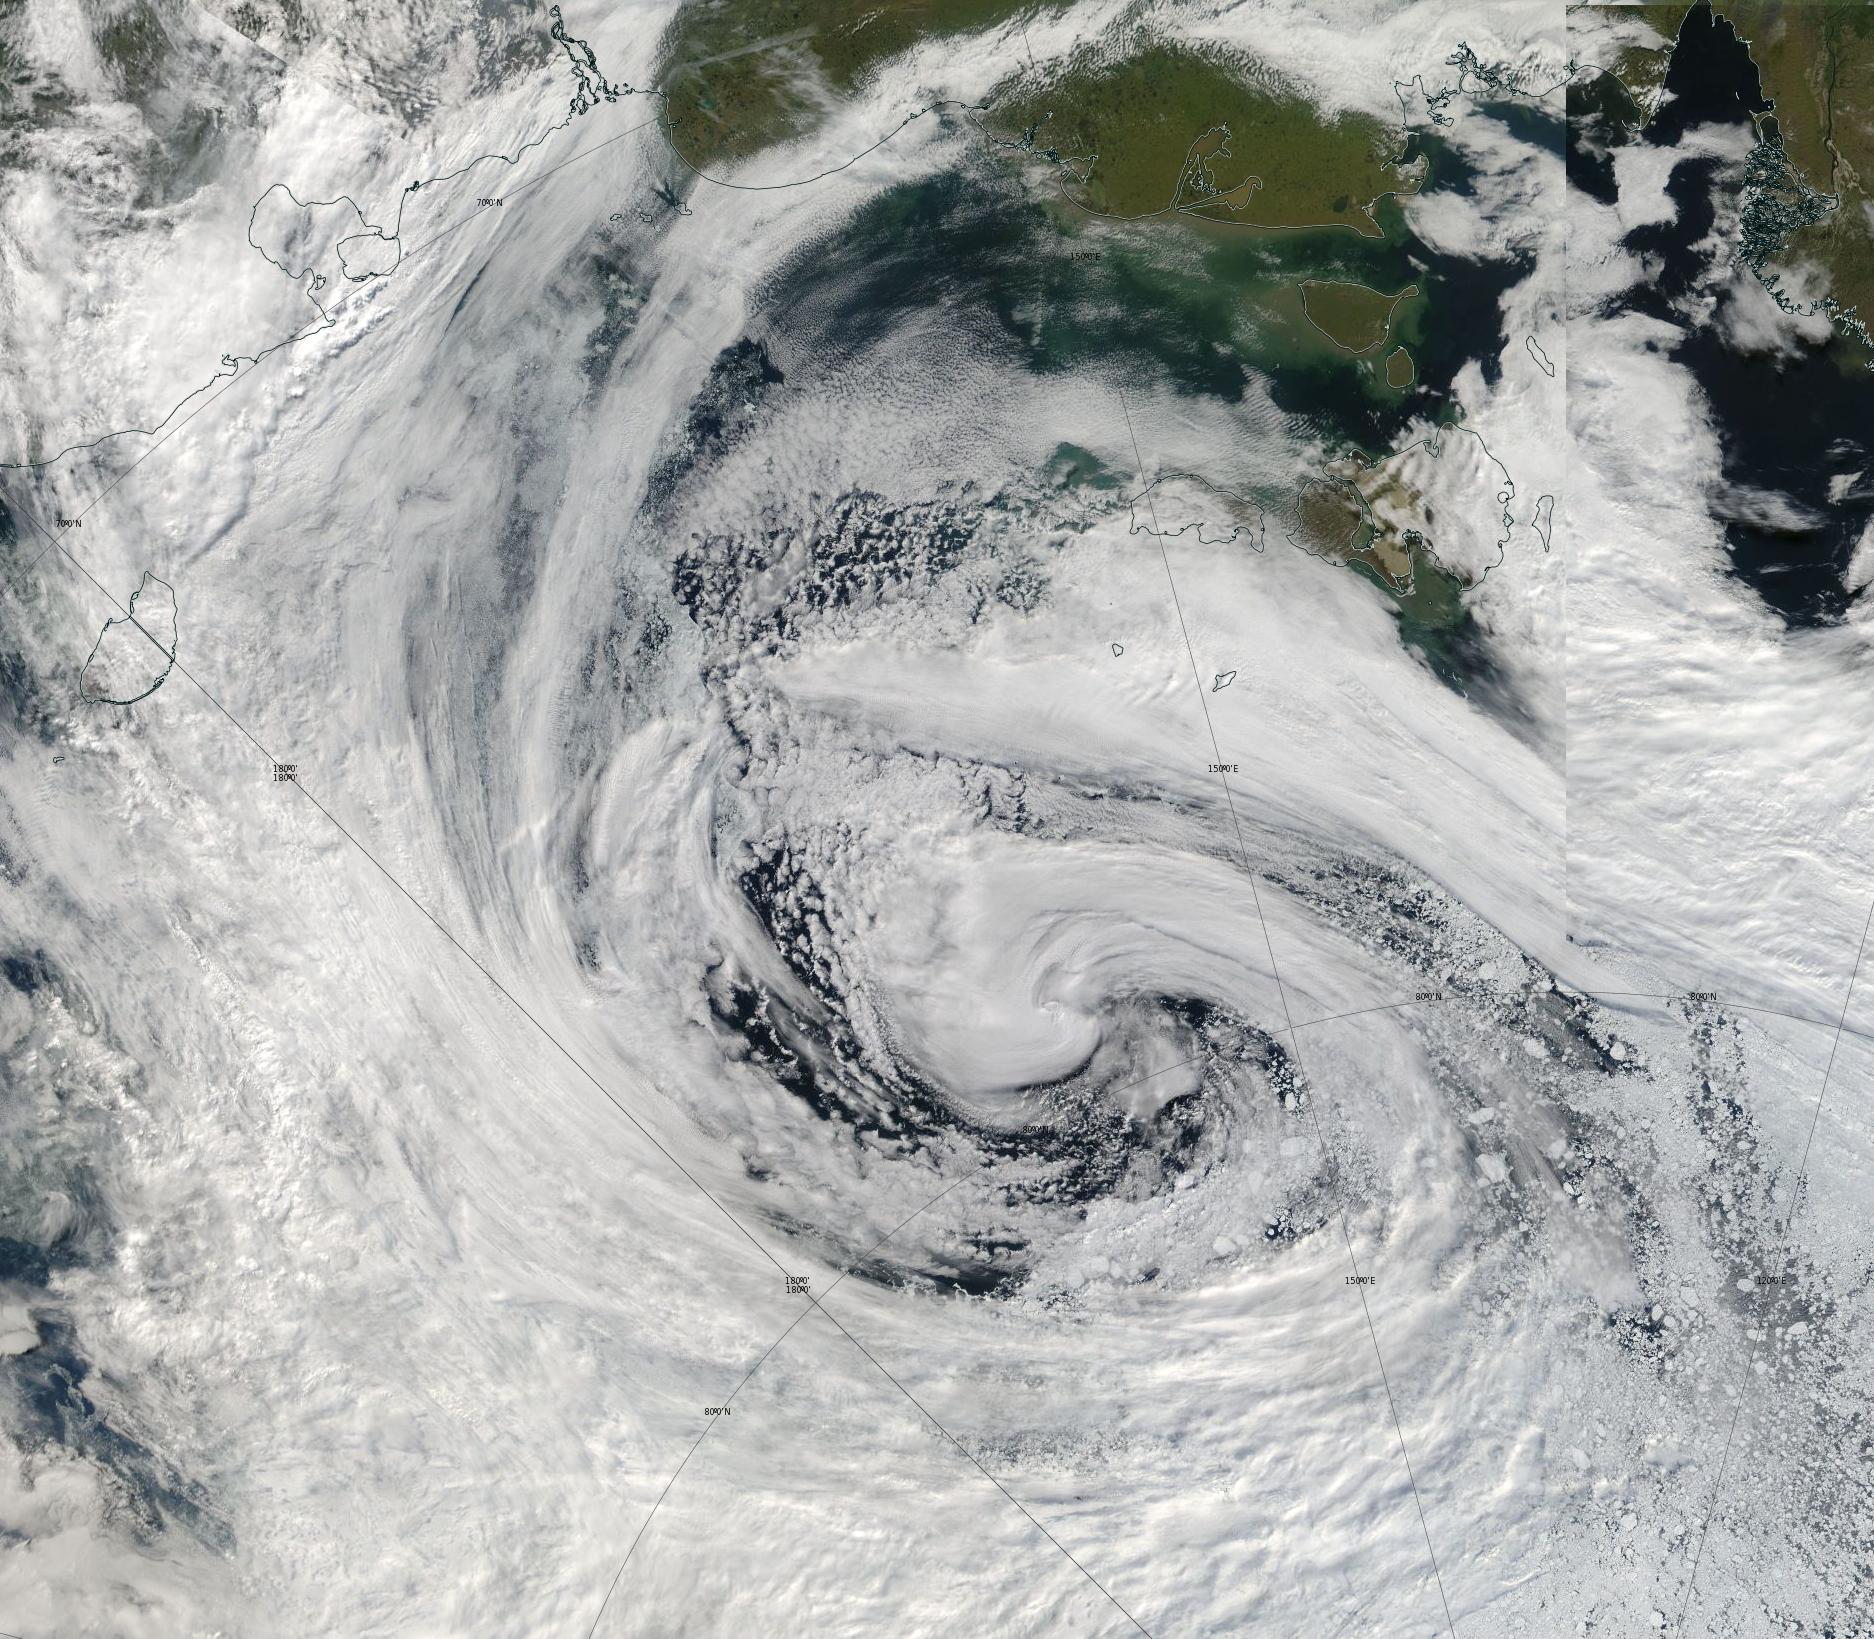
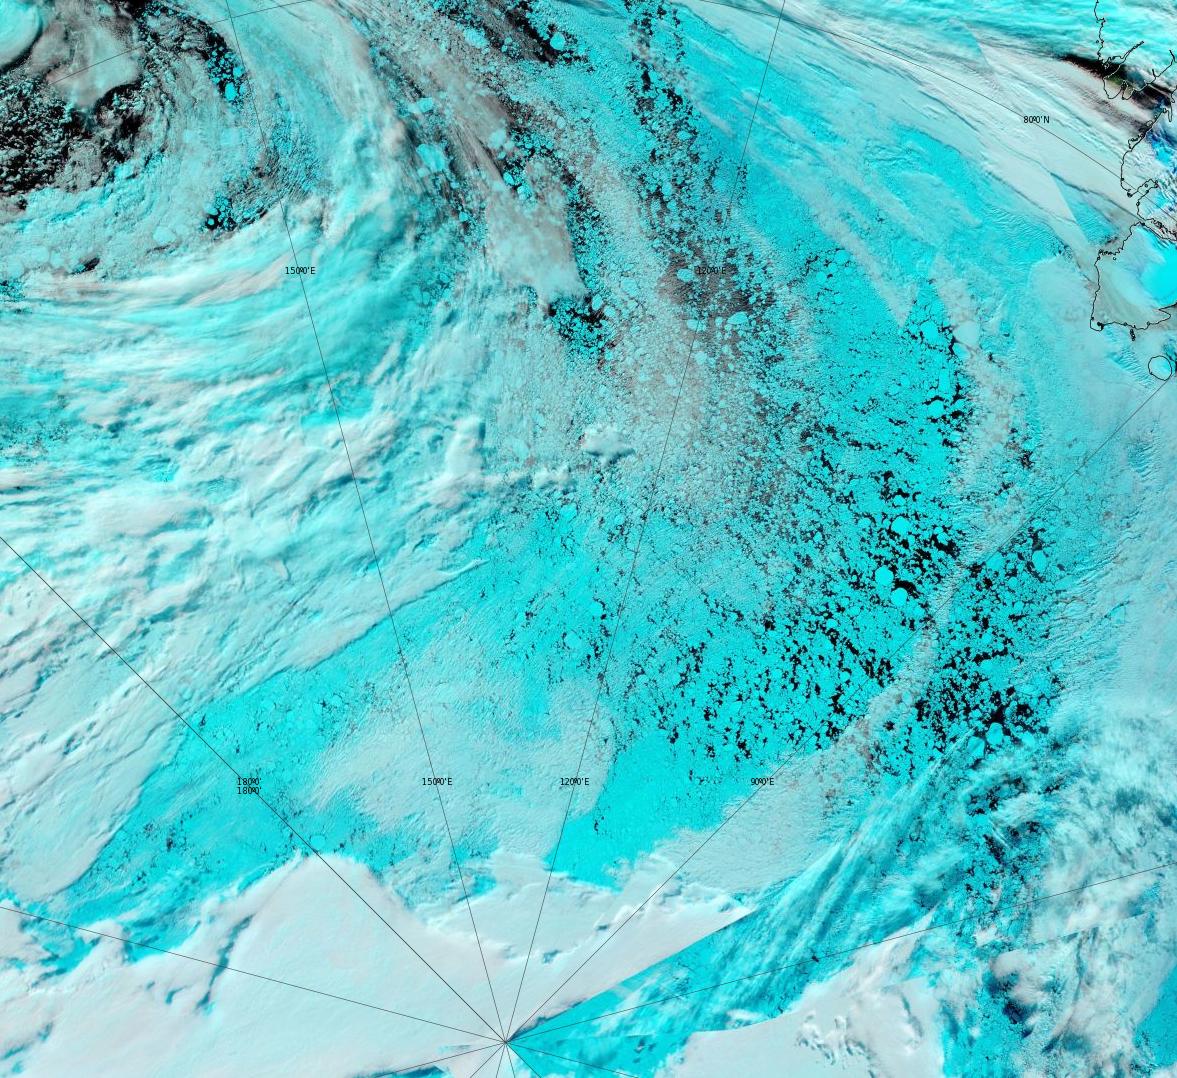
P.S. As Aqua covers more of the Earth’s surface as the day progresses, more of the wide band of fragmented sea ice north of 80 degrees has become visible:
The PIOMAS mid month gridded thickness data has been released. Arctic sea ice volume is now 10th lowest in the satellite era, at 6,181 km3:
Here’s the associated thickness map:
Since the storm in the vicinity is still going strong, I cannot help but wonder how much of the arm of sea ice extending into the East Siberian Sea will remain this time next month:
Possibly as a side effect of the storm, JAXA extent is now fallen to the 2010’s average:
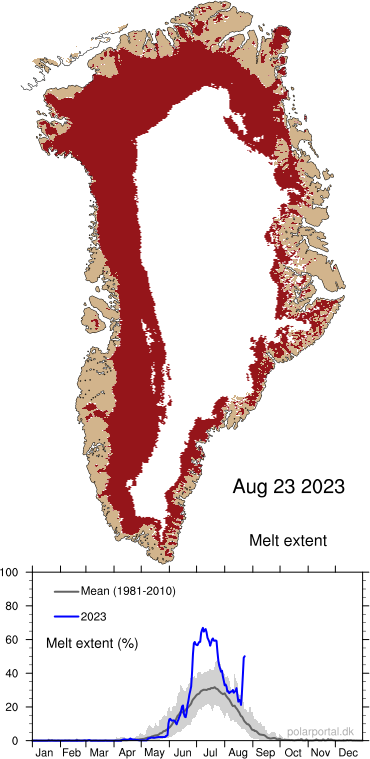
There are some interesting developments in and around Greenland at the moment. Surface melt has kicked in again, rather late in the summer season:
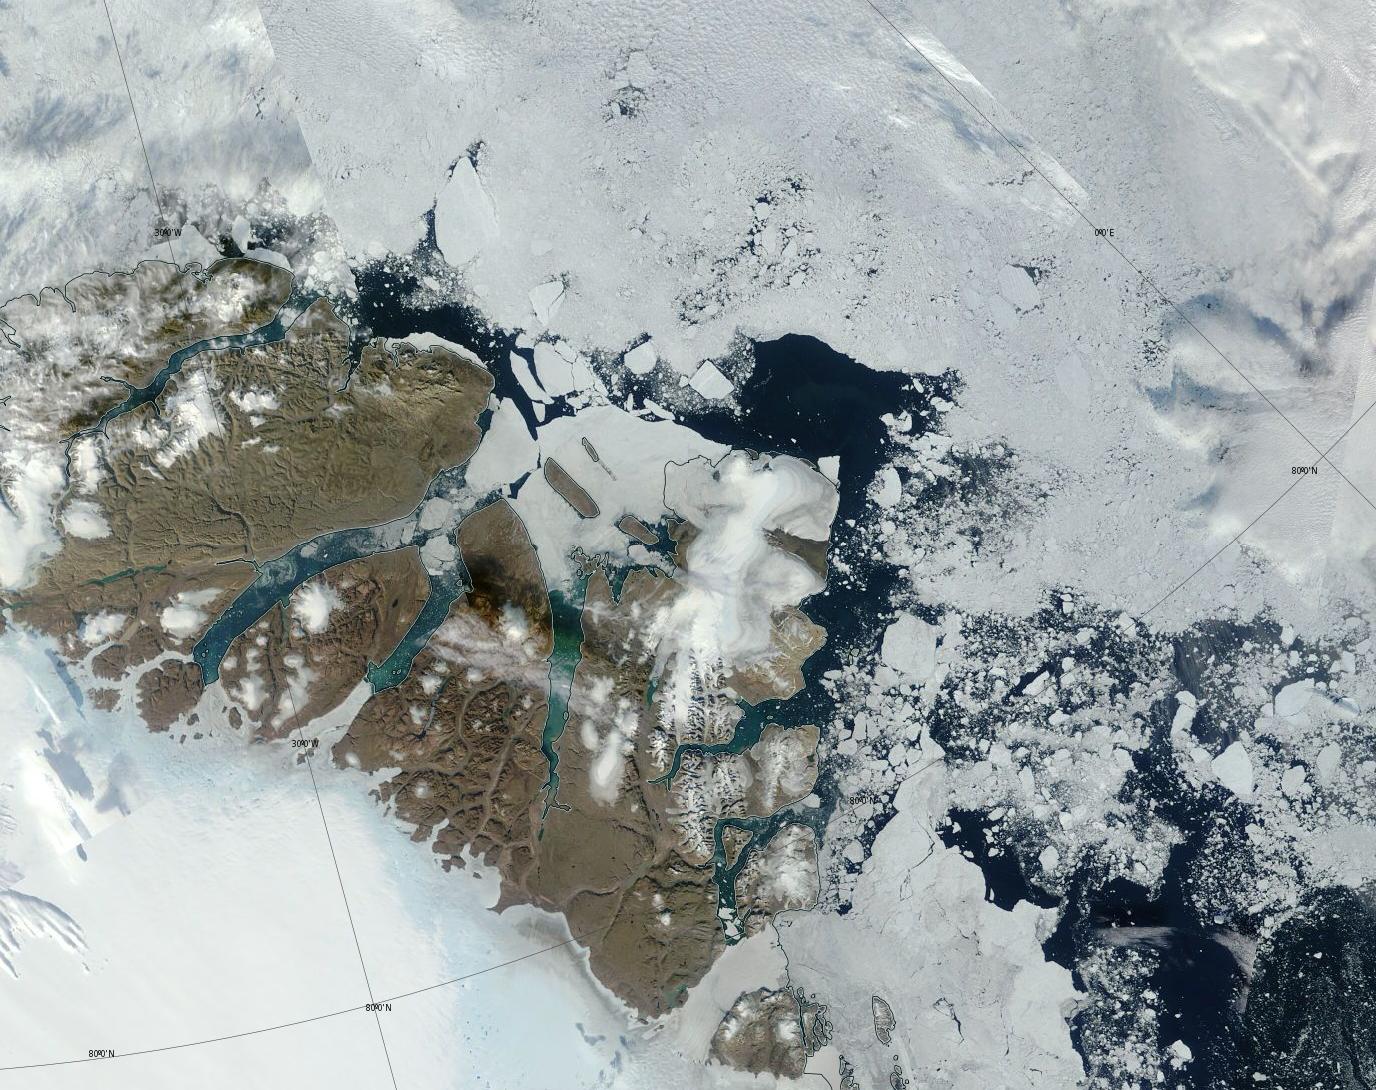
In addition the ice is breaking up off North East Greenland, leaving plenty of open water behind in the process:
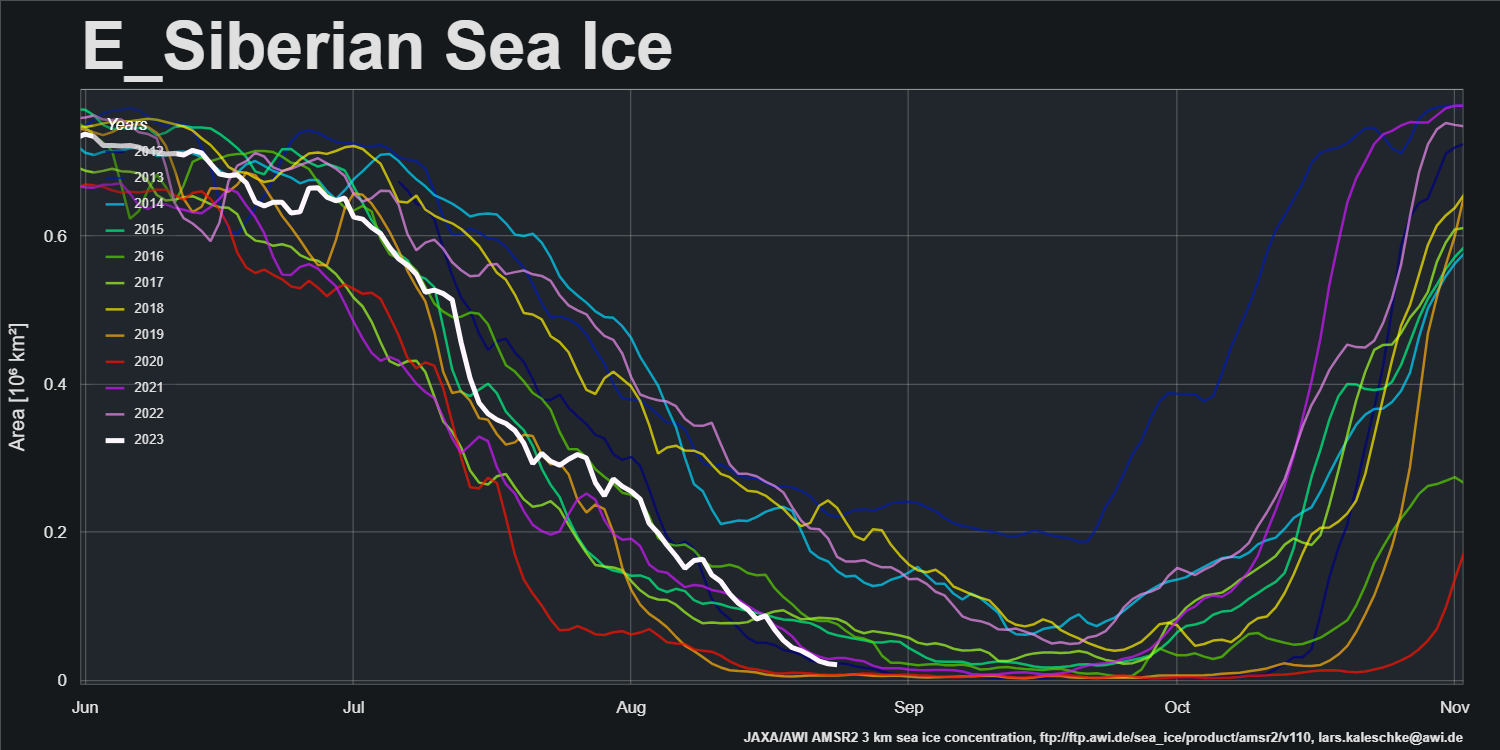
The tenacious Arctic cyclone of August 2023 (TAC23 for short?) certainly seems to have had an effect on the sea ice in its vicinity. According to AWI’s AMSR2 concentration data the remaining ice in the East Siberian Sea has almost completely melted away:
The tenacious Arctic cyclone has finally wandered off into the CAA, with high pressure arriving in its wake. However in its place a sub 990 hPa low has now appeared off northern Greenland:
The conversation continues over on the September open thread.
2022
Jan.31.—-16th.lowest. +333,064 sq.km. above 2010’s average.
Feb.28.—-11th.lowest +116,764 sq.km. above 2010’s average
Mar.31.—-10th.lowest -127,470 sq.km. BELOW 2010’s average
Apr. 30.—-14th.lowest +16,886 sq.km. above 2010’s average
May. 31.—15th lowest +395,097 sq.km. above 2010’s average
Jun. 30-10th.lowest +35,744 sq.km above 2010’s average
Jul. 31.—–12th lowest +228,905 sq.km. above 2010’s average
Aug.31.—-11th.lowest +203,902 sq.km. above 2010’s average
Sep.30.—-–7th lowest +115,918 sq.km. above 2010’s average
Oct.31.– 11th lowest, +269,119 sq.km. above 2010’s average
Nov30.——5th lowest, -183,803 sq.km. BELOW 2010’s average
Dec.31—–4th.lowest,-138,700 sq.km. BELOW 2010’s average
2023
Jan.31—-2nd.lowest, -302,000 sq.km. BELOW 2010’s average
Feb.28——9th.lowest, -36,000 sq.km. BELOW 2010’s average
Mar.31—–7th.lowest, -274,000 sq.km. BELOW 2010’s average
Apr.30—–11th.lowest, +50,500 sq.km. above 2010’s average
May 31—11th.lowest, +103,000 sq.km. above 2010’s average
Jun.30–11th.lowest, +81,754 sq.km. above 2010’s average
Jul.31 —13th. lowest, +244,585 sq.km. above 2010’s average
Aug.1—–12th.lowest, +235,630 sq.km. above 2010’s average
We wait to see if August remains above the 2010’s average
Thanks for the update Neil:
So Tony Heller’s recent assertion that “Arctic sea ice extent is the highest in seventeen years” is in actual fact extremely “economical with the truth”?
Hi Jim,
Not sure where Toni gets his information from.
My information comes from Artic Sea Ice Forum which I know you contribute to. If Juan Garcia’s data is correct Aug.2nd. 2014 was 63,110 sq.km. higher than 2023.
Notice that I keep comparing sea ice extent to the 2010’s average. There does appear to be some sort of recovery at the moment. Will it continue through to September
Juan provides a regular update based on JAXA extent numbers as soon as they are released for the day, late in the evening where he lives in Mexico.
Gerontocrat usually follows with a more comprehensive data set range of both extent and area from JAXA and NISDC.
As of now extent has been above average, though it’s interesting to note area has been lower.
Area is currently 8th lowest, maybe not spectacularly low, but lower than the last two years.
In fact the 7 lowest years by area at this point turned out as the 7 lowest years by extent by September minimum.
What we can say is the ice is very diffused in places( more vunerable to melt?) Though perhaps “a bit behind” due a slow start to the melt season.
Will be interesting to see how August pans out!
“Steve”/Tony cherry picks whichever Arctic metric allows him to attempt to pull the wool over the eyes of his flock of faithful followers on any particular day.
What’s the volume???
Watch this space!
P.S. See above:
https://GreatWhiteCon.info/2023/07/facts-about-the-arctic-in-august-2023/#Aug-05
Well, according to volume the Arctic sea ice seems to have stabilised.
And, thanks Jim
You’re welcome!
Of cause it has! Arctic sea ice is not linear.
Mornin’ Matt (UTC),
Of course it hasn’t!
Rather than spending your time curve fitting, perhaps you might read some Arctic science? Here you go:
https://GreatWhiteCon.info/2021/10/facts-about-the-arctic-in-october-2021/
and/or
https://GreatWhiteCon.info/2023/04/facts-about-the-arctic-in-april-2023/#comment-677629
If Matt is up for a wager that sea ice will return to 1980 levels by 2040, I’m in 😉
The ball’s in your court Matt!
All that’s missing from Matt’s curve fit is the data from the 50’s, 60’s and 70’s, which, if rumors are true, could provide support for his hypothesis. Were the late 70’s, when a ‘coming ice age’ was being hyped, truly a modern ice high point?
The main thing missing from Matt’s curve fit is any Physics!
The data is not linear.
Yup. I see what you mean:
Hi Jim.
I’d take that sea surface temperature with a pinch of salt. I think you know why.
Regards, Matthew
Thanks for the graph and reference to the Stein paper, Matthew. I’ll check it out. In the meantime, the graph also correlates nicely with the Roman and Minoan periods, doesn’t it!
Here’s “Arctic Ocean sea ice cover during the penultimate glacial and the last interglacial“.
I thought skeptical sorts weren’t very keen on the use of “proxy” climate data? What’s more I can’t find Matt’s graph anywhere in the paper!
Can you?
I found the same paper and also not the graph, Jim. I’m assuming there must be another Stein paper that year. Matt, can you point us to it?
And BTW, we’re not opposed to proxies, not sure how else estimates could be done. We’re opposed to misuse of proxies, like Dr. Mike’s famous example…
I think Matt will have great difficulty in complying with your request Taylor.
“Dr. Mike’s famous example” was the one I was thinking of!
Relevance?
It seems Matt was just driving by.