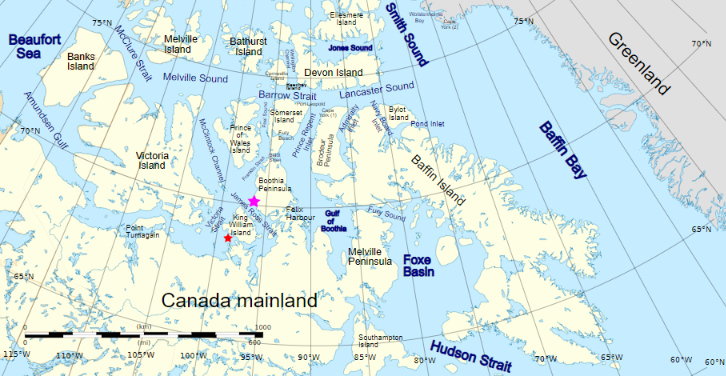
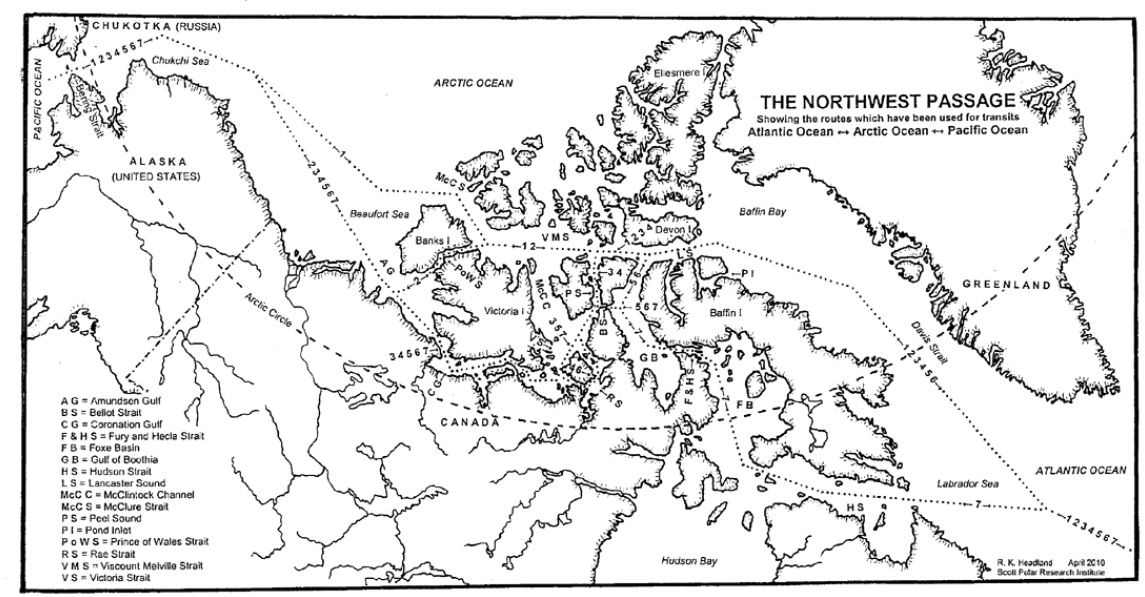
I’m opening the 2025 Northwest Passage thread earlier than usual, because of some news you can read if you scroll down. However, let’s first of all get our bearings with the help of this map of the area:
and another map detailing the routes through Canadian Arctic Archipelago that have previously been successfully traversed:
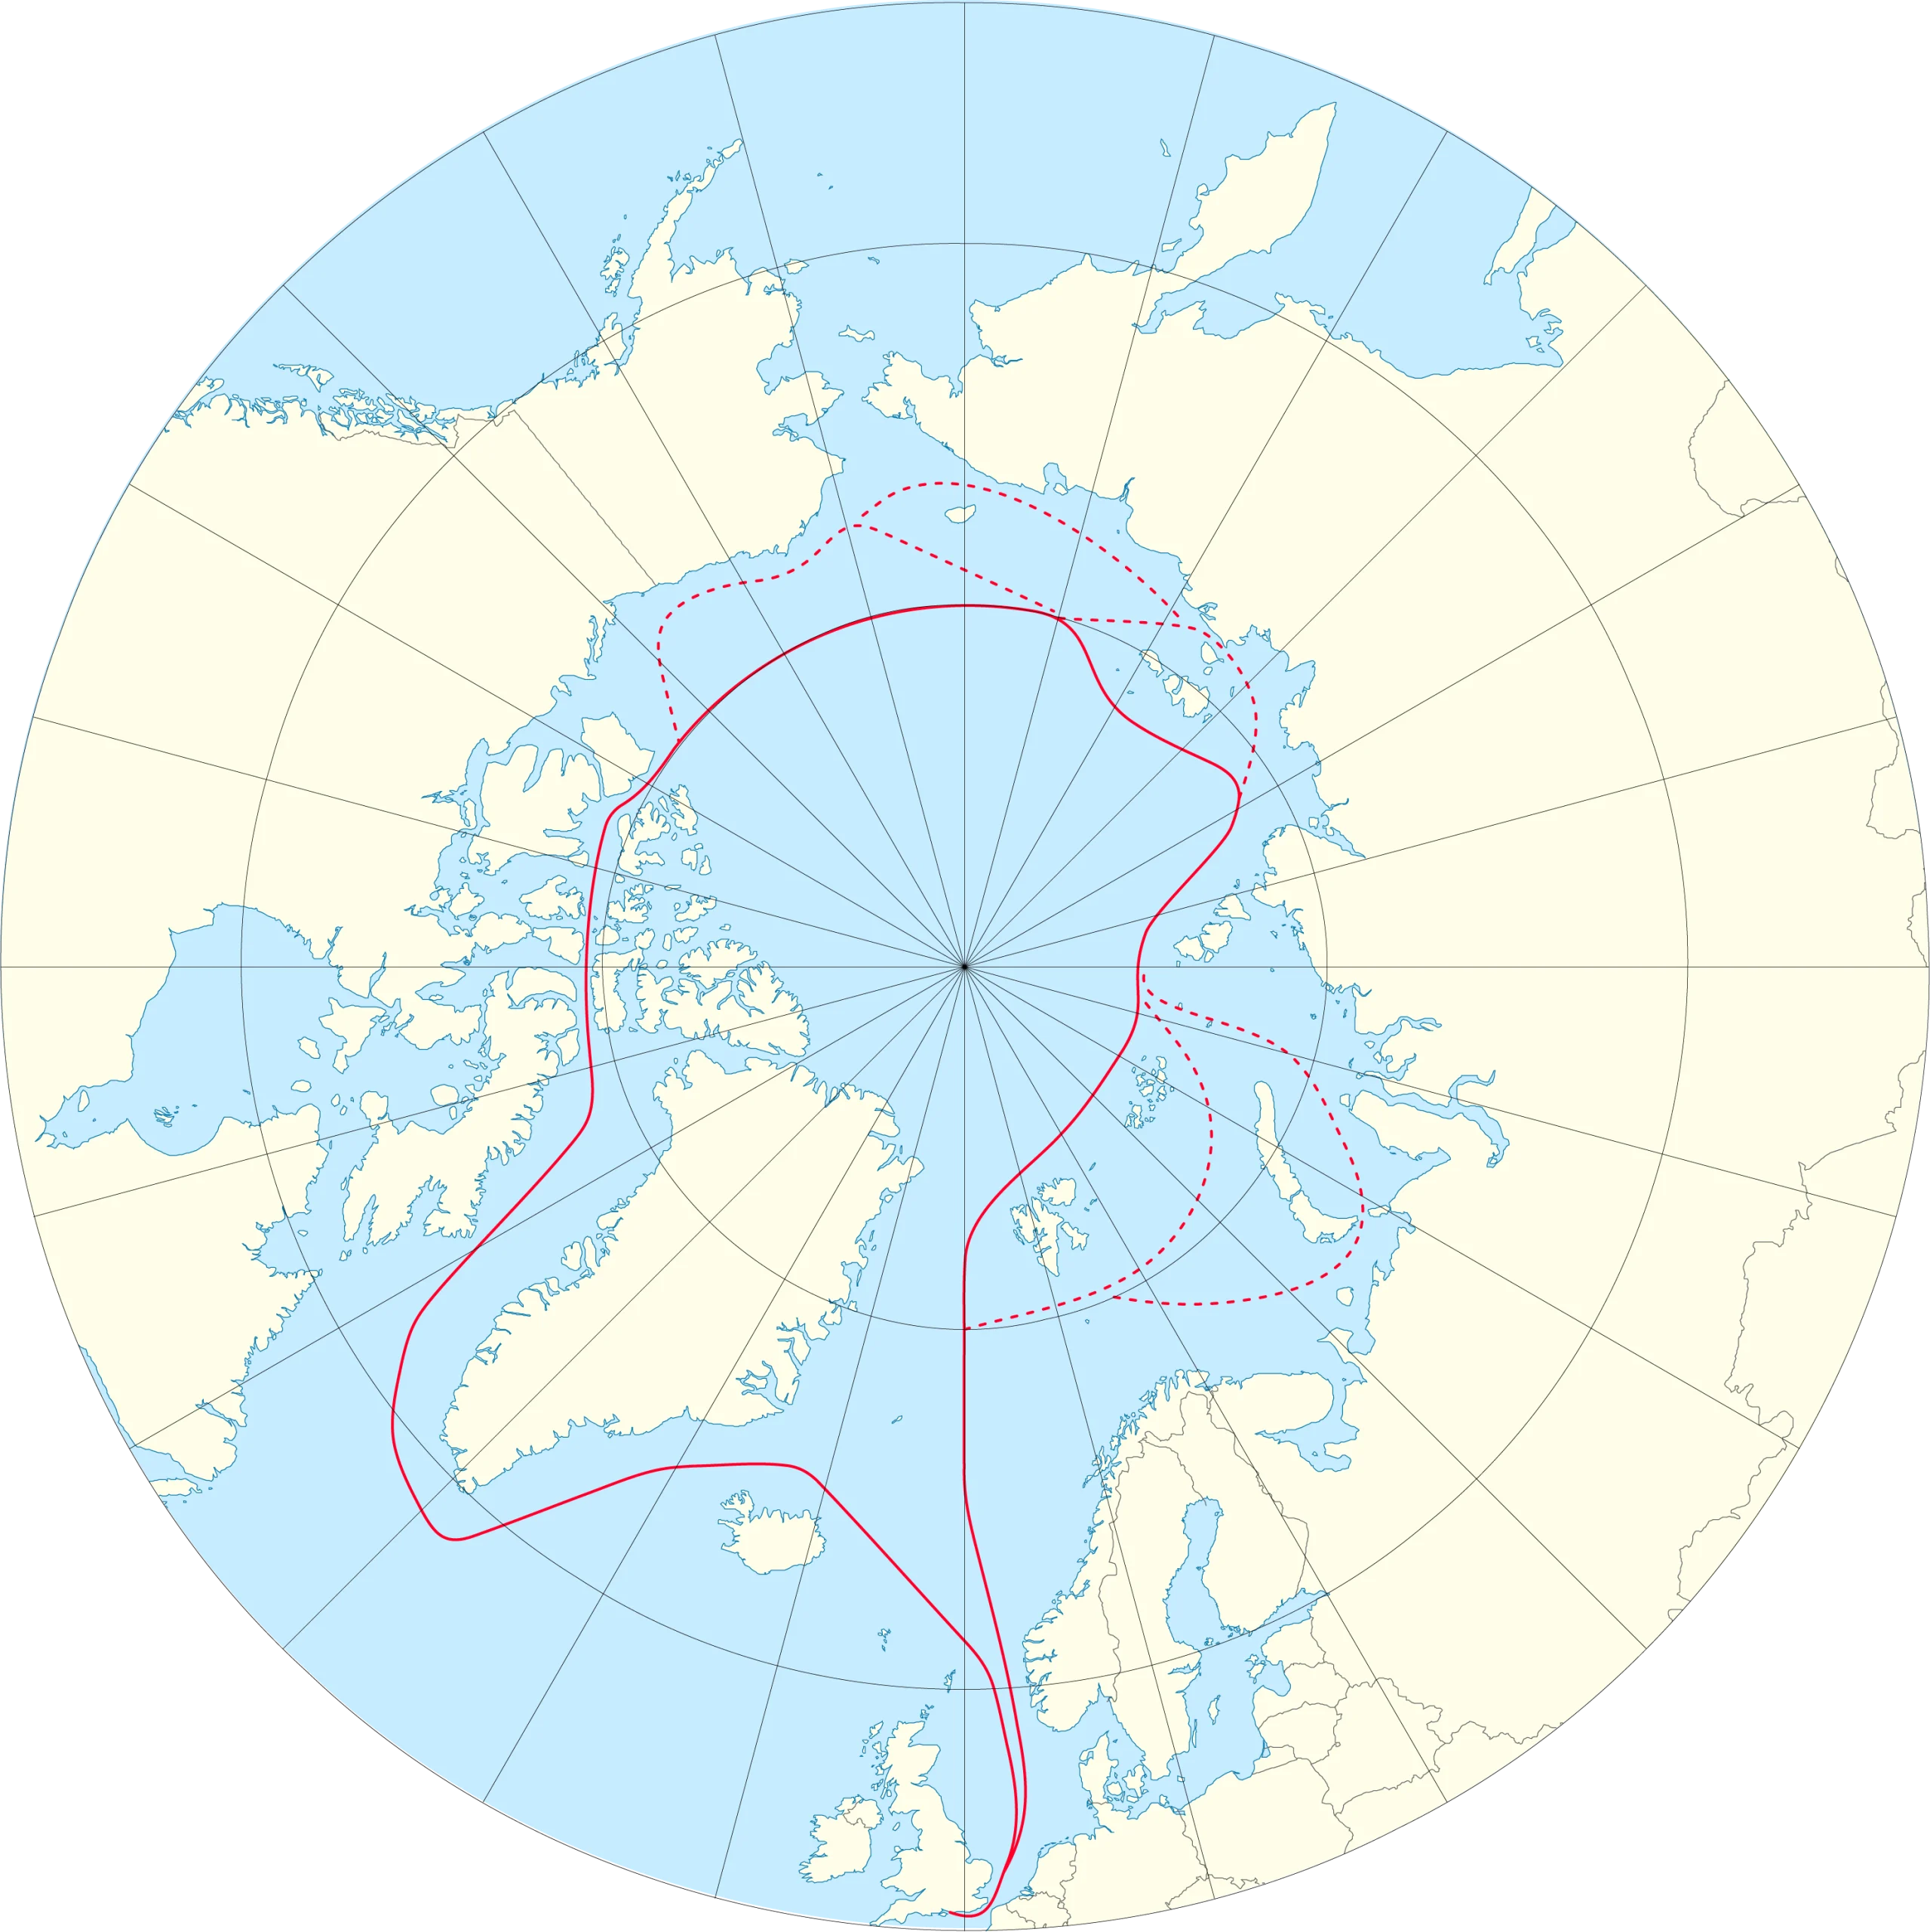
The news I was referring to is that at lunchtime today Ella Hibbert is setting off in her yacht Yeva from Haslar Marina near Portsmouth in southern England for a rather unusual voyage through the Northwest Passage this summer. Here is Ella’s current route plan:
You will note some unusual features. Apparently Ella is intent on taking Route 1 into the Beaufort Sea via McClure Strait. After that she is not heading for the Bering Strait, but is instead taking the route less travelled back to Haslar via the Northern Sea Route. Perhaps even more surprising in this day and age is that Ella has received permission to sail through Russian waters without an ice pilot. She is aiming to complete an entire circumnavigation of the Arctic in a single summer single handed! As Ella puts it, this is “A voyage that should not be possible”:
Ella is hoping to overcome terrifying challenges including icebergs, freezing water and polar bears.
Her journey – which has only recently become possible due to melting polar ice caps – aims to showcase the devastating environmental impact of sea ice decline, both in the Arctic and across the world.
Ella’s voyage also aims to support two charities working tirelessly to protect the Arctic: Polar Bears International and the Ocean Conservancy.
At the end of her voyage, Ella will auction her ship Yeva with proceeds to go to these two charities.
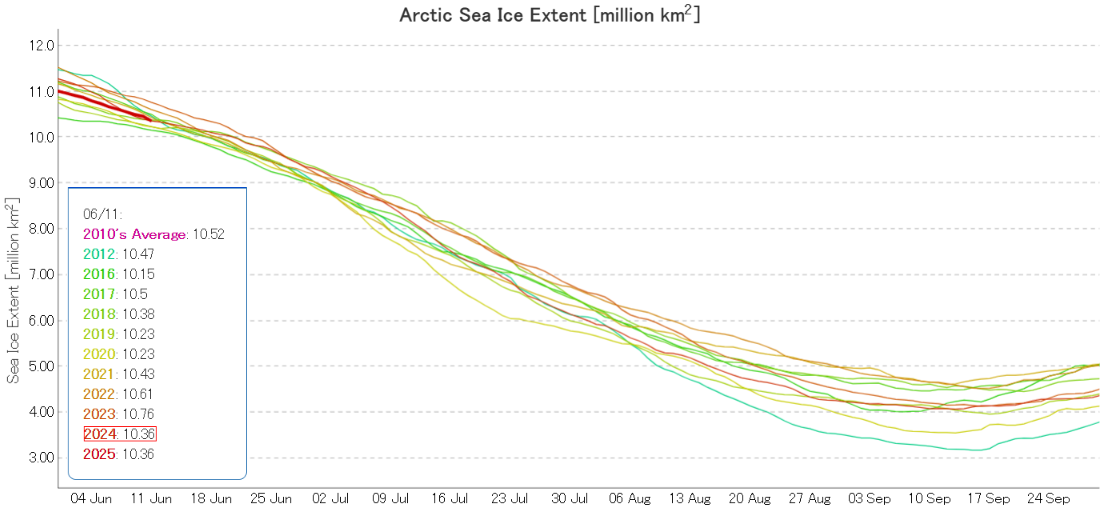
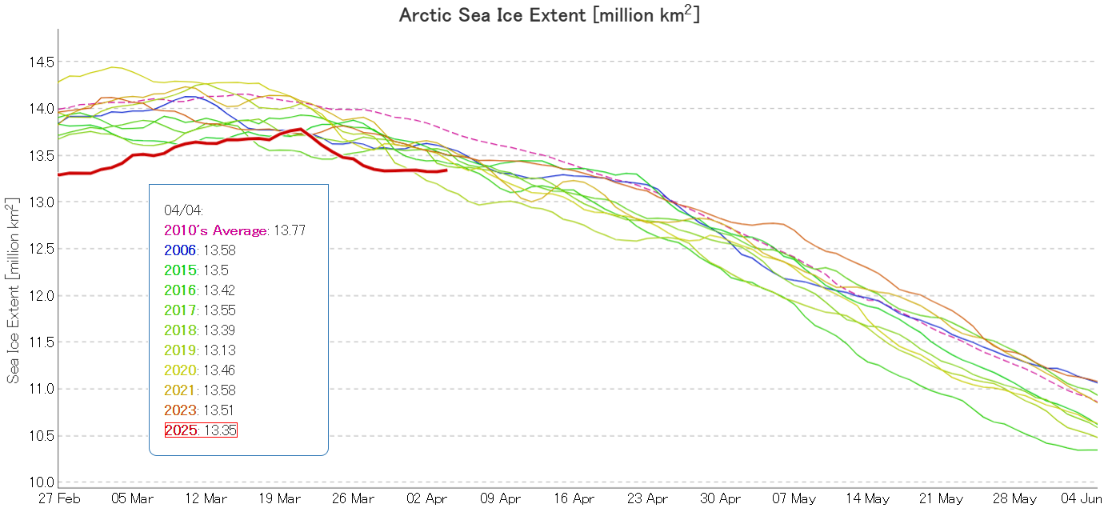
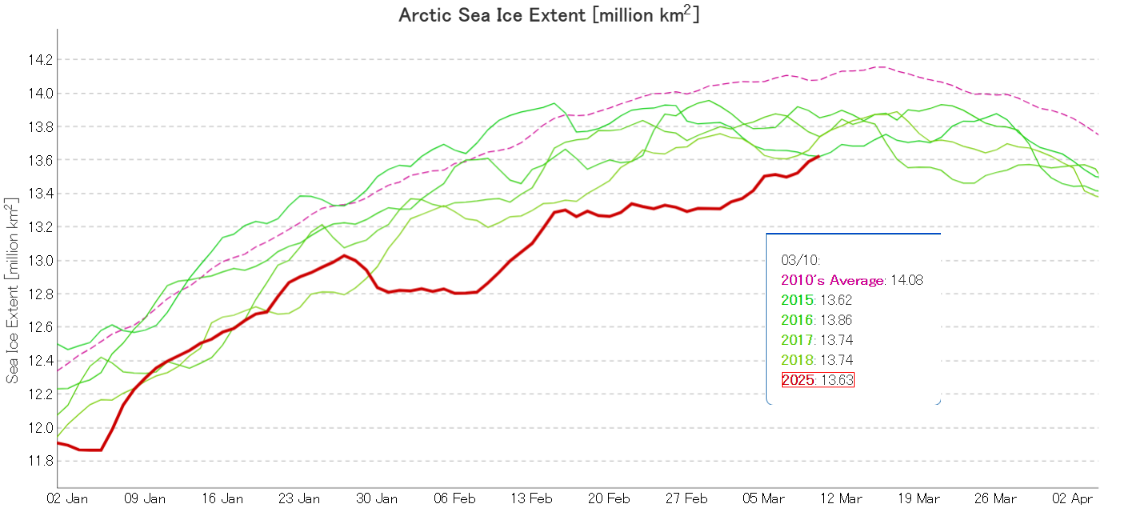
After spending several weeks in the unfortunate position of lowest for the date, JAXA/ViSHOP Arctic sea ice extent has just risen above 2015. By a mere 10,000 km²:
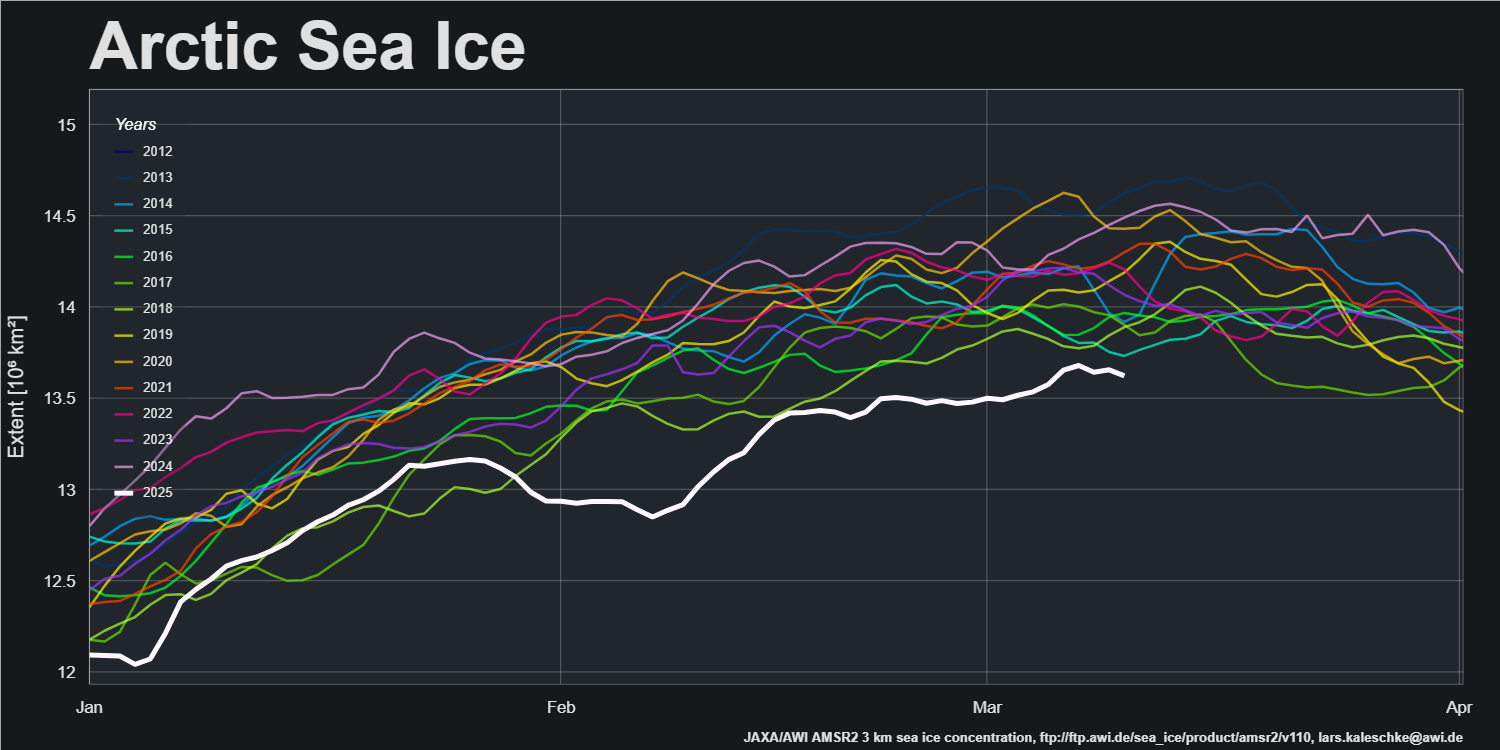
Despite the fact that JAXA extent is still rising, AWI extent has potentially already achieved its maximum value for 2025:
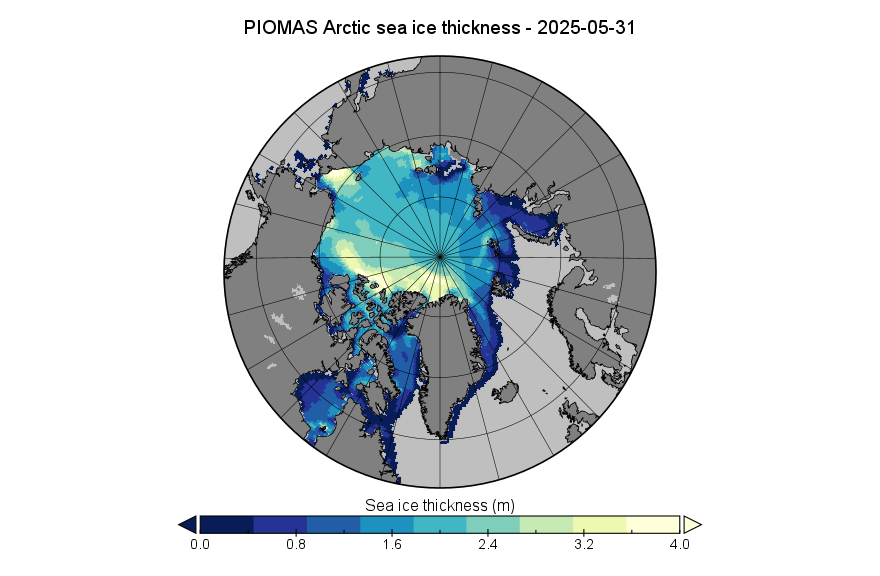
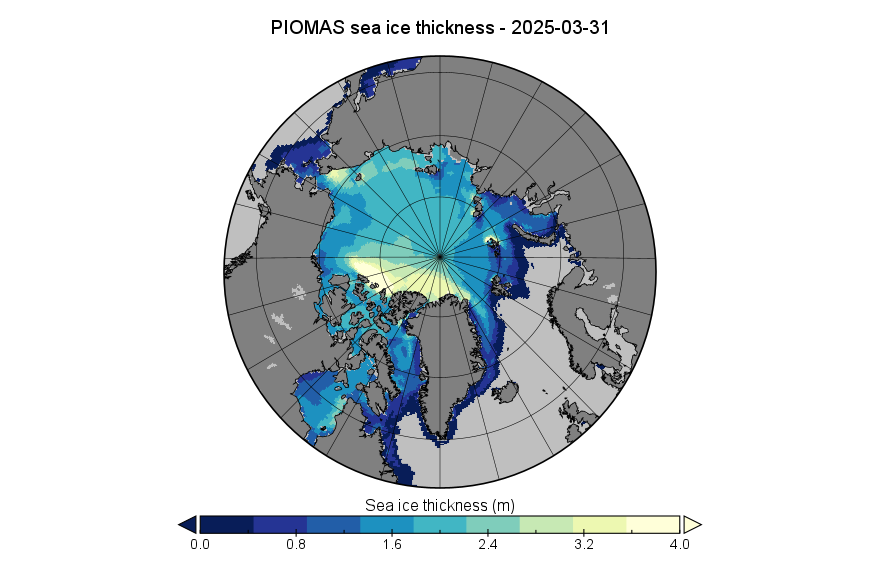
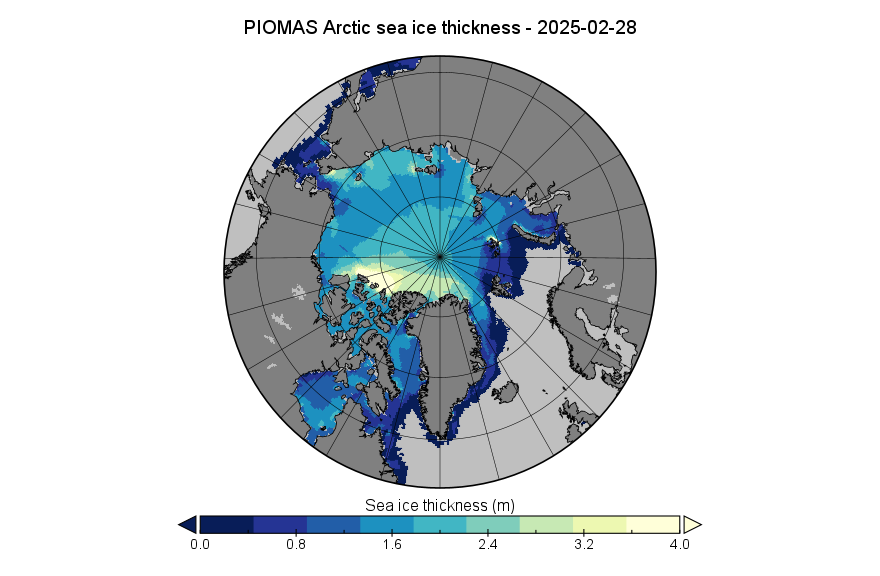
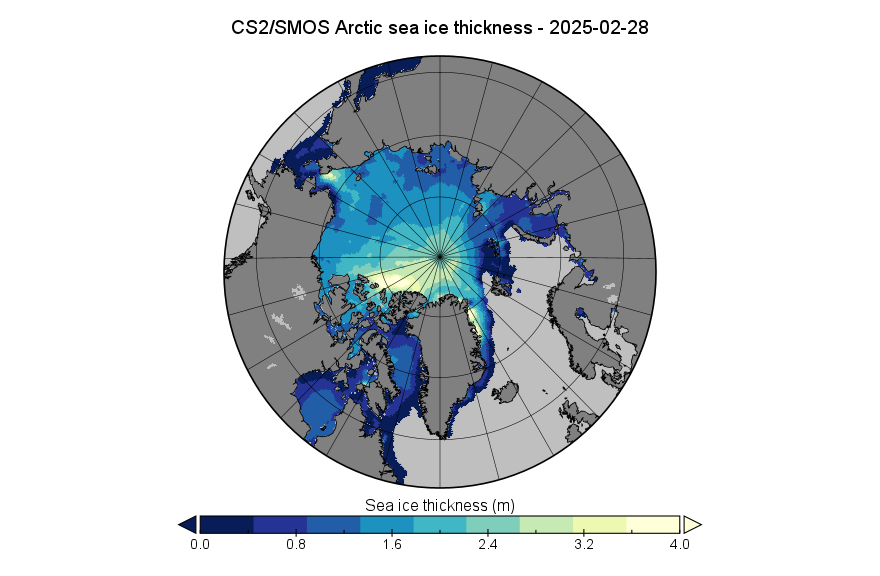
Somewhat belatedly, here is the PIOMAS sea ice thickness map for February 28th 2025:
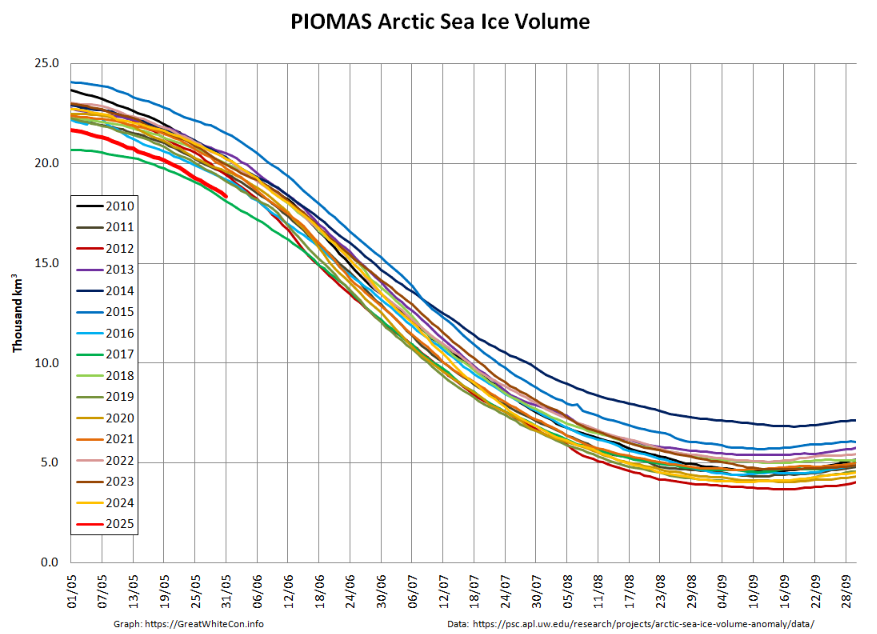
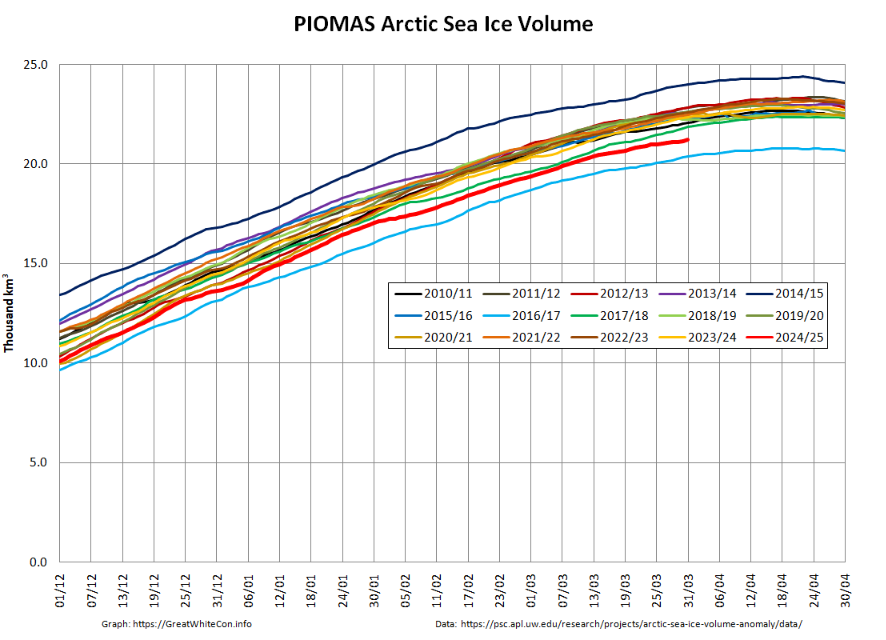
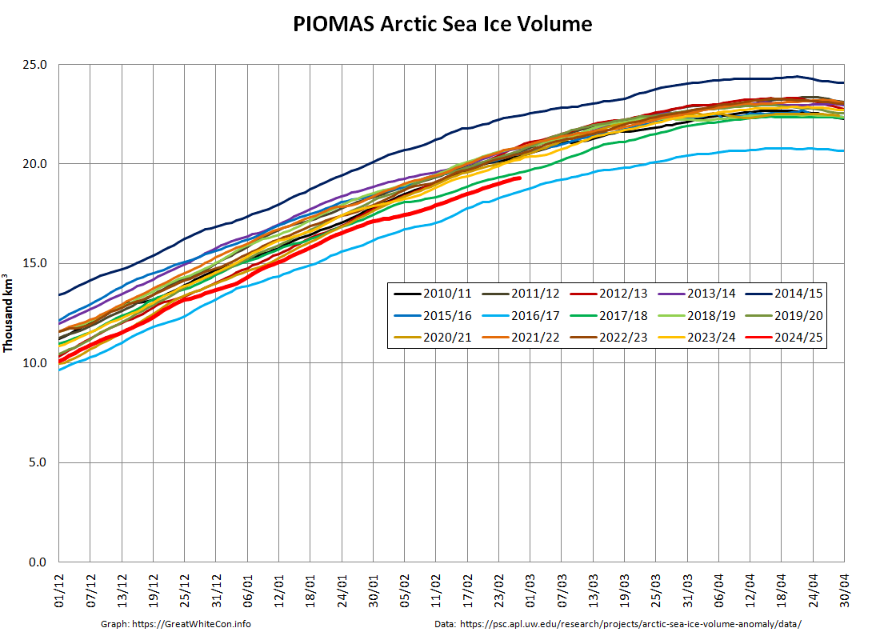
At the end of February Arctic sea ice volume had increased to 19.32 thousand km³, still 2nd lowest for the date in the PIOMAS record:
AWI have also released a new version of their thickness product, incorporating additional data from the two Sentinel 3 satellites. The thickness data for February 28th, looks slightly different:
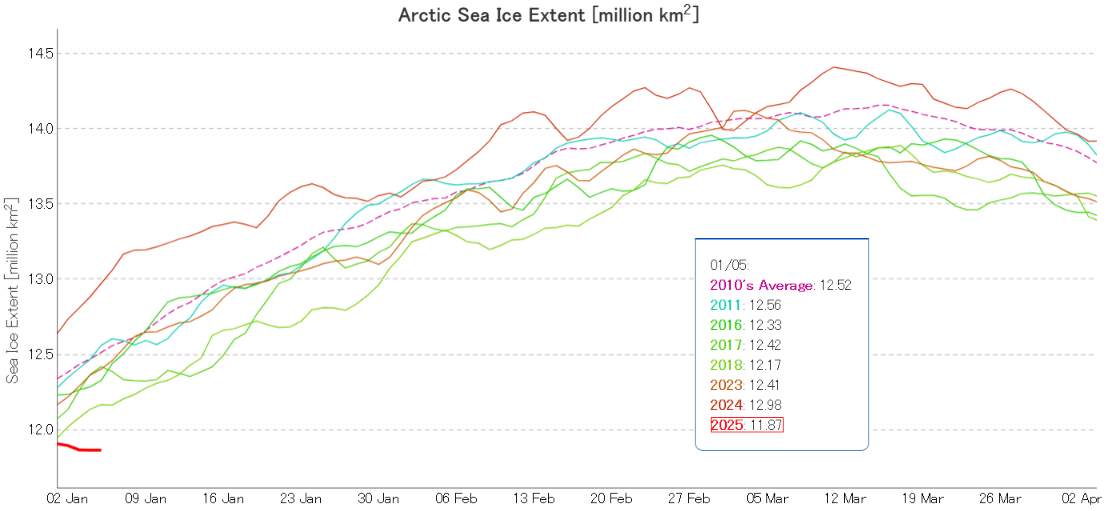
The New Year began with JAXA/ViSHOP extent lowest for the date in the satellite era, just below 2018 . Since then extent has reduced, and there is now a large gap:
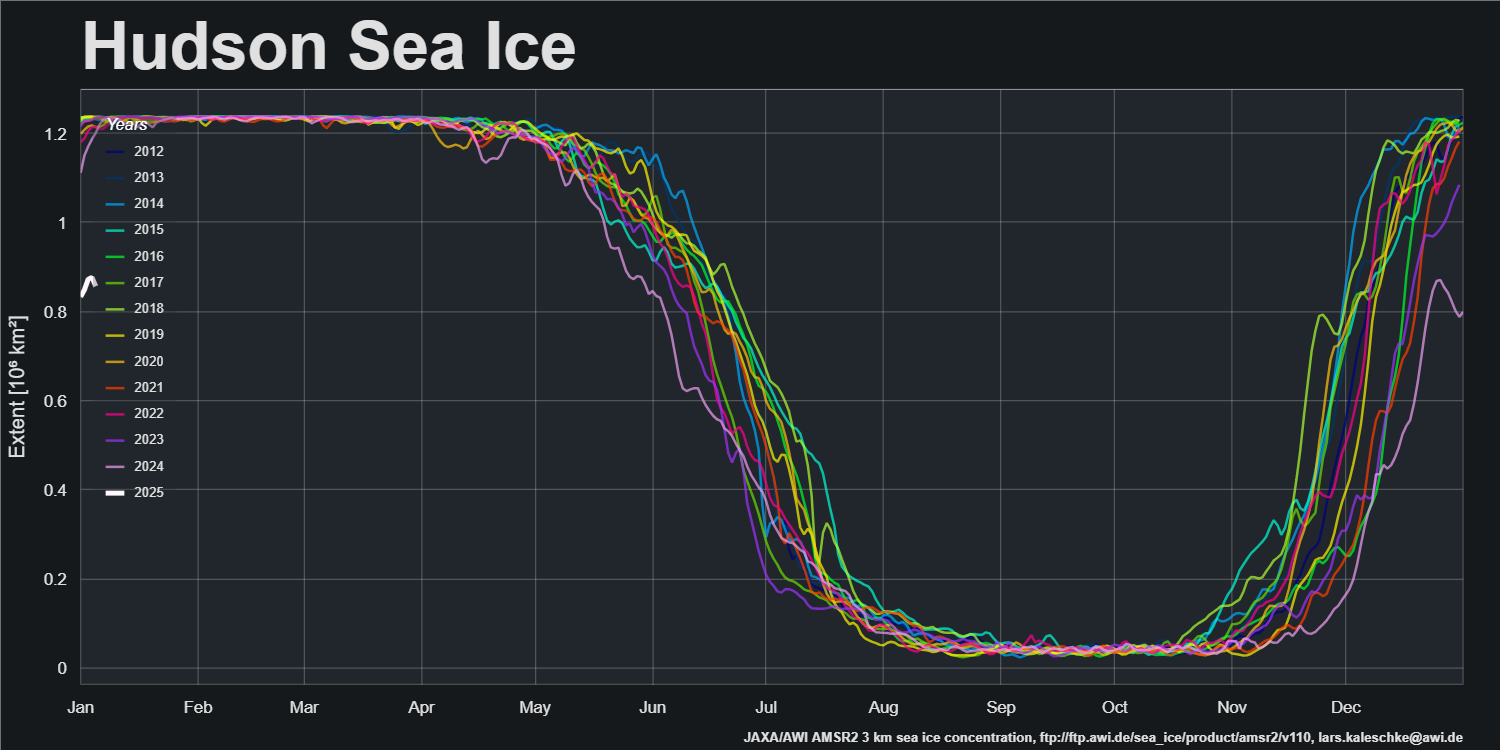
The primary reason for this is the remaining open water in Hudson Bay:
In previous years Hudson Bay has been covered by sea ice by this time of year, but in 2025 a large area remains unfrozen in early January!
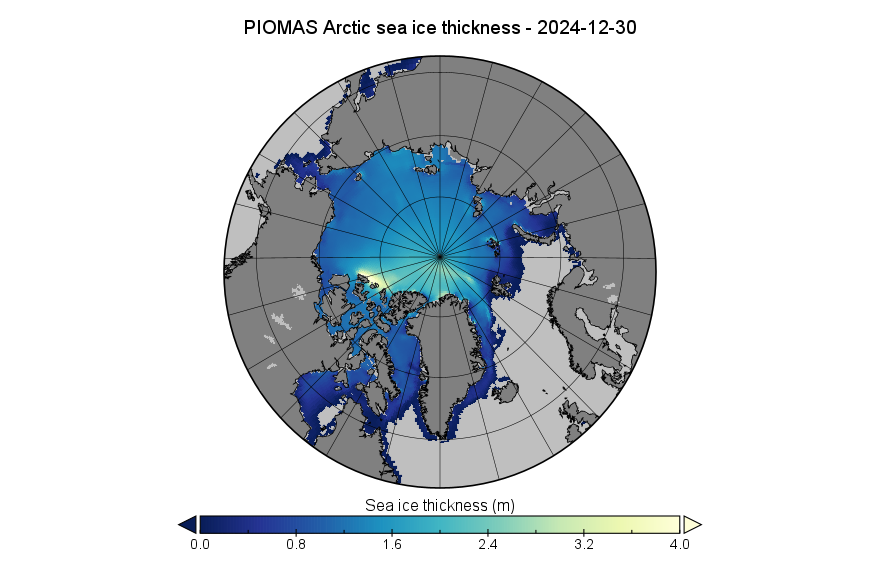
Due to the way PIOMAS handles the leap years the last gridded thickness data of 2024 is dated December 30th:
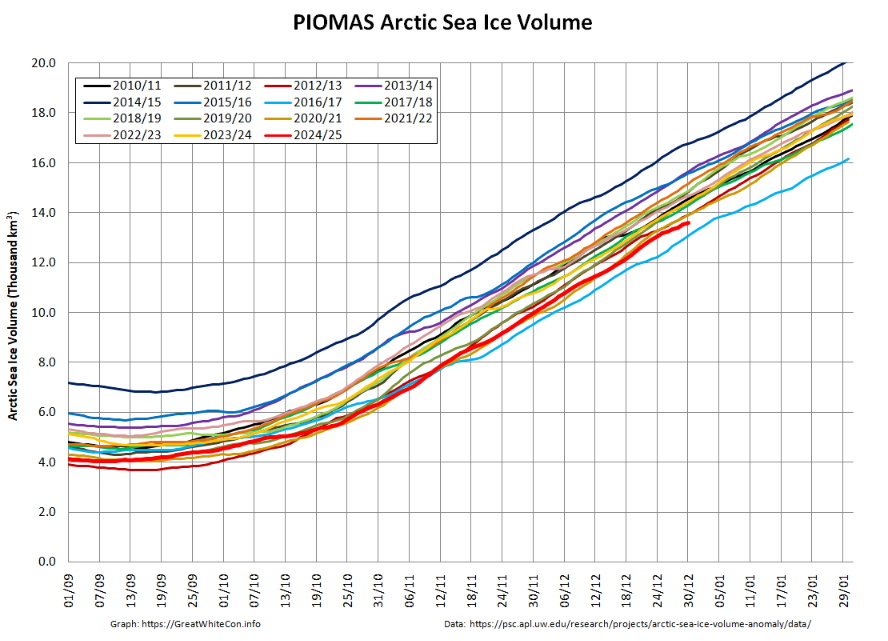
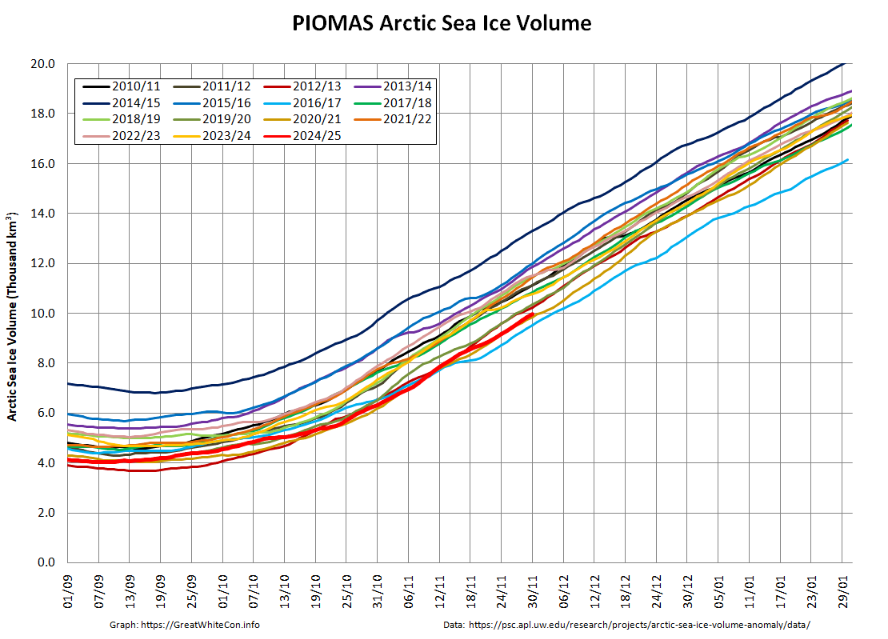
By December 30th Arctic sea ice volume had increased to 13.61 thousand km³, 2nd lowest for the date in the PIOMAS record:
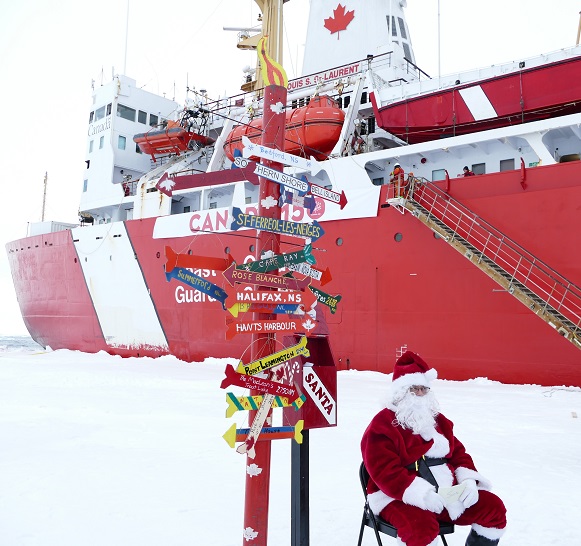
Christmas is coming, and even as we speak Snow White is heading for the geographical North Pole to assist Santa’s little helpers in their annual gift delivery mission:
Santa at the North Pole in August 2016
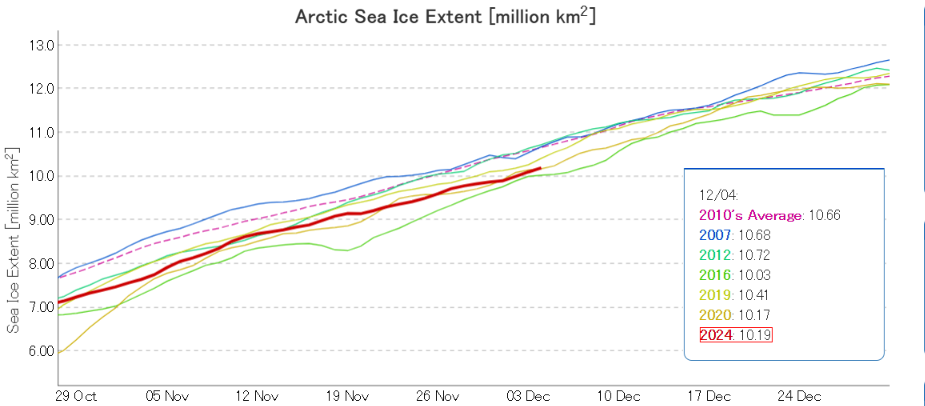
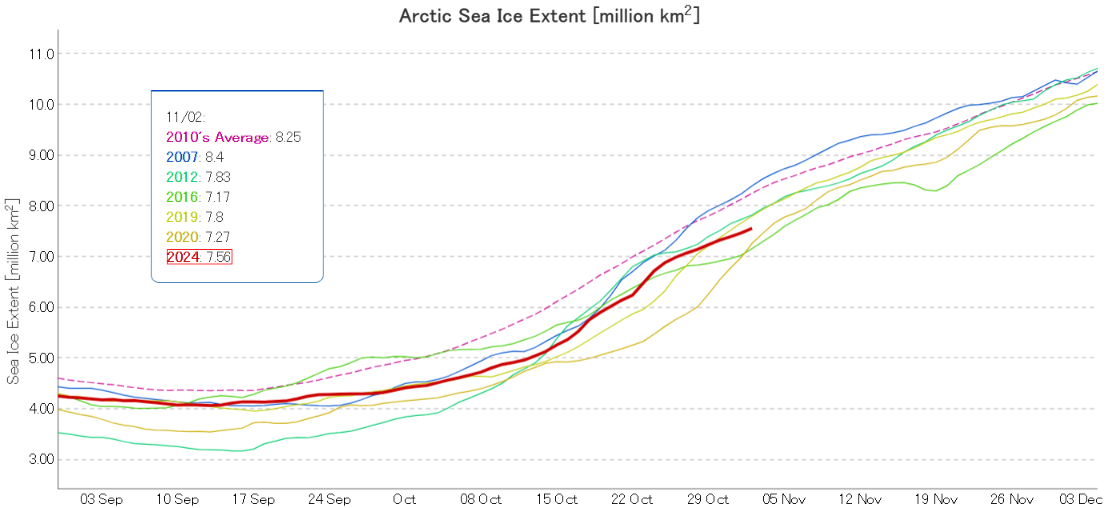
We’ll start the festive season with a graph of JAXA/ViSHOP extent, which is in a “statistical tie” with 2020 for 2nd lowest for the date in the satellite era:
The Laptev and East Siberian Seas have now refrozen. Consequently Arctic sea ice extent is now increasing more slowly, and JAXA/ViSHOP extent is 3rd lowest for the date in the satellite era:
Note the change in scale from previous months, to allow for easier comparison with the “near real time” CryoSat-2/SMOS merged thickness data from the Alfred Wegener Institute:
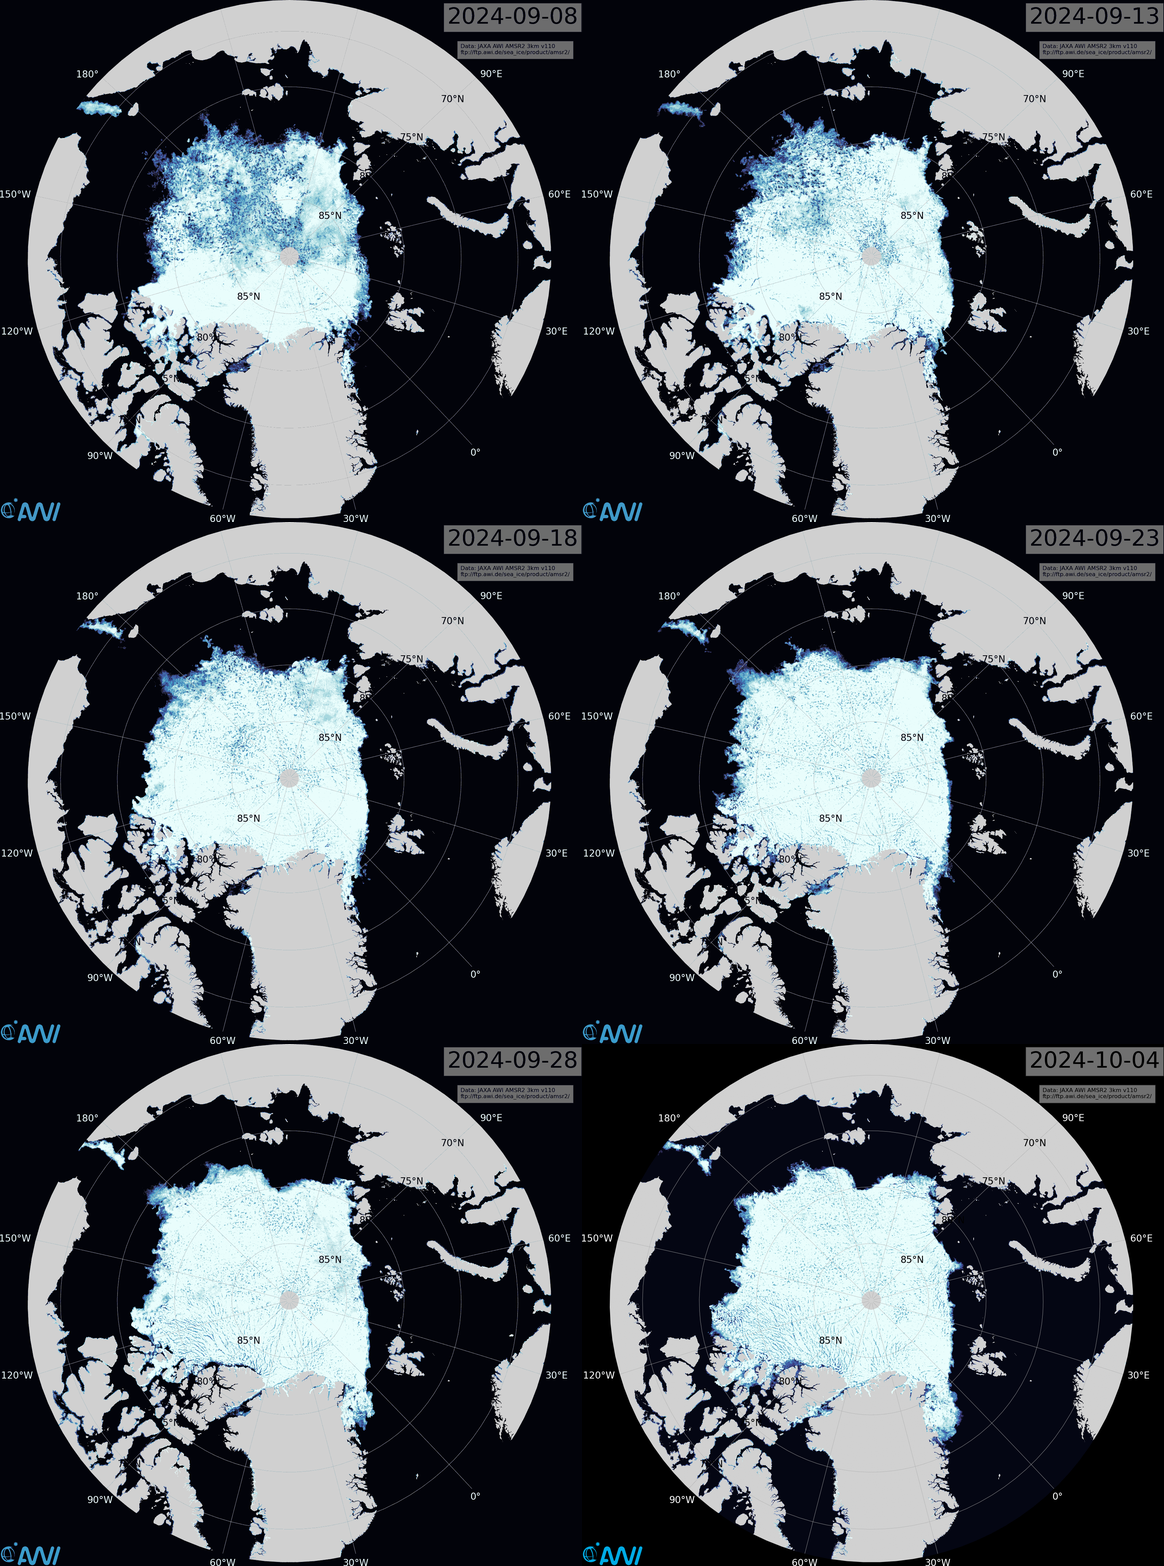
The JAXA extent graph is currently not updating, so let’s begin this month with the latest AMSR2 sea ice concentration map from the Alfred Wegener Institute. Click the image to see a ~10 Mb animation of the last four weeks:
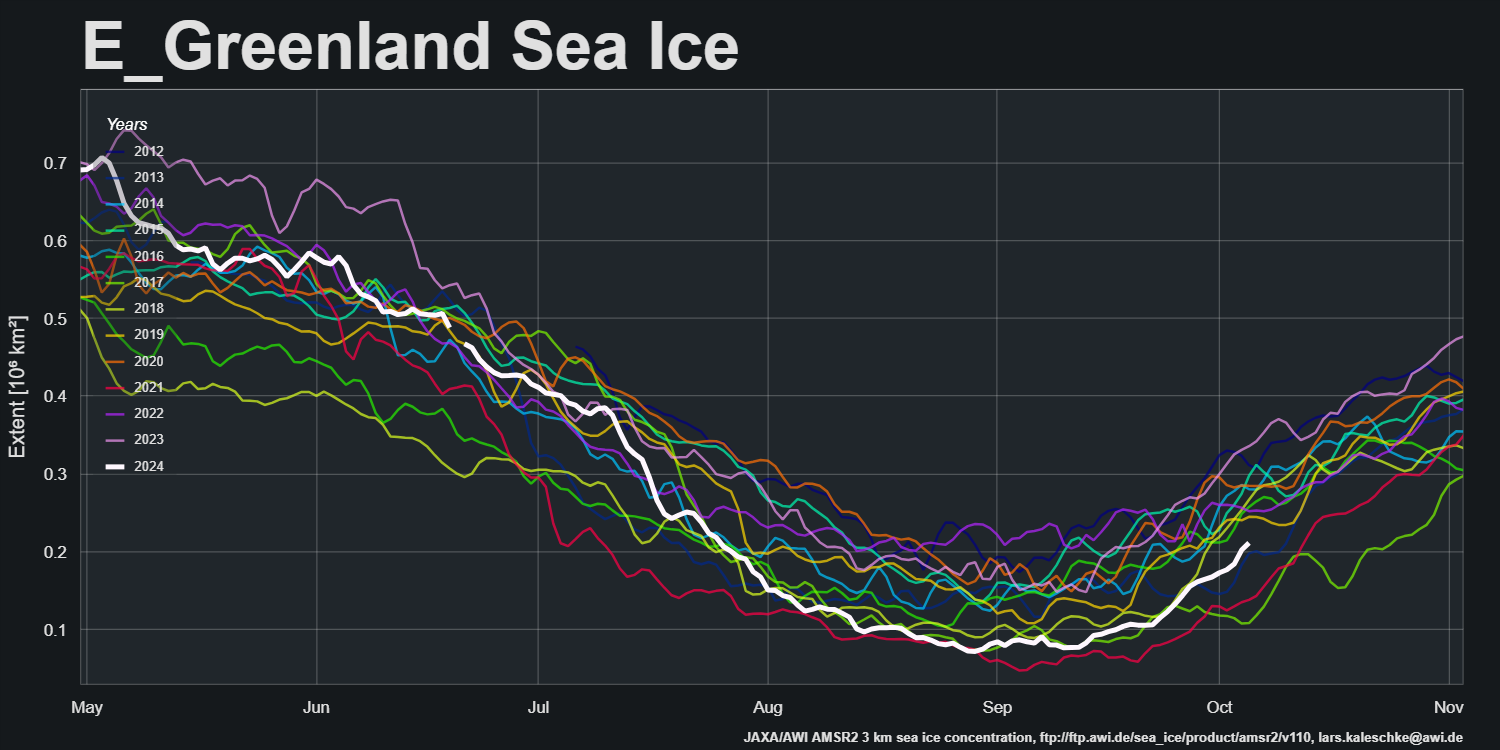
Note in particular the restart of export into the East Greenland Sea via the Fram Strait:
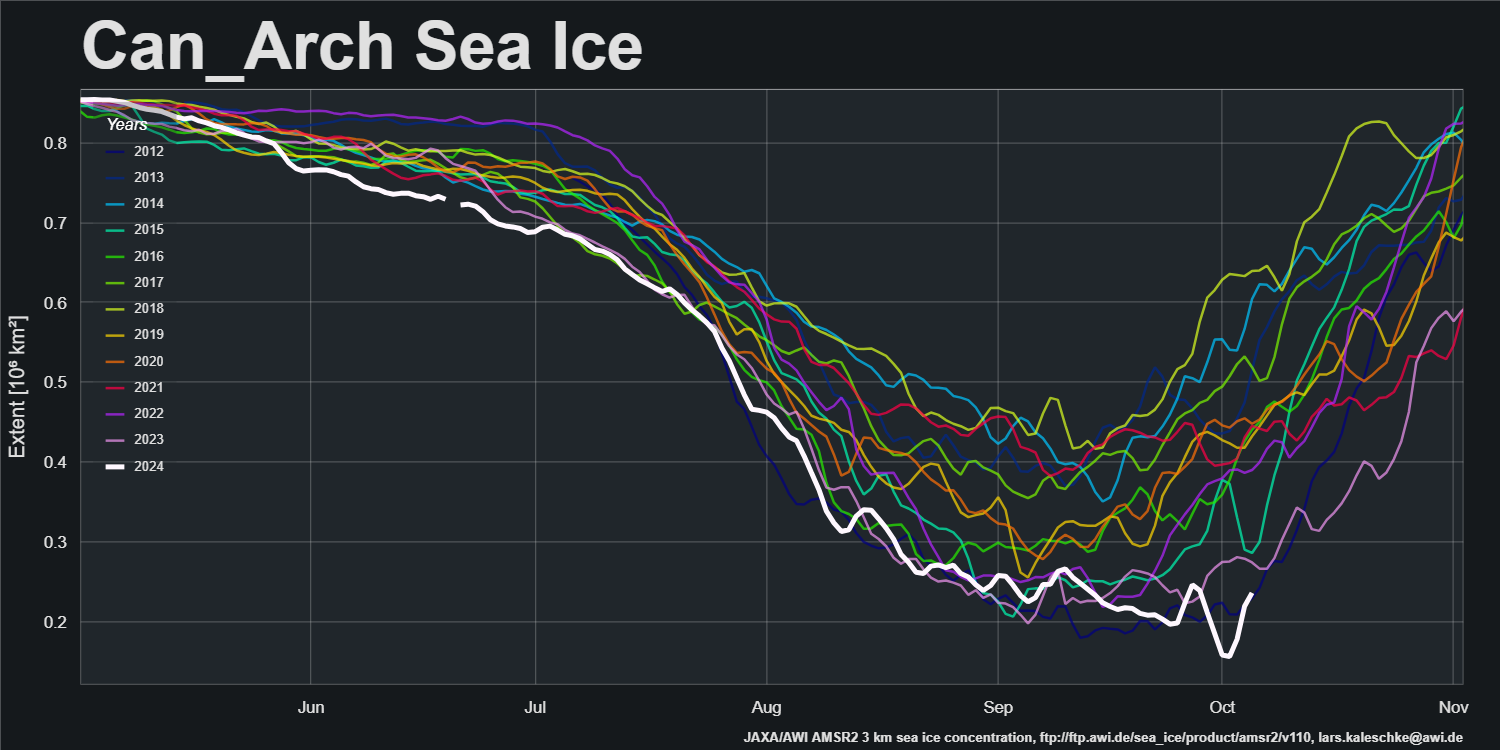
and the movement of ice within the Canadian Arctic Archipelago:
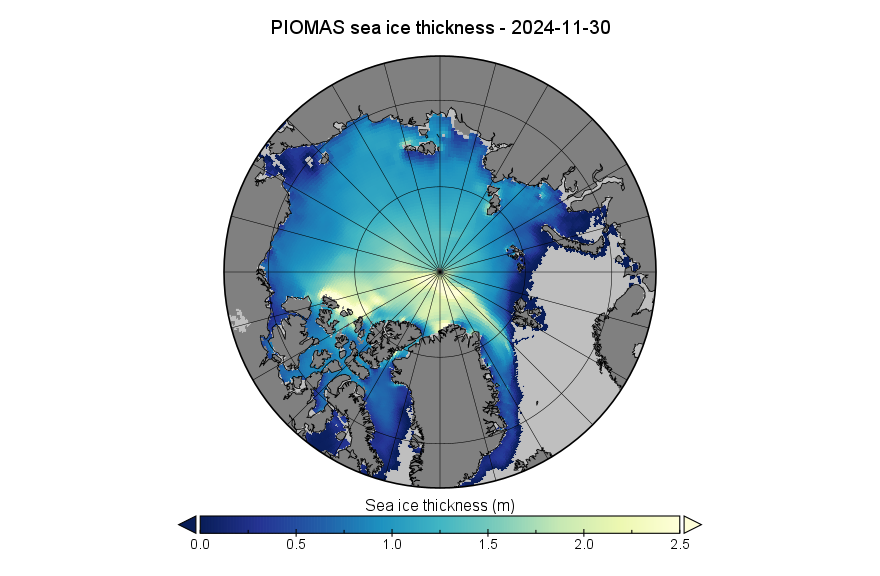
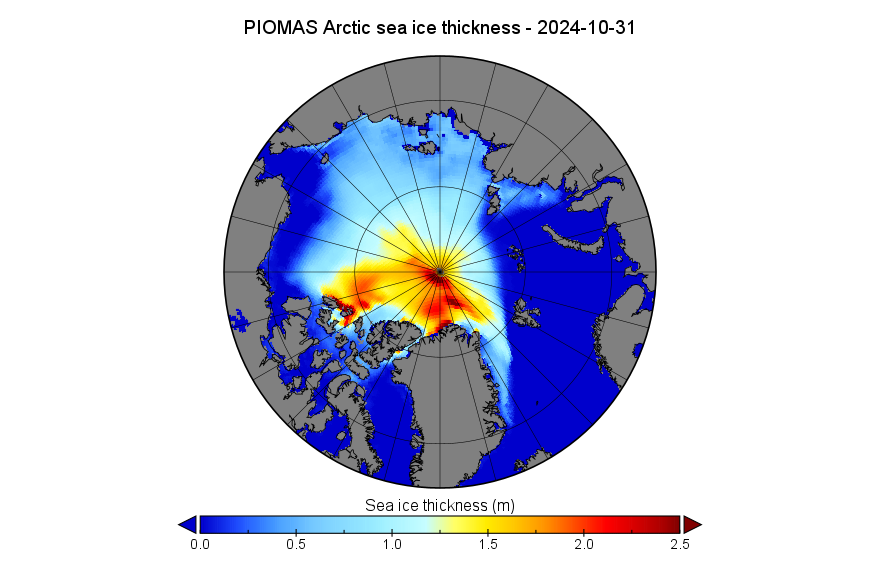
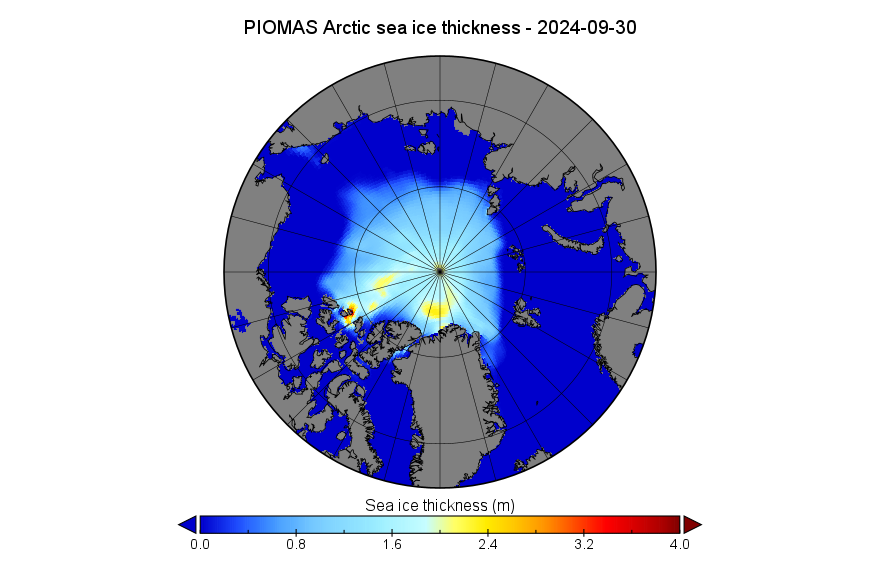
The PIOMAS gridded thickness data for September 2024 has been released:
Earlier today the National Snow and Ice Data Center announced that:
On September 11, Arctic sea ice likely reached its annual minimum extent of 4.28 million square kilometers (1.65 million square miles). The 2024 minimum is the seventh lowest in the nearly 46-year satellite record. The last 18 years, from 2007 to 2024, are the lowest 18 sea ice extents in the satellite record…
Note that this is a preliminary announcement. Changing winds or late-season melt could still reduce the Arctic ice extent, as happened in 2005 and 2010. NSIDC scientists will release a full analysis of the Arctic melt season, and discuss the Antarctic winter sea ice growth, in early October.
Consequently several of the usual cryodenialospheric suspects have been frantically spinning their webs of deceit around the announcement.
First up was Javier Vinós, who beat the NSIDC’s starting gun by firing a broadside on X (formerly Twitter) on Sunday. If you’re unfamiliar with the name, Javier frequently pontificates about Arctic sea ice, amongst other things, on Judith Curry’s “Climate Etc.” blog. He confidently announced that:
Arctic sea ice reaches its annual minimum with an extent greater than in 2007, 2012, 2016, 2019, 2020 and 2023.
The two warmest years in a row at > +1.5°C have ZERO IMPACT on the 17-year resilience of Arctic sea ice.
Needless to say, “Snow White” felt compelled to quibble:
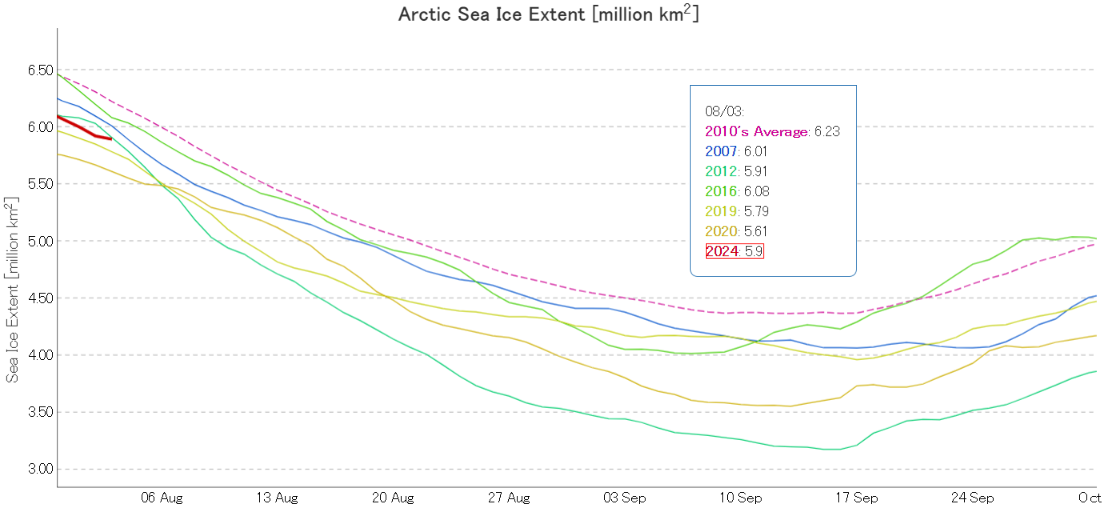
At the beginning of August JAXA/ViSHOP extent is 3rd lowest for the date in the satellite era:
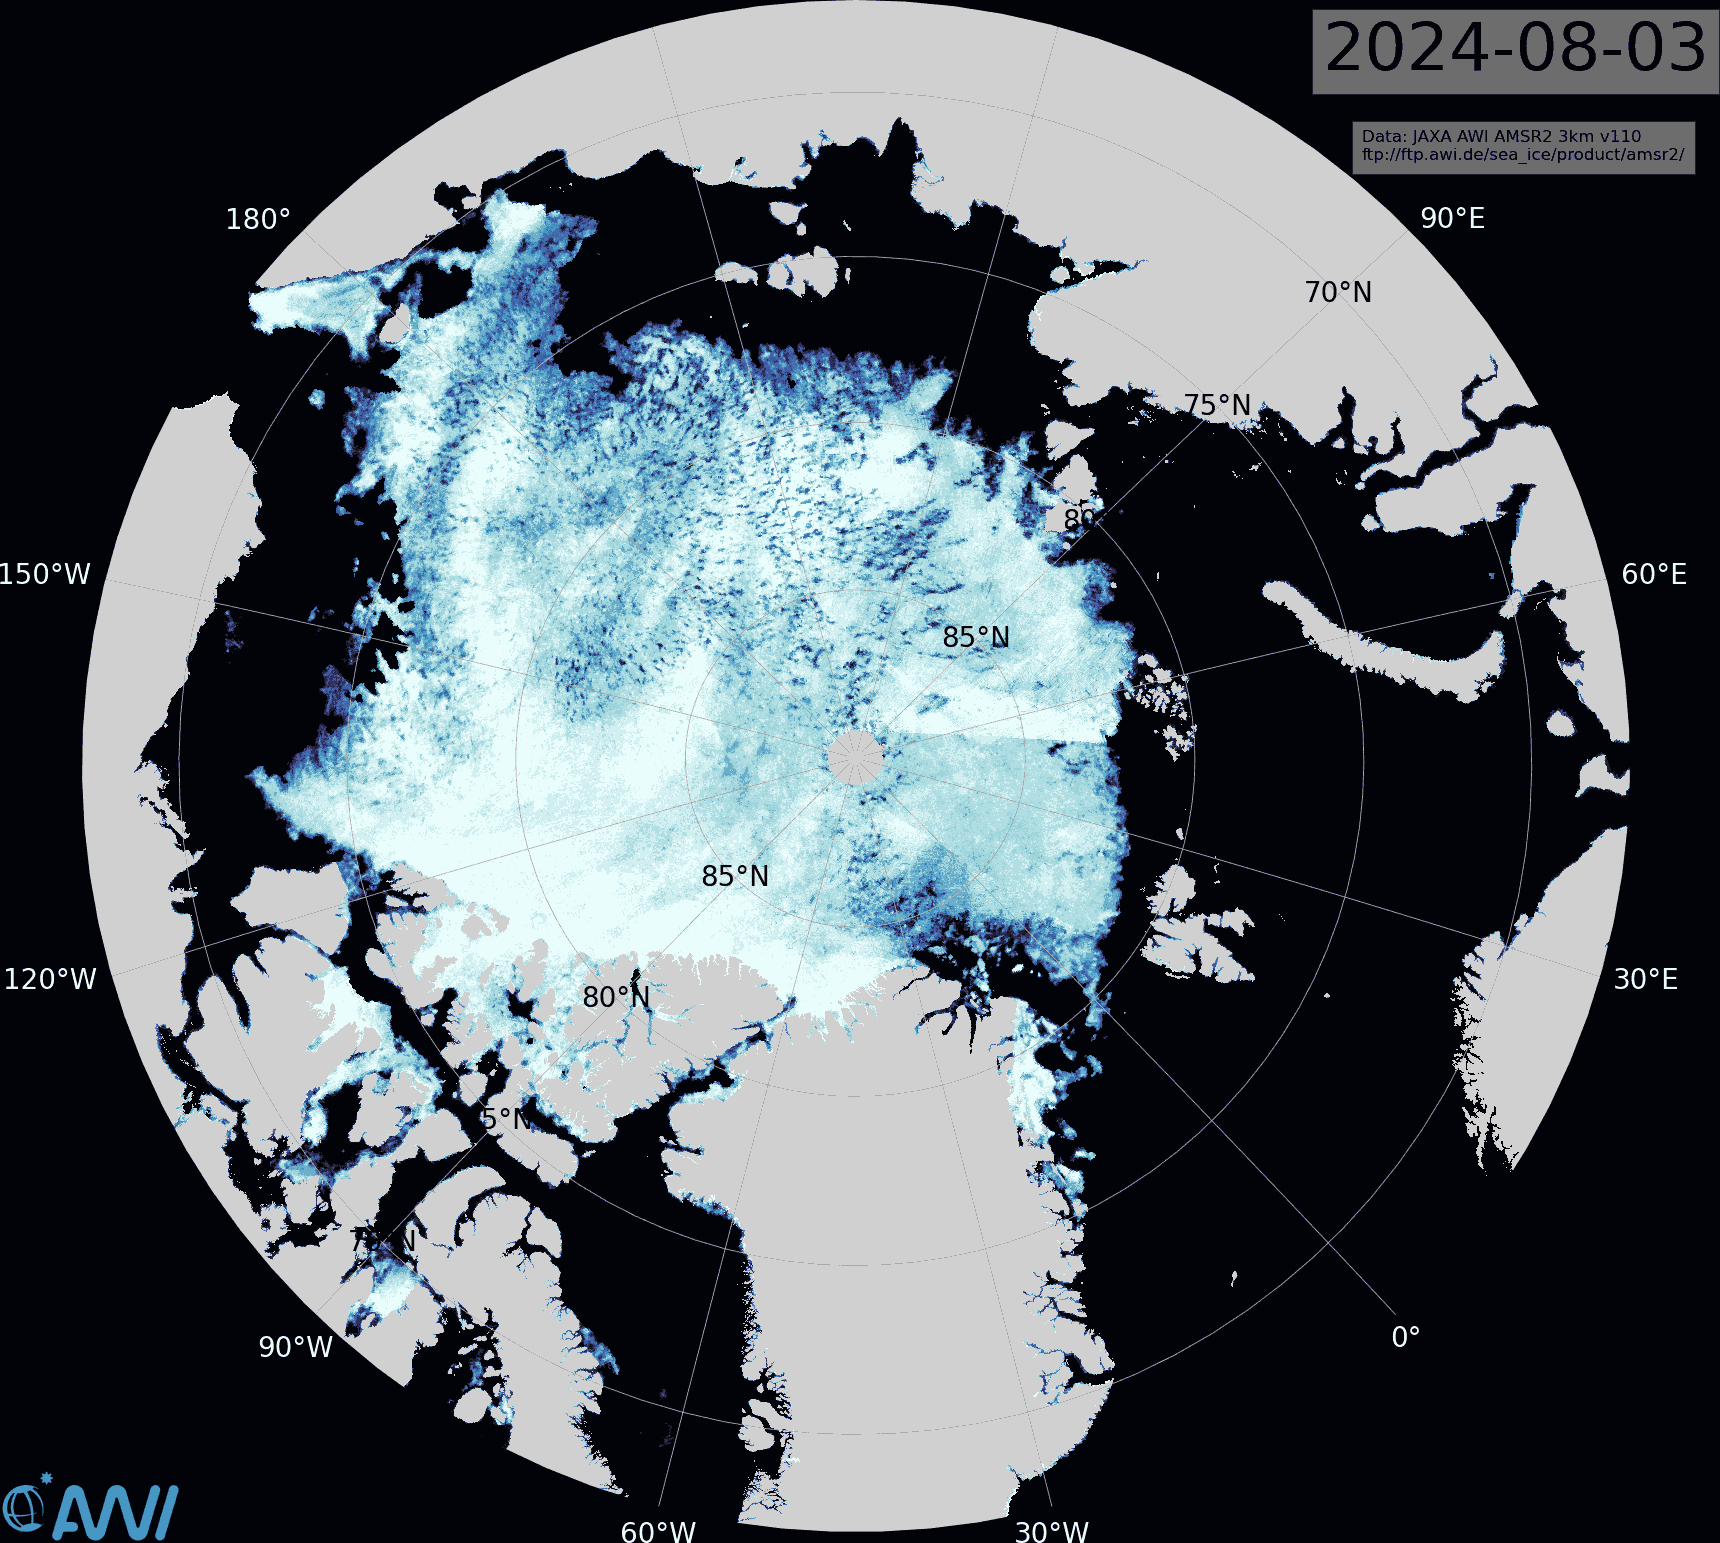
In 2012 extent had just started its unprecedented plunge towards the record September minimum, and 2024 seems certain to cross above the 2012 curve shortly. However, the latest AMSR2 sea ice concentration map from the Alfred Wegener Institute reveals areas of open water across the majority of the Central Arctic Basin:
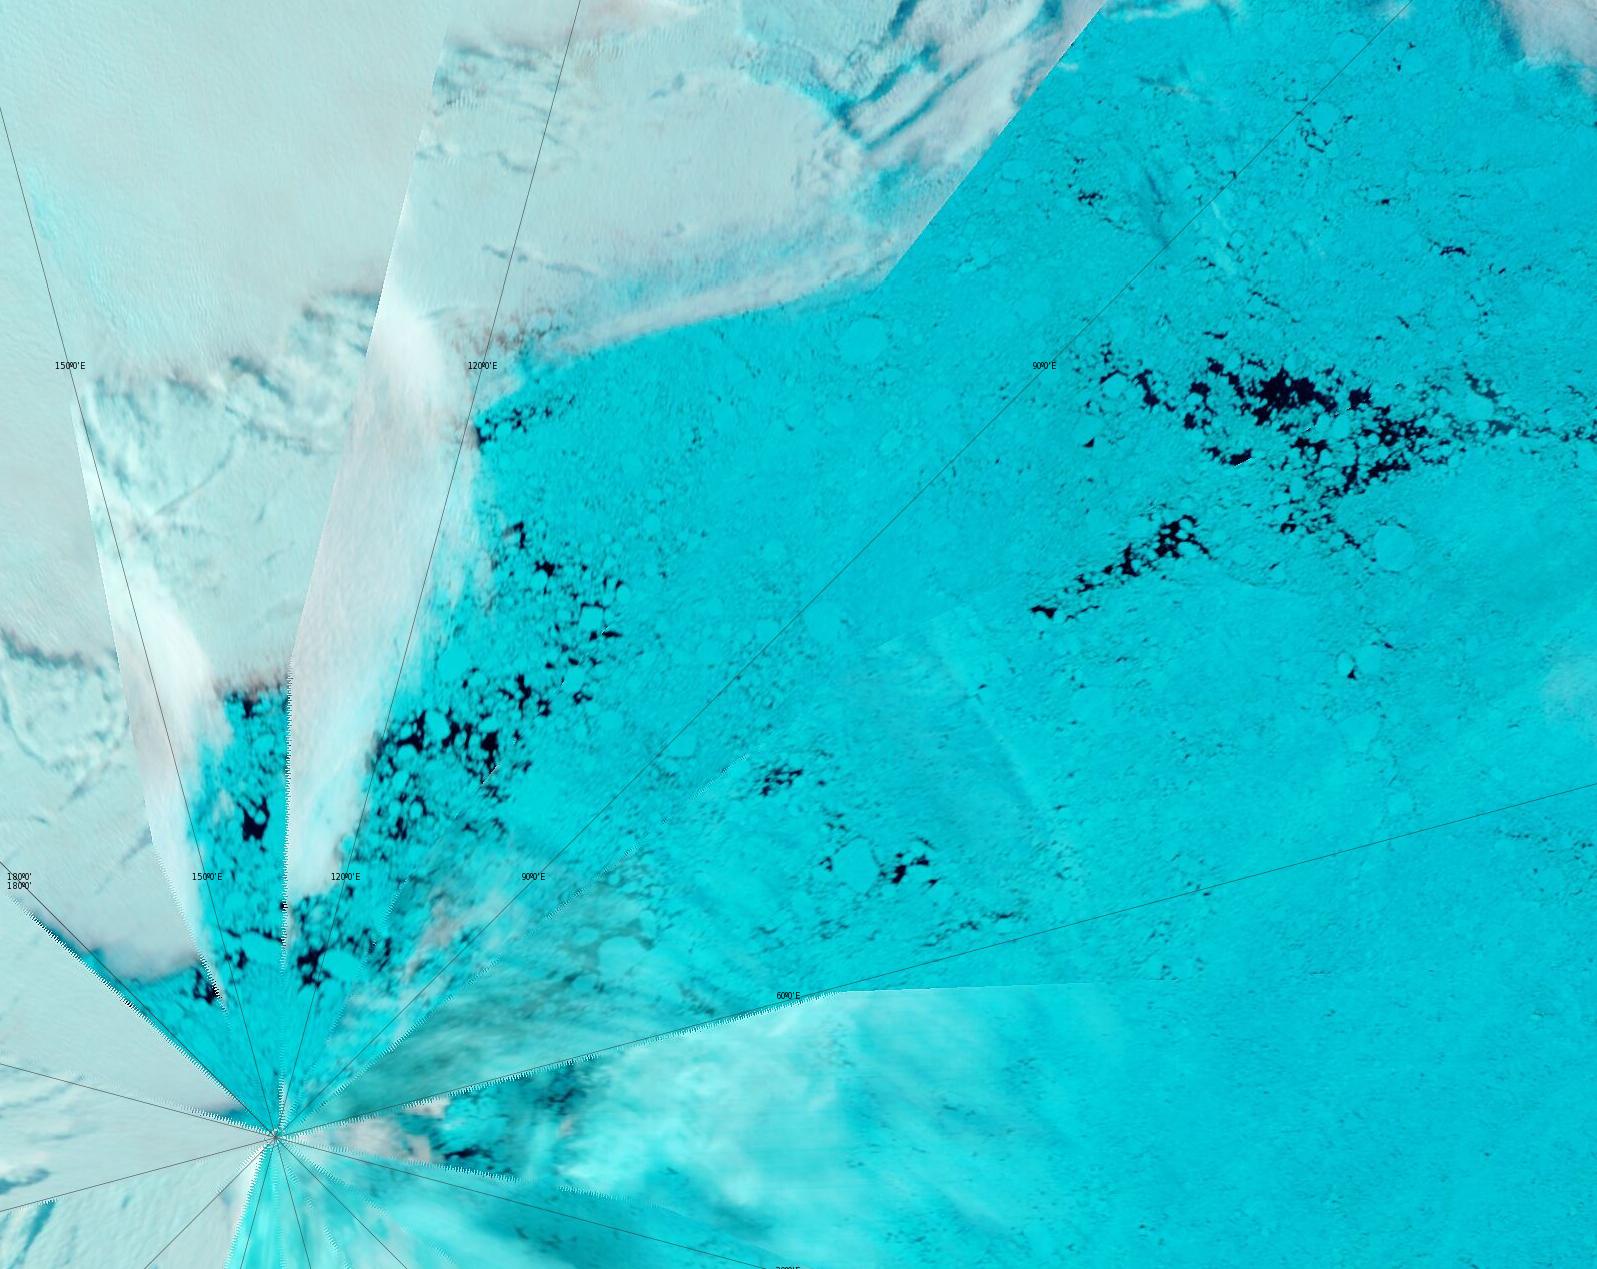
In particular the sea ice between the North Pole and northern Greenland is remarkably fragmented:
“False colour” image of the North Pole on August 3rd from the MODIS instrument on the Terra satellite
This website uses cookies to improve your experience. We'll assume you're ok with this, but you can opt-out if you wish. Cookie settingsACCEPT
Privacy & Cookies Policy
Privacy Overview
This website uses cookies to improve your experience while you navigate through the website. Out of these, the cookies that are categorized as necessary are stored on your browser as they are essential for the working of basic functionalities of the website. We also use third-party cookies that help us analyze and understand how you use this website. These cookies will be stored in your browser only with your consent. You also have the option to opt-out of these cookies. But opting out of some of these cookies may affect your browsing experience.
Necessary cookies are absolutely essential for the website to function properly. This category only includes cookies that ensures basic functionalities and security features of the website. These cookies do not store any personal information.
Any cookies that may not be particularly necessary for the website to function and is used specifically to collect user personal data via analytics, ads, other embedded contents are termed as non-necessary cookies. It is mandatory to procure user consent prior to running these cookies on your website.