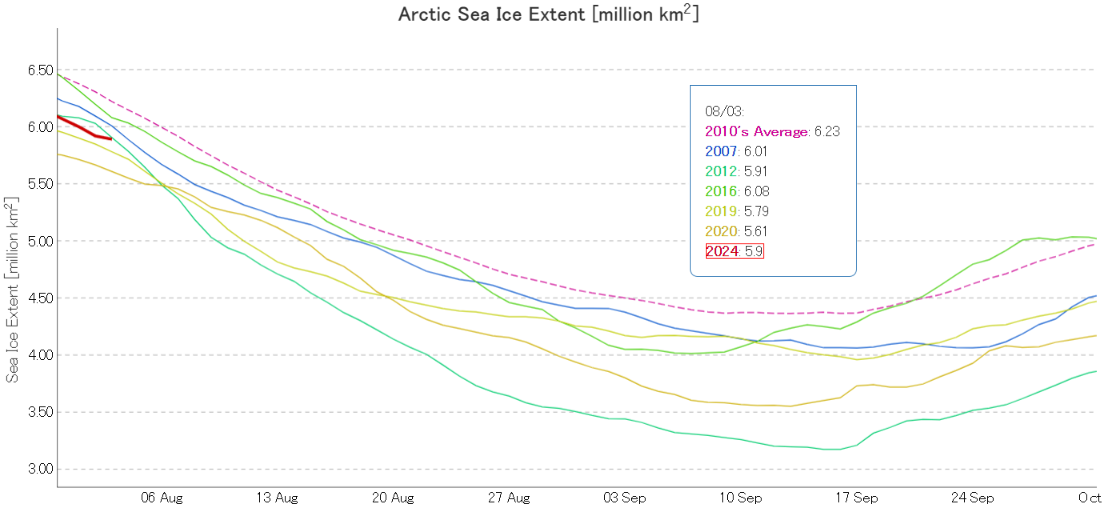
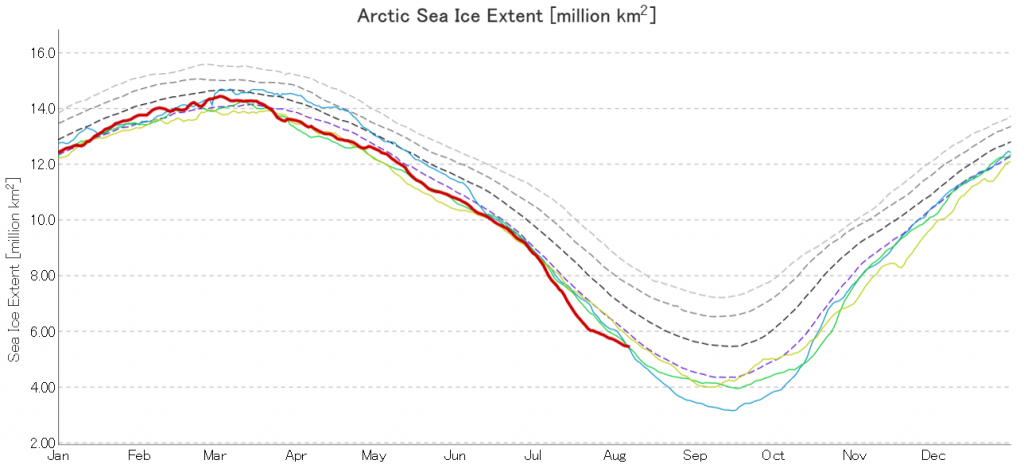
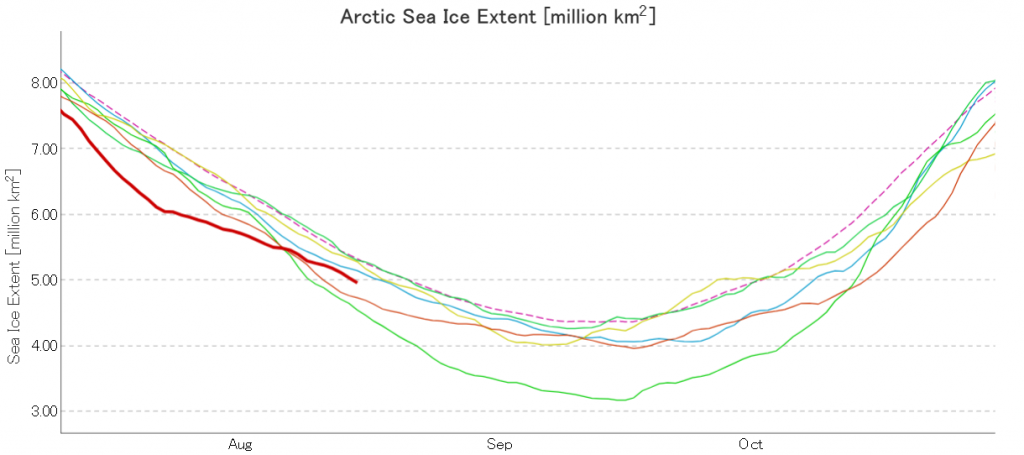
At the beginning of August JAXA/ViSHOP extent is 3rd lowest for the date in the satellite era:
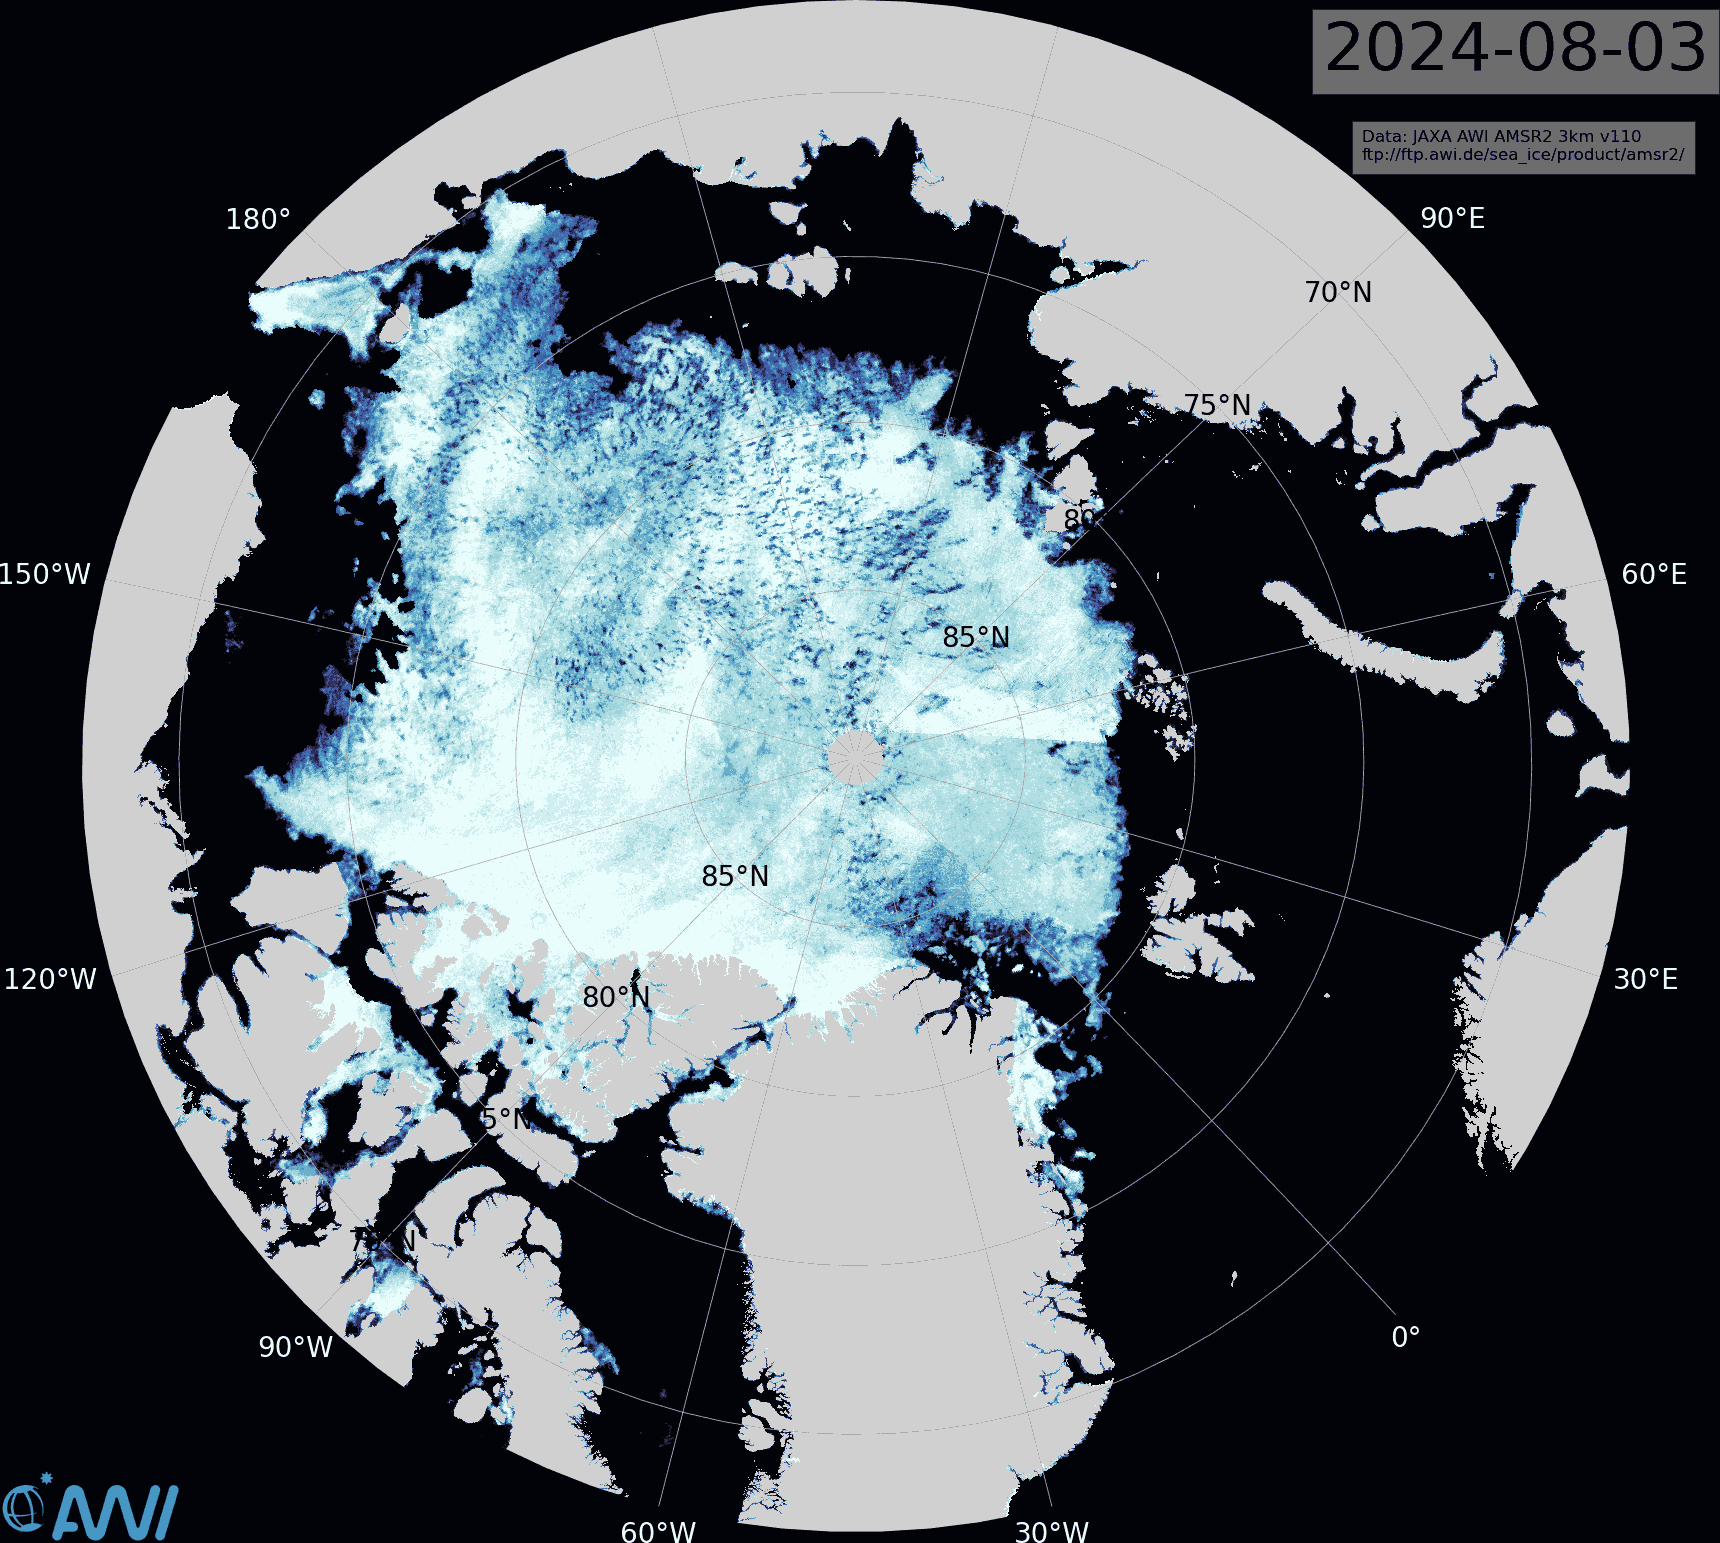
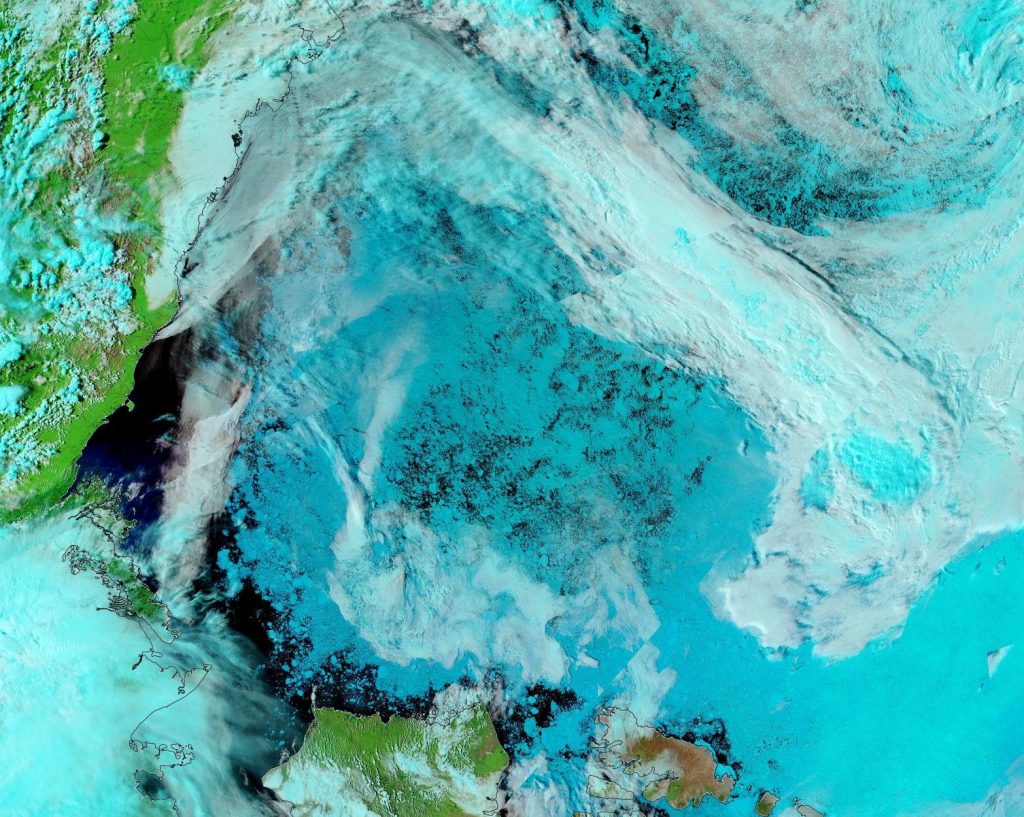
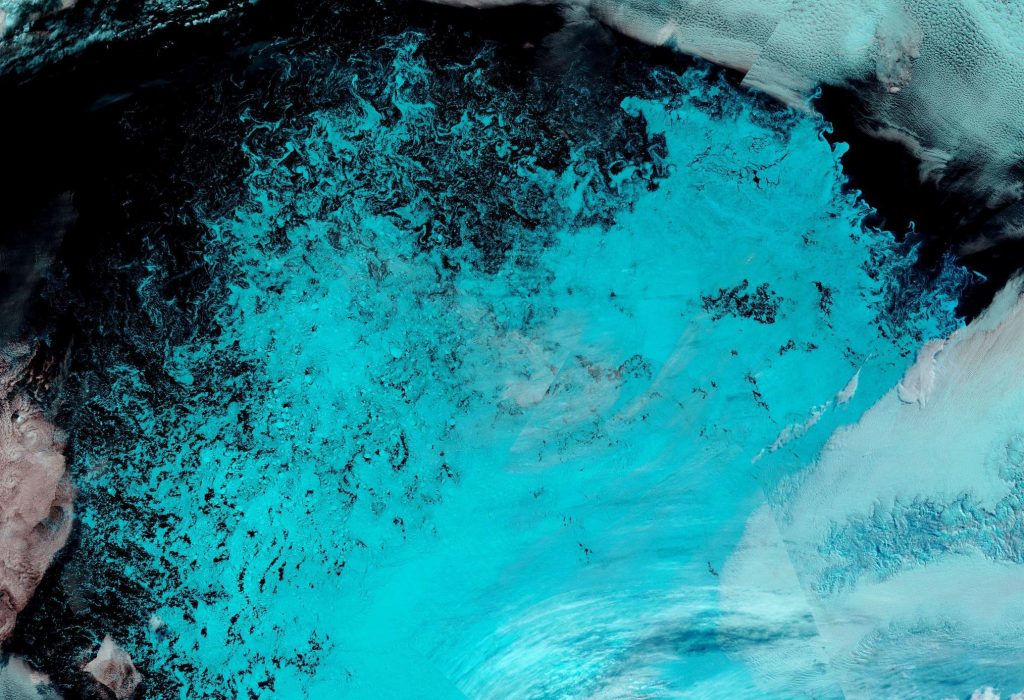
In 2012 extent had just started its unprecedented plunge towards the record September minimum, and 2024 seems certain to cross above the 2012 curve shortly. However, the latest AMSR2 sea ice concentration map from the Alfred Wegener Institute reveals areas of open water across the majority of the Central Arctic Basin:
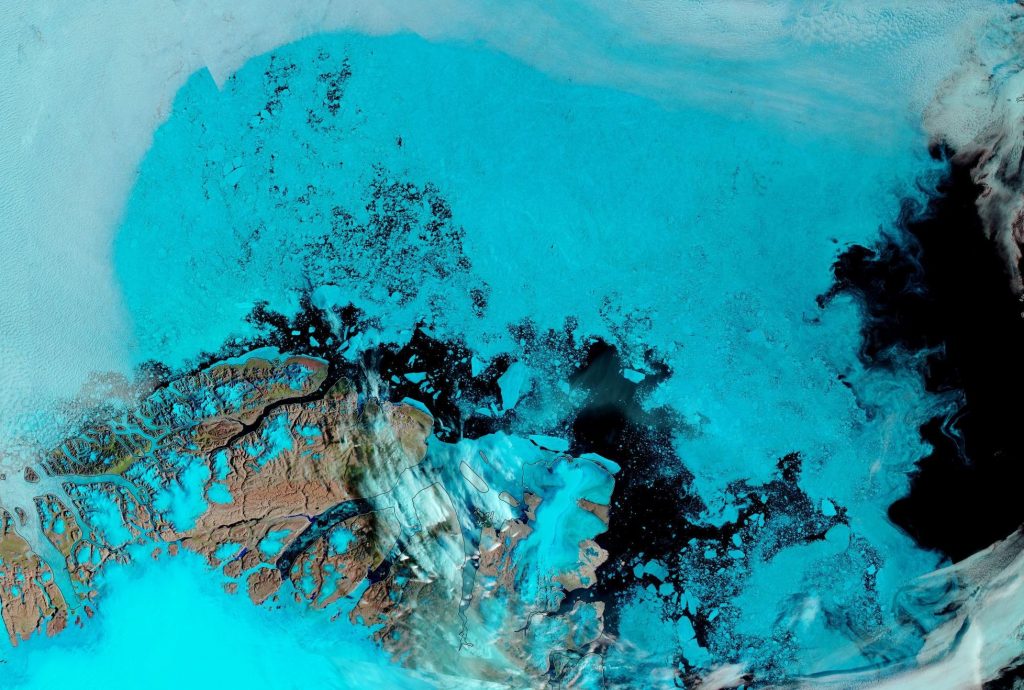
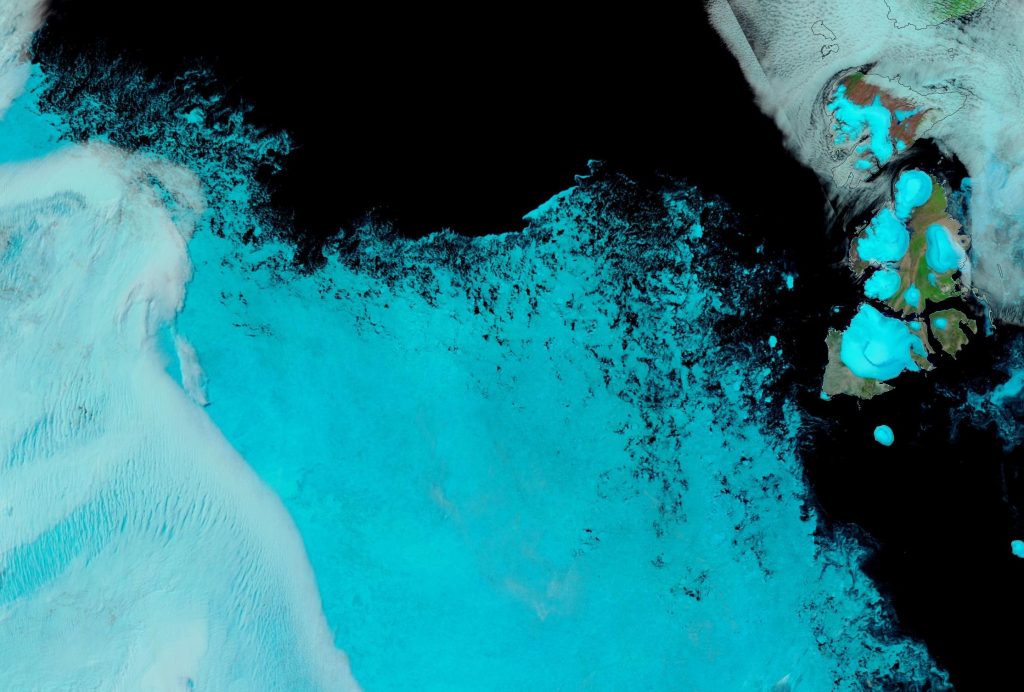
In particular the sea ice between the North Pole and northern Greenland is remarkably fragmented:
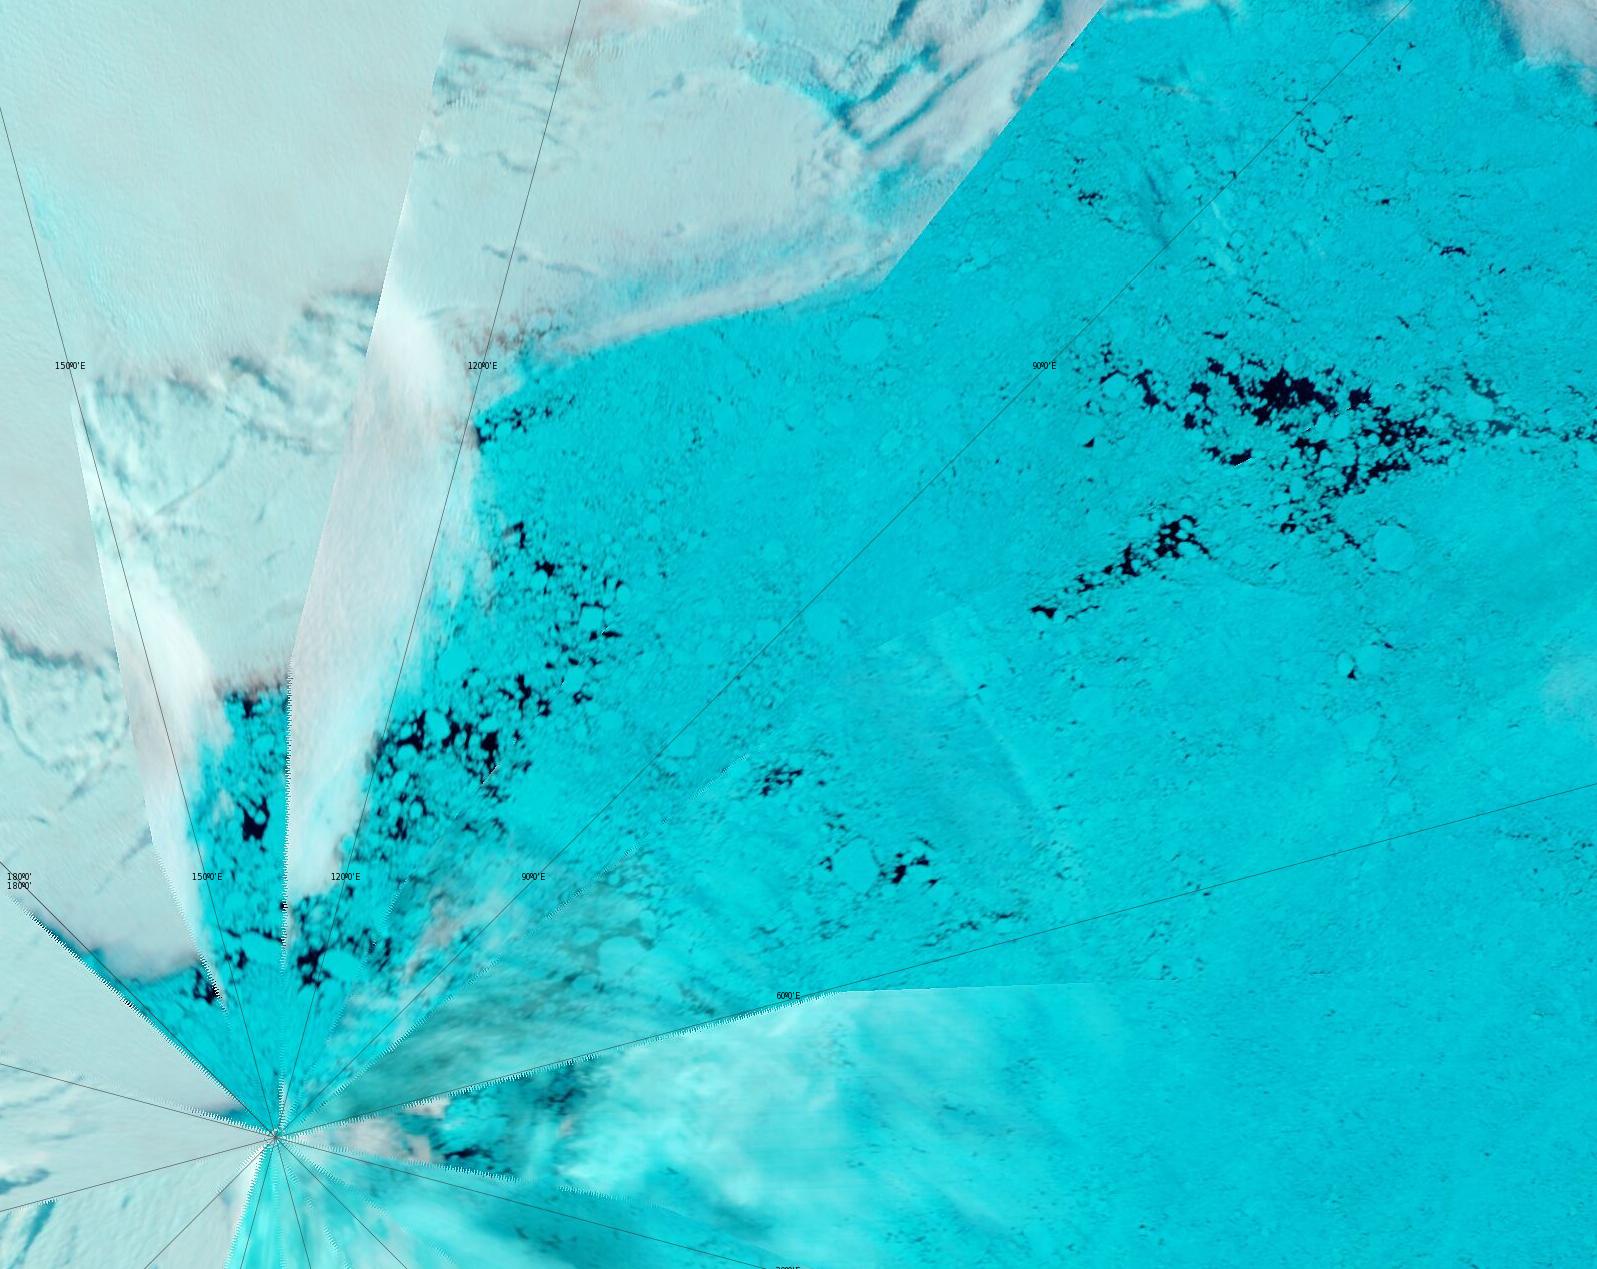
“False colour” image of the North Pole on August 3rd from the MODIS instrument on the Terra satellite
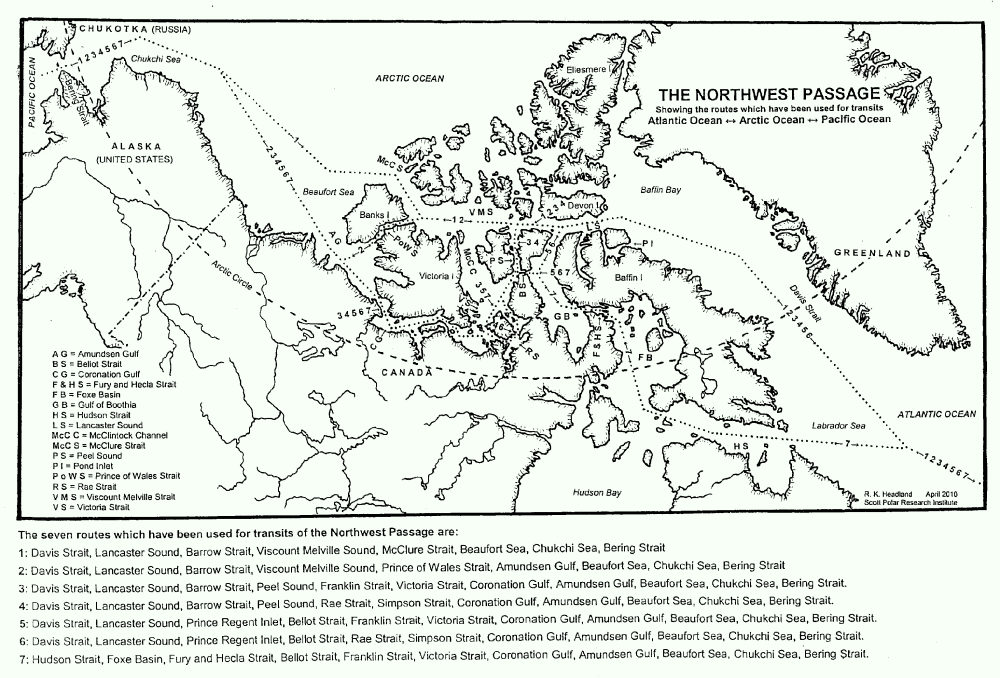
Some “pleasure craft” are currently heading up the west coast of Greenland en route to the Bering Strait via Lancaster Sound and one of the assorted routes through the Canadian Arctic Archipelago. For those of you unfamiliar with the geography of the Northwest Passage, here are couple of hopefully helpful maps:
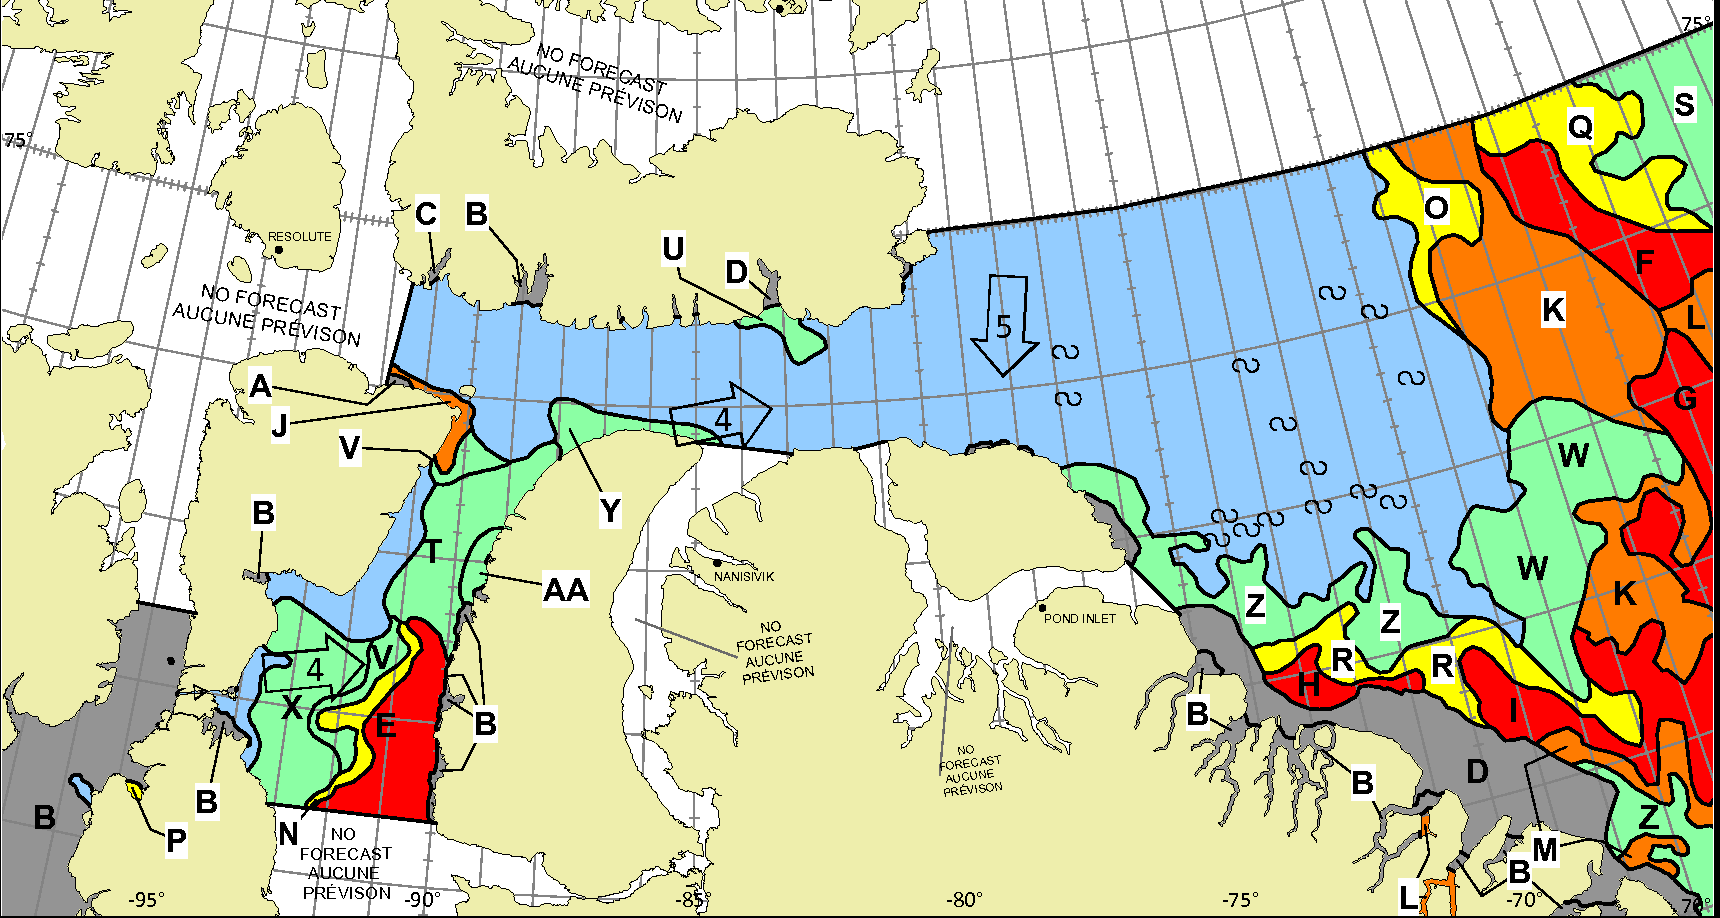
Whilst there is still ice blocking the route across Baffin Bay from Greenland, the Canadian Ice Service has already started daily coverage of the heart of the southern route through the Northwest Passage. There’s plenty of open water in Lancaster Sound and low concentration sea ice in Prince Regent Inlet:
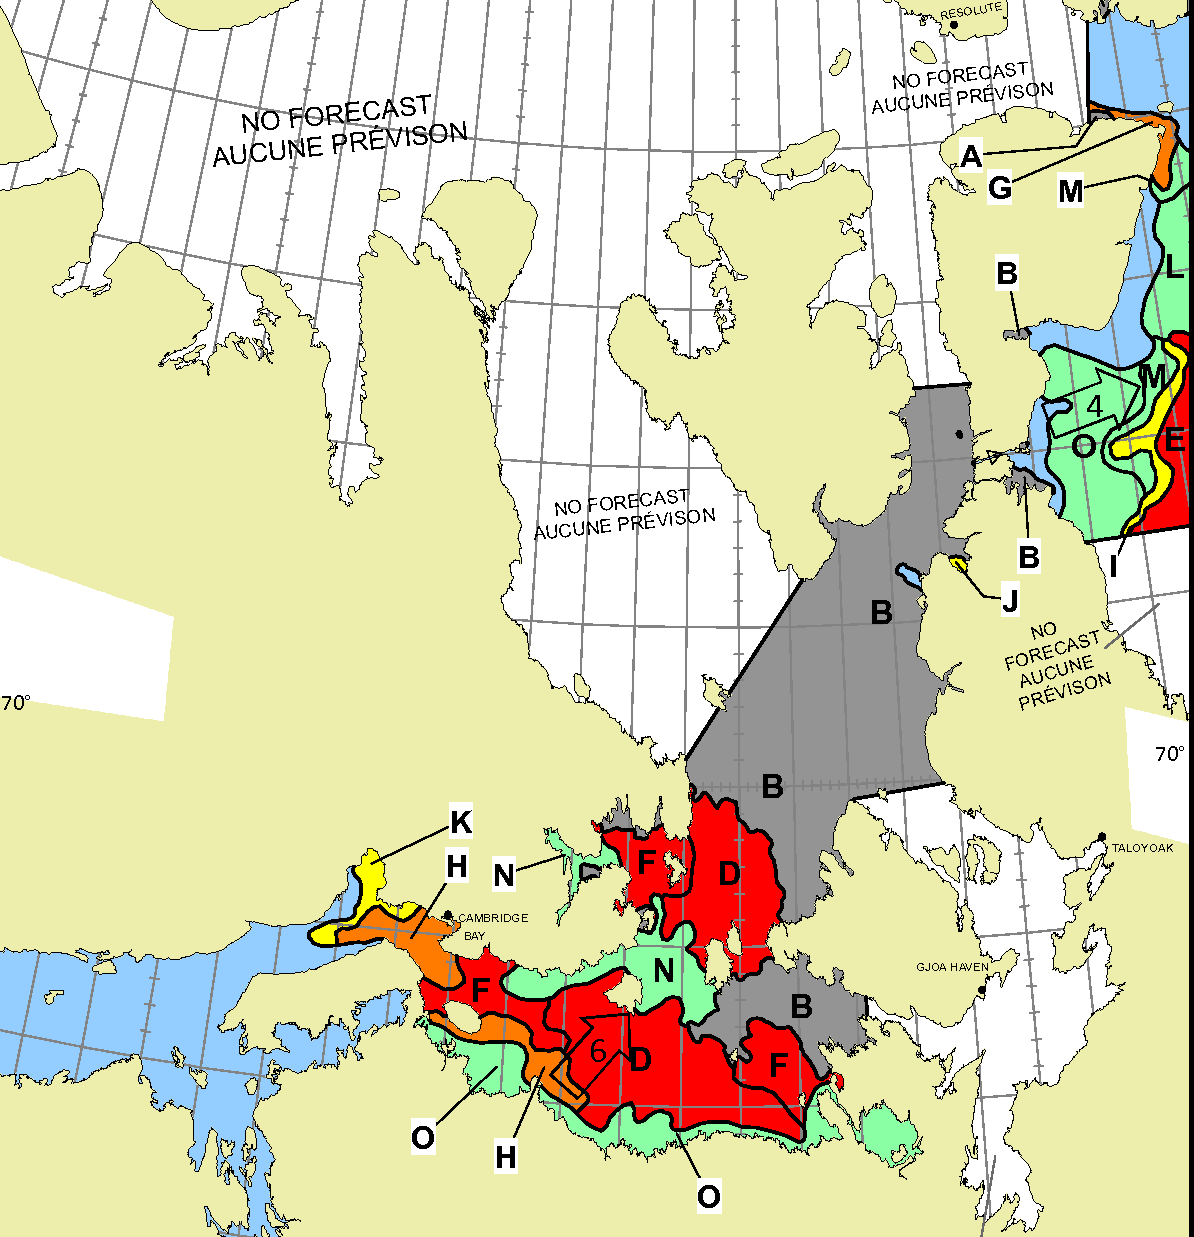
Further south there is also open water in the Coronation Gulf, but the fast ice between Peel Sound and King William Island has not yet started breaking up:
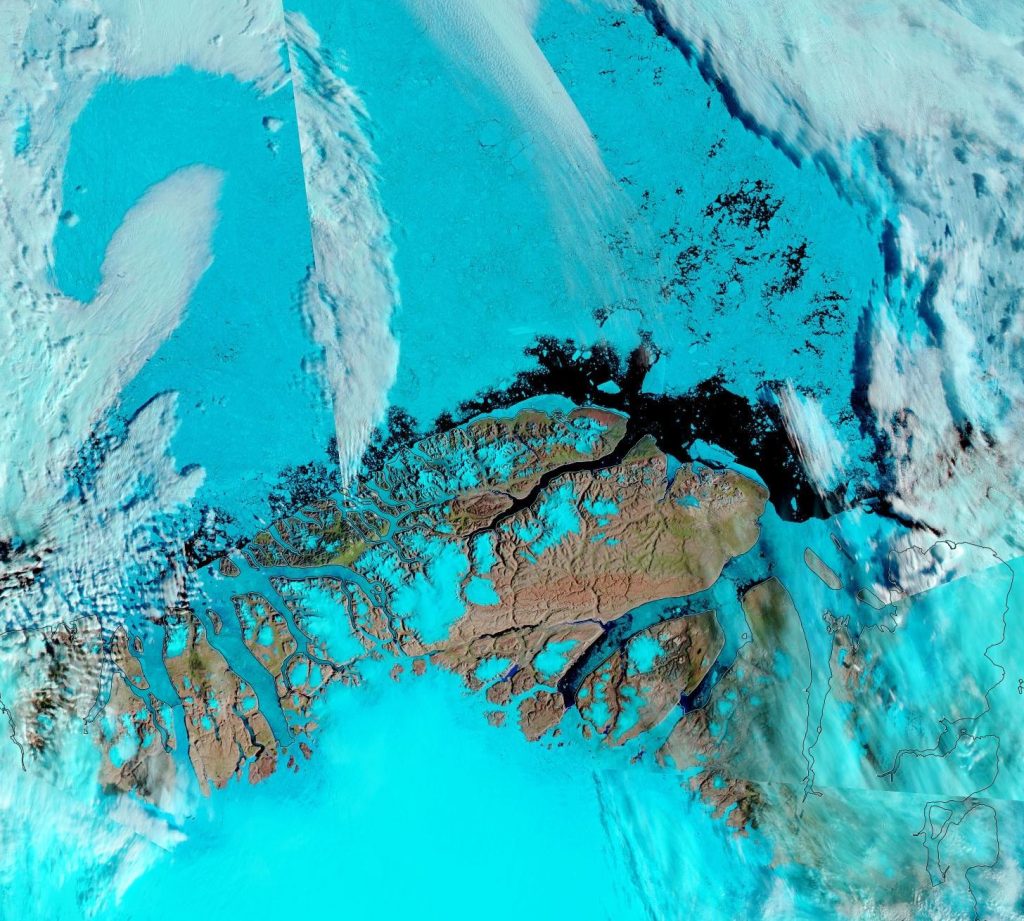
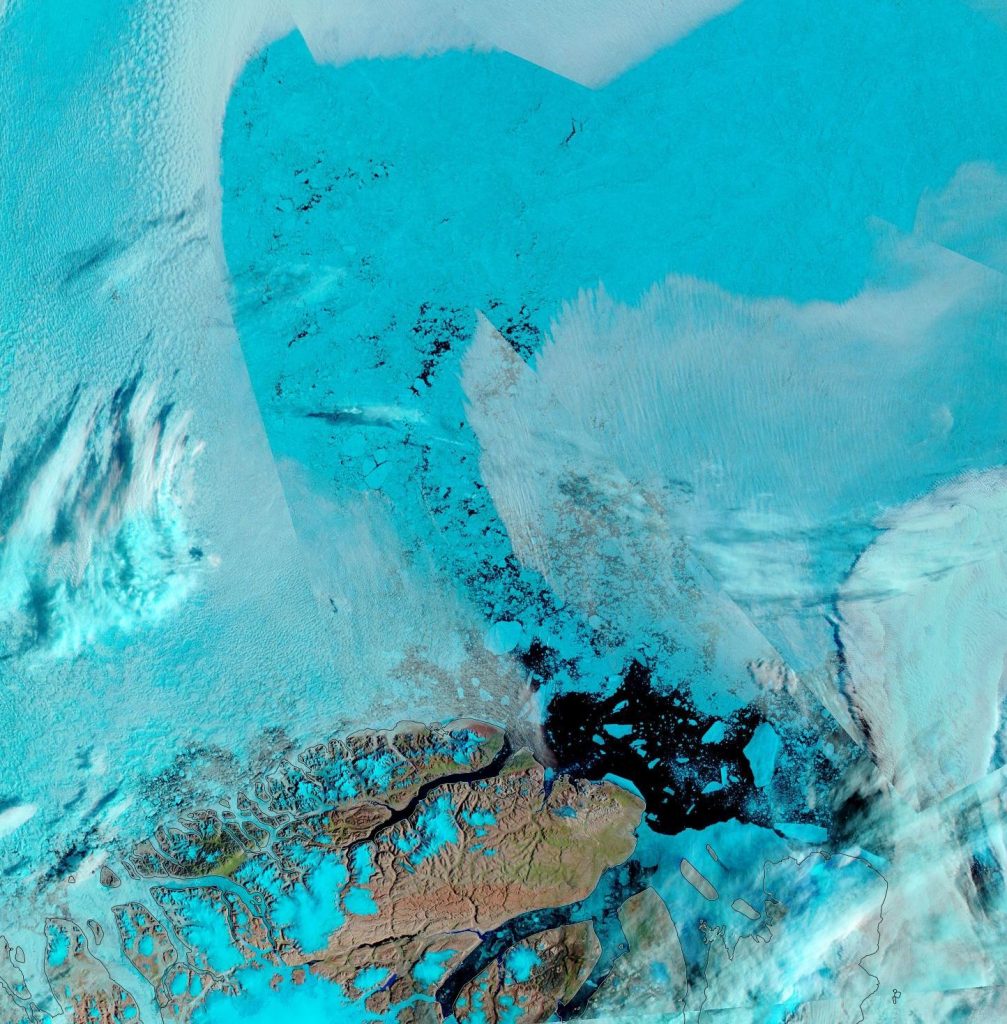
This slightly cloudy satellite image of the Canadian Arctic Archipelago also shows that the exit of the northern route via McClure Strait into the Beaufort Sea is already navigable:
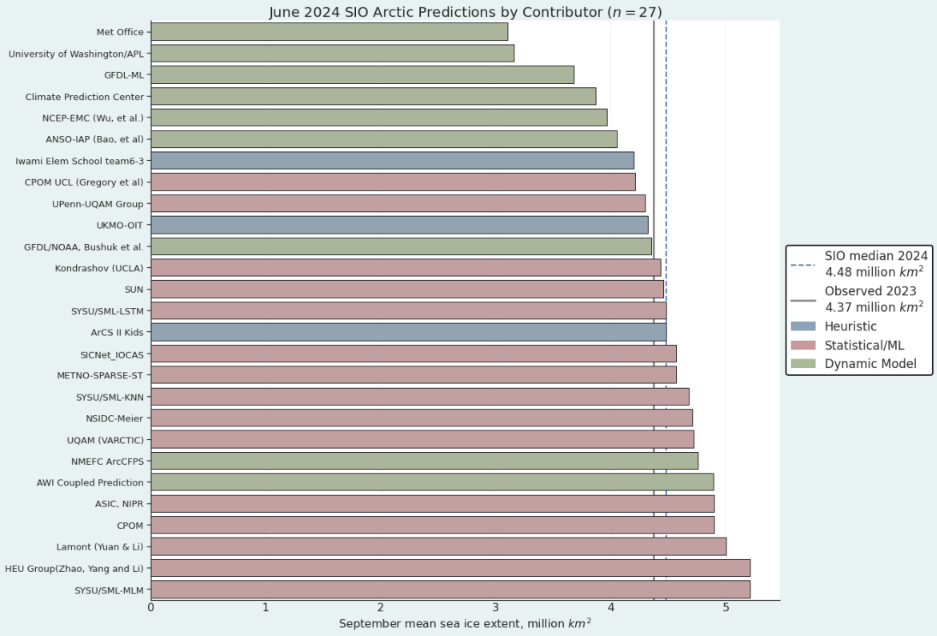
The first sea ice outlook report for 2024 has been published by the Sea Ice Prediction Network:
This year’s median forecasted value for pan-Arctic September sea-ice extent is 4.48 million square kilometers with an interquartile range of 4.21 to 4.74 million square kilometers. This is slightly lower than the 2022 (4.57 million square kilometers) and 2023 (4.54 million square kilometers) June median forecasts for September.
The lowest sea-ice extent forecast is 3.1 million square kilometers, from the UK Met Office, which would be a new record low for the satellite period (1979-present); the highest sea-ice extent forecast is 5.21 million square kilometers, submitted by both the HEU Group and SYSU/SML-MLM, which would be the highest September extent since 2015:
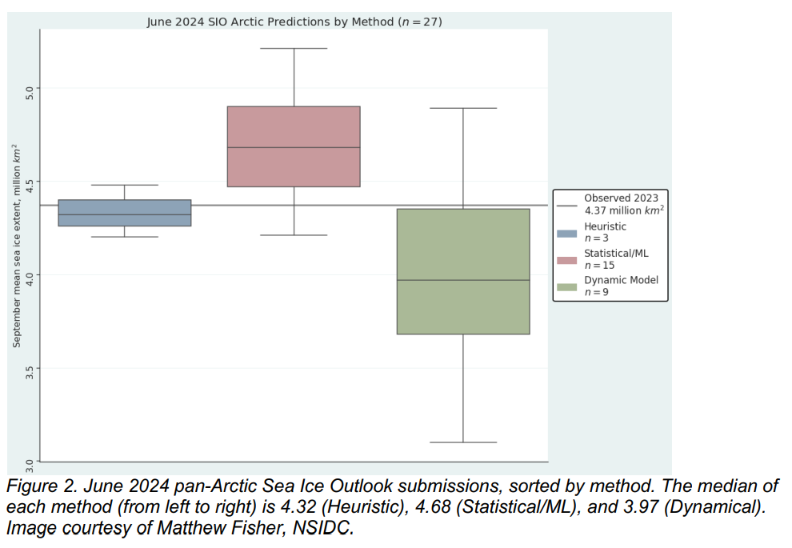
There are three heuristic Outlooks, with a median of 4.32 million square kilometers and an interquartile range of 4.26 to 4.4 million square kilometers. Statistical submissions total fifteen Outlooks with a median of 4.68 million square kilometers and an interquartile range of 4.47 to 4.9 million square kilometers. There are nine dynamical model contributions. The dynamical models have a median forecast of 3.97 million square kilometers with an interquartile range of 3.68 to 4.35 million square kilometers.
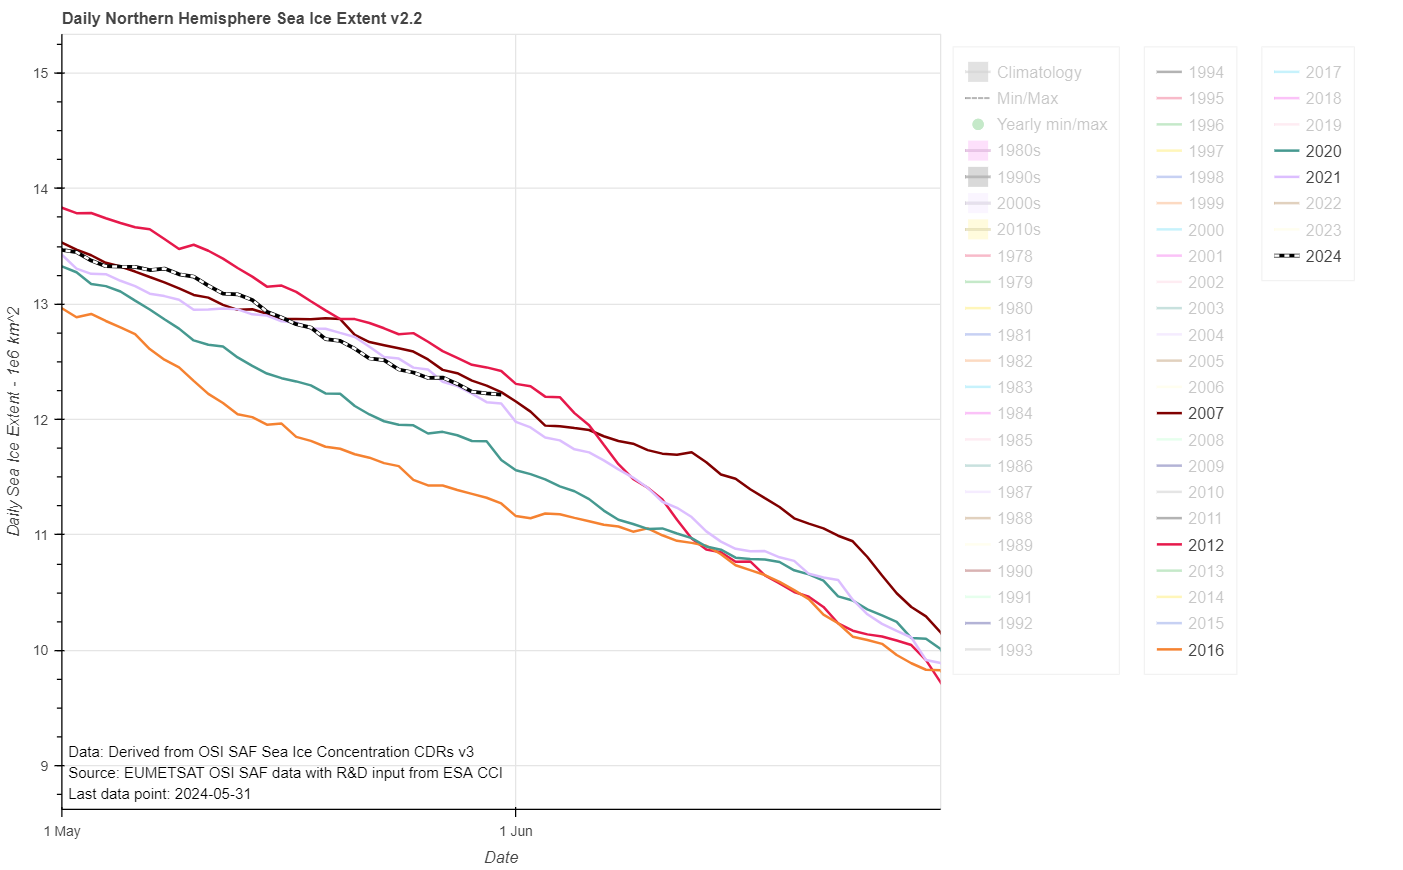
The JAXA/ViSHOP web site is currently down, so here is the current OSI SAF extent graph for the end of May:
2012’s “June cliff” is almost upon us, and if 2024’s current trajectory continues extent will cross above 2012 for the first time since February in a week or so.
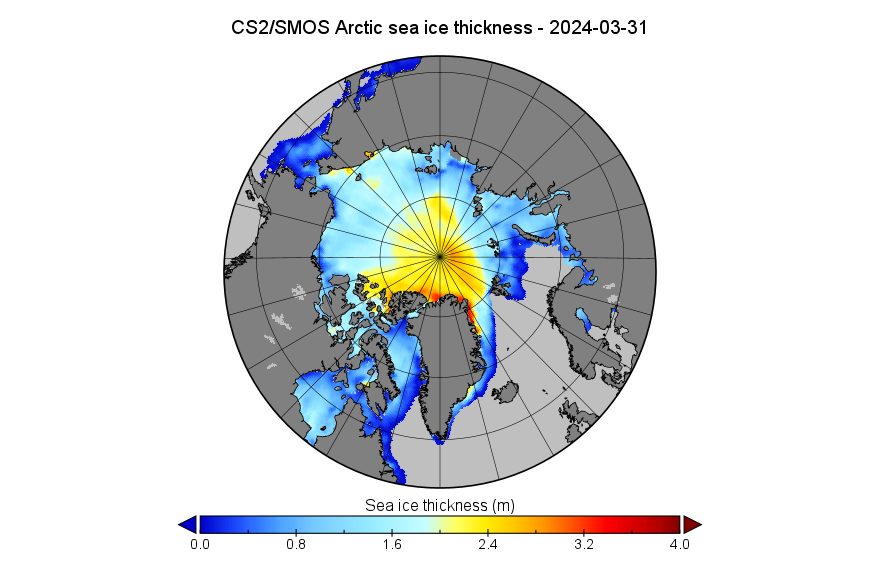
Starting this month with a look at assorted volume/thickness data, here is the CryoSat-2/SMOS merged Arctic sea ice thickness map for March 31st:
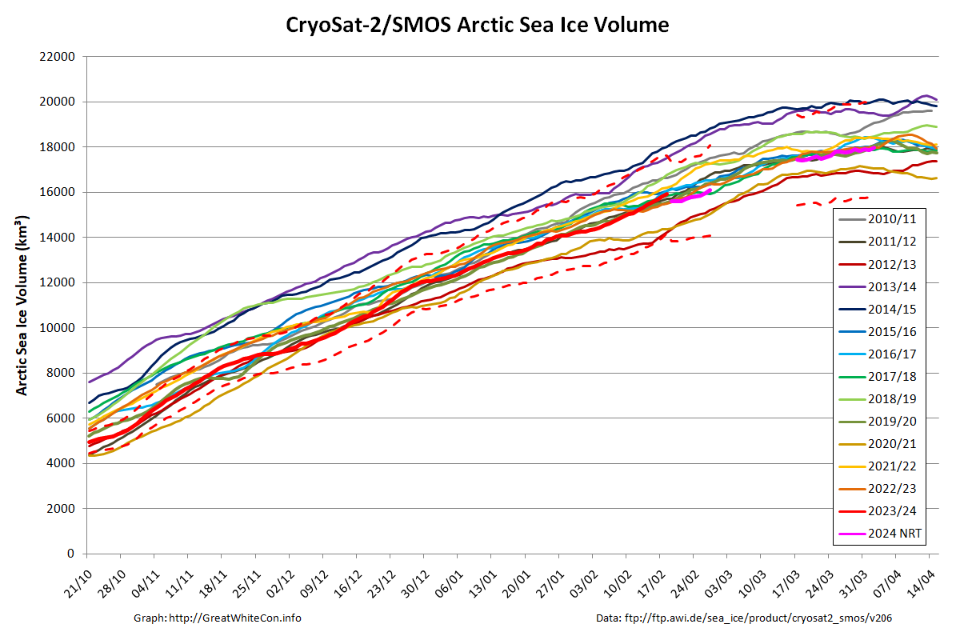
Plus the associated volume graph, which still suffers from a gap in the near real time data due to the problem with the SMOS satellite during the first half of March:
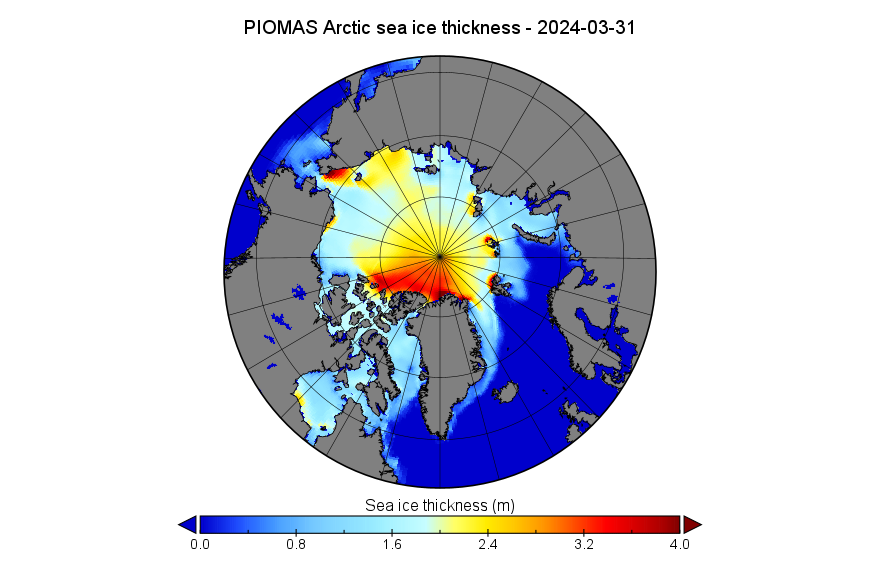
The PIOMAS gridded thickness data for March 2024 is also available. Here’s the end of month thickness map:
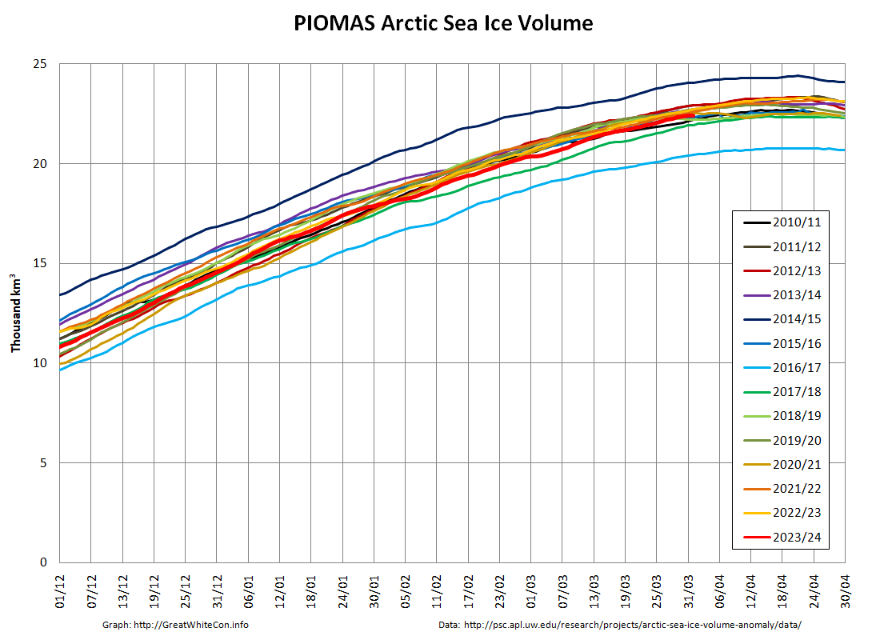
Plus the calculated volume graph:
Especially for Peter, here too is the DMI’s chart of monthly Arctic sea ice volume for March:
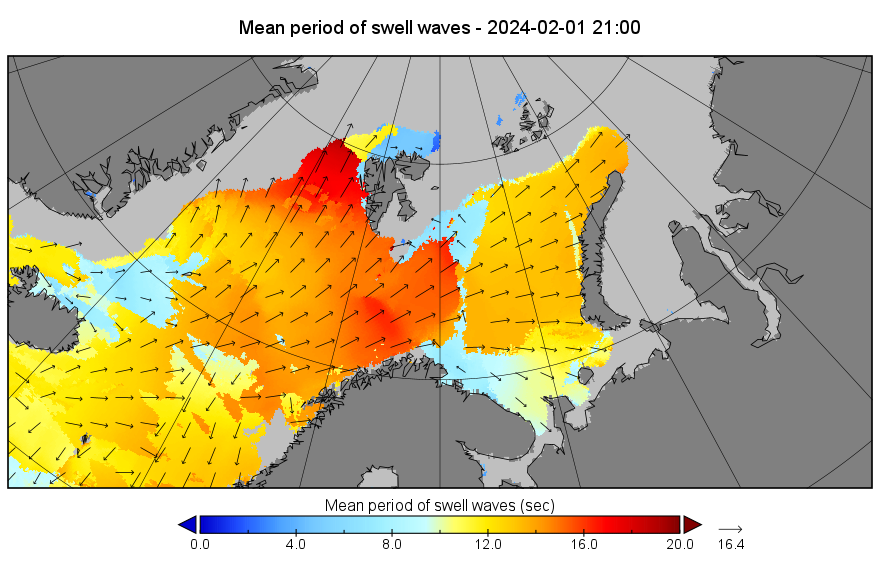
A change is perhaps even better than a rest? Let’s start February with a reminder that following close behind another recent Arctic cyclone, Storm Ingunn caused red weather warnings for high winds and avalanches in Norway two days ago:
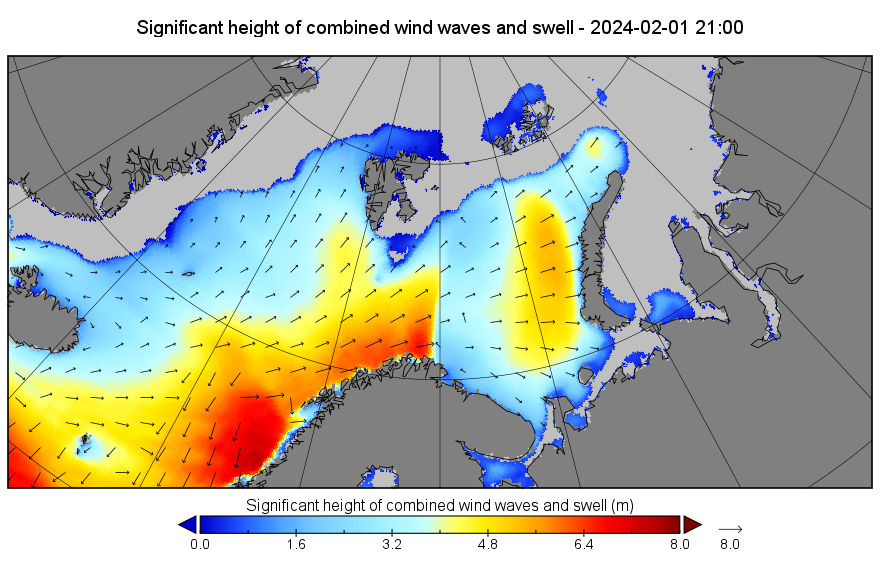
By yesterday evening another long period, storm driven swell was arriving at the sea ice edge in the Fram Strait, and to a lesser extent in the Barents Sea:
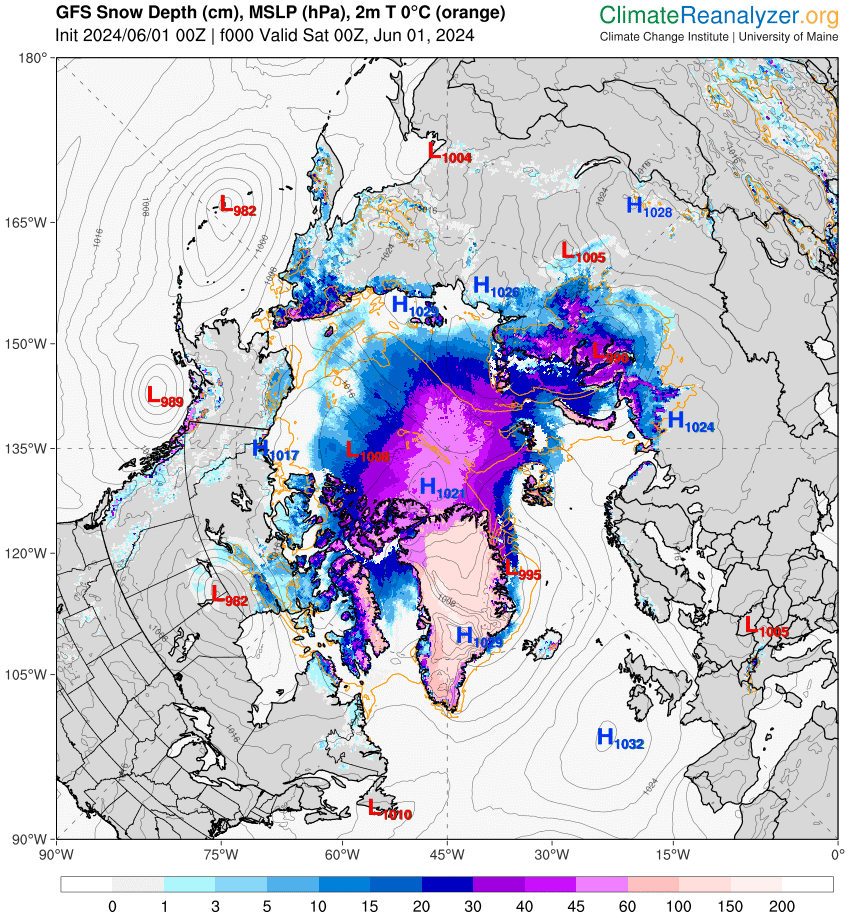
By this morning Ingunn had merged with the remnants of the prior cyclone, as revealed in Climate Reanalyzer’s visualisation of the latest GFS model run::
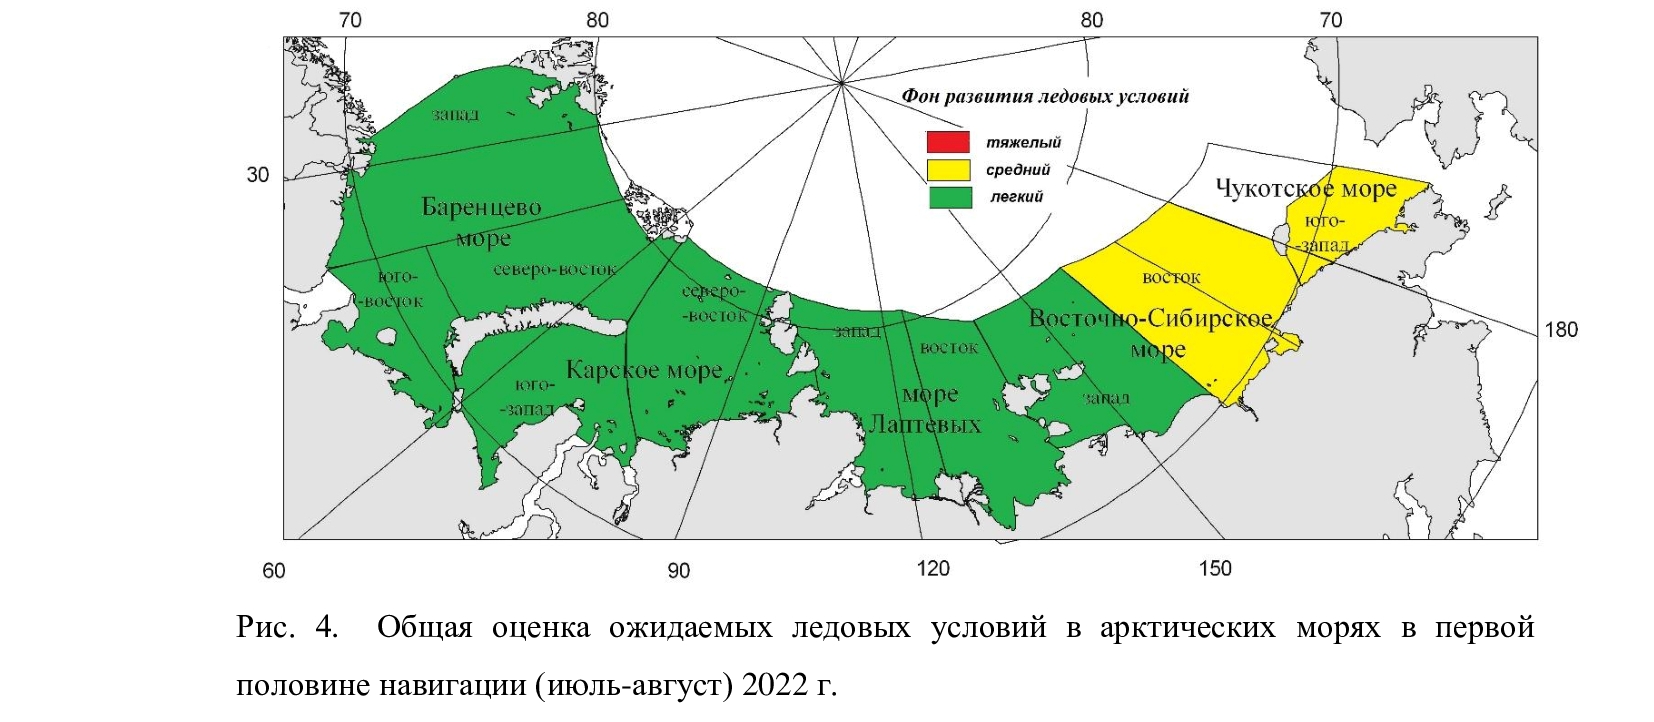
On June 17th the Northern Sea Route Administration published the Arctic and Antarctic Research Institute forecast of ice conditions for June to August 2022. Here’s the summary:
“Favorable” conditions in most areas, but “average” in the eastern East Siberian Sea and south west Chukchi Sea.
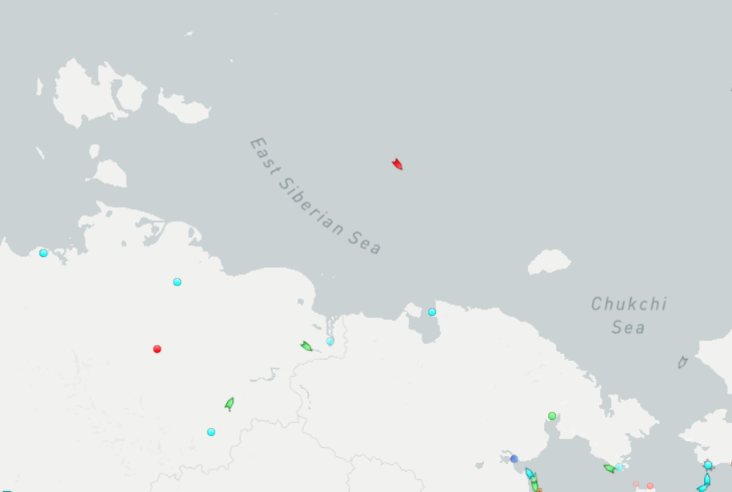
Traffic along the main Northern Sea Route has already begun. Marine Traffic reveals that the liquified natural gas carrier Nikolay Yevgenov is heading for the Bering Strait and has already sailed north of the New Siberian Islands. He is now entering the “average” ice area in the eastern ESS:
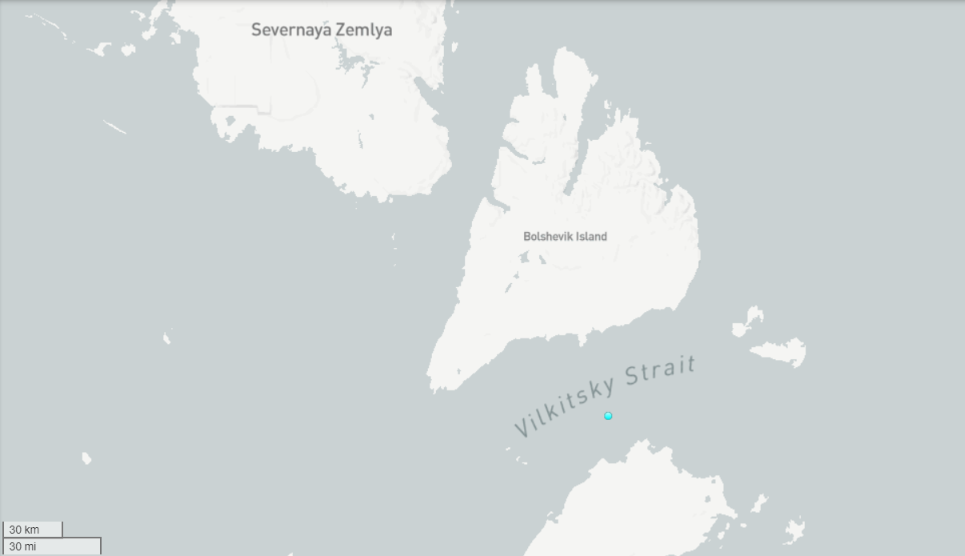
Meanwhile the recently commissioned nuclear powered icebreaker Sibir is patiently waiting in the Vilkitsky Strait:
The Northern Sea Route is evidently already “open” for ice hardened LNG tankers, but not yet for more conventional vessels. Here is the current AMSR2 sea ice concentration map:
After a quiet couple of years due to the Covid-19 pandemic there are numerous cruises through the Northwest Passage planned for the summer of 2022. Some (very!) small vessels are also currently scheduled to attempt that perilous journey. First of all let’s take a look at a map of the assorted routes through the Canadian Arctic Archipelago:
plus another map which includes a few more place names:
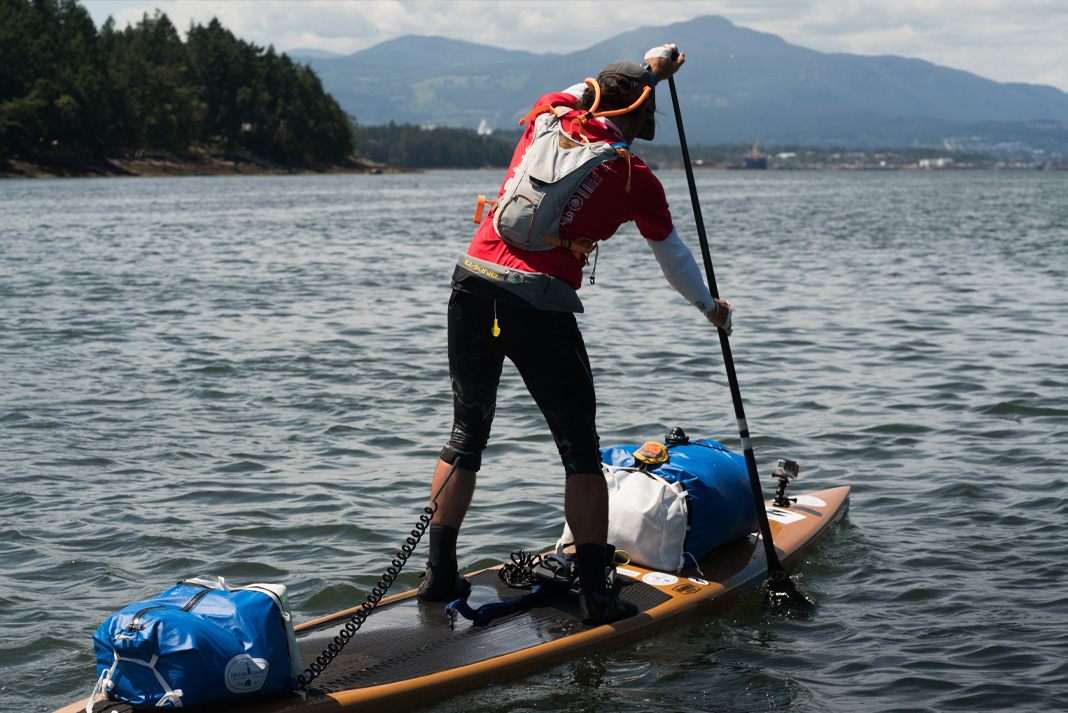
Next comes news of the expeditions planned by a variety of intrepid adventurers. According to Karl Kruger’s web site :
In 2022, Karl will attempt to become the first human to paddle 1,900 miles of the Northwest Passage on a standup paddleboard.
The article at the link is undated, but suggests that Karl initially intended to set off for Pond Inlet from Tuktoyaktuk in July 2019, but postponed the trip until the summer of 2020. By then Covid restrictions were in place, so next month provides the first opportunity for him to attempt the journey once again.
A recent paper by Kent Moore et al. has caused something of a stir in the mainstream media recently, as well as in cryospheric circles and amongst the cryodenialista:
The area to the north of Ellesmere Island and Greenland contains the Arctic’s thickest ice and it is predicted to be the last to lose its perennial ice, thus providing an important refuge for ice-dependent species. There is however evidence that this Last Ice Area is, like the entire Arctic, undergoing rapid changes that may reduce its suitability as a refuge. During May 2020, a polynya developed to the north of Ellesmere Island in a region where there are no reports of a previous development. We use a variety of remotely sensed data as well as an atmospheric reanalysis to document the evolution and the dynamics responsible for the polynya. In particular, we argue that anomalously strong divergent winds associated with an intense and long-lived Arctic anti-cyclone contributed to the development of the polynya as well as similar previously unreported events in May 1988 and 2004.
Curiously the paper neglects to mention a polynya in the same region that we reported on, albeit in passing, in August 2018. Here’s an updated video of that event, with the addition at the start of a yellow arrow to highlight the part of the Arctic’s “Last Ice Area” investigated by Moore et al. and a pale blue arrow to highlight Kap Morris Jesup, the most northerly point in Greenland:
Next here’s another animation, covering the time period discussed in the paper and continuing throughout the summer of 2020:
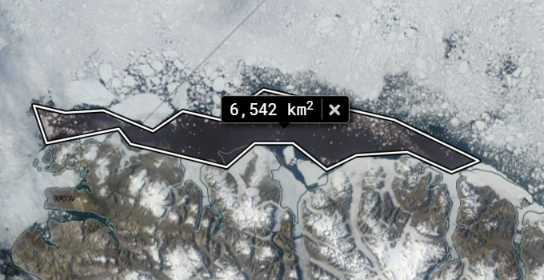
Comparing the two animations it is obvious that the August 2018 polynya is much larger than the one in May 2020, confirmed by a quick area computation using NASA WorldView:
The introduction to the paper states that:
Flaw leads, elongated regions of open water that develop along the interface between land fast and pack ice (Barber & Massom, 2007) are common in the region. Indeed Peary’s 1909 sledding expedition to the North Pole was delayed as a result of a large flaw lead that developed north of Ellesmere Island (Peary, 1910). However, the development of a polynya in this region has not been reported previously.
To my eye the image above reveals something far too wide to be described as a “flaw lead”, but let’s delve deeper into the paper:
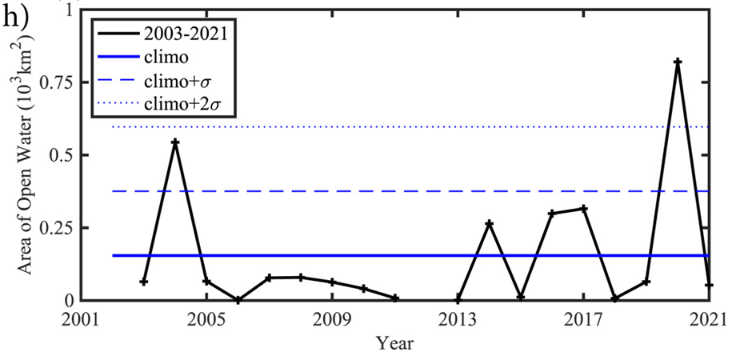
A perspective on the unique nature of the May 2020 event is provided by the monthly mean area of open water in the area of interest during May for the entire period of the ASI data set, 2003–2021 (Figure 2h). Typically the area of open water during May in the region is less than 160 km2. May 2020 is the only year in which the area of open water exceeds 2 standard deviations above the mean.
Perhaps the polynya in question is indeed “unique in the month of May”, in which case it would no doubt have been helpful if the abstract and/or the introduction to the paper had mentioned this subtlety. Then the plethora of erroneous statements in the media like the one recently referenced by Mark Lynas on Twitter might have been avoided?
The polynya is the first one that has been identified in this part of the Last Ice Area, according to a new study detailing the findings in the AGU journal Geophysical Research Letters.
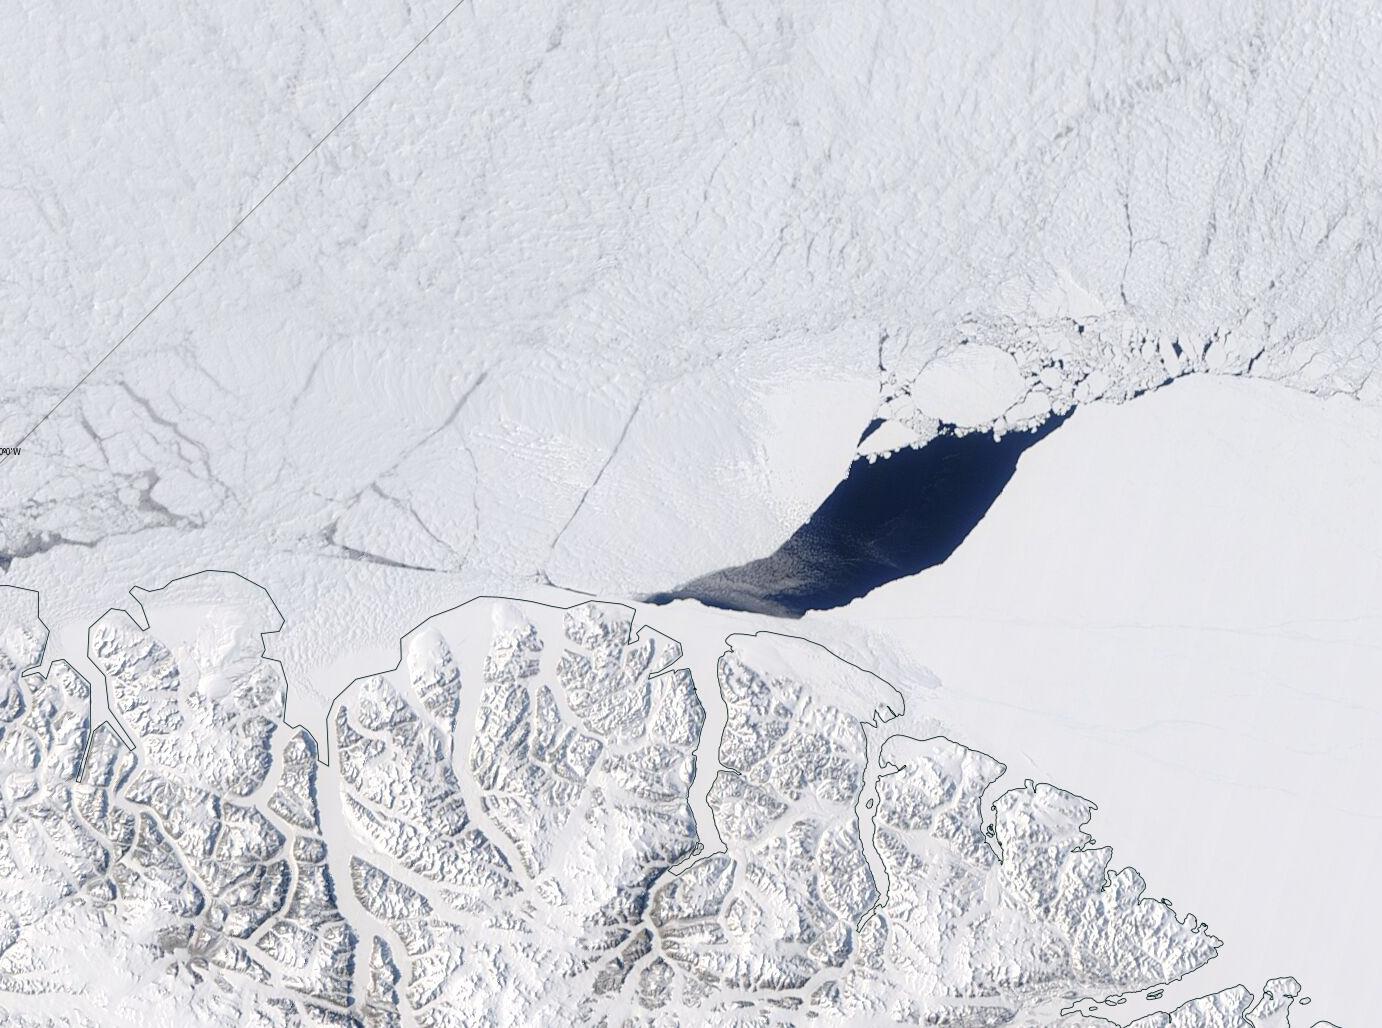
Since Mark, amongst others, seem to be suffering from the misapprehension that “The Arctic’s ‘Last Ice Area’ is cracking, just in time for COP26” here is what’s been happening in the “Last Ice Area” this year, in the run up to next month’s conference in Glasgow:
Finally, for the moment at least, are MODIS images of the May 20th 2020 polynya:
and the one on May 12th 2004:
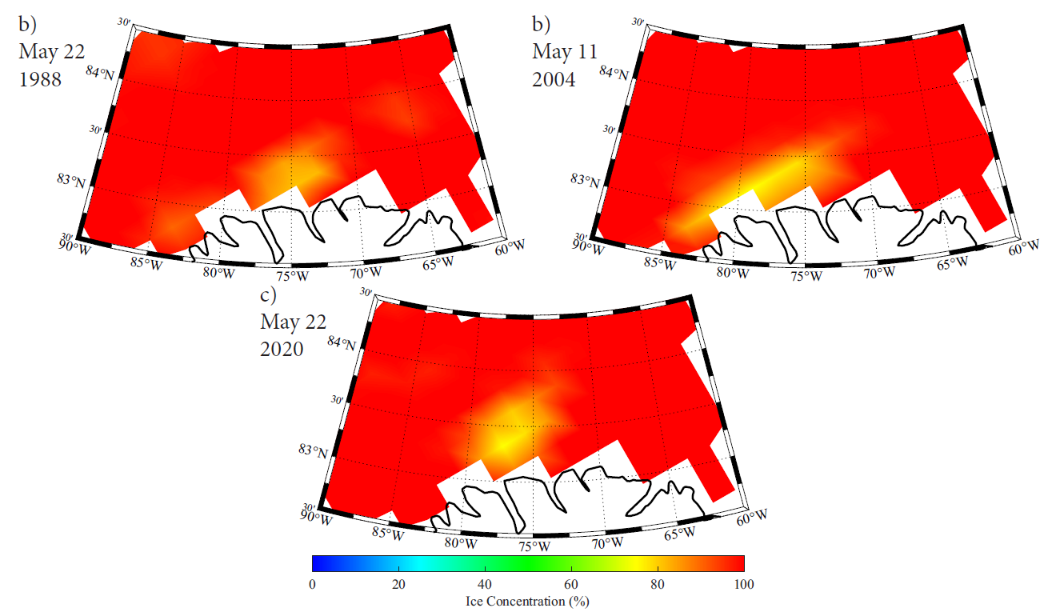
Neither Aqua or Terra had been launched in 1988 of course, and Landsat 5 didn’t cover the north of Ellesmere Island. This is the SSM/I & SSMIS visualisation of all three May polynyas from the supplement to Moore’s paper:
A new month begins today, and at the moment it looks as though it’s going to be the most interesting one since August 2012. Here once again is the satellite image of the enormous cyclone that was spinning over the Beaufort/Chukchi Seas just a few days ago:
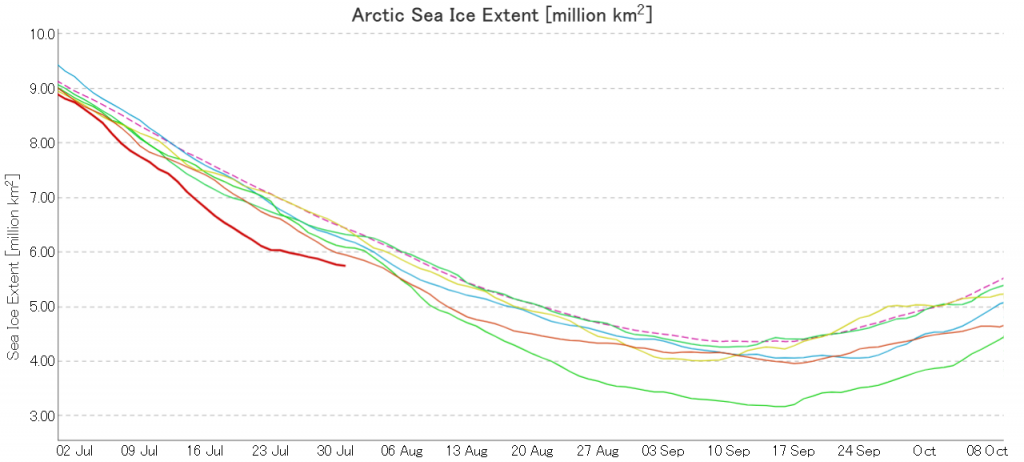
Here too is the effect of the cyclone on the trajectory of the JAXA Arctic sea ice extent graph:
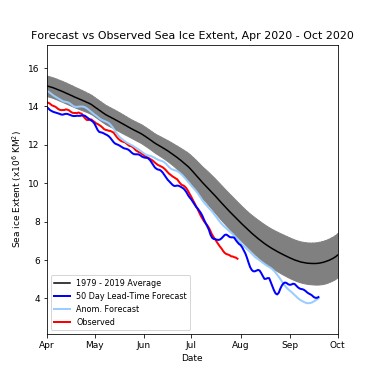
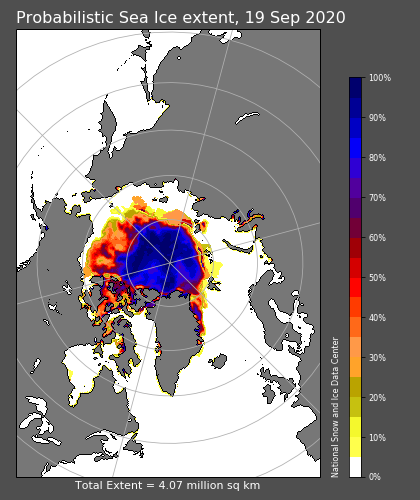
Here too is the current prognosis of the late Andrew Slater’s “Slater Probabilistic Ice Extent” 50 day forecast:
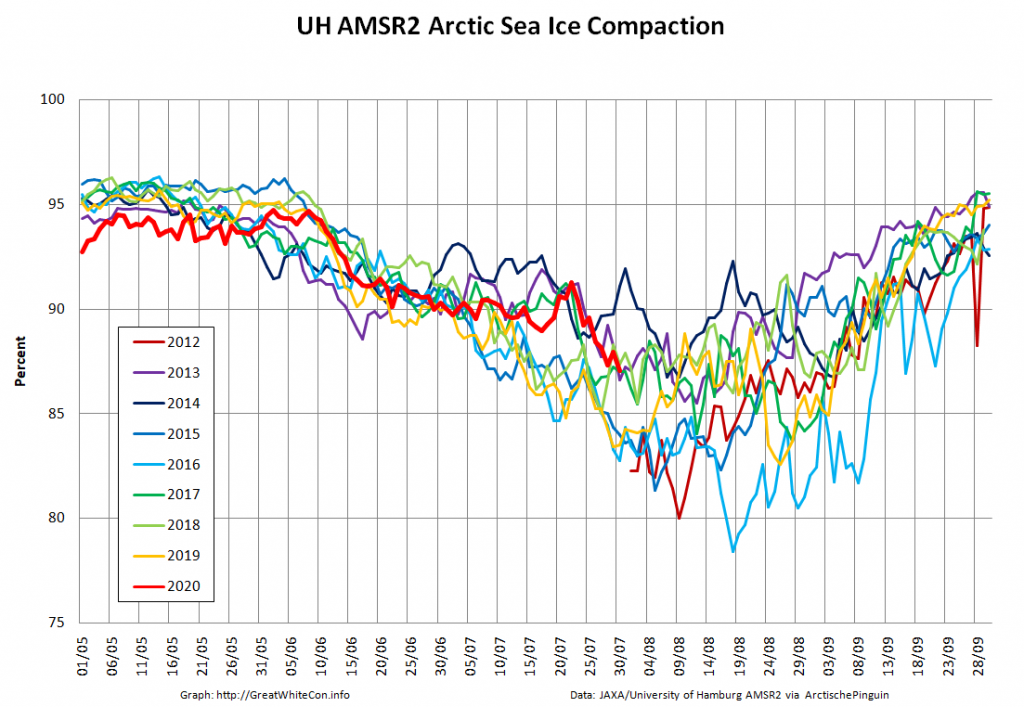
The cyclone has obviously resulted in a reduction in the rate of extent decline, but take a look at the high resolution AMSR2 “compaction” graph:
The gaps between the remaining sea ice floes have evidently increased, and hence the ice area is declining more rapidly than its extent.
[Edit – August 2nd]
Here’s an animation, based on the University of Hamburg’s AMSR2 concentration maps, which reveals the motion of the sea ice across the Beaufort and Chukchi Seas for the last two months:
Note in particular the side effects of the recent cyclone, visible at the end of the video.
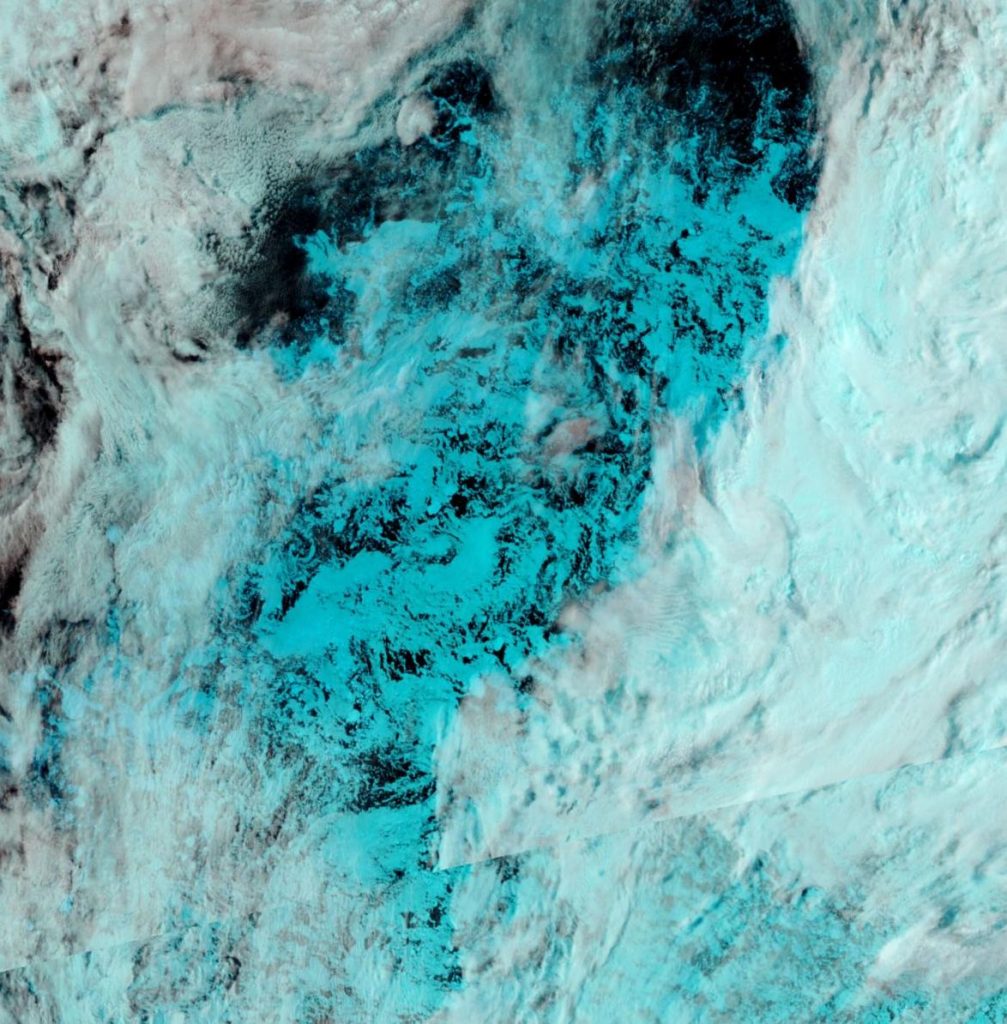
Here too is a close up of the current state of the remaining ice in the Chukchi Sea, snapped by the Suomi NPP satellite through a gap in the clouds:
Plus the current open water north of Greenland. Perhaps once Polarstern has been flushed out into the open water of the Fram Strait at the end of the MOSAiC expedition she could take another look at this almost completely unexplored area of the Arctic Ocean?
[Edit – August 6th]
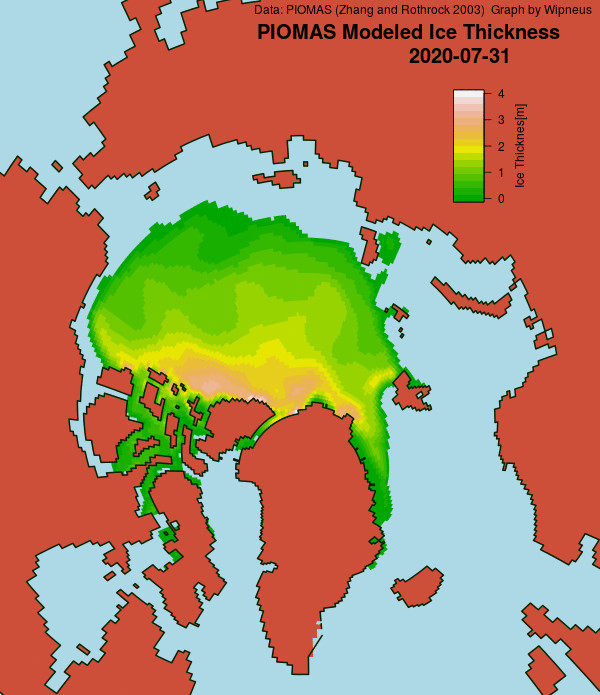
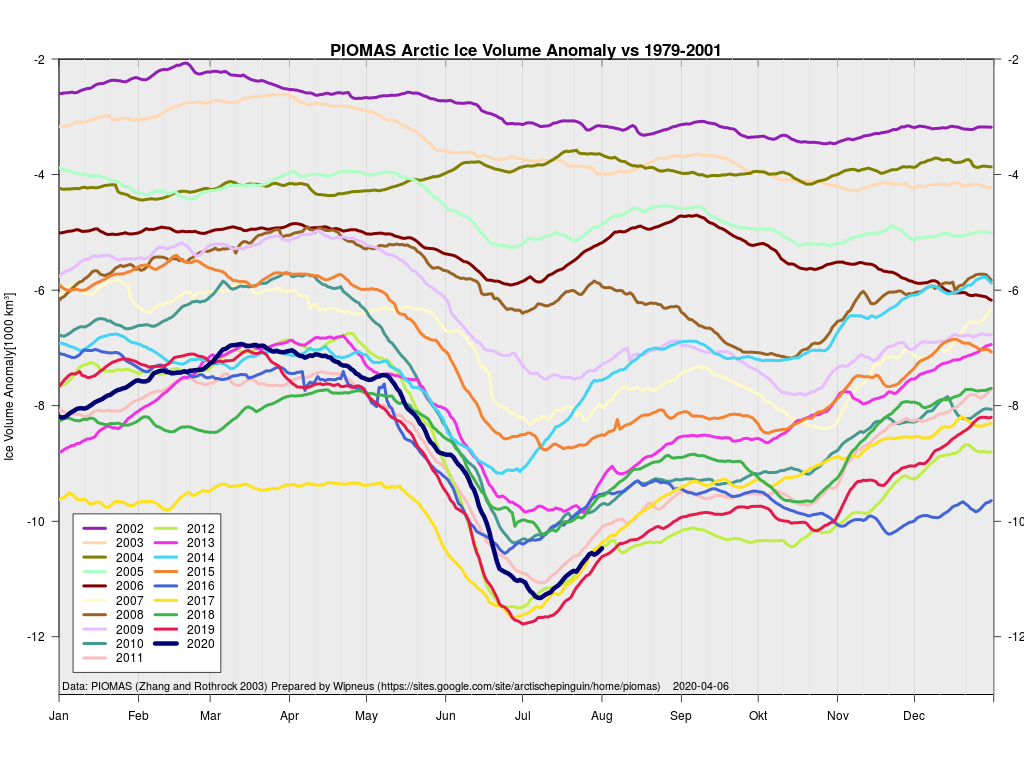
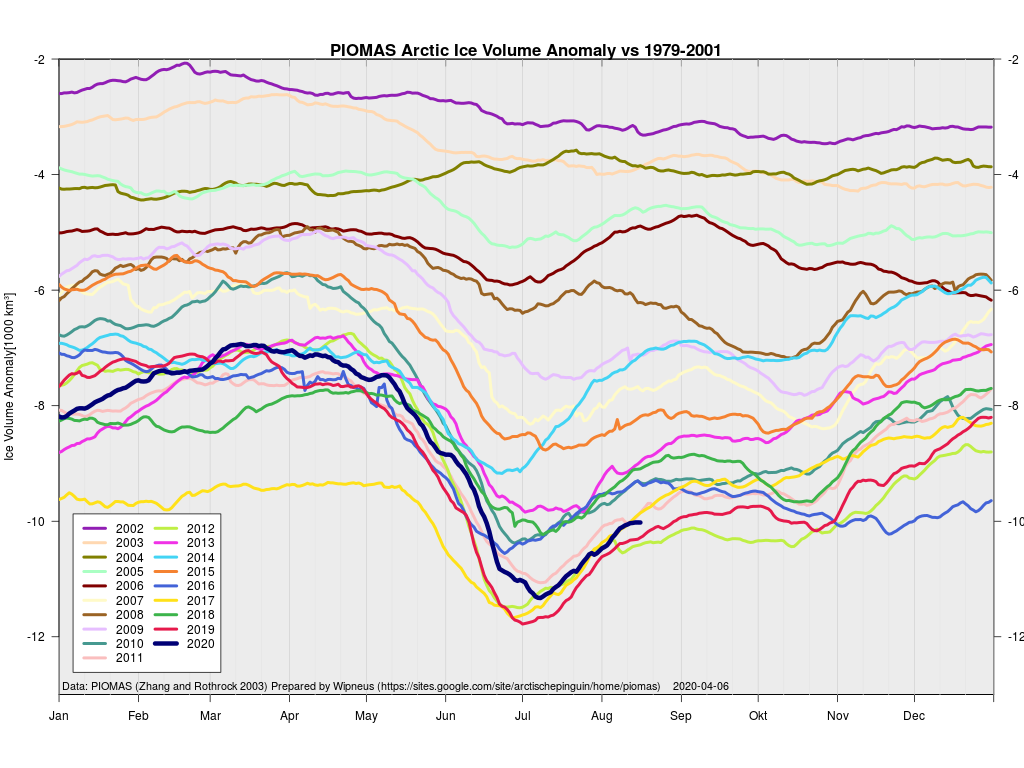
The latest gridded thickness data has been released by the PIOMAS team, and here are Wipneus’s visualisations:
Average Arctic sea ice volume in July 2020 was 9,300 km3. This value is only 400 km3 above the record minimum value of 8,900 km3 set in 2019. This makes 2020 the fourth lowest on record for July with 2012, 2017,2019 falling just below 2020.
JAXA extent is still lowest for the date, but following the recent cyclone it looks as though it will not maintain that position for much longer:
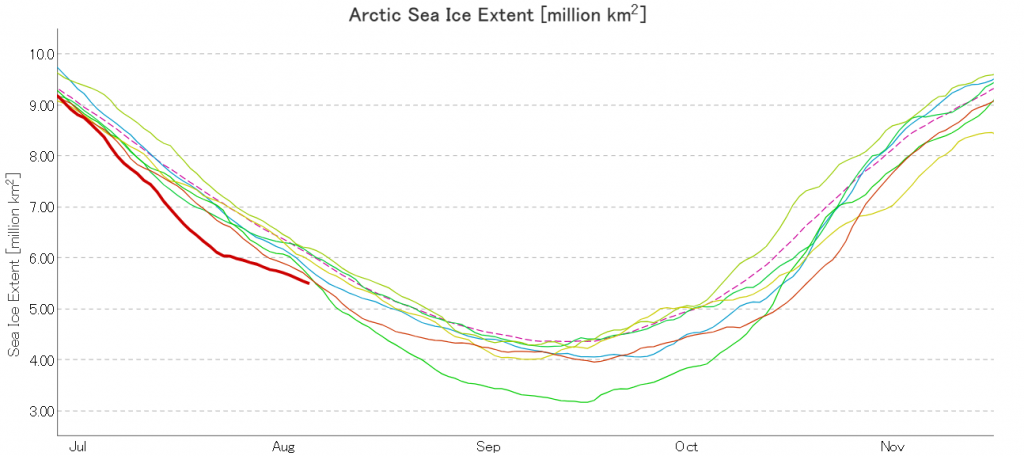
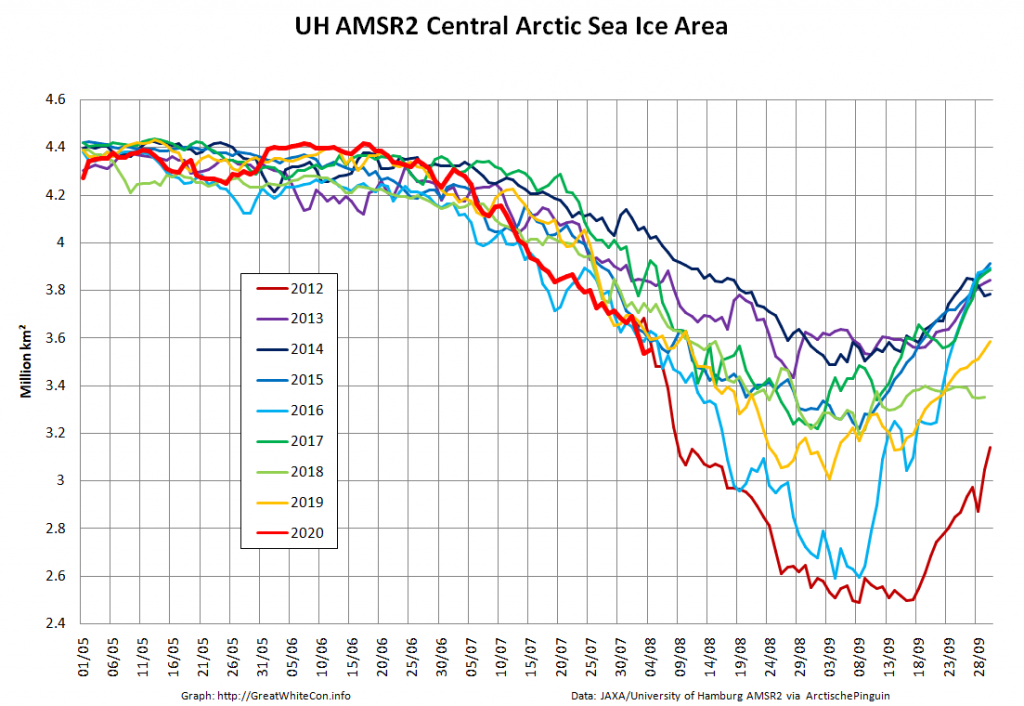
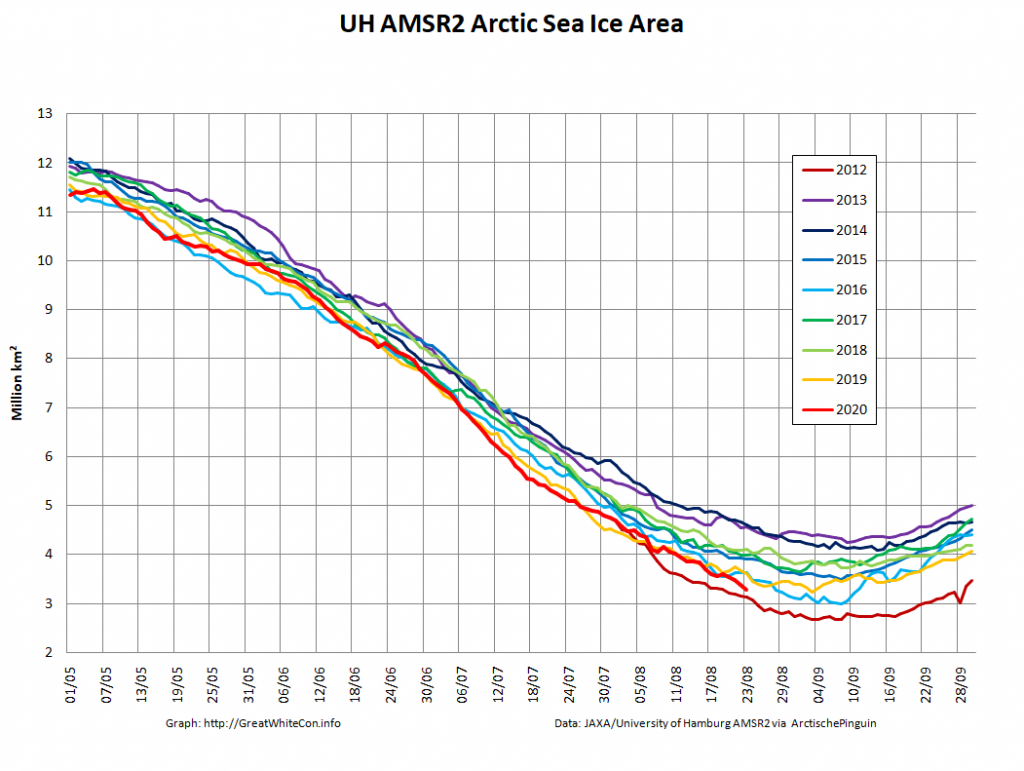
Now we’re in the month of August it’s possible to do a direct comparison with AMSR2 data for 2012. Here’s sea ice area for the Central Arctic Basin:
[Edit – August 8th]
All of a sudden JAXA extent is in 3rd place in the race to the minimum:
However let’s also take a close look at the state of the sea ice in the Beaufort and Wandel Seas shall we?
At this juncture I reckon that come mid September second place is now more likely than first. However as always, it still all depends on the weather.
[Edit – August 9th]
Surprising as it may seem, high resolution AMSR2 Central Arctic Basin sea ice area has so far managed to keep up with the precipitous drop in 2012:
North of Greenland the clouds have cleared closer to the North Pole, to reveal this:
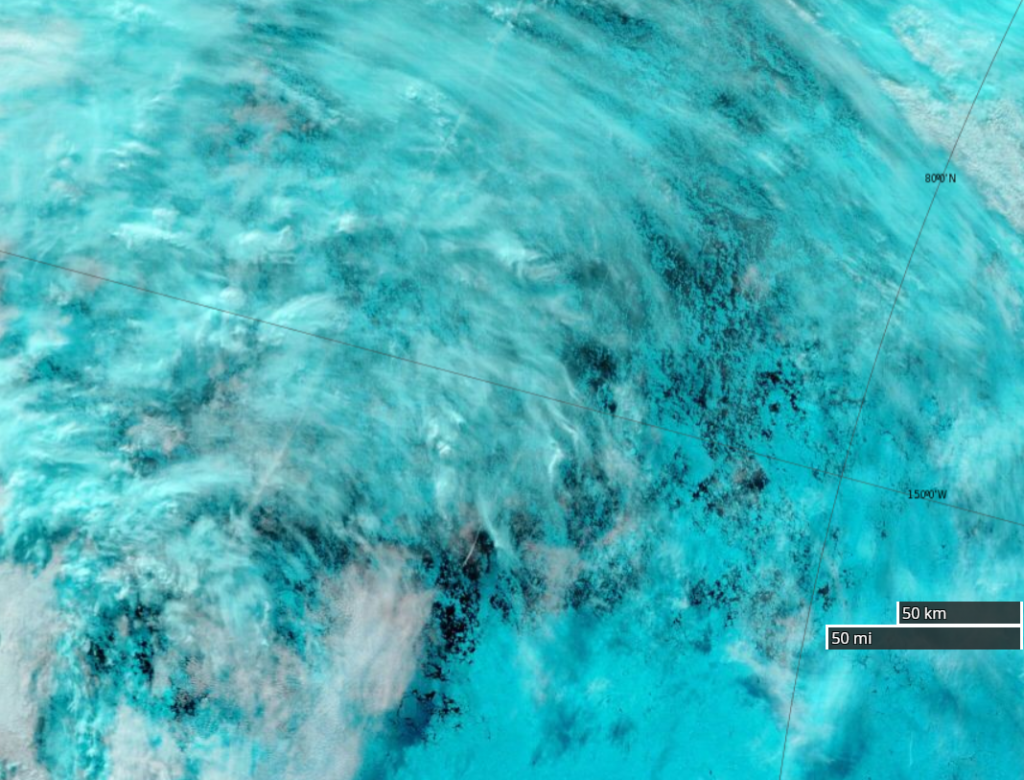
Fresh this morning from Terra, a rather cloudy view of the devastation near 80N, 150W:
[Edit – August 10th]
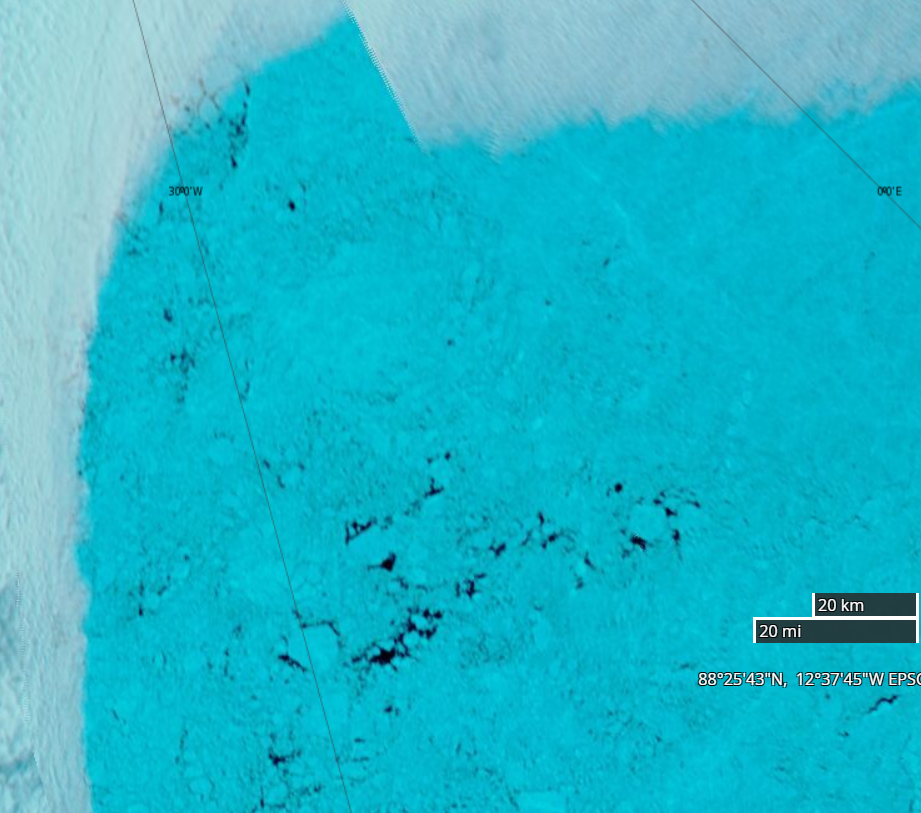
In a not entirely unexpected development one of ex Prof. Judy’s denizens is quibbling about the current condition of sea ice in the Arctic. Hence here is a close up of some “gaping holes in the sea ice cover” at 88N between Greenland and the North Pole:
[Edit – August 13th]
A nice clear view this morning of the marginal ice zone of the “Laptev Bite” and thereabouts from the Suomi satellite :
[Edit – August 16th]
JAXA AMSR2 extent has fallen below 5 million km²:
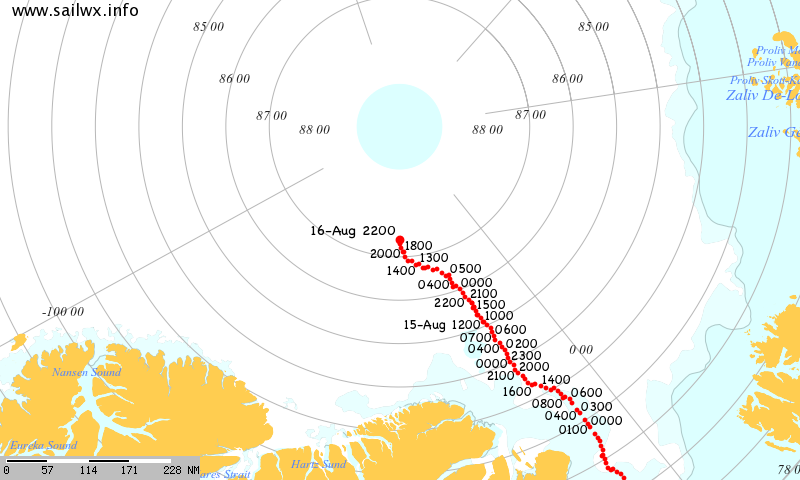
Having been flushed out of the Central Arctic through the Fram Strait the polar research vessel Polarstern is back, seemingly intent on taking a close look at the North Pole:
[Edit – August 19th]
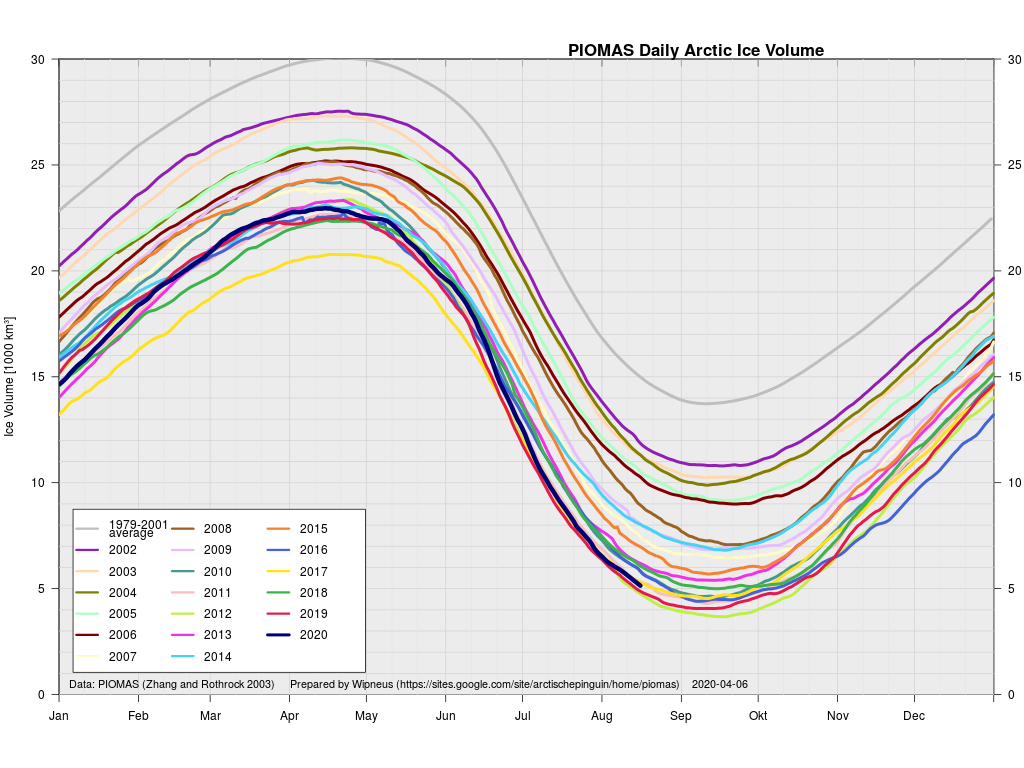
The mid month PIOMAS gridded thickness numbers have been published:
According to the Polar Science Center model Arctic sea ice volume is currently third lowest after 2012 and 2019.
[Edit – August 24th]
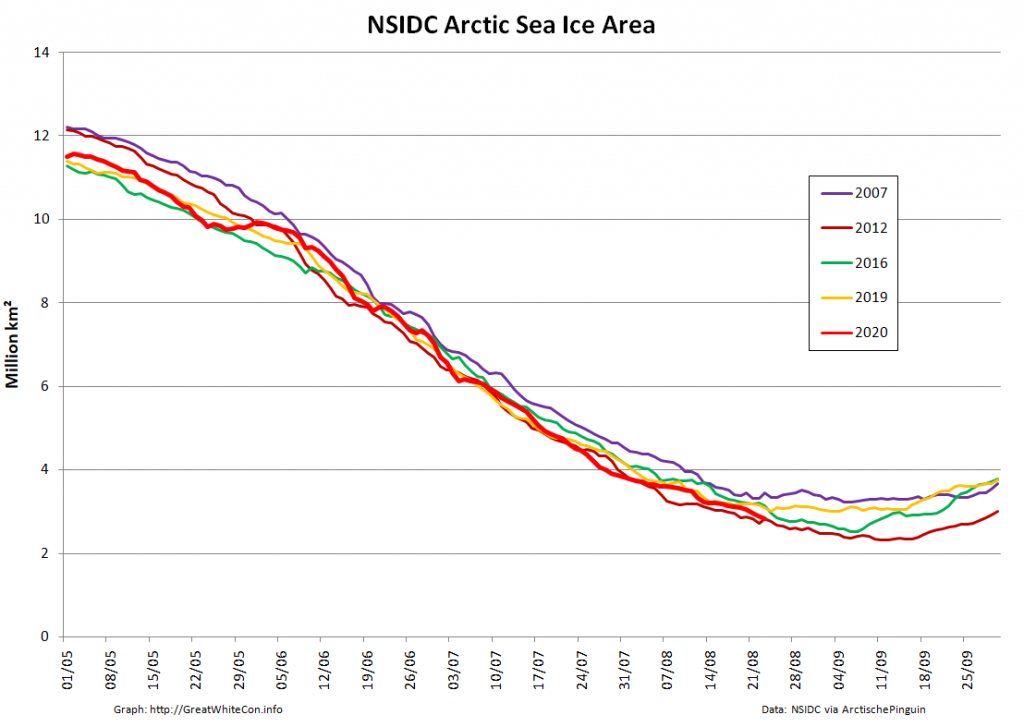
Arctic sea ice area based on NSIDC concentration data is now in a “statistical tie” with 2012 for the honour of “lowest for the date” in the satellite record:
High resolution AMSR2 area isn’t far behind:
[Edit – August 24th]
A nice clear view of the disintegrating sea ice north of the East Siberian and Chukchi Seas yesterday:
Watch this space very closely for the next few weeks!
This website uses cookies to improve your experience. We'll assume you're ok with this, but you can opt-out if you wish. Cookie settingsACCEPT
Privacy & Cookies Policy
Privacy Overview
This website uses cookies to improve your experience while you navigate through the website. Out of these, the cookies that are categorized as necessary are stored on your browser as they are essential for the working of basic functionalities of the website. We also use third-party cookies that help us analyze and understand how you use this website. These cookies will be stored in your browser only with your consent. You also have the option to opt-out of these cookies. But opting out of some of these cookies may affect your browsing experience.
Necessary cookies are absolutely essential for the website to function properly. This category only includes cookies that ensures basic functionalities and security features of the website. These cookies do not store any personal information.
Any cookies that may not be particularly necessary for the website to function and is used specifically to collect user personal data via analytics, ads, other embedded contents are termed as non-necessary cookies. It is mandatory to procure user consent prior to running these cookies on your website.