We have grandchildren visiting this week, so it seems prudent to get the new open thread started a day early, and before they wake up!
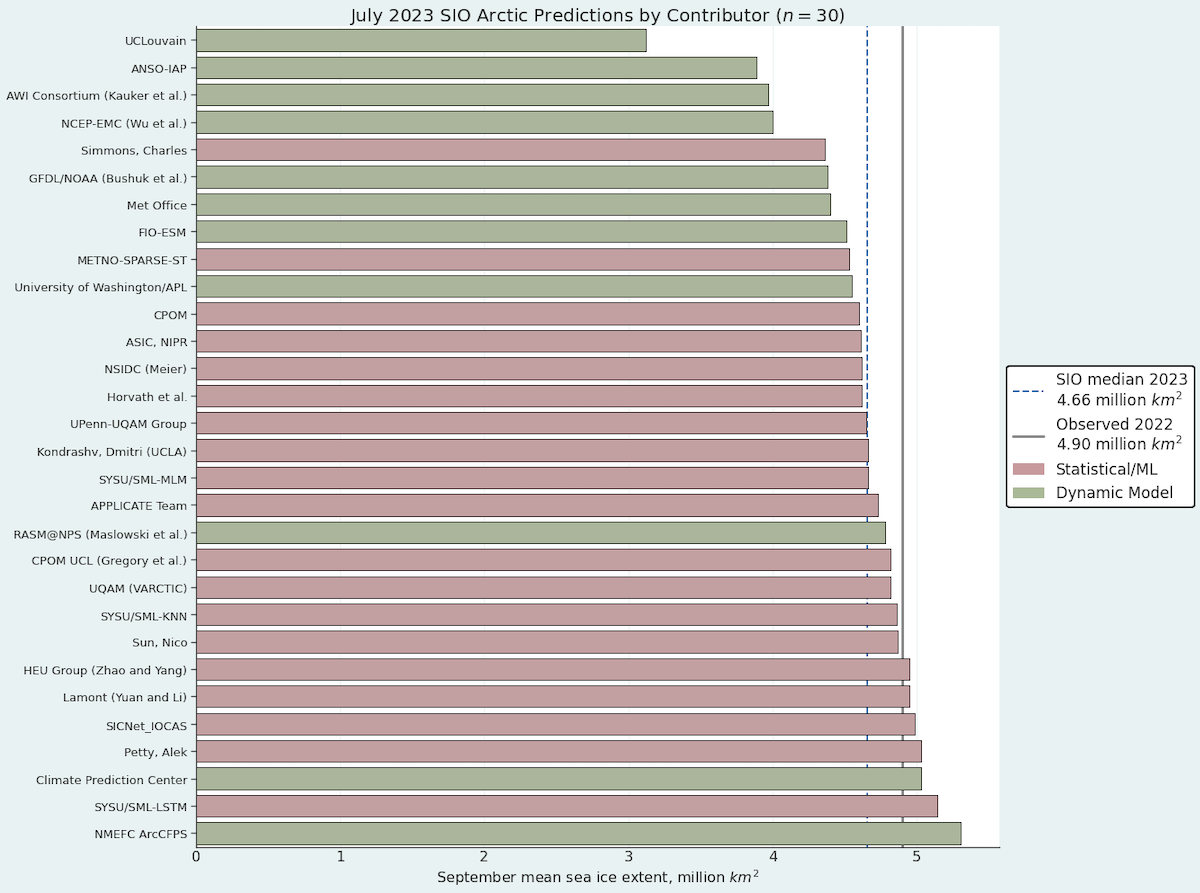
The ARCUS Sea Ice Prediction Network July report has recently been published. Here’s the graphic overview of the 30 predictions for September sea ice monthly average extent:
The July median forecasted value for pan-Arctic September sea-ice extent is 4.66 million square kilometers with interquartile values of 4.51 and 4.87 million square kilometers, while individual forecasts range from 3.12 and 5.30 million square kilometers. We note the lowest forecast is an outlier, and the only forecast that predicts a new record September sea-ice extent value (current record is September 2012, with a sea-ice extent of 3.57 million square kilometers).
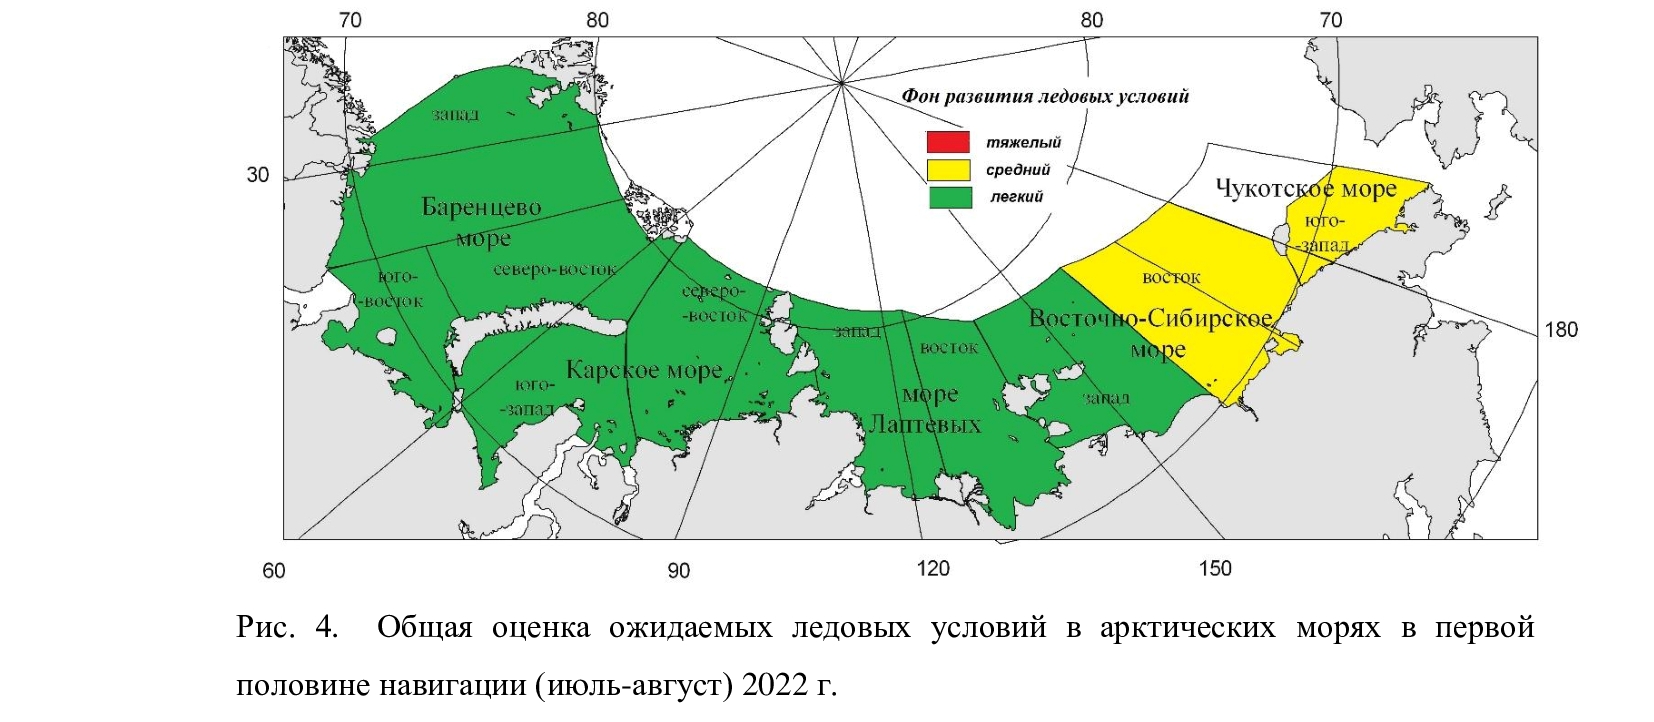
On June 17th the Northern Sea Route Administration published the Arctic and Antarctic Research Institute forecast of ice conditions for June to August 2022. Here’s the summary:
“Favorable” conditions in most areas, but “average” in the eastern East Siberian Sea and south west Chukchi Sea.
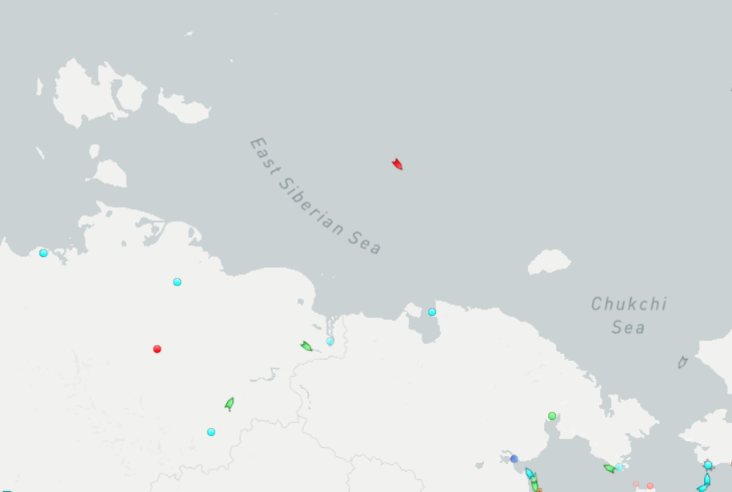
Traffic along the main Northern Sea Route has already begun. Marine Traffic reveals that the liquified natural gas carrier Nikolay Yevgenov is heading for the Bering Strait and has already sailed north of the New Siberian Islands. He is now entering the “average” ice area in the eastern ESS:
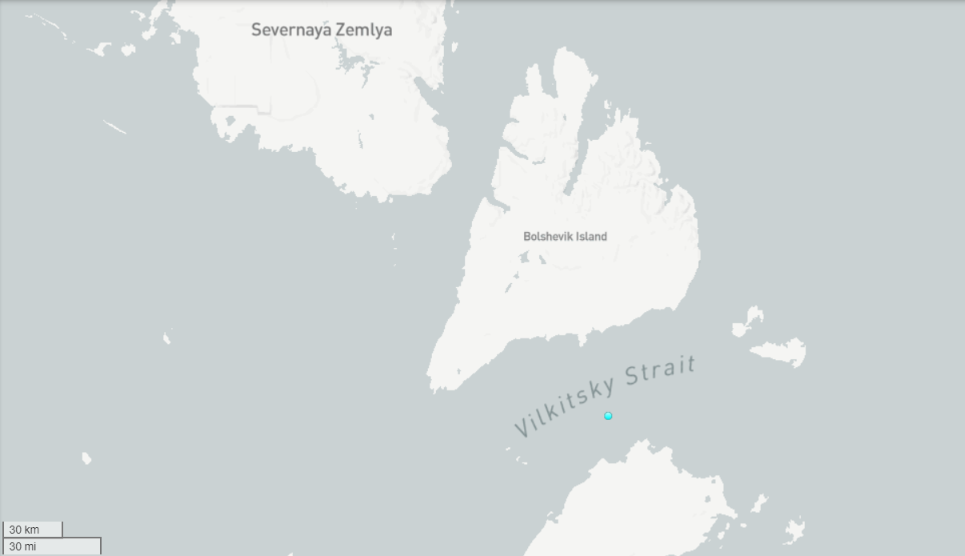
Meanwhile the recently commissioned nuclear powered icebreaker Sibir is patiently waiting in the Vilkitsky Strait:
The Northern Sea Route is evidently already “open” for ice hardened LNG tankers, but not yet for more conventional vessels. Here is the current AMSR2 sea ice concentration map:
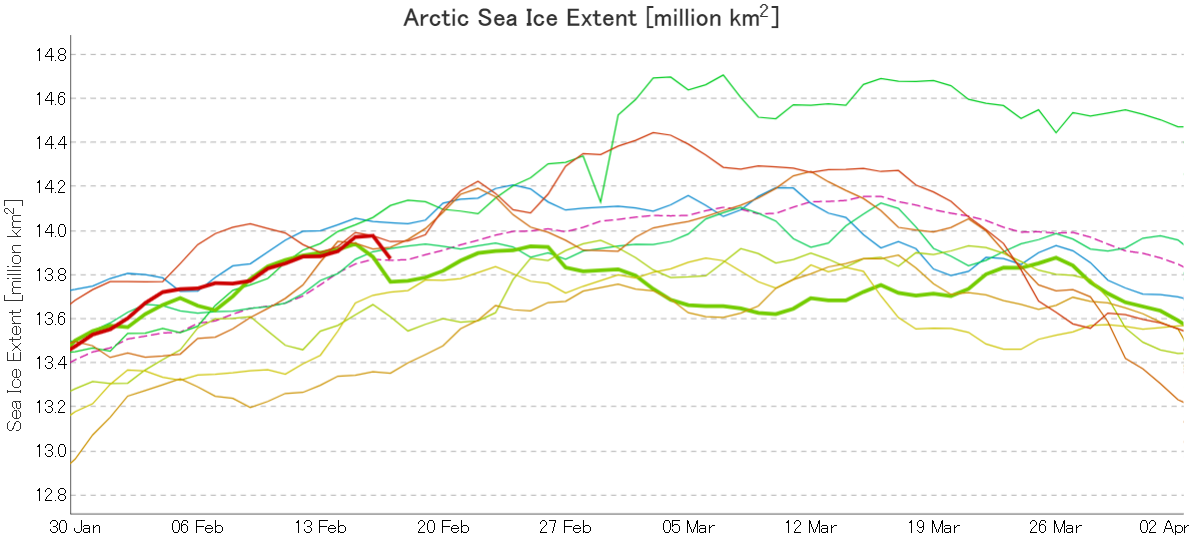
Here’s the latest graph of Arctic sea ice extent from JAXA/ViSHOP, with 2021 and 2015 highlighted:
Extent fell by over 100,000 square kilometres between February 16th and 17th! Can that steep fall continue, as it did for one more day in 2015?
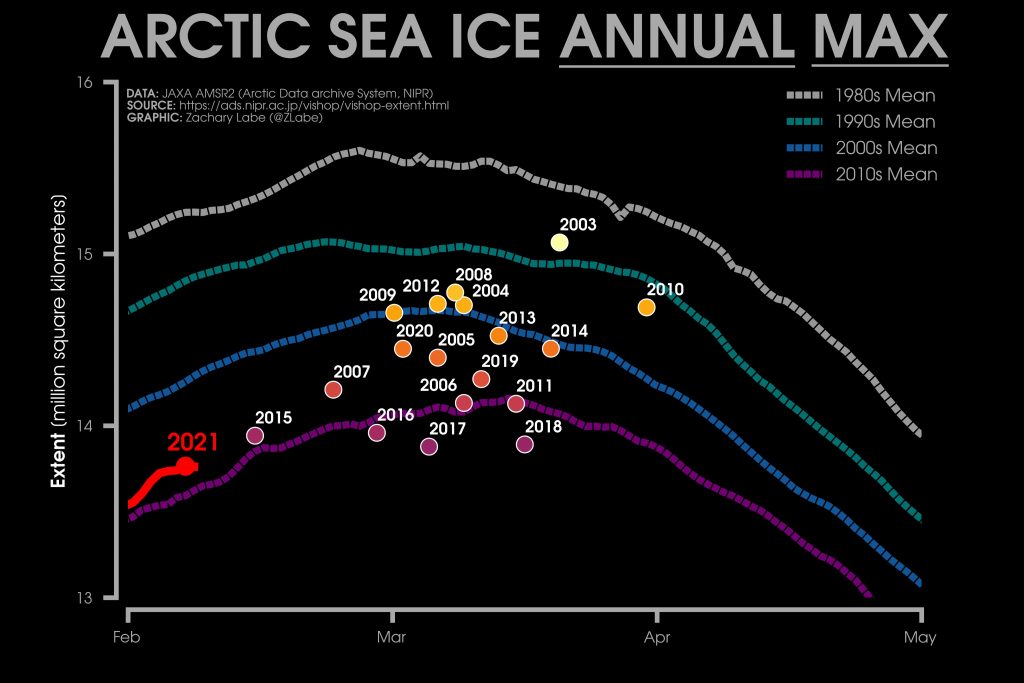
Here too is Zack Labe’s 2021 overview of JAXA maximum extent over the previous couple of decades:
2015’s maximum was very early, on February 15th. Hence the current extremely tentative 2021 maximum is already both higher and later than that. The decadal average extent graphs show the date of the maximum getting later and later, and the 2010’s peaks in the middle of March.
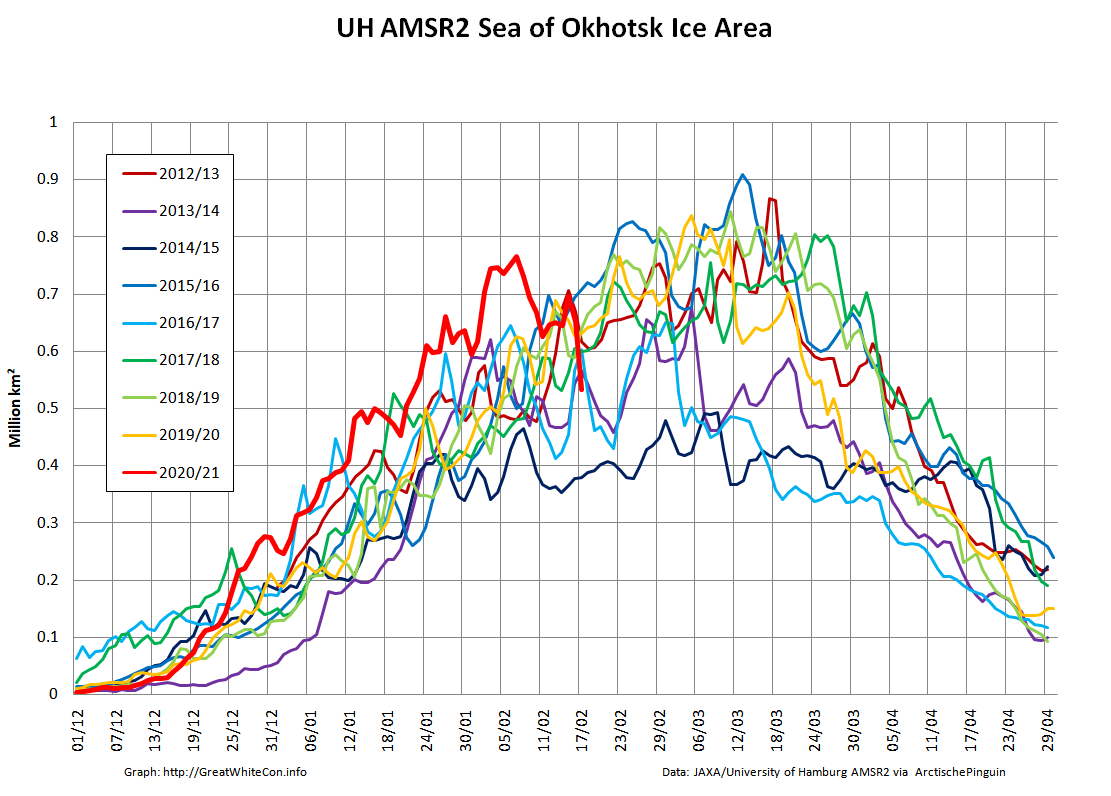
It therefore seems likely that there is more freezing still to come this year. However lets take a look at the high resolution AMSR2 sea ice area graph for the Sea Of Okhotsk:
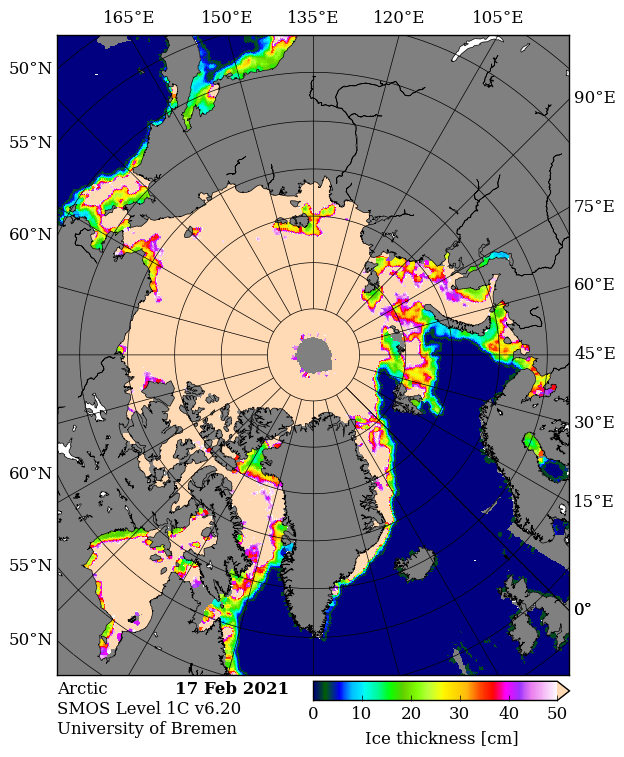
The recent fall in Arctic wide extent has evidently been driven by the recent rapid decline in this peripheral sea, where SMOS reveals more thin ice ripe for further melting:
In conclusion, the high res AMSR2 extent metric shows the tentative 2021 peak below that of 2015!
Our title for today refers back to the Great Arctic Cyclone of August 2012. There has been some speculation over on the Arctic Sea Ice Blog about whether a similar event is about to occur this year.
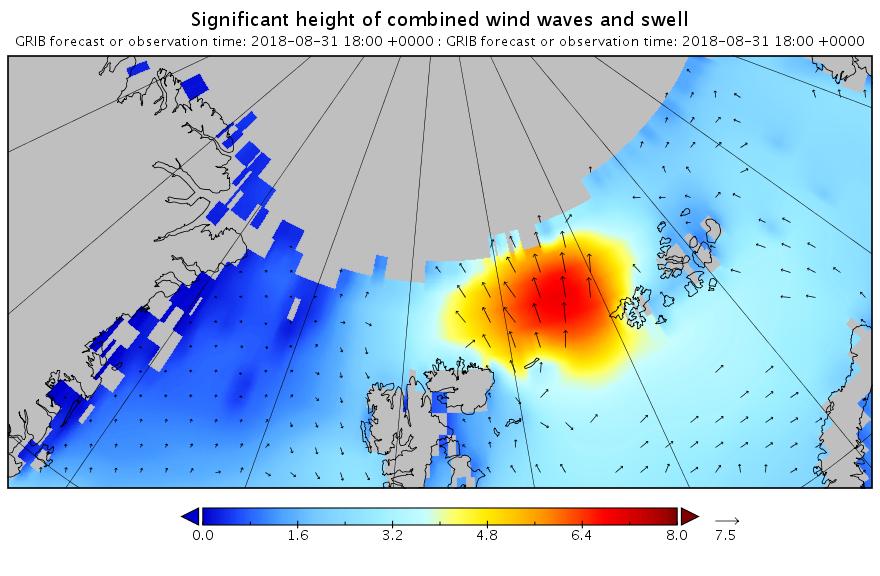
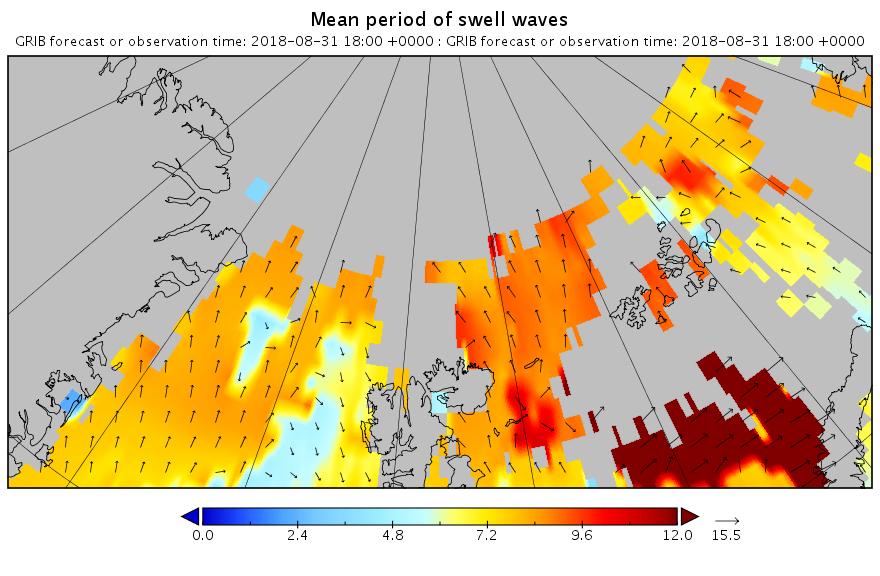
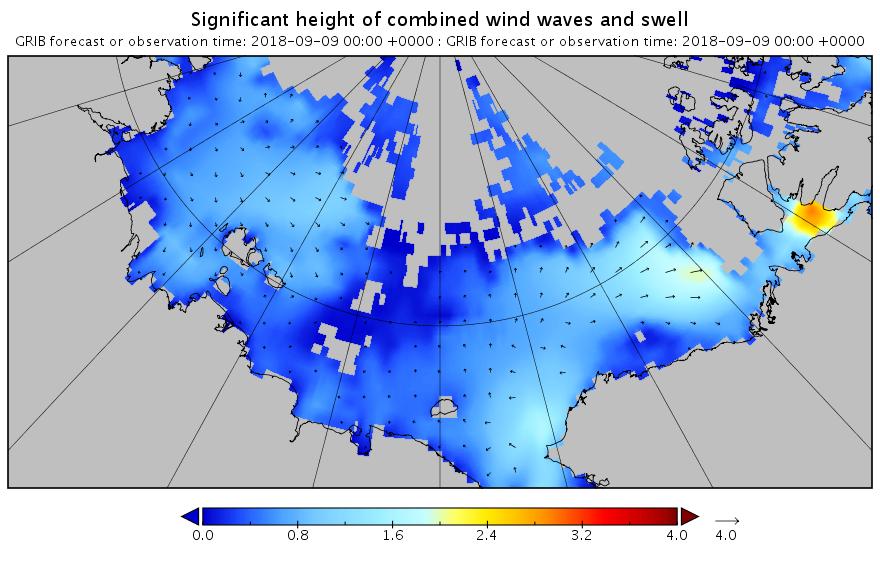
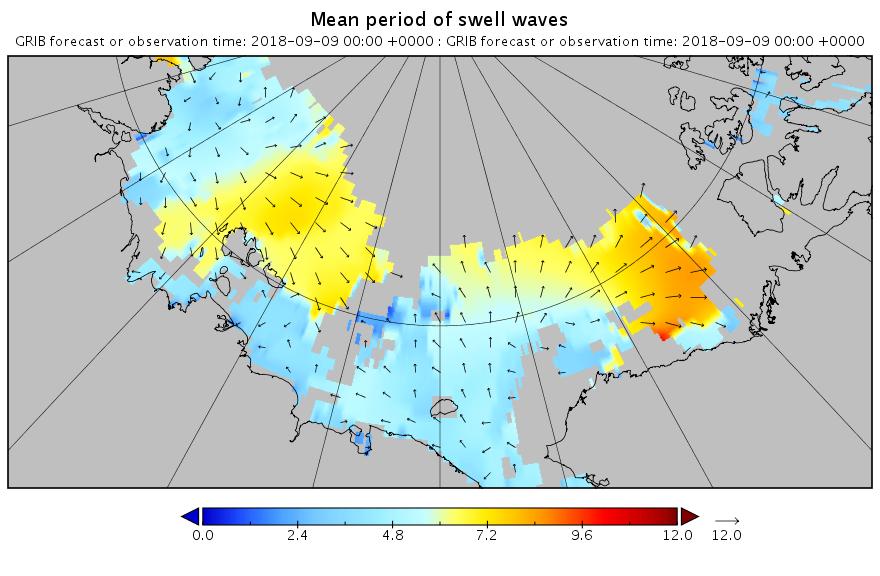
It’s later in the season of course, but as is our wont we always look at the waves first. Here is the current WaveWatch III forecast for the evening of August 31st UTC:
In summary the forecast shows some very large waves with a substantial period for inside the Arctic Circle directed straight at the ice edge. Let’s follow the forecast over the next few days carefully shall we?
[Edit – August 30th]
The latest wave forecast for tomorrow evening isn’t as extreme as 3 days ago. Note the change in the significant height scale:
Nonetheless the height and period are still very significant!
[Edit – August 31st]
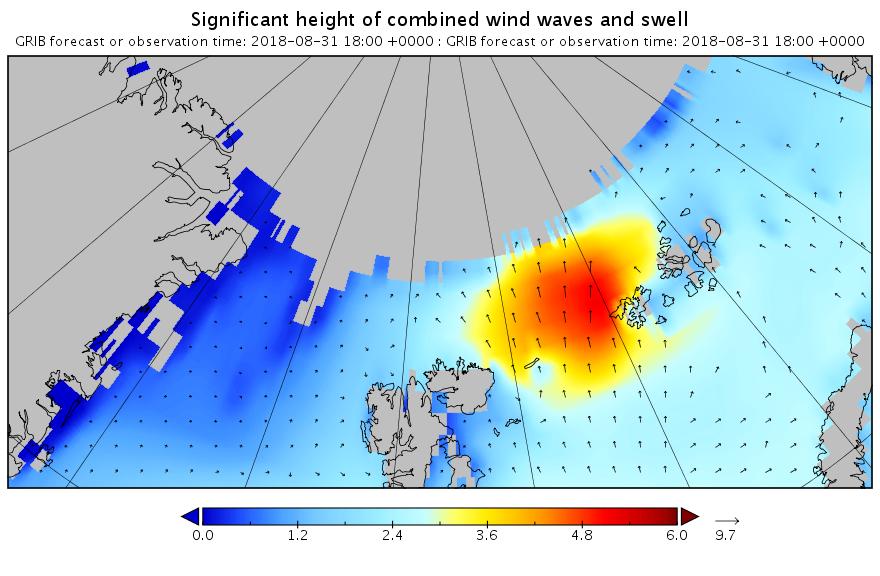
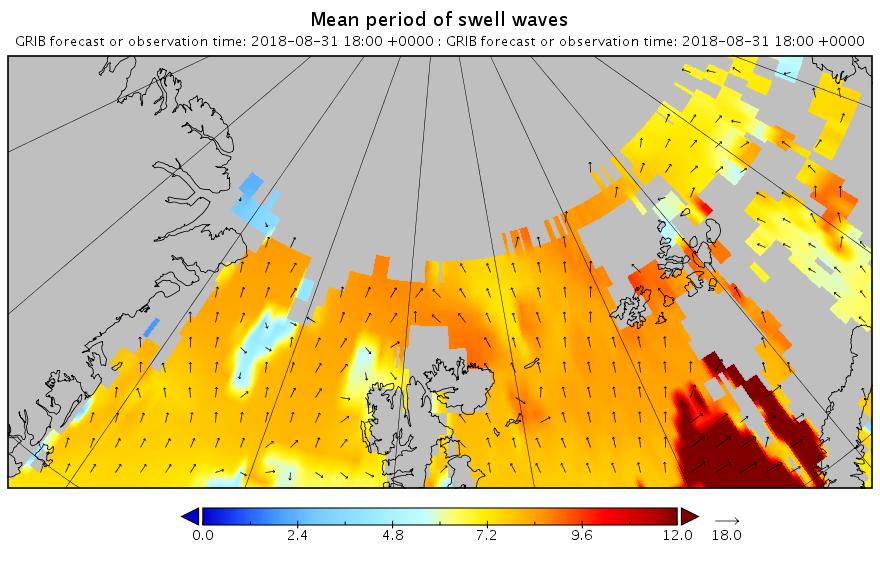
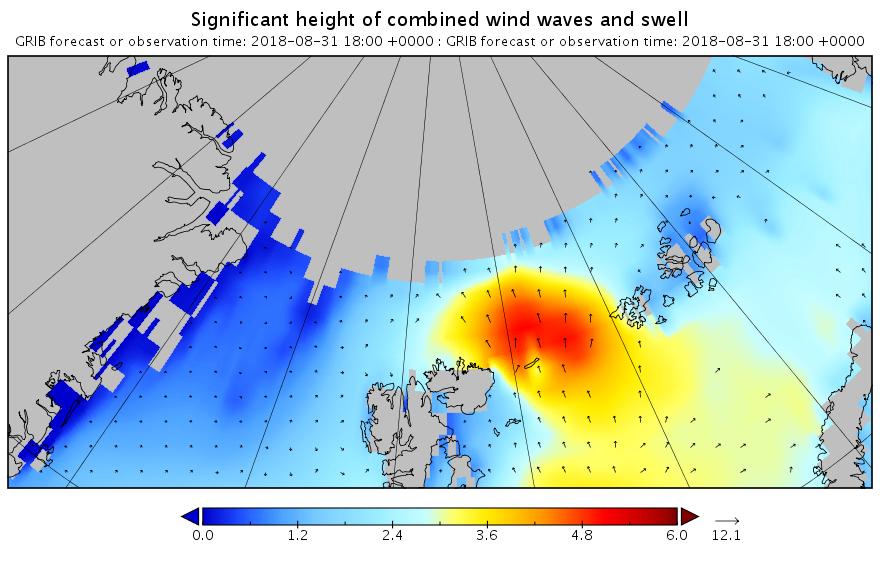
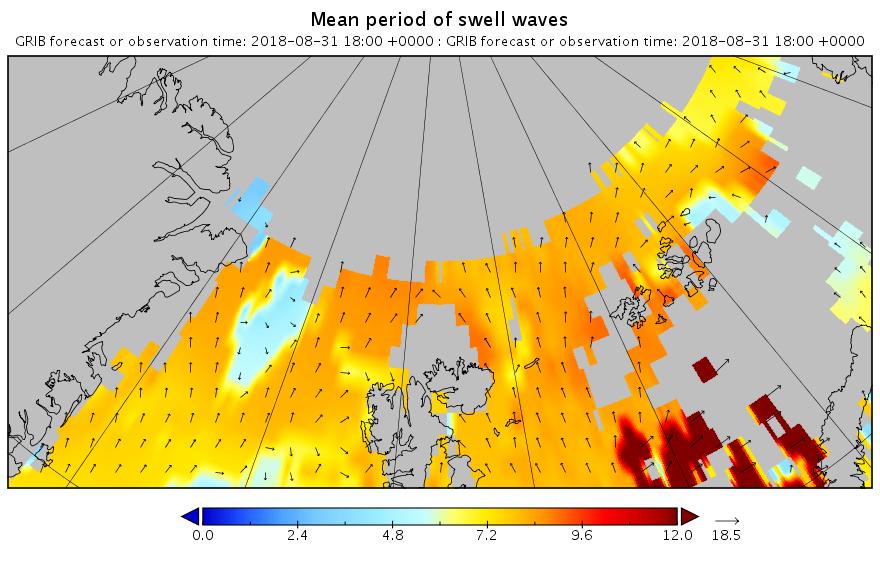
Here’s the latest forecast for 6 PM this evening (UTC):
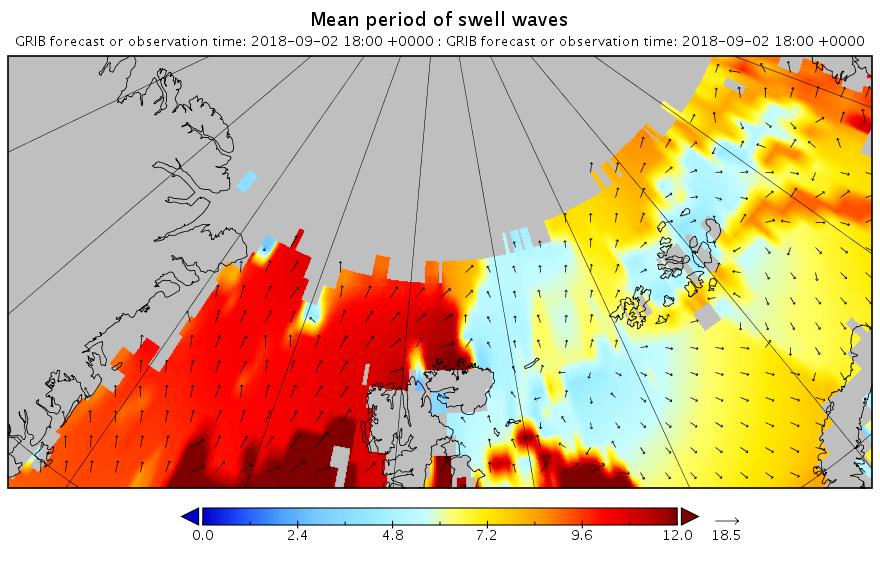
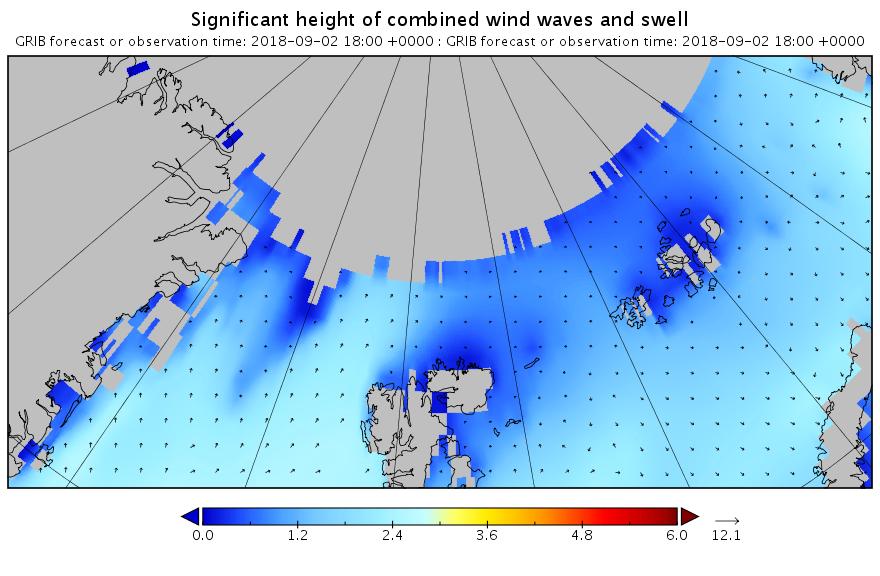
Note how the open water across almost the entire map is full of what in the Arctic counts as a long period swell. That means that the forecast for 2 days later looks like this:
Less height but with a longer period. All of which means that the sea ice north of the Atlantic Ocean isn’t about to receive a short sharp shock. It has a sustained battering lasting several days to look forward to.
[Edit – September 1st]
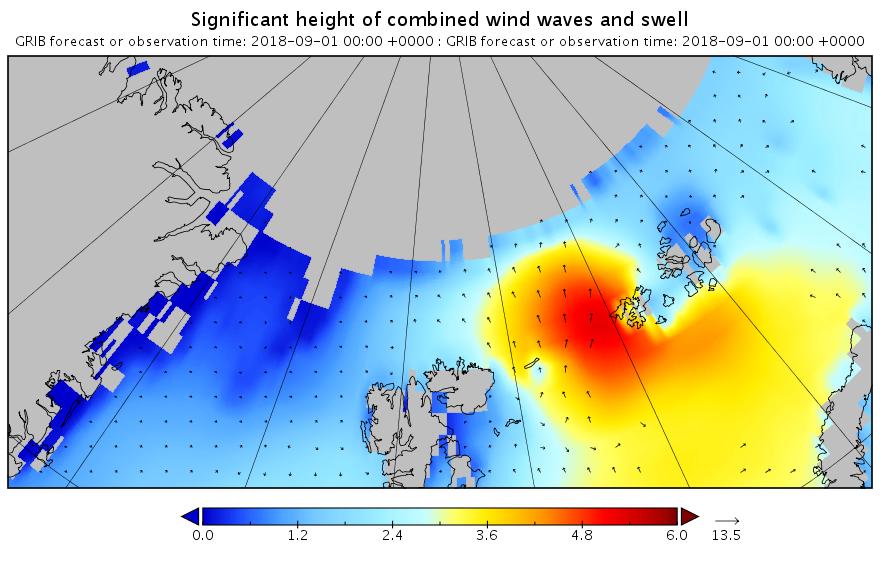
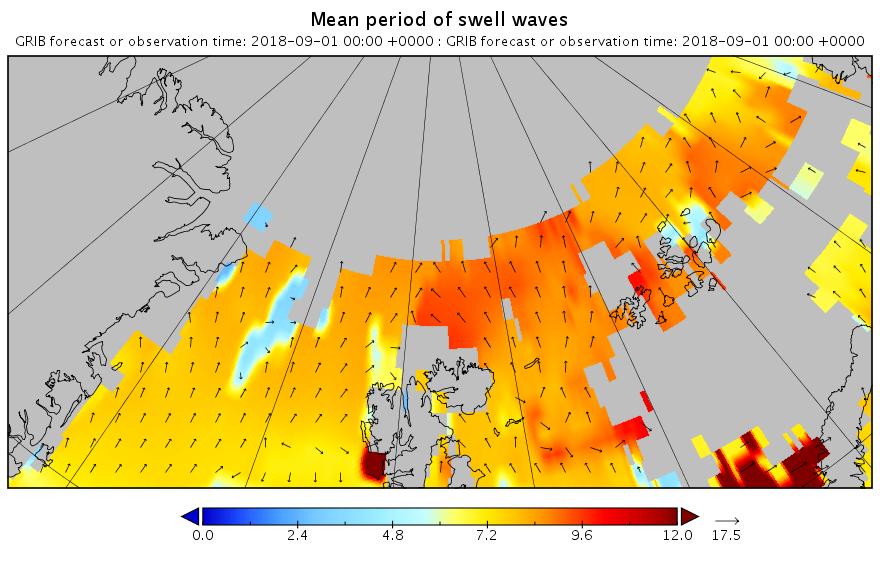
The barrage of assorted swells has begun. Here’s the “hindcast” from midnight last night UTC:
Now lets take a look at tomorrow’s forecast for the Laptev Sea. This is for 09:00 UTC:
Note once again the change of scale on the wave/swell height map. Nevertheless a 3+ meter swell heading over into the East Siberian Sea isn’t something you see every day.
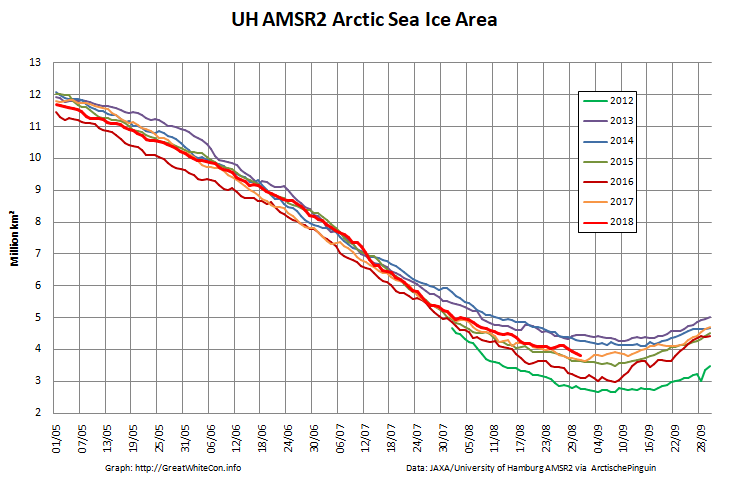
Now were into September the 2018 annual minimum extent can’t be too far away. Extent decline appears to have stalled. However “high res” AMSR2 area is currently falling fast, for the time of year at least:
[Edit – September 2nd]
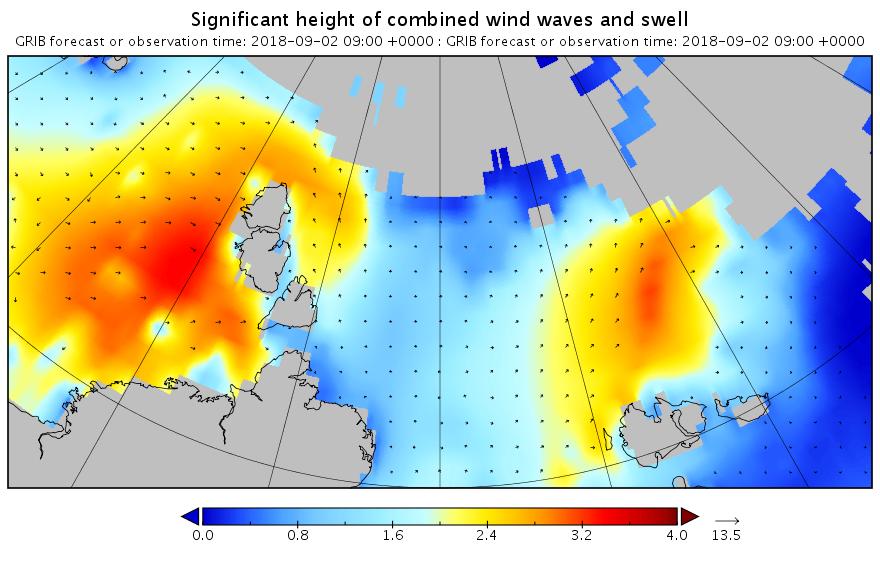
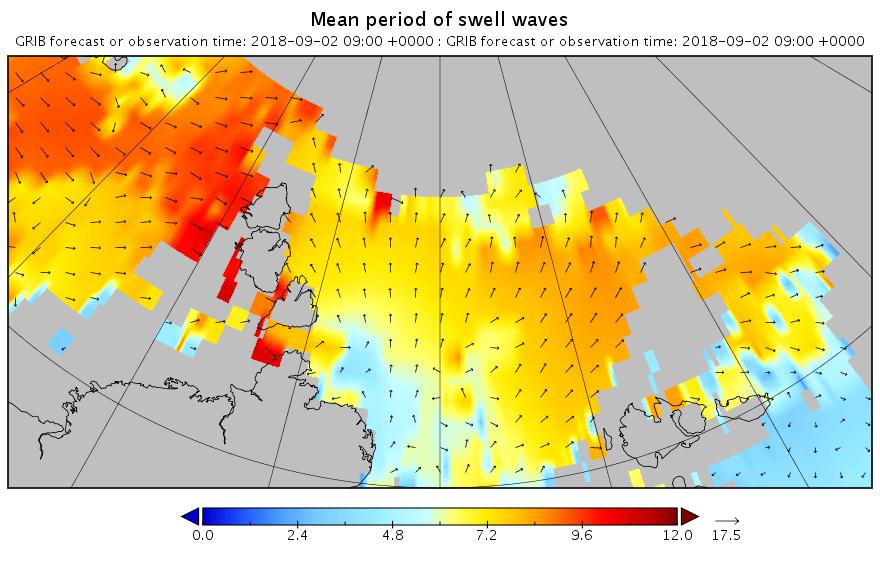
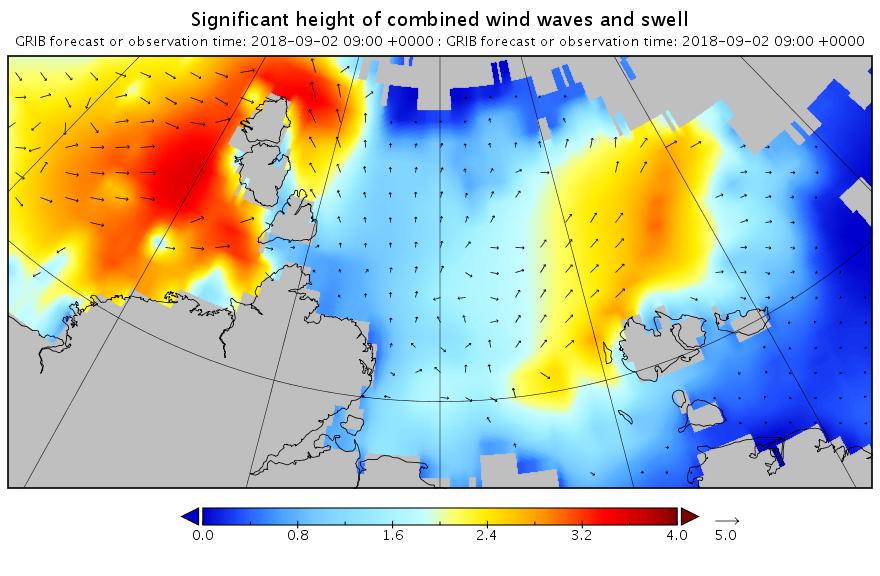
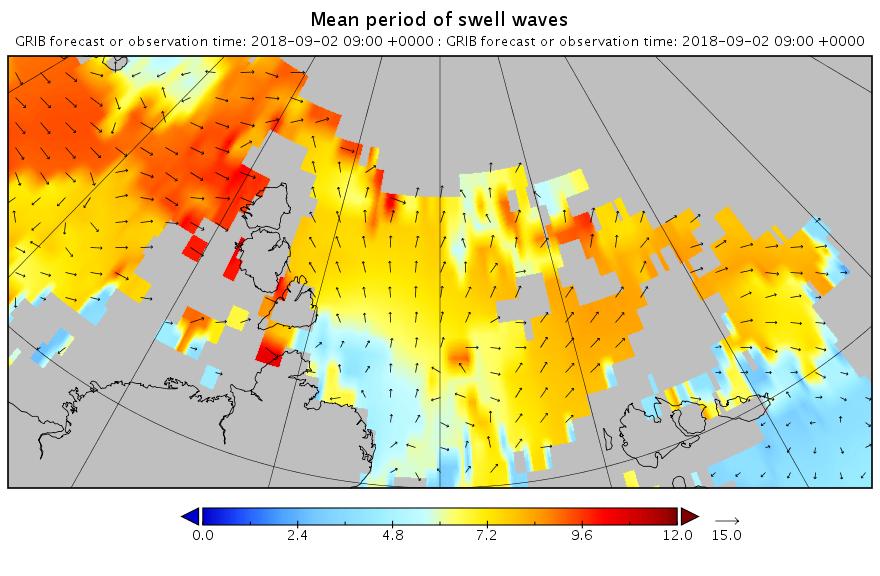
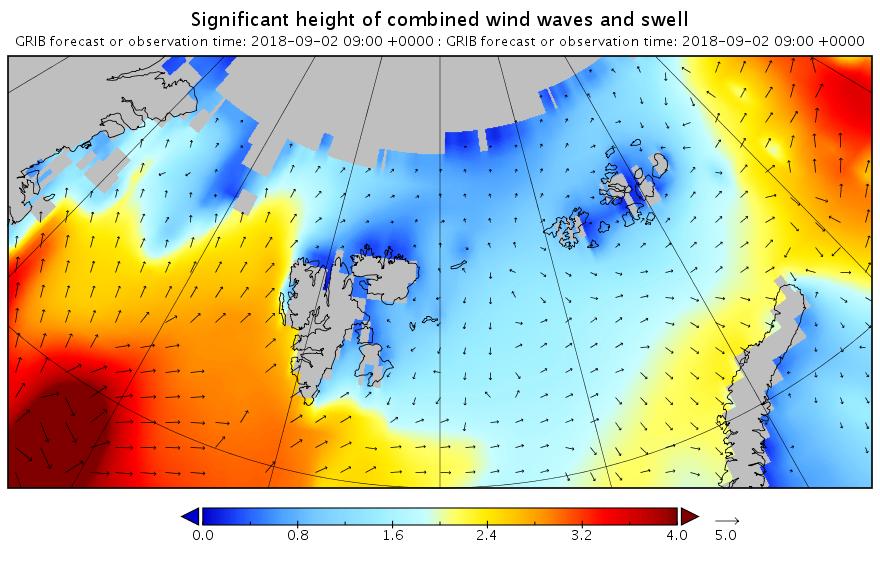
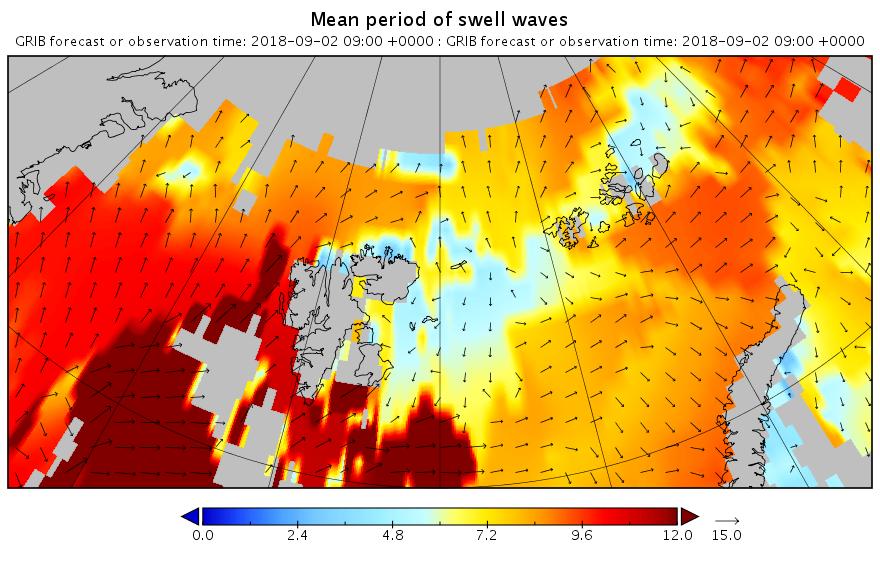
Here are the swell and period forecasts at midnight for round about now, 09:00 UTC:
All the seas between Greenland and the New Siberian Islands are awash with swells with a period of 8 second or greater. This is most unusual, to put it mildly!
[Edit – September 3rd]
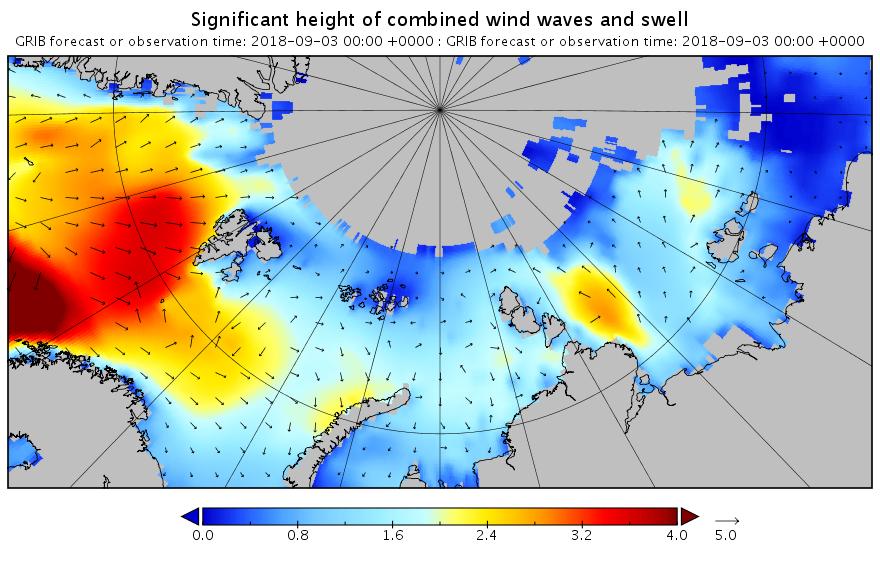
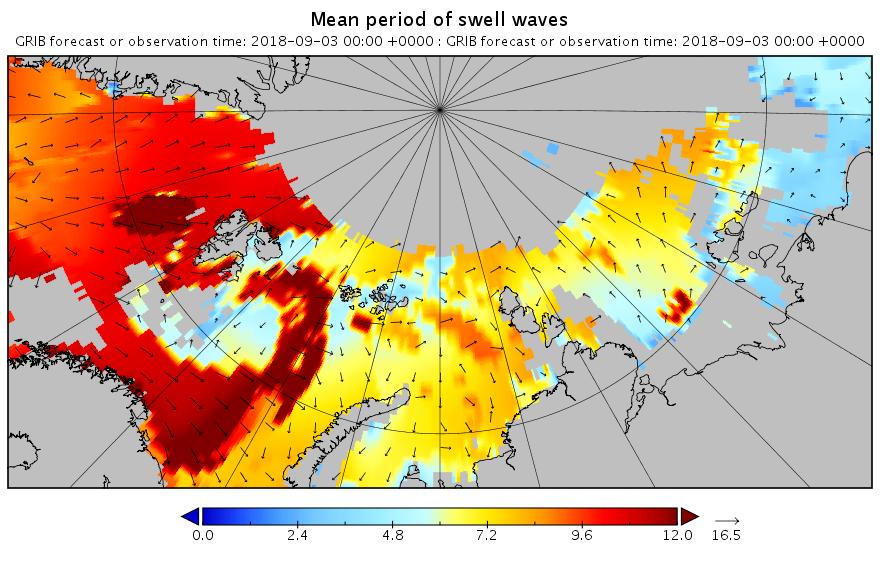
Here’s the WaveWatch III “hindcast” from midnight last night UTC for the Russian side of the Arctic Ocean:
There are still significant swells almost everywhere you look.
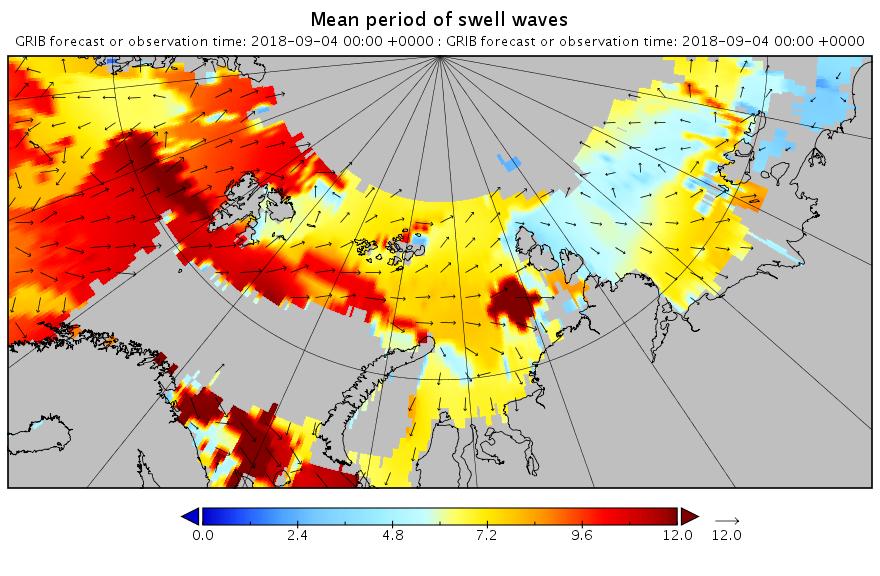
[Edit – September 4th]
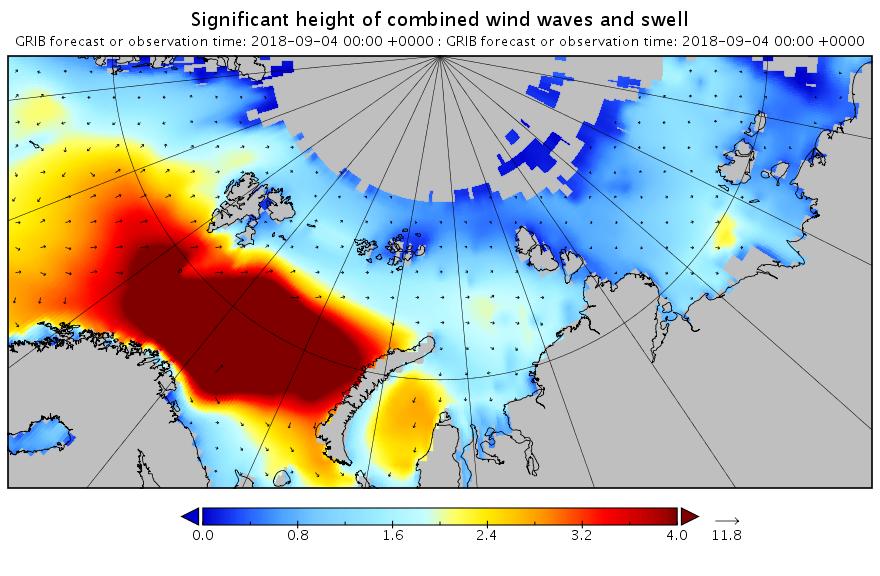
Using the same scales as yesterday, here’s today’s hindcast from midnight:
There’s still plenty of action in the Arctic Ocean!
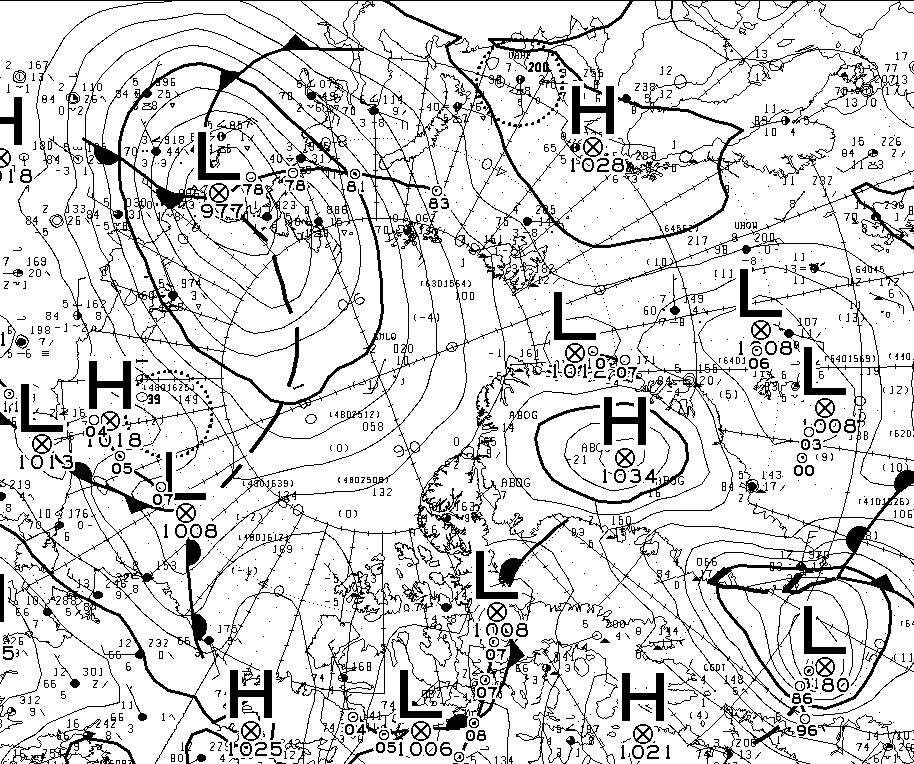
[Edit – September 5th]
Feel free to debate whether it merits the “Great” prefix, but this is how the early September 2018 Arctic cyclone has panned out. According to this morning’s Environment Canada synopsis the cyclone is centred near the coast of the Laptev Sea and is down to a MSLP of 977 hPa:
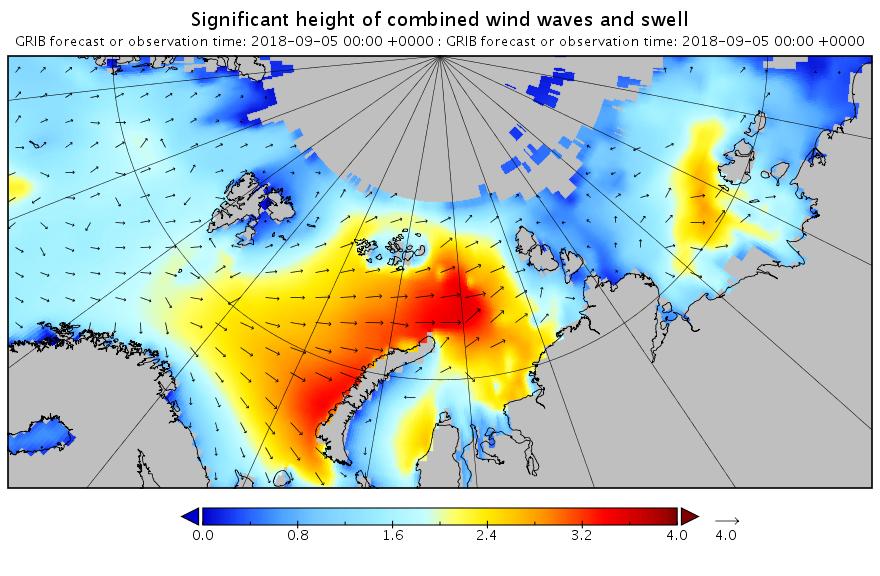
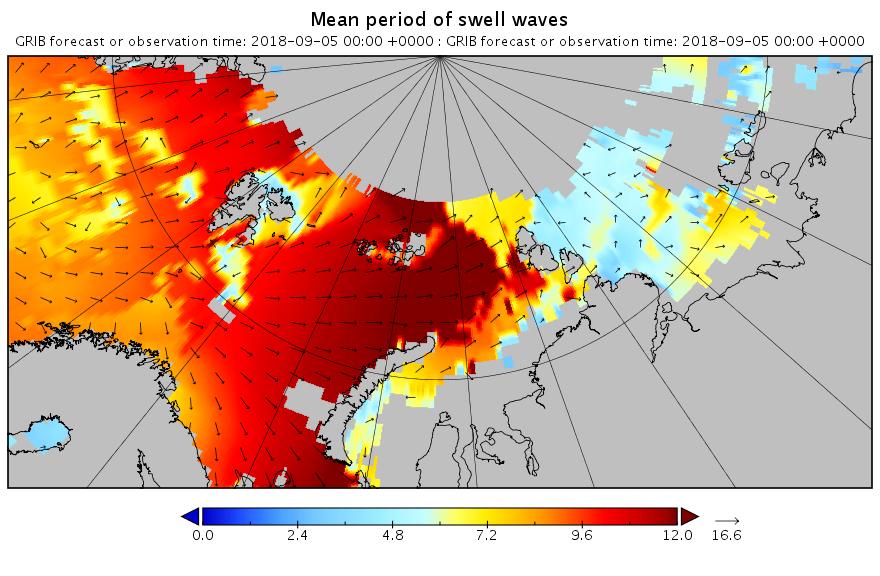
Here’s another WaveWatch III hindcast from midnight UTC:
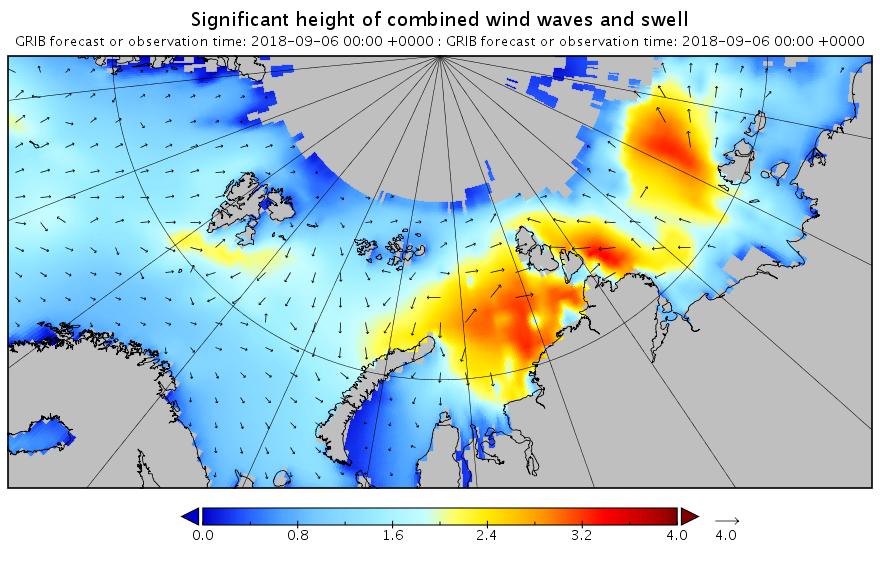
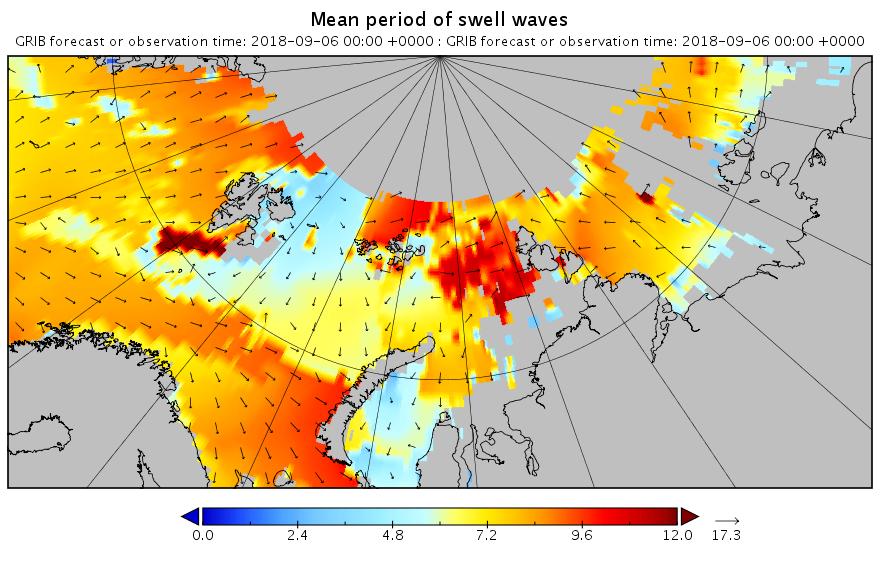
[Edit – September 6th]
Need I say more?
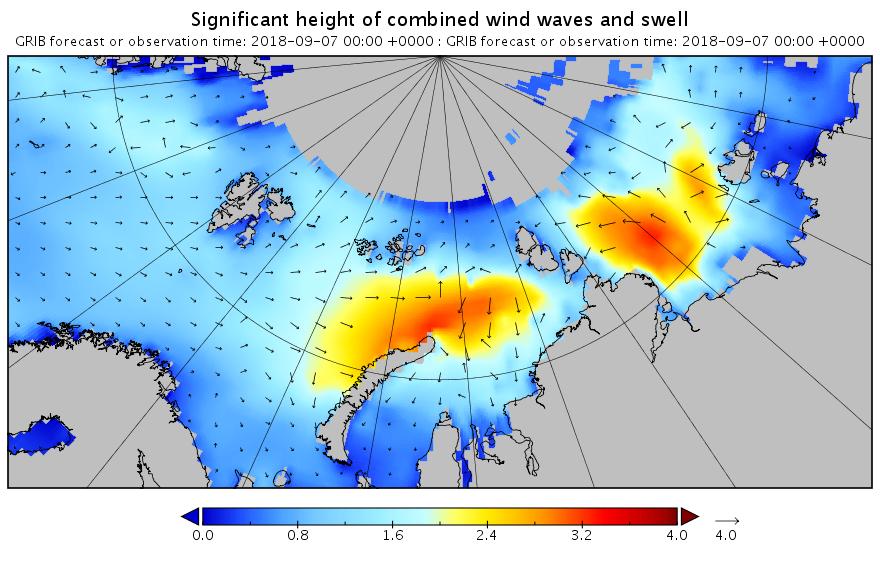
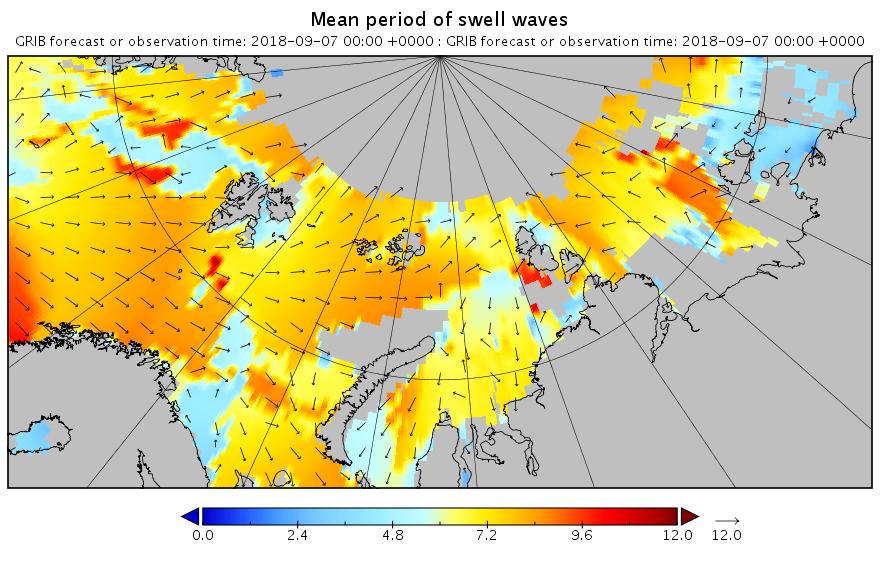
[Edit – September 7th]
The swell in the Fram Strait an Barents Sea is diminishing, but the period in the Laptev Sea is increasing now:
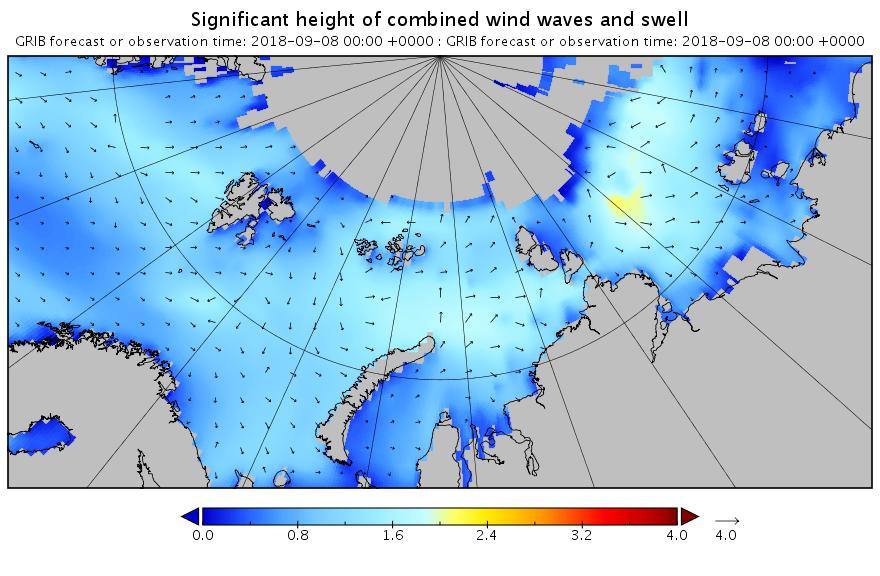
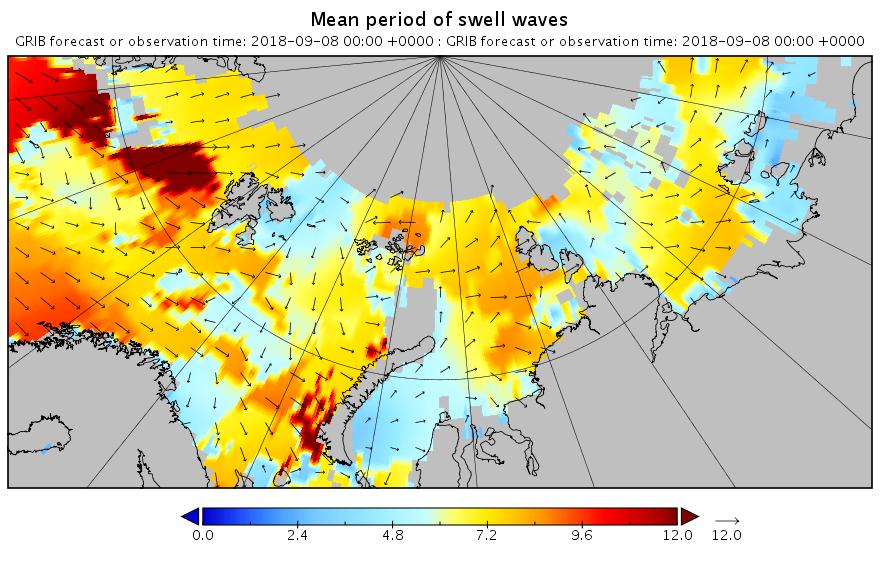
[Edit – September 8th]
All the wave activity in the Laptev Sea is diminishing. Here’s the hindcast from midnight:
Meanwhile things are warming up in the Chukchi and Beaufort Seas. Here’s the forecast for midnight tonight:
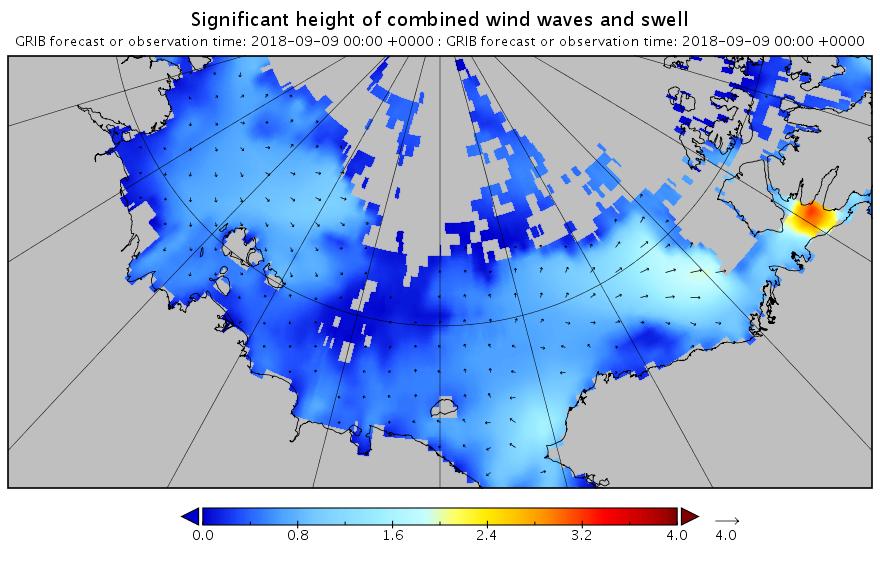
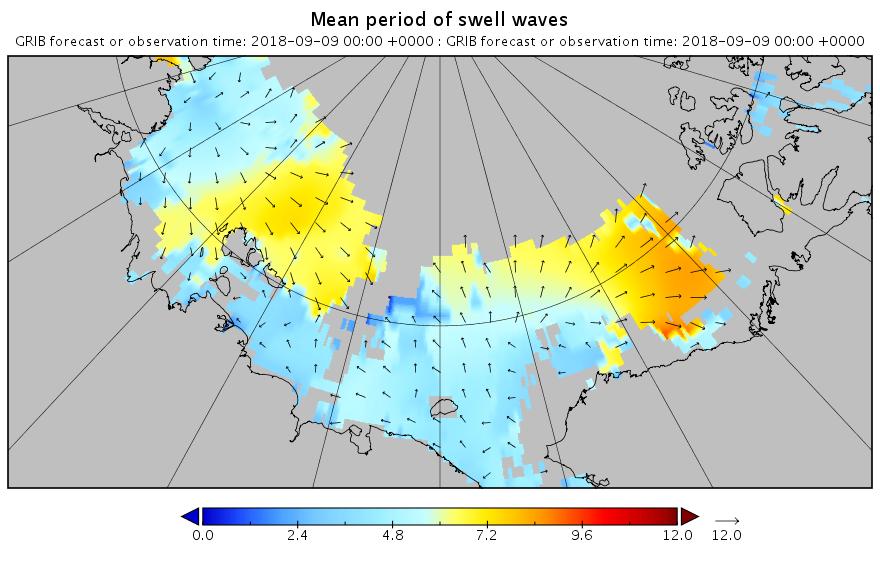
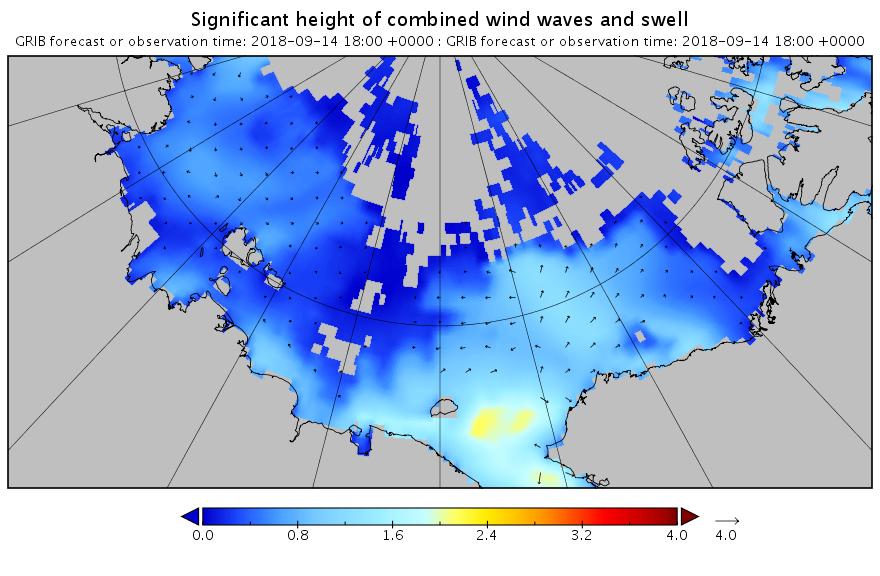
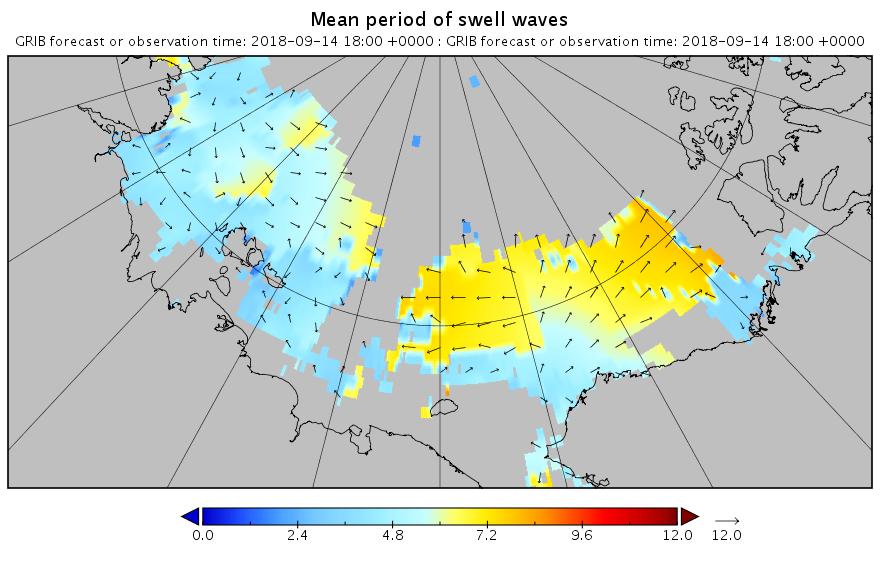
[Edit – September 9th]
Here’s the hindcast for this morning’s swell in the Beaufort Sea:
This is currently a long way into the future and hence may not verify in practice. However any pulse of swell is currently forecast for September 13th:
Yesterday I found myself in conversation with Nigel and “Steve” on Twitter about NOAA’s recent report on Arctic temperatures and the seemingly unrelated topic of Russian icebreakers. Apparently Nigel has been perusing “Steve’s” recent railing against NOAA’s “Red Hot Arctic” in 2016 on his “Deplorable Client Science” blog. Here’s how my conversation with Nigel went:
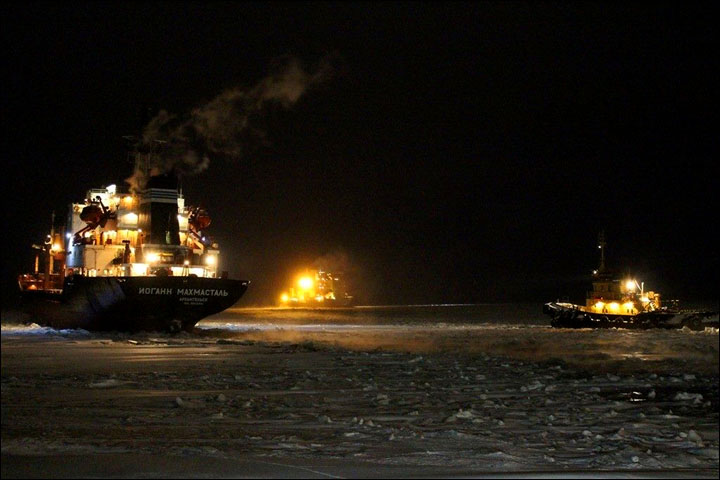
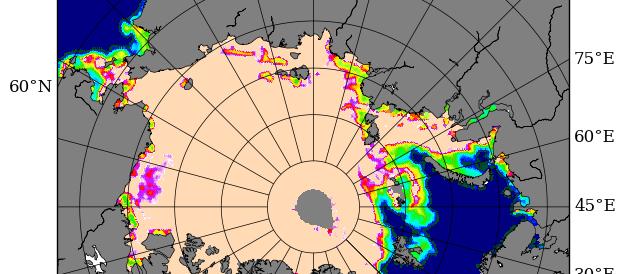
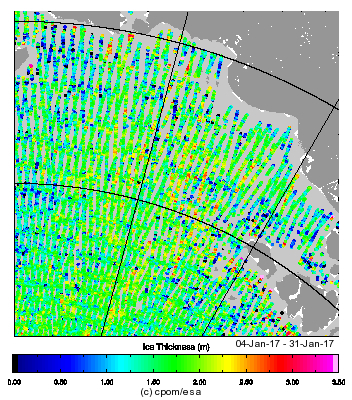
It appears that Nigel believes that an image like this:
is far more relevant than an image like this:
when it comes to determining the thickness of “the ice up in the north of Russia”!
Then of course there was my “conversation” with “Steve” after he butted in on my “debate” with Nigel. It went like this:
Just like Nigel, “Steve” still hasn’t got around to commenting on my map of Arctic sea thickness or explaining the significance of 2 Russian icebreakers NOT stuck in the East Siberian Sea.
The Journal of Alternative Facts article guidelines insist on peer review by politicians, so I’ve invited a few local, national and international politicians to comment on my draft paper:
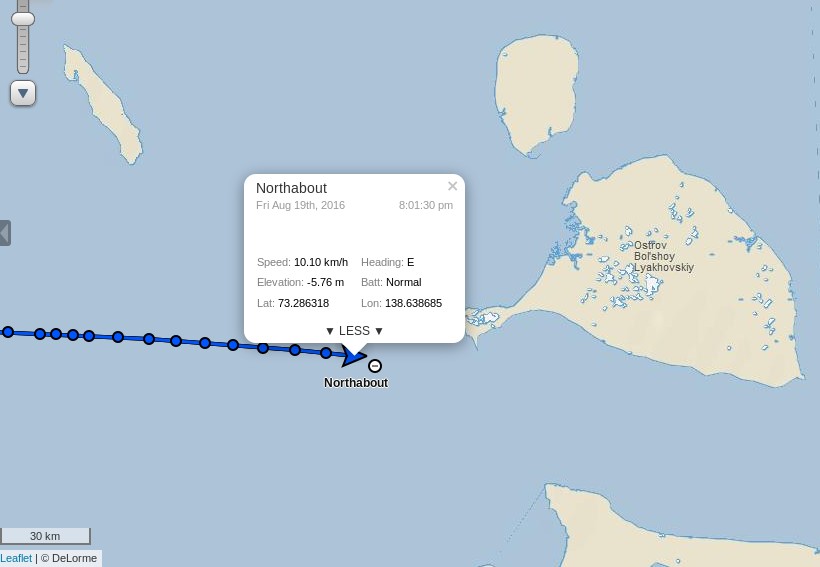
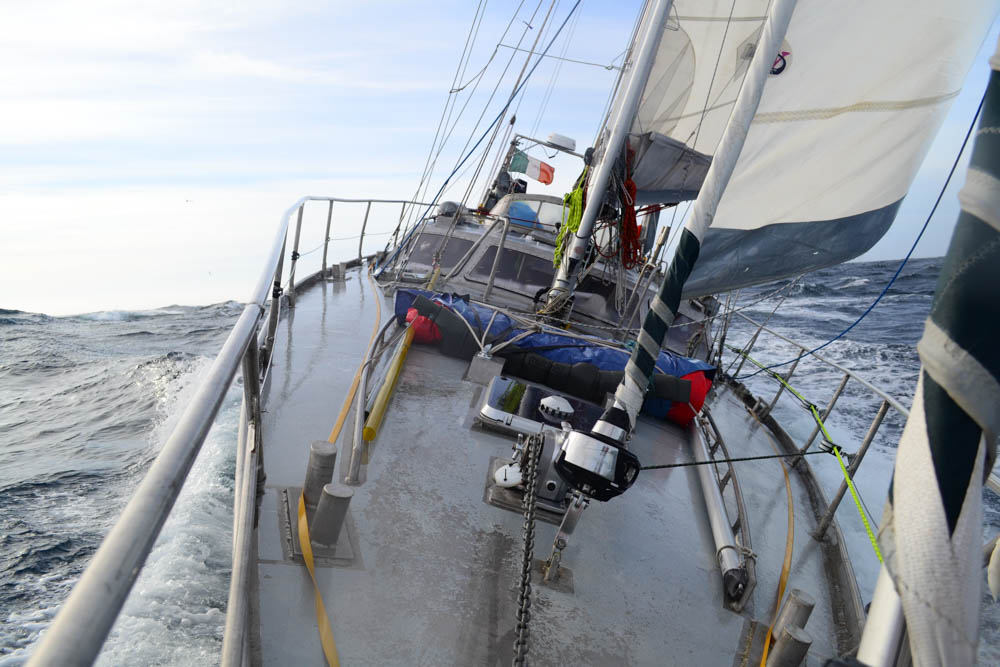
It’s time to open another chapter in the continuing adventures of Northabout. The Polar Ocean Challenge team have been plagued by sea ice along their route across the Laptev Sea, but currently they are hurrying towards the exit into the East Siberian Sea via the Dmitry Laptev Strait:
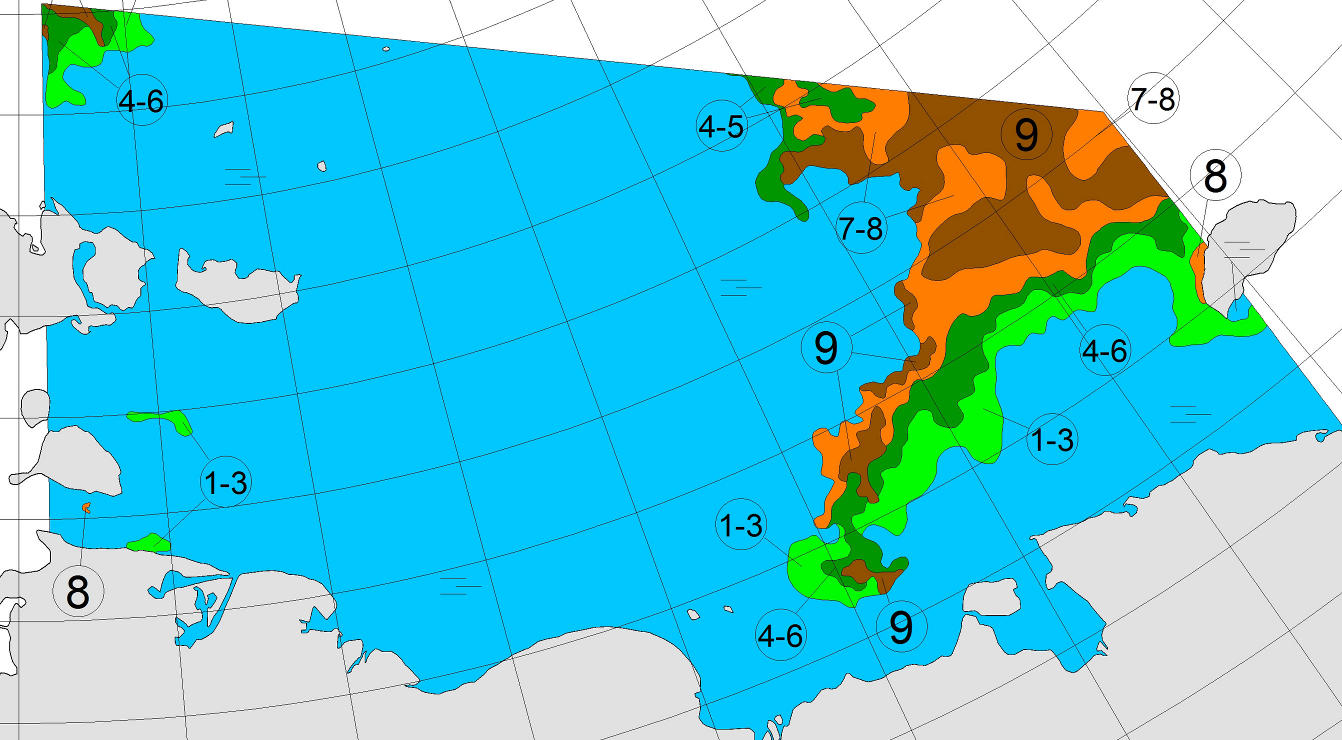
The latest chart of sea ice in the East Siberian Sea from the Arctic and Antarctic Research Institute suggest they should now have plenty of (comparatively!) plain sailing ahead of them:
Certain quarters of the cryodenialosphere have been questioning the plucky little yacht’s ability to make it through the Northwest Passage before it freezes up once again in the Autumn. As a crude reality check on that assertion let’s see how previous successful single season polar circumnavigations fared in that regard. The international date line runs through the Bering Strait, and effectively defines a boundary between the Northern Sea Route and the Northwest Passage. In 2010 Børge Ousland and Thorleif Thorleifsson in the catamaran Northern Passage crossed the date line on September 3rd:
Let’s wait and see when Northabout manages to pass that milestone, before heading to their next scheduled port of call at Barrow in Alaska.
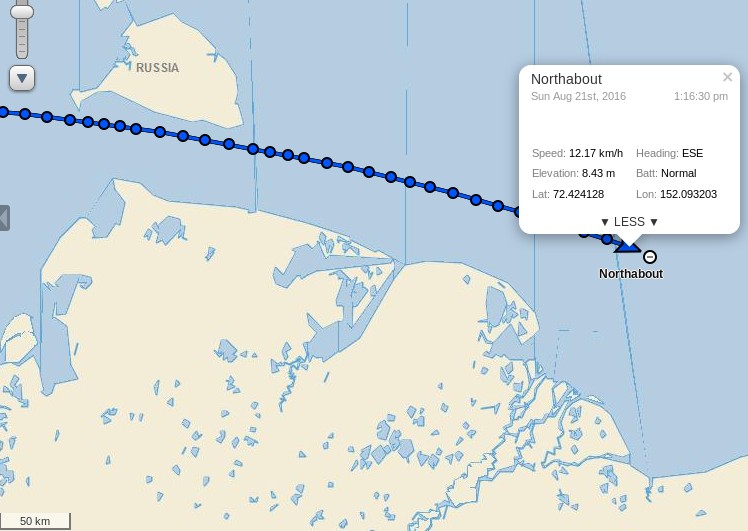
[Edit – August 21st]
Northabout has spotted some more sea ice, this time in the Dmitry Laptev Strait. Presumably the small area shown in the AARI chart above? According to the latest “Ship’s Log”:
Well slowly making progress, and now into a new sea, East Siberian, Looks the same to be honest. Saw a ship,on the AIS , but couldn’t see it with the fog. Went between the Islands. We had a large patch of 8/10ths ice in the middle, but managed to keep north of it. Along the coast you could again see the remnants of an old Polar station. What a vast coast to look after.
Just as things were getting into a rhythm, the engine is over revving. We are so close but so far out here. My stomach is sometimes in my mouth, Comrades trying to work it out. If not, is a slow sail from here to Alaska.
The reported engine trouble doesn’t seem to have slowed Northabout down. She crossed 150 east earlier this morning and is now passing the delta of the Indigigirka River:
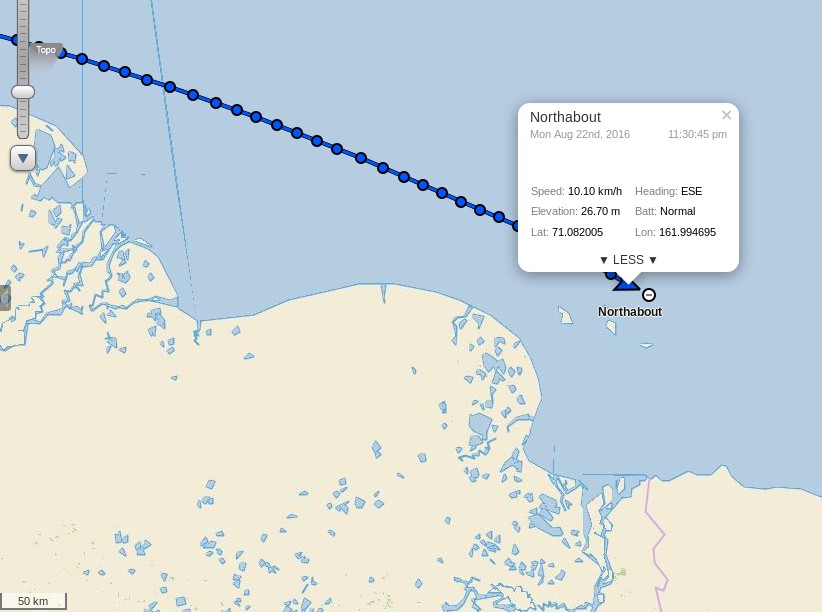
[Edit – August 22nd]
Her engine has been serviced, and Northabout continues to make good progress. She’s crossed 160 east, and is now passing the delta of the Kolyma River:
We’ve got enough wind to put the staysail out and the skies are clear. I think quite a lot of how I was feeling may have been that I hadn’t got any sunshine for over two weeks, the last couple of days however have been warm(ish) and bright. I at least am coming dangerously close to feeling actually happy, I don’t know about anyone else… Provided we continue like this we should be in Point Barrow in under a week.
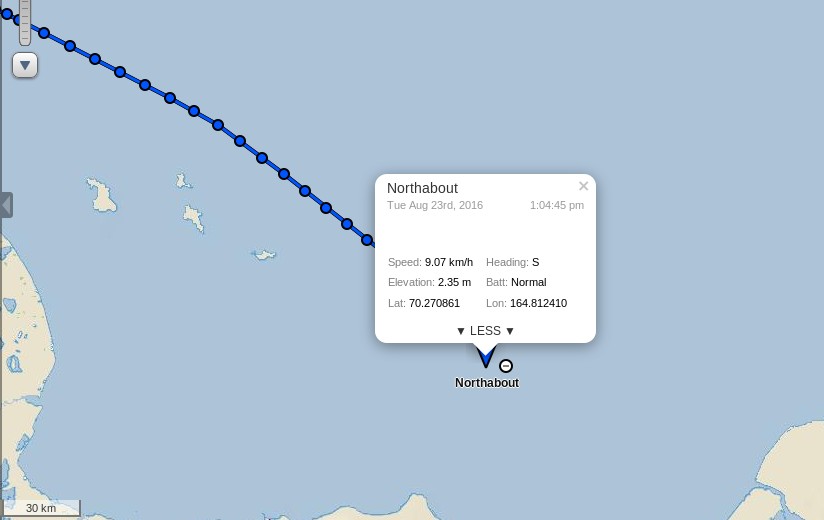
[Edit – August 23rd]
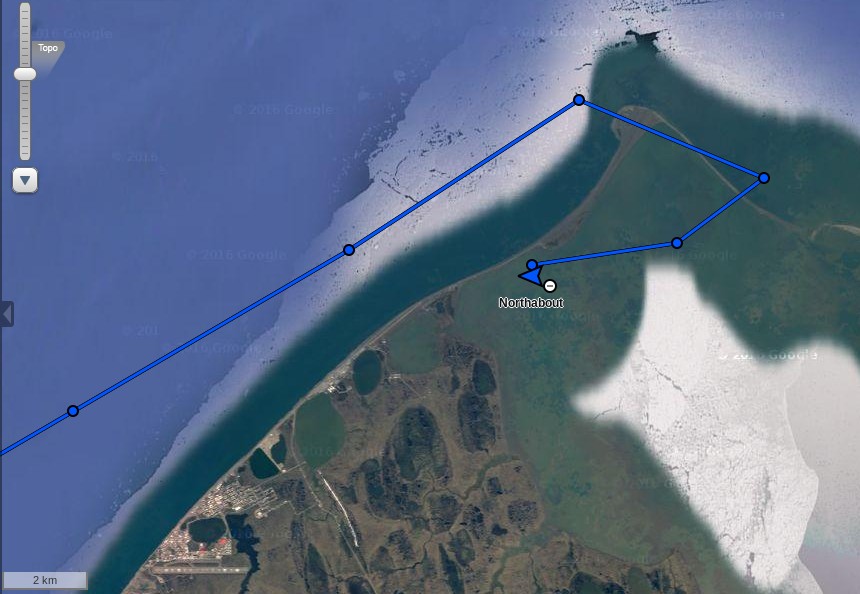
Northabout looks to be turning south:
Presumably that is to skirt the patch of high concentration sea ice in their path, rather than try to break through the lower concentration area to the north (which is towards the bottom of this image!):
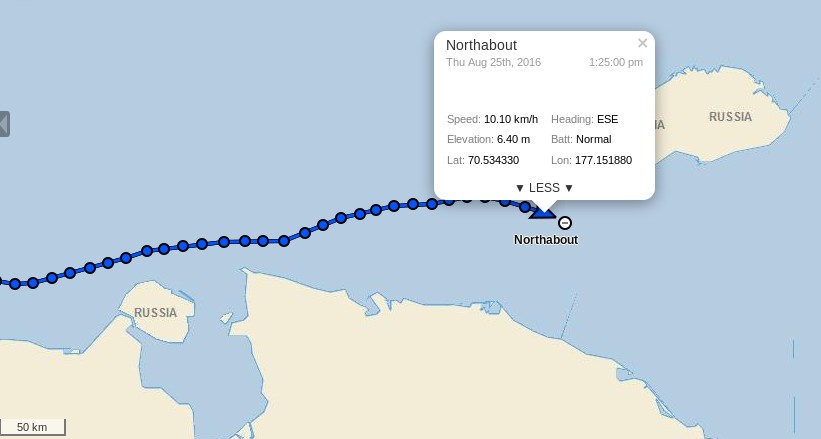
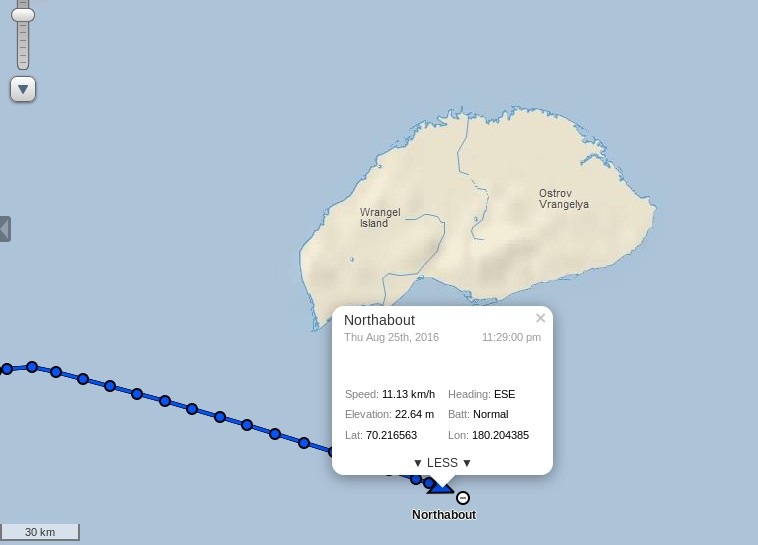
[Edit – August 25th]
Northabout is currently closing in on “the edge of the world” at 180 degrees east and/or west:
Her crew aren’t entirely happy with the speed at which that is happening at present though:
A long slog of a day. Very choppy seas which makes living onboard difficult, especially sleeping, when you can be fast asleep and suddenly wake up in mid air.
The wind we had was a head wind, so slow going. Getting to the edge of the World is proving tiresome.
Our track to get the best wind is towards the ice, and north east, hoping this will change during the night, and bring us back south to our waypoint.
A long slog in the Chukchi Sea. Its renown for its wild weather and seas. With rising winds now in the 25/30 knots, we have had a bumpy ride, but fast and in the right direction.
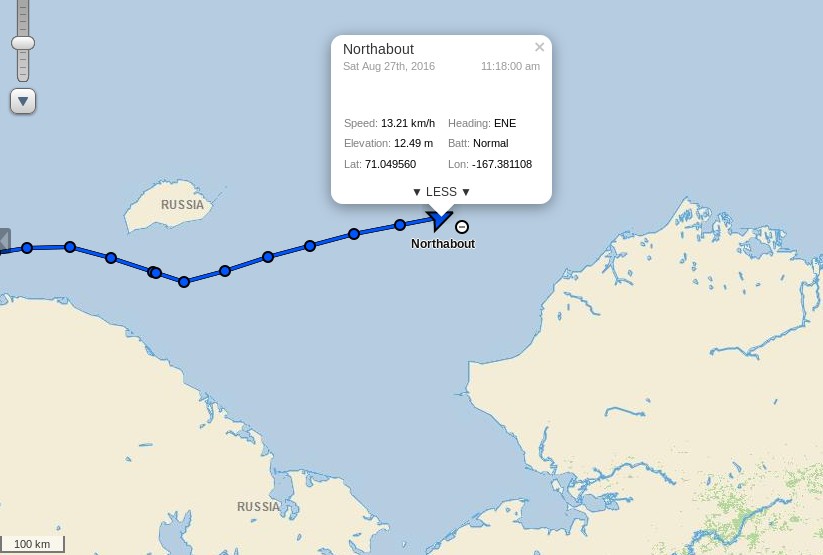
Well, well, we passed the date line and the W 168 58 .620 at 16.57 boat time, that is the point we can inform the Russian Authorities that we have finished their Northern Sea Route, and we no longer have to report to them daily. I will celebrate this milestone when we get to Point Barrow. It’s only just sinking in what we have all done.
Next stop Barrow, and after that Northabout takes on one of the Southern routes through the NorthWest Passage. It looks like she’ll have much more difficulty spotting some sea ice than on the first half of her polar circumnavigation!
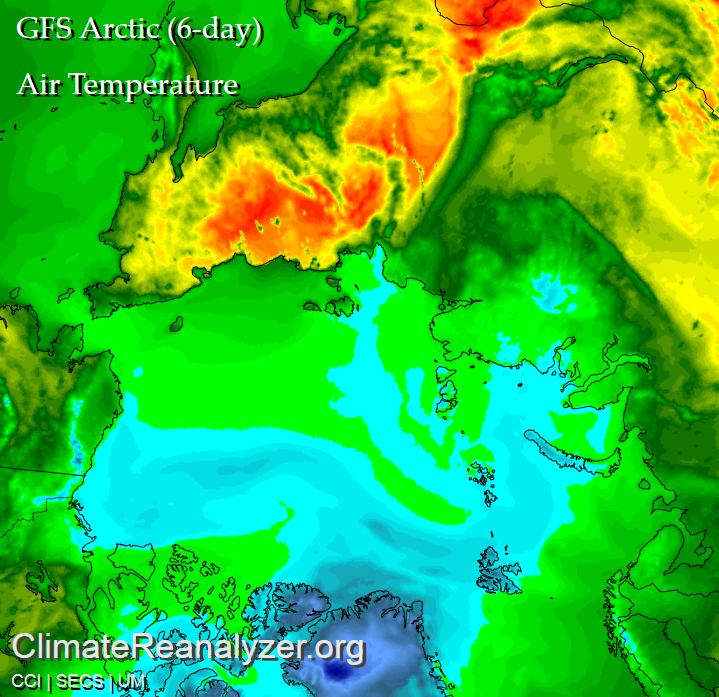
June has arrived, and according to the Great White Con Arctic sea ice calendar that means the summer surface melting season has started. Once July arrives bottom melt should have started in earnest too, but for now let’s stick to the surface. Here’s the Climate Reanalyzer map of Arctic surface air temperatures at 06:00 UTC this morning:
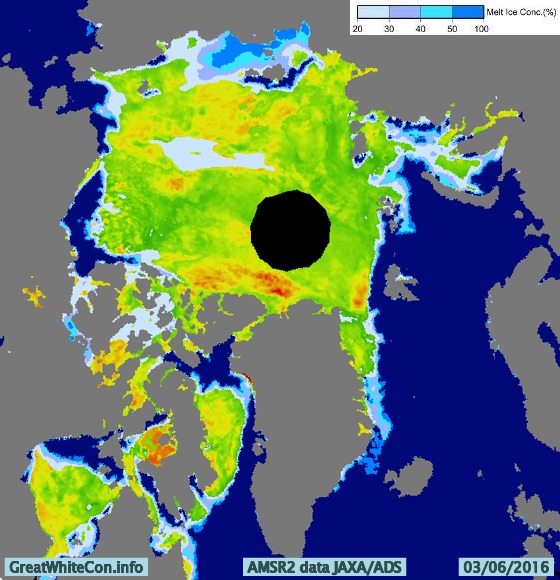
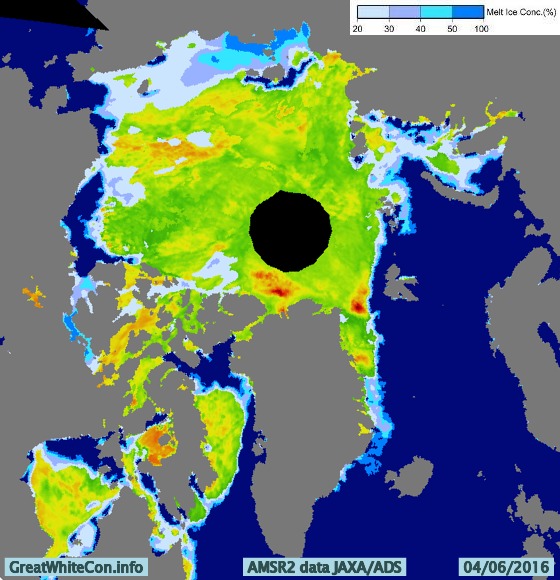
Green areas are above 0 degrees Celsius, and bear in mind that the melting point of sea ice is at around -1.8 degrees Celsius. The red areas near the East Siberian Sea coast are 25-30 degrees Celsius. Given those sort of temperatures you might well think that some snow and/or ice in that area would be melting, and you would be correct! Here is the Japan Aerospace Exploration Agency’s current map of Arctic surface melting:
The assorted shades of blue/grey show the areas where surface melting is already underway. Whilst this melting is taking place you may possibly read in some quarters of the cryodenialosphere that “There is almost no melting going on in the Arctic“. The authors of such nonsense evidently don’t know their proverbial Arctic arse from their elbow.
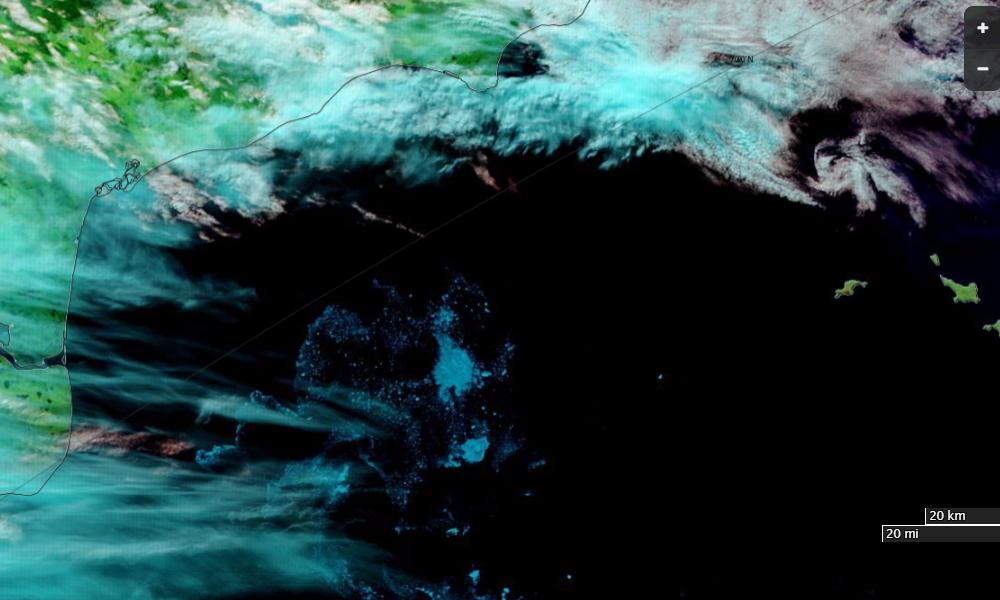
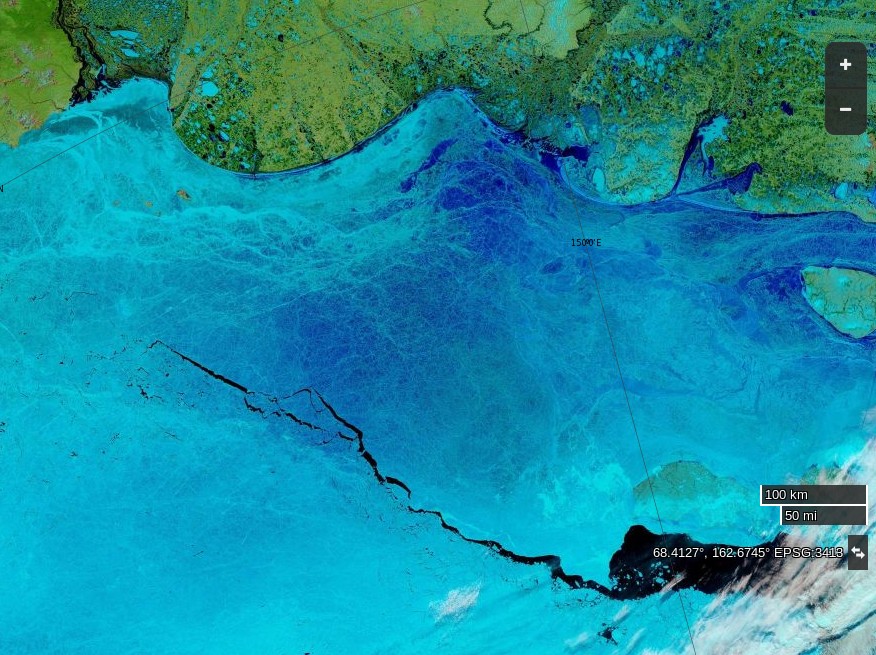
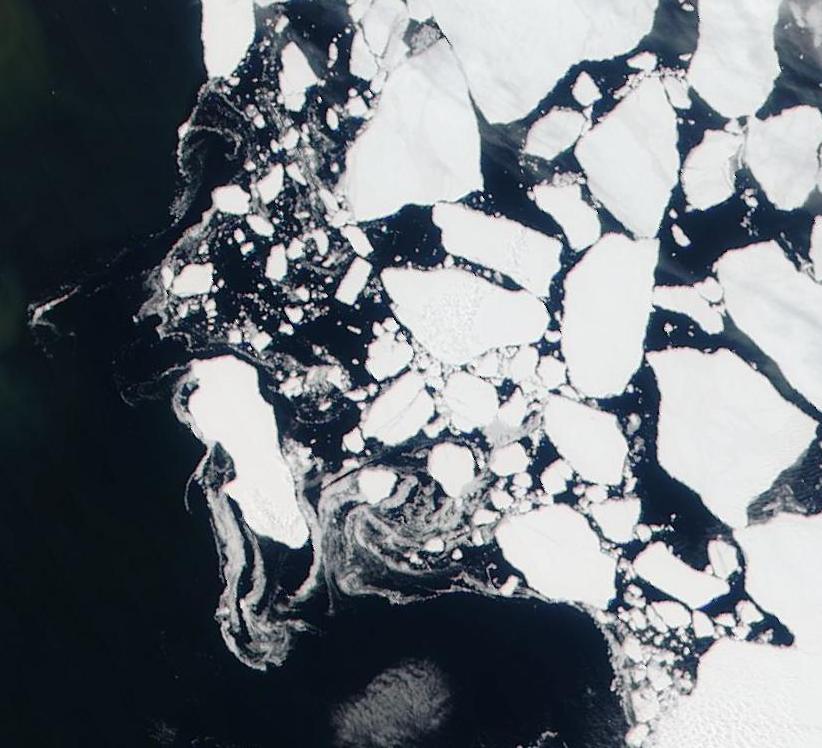
Here’s how today’s surface melting in the East Siberian Sea looks from space:
NASA Worldview “false-color” image of the East Siberian Sea on June 4th 2016, derived from the MODIS sensor on the Terra satellite
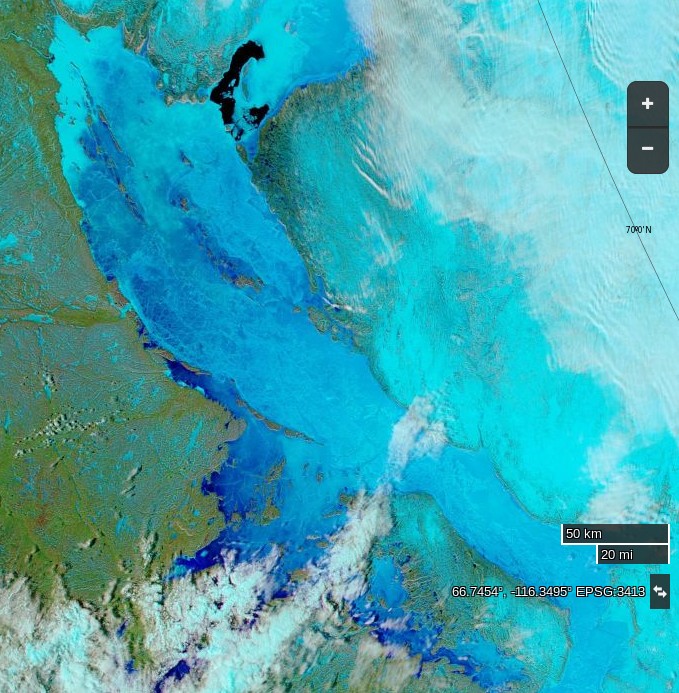
Meanwhile over on the other side of the Arctic, here’s yesterday’s surface melting on “Amundsen’s Route” through the Northwest Passage:
NASA Worldview “false-color” image of the Northwest Passage on June 3rd 2016, derived from the MODIS sensor on the Aqua satellite
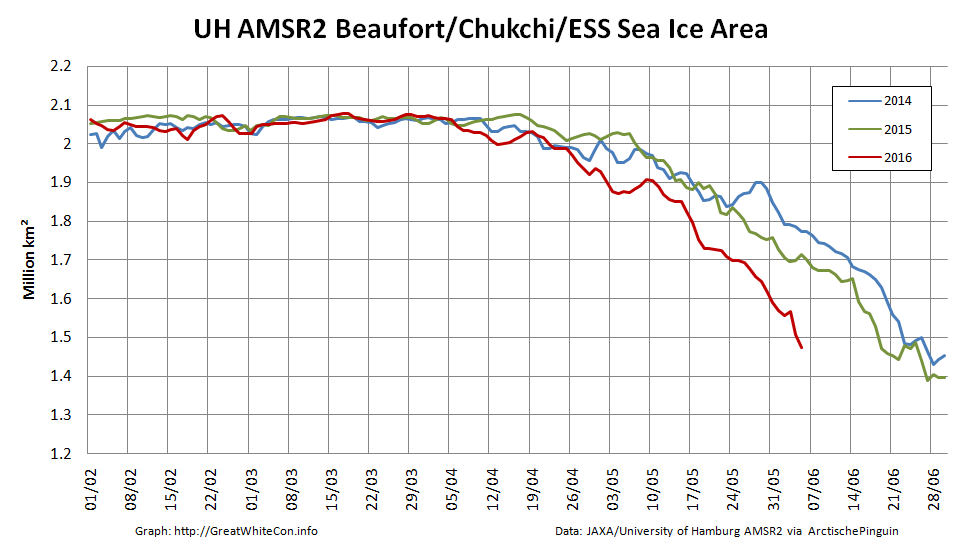
By way of further illustration of the fact that Arctic sea ice is and has been melting, here is a graph of the current area of sea ice in the all important central area of the Arctic Basin, courtesy of “Wipneus” at Arctische Pinguin:
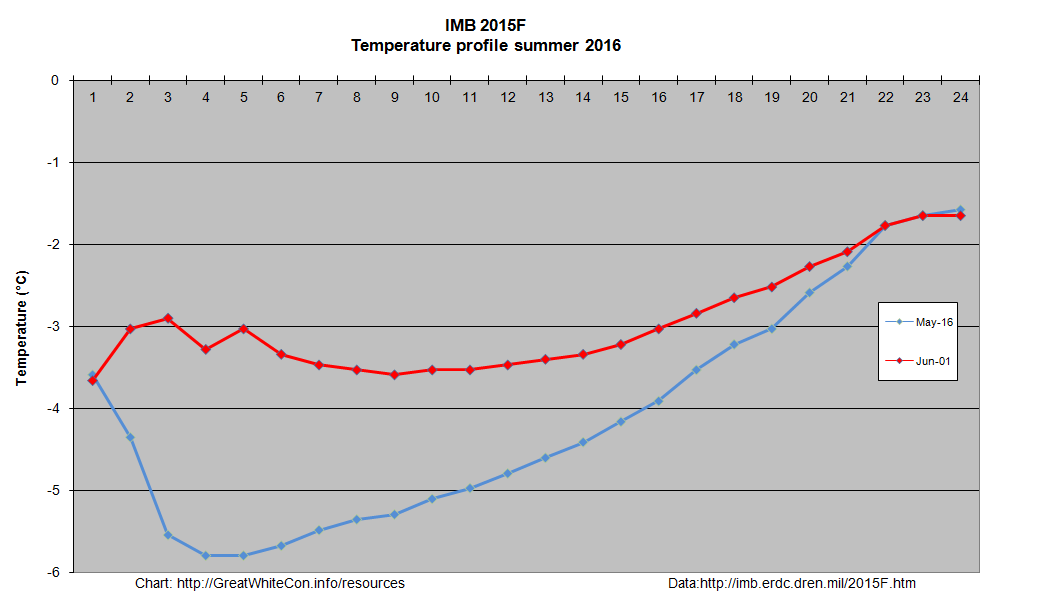
The areas included are the Central Arctic Basin, plus the Beaufort, Chukchi, East Siberian and Laptev Seas. The above zero temperatures are forecast to spread across the Central Arctic Basin early next week, whereupon it will be very interesting to discover what happens to the snow around the single ice mass balance buoy currently transmitting near real time data. Here is the current temperature profile for the sea ice underneath IMB buoy 2015F:
The current conditions there are summarised this morning as:
Pos: 82.00 N, 147.45 W
Air Temp: -3.74 C
Air Pres: 1007.42 mb
Snow depth: 21 cm
Ice thickness: 202 cm
Normally by now there would also be a number of webcams beaming back pictures from across the sea ice in the Arctic Basin. However according to NOAA:
Due to funding constraints, it was not possible to deploy new Web Cams in Spring 2016, but deployments in Spring 2017 are planned.
Three of the camera carrying O-Buoys also seem to have failed over the winter, which leaves us with only O-Buoy 14 to reveal the forthcoming melt to us:
O-Buoy 14 image from June 2nd 2016
O-Buoy 14 is currently colocated with Ice Tethered Profiler 89, the yellow object in the foreground, at 77.49° N, 153.92° W, to the north of the Beaufort Sea. ITP 89 measures the temperature and salinity of the water beneath the sea ice and revealed this the last time it managed to take a measurement, a month or so ago:
If you examine the extreme right hand edge of the charts carefully you will no doubt note that the water underneath the ice has recently become both warmer and saltier.
Watch this space!
[Edit – June 5th 2016]
The latest JAXA/ADS map shows that the area of sea ice undergoing surface melting has increased since yesterday, particularly over the Chukchi Sea:
The recent clouds over the Beaufort Sea cleared yesterday. Here’s a close up view of the open water between the big floes from the Suomi satellite:
This website uses cookies to improve your experience. We'll assume you're ok with this, but you can opt-out if you wish. Cookie settingsACCEPT
Privacy & Cookies Policy
Privacy Overview
This website uses cookies to improve your experience while you navigate through the website. Out of these, the cookies that are categorized as necessary are stored on your browser as they are essential for the working of basic functionalities of the website. We also use third-party cookies that help us analyze and understand how you use this website. These cookies will be stored in your browser only with your consent. You also have the option to opt-out of these cookies. But opting out of some of these cookies may affect your browsing experience.
Necessary cookies are absolutely essential for the website to function properly. This category only includes cookies that ensures basic functionalities and security features of the website. These cookies do not store any personal information.
Any cookies that may not be particularly necessary for the website to function and is used specifically to collect user personal data via analytics, ads, other embedded contents are termed as non-necessary cookies. It is mandatory to procure user consent prior to running these cookies on your website.