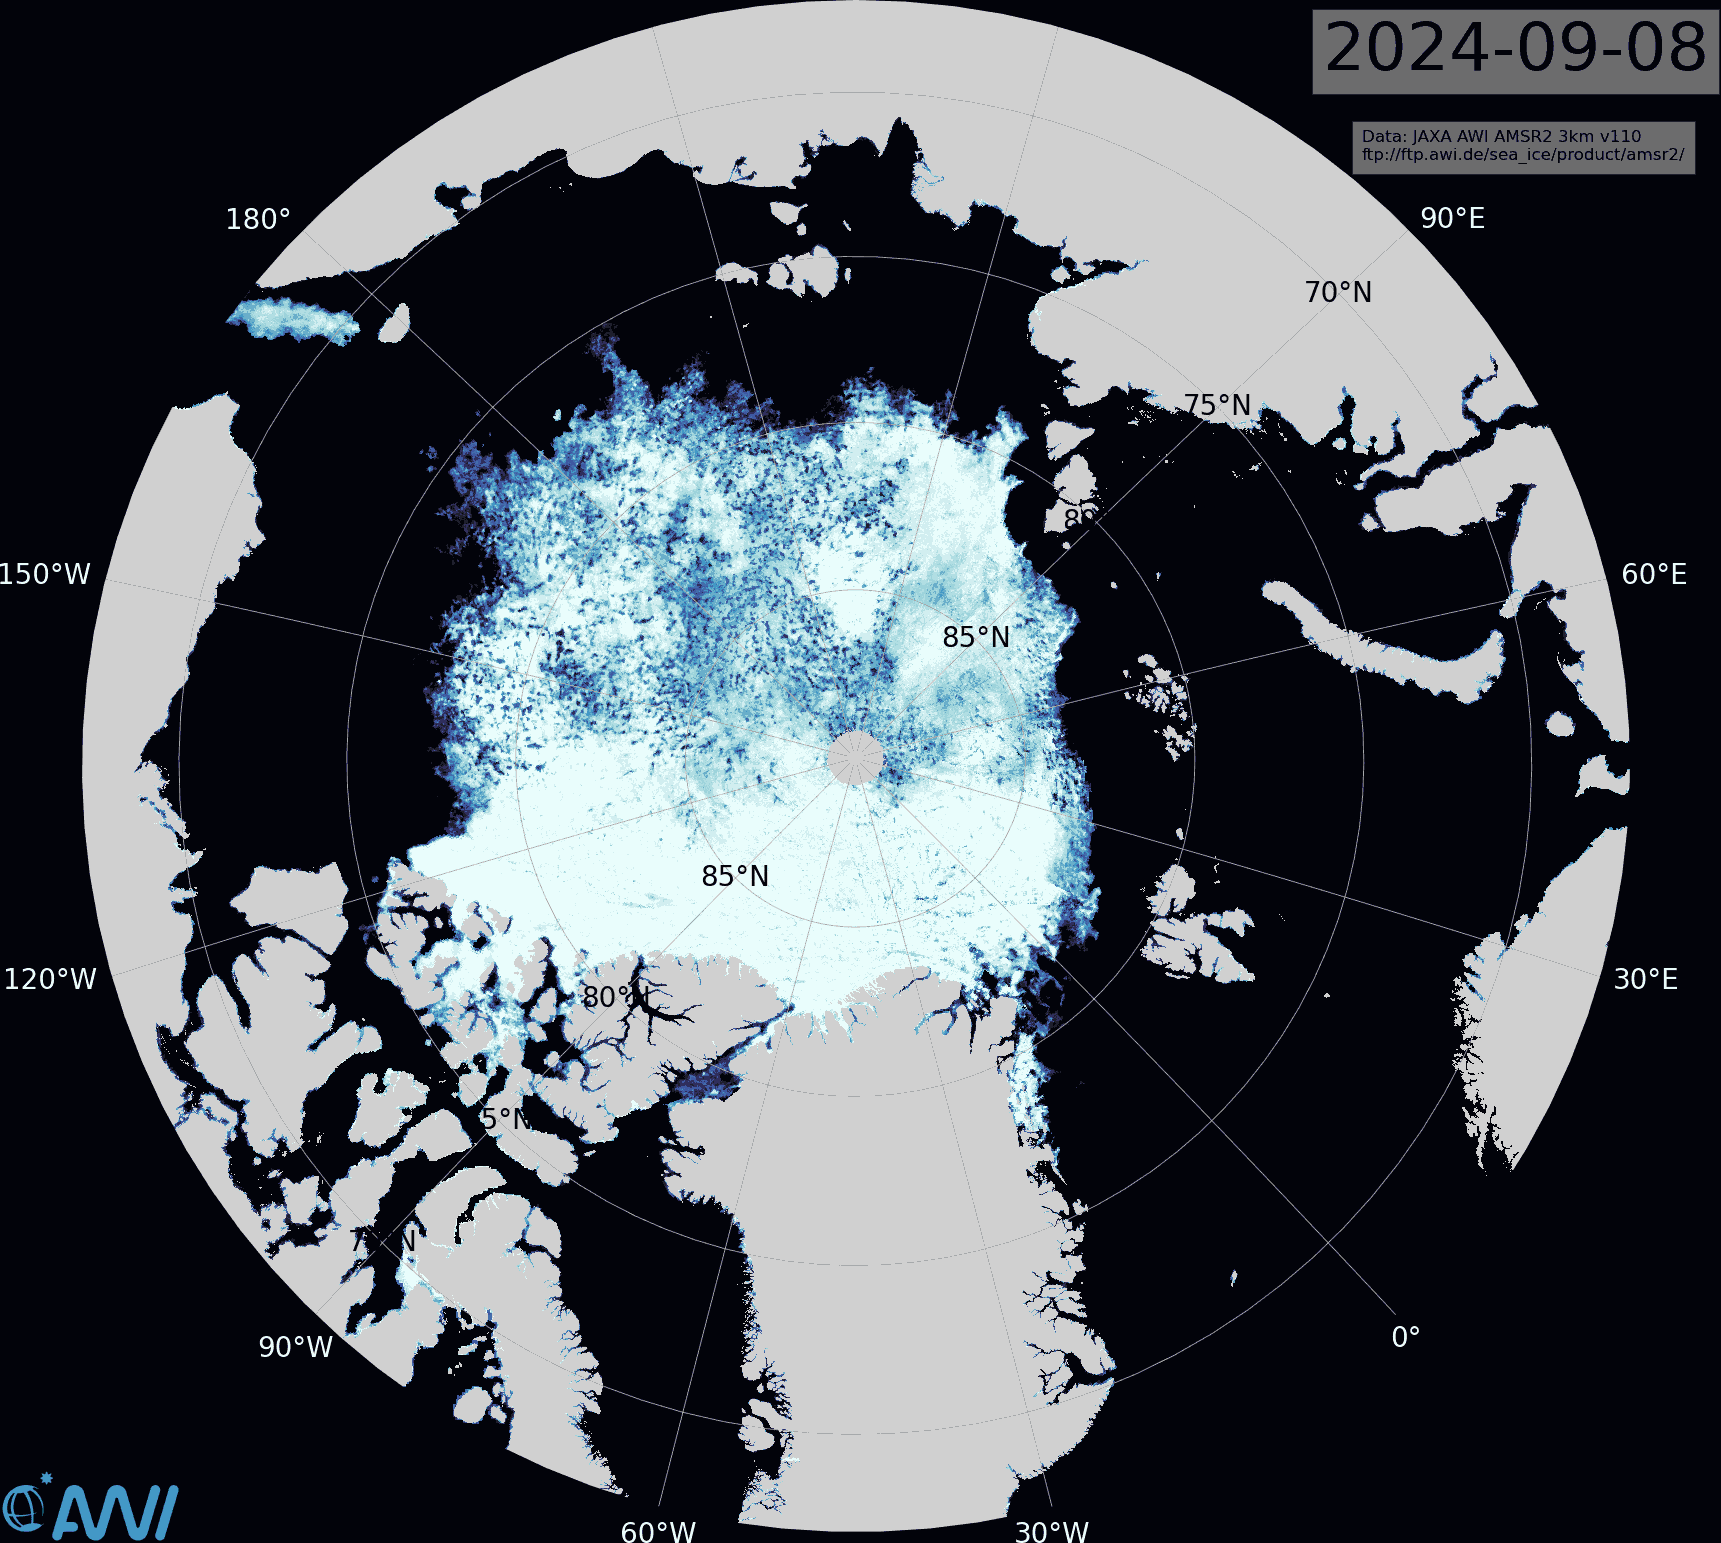
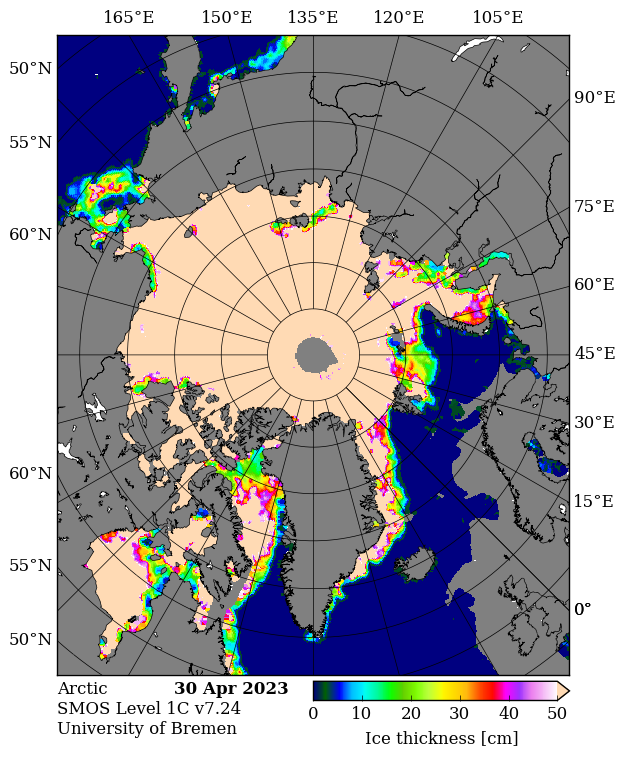
The JAXA extent graph is currently not updating, so let’s begin this month with the latest AMSR2 sea ice concentration map from the Alfred Wegener Institute. Click the image to see a ~10 Mb animation of the last four weeks:
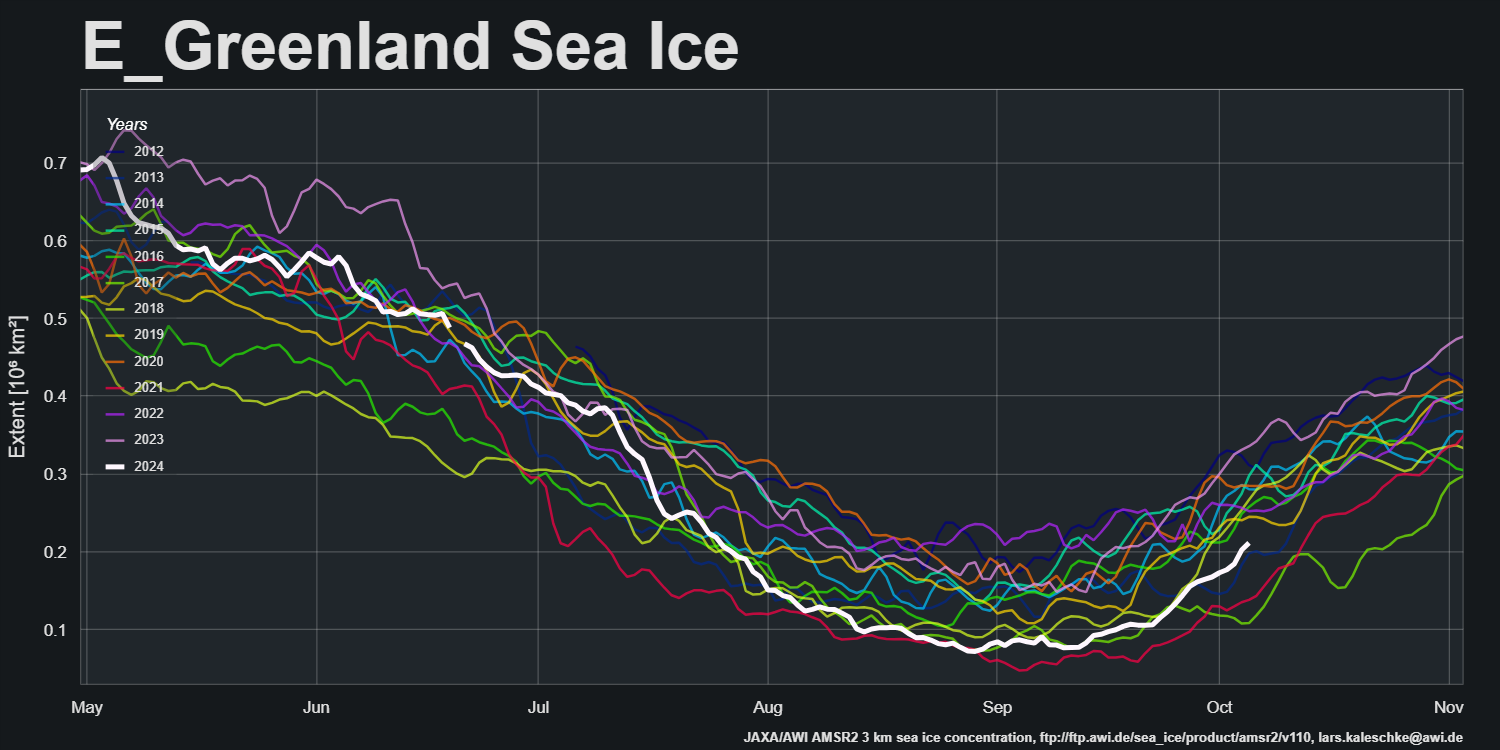
Note in particular the restart of export into the East Greenland Sea via the Fram Strait:
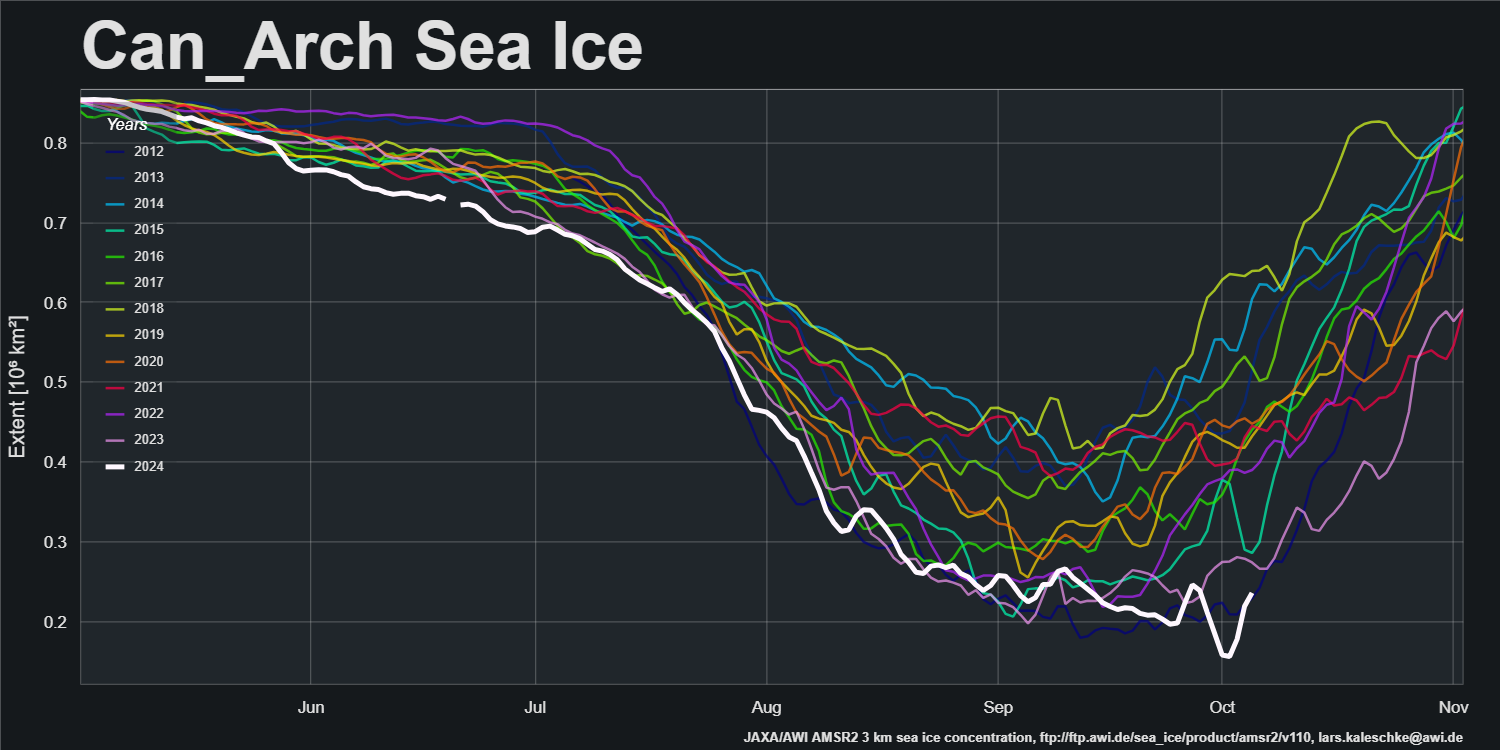
and the movement of ice within the Canadian Arctic Archipelago:
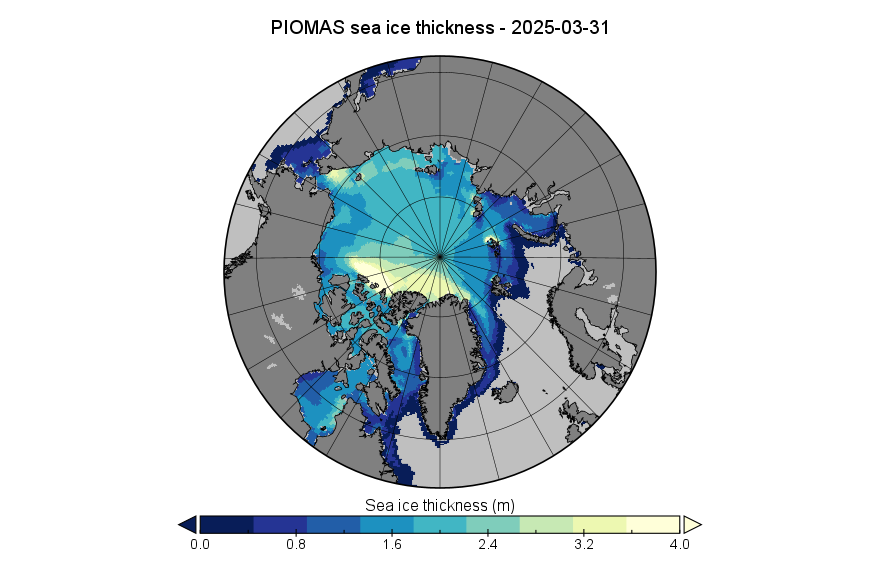
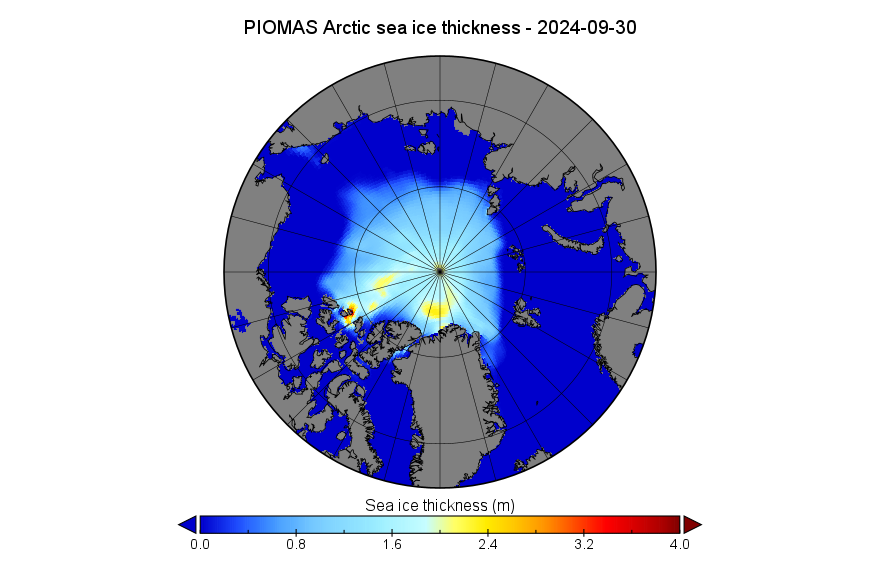
The PIOMAS gridded thickness data for September 2024 has been released:
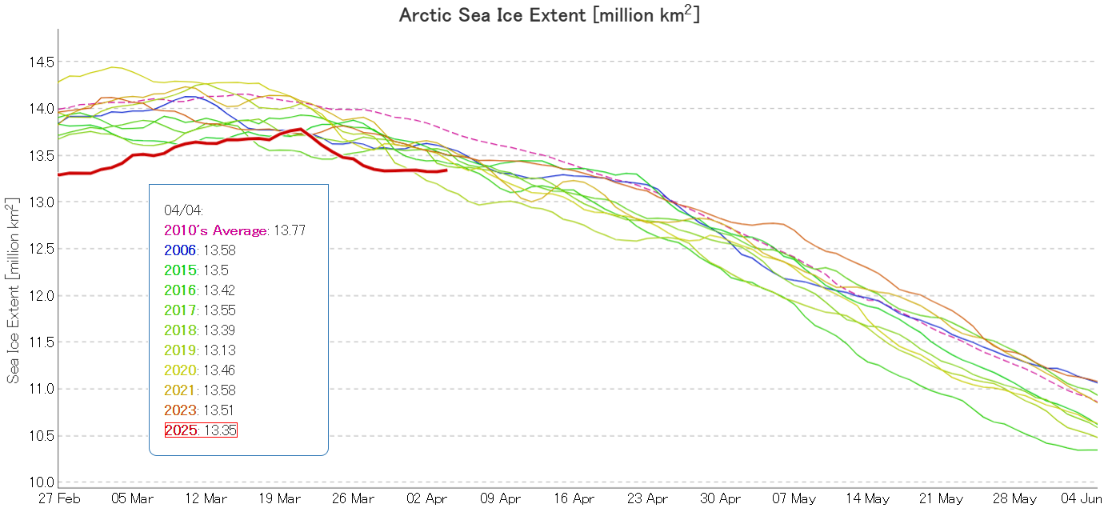
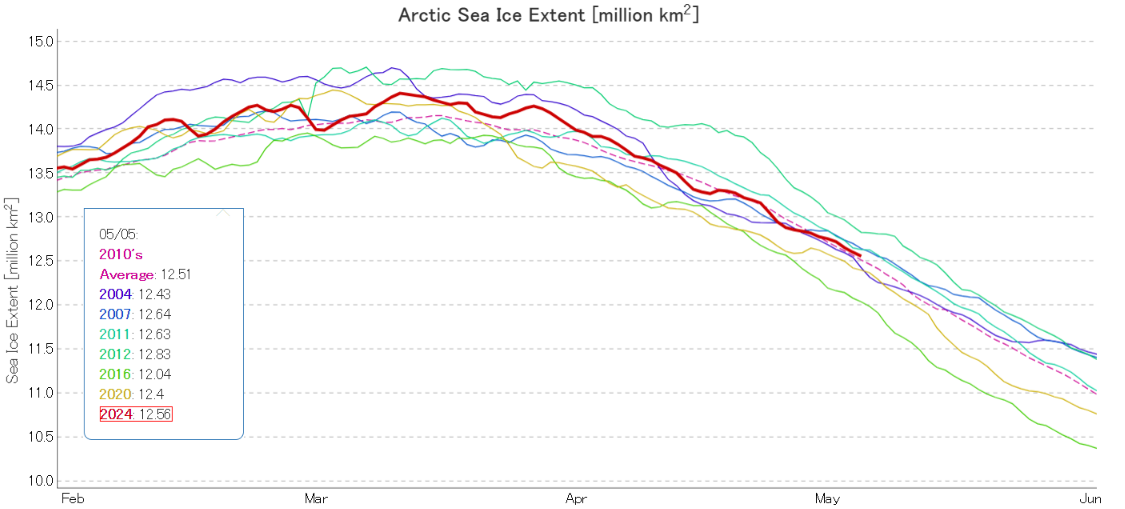
Since a certain “sceptic” has recently been comparing 2024 sea ice extent to “20 years ago”, here’s the current JAXA/ViSHOP extent graph of selected years, including 2004:
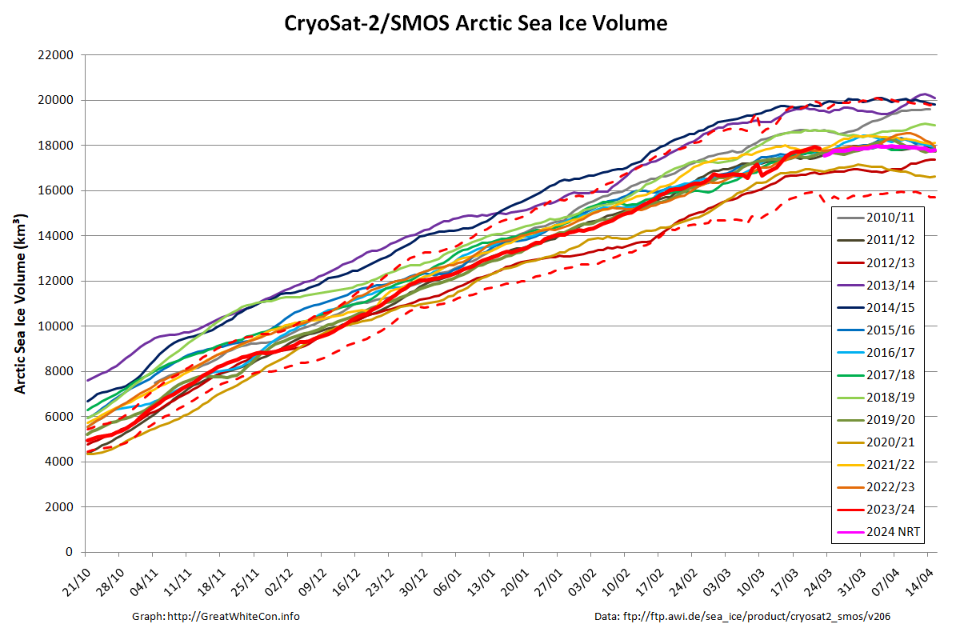
The CryoSat-2/SMOS merged Arctic sea ice volume graph finishes on April 15th, but older data is being reanalysed and here is the latest version:
The gap in the near real time data due to the problem with the SMOS satellite during the first half of March has been filled in, but the result doesn’t look very convincing to say the least!
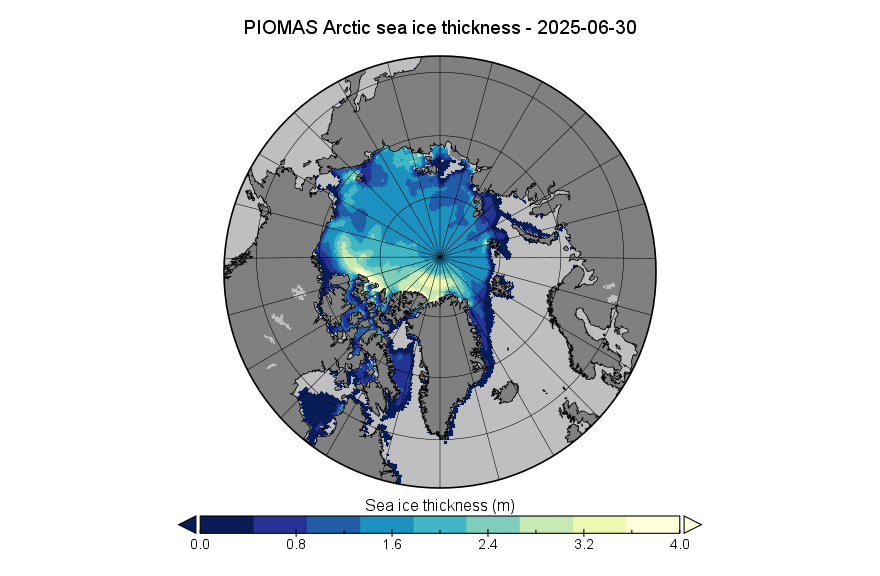
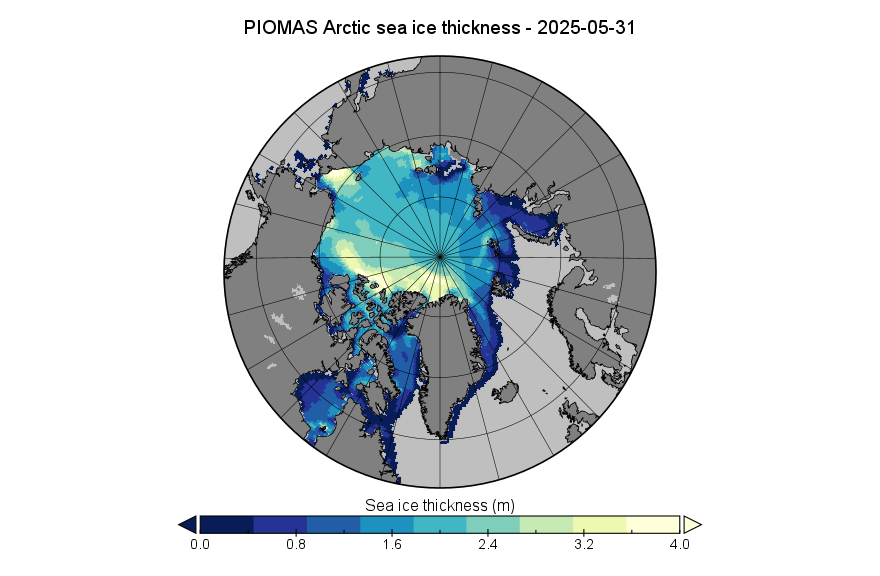
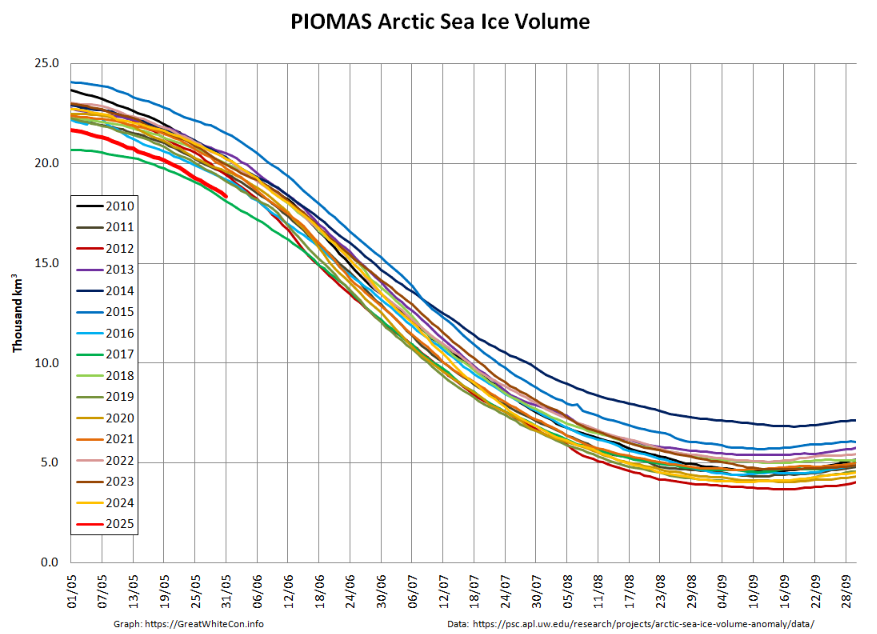
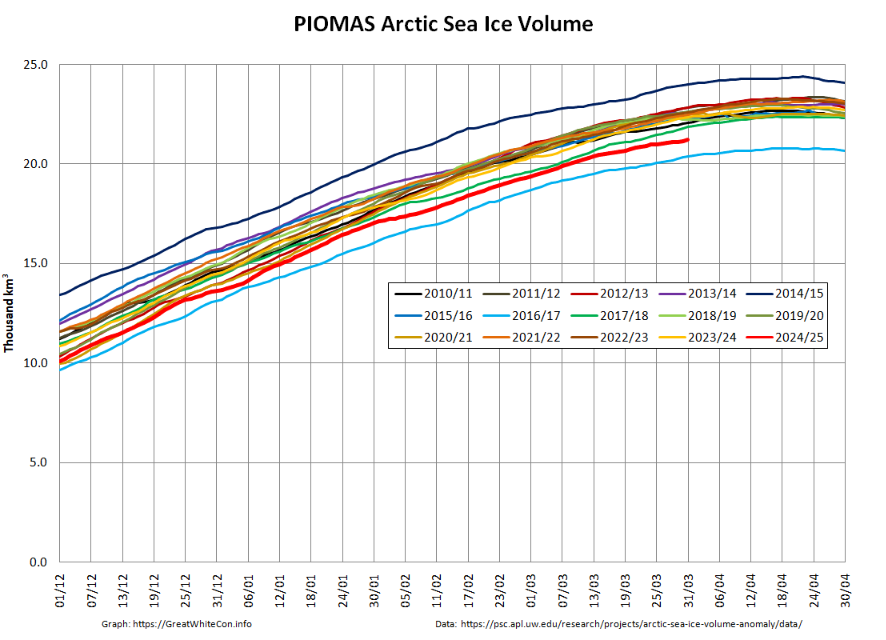
The PIOMAS gridded thickness data for April 2024 is now available. Here’s the end of month volume graph:
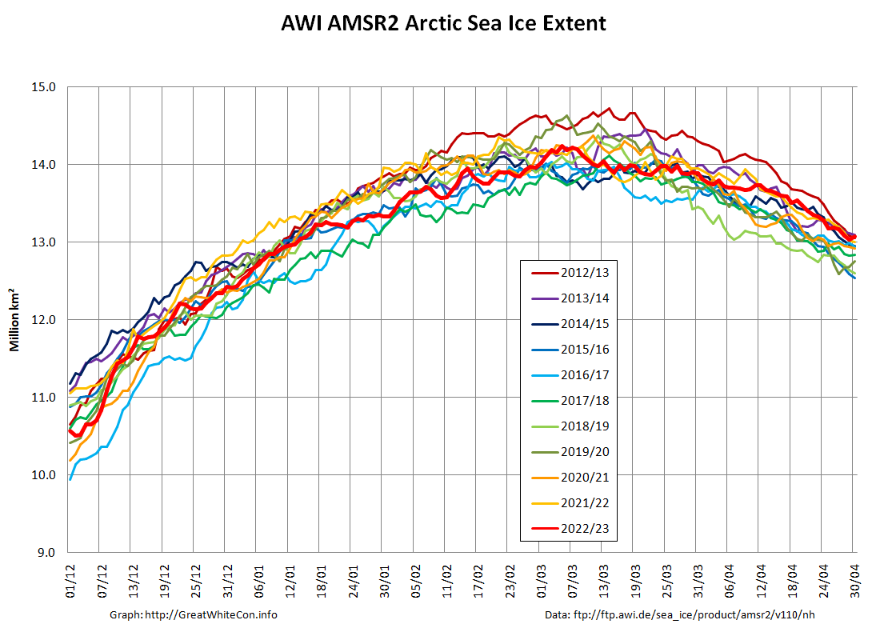
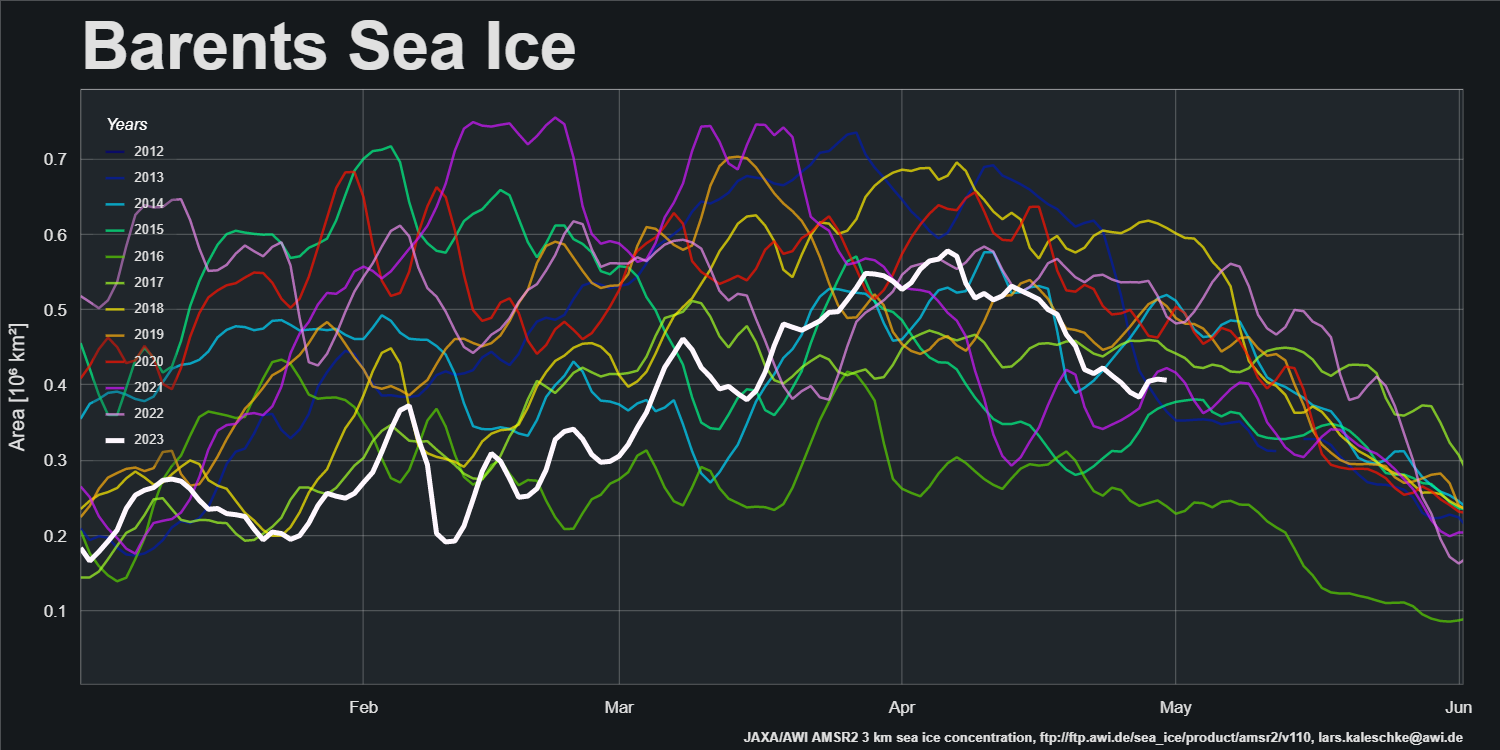
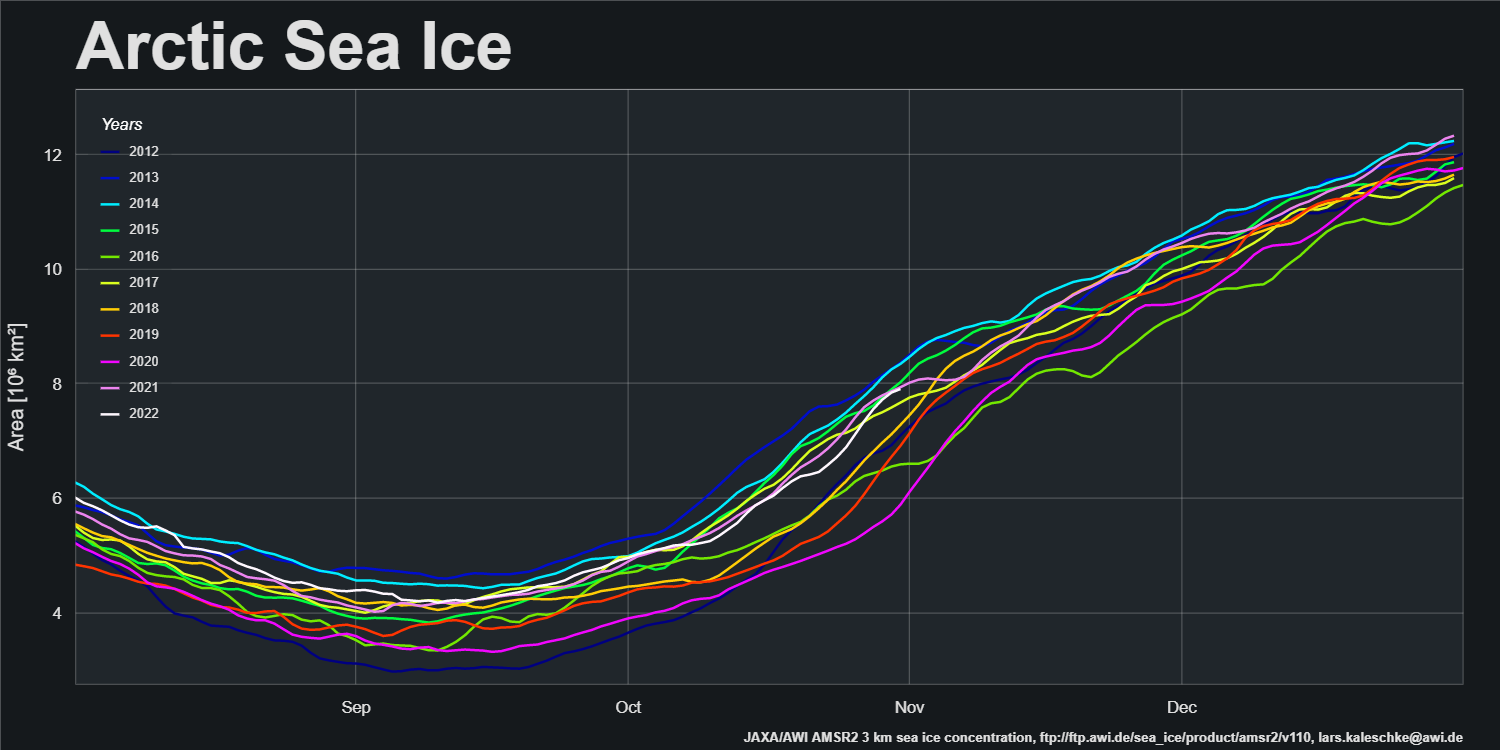
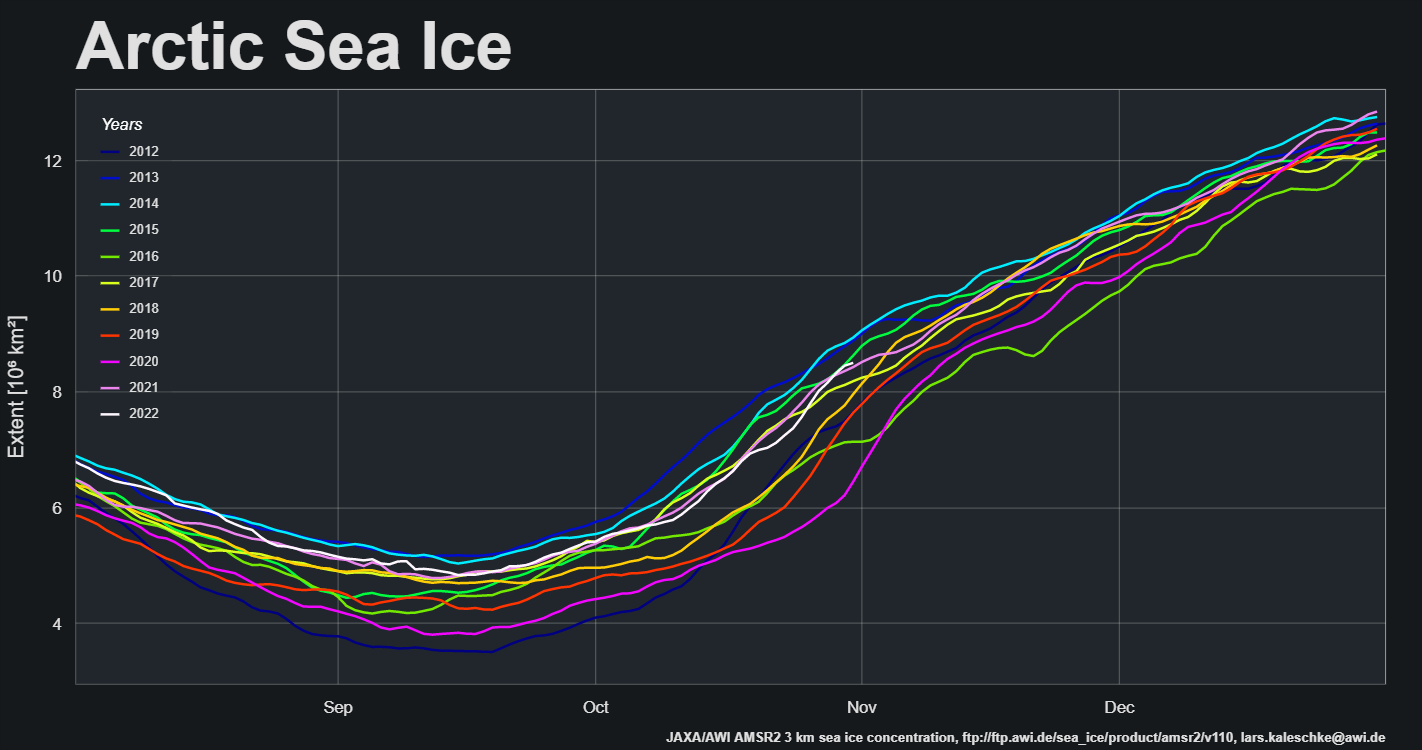
A change is allegedly as good as a rest, so here’s an alternative view of high resolution AMSR2 area and extent created using the experimental tools provided by the AWI’s Lars Kaleschke at: https://sites.google.com/view/sea-ice/
After a brief pause mid-month the refreeze has accelerated again. Both metrics are in the upper half of the decadal range, with extent this year just above 2021 and area just below last year.
Next let’s take a look at sea ice concentration at the end of October:
As in previous years there is already a thread devoted to this year’s minimum extent. By way of a summary here are the end of August numbers for our favourite “high resolution” AMSR2 area and extent metrics:
Extent is currently near the top of the range of the last 10 years.
We have now reached the stage of the “melting season” when “refreezing” has started in the Central Arctic but melting at the periphery is outpacing it. However the Canadian Ice Service stage of development charts now show the arrival of new ice in the high latitudes of the Canadian Arctic Archipelago:
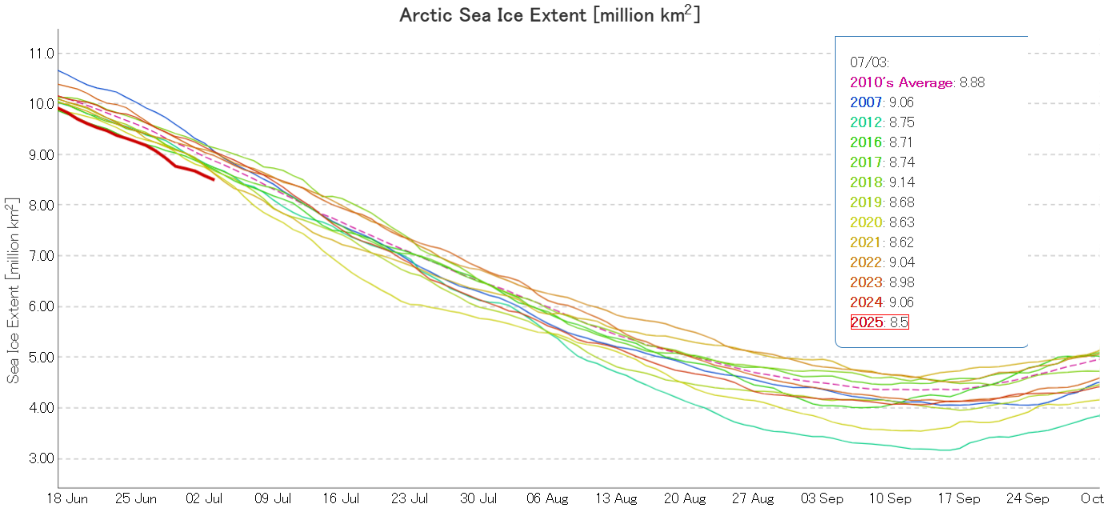
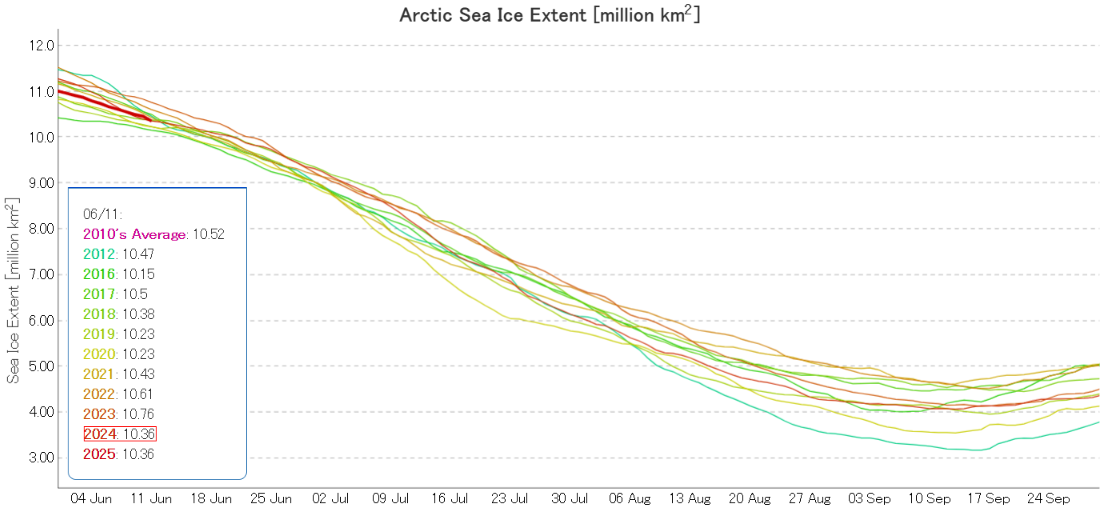
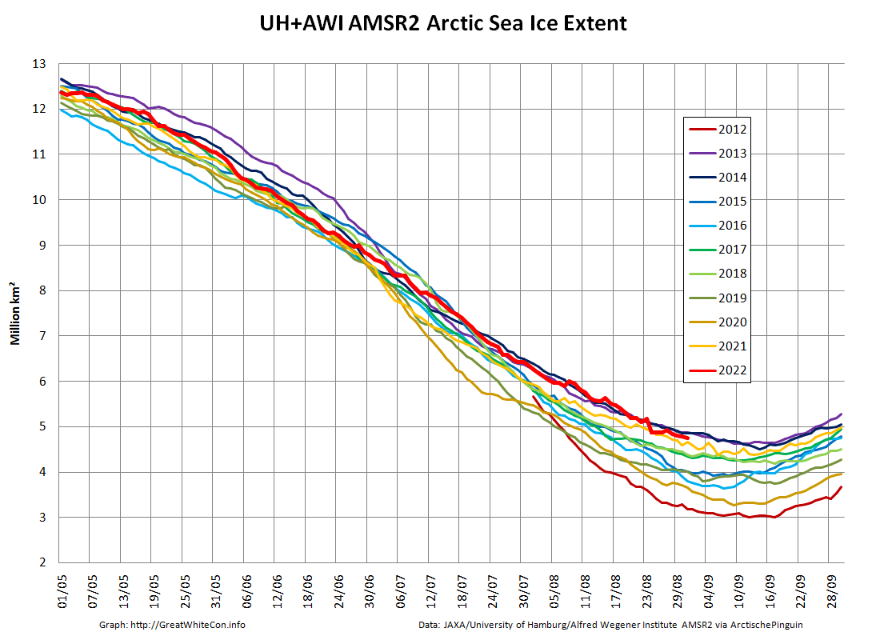
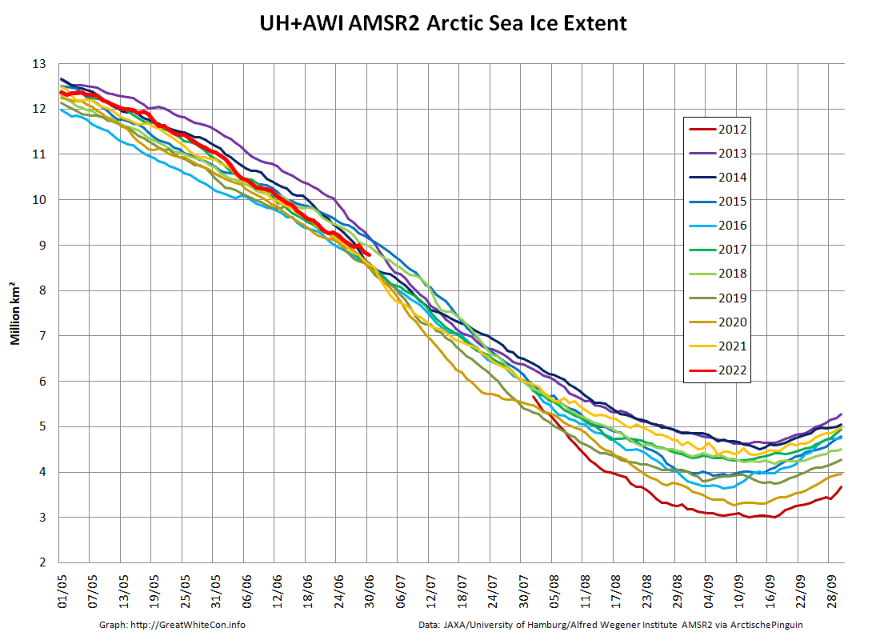
After a relatively rapid decline at the beginning of June Arctic sea extent is now very close to the 2010s average:
Both 2020 and 2021 began relatively rapid declines of their own at the beginning of July, so it will be interesting to see if 2022 follows suit.
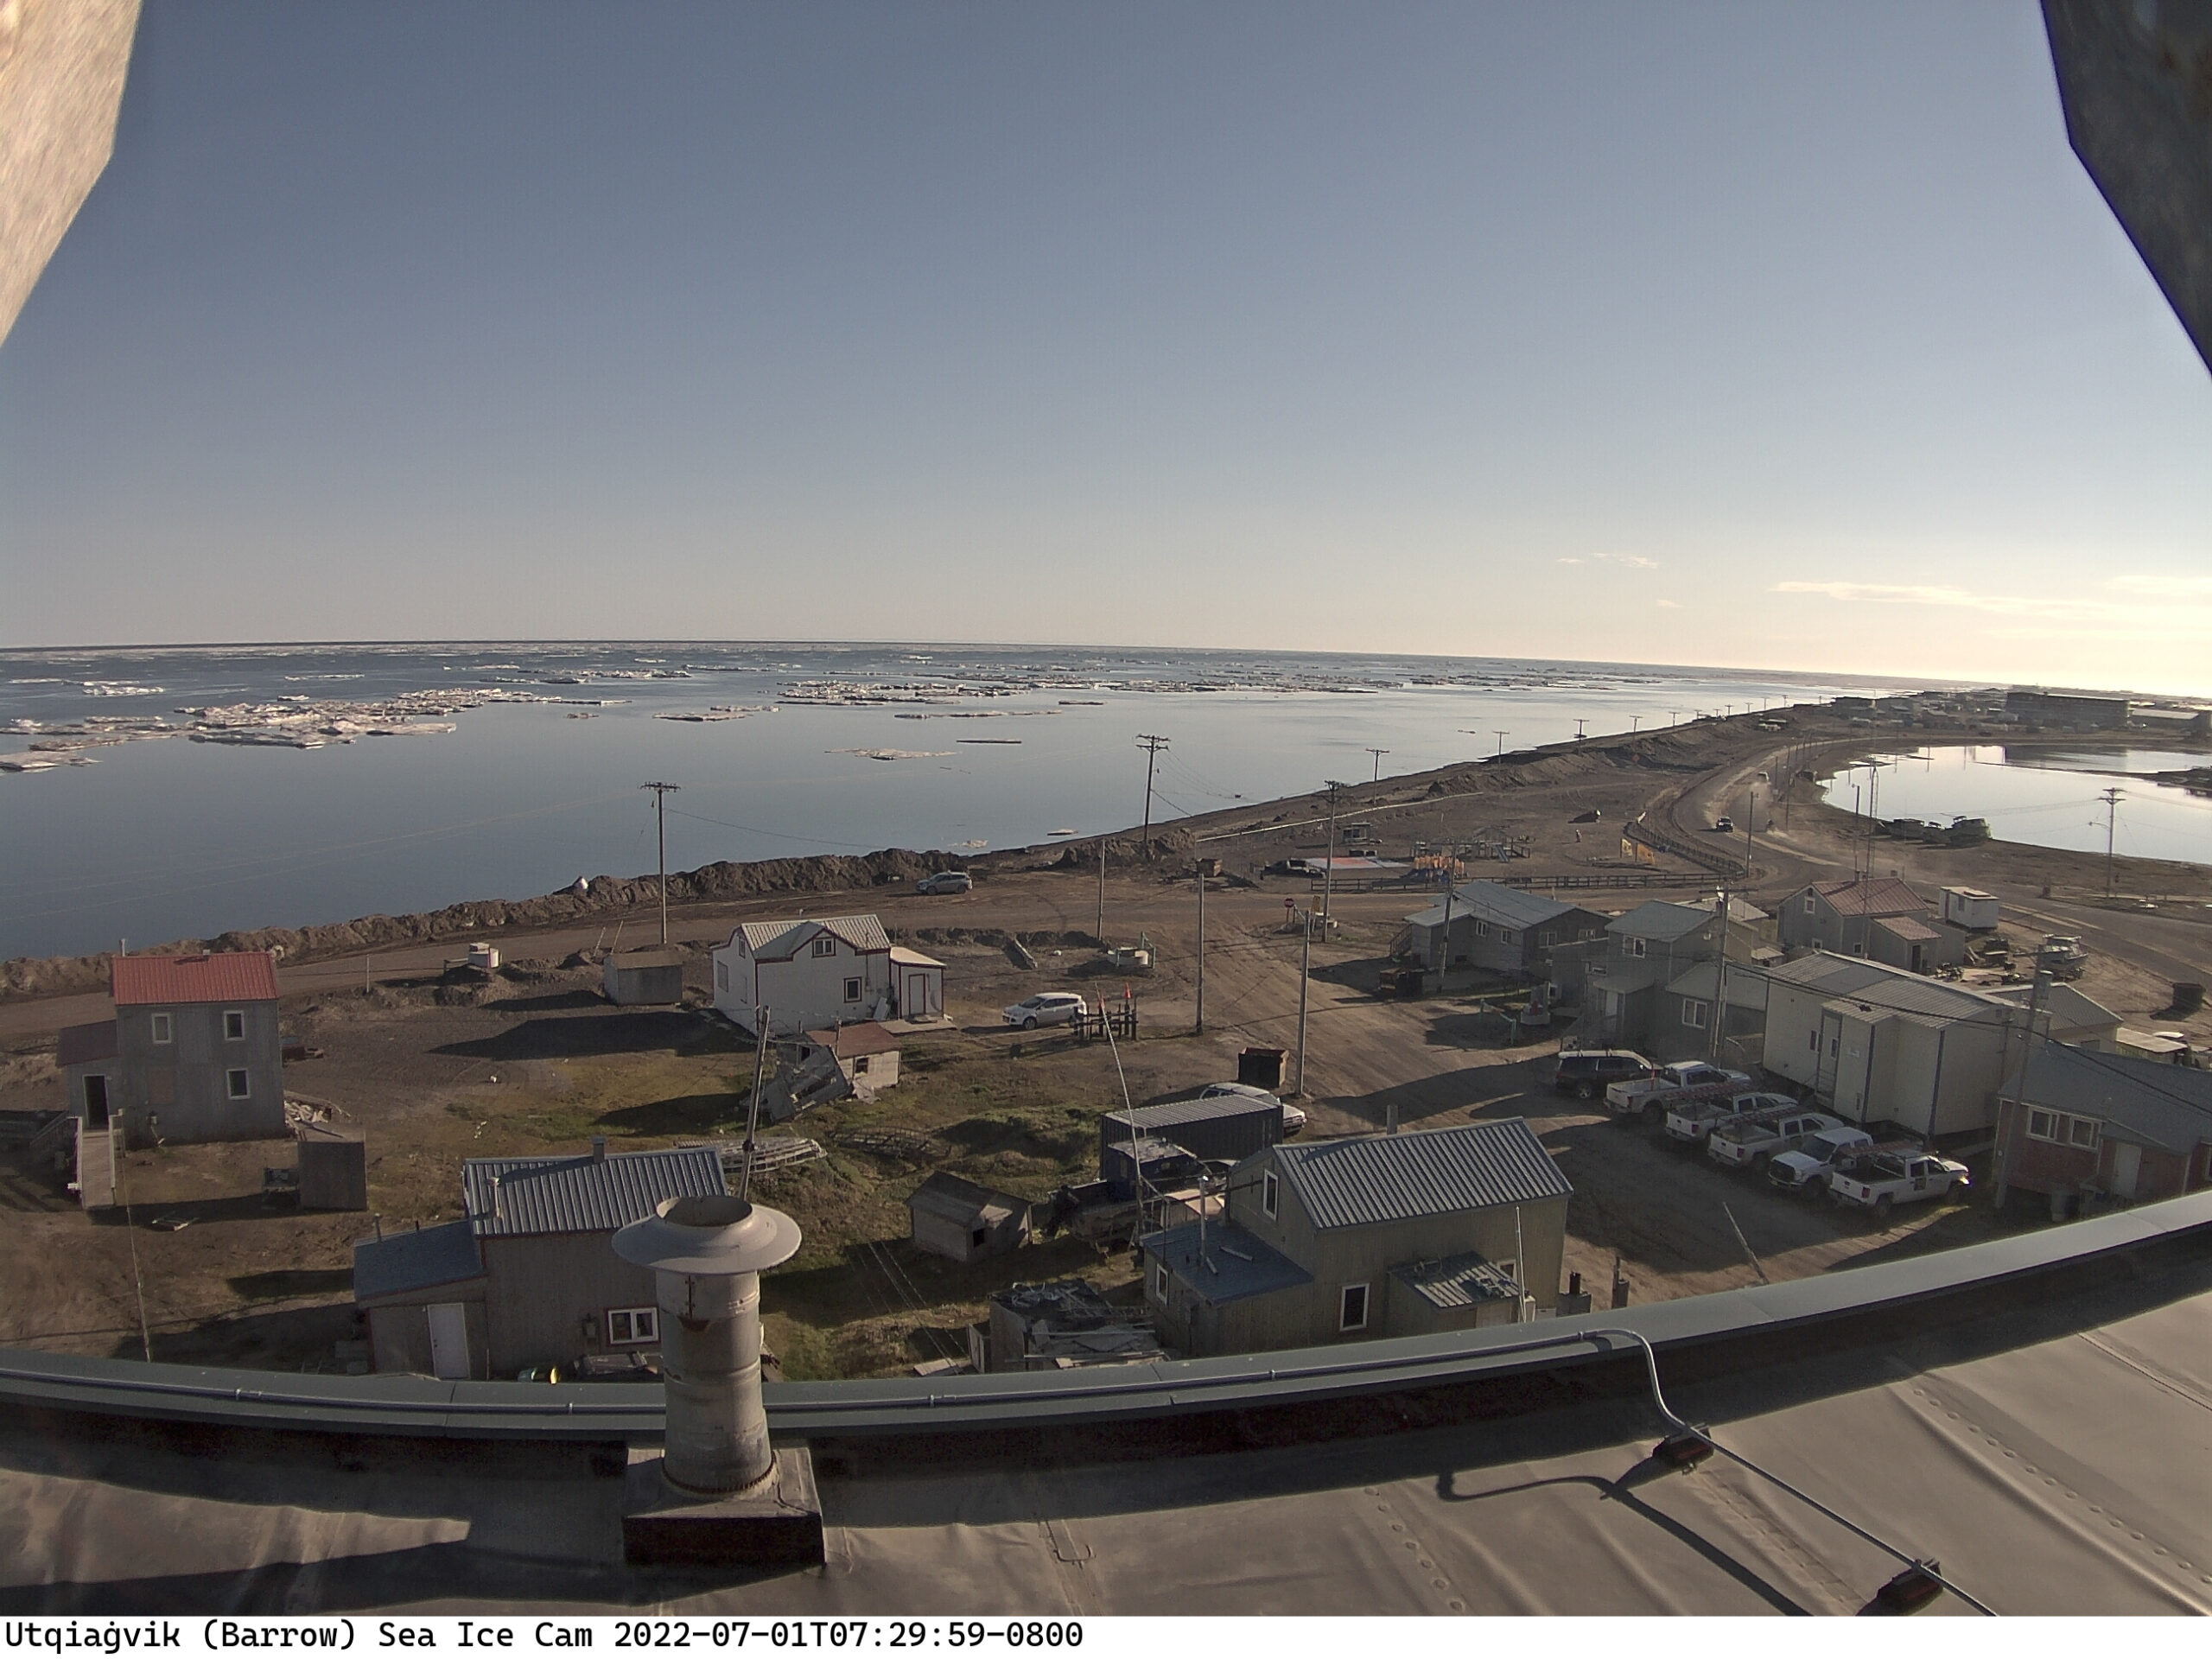
Most of the fast ice off Utqiaġvik has recently disappeared:
Meanwhile further out into the Chukchi Sea the sea ice looks to be in poor shape at the moment, with surface melting apparent across the entire region:
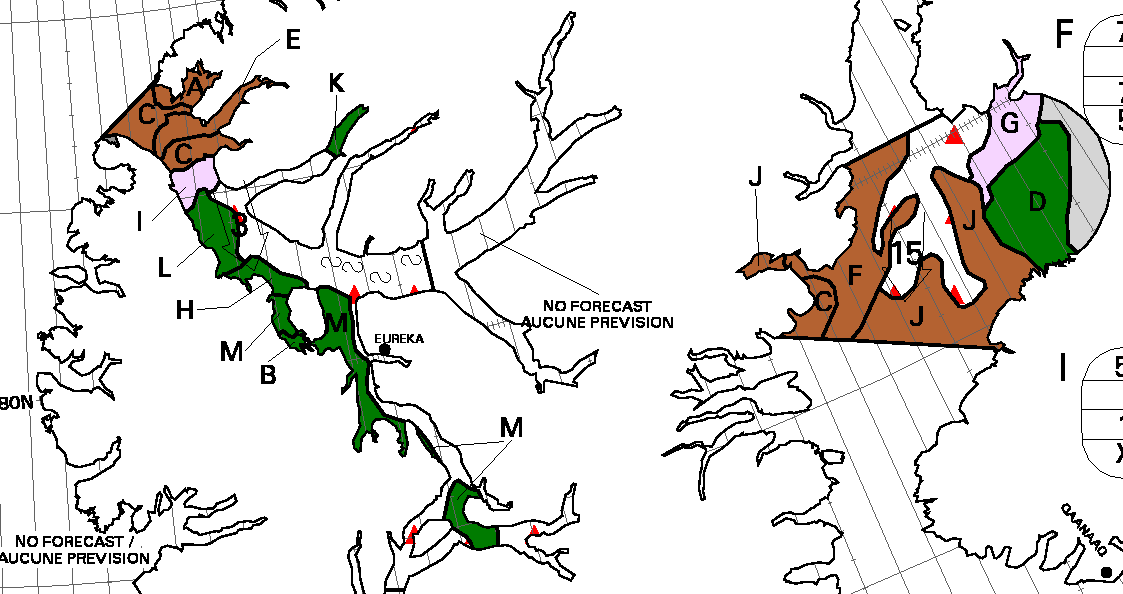
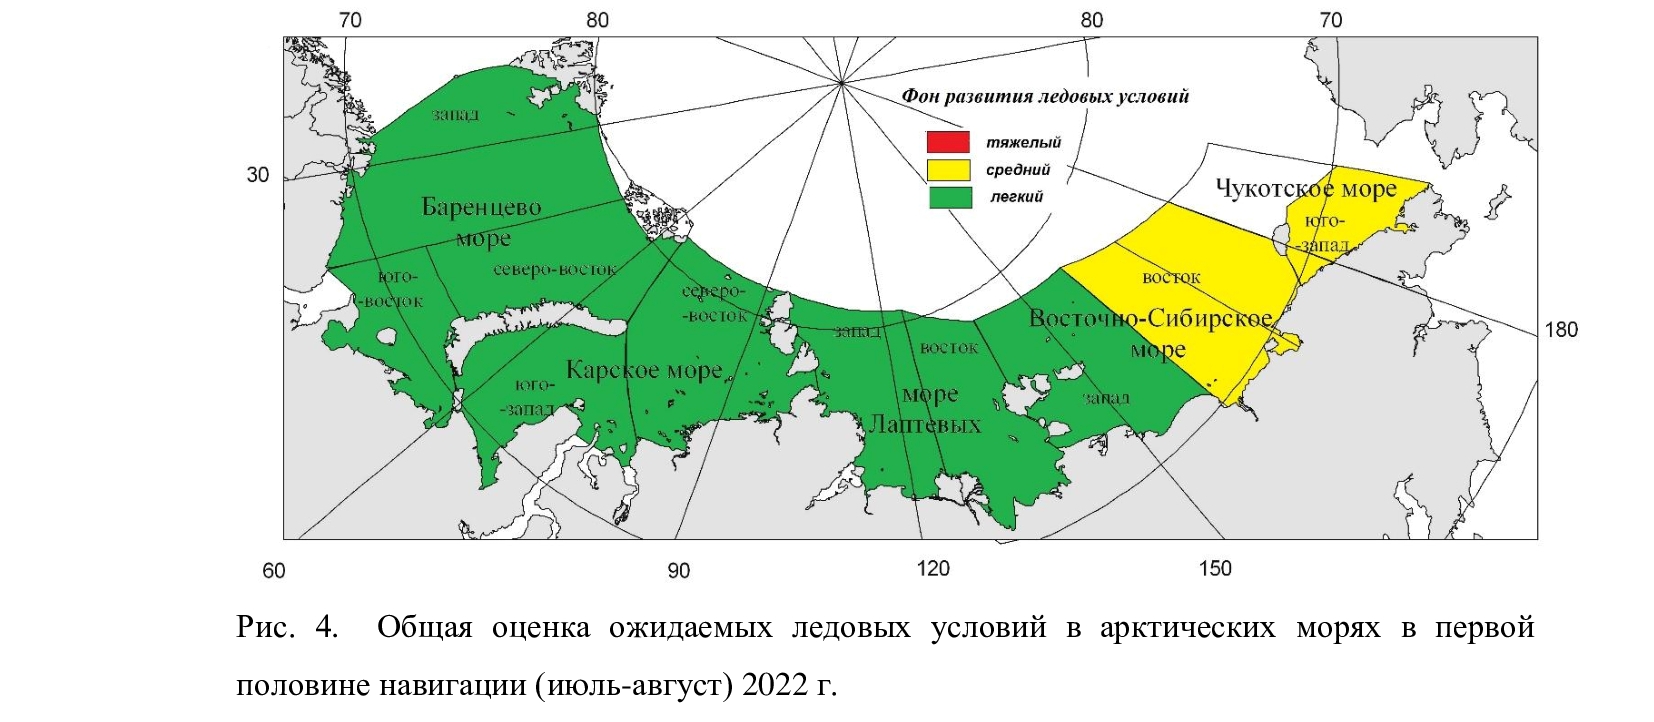
On June 17th the Northern Sea Route Administration published the Arctic and Antarctic Research Institute forecast of ice conditions for June to August 2022. Here’s the summary:
“Favorable” conditions in most areas, but “average” in the eastern East Siberian Sea and south west Chukchi Sea.
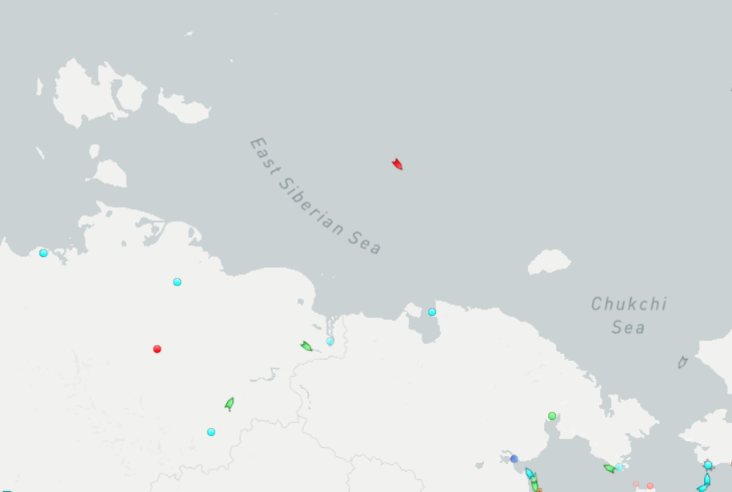
Traffic along the main Northern Sea Route has already begun. Marine Traffic reveals that the liquified natural gas carrier Nikolay Yevgenov is heading for the Bering Strait and has already sailed north of the New Siberian Islands. He is now entering the “average” ice area in the eastern ESS:
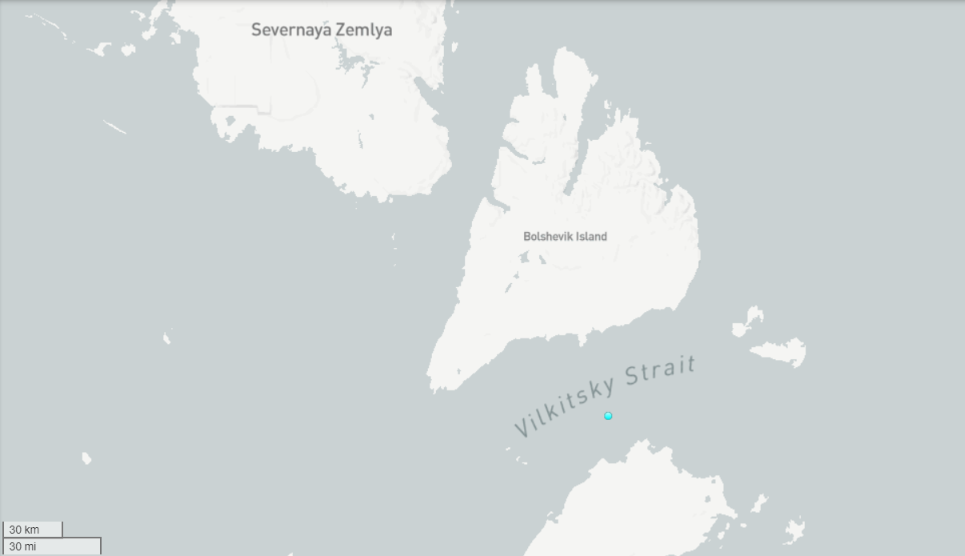
Meanwhile the recently commissioned nuclear powered icebreaker Sibir is patiently waiting in the Vilkitsky Strait:
The Northern Sea Route is evidently already “open” for ice hardened LNG tankers, but not yet for more conventional vessels. Here is the current AMSR2 sea ice concentration map:
This website uses cookies to improve your experience. We'll assume you're ok with this, but you can opt-out if you wish. Cookie settingsACCEPT
Privacy & Cookies Policy
Privacy Overview
This website uses cookies to improve your experience while you navigate through the website. Out of these, the cookies that are categorized as necessary are stored on your browser as they are essential for the working of basic functionalities of the website. We also use third-party cookies that help us analyze and understand how you use this website. These cookies will be stored in your browser only with your consent. You also have the option to opt-out of these cookies. But opting out of some of these cookies may affect your browsing experience.
Necessary cookies are absolutely essential for the website to function properly. This category only includes cookies that ensures basic functionalities and security features of the website. These cookies do not store any personal information.
Any cookies that may not be particularly necessary for the website to function and is used specifically to collect user personal data via analytics, ads, other embedded contents are termed as non-necessary cookies. It is mandatory to procure user consent prior to running these cookies on your website.