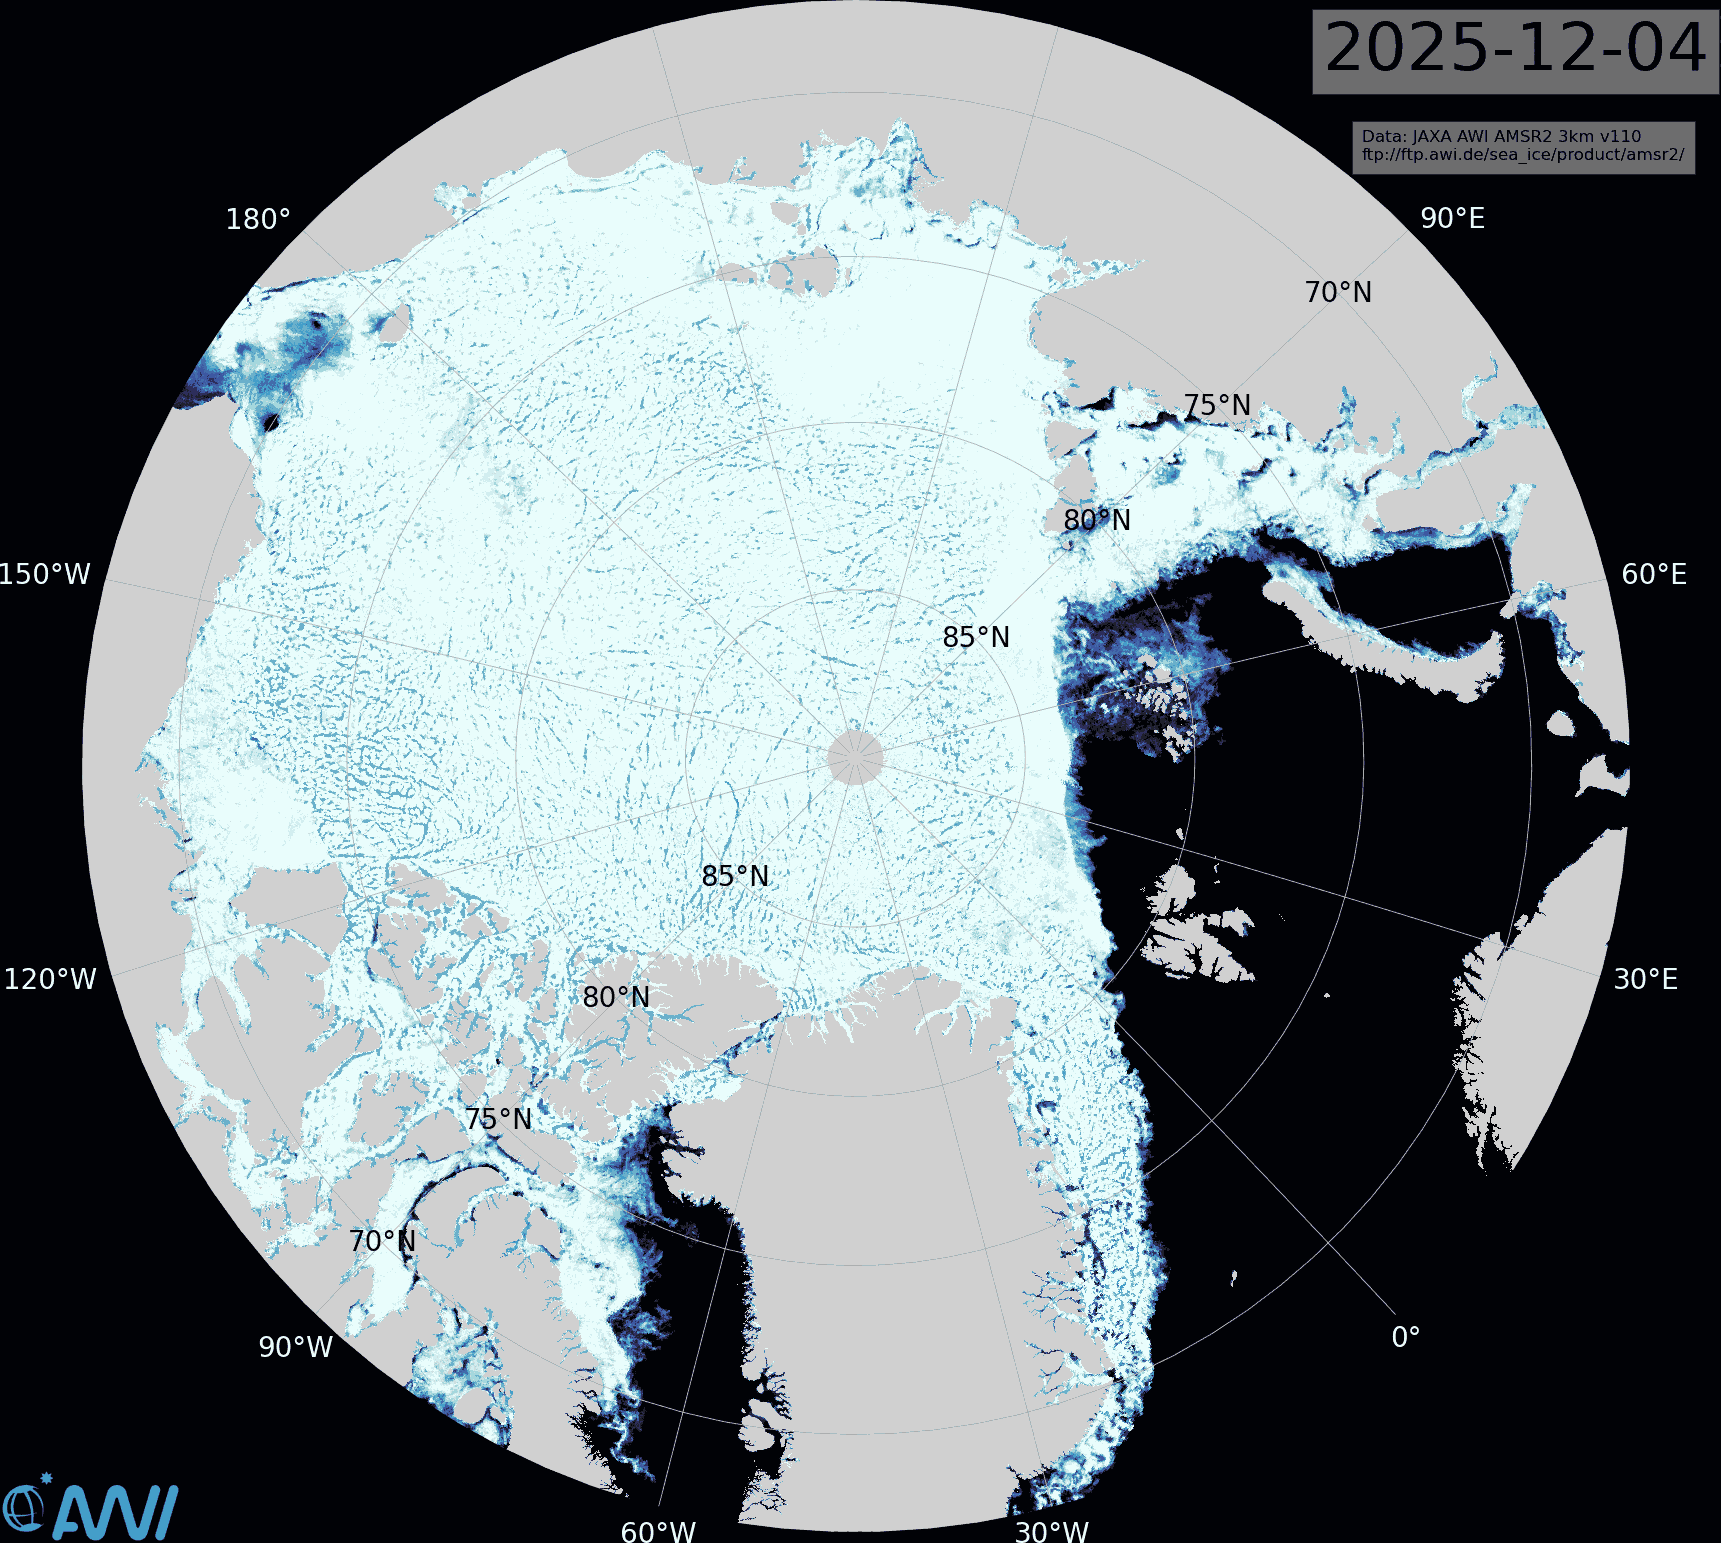
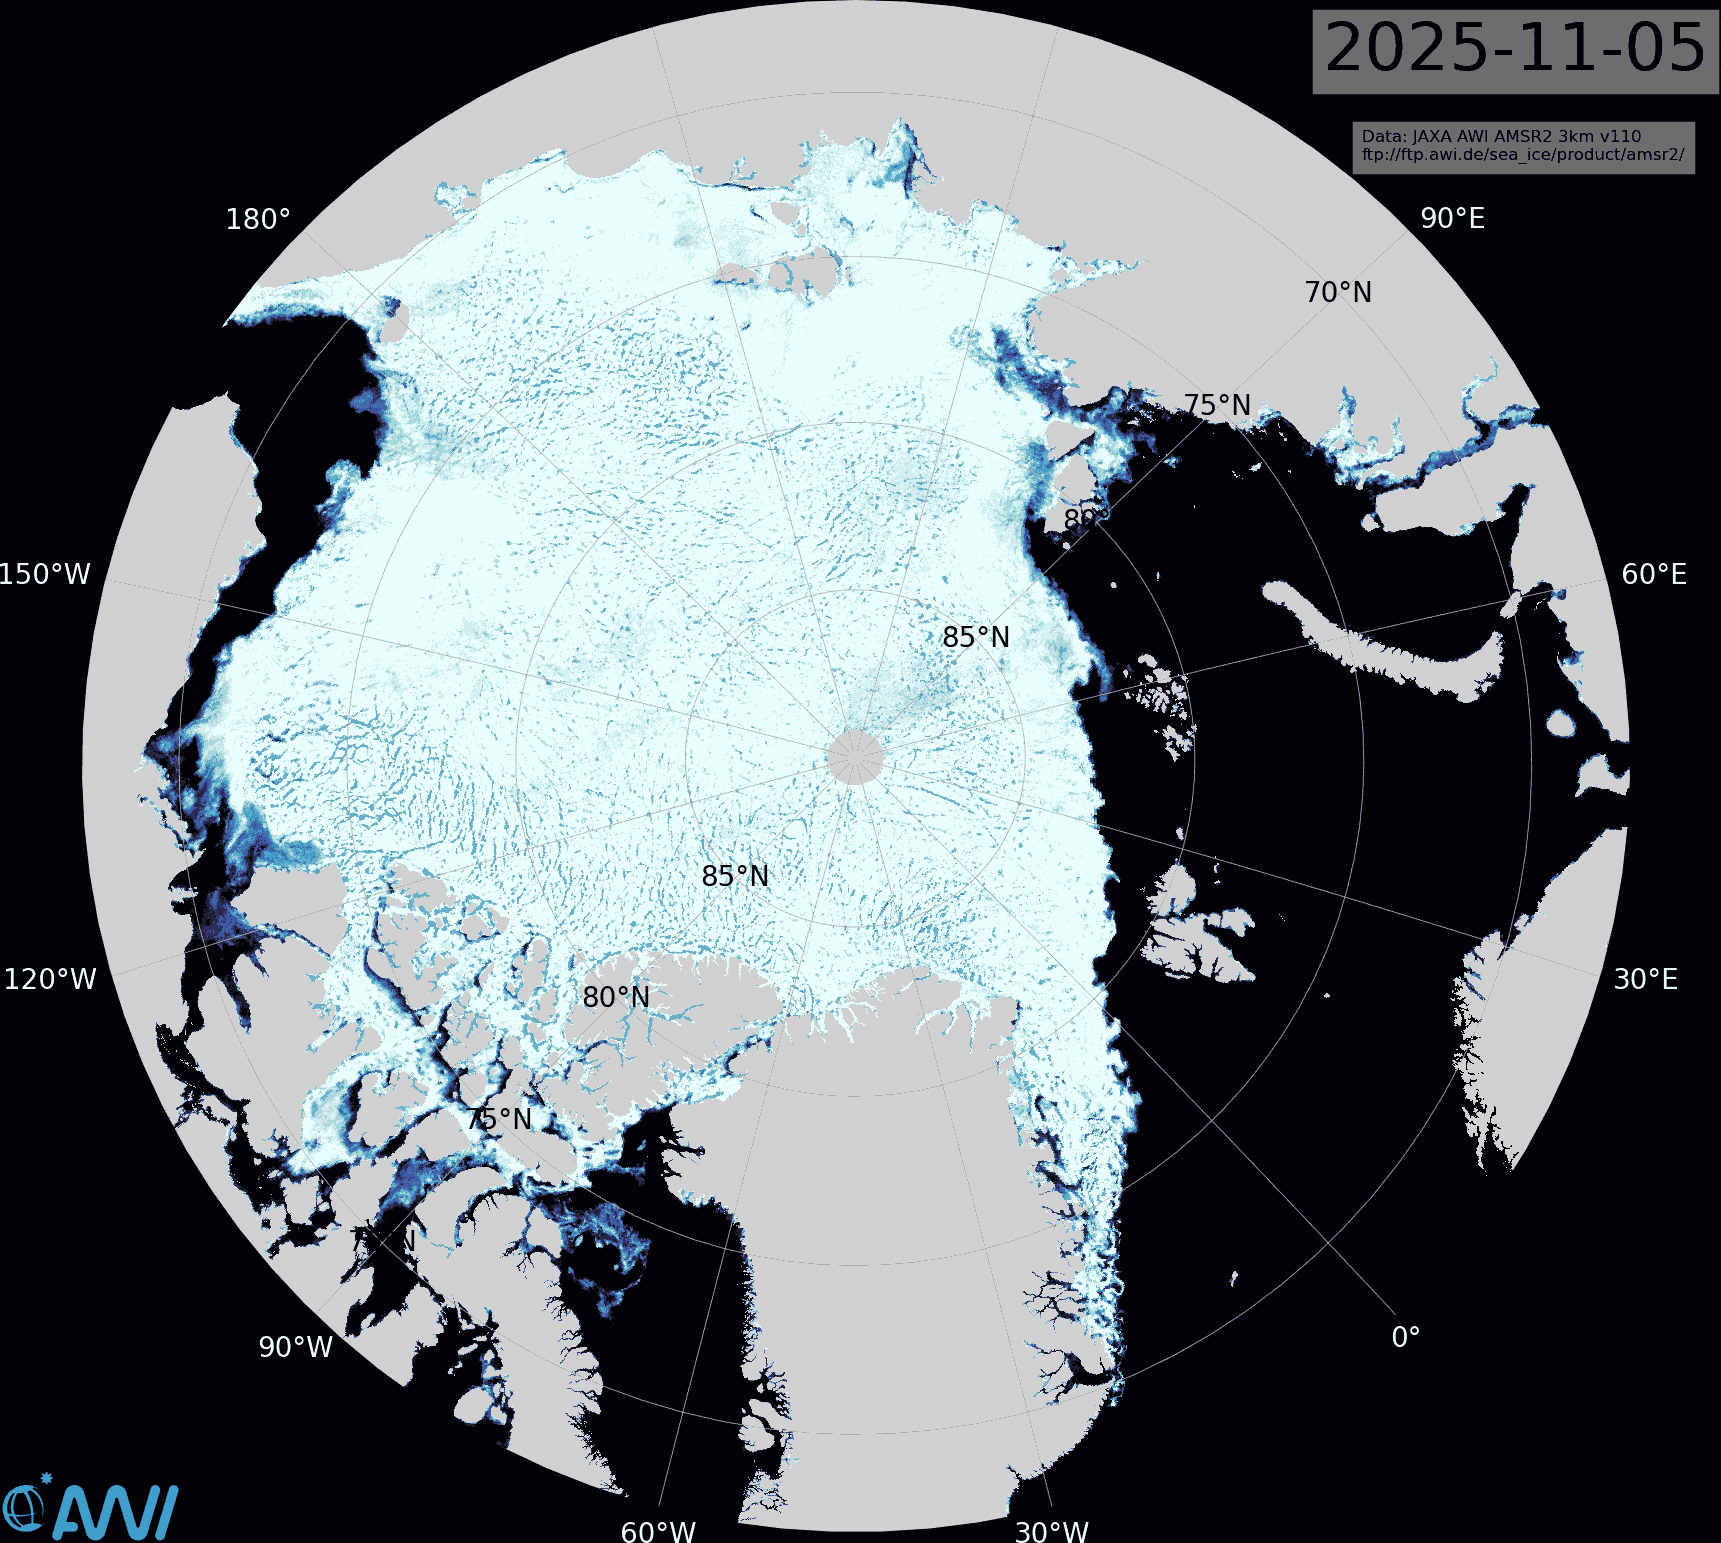
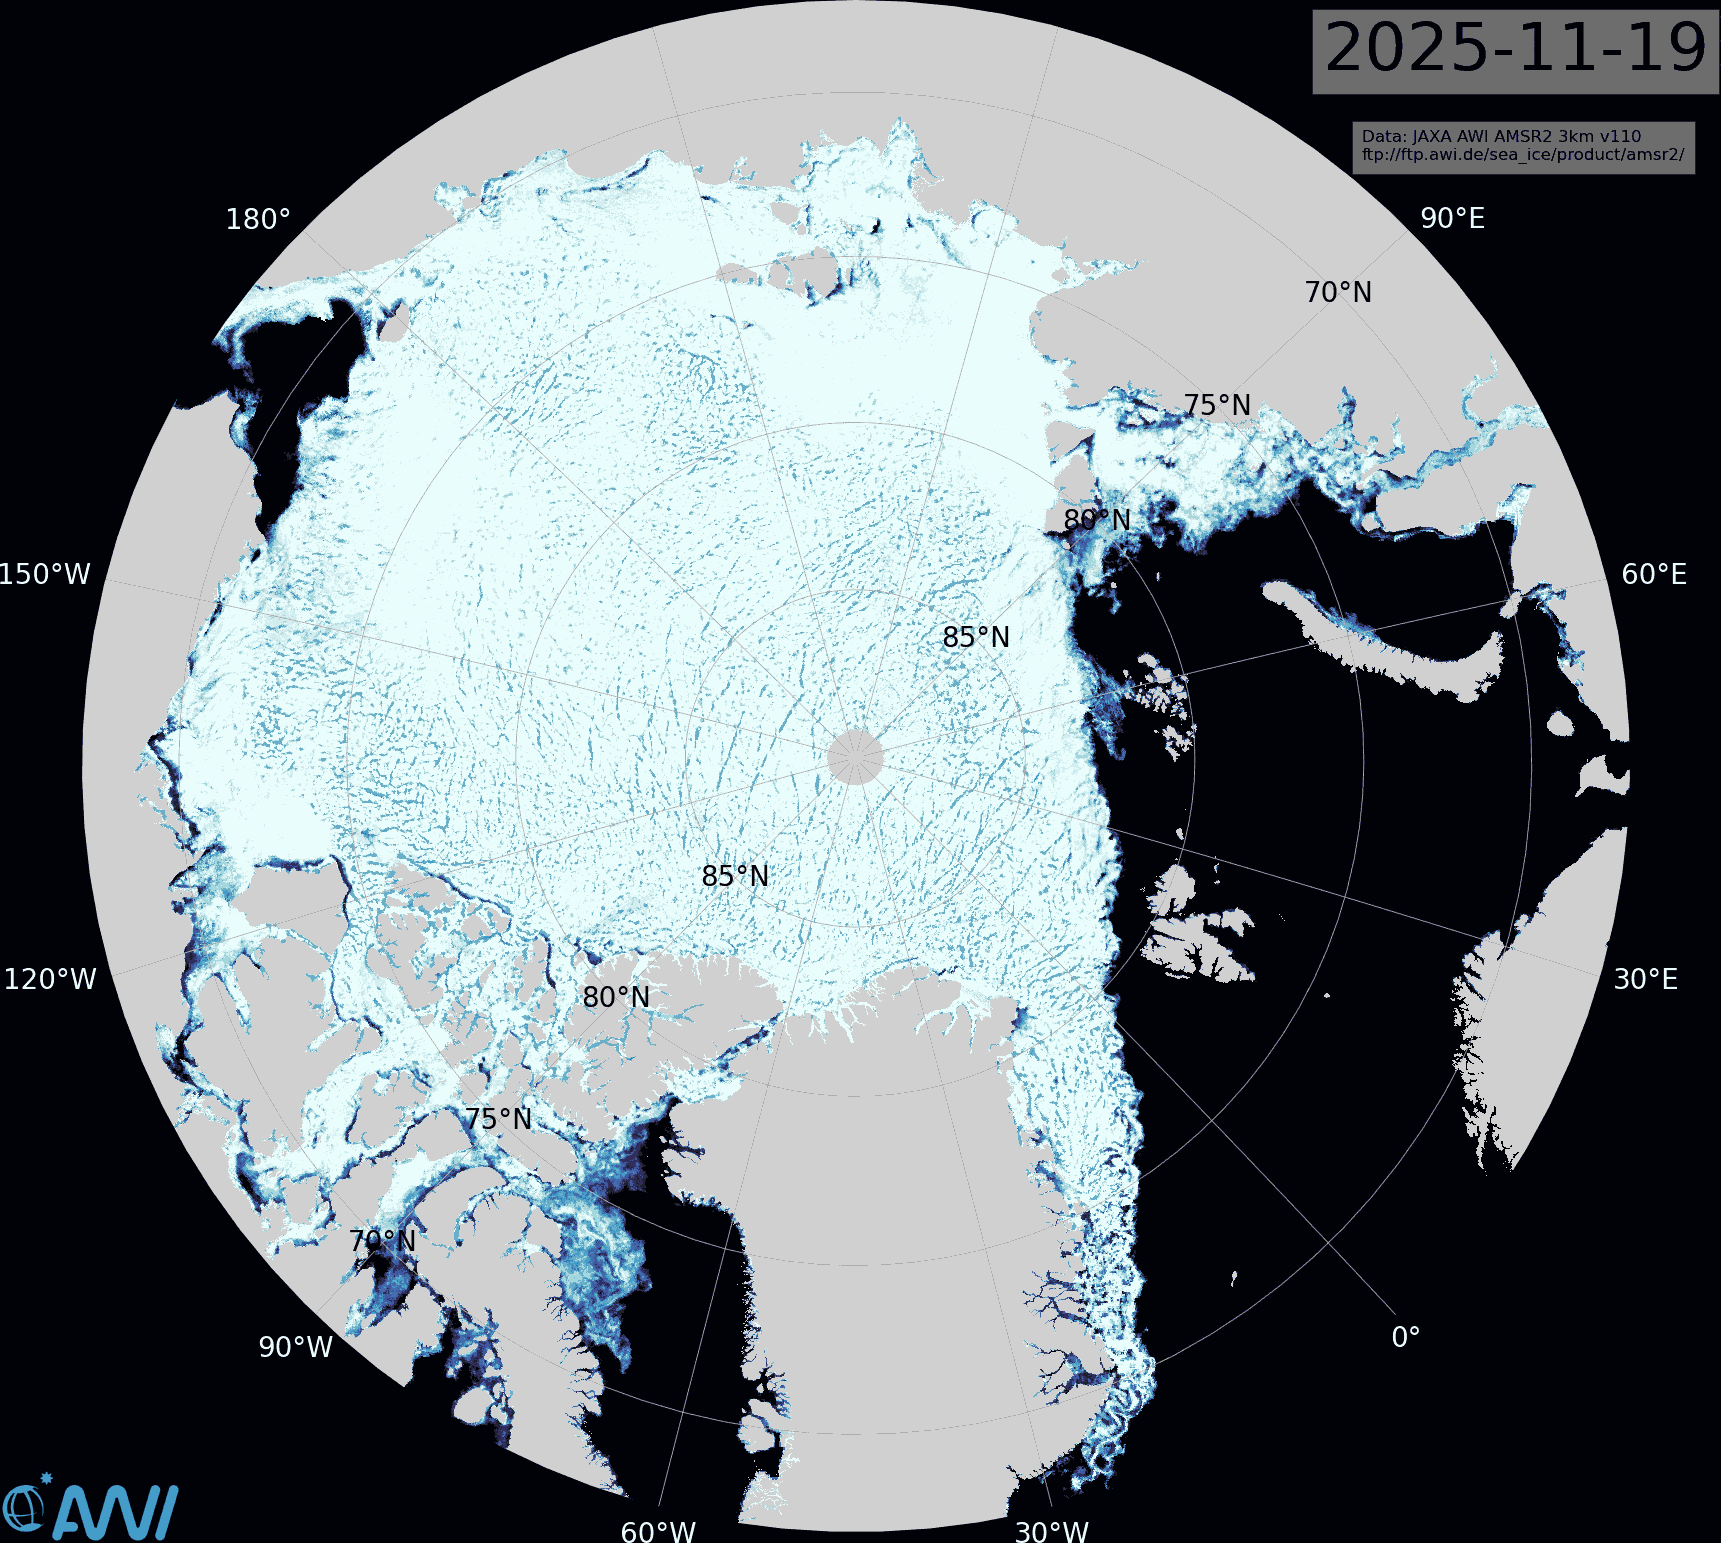
The latest Alfred Wegener Institute sea ice concentration map shows that the Pacific side of the Central Arctic Basin is now almost completely refrozen:
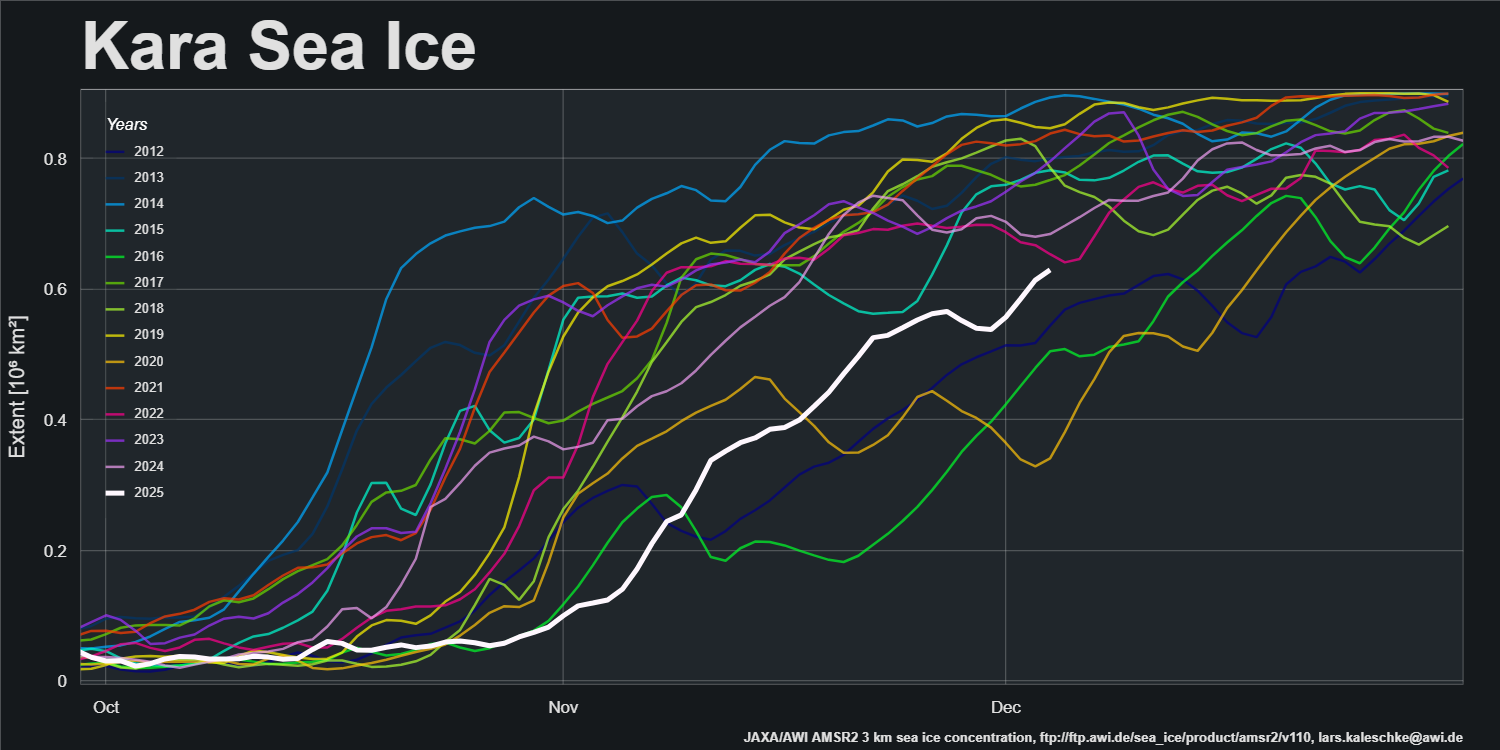
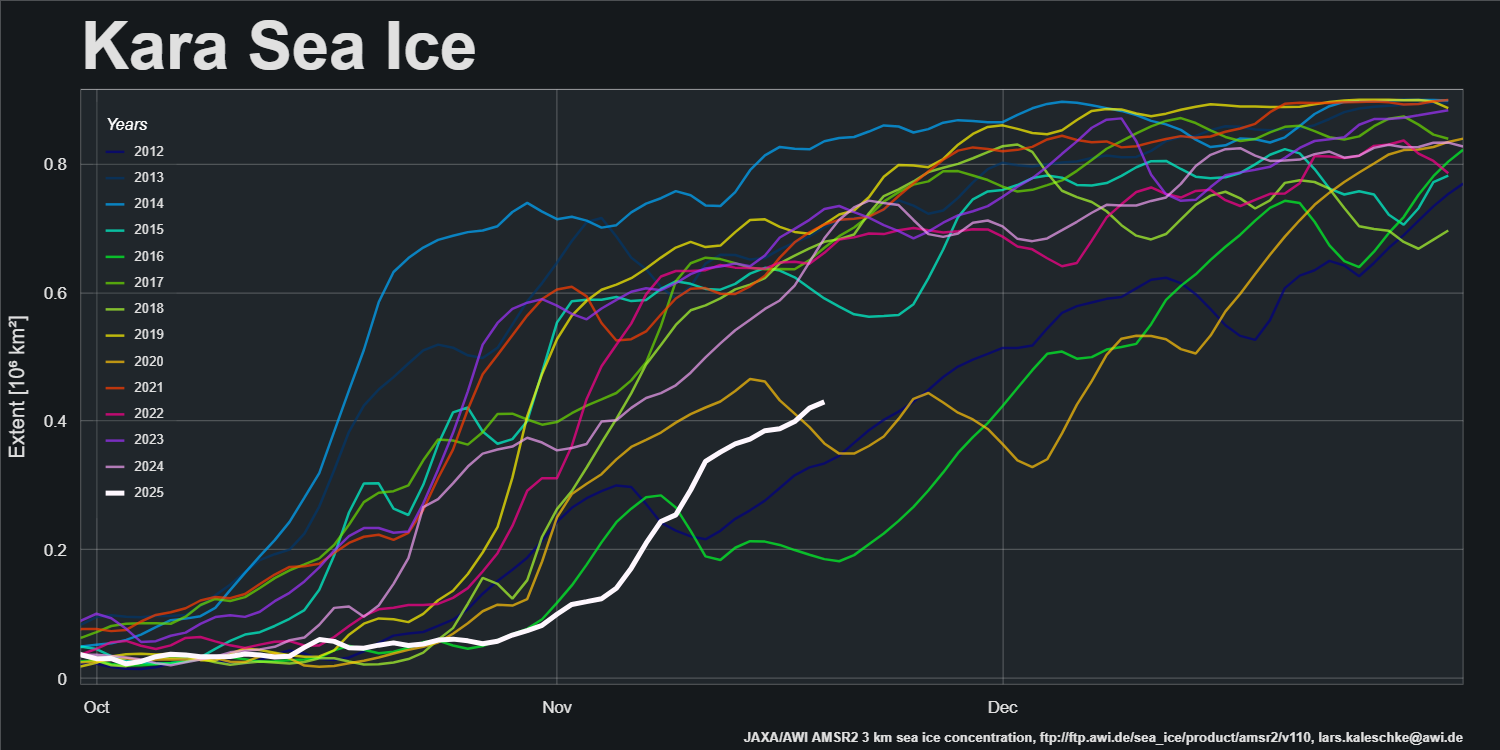
On the Atlantic side of the Arctic the Kara Sea is rapidly refreezing:
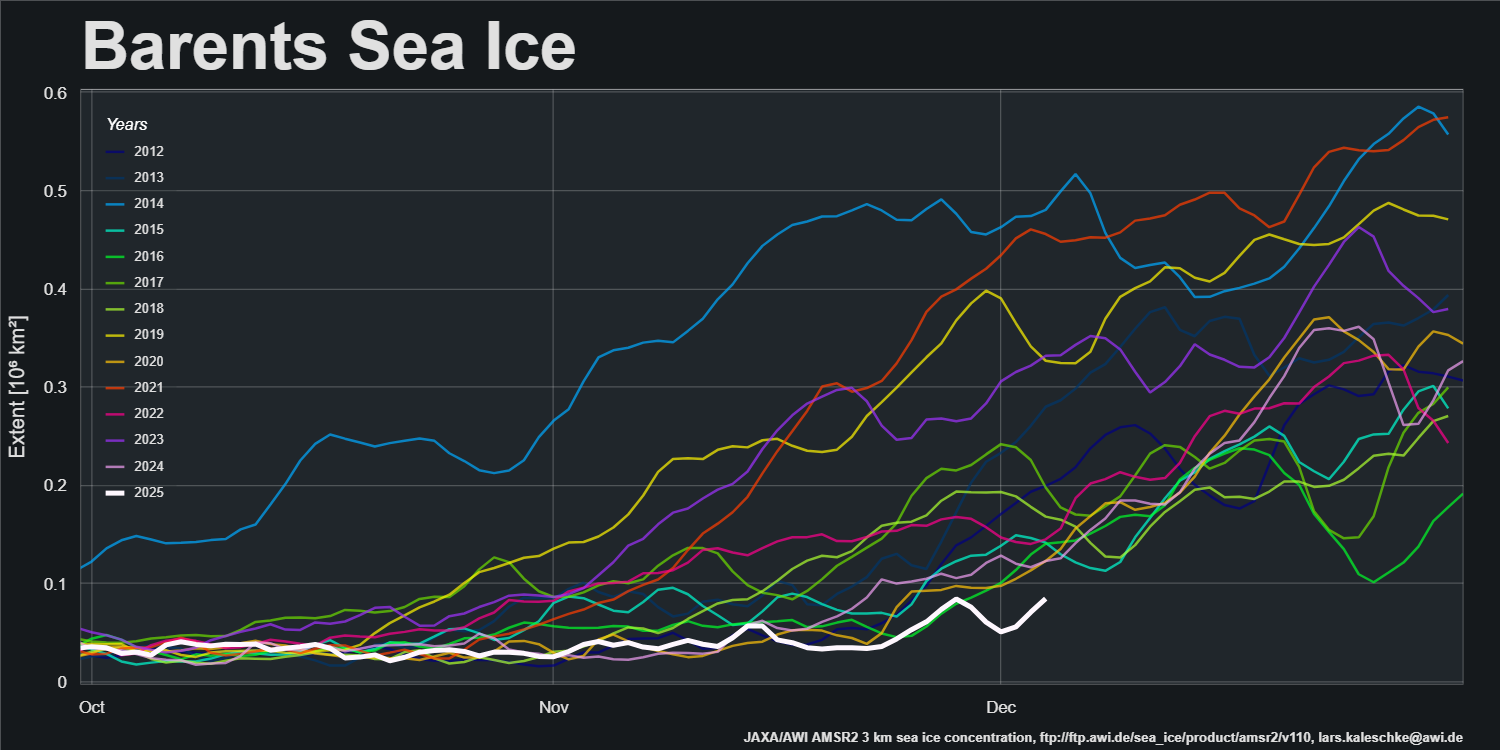
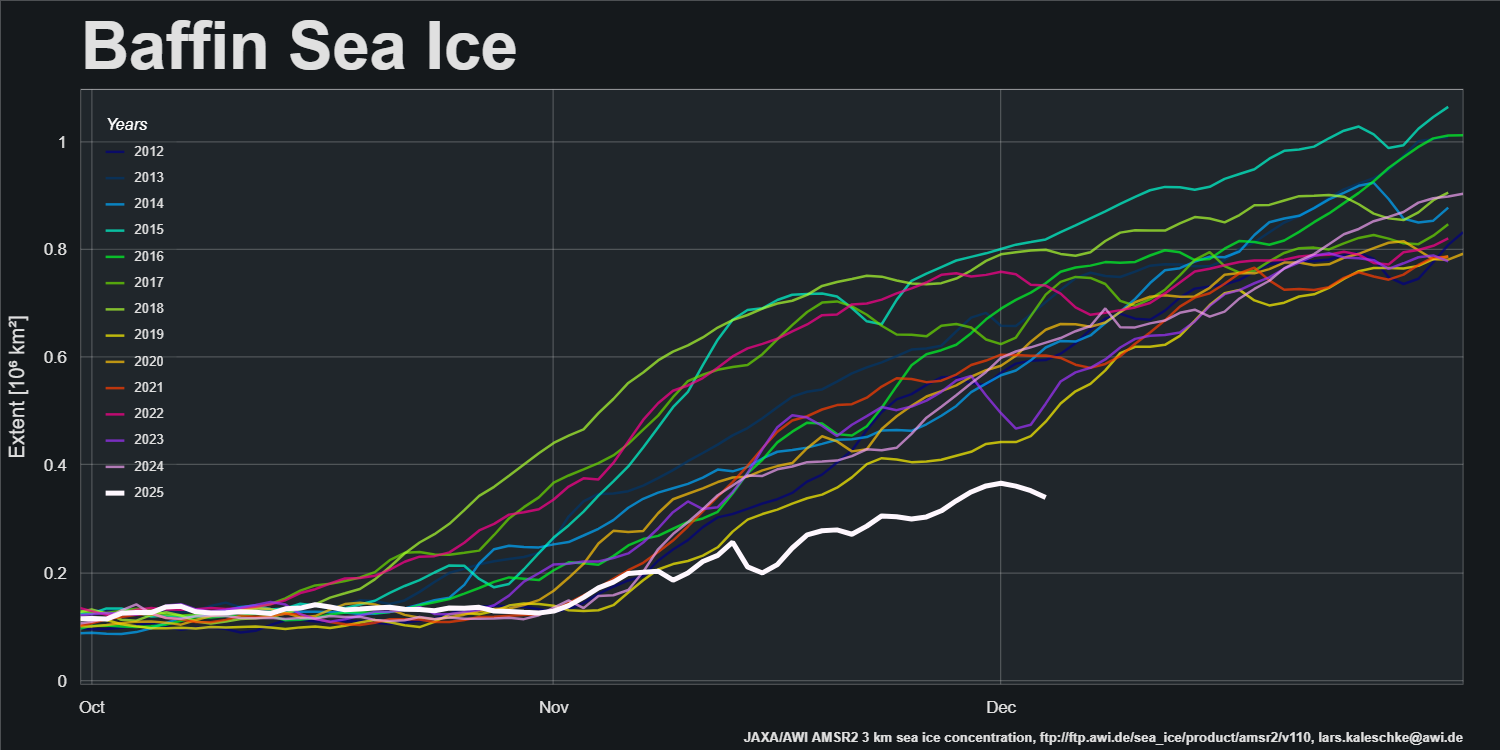
However, sea ice extent in the Barents Sea and Baffin Bay is currently lowest for the date in the AMSR2 record:
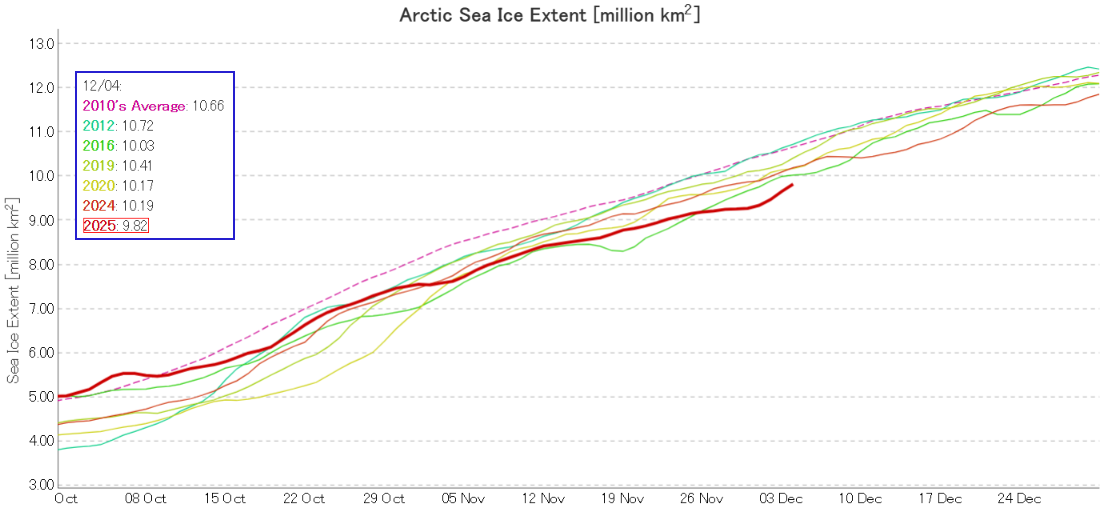
Pan Arctic JAXA/ViSHOP extent is currently lowest for the date in the satellite era:
The latest Alfred Wegener Institute sea ice concentration map shows the East Siberian and Laptev Seas almost completely refrozen. However, refreeze of the Kara Sea has barely begun:
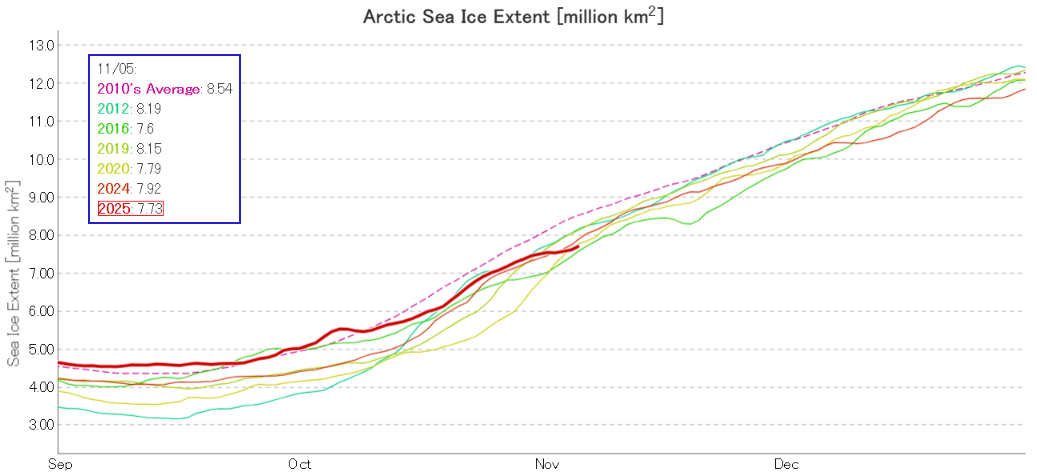
Across the Arctic as a whole the refreeze has slowed significantly, and JAXA/ViSHOP extent is now 2nd lowest in the satellite era:
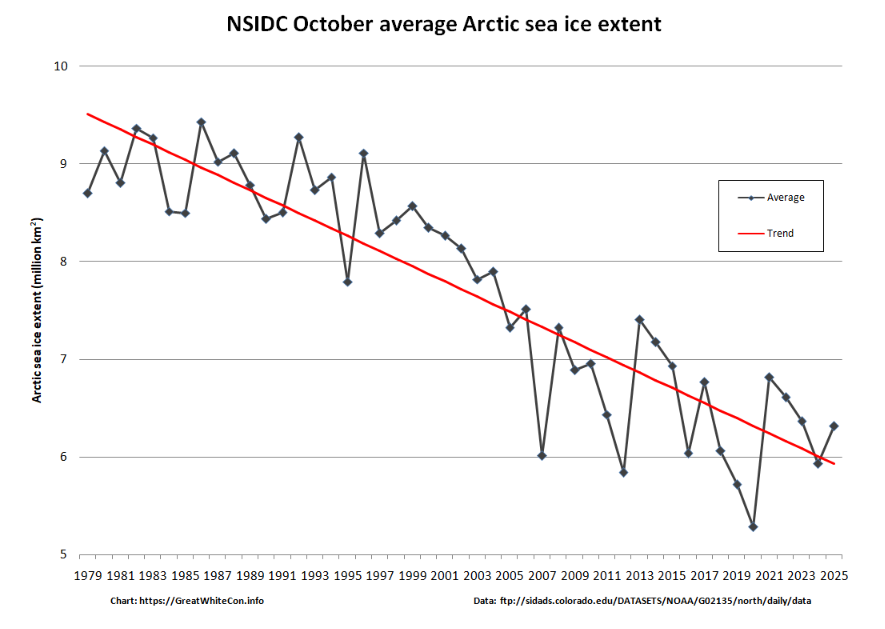
However, average NSIDC extent for the month of October was higher than last year and above the linear trend:
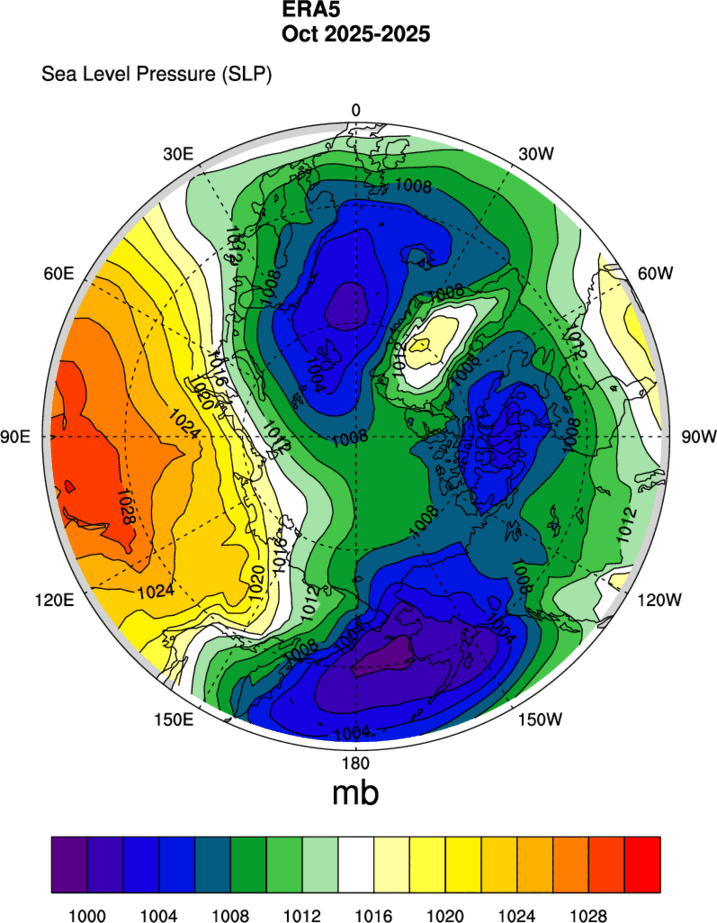
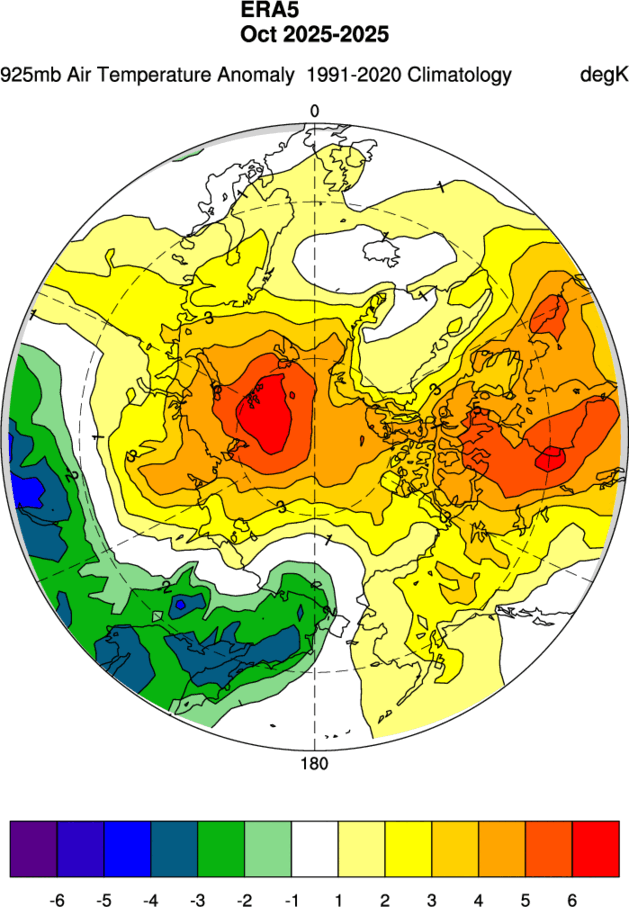
The ERA5 MSLP map for October shows high pressure over Siberia, associated with lower than normal air temperatures at 925 hPa across the region. However, temperatures across almost the entire Arctic Ocean were above normal:
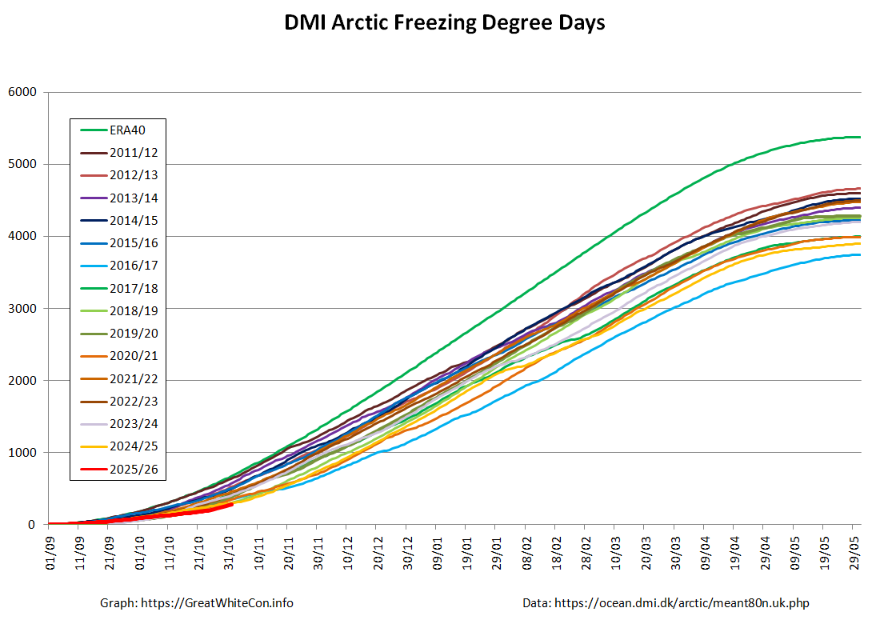
High Arctic freezing degree days based on DMI >80N data were lowest for the date at the beginning of November:
Bear in mind the caveats about the current lack of reliable SMOS data on the Atlantic side of the Arctic, and that Sentinel 3 data is only incorporated from Autumn 2023.
[Update – November 20th]
Refreeze of the Beaufort Sea is complete, and refreeze of the Kara Sea has started in earnest:
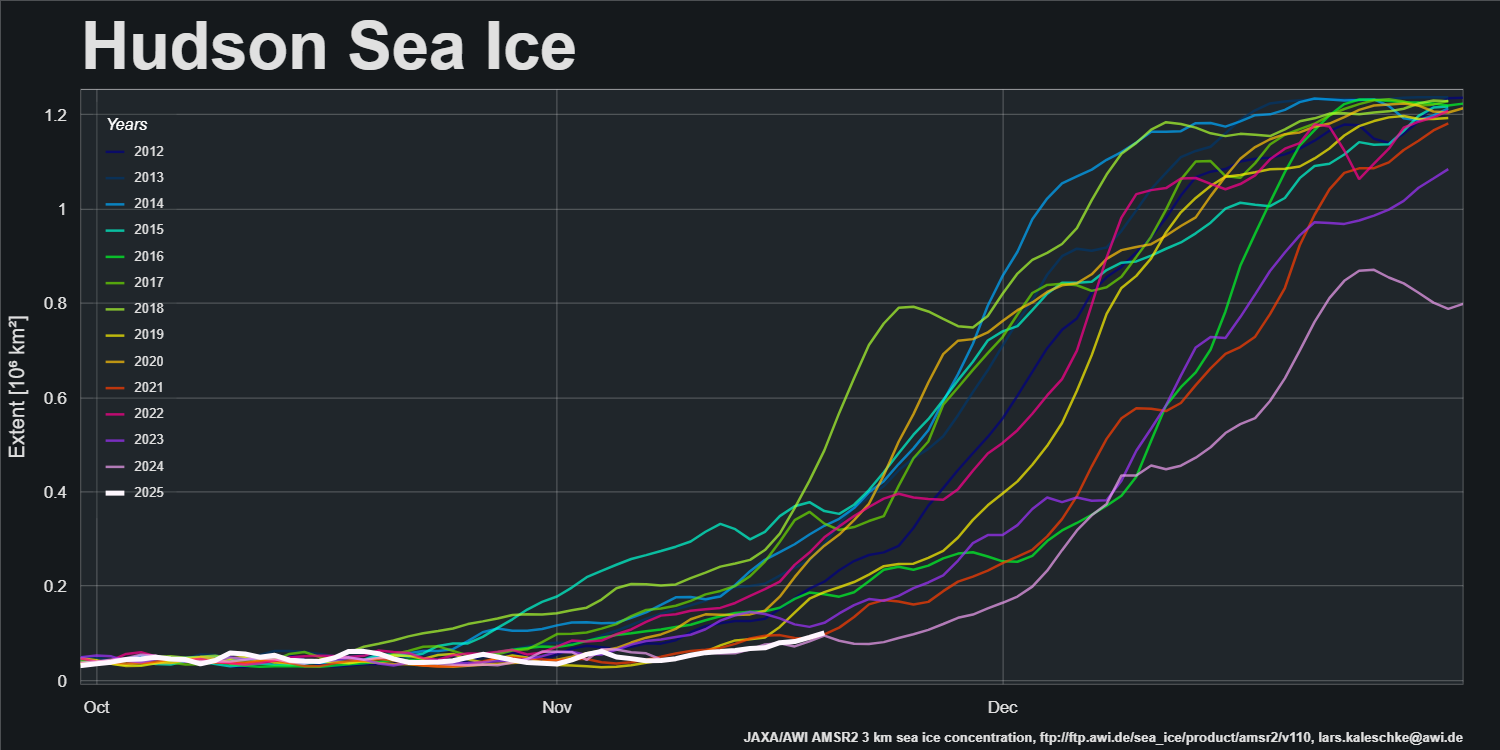
However, the Barents Sea is still sea ice free and refreeze of Hudson Bay has barely begun:
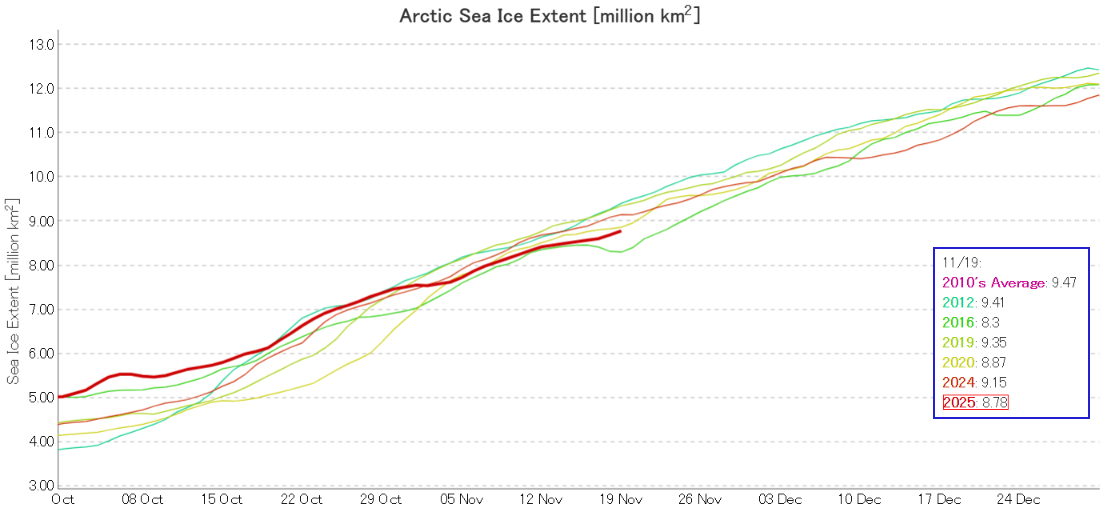
JAXA extent is still second lowest for the date:
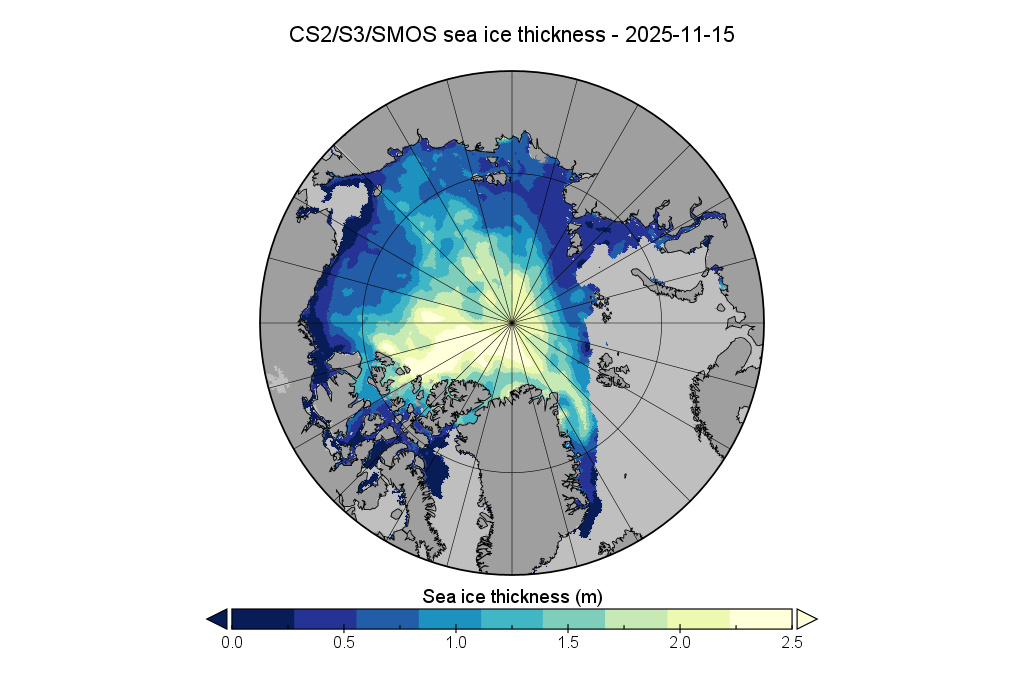
The PIOMAS gridded thickness data for October has yet to be corrected, but here is the mid month thickness map from AWI:
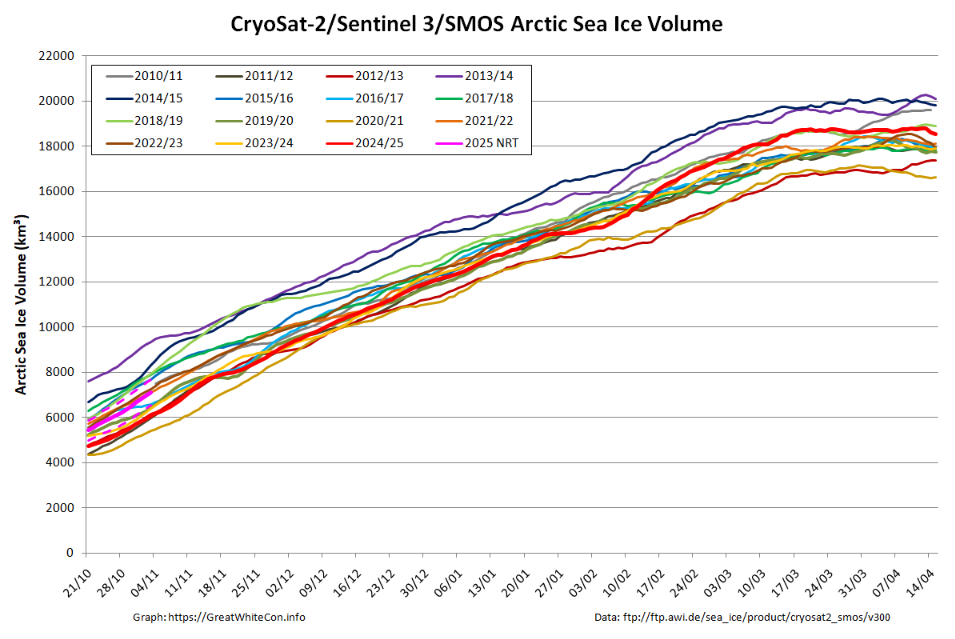
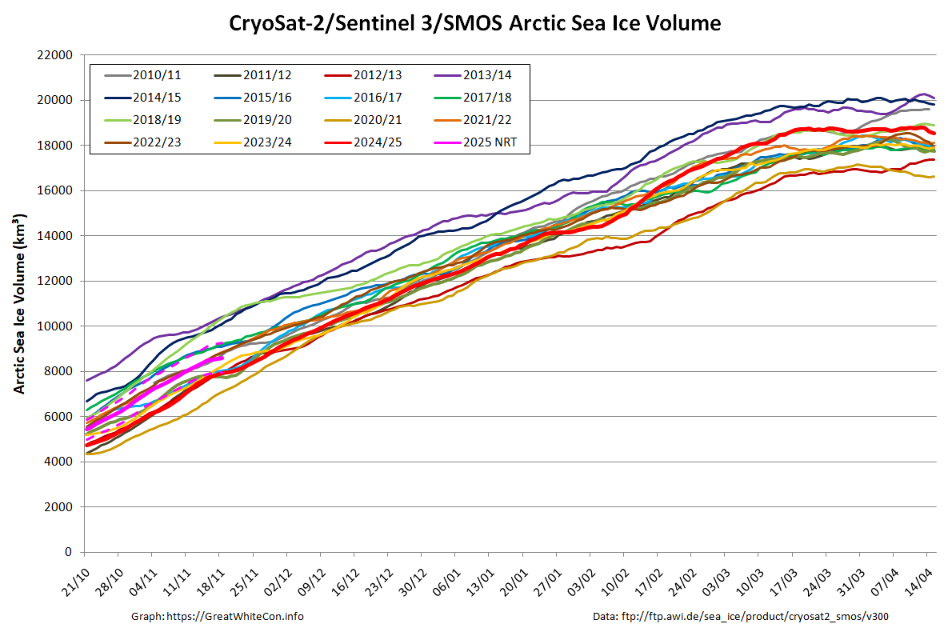
Here too is the associated volume graph:
[Update – November 27th]
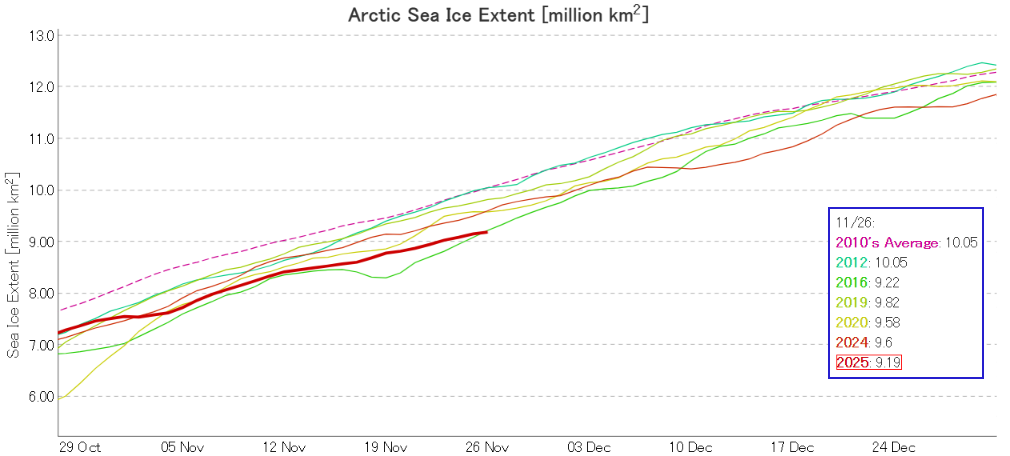
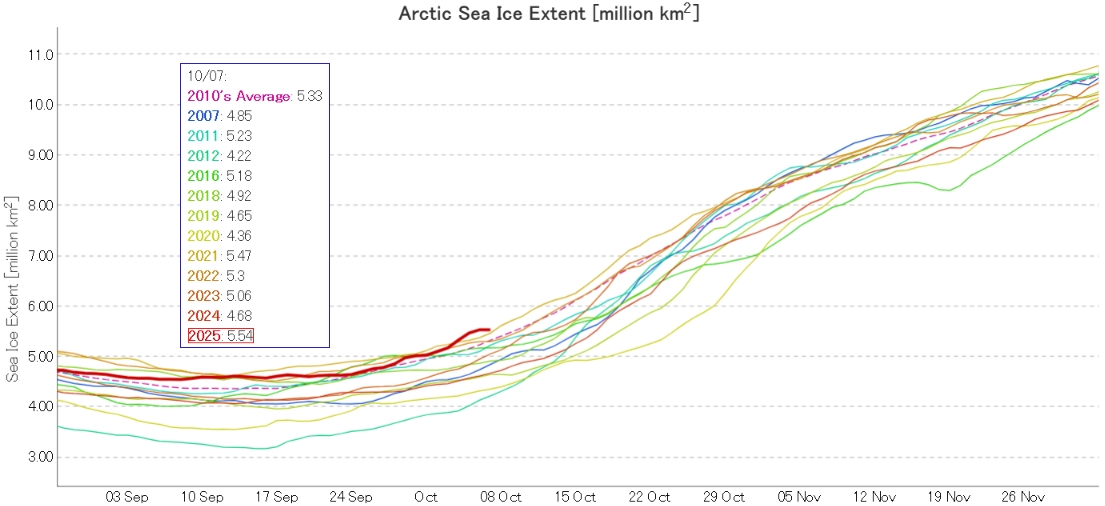
JAXA/ViSHOP extent is now lowest for the date in their record going back to 1978:
[Update – December 5th]
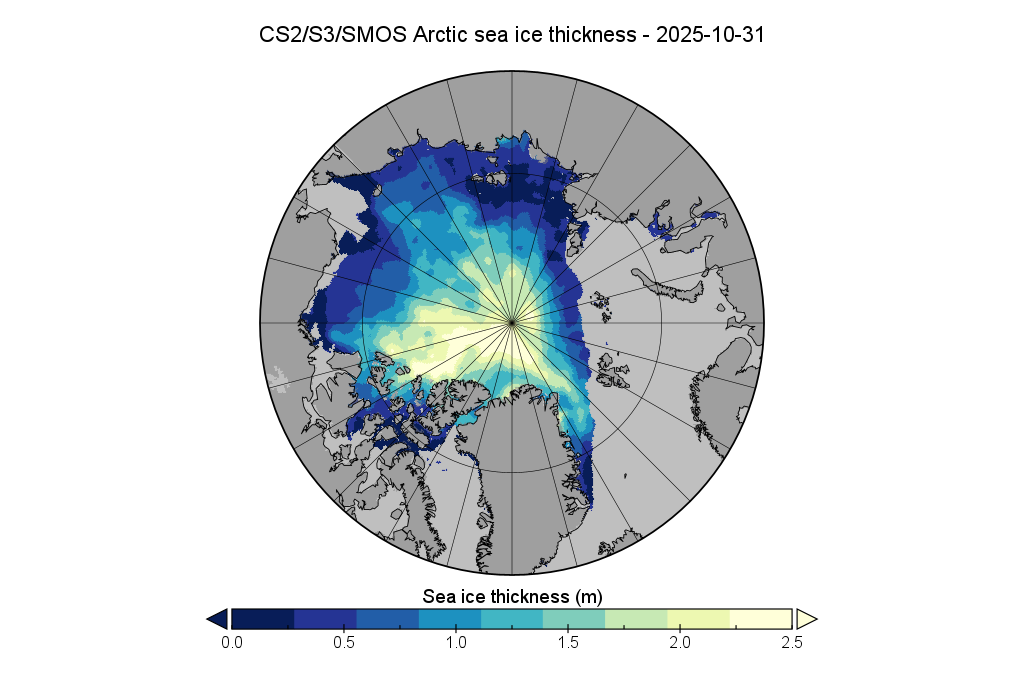
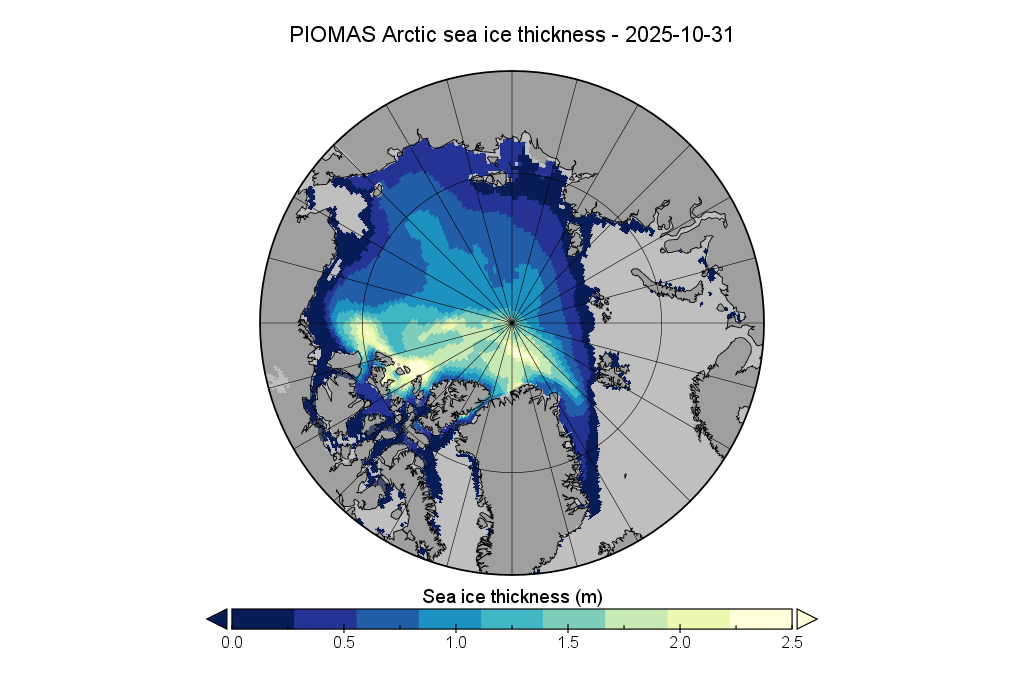
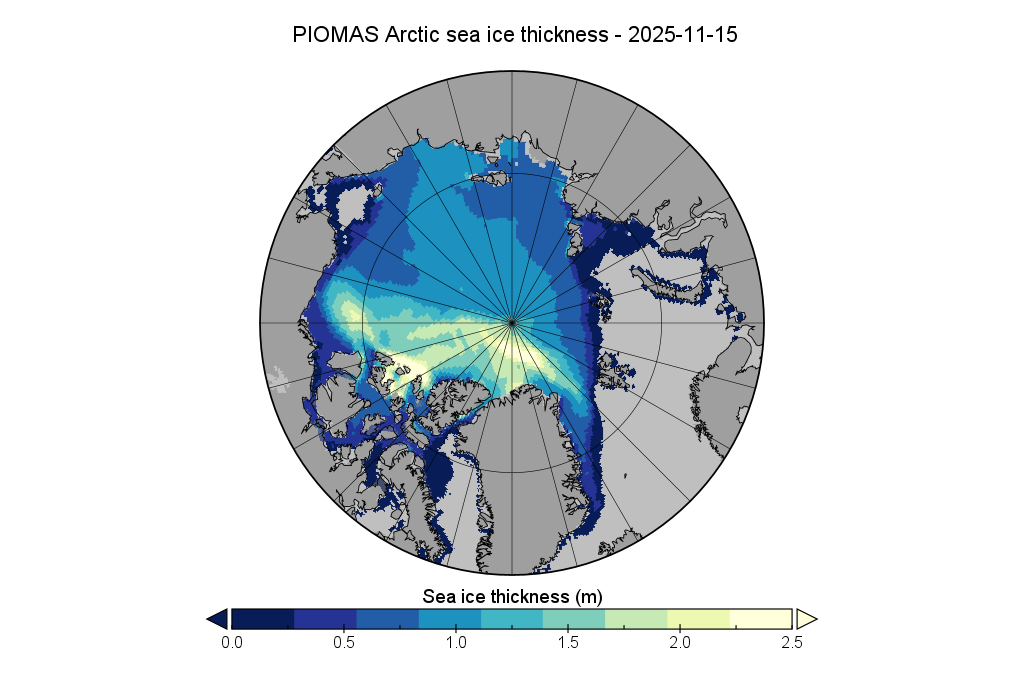
The PIOMAS team have finally published gridded thickness data for October and November, so here are the October 31st and November 15th thickness maps:
The conversation continues over on the December open thread, including the latest PIOMAS data.
I was hoping that the September PIOMAS gridded thickness data would have been published by now, but no such luck. Reverting to JAXA/ViSHOP extent, after flatlining for most of September the refreeze has started in earnest over the last two weeks. Extent is currently 12th lowest in the satellite era:
The latest sea ice concentration map from Lars Kaleschke of the Alfred Wegener Institute, based on AMSR2 data, reveals plenty of new ice in the Beaufort Sea, plus a bit more to the north of the Laptev Sea:
The latest sea ice “stage of development” charts from the Canadian Ice Service confirm that, and reveal more new ice that has yet to show up in the AMSR2 data:
[Update – October 11th]
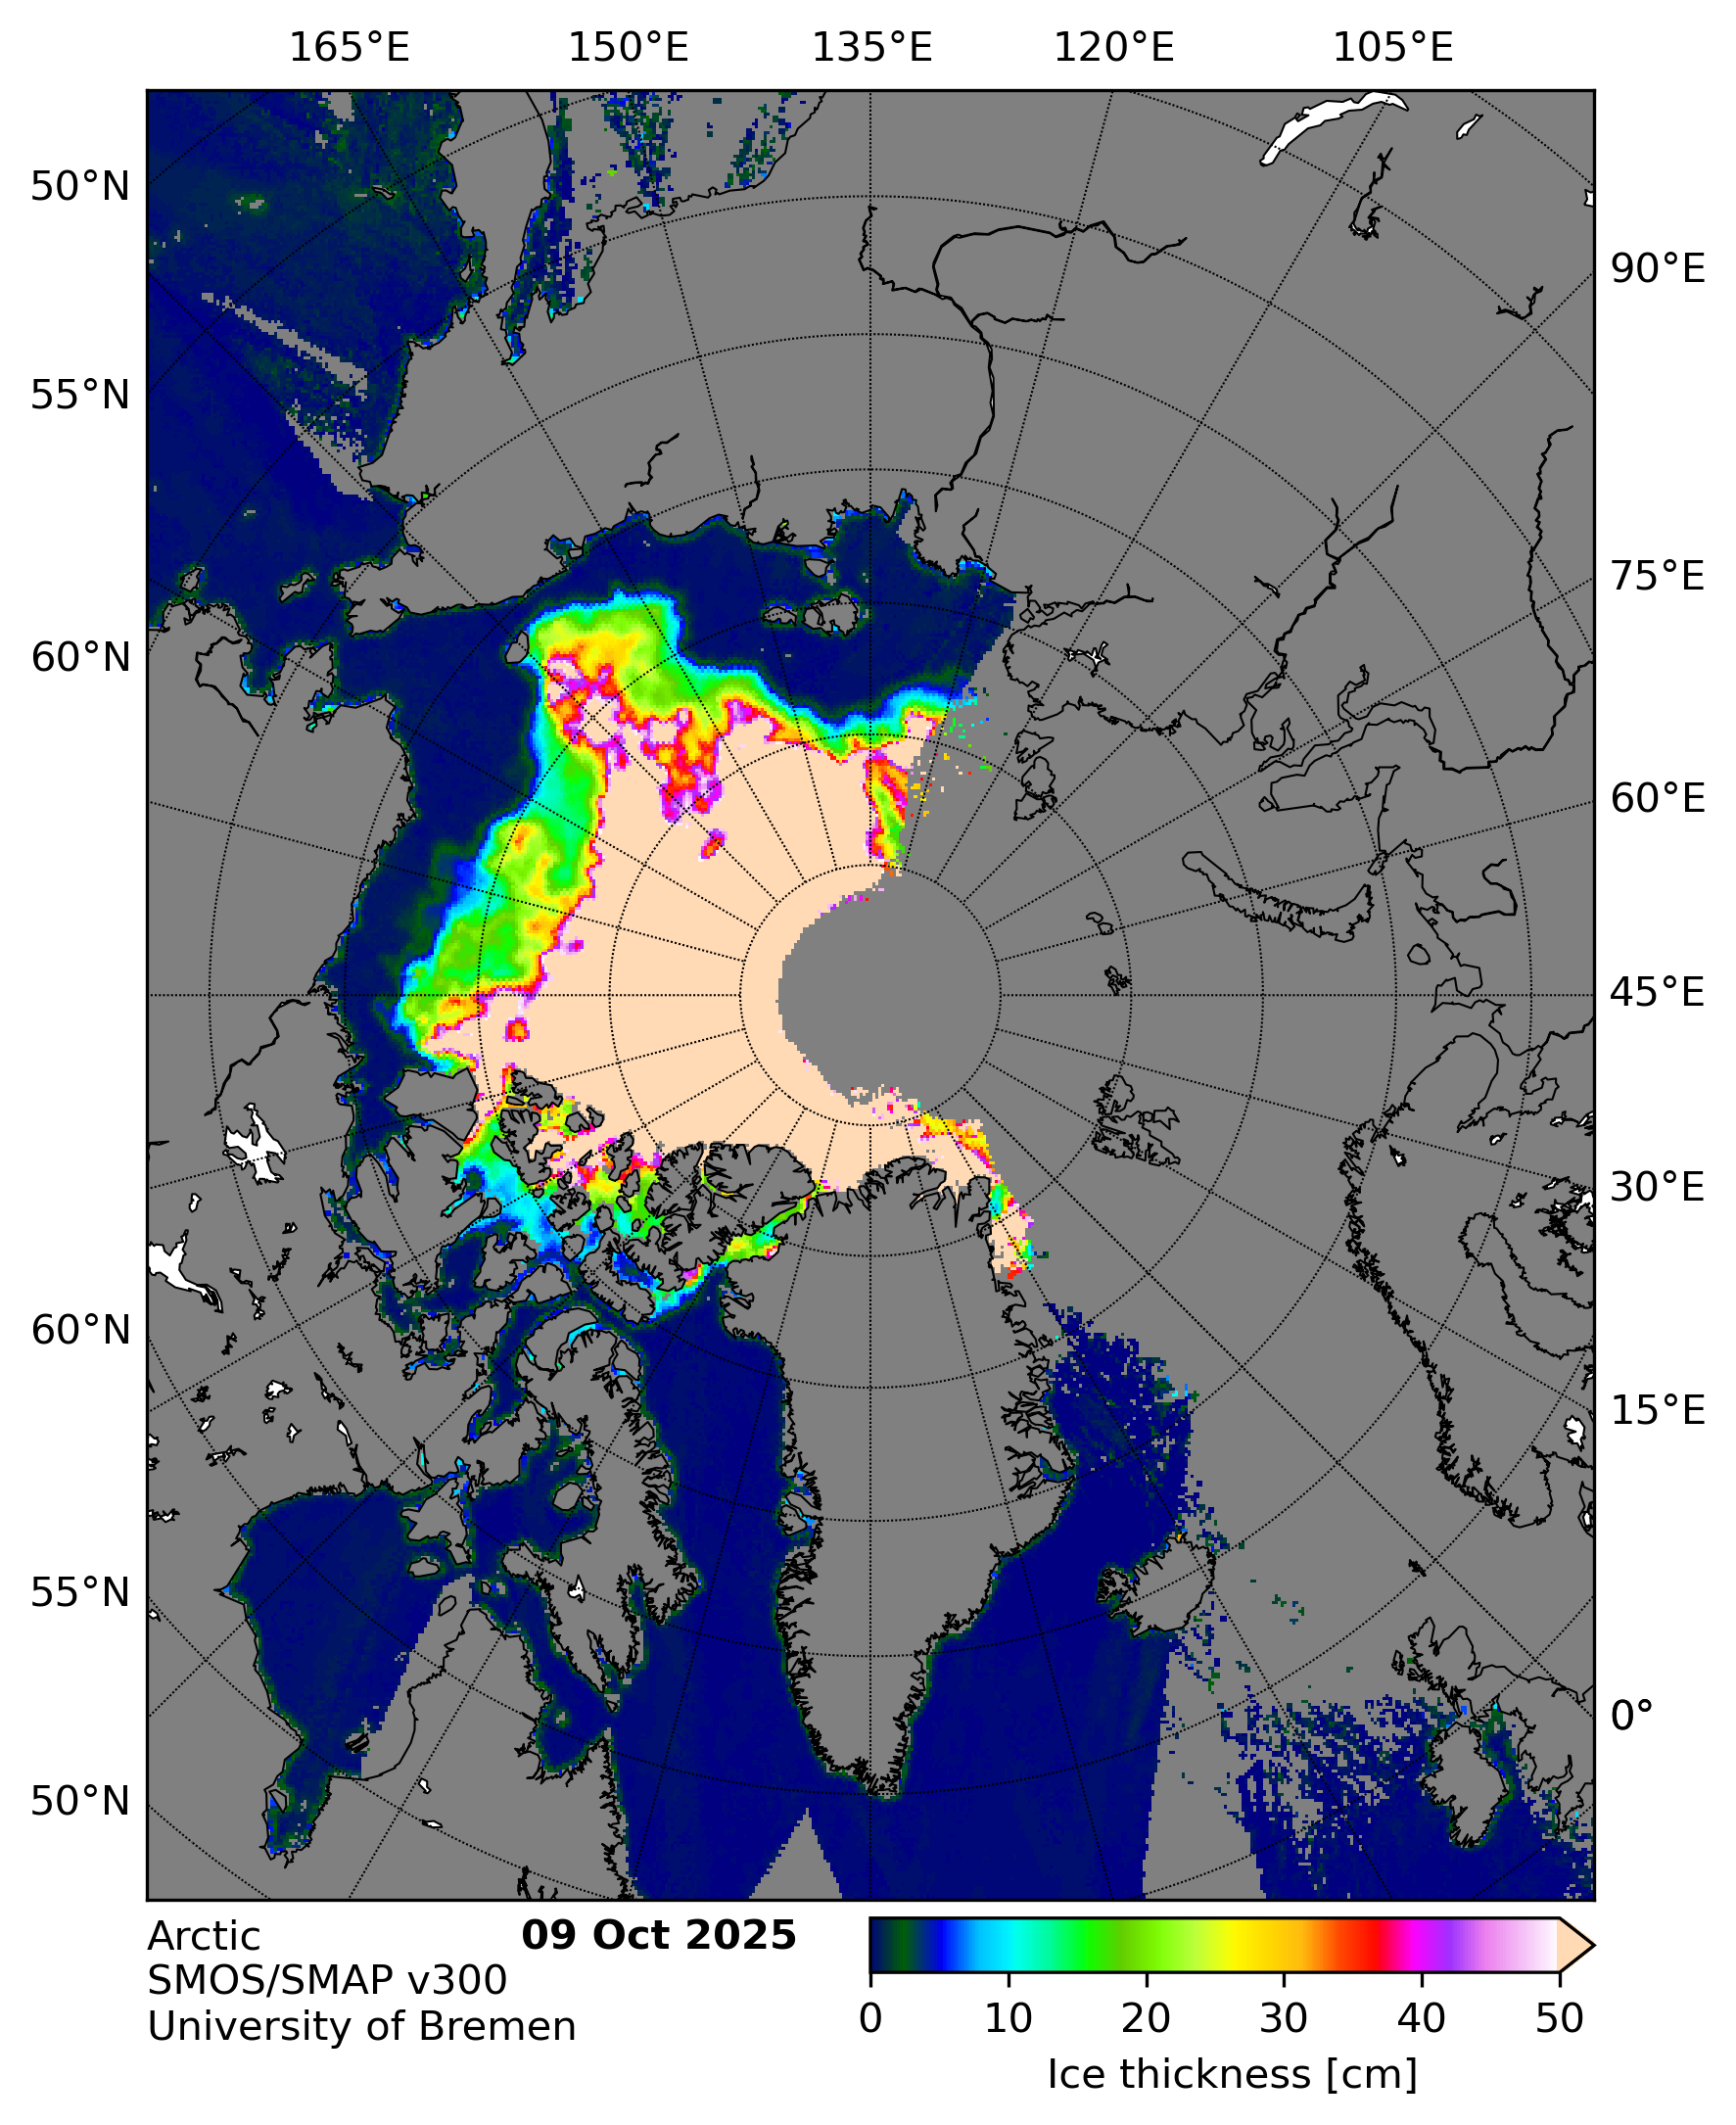
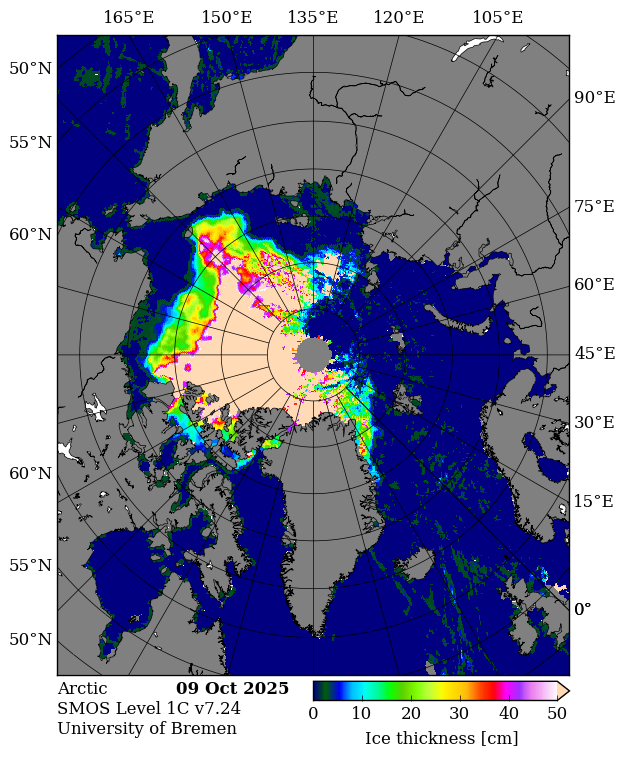
In the continuing absence of PIOMAS gridded thickness data (see below), here’s the latest SMOS/SMAP “thin ice thickness” map:
It appears to be badly affected by radio frequency interference on the Atlantic side of the Arctic. Here’s the raw SMOS map:
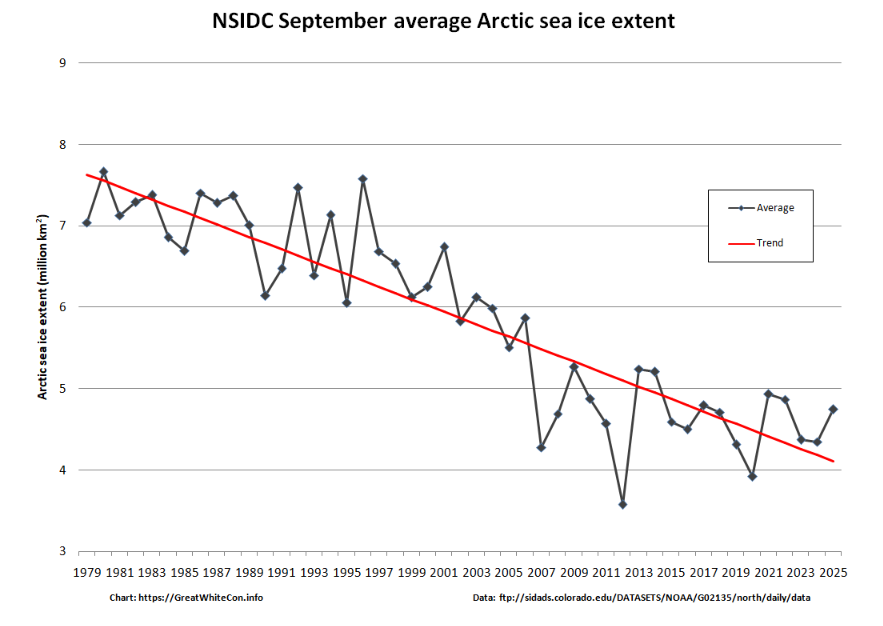
Further to a previous conversation on the subject, here’s the final NSIDC annual average extent graph for September:
As anticipated, 2025 annual average extent has proved to be the lowest in the satellite era.
[Update – October 16th]
I was hoping that the September edition of the NSIDC’s “Sea Ice Today” analysis would have been published by now, but no such luck. Here’s the latest data announcement from the NSIDC:
Effective October 15, 2025, due to non-renewed funding, NSIDC has suspended or reduced several Sea Ice Today tools and services.
Sea ice annual maximum and minimum announcements (typically occurring in March and September)
Previously-published Sea Ice Today analysis posts will remain online. The discontinued Sea Ice Today products will no longer update or be maintained, and will be removed in the next several weeks.
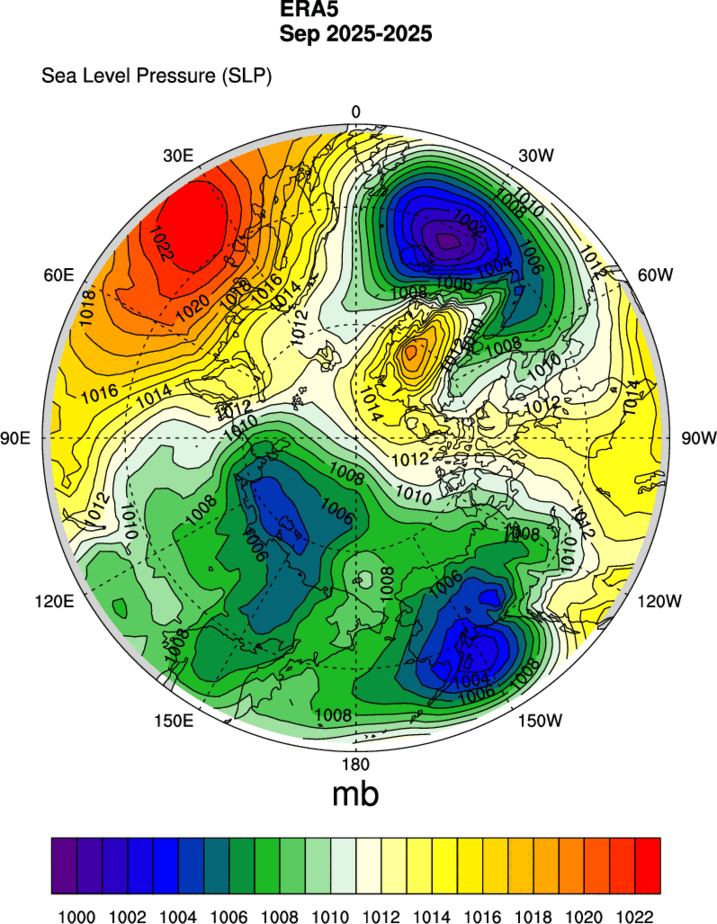
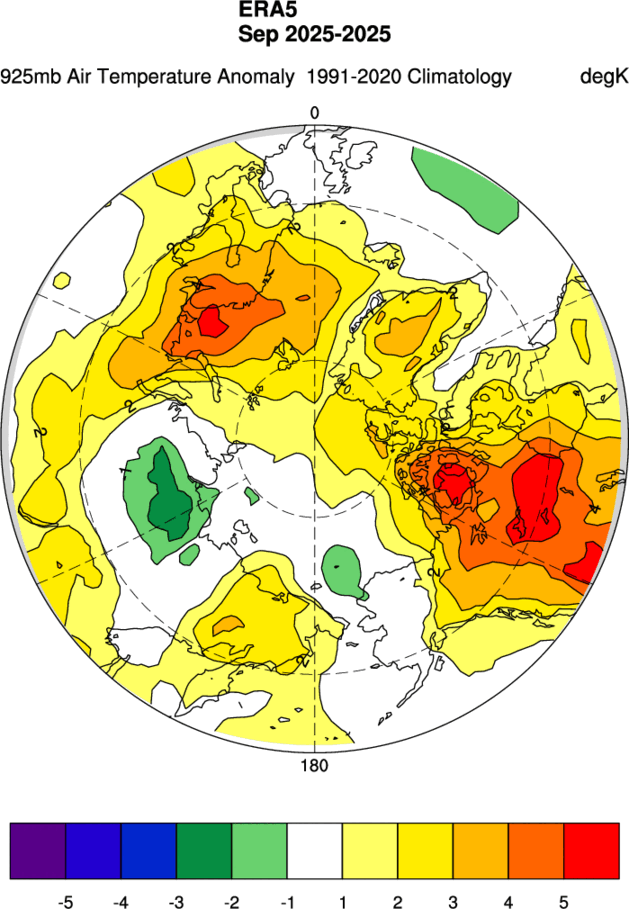
In Sea Ice Today’s absence, here’s the MSLP and 925 hPa temperature maps for September, usually contained in the monthly analysis articles:
Plus a hastily constructed graph of the monthly average extent for September:
The Arctic sea ice volume derived therefrom is 5.43 thousand km³. The data is accompanied by the following “Product Degradation Warning”:
SMOS input data continues to be affected by persistent and frequent radio-frequency interference (RFI) in the Barents, Kara, and Laptev Seas, resulting in missing thin ice thickness measurements. Consequently, sea ice thickness estimates for this region in the product will rely exclusively on radar altimeter data, which may lead to higher reported values than would have been obtained using SMOS.
[Update – October 27th]
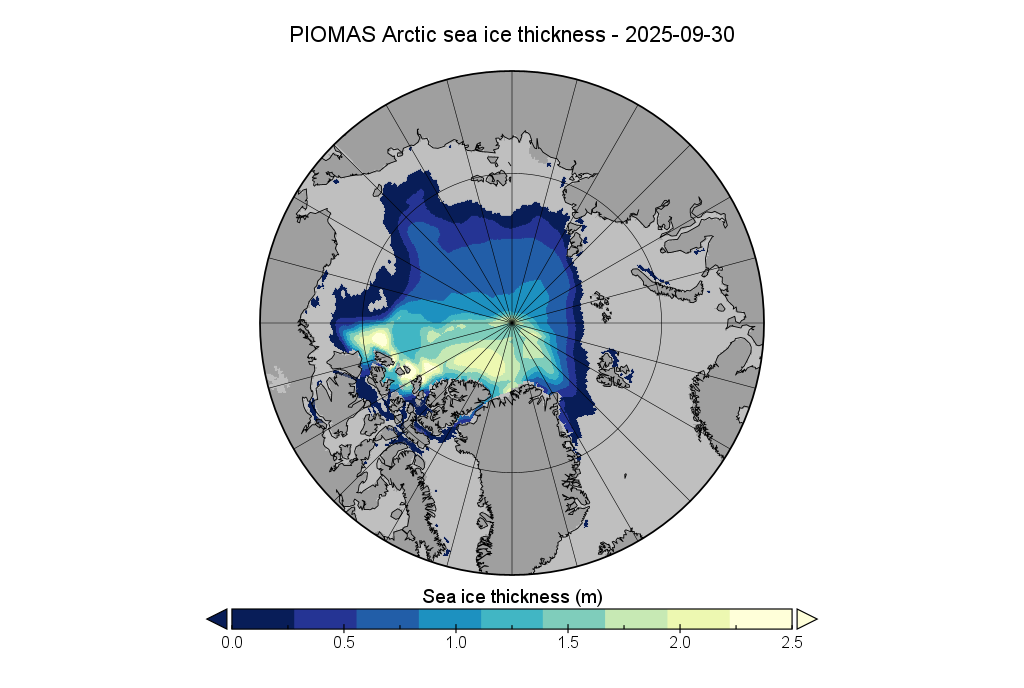
The PIOMAS gridded thickness data for September 2025 has been belatedly released:
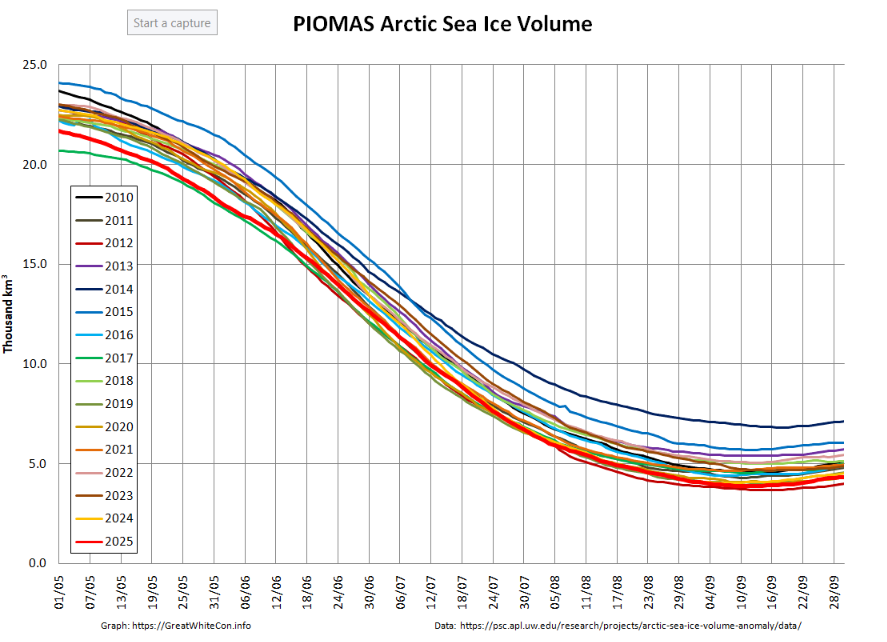
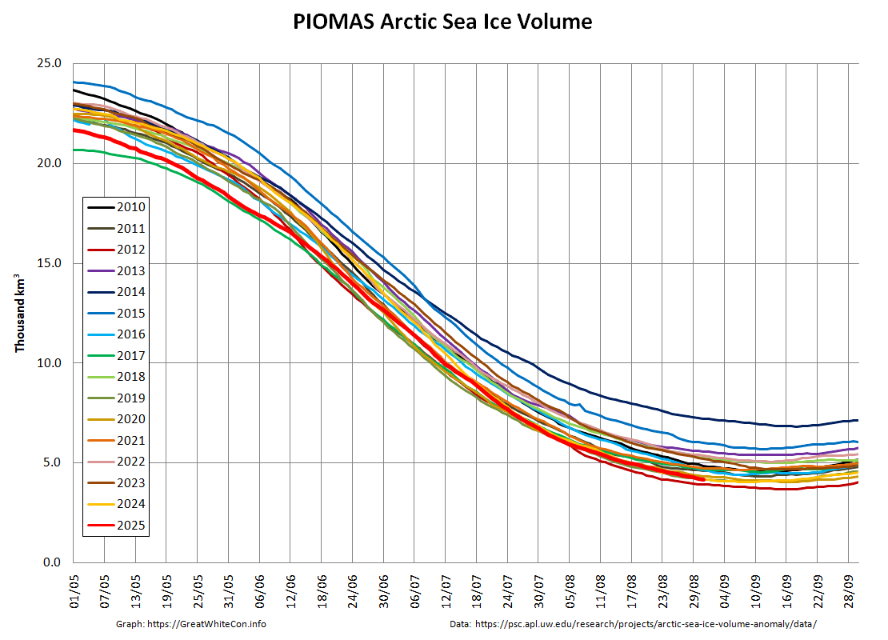
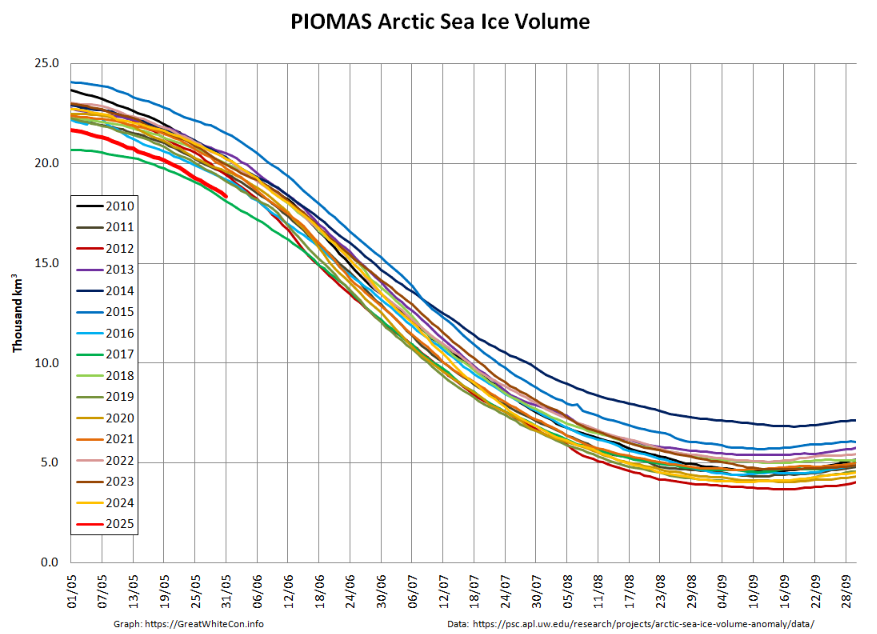
The associated volume graph reveals that the 2025 minimum modelled Arctic sea ice volume was 3.87 thousand km³ on September 12th, which is the 2nd lowest minimum in the PIOMAS record going back to 1979:
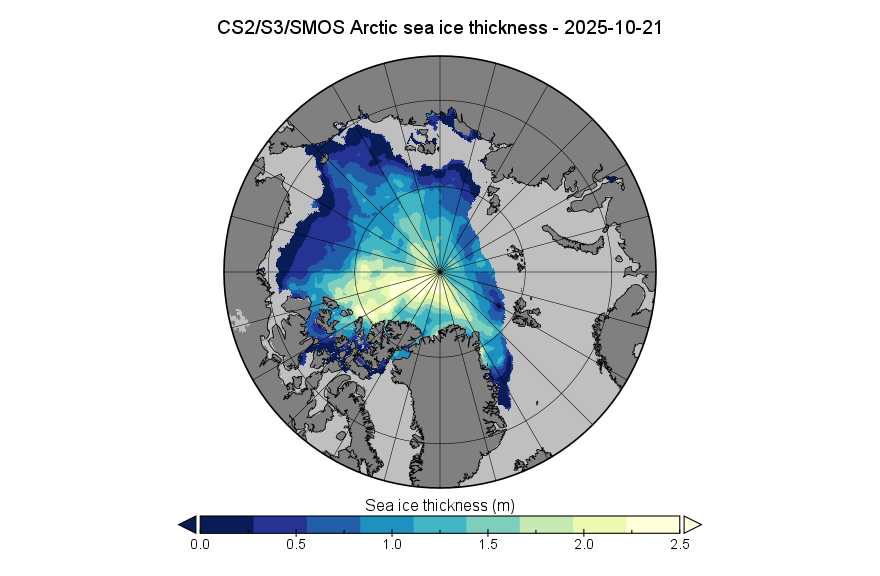
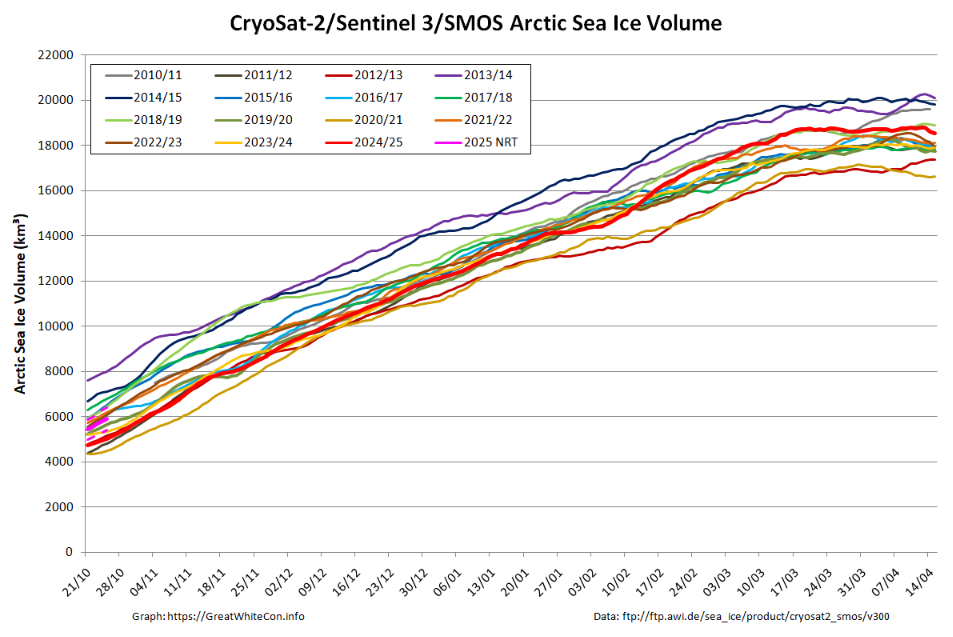
Whilst we’re on the topic of sea ice volume, here’s the latest “measured” volume graph:
Note the proviso about recent SMOS data above, and also that the version 3.00 data from AWI is currently only available beginning in Autumn 2023. Prior years shown on the graph above are based on version 2.06 data, which amongst other things does not incorporate Sentinel 3 data.
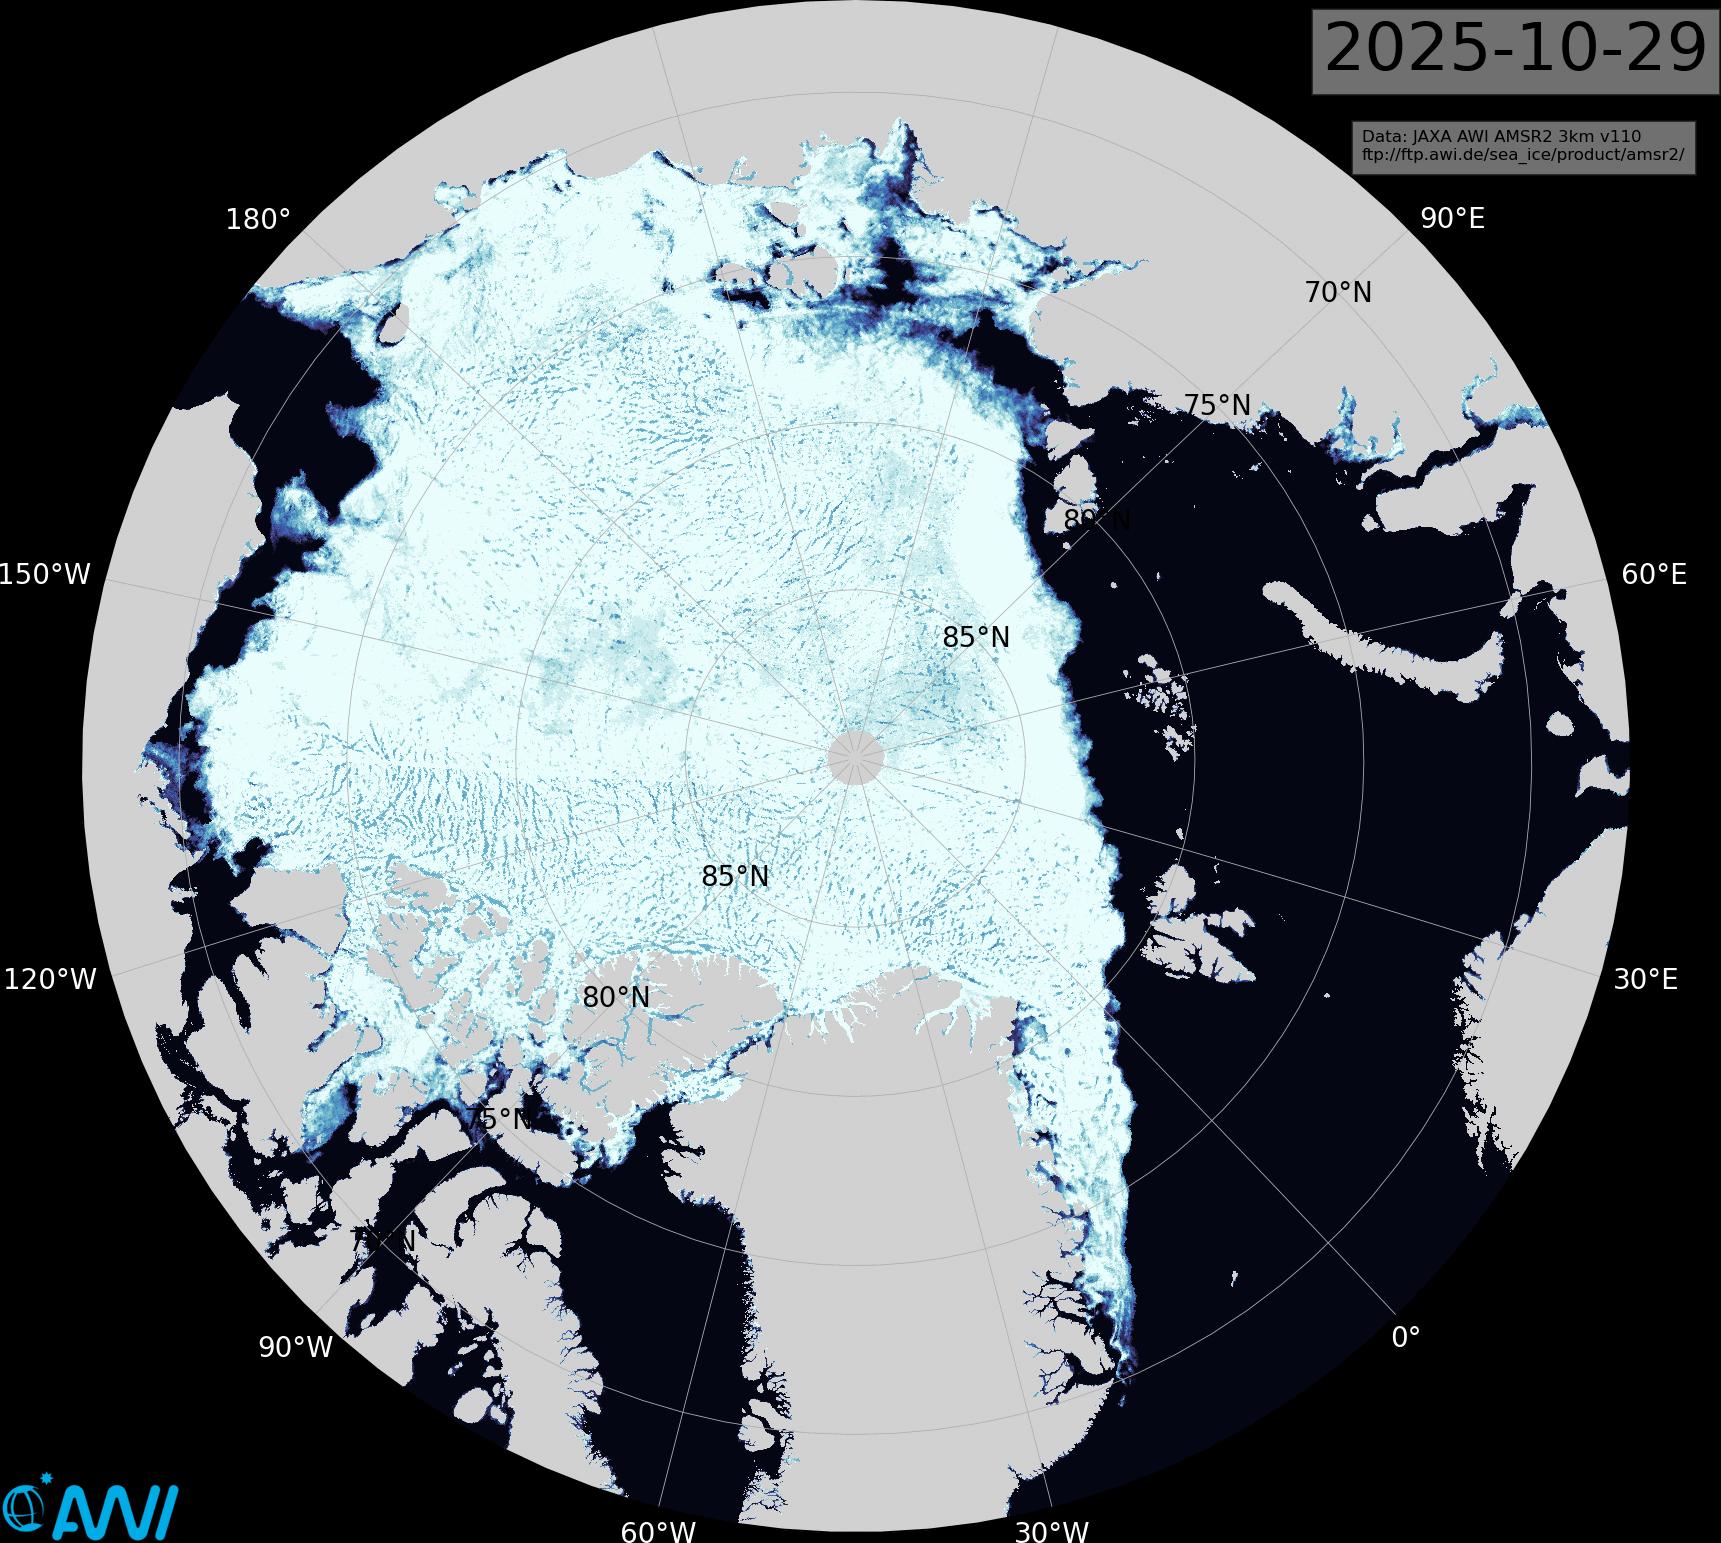
[Update – October 29th]
Much of the Siberian side of the Arctic Ocean has now refrozen:
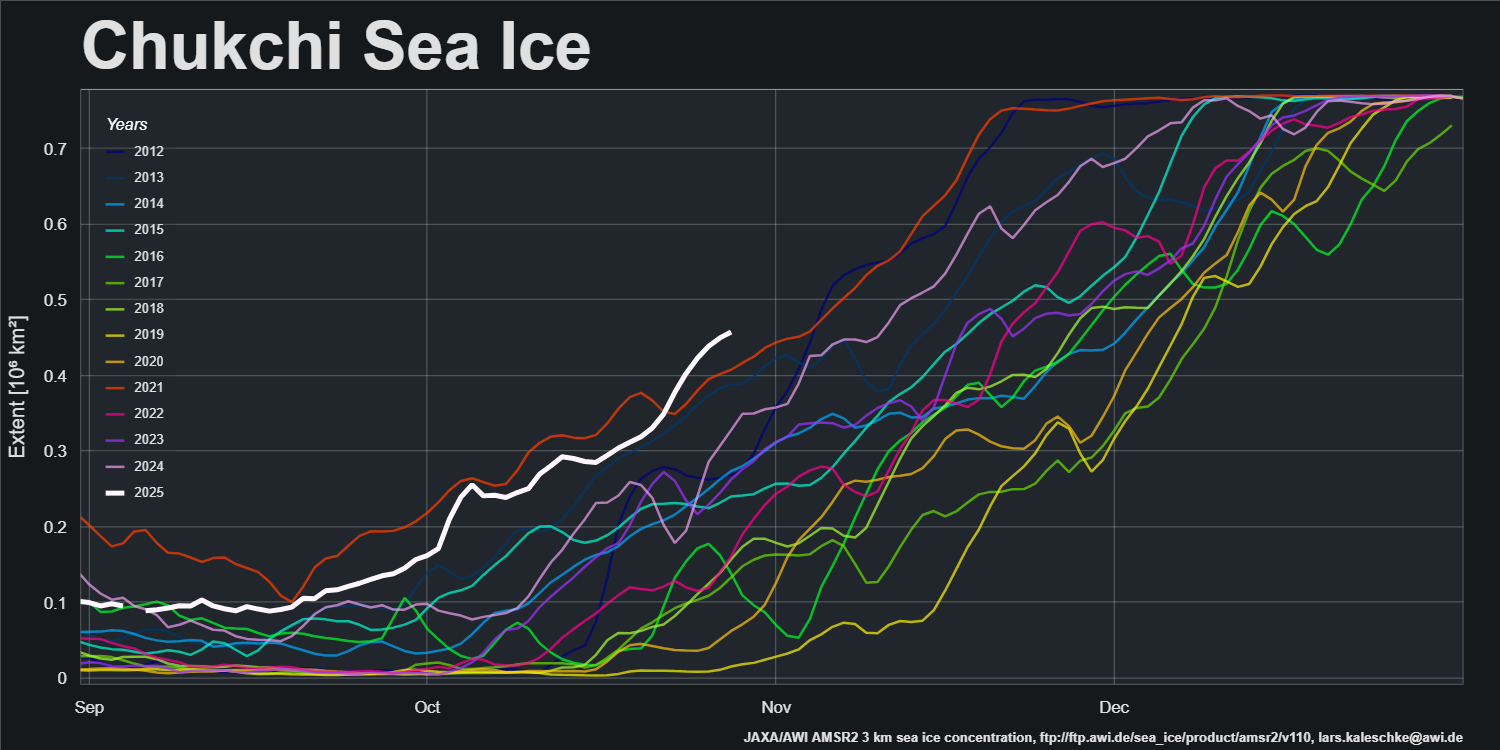
There is a significant difference between progress of the refreeze on the the Pacific and Atlantic sides of the Arctic. Extent in the Chukchi Sea is currently highest for the date in the AMSR2 record:
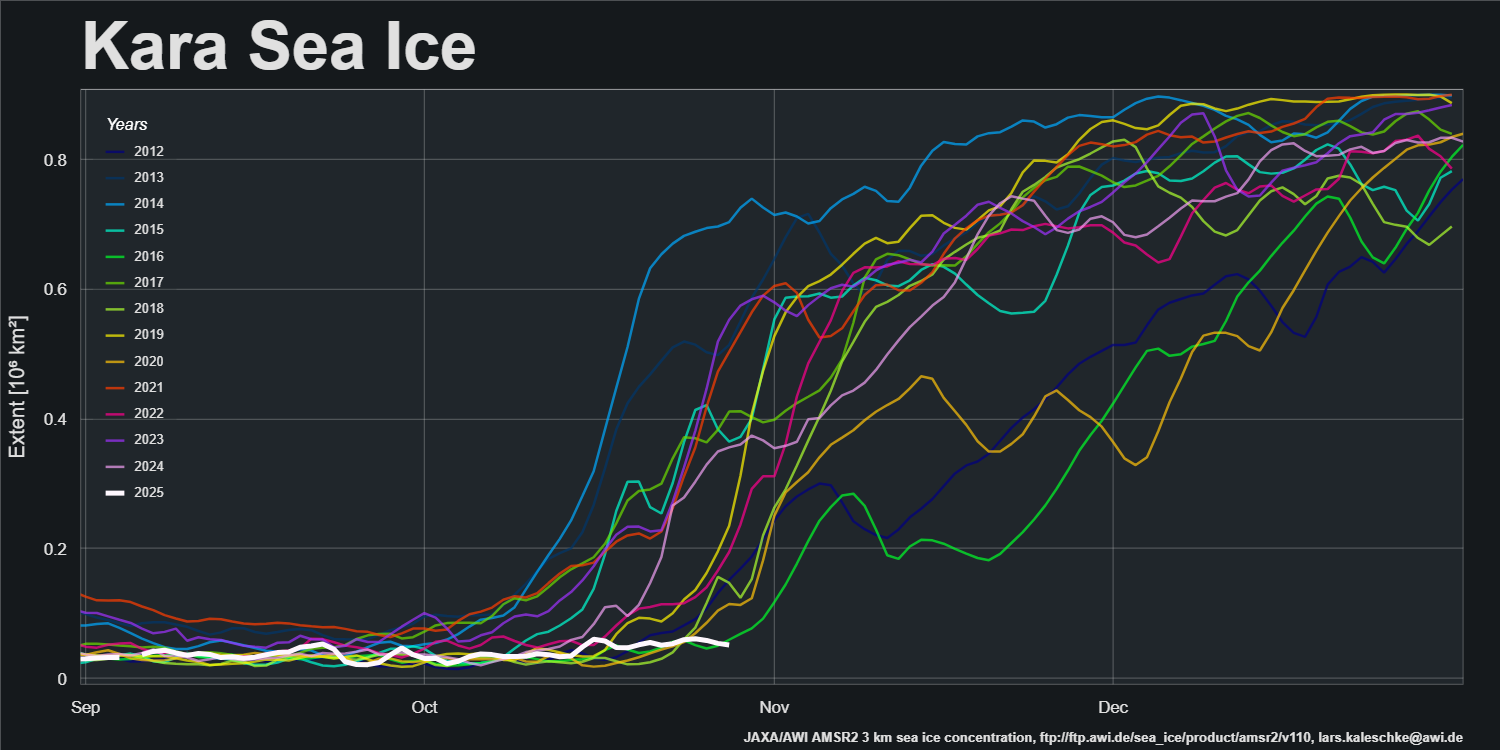
However, refreeze of the Kara Sea has yet to begin, and extent is currently lowest for the date in the AMSR2 record:
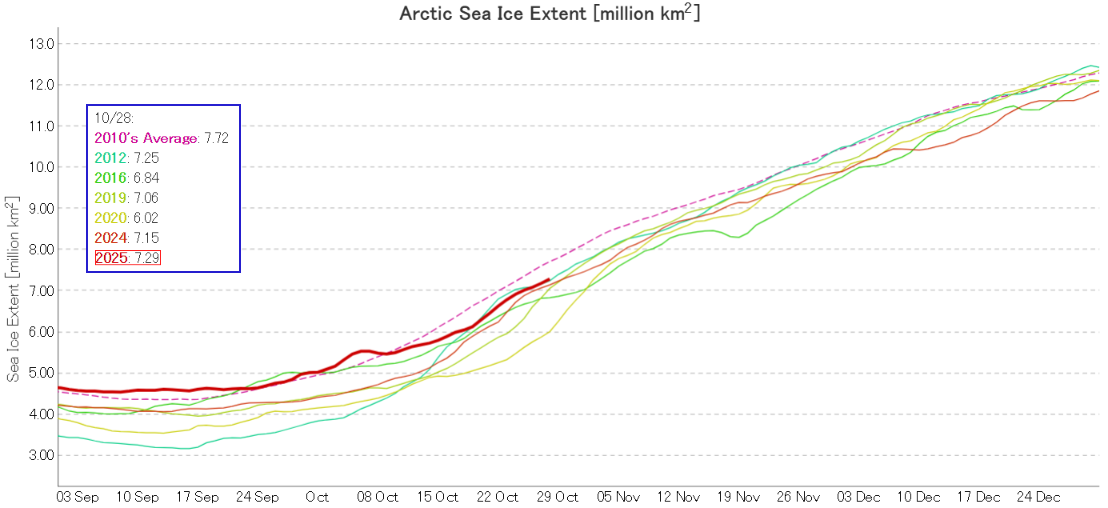
Pan Arctic JAXA/ViSHOP extent is now 6th lowest in the satellite era:
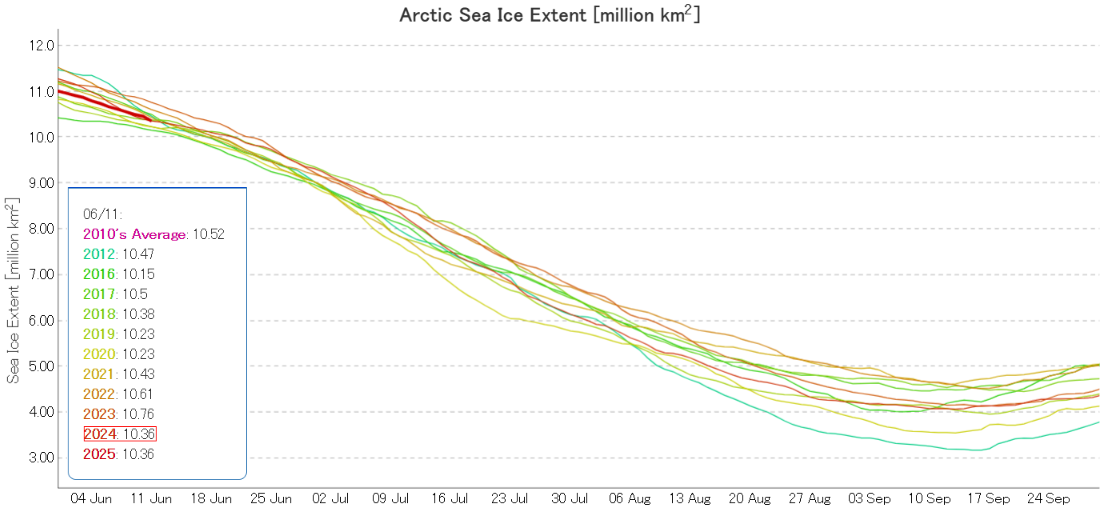
At the beginning of last month JAXA/ViSHOP extent was third lowest for the date in the satellite era. With the date of the 2025 minimum extent rapidly approaching that is no longer the case:
Whilst JAXA extent is now 10th lowest, PIOMAS volume remains second lowest for the date:
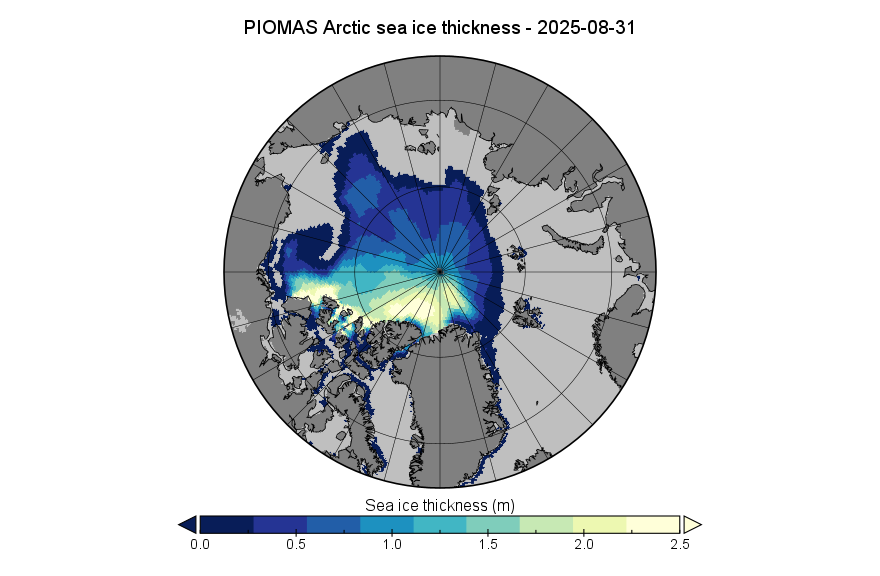
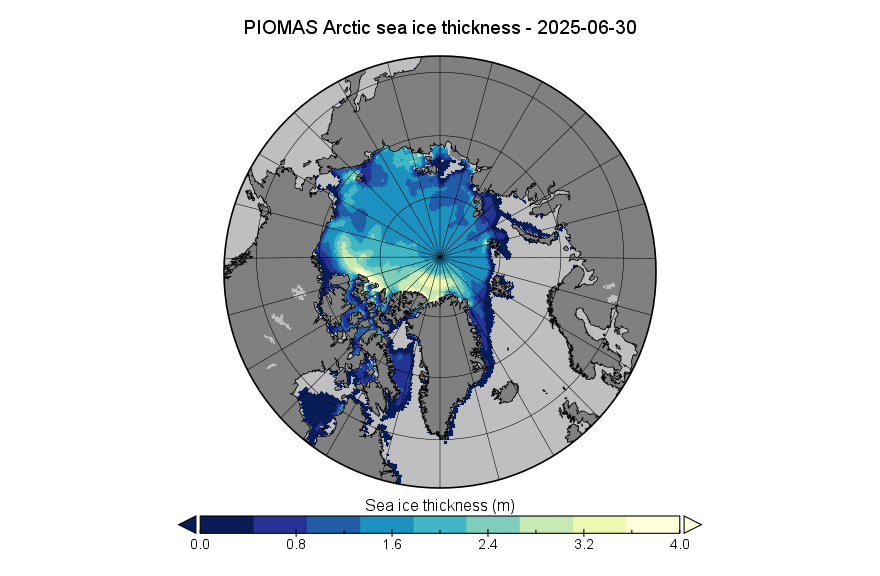
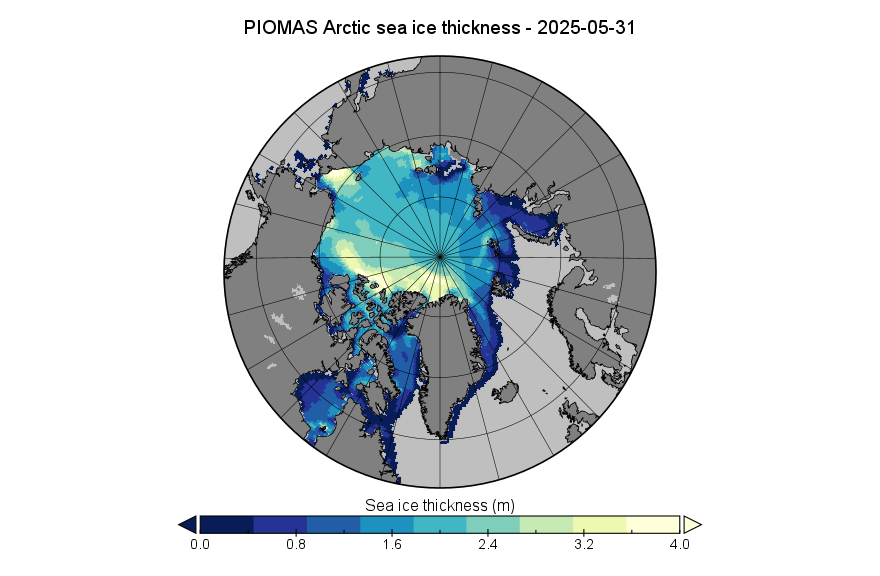
Here’s the associated thickness map. Note the change of scale from last month
Compare and contrast that map with the AWI’s sea ice concentration map, particularly in the Beaufort Sea area:
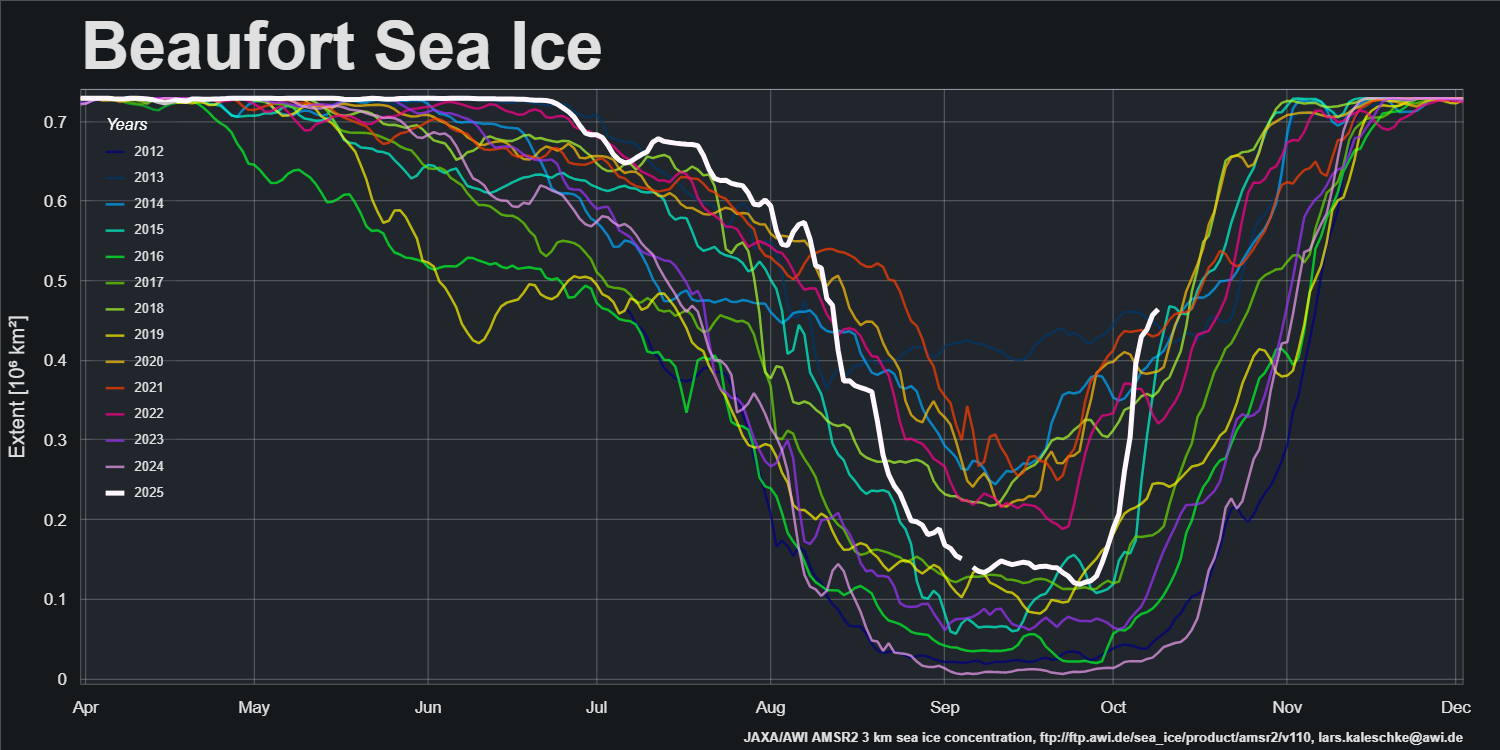
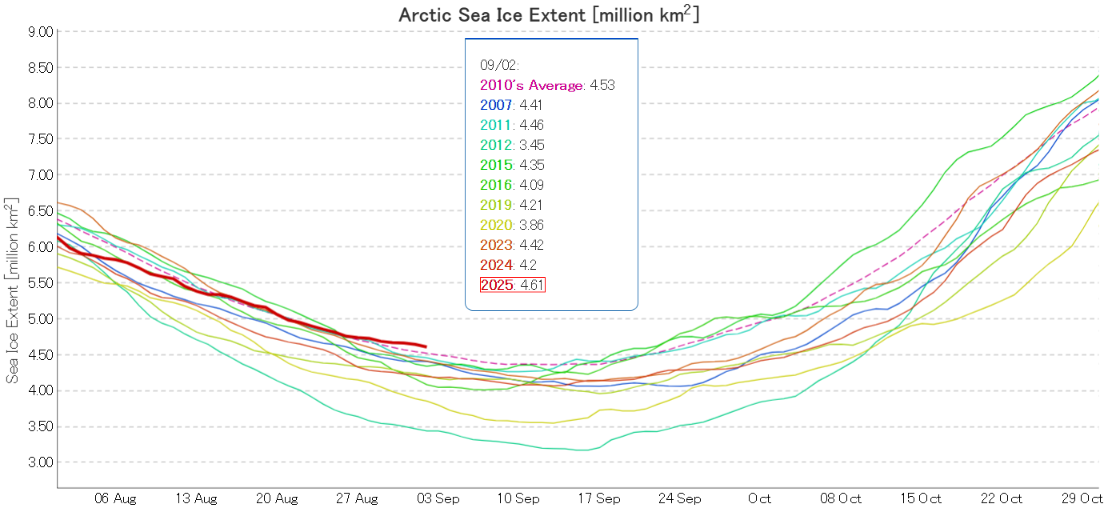
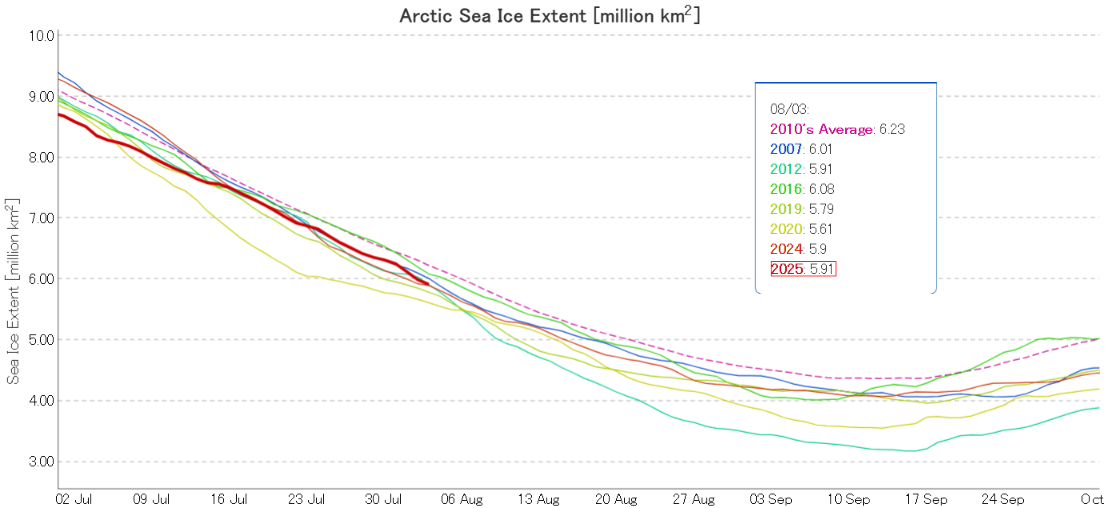
At the beginning of August JAXA/ViSHOP extent is in a “statistical tie” for 3rd lowest for the date in the satellite era:
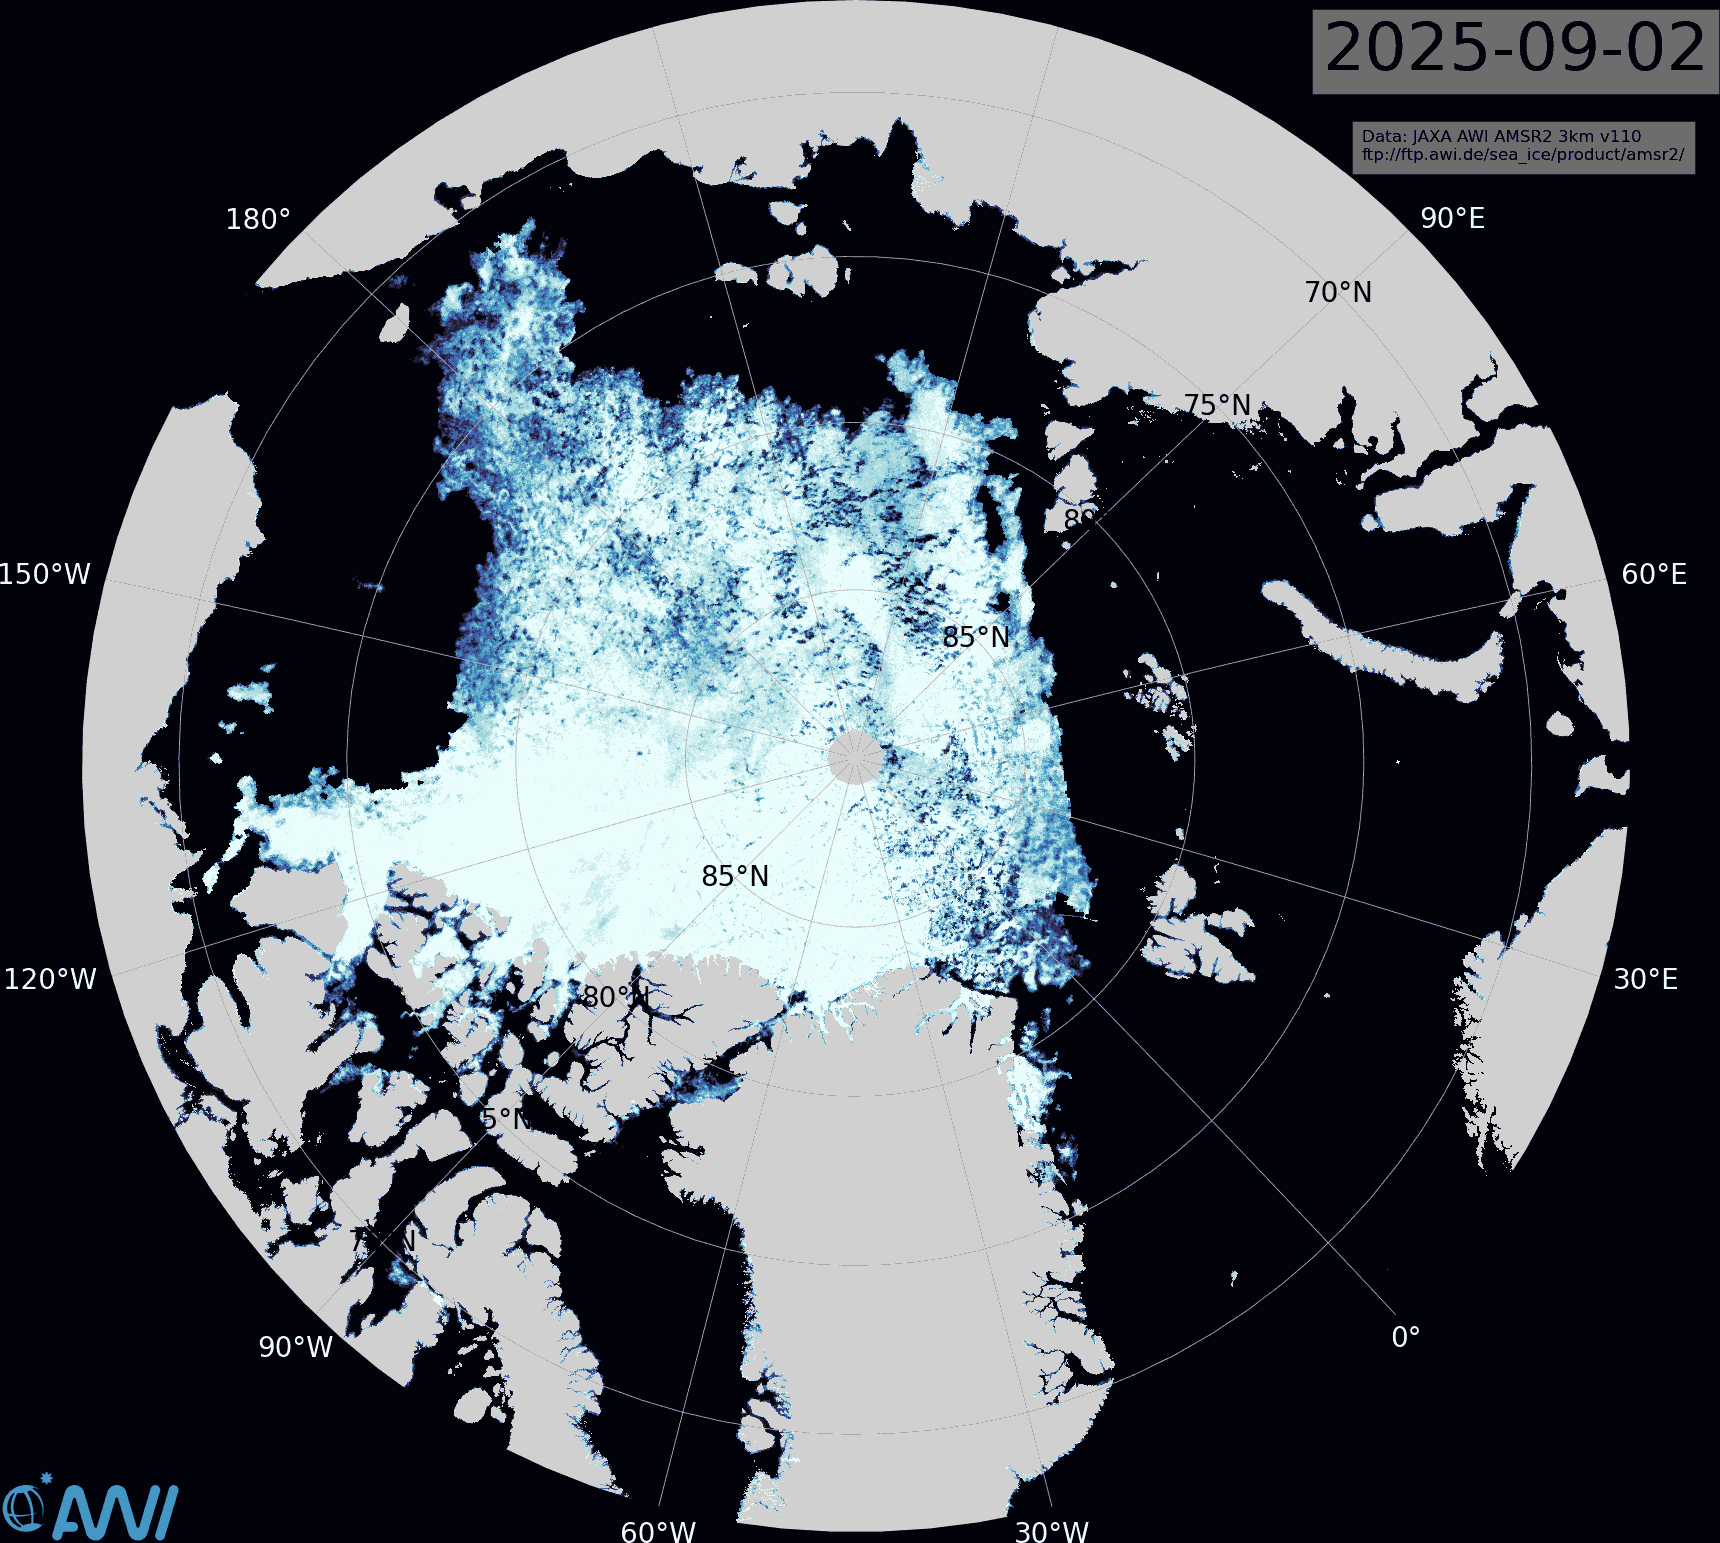
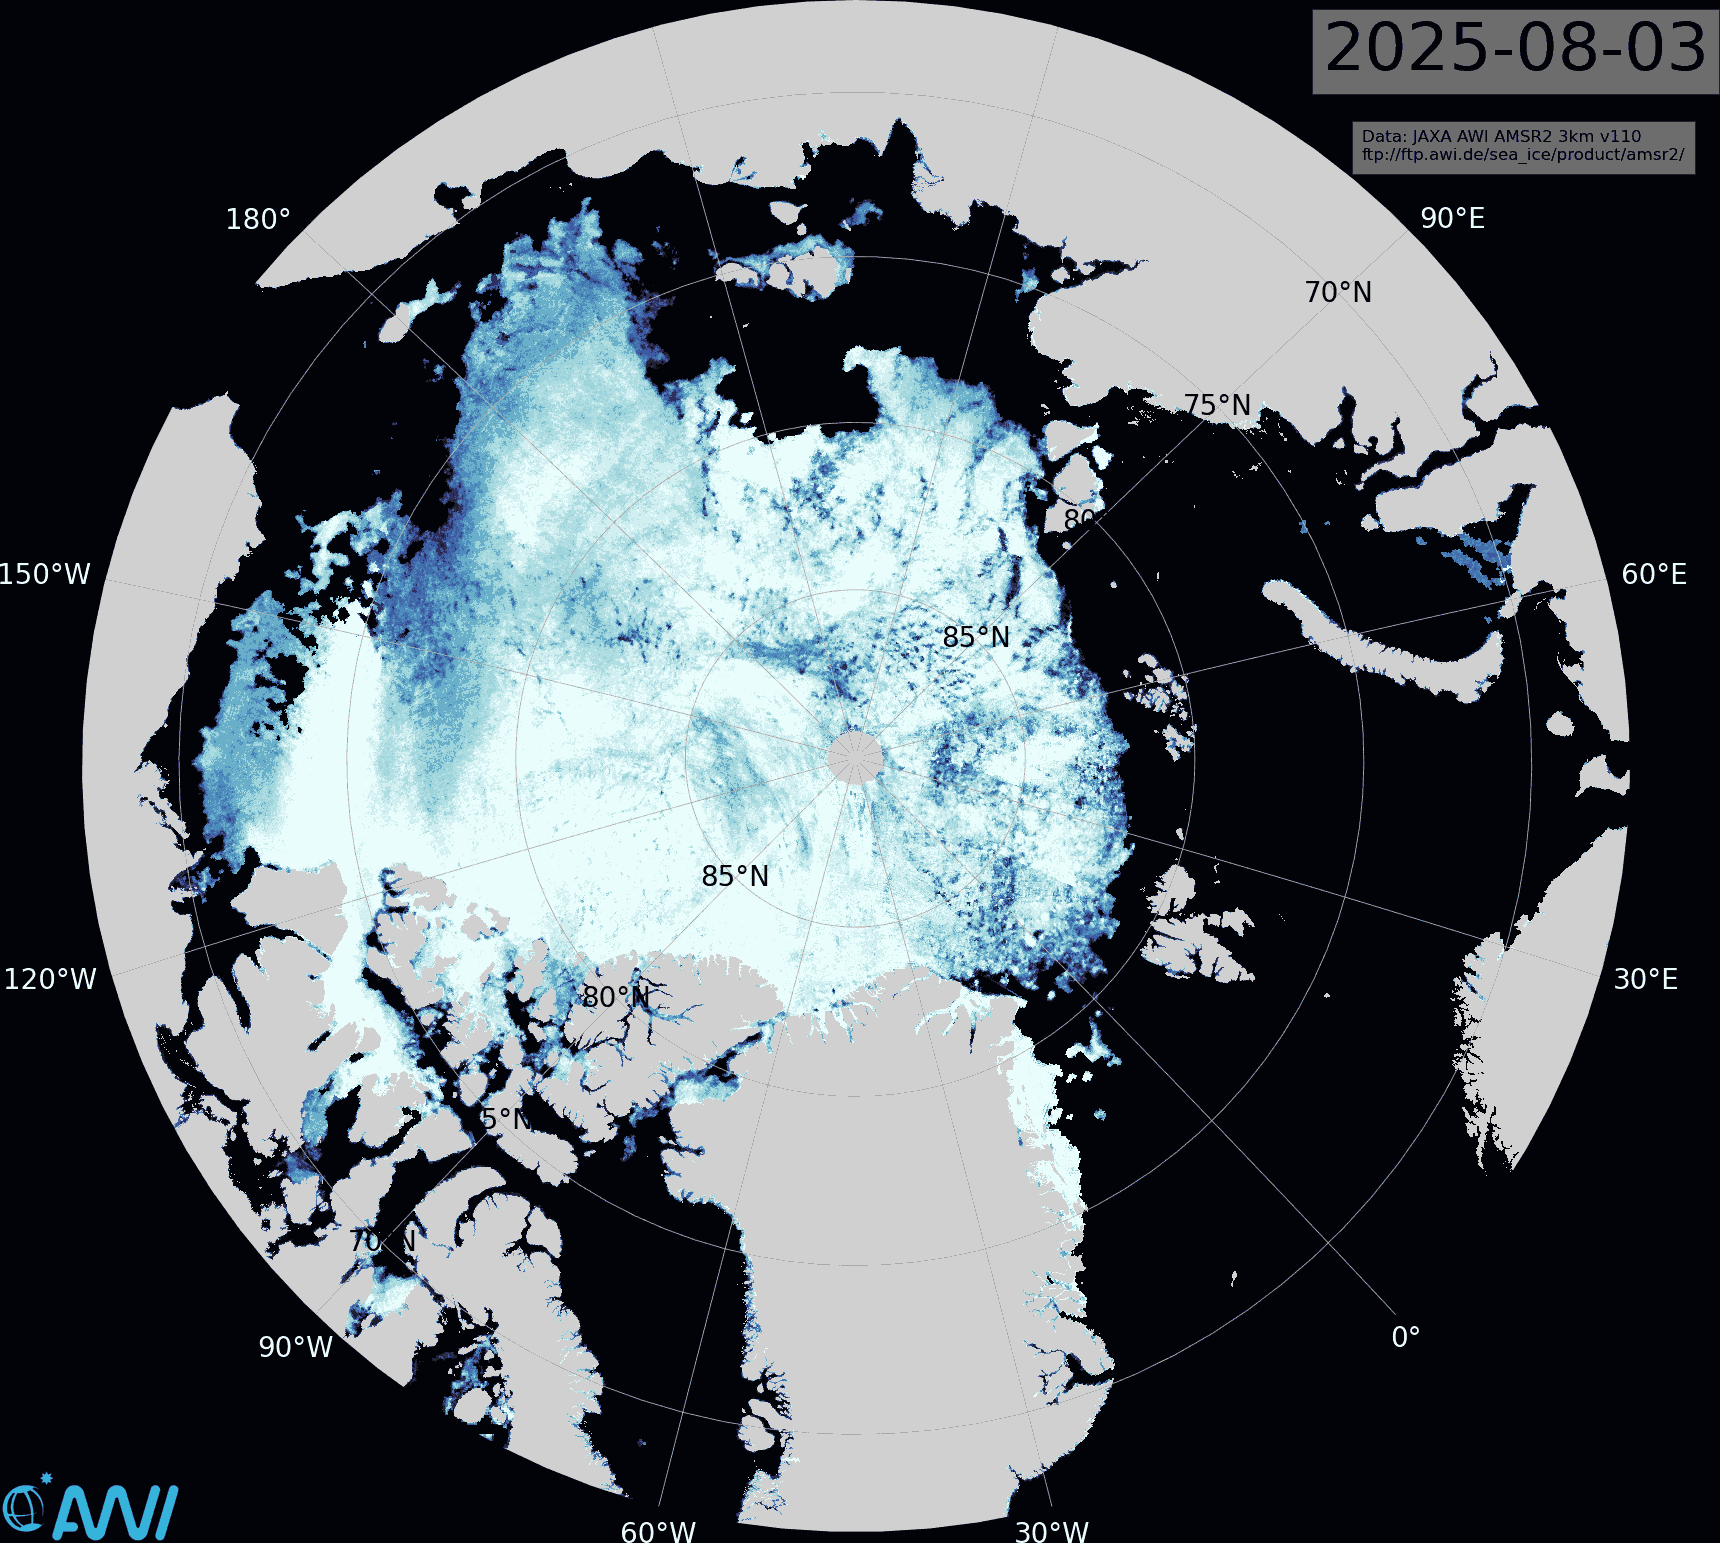
Extent has been declining rapidly for the past few days, and further losses look likely in the Beaufort Sea on either side of an arm of high concentration ice visible in the Alfred Wegener Institute’s map of sea ice concenration:
The ice on the Atlantic side of the Arctic is starting to look highly fragmented, all the way to the North Pole.
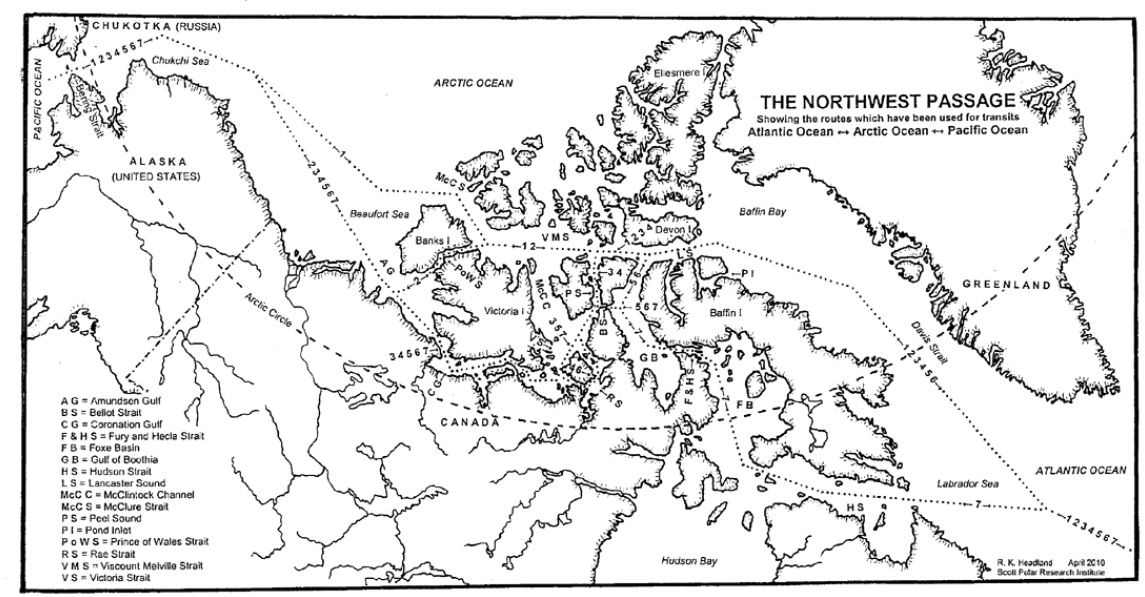
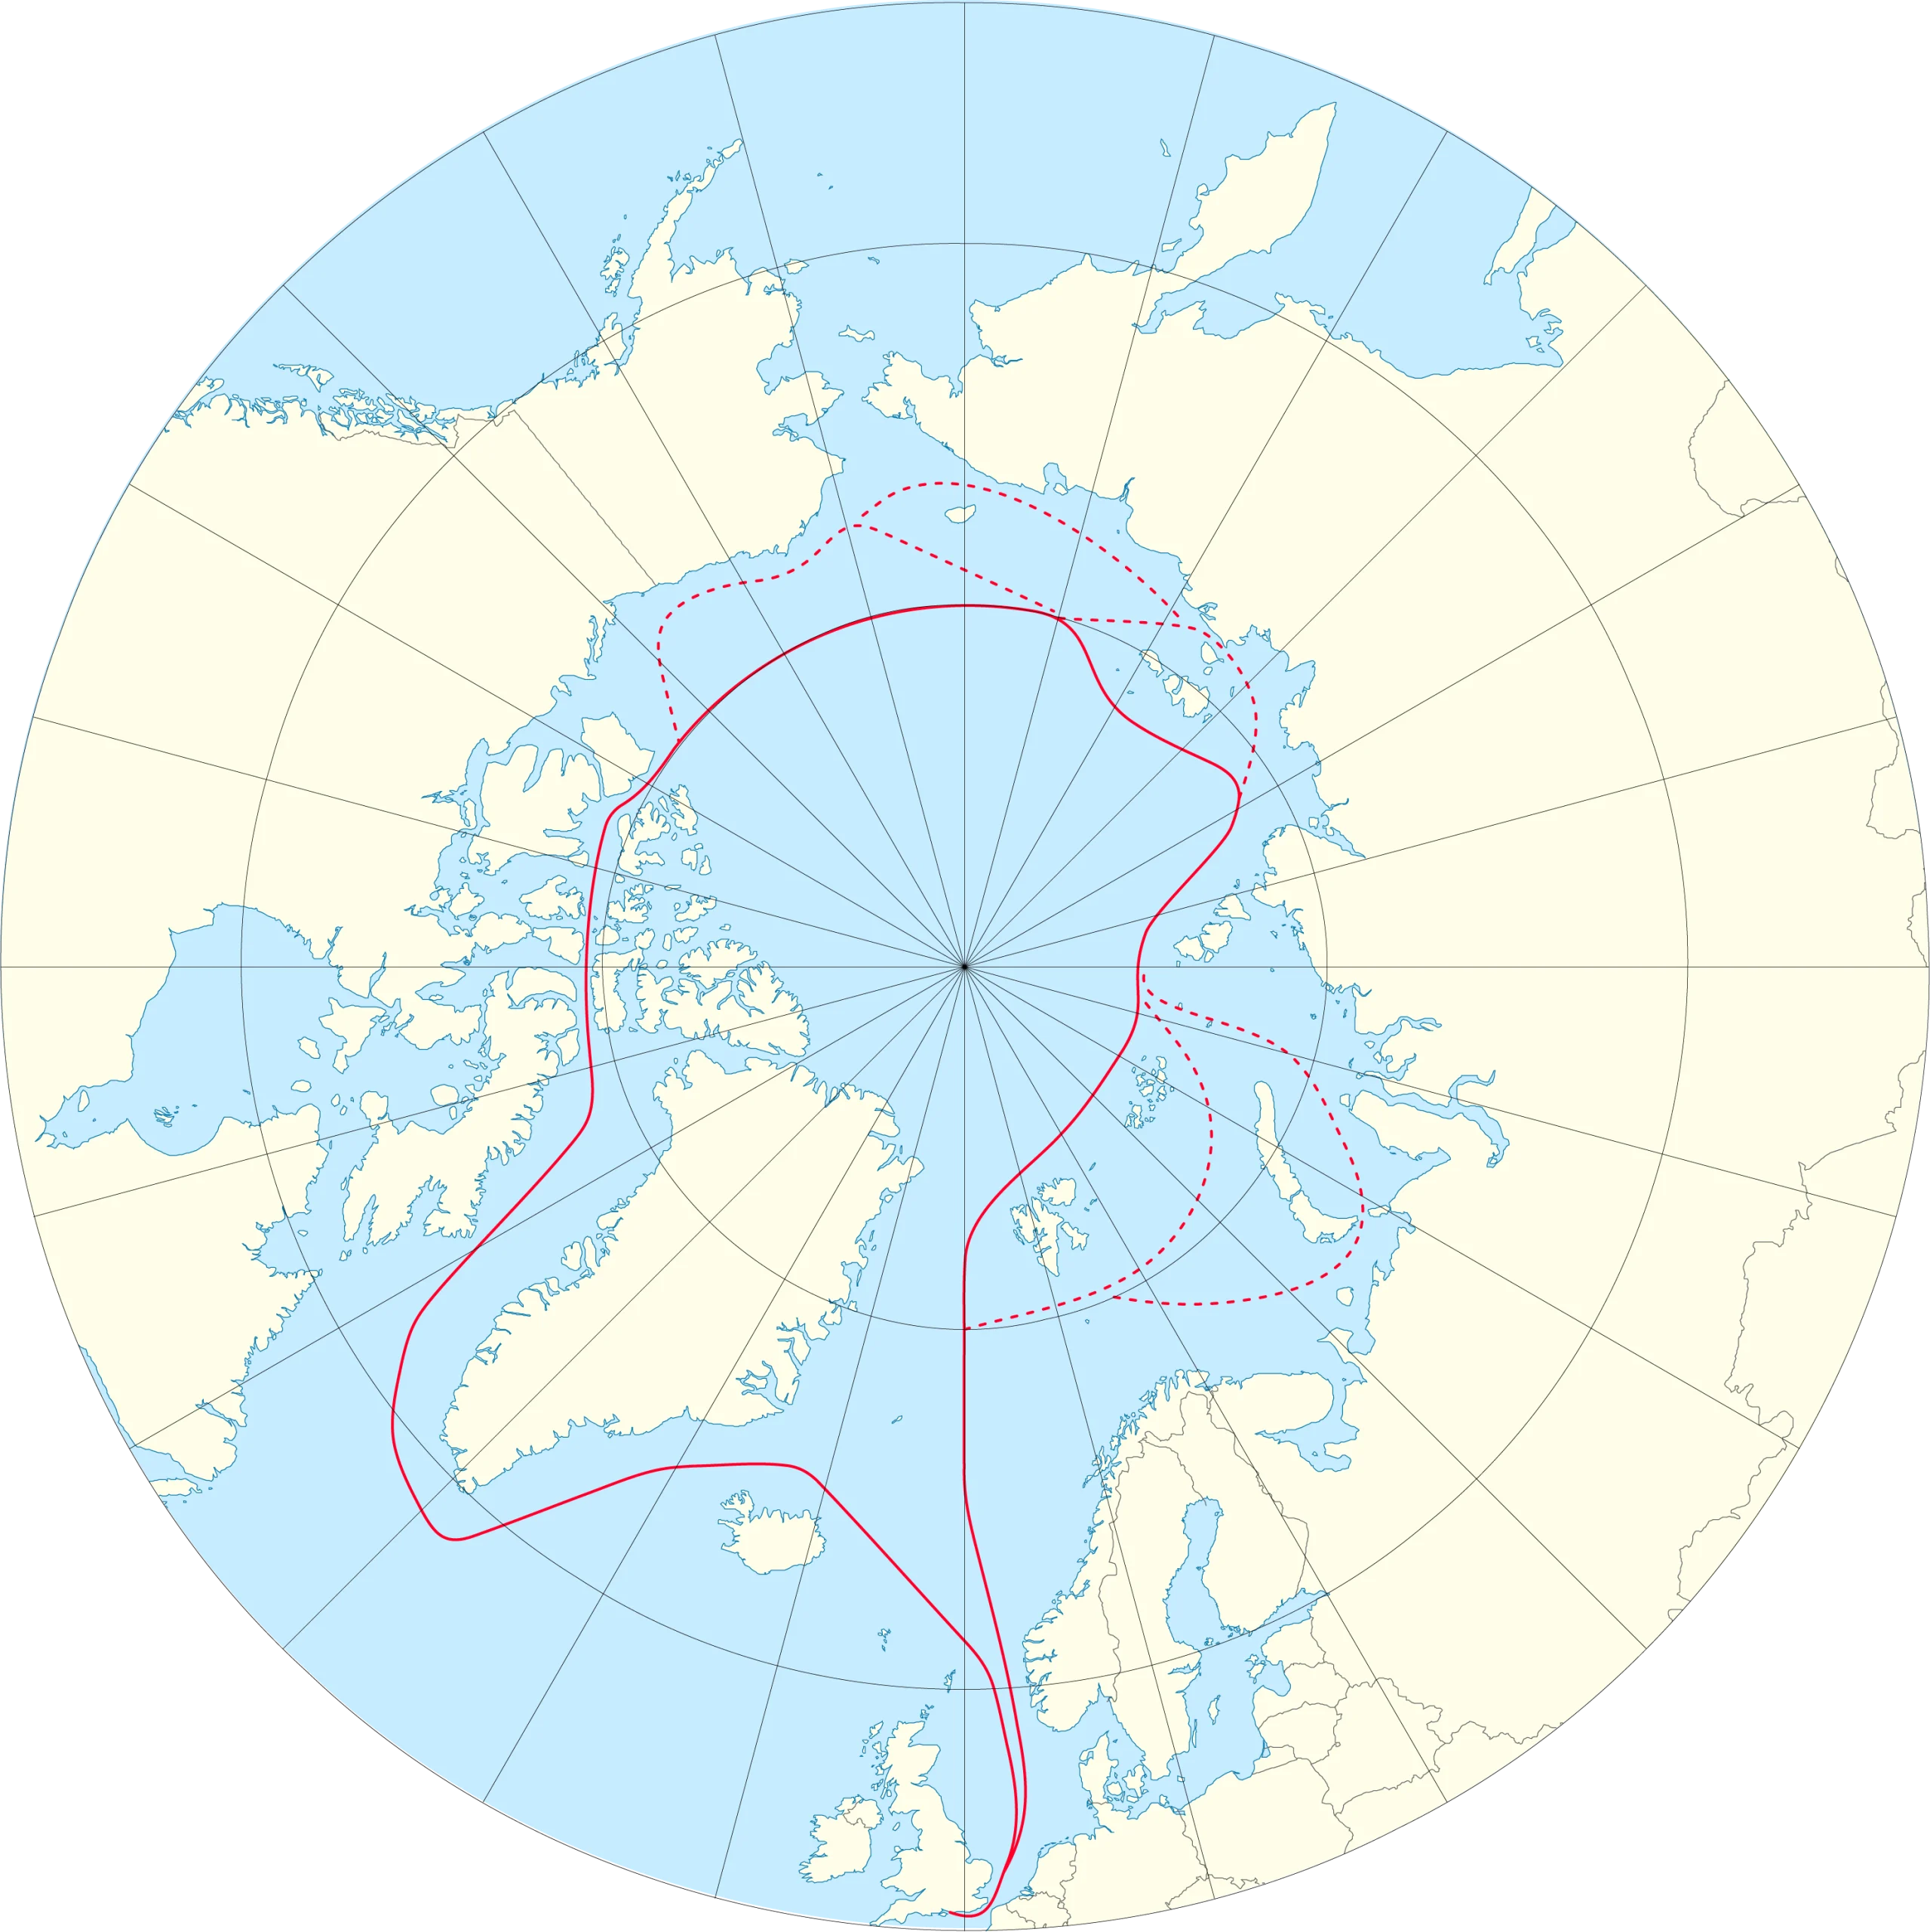
I’m opening the 2025 Northwest Passage thread earlier than usual, because of some news you can read if you scroll down. However, let’s first of all get our bearings with the help of this map of the area:
and another map detailing the routes through Canadian Arctic Archipelago that have previously been successfully traversed:
The news I was referring to is that at lunchtime today Ella Hibbert is setting off in her yacht Yeva from Haslar Marina near Portsmouth in southern England for a rather unusual voyage through the Northwest Passage this summer. Here is Ella’s current route plan:
You will note some unusual features. Apparently Ella is intent on taking Route 1 into the Beaufort Sea via McClure Strait. After that she is not heading for the Bering Strait, but is instead taking the route less travelled back to Haslar via the Northern Sea Route. Perhaps even more surprising in this day and age is that Ella has received permission to sail through Russian waters without an ice pilot. She is aiming to complete an entire circumnavigation of the Arctic in a single summer single handed! As Ella puts it, this is “A voyage that should not be possible”:
Ella is hoping to overcome terrifying challenges including icebergs, freezing water and polar bears.
Her journey – which has only recently become possible due to melting polar ice caps – aims to showcase the devastating environmental impact of sea ice decline, both in the Arctic and across the world.
Ella’s voyage also aims to support two charities working tirelessly to protect the Arctic: Polar Bears International and the Ocean Conservancy.
At the end of her voyage, Ella will auction her ship Yeva with proceeds to go to these two charities.
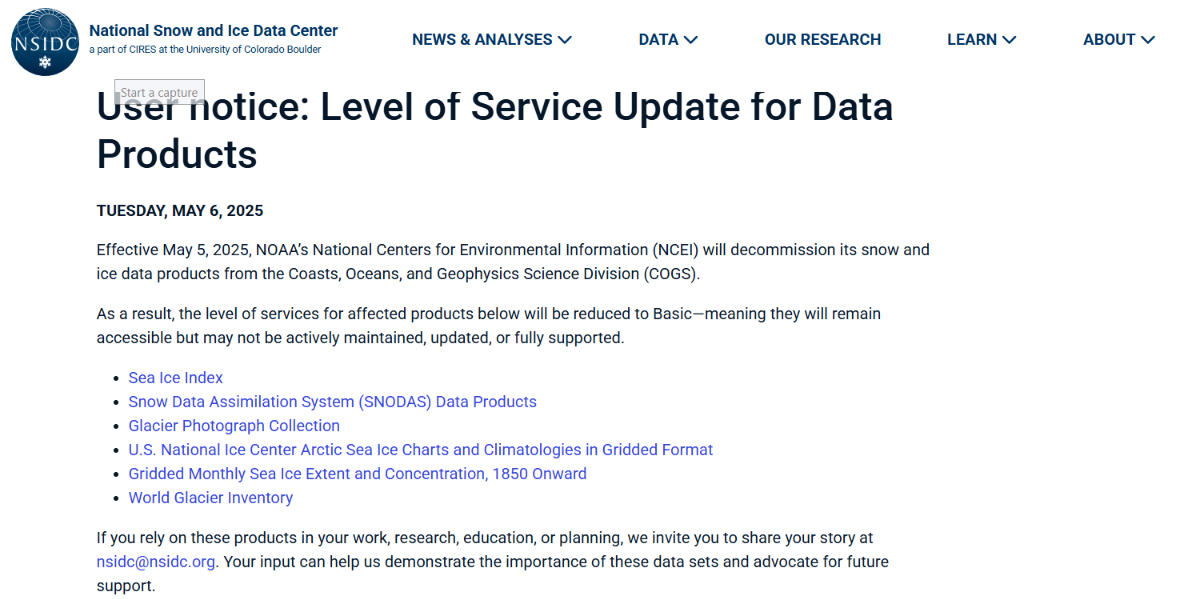
I frequently post a summary of the Arctic section of the United States’ National Snow and Ice Data Center’s monthly review of the current state of the cryosphere. Here is the most recent edition.
Effective May 5, 2025, NOAA’s National Centers for Environmental Information (NCEI) will decommission its snow and ice data products from the Coasts, Oceans, and Geophysics Science Division (COGS).
As a result, the level of services for affected products below will be reduced to Basic—meaning they will remain accessible but may not be actively maintained, updated, or fully supported.
If you rely on these products in your work, research, education, or planning, we invite you to share your story at [email protected]. Your input can help us demonstrate the importance of these data sets and advocate for future support.
I will certainly share my story with the NSIDC. If you are a resident of the US you may also wish to contact your local friendly neighbourhood politician(s) about the matter?
[Update – May 9th]
Mark Serreze, Director of the National Snow and Ice Data Center, replied to my email and told me that:
We are acutely aware of the importance of the SII and Sea Ice Today. Millions of visits per year. High priority. We’re in the middle of discussions about to make sure that we have continuity.
Thanks for your support. Everything helps.
One of the less well known data products provided by the NSIDC is EASE-Grid Sea Ice Age.
I recently used that particular mine of essential cryospheric information to produce this educational YouTube video:
The video reveals the underlying reason for the “fast transition” of Arctic sea ice cover from thick multi-year ice to a reduced area of much more mobile young ice.
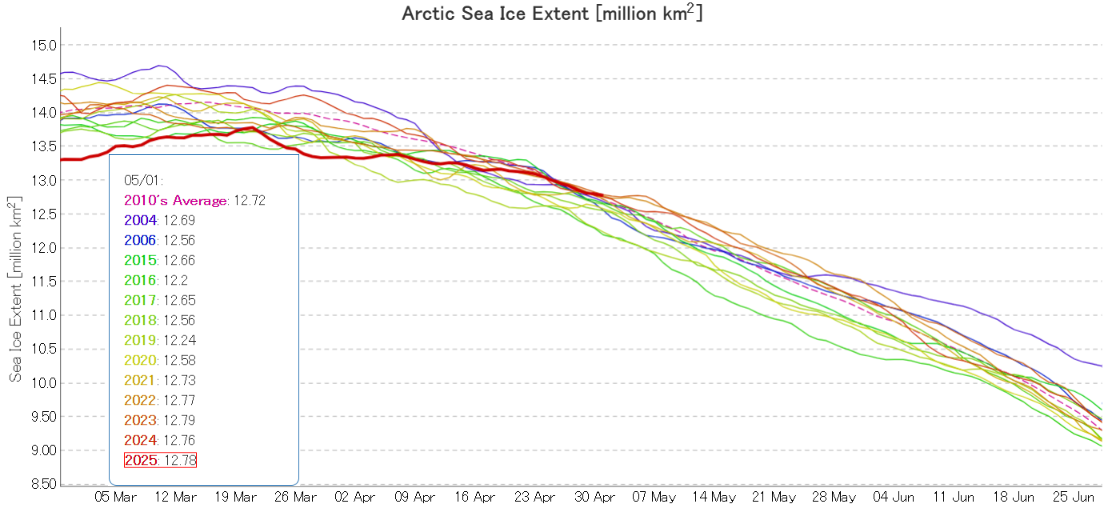
JAXA/ViSHOP extent is no longer “lowest for the date”! After “flatlining” for most of April the metric is now in the midst of a close knit group of the other years in the 2020s:
The high pressure area over the Central Arctic persisted through the second half of April, and so did the consequent drift of ice from the Pacific side of the Arctic to the Atlantic periphery:
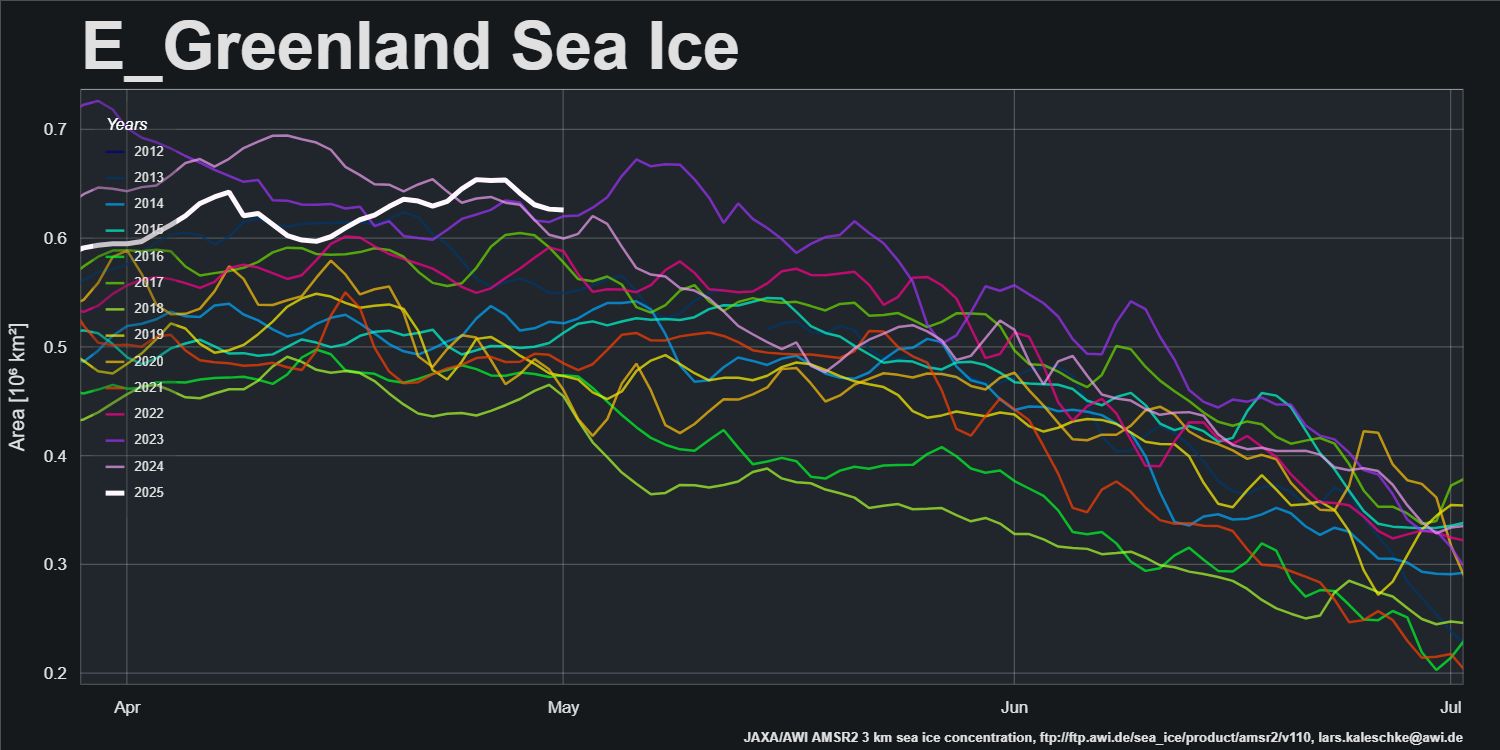
AWI’s sea ice area for the Greenland Sea is currently “highest for the date” in the AMSR2 record that started in July 2012:
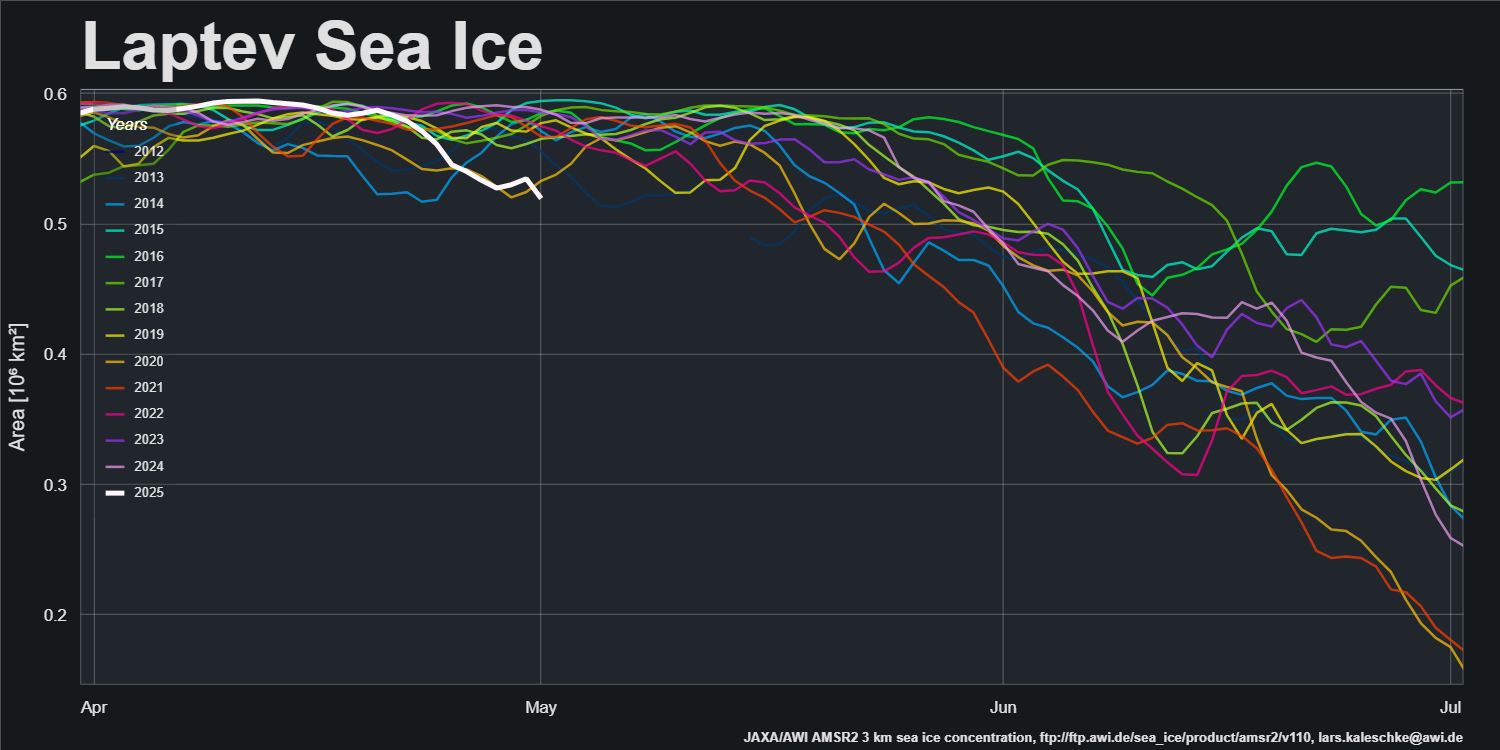
The offshore winds along the Laptev Sea coast have continued, and sea ice area is now “lowest for the date”:
The first signs of a break in the high pressure dominance are appearing. GFS currently forecasts that a low pressure area will enter the Central Arctic, bring above zero temperatures over the Kara Sea on Sunday:
This website uses cookies to improve your experience. We'll assume you're ok with this, but you can opt-out if you wish. Cookie settingsACCEPT
Privacy & Cookies Policy
Privacy Overview
This website uses cookies to improve your experience while you navigate through the website. Out of these, the cookies that are categorized as necessary are stored on your browser as they are essential for the working of basic functionalities of the website. We also use third-party cookies that help us analyze and understand how you use this website. These cookies will be stored in your browser only with your consent. You also have the option to opt-out of these cookies. But opting out of some of these cookies may affect your browsing experience.
Necessary cookies are absolutely essential for the website to function properly. This category only includes cookies that ensures basic functionalities and security features of the website. These cookies do not store any personal information.
Any cookies that may not be particularly necessary for the website to function and is used specifically to collect user personal data via analytics, ads, other embedded contents are termed as non-necessary cookies. It is mandatory to procure user consent prior to running these cookies on your website.