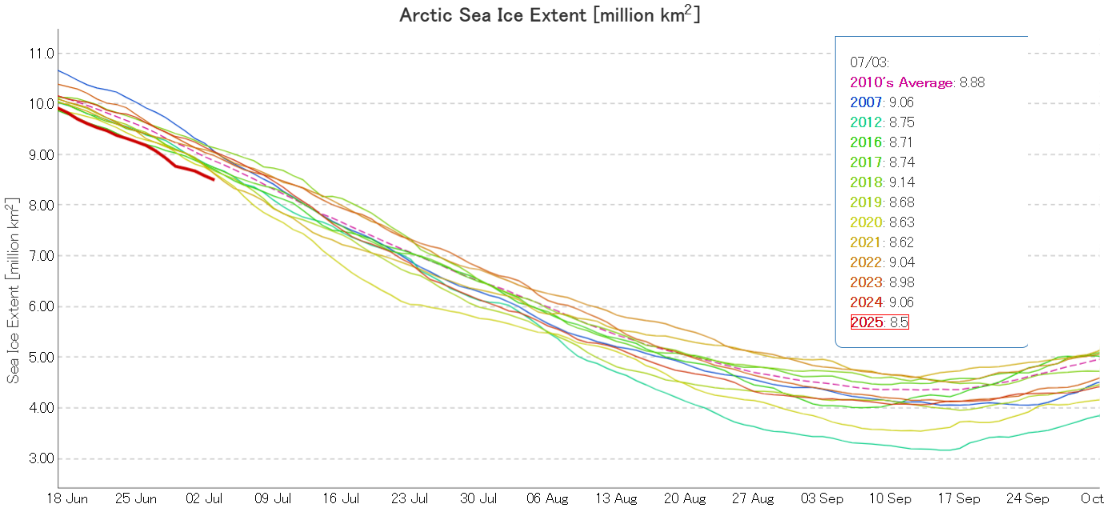
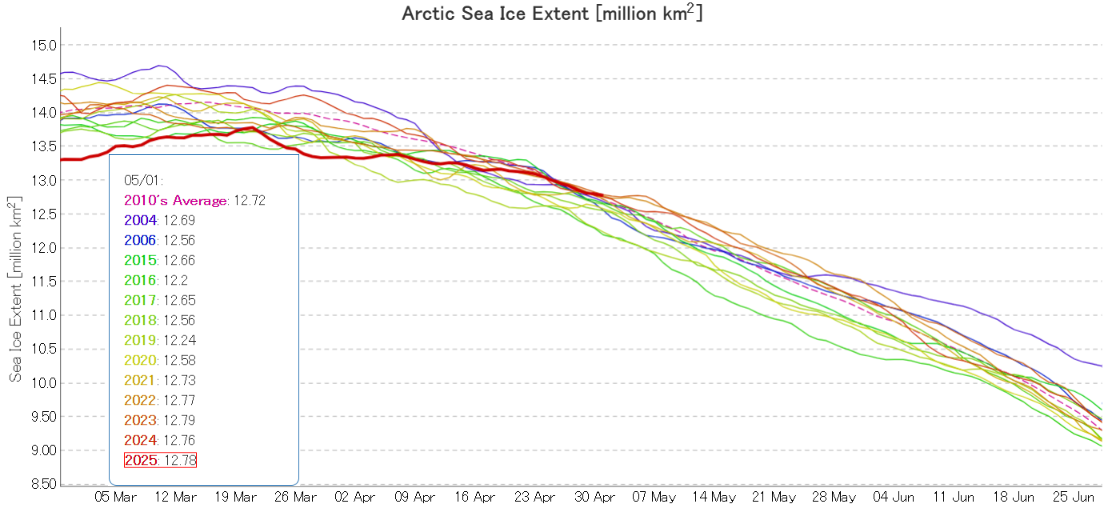
JAXA/ViSHOP extent is no longer “lowest for the date”! After “flatlining” for most of April the metric is now in the midst of a close knit group of the other years in the 2020s:
The high pressure area over the Central Arctic persisted through the second half of April, and so did the consequent drift of ice from the Pacific side of the Arctic to the Atlantic periphery:
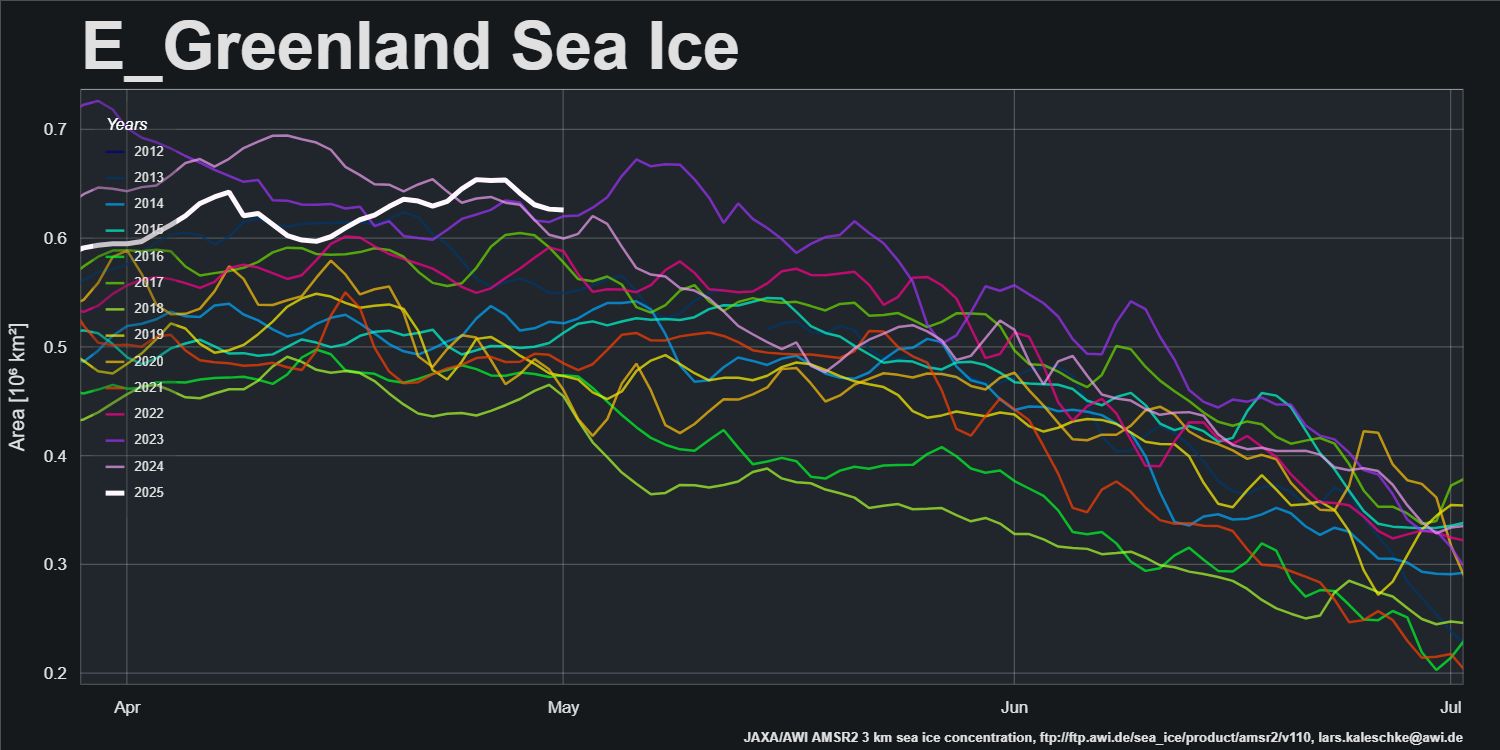
AWI’s sea ice area for the Greenland Sea is currently “highest for the date” in the AMSR2 record that started in July 2012:
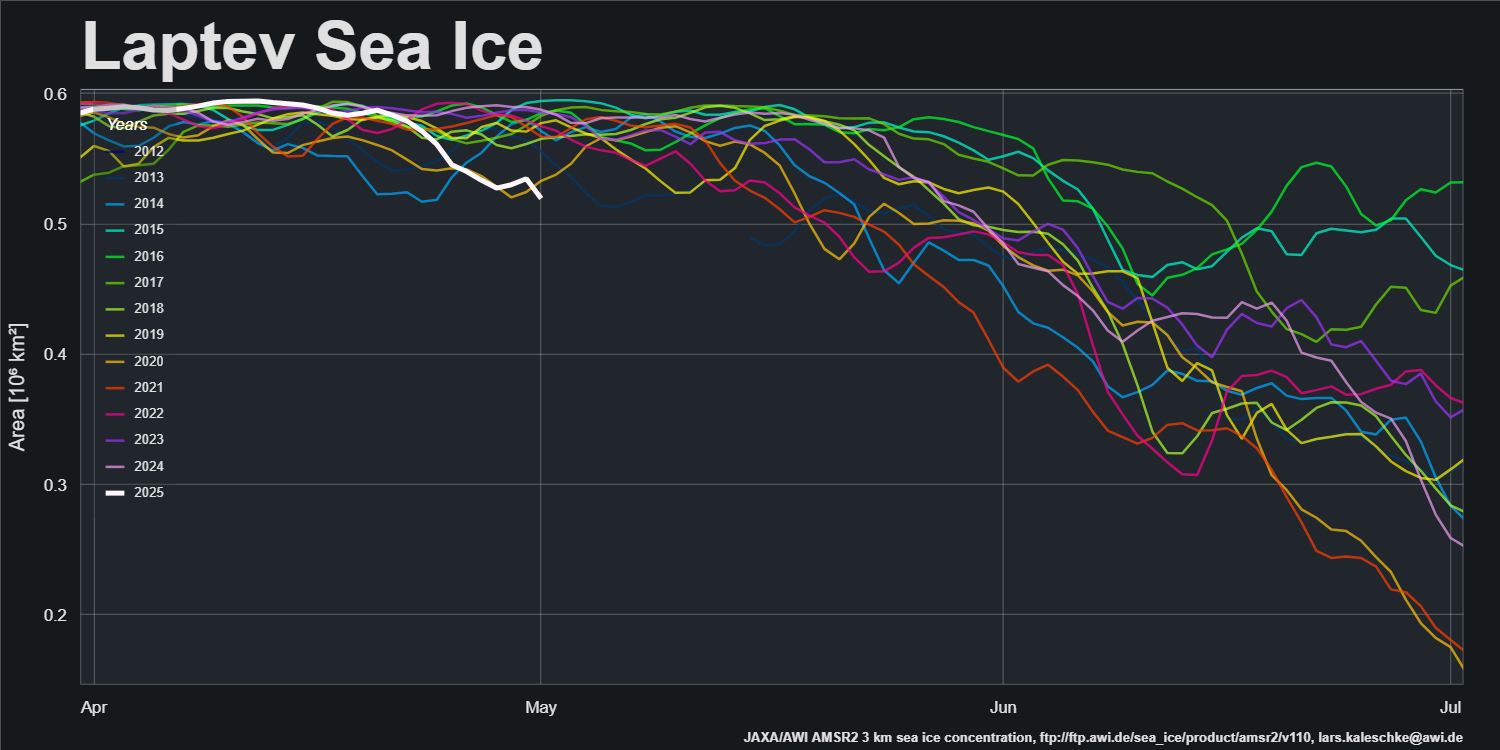
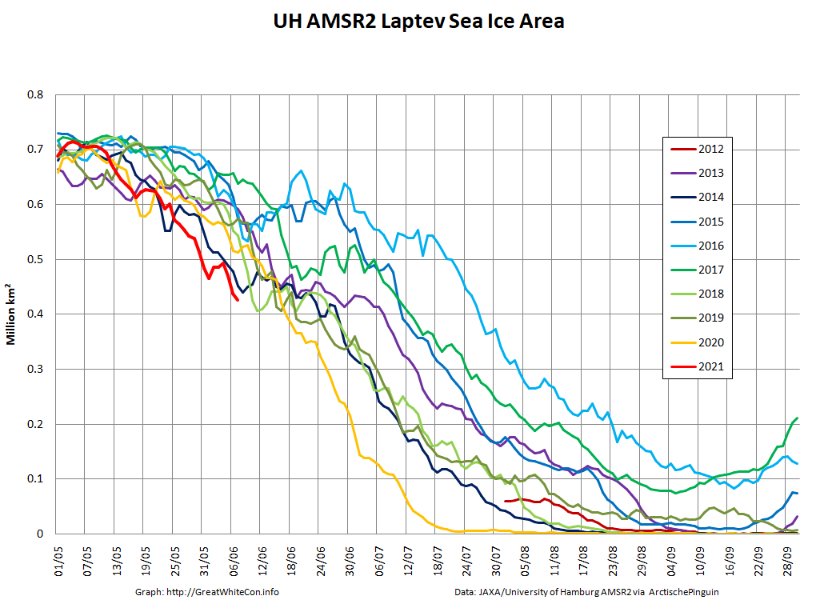
The offshore winds along the Laptev Sea coast have continued, and sea ice area is now “lowest for the date”:
The first signs of a break in the high pressure dominance are appearing. GFS currently forecasts that a low pressure area will enter the Central Arctic, bring above zero temperatures over the Kara Sea on Sunday:
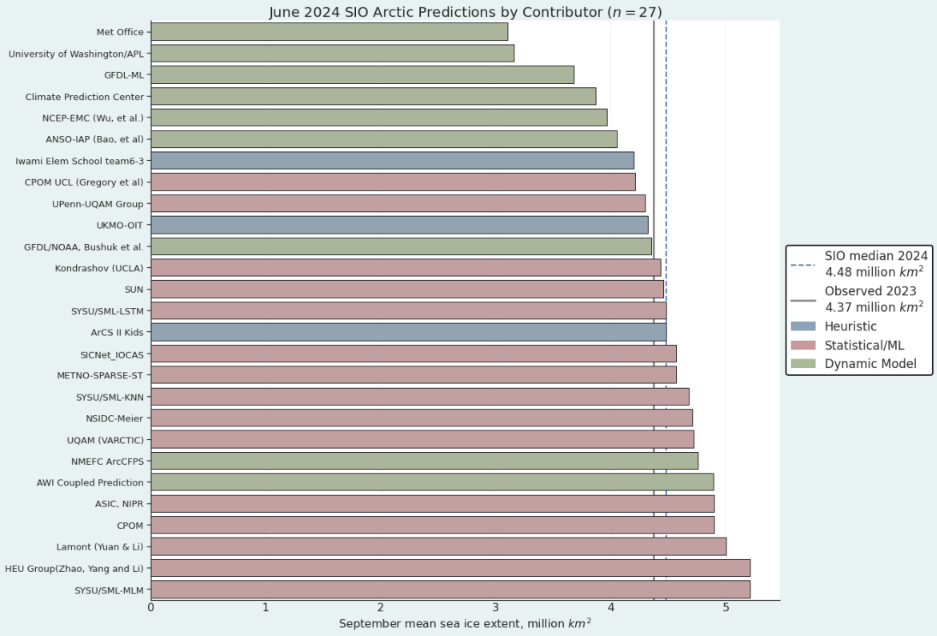
The first sea ice outlook report for 2024 has been published by the Sea Ice Prediction Network:
This year’s median forecasted value for pan-Arctic September sea-ice extent is 4.48 million square kilometers with an interquartile range of 4.21 to 4.74 million square kilometers. This is slightly lower than the 2022 (4.57 million square kilometers) and 2023 (4.54 million square kilometers) June median forecasts for September.
The lowest sea-ice extent forecast is 3.1 million square kilometers, from the UK Met Office, which would be a new record low for the satellite period (1979-present); the highest sea-ice extent forecast is 5.21 million square kilometers, submitted by both the HEU Group and SYSU/SML-MLM, which would be the highest September extent since 2015:
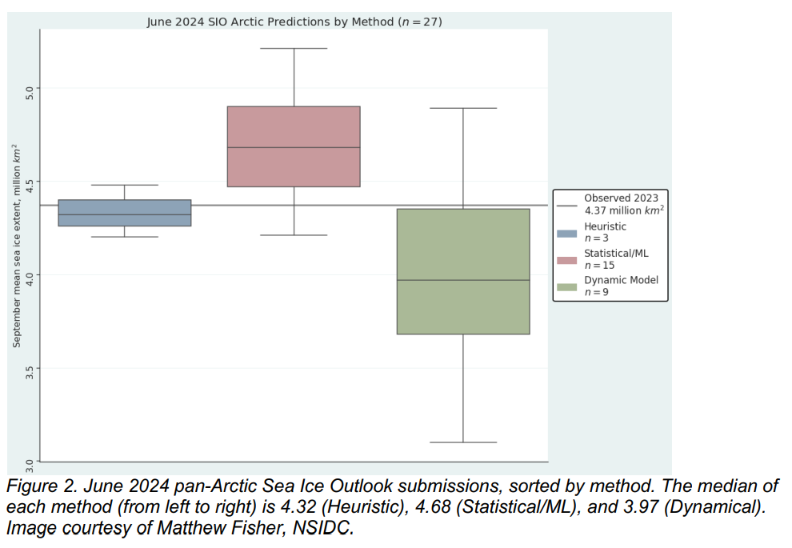
There are three heuristic Outlooks, with a median of 4.32 million square kilometers and an interquartile range of 4.26 to 4.4 million square kilometers. Statistical submissions total fifteen Outlooks with a median of 4.68 million square kilometers and an interquartile range of 4.47 to 4.9 million square kilometers. There are nine dynamical model contributions. The dynamical models have a median forecast of 3.97 million square kilometers with an interquartile range of 3.68 to 4.35 million square kilometers.
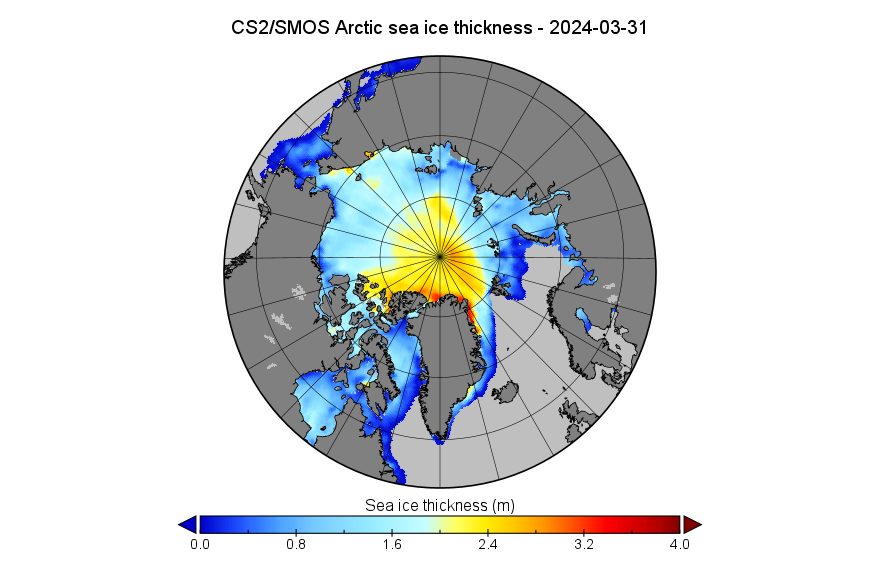
Starting this month with a look at assorted volume/thickness data, here is the CryoSat-2/SMOS merged Arctic sea ice thickness map for March 31st:
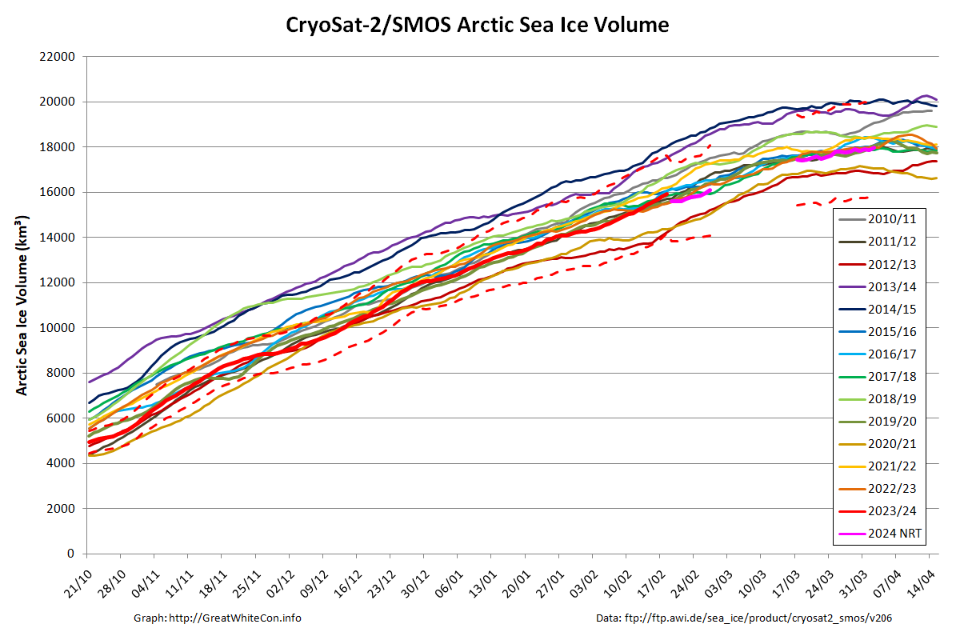
Plus the associated volume graph, which still suffers from a gap in the near real time data due to the problem with the SMOS satellite during the first half of March:
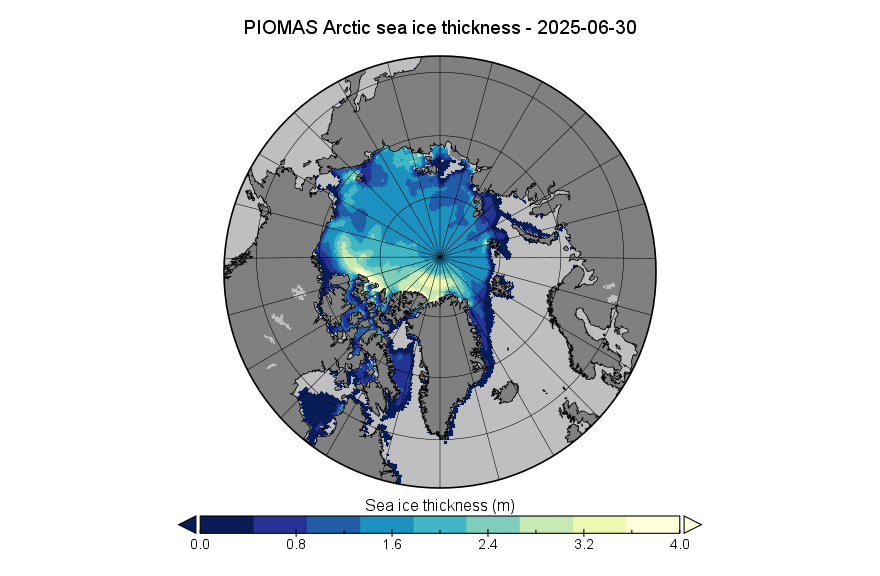
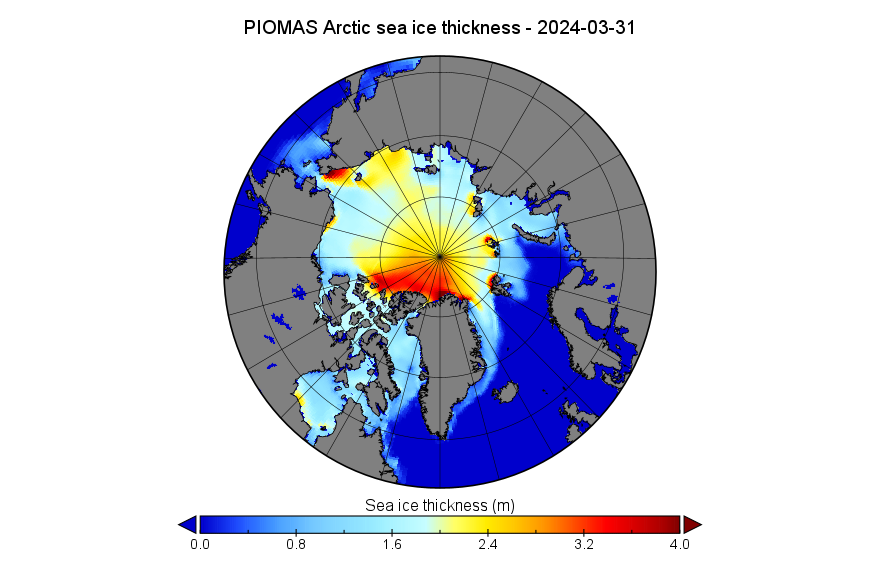
The PIOMAS gridded thickness data for March 2024 is also available. Here’s the end of month thickness map:
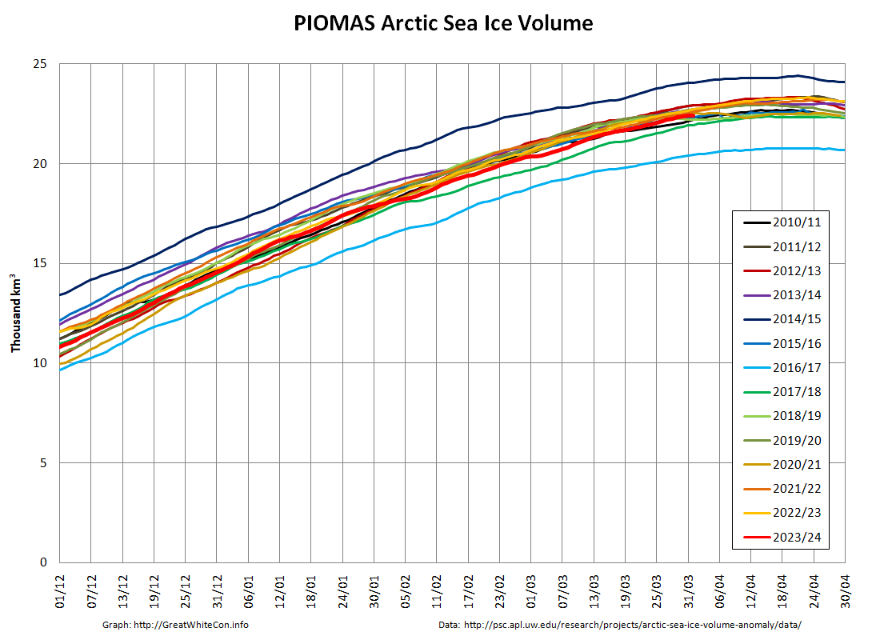
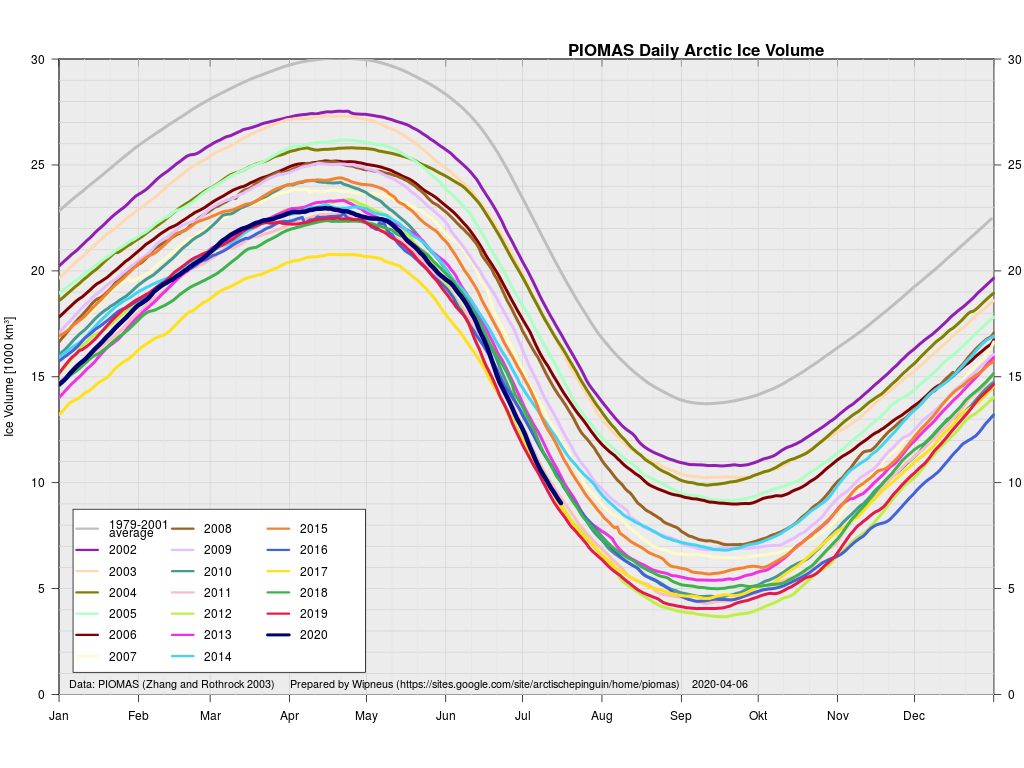
Plus the calculated volume graph:
Especially for Peter, here too is the DMI’s chart of monthly Arctic sea ice volume for March:
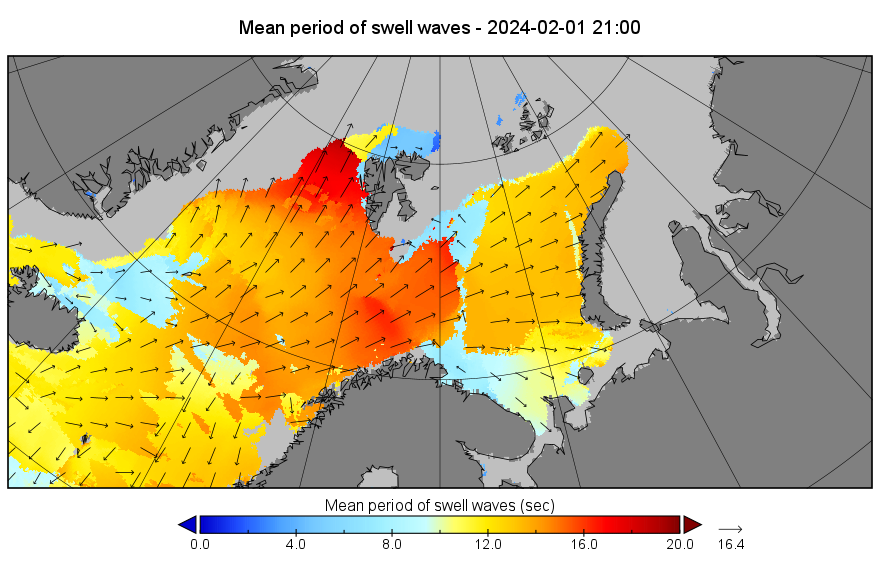
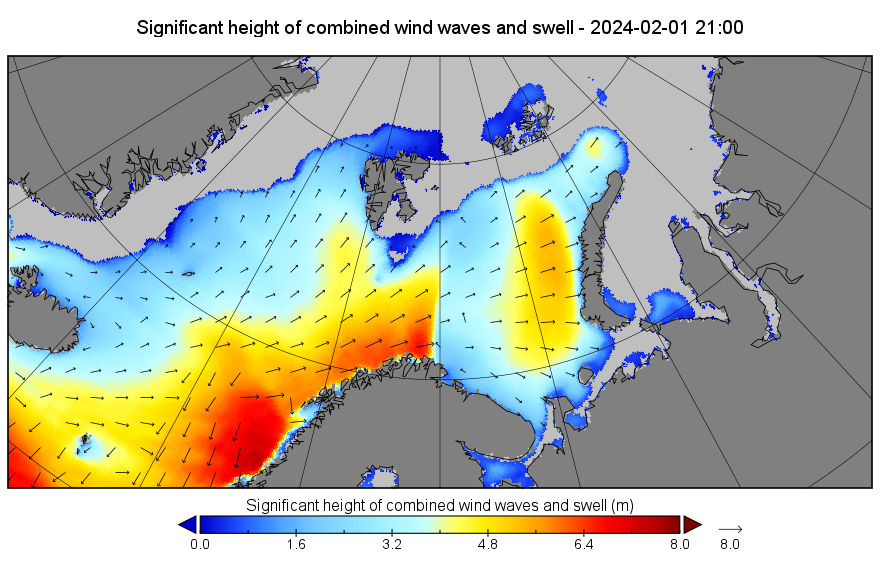
A change is perhaps even better than a rest? Let’s start February with a reminder that following close behind another recent Arctic cyclone, Storm Ingunn caused red weather warnings for high winds and avalanches in Norway two days ago:
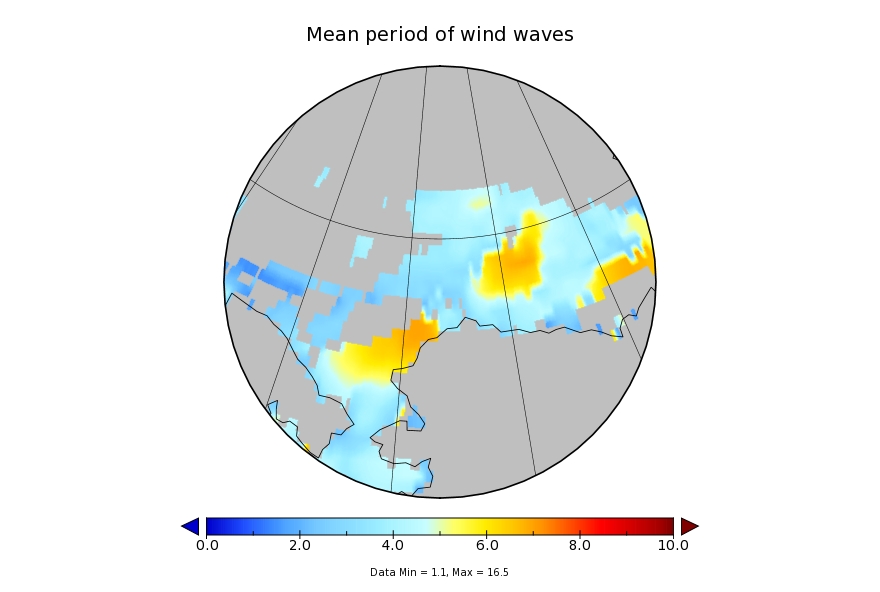
By yesterday evening another long period, storm driven swell was arriving at the sea ice edge in the Fram Strait, and to a lesser extent in the Barents Sea:
By this morning Ingunn had merged with the remnants of the prior cyclone, as revealed in Climate Reanalyzer’s visualisation of the latest GFS model run::
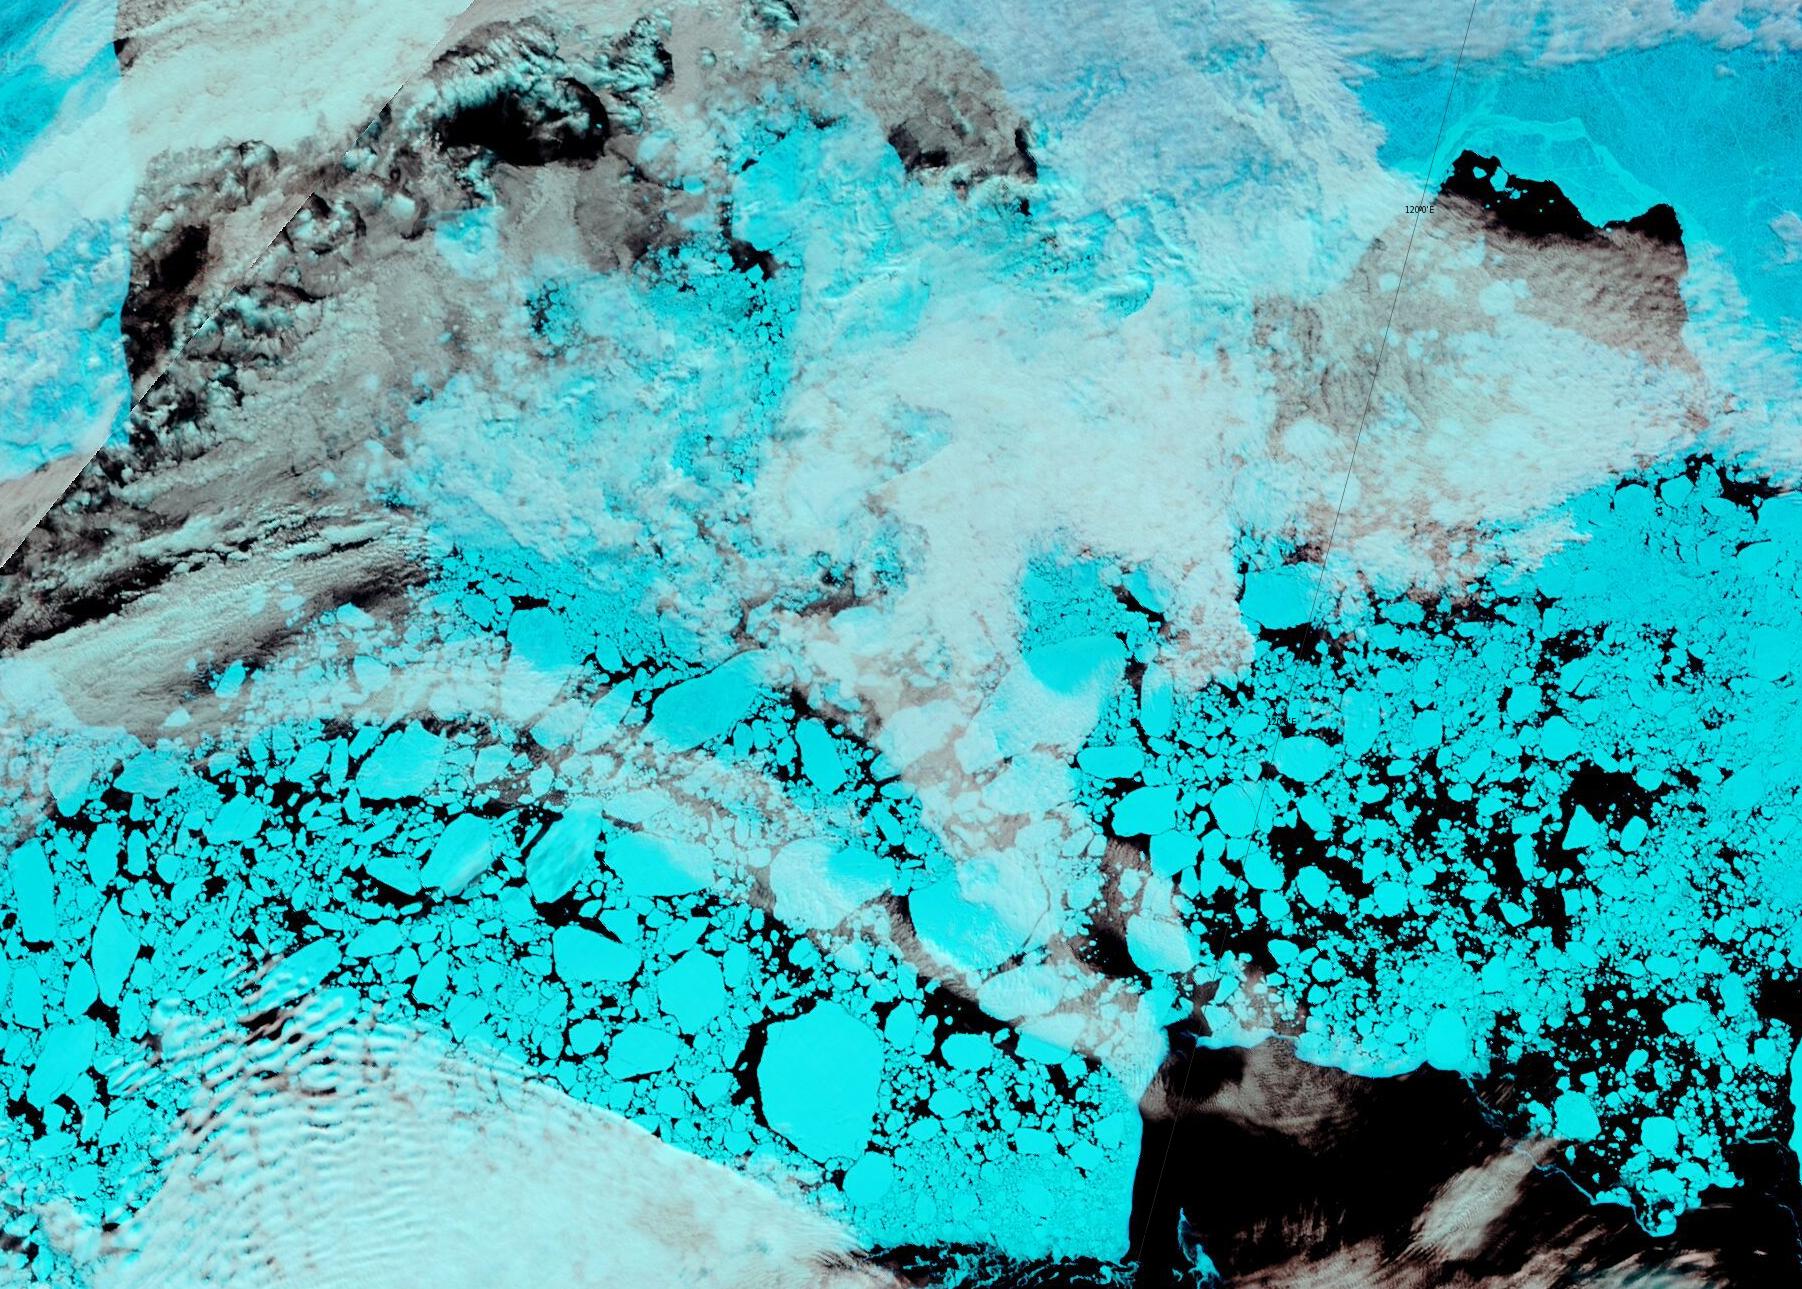
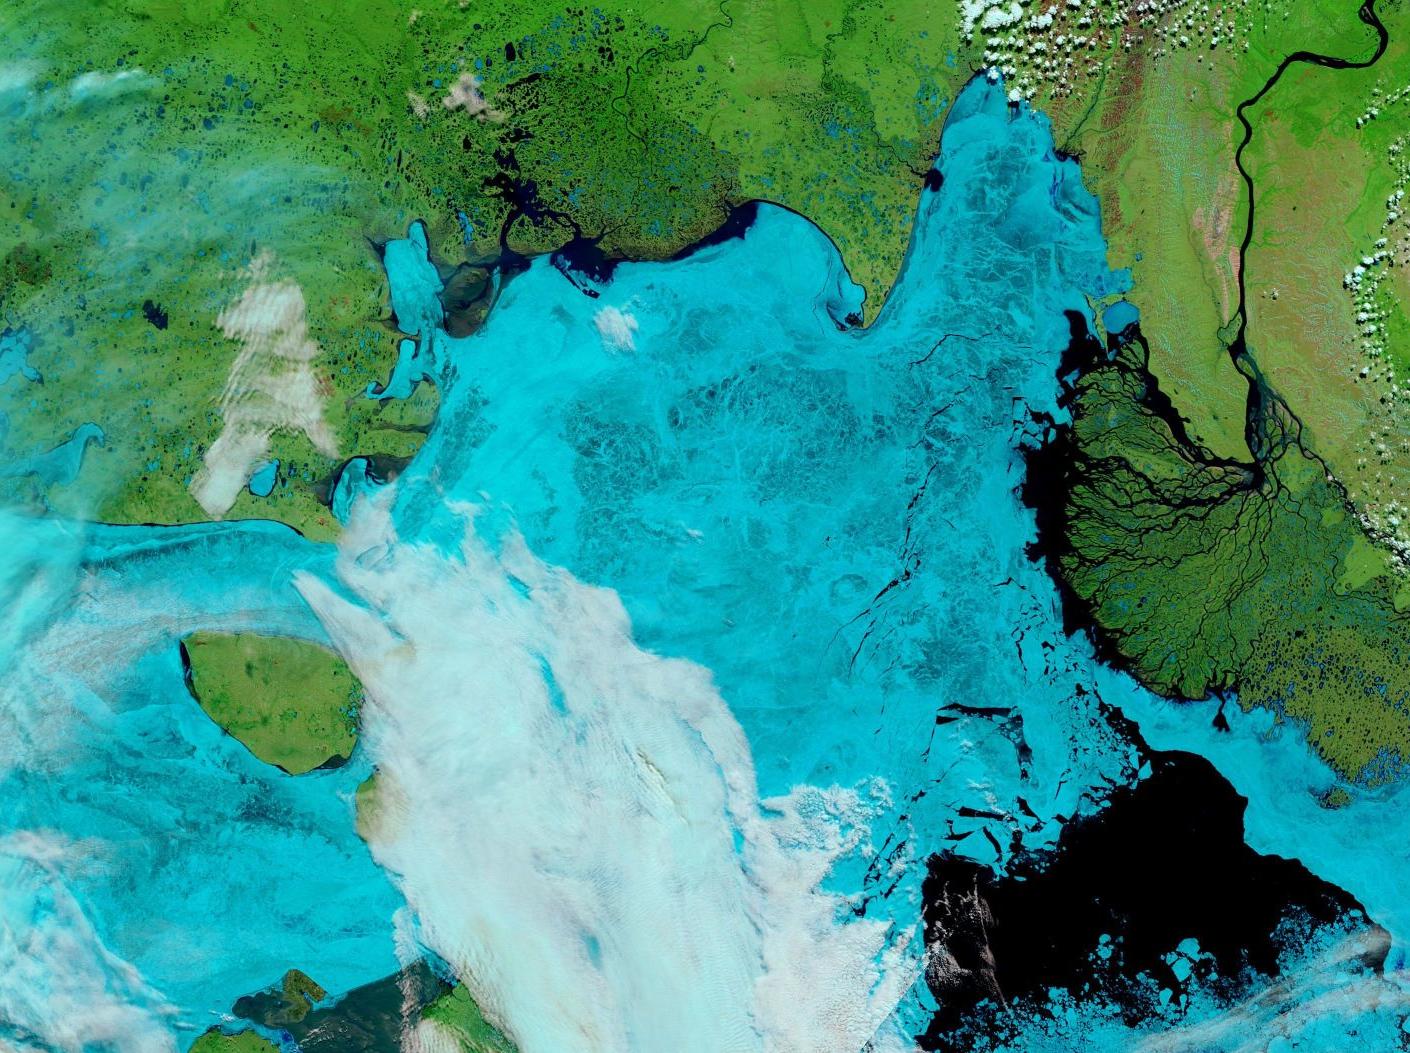
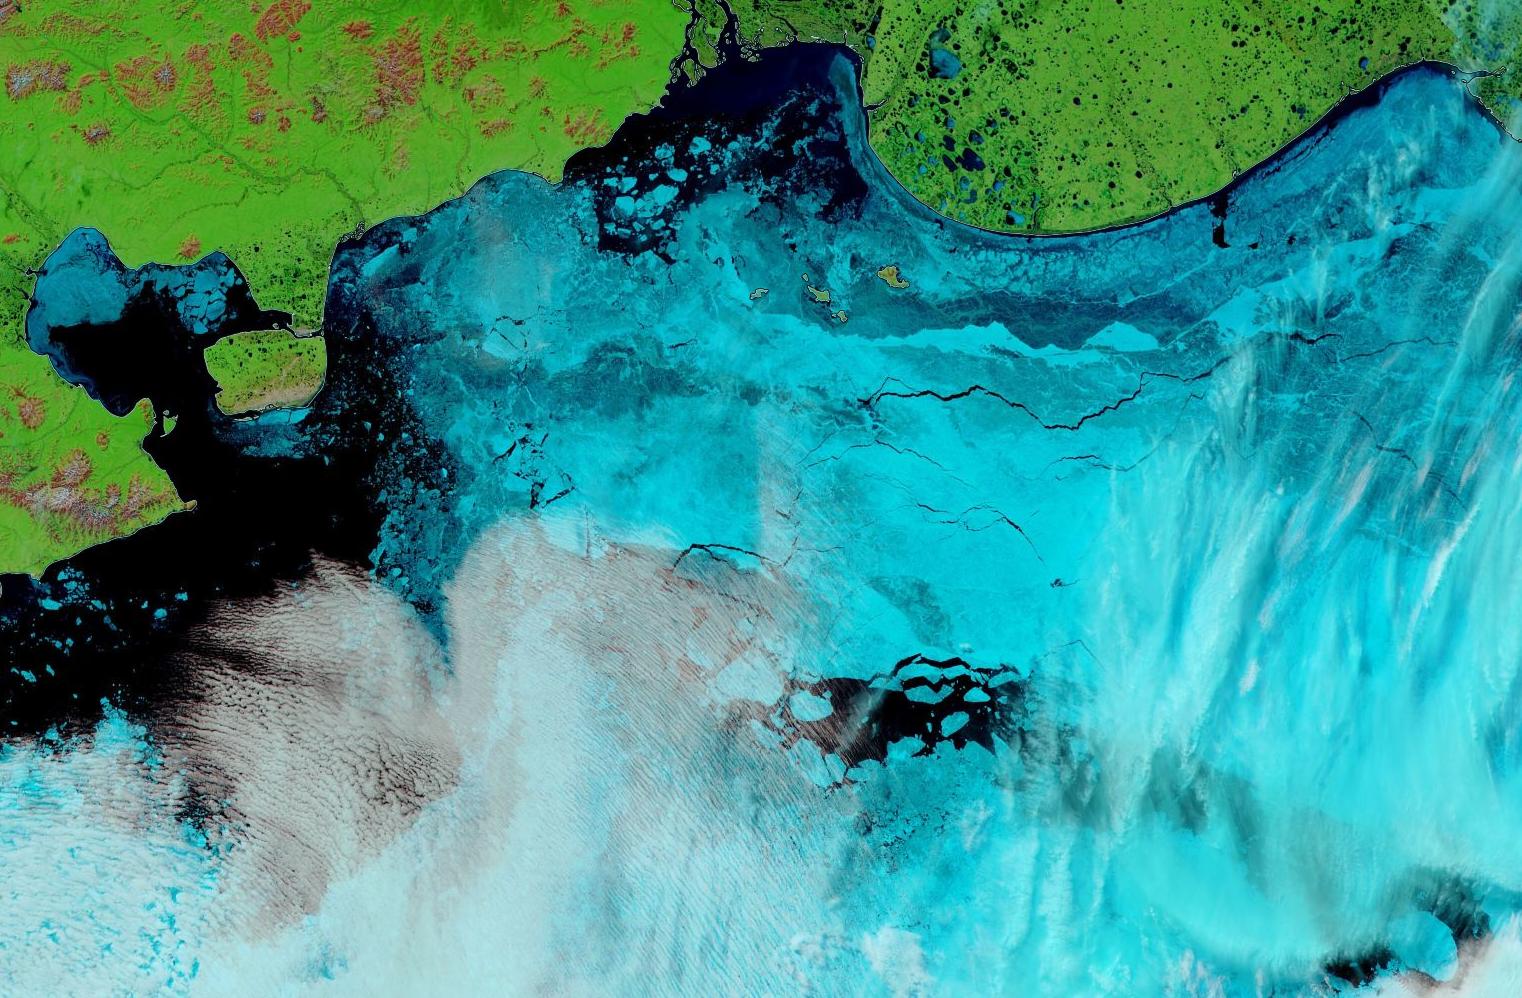
Let’s begin the month with a “true colour” image from the Terra satellite of the Laptev Sea and thereabouts:
The blueish tinge indicates the appearance of melt ponds almost everywhere over the land-fast ice currently covering the majority of the Laptev Sea.
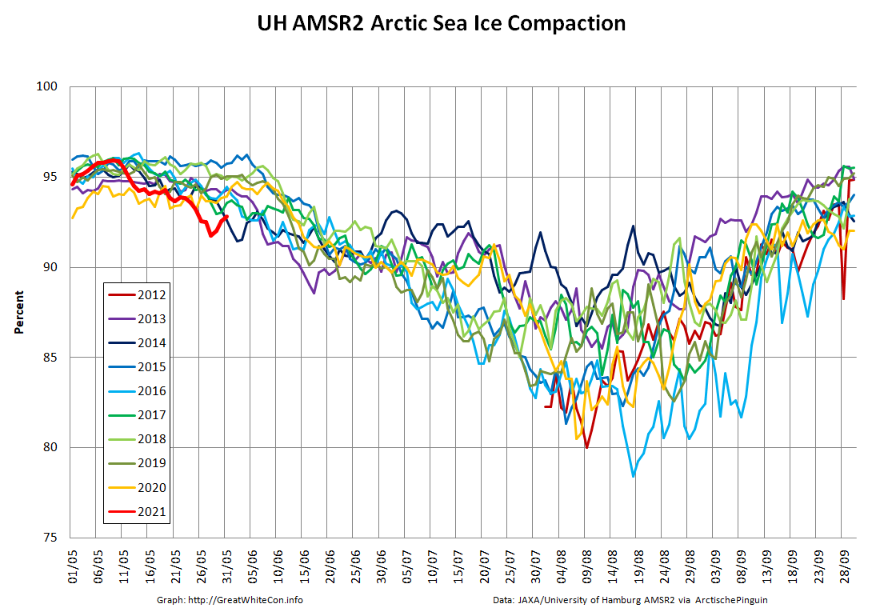
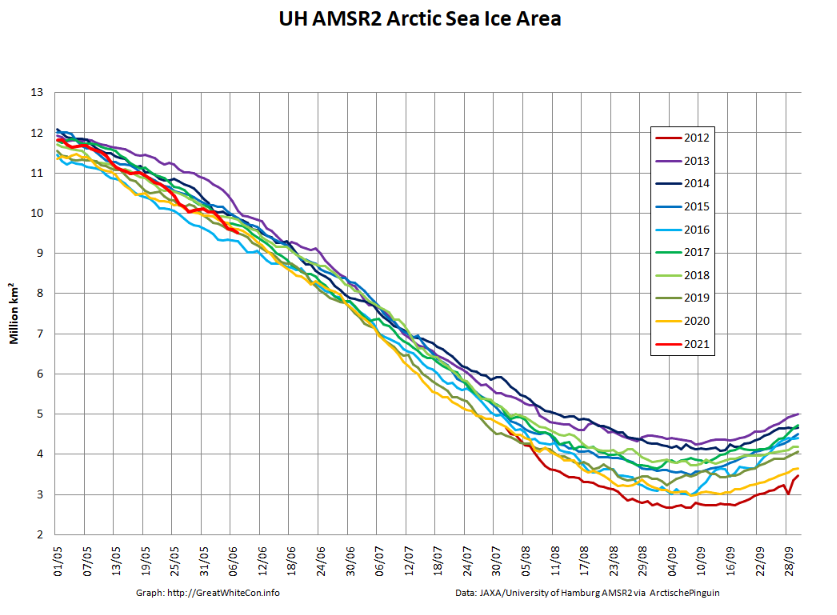
Let’s also take a look at the high resolution AMSR2 metrics for the end of May 2021:
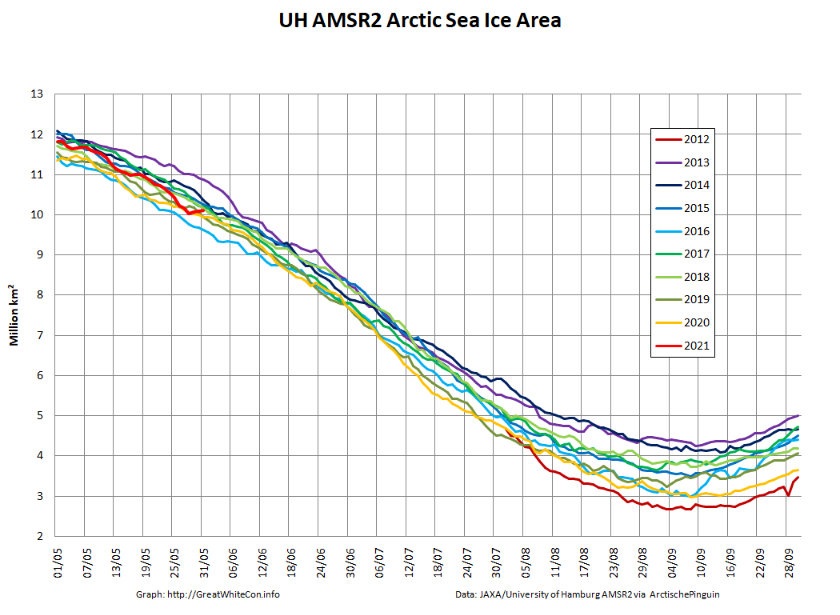
Thanks to the recent “brief hiatus” in areal decline, Arctic wide compaction is no longer in record territory:
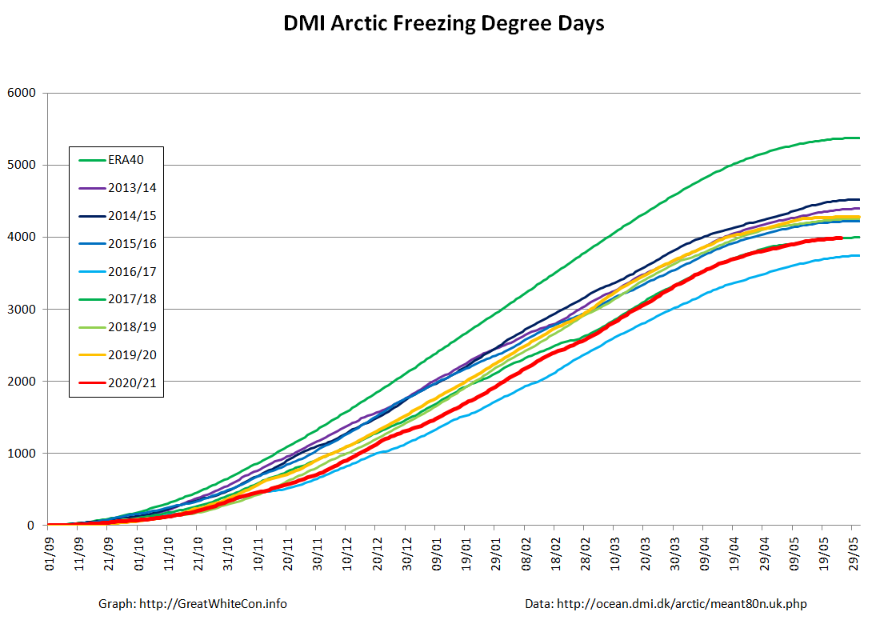
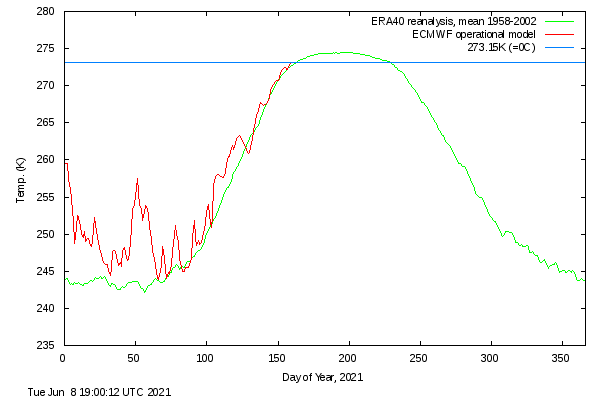
Finally, for the moment at least, here is the Danish Meteorological Institute’s high Arctic temperature data in the form of a graph of freezing degree days:
For some reason the data file still doesn’t include data to the end of May, but things won’t change much by then. Over the winter as a whole only 2016/17 was significantly warmer.
Let the 2021 Arctic sea ice summer melting season officially begin!
[Edit – June 4th]
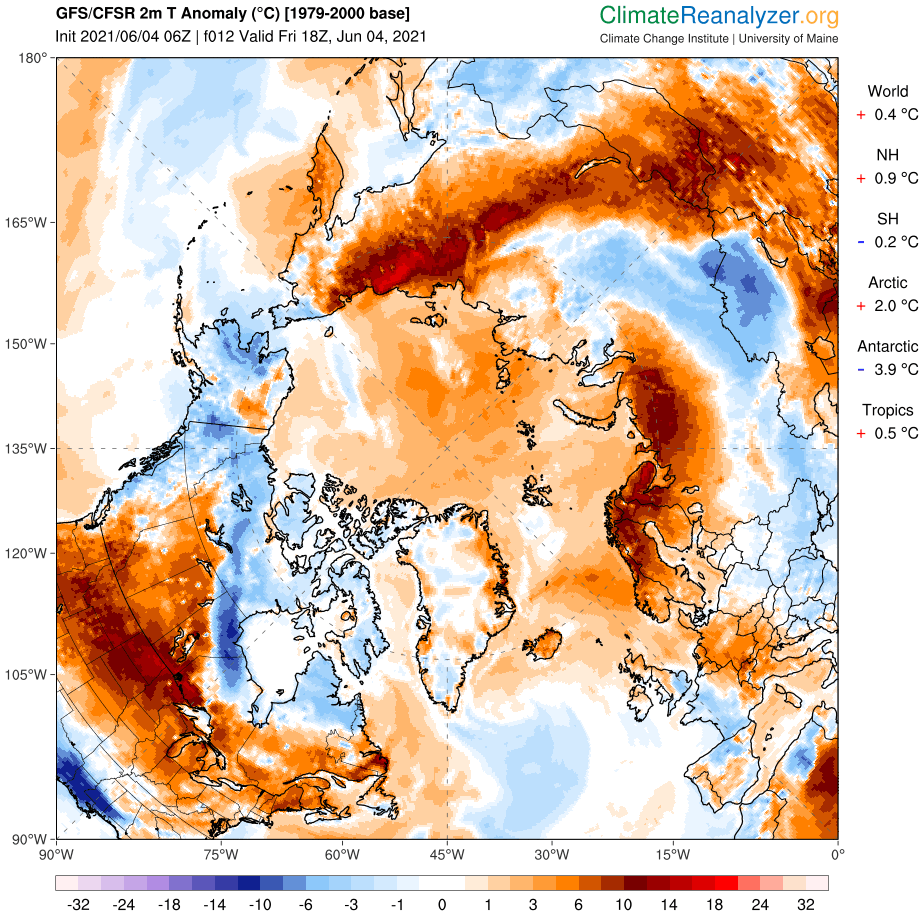
Perhaps unsurprisingly the GFS forecast from four days ago hasn’t quite worked out as predicted. The Arctic as a whole is certainly on the warm side, with a +2 C anomaly at this moment:
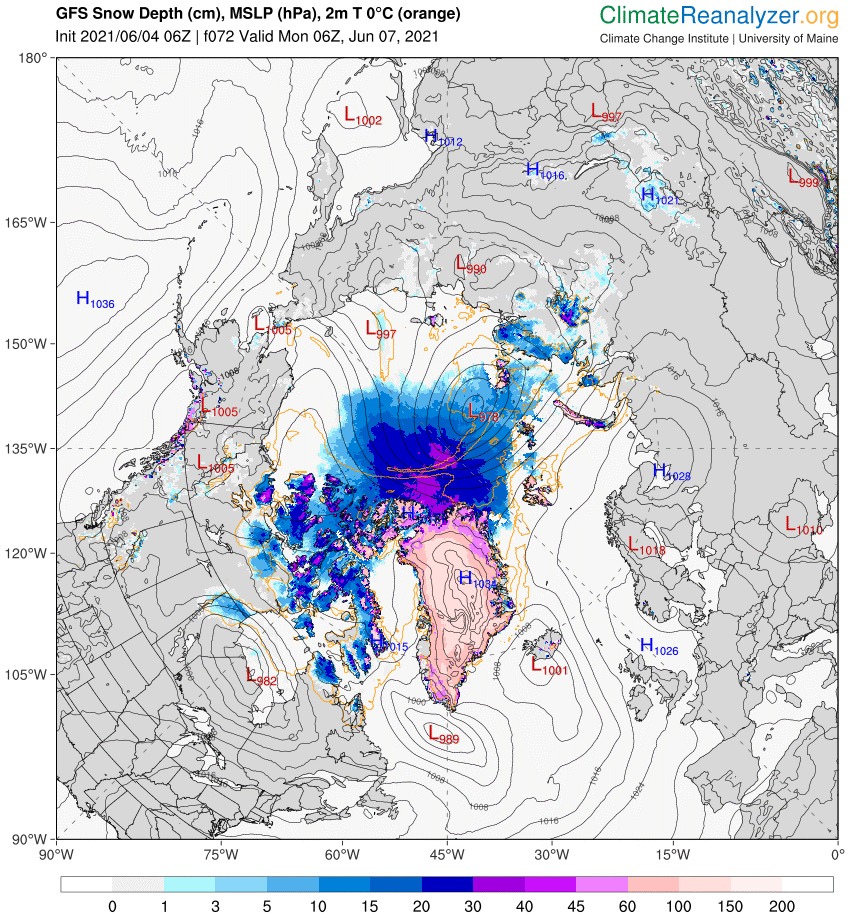
However the 966 hPa MSLP cyclone predicted for Monday is now forecast to be a mere 978 hPa:
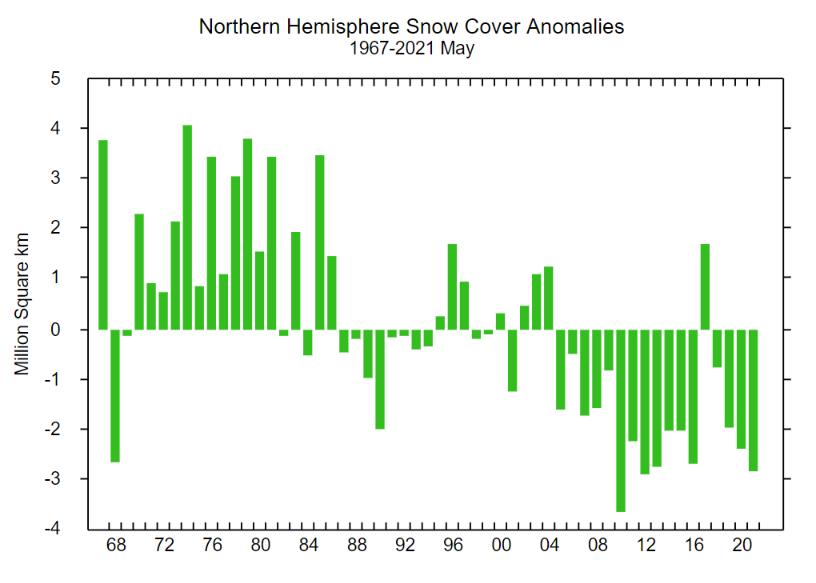
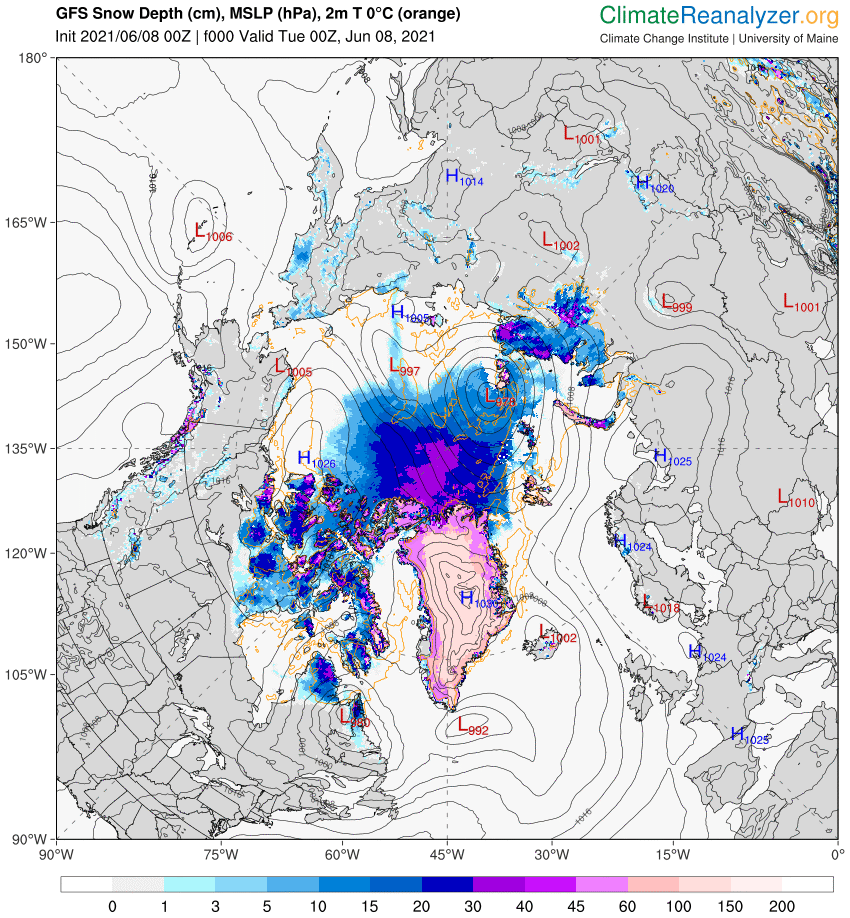
With 3 days to go there is a reasonable chance of it verifying in the “New Arctic” of 2021. As you can see from the map above a large area of the Central Arctic has now lost its snow cover. This is confirmed by the Rutgers Snow Lab northern hemisphere data for May:
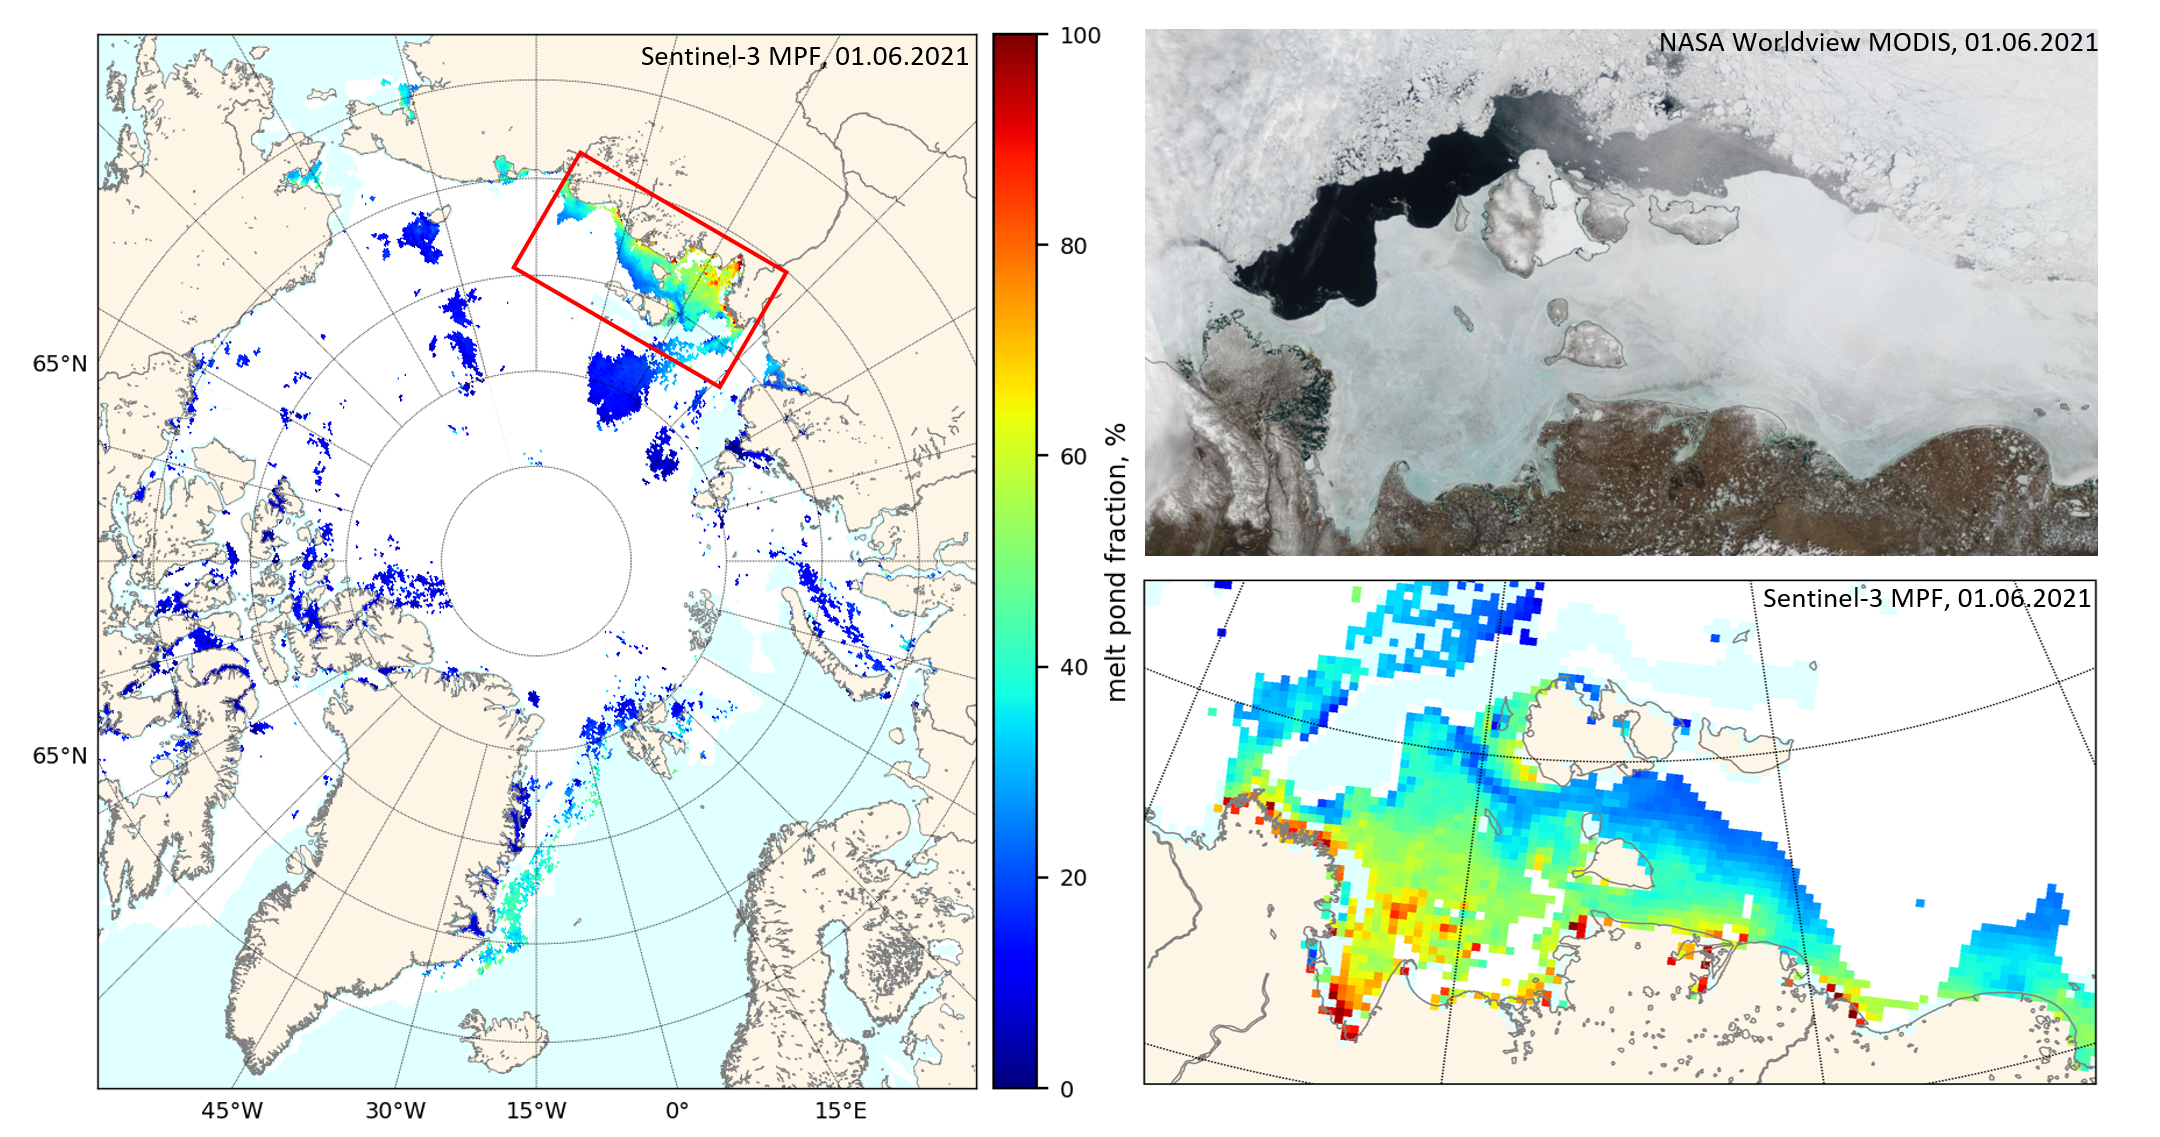
A new Sentinel 3 melt pond fraction product from the University of Bremen confirms that on the fast ice in the Laptev & East Siberian Seas snow cover has departed and melt ponds have arrived:
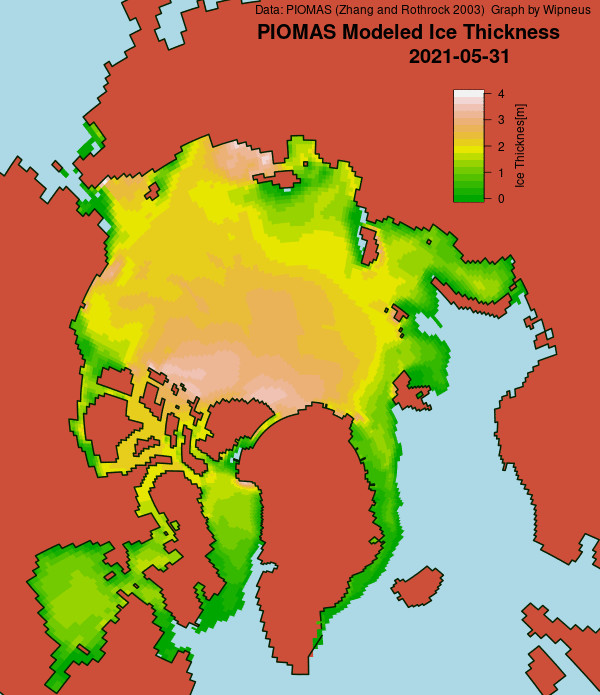
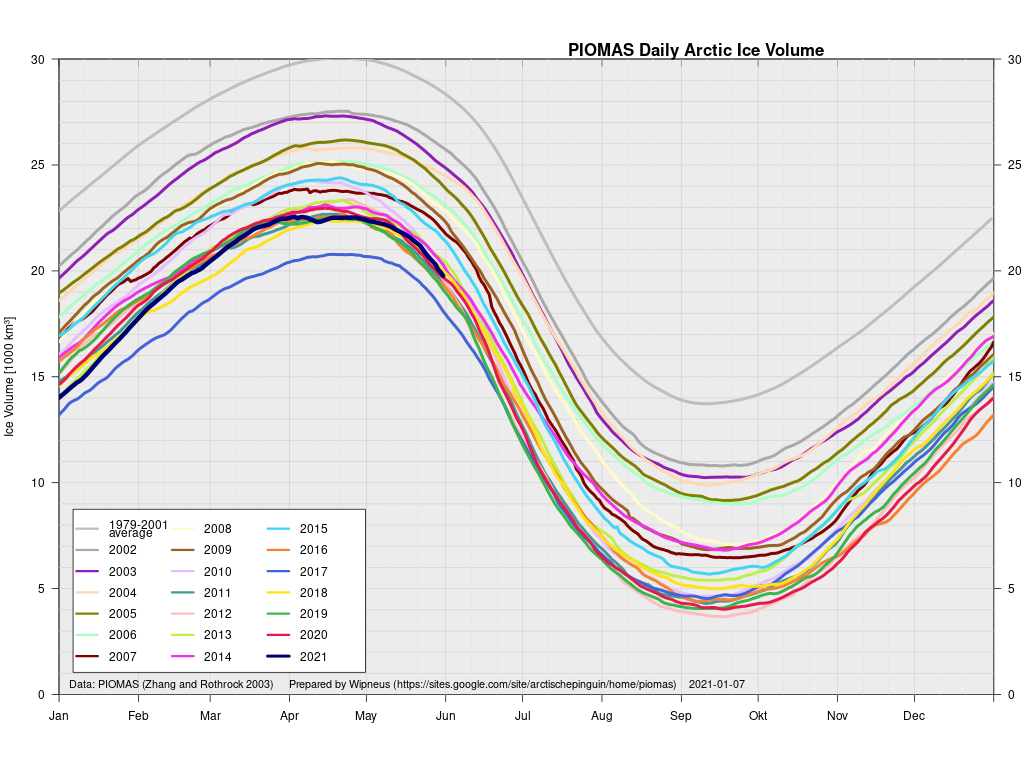
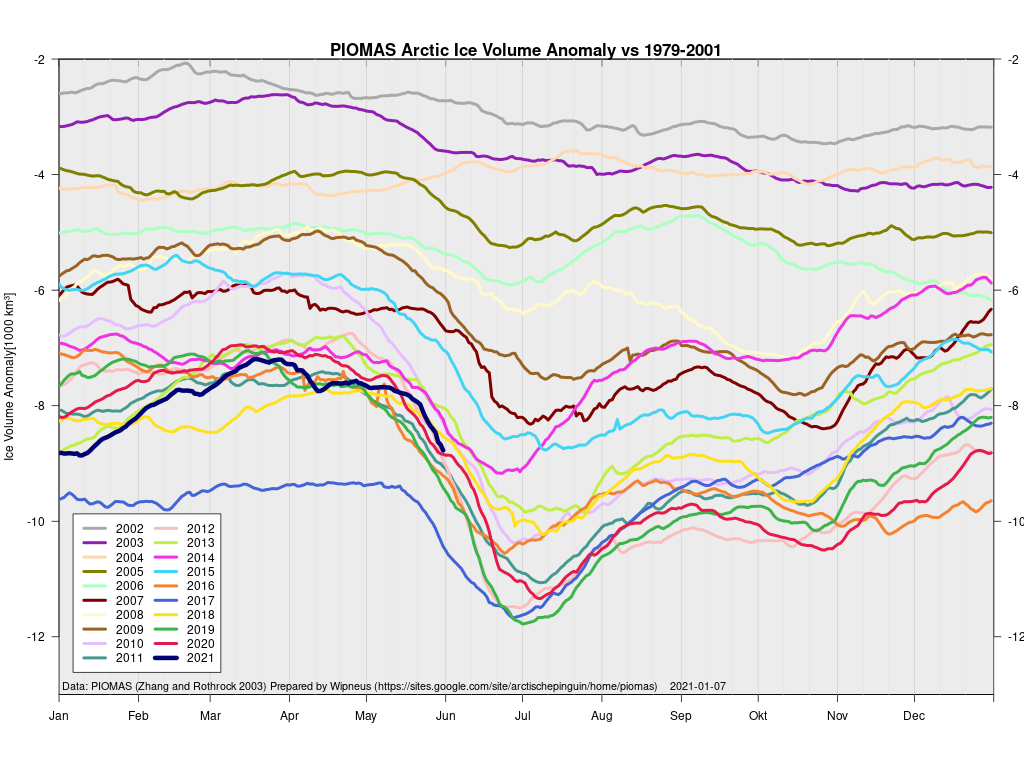
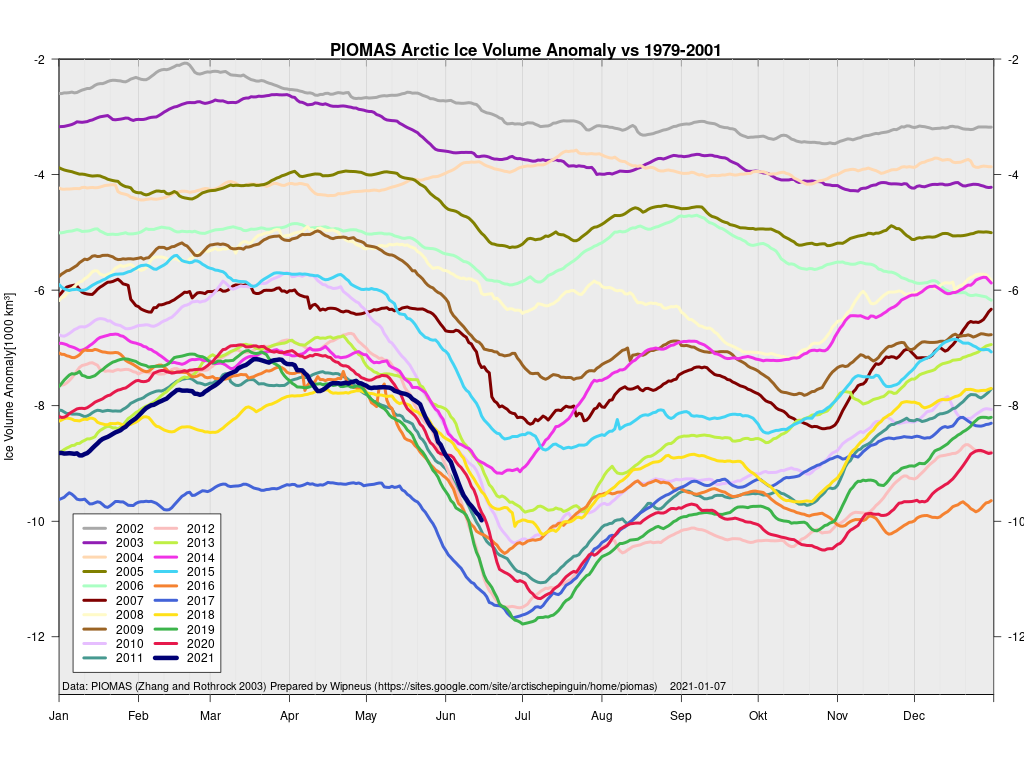
In other news Wipneus has released the latest PIOMAS gridded thickness and volume data on the Arctic Sea Ice Forum:
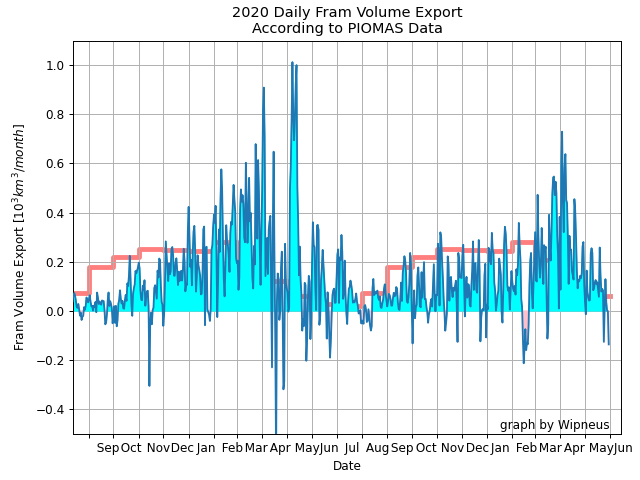
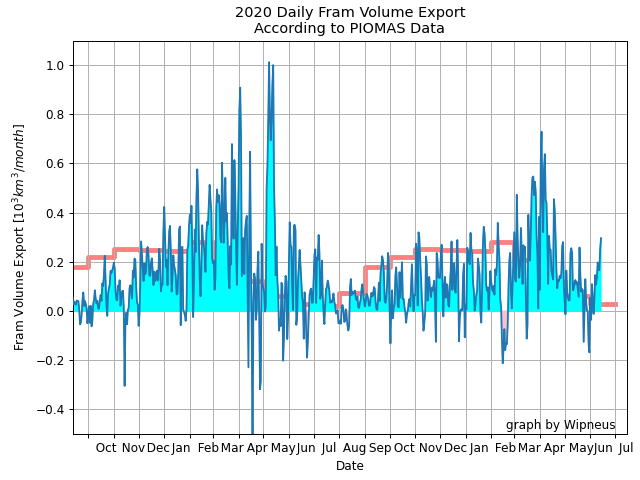
For some strange reason 2021 volume at the end of May is almost identical to 2012 and 2020! Plus of course there’s the modelled volume export from the Central Arctic via the Fram Strait:
[Edit – June 6th]
This “false colour” image reveals that there’s virtually no snow cover left on land, and this “false colour” image reveals that the land-fast ice in the East Siberian Sea is now awash with melt ponds:
[Edit – June 8th]
The forecast low pressure area appears to have bottomed out near the Severnaya Zemlya islands with a 978 hPa MSLP:
High resolution AMSR2 Arctic sea ice area is now 2nd lowest for the date after 2016:
Laptev sea ice area is still lowest for the data, and looks as though it will retain that position for a while:
[Edit – June 9th]
The effect of the recent heat and wind on the remaining sea ice in the Laptev Sea is now all too apparent:
It’s also evident in the DMI >80N temperature graph, which has now reached sea ice “melting point” ahead of the climatology:
Note that the blue line is actually above the “freezing point” of salty Arctic sea water.
[Edit – June 13th]
Fairly clear skies over the Laptev Sea and the western East Siberian Sea, revealing wall to wall melt ponds and the land-fast ice starting to break up near the coast as well as on the edge of the now open ocean:
Plus yesterday’s view of the Beaufort Sea, revealing fast ice breaking up in the western entrance to the McClure Strait:
[Edit – June 18th]
A clearish view of the Laptev Sea today, revealing assorted cracks in a variety of locations:
[Edit – June 20th]
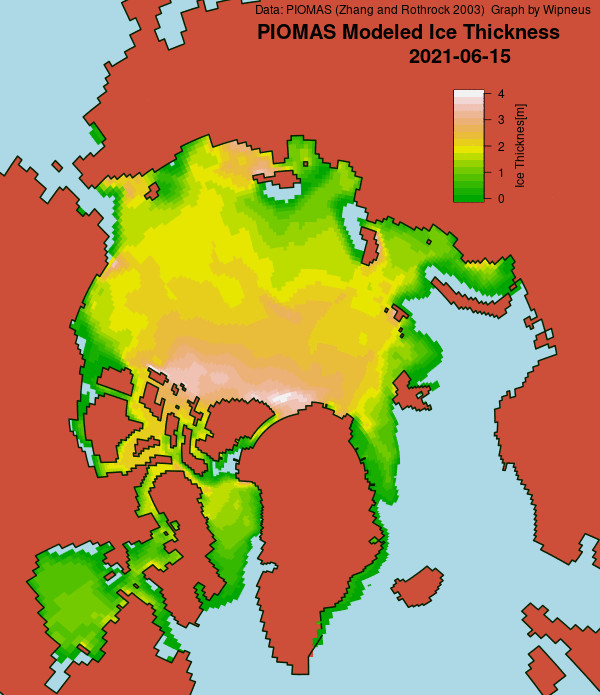
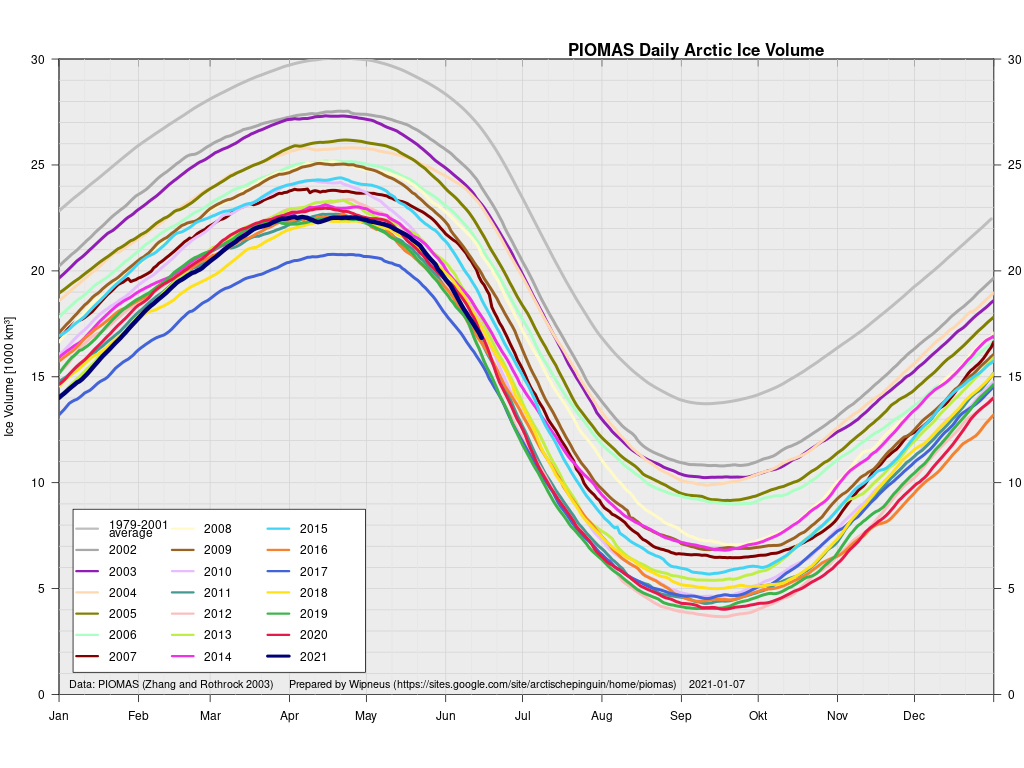
The latest mid-month PIOMAS thickness/volume numbers have been released:
[Edit – June 23rd]
The skies over the Vilkitsky Strait have been cloudy for a few days. However a fairly clear view yesterday reveals that breakup is well under way in what is usually one the last areas along the Northern Sea Route to become navigable:
[Edit – June 26th]
The land-fast ice in the East Siberian Sea has started to disintegrate en masse:
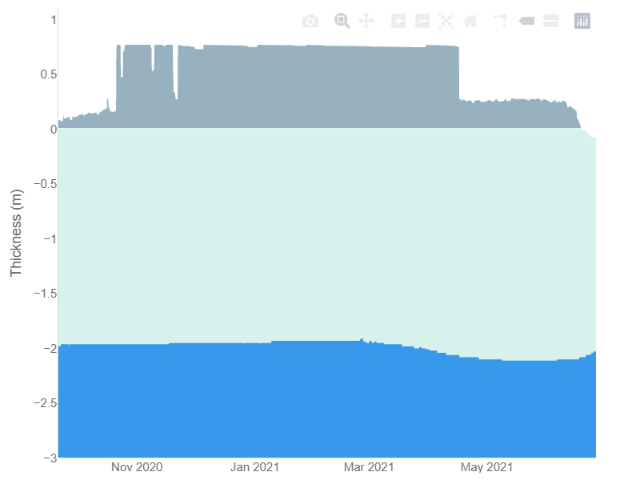
Data from ice mass balance buoy 441910, currently located at 76.1 N, 151.1 W in the Beaufort Sea, reveals the onset of both surface and bottom melt:
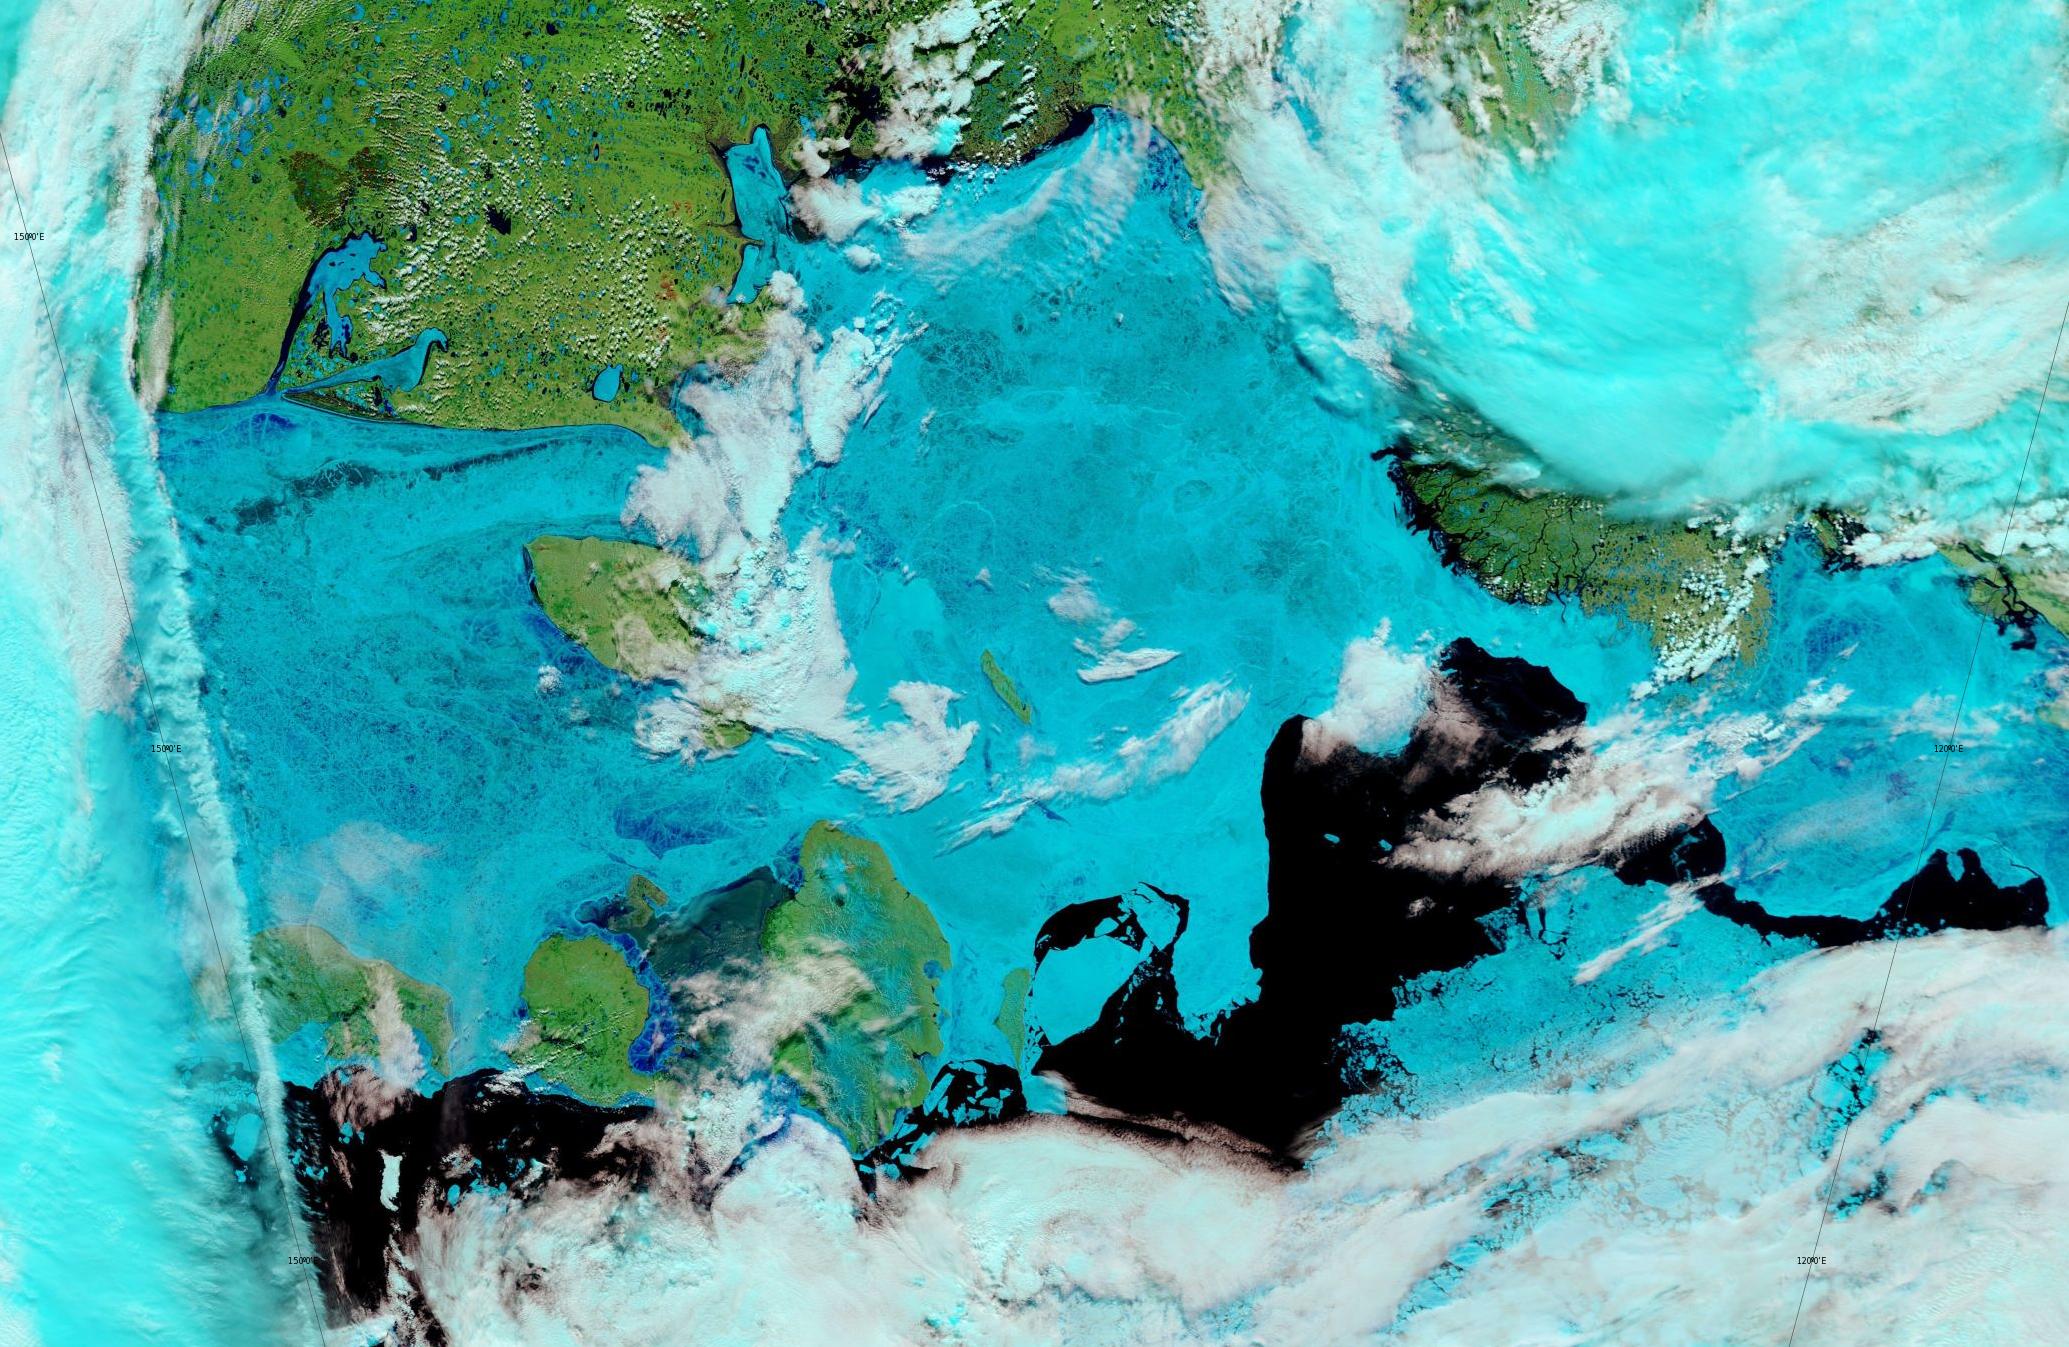
It’s May Day 2021, and just for a change we’re going to start the month off with a pretty picture!
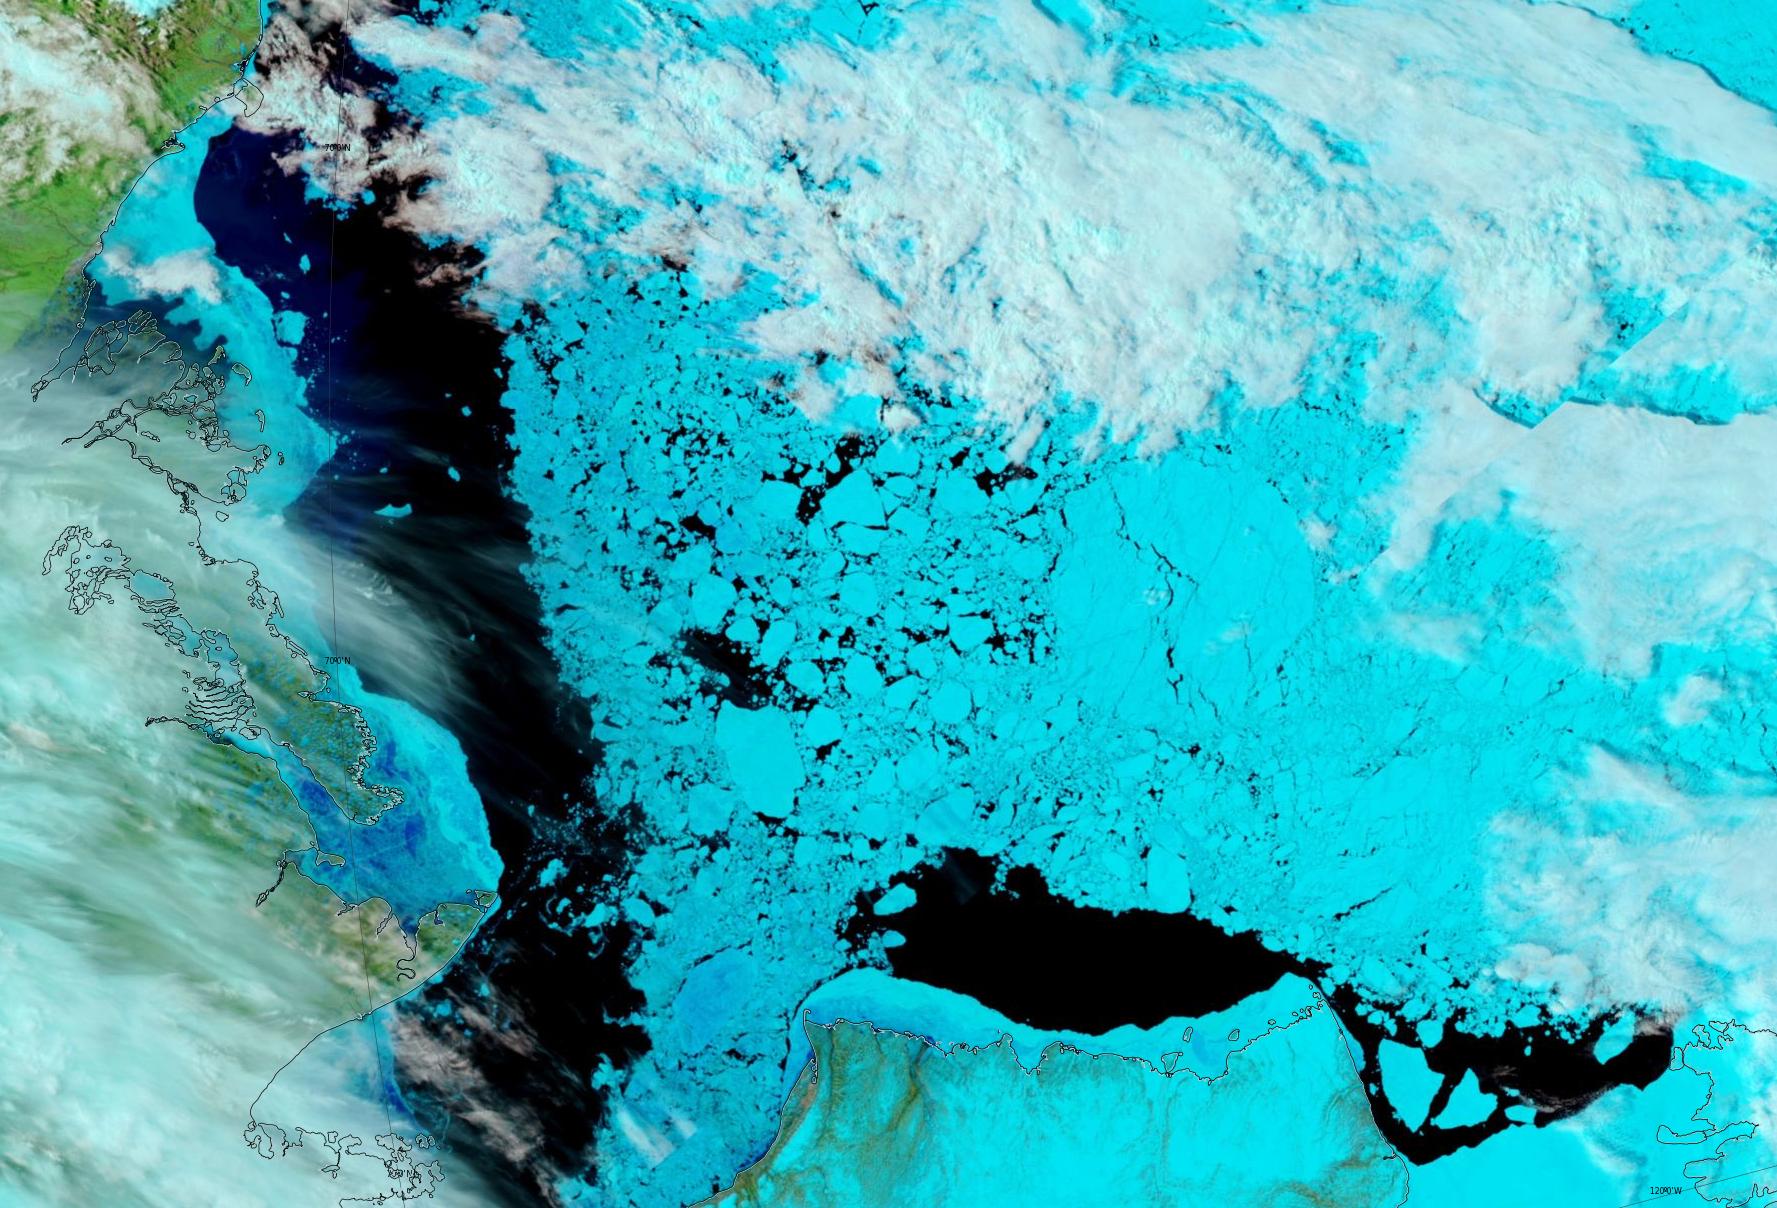
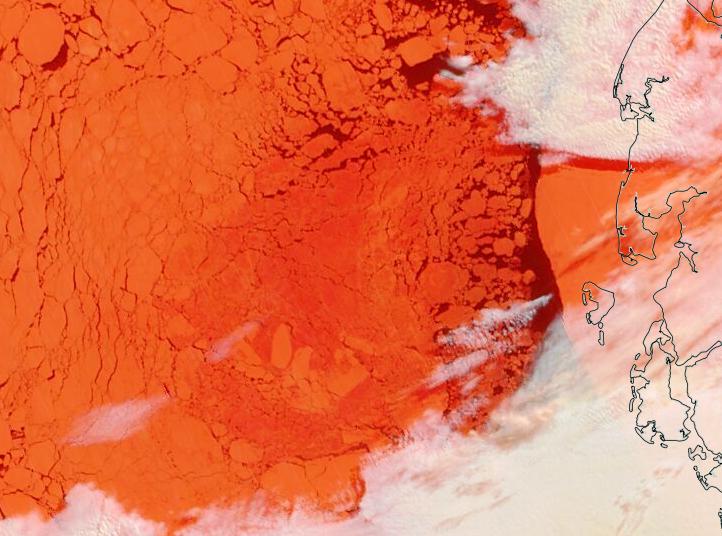
Parts of the Laptev Sea are starting to look distinctly “warm” in the infra-red. Here’s a “false colour” image taken by the Terra satellite during a gap in the clouds:
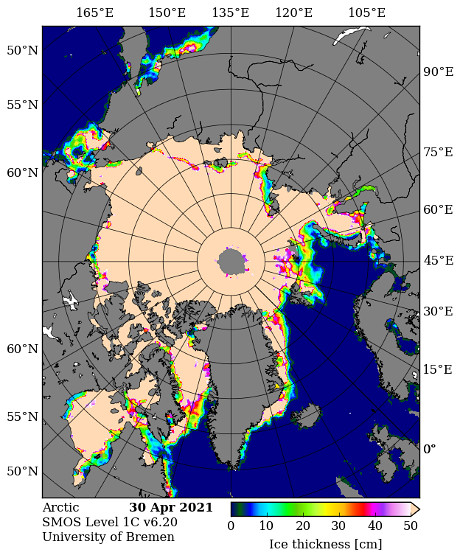
We have reached the time of year when the SMOS “thin ice thickness” readings start being affected by surface melt, but let’s take a look anyway:
That area of the Laptev certainly appears to be either thin or melting.
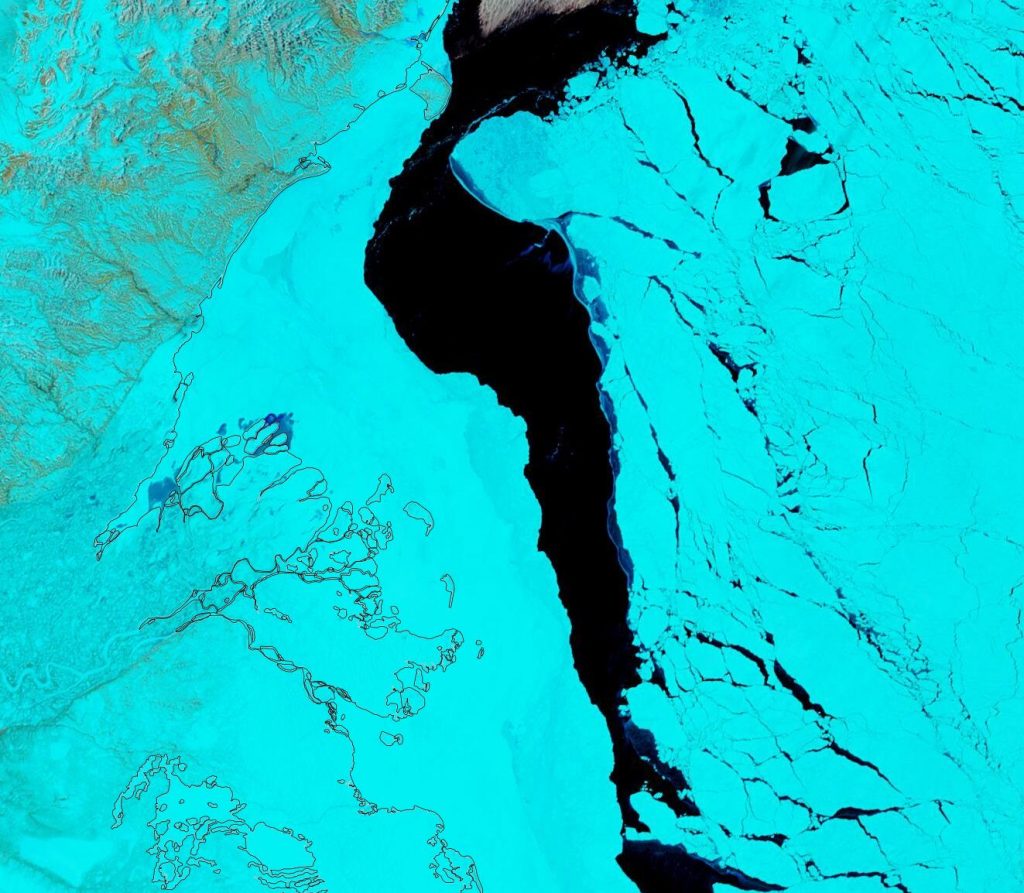
Meanwhile on the Canadian side of the Arctic the fast ice off the Mackenzie Delta is starting to get damp, even though the river itself still looks to be fairly well frozen:
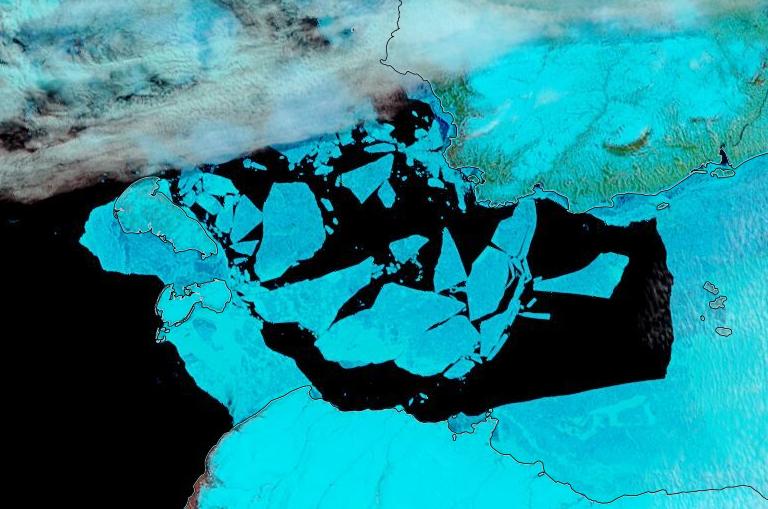
It will also be interesting to follow the progress of this large floe as it heads towards oblivion through the Fram Strait:
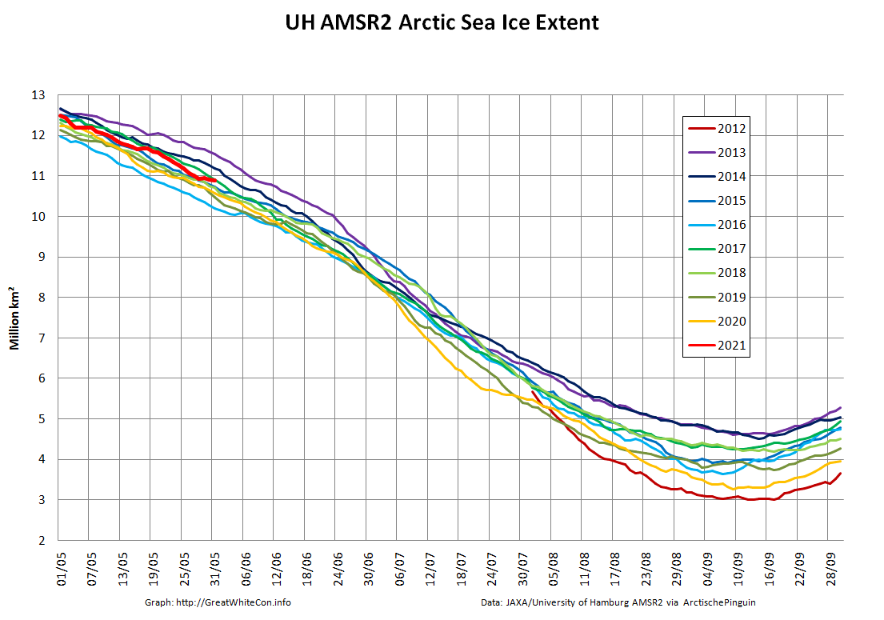
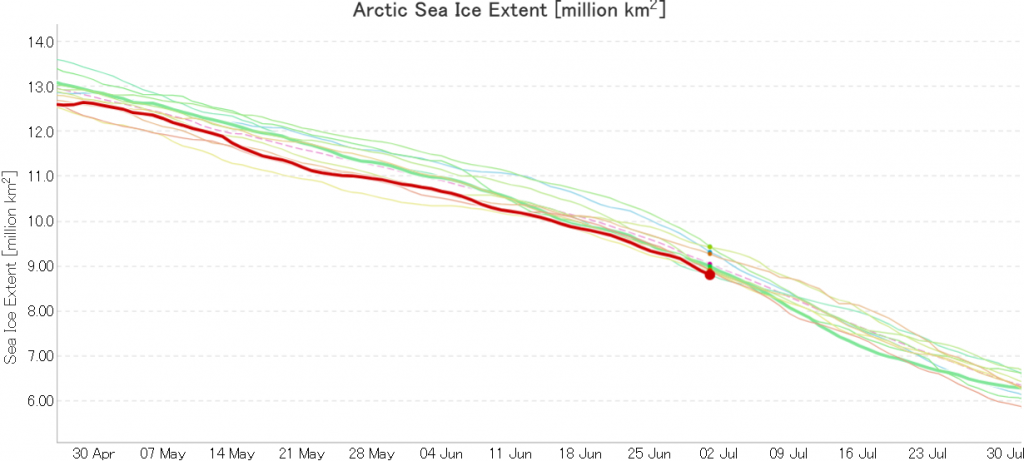
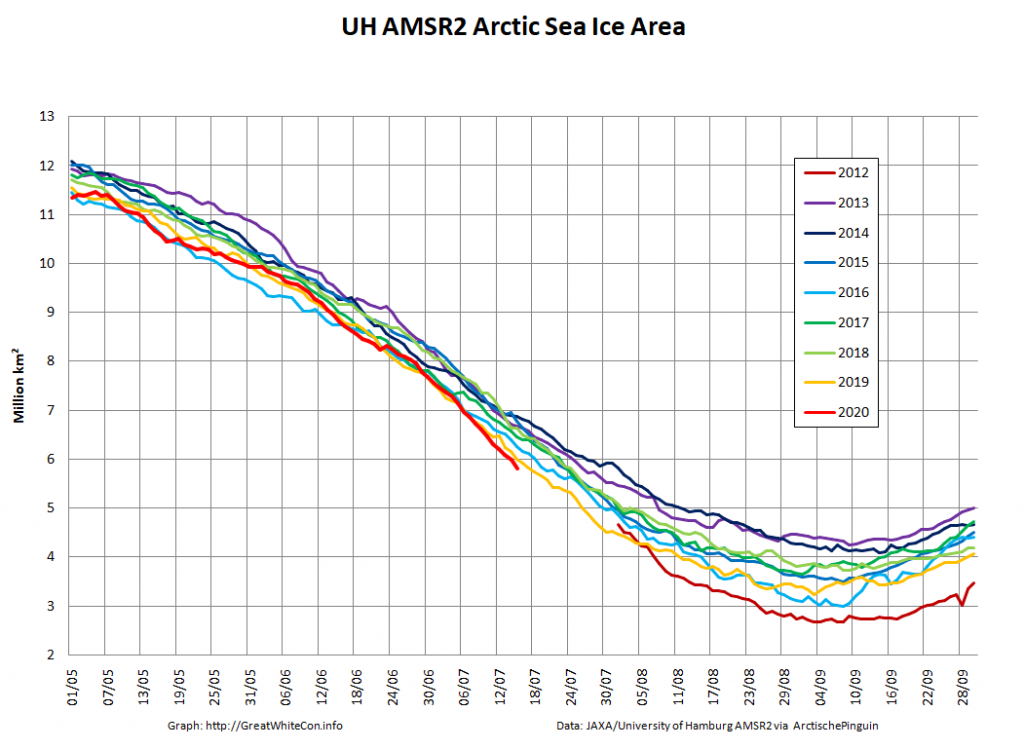
The new month starts with JAXA extent “lowest for the date in the satellite record” by a whisker:
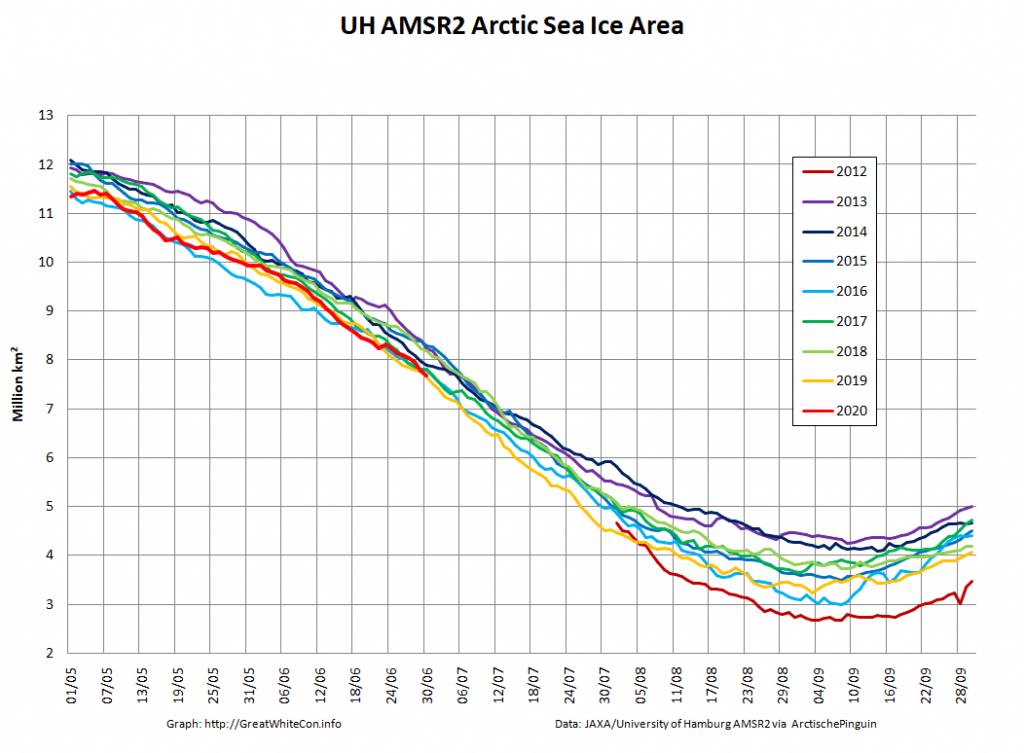
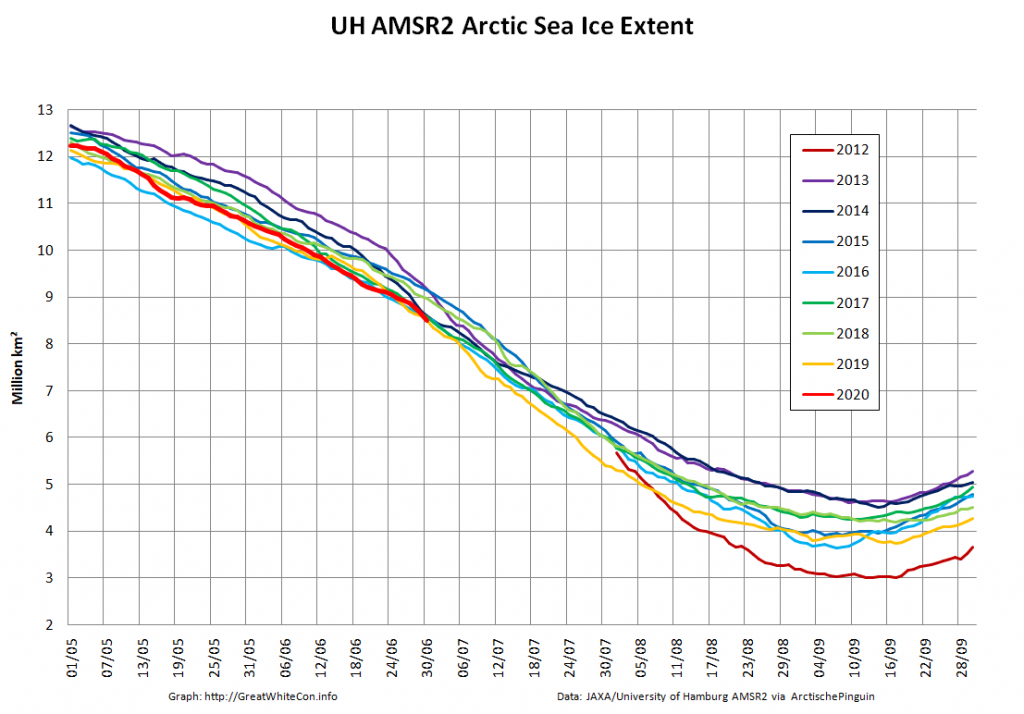
The high resolution Arctic sea ice area and extent graphs based on the University of Hamburg’s AMSR2 concentration data are also in “statistical ties” for that honour, in records going back to 2013:
The 2020 melting season currently seems to be a game of two (geographical) halves. The sea ice on the Siberian side of the Arctic is currently at record lows:
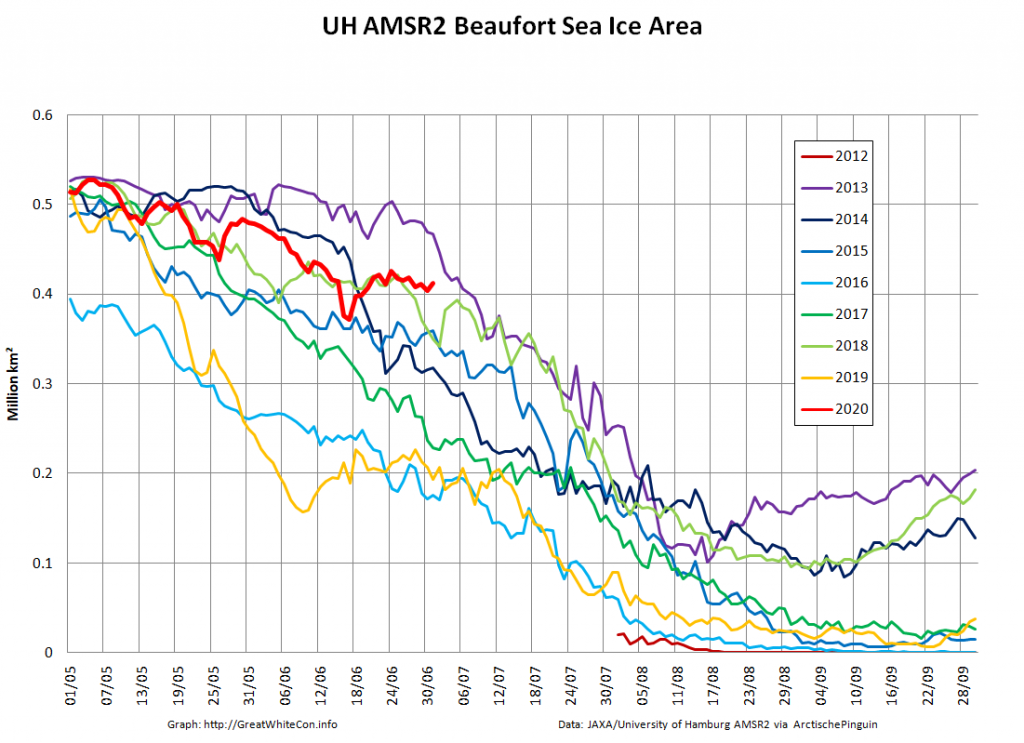
Whereas the Beaufort Sea is near a record high:
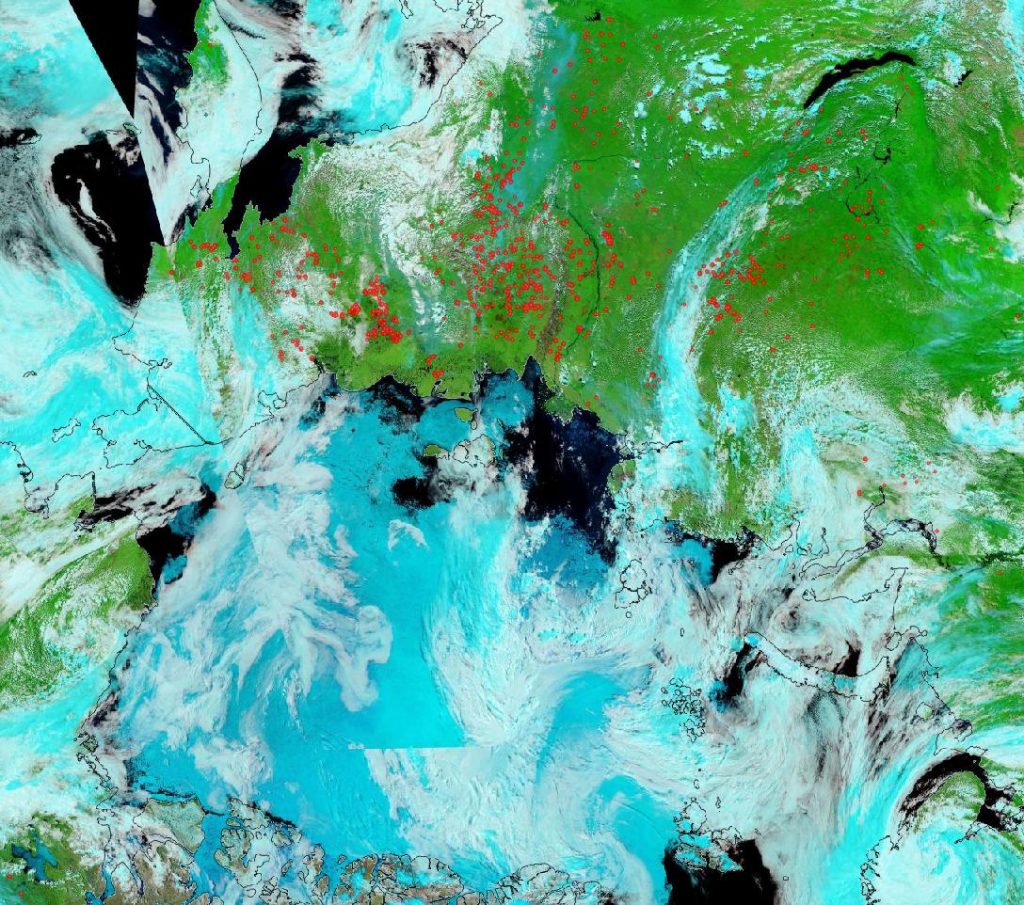
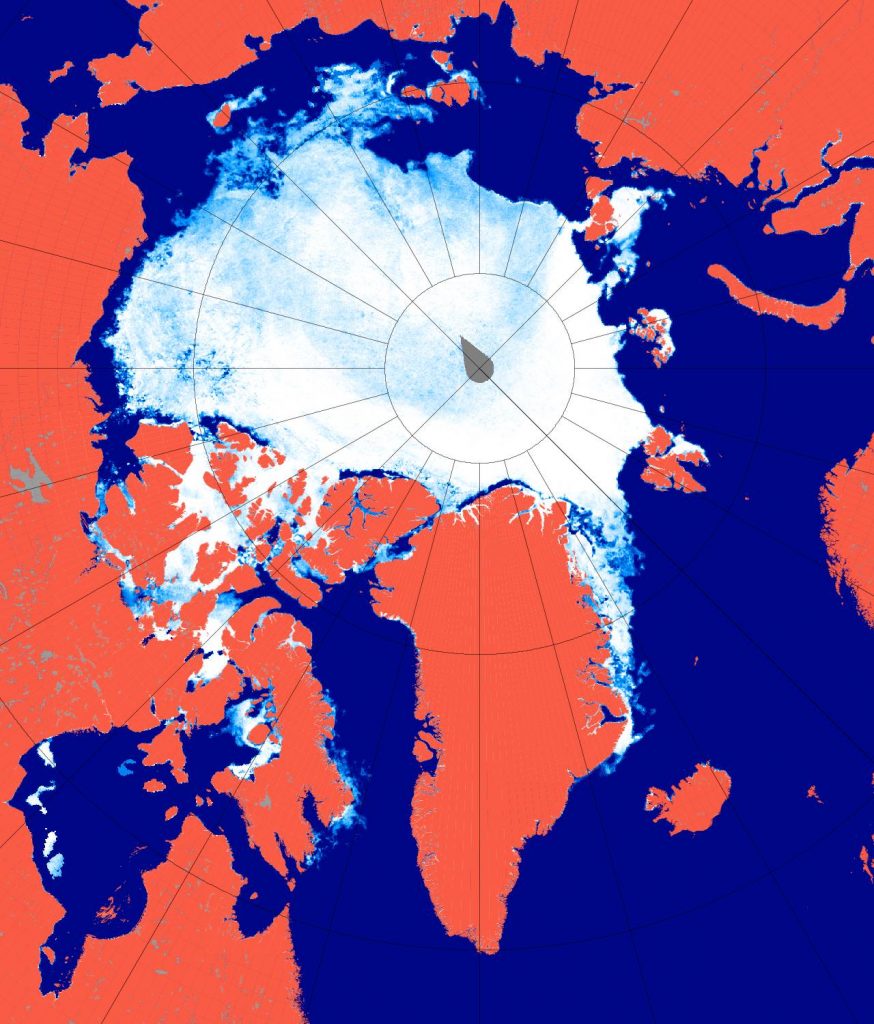
Currently the tell tale signs of surface melt are visible across most of the central Arctic, as are the large number of wildfires across Arctic Siberia:
NASA Worldview “false-color” image of the Arctic on July 1st 2020, derived from the MODIS sensor on the Terra satellite
[Edit – July 4th]
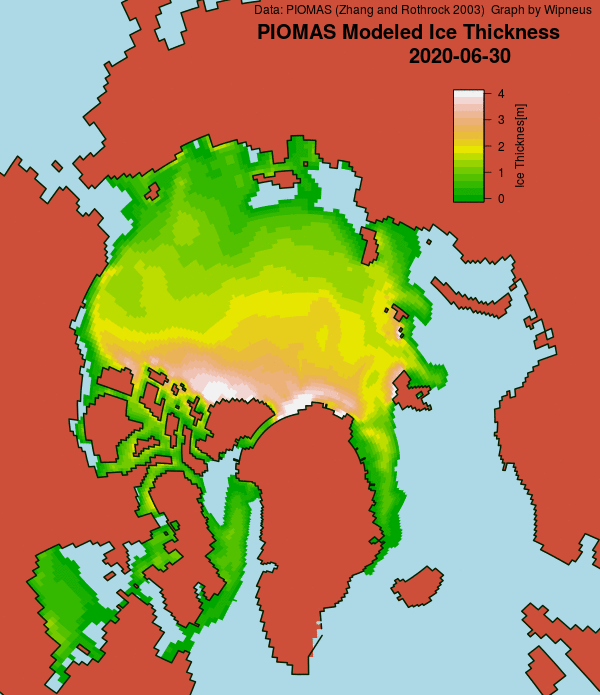
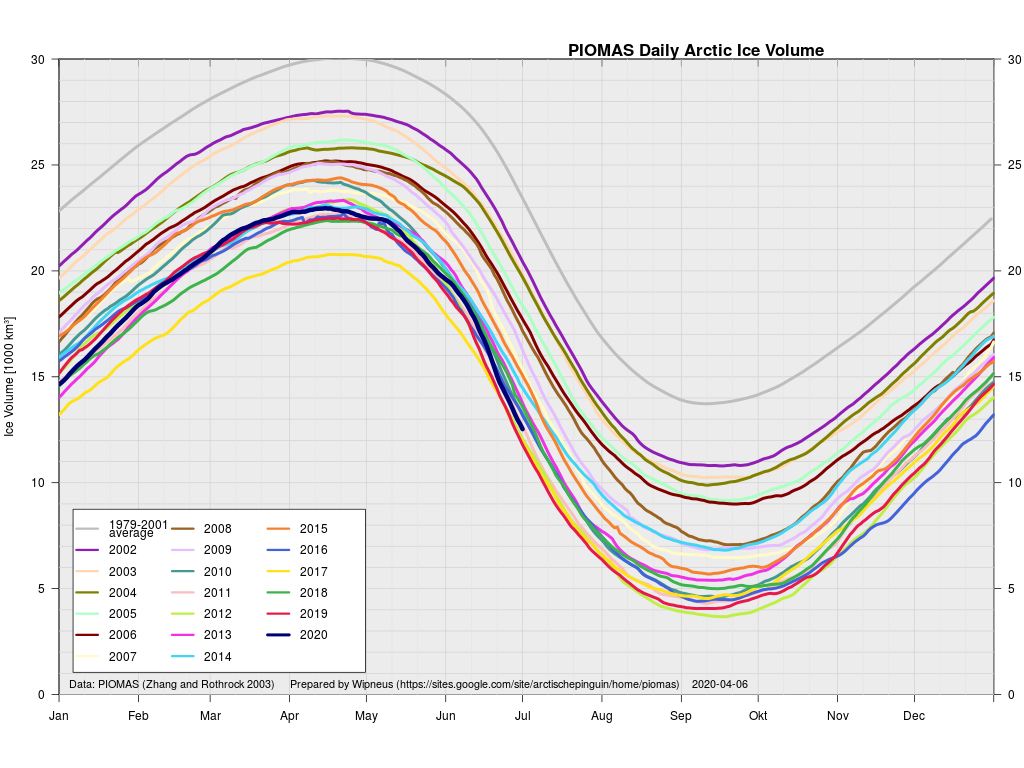
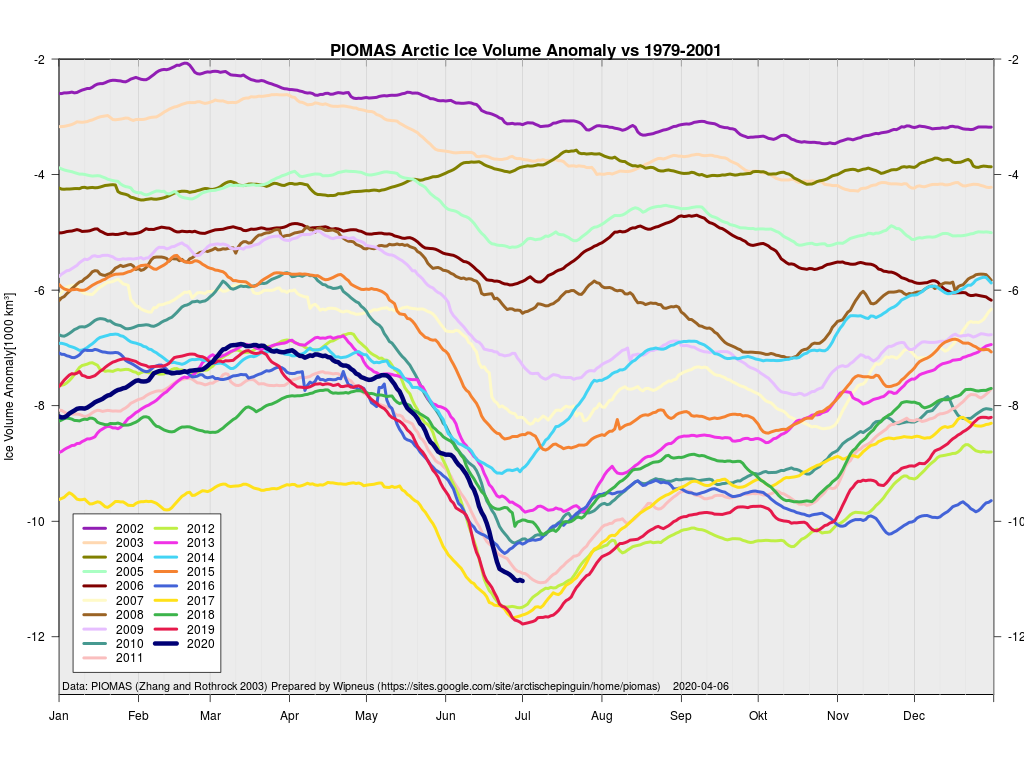
The June 30th PIOMAS gridded thickness numbers have been released, and here are the results of Wipneus’s number crunching:
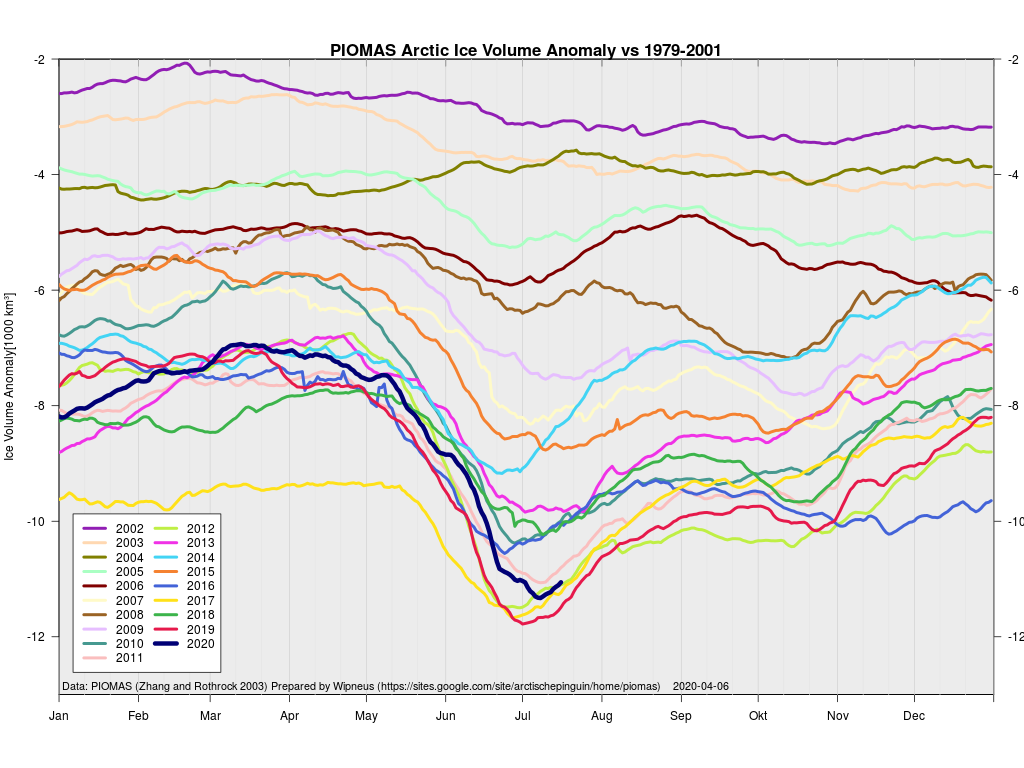
This month including a visualisation of the increasing negative anomaly:
[Edit – July 6th]
A break in the clouds over the North Pole reveals the onset of surface melt:
NASA Worldview “false-color” image of the North Pole on July 6th 2020, derived from the MODIS sensor on the Terra satellite
[Edit – July 8th]
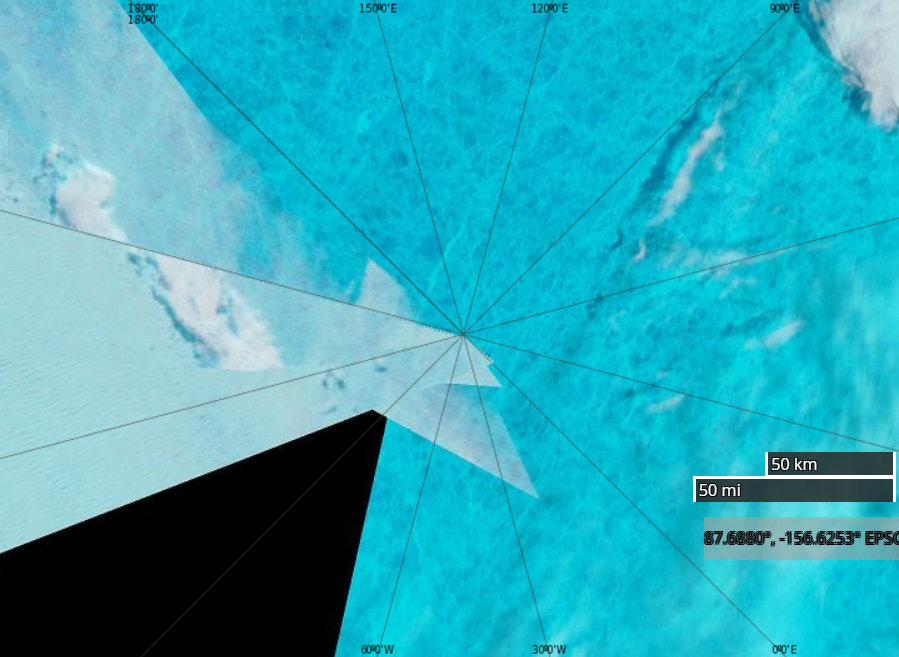
After a brief hiatus there are once again some ice mass balance buoys installed at assorted locations across the Arctic. Some have ceased to function, but one of the buoys installed as part of the MOSAiC expedition is still sending back data as it heads towards the Fram Strait. Buoy 387850 is currently located at 81.66 N, 4.19 E. Here’s its ice mass balance plot:
As you can see, both surface and bottom melt are well under way, with just over a meter of ice still remaining.
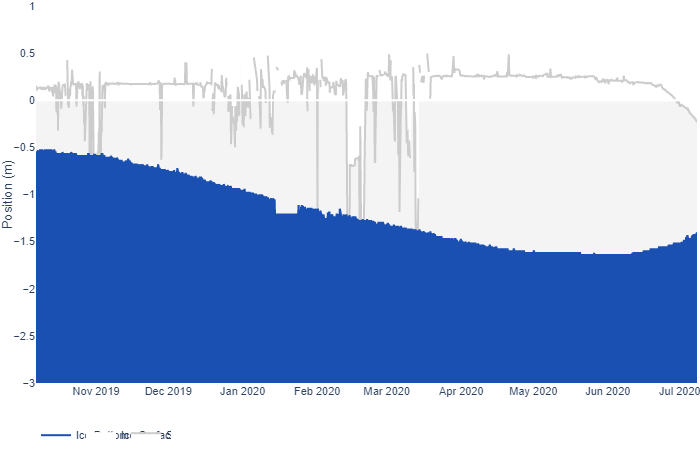
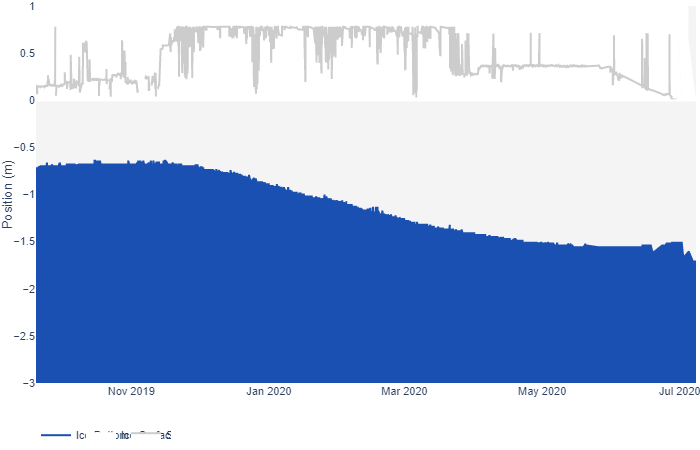
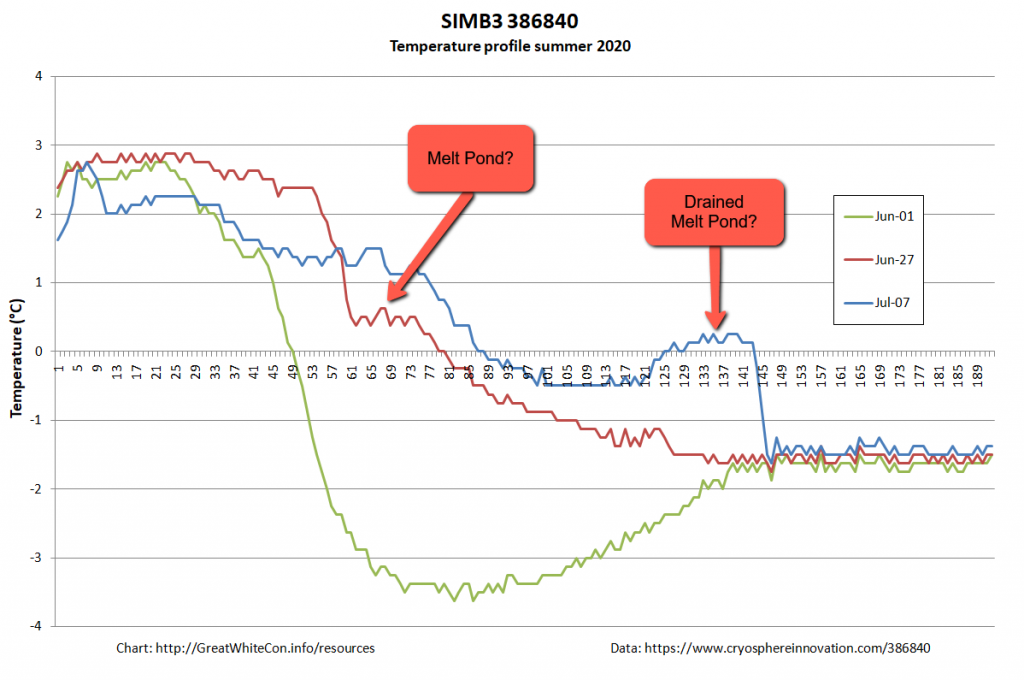
Now let’s take a look at buoy 386840, currently located at 74.30 N, 132.60 W in the Beaufort Sea:
It looks as though the ice thickness has increased, but surely that can’t be right at this time of year? To try and find out I downloaded the raw data and plotted the temperature readings from the buoy’s thermistor string:
It looks to me as though the ice floe carrying the buoy is currently floating on some warm fresh water from a recently drained melt pond, which is confusing the sensor designed to measure the position of the bottom of the ice. There certainly seems to be far less than the claimed “1.653 m snow and ice thickness” still remaining to be melted!
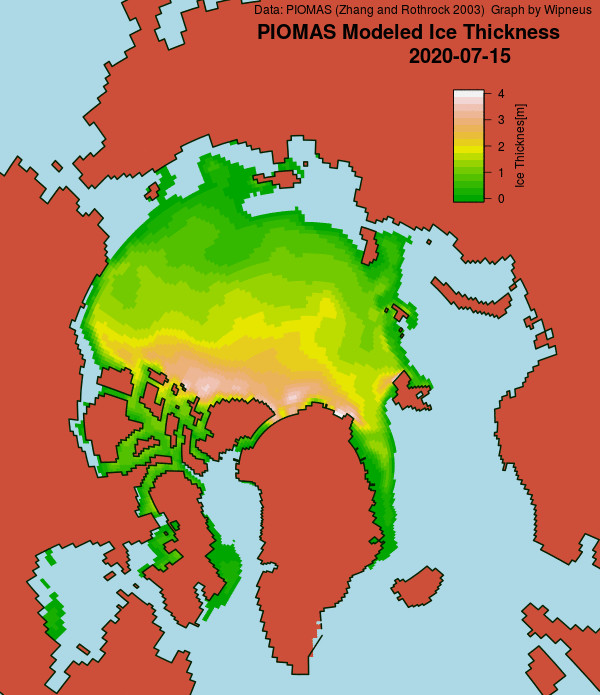
[Edit – July 15th]
A very unusual image. Hardly a cloud in the sky over the North Pole yesterday:
NASA Worldview “false-color” image of the North Pole on July 14th 2020, derived from the MODIS sensor on the Terra satellite
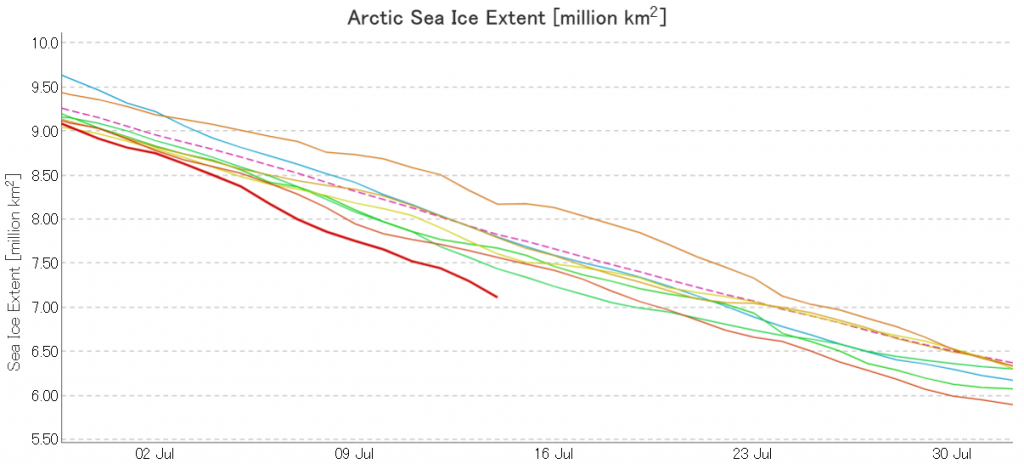
The July 2020 extent “plummet” shows no signs of ending just yet. Here’s the JAXA/ViSHOP version:
[Edit – July 17th]
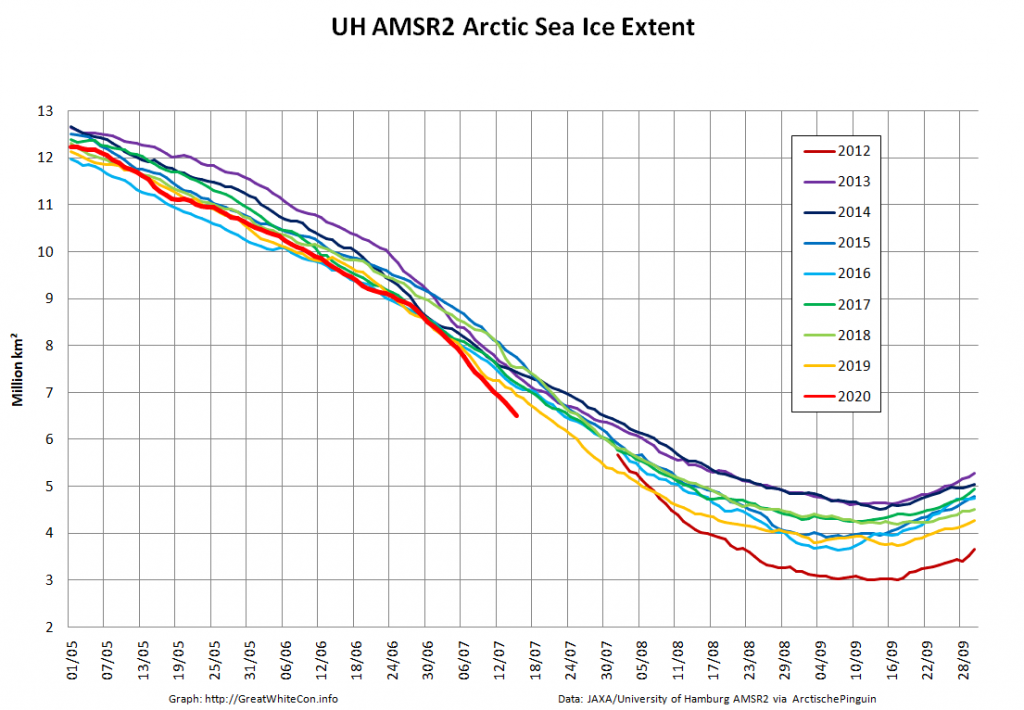
JAXA AMSR2 extent is now below 7 million km², and the high resolution version is lower still:
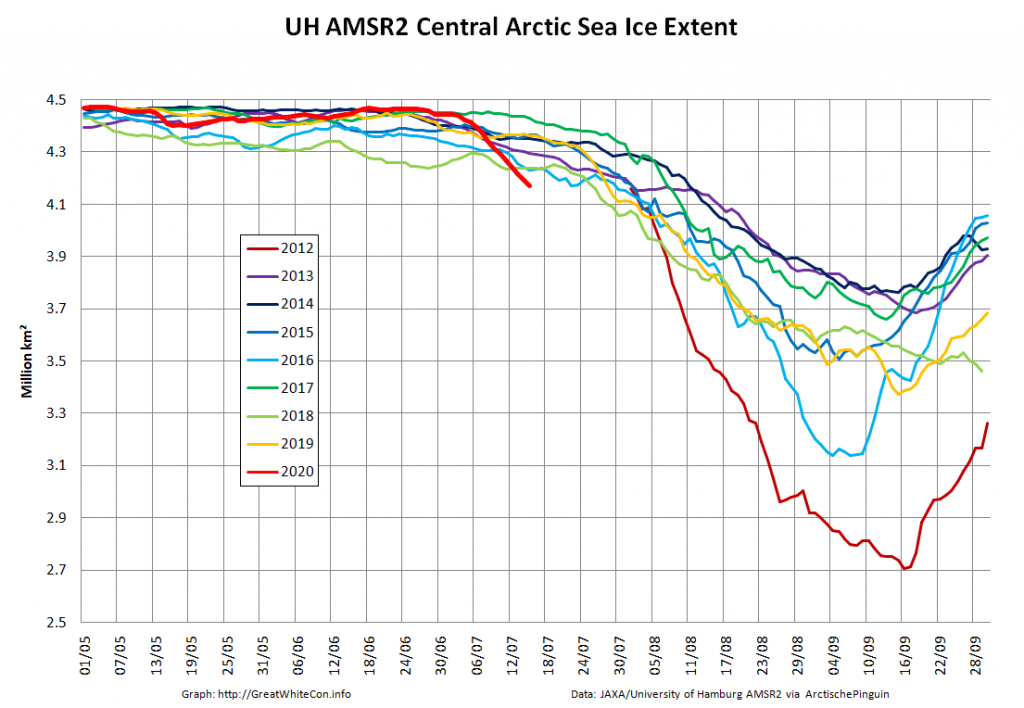
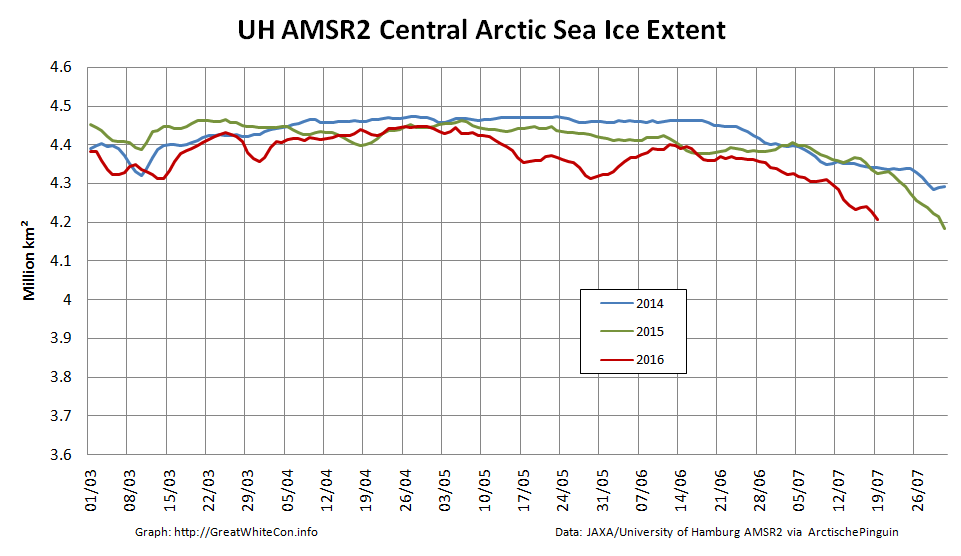
As the “Laptev Bite” and the Atlantic periphery of open water extends further towards the North Pole, Central Arctic Basin extent is now also at record lows for the date in the AMSR2 record:
Extent is currently lowest in the satellite era by a long way, but modelled volume is only fourth lowest!
Watch this space!
[Edit – July 21th]
At long last there’s a sub 1000 hPa MSLP low pressure area slowly wending its way across the central Arctic:
It seems to have bottomed out at 997 hPa. Perhaps this will inhibit the ongoing “plummet” in extent? JAXA extent fell by 114,342 km2 yesterday.
[Edit – July 23rd]
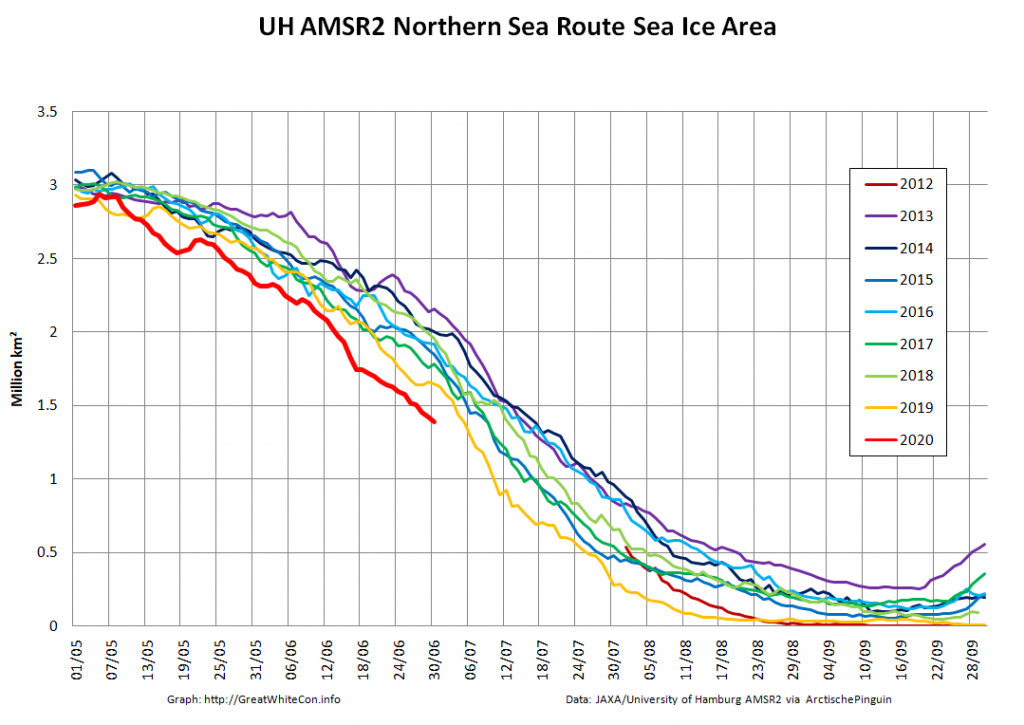
The Northern Sea Route has opened unusually early this year:
Based on the AMSR2 concentration maps from the University of Hamburg that happened on July 13th. The final choke point, as is so often the case, was the Vilkitsky Strait. According to the charts from the Russian Arctic and Antarctic Research Institute, by the 14th there was a narrow way through occupied by no more than 3/10 concentration ice:
[Edit – July 25th]
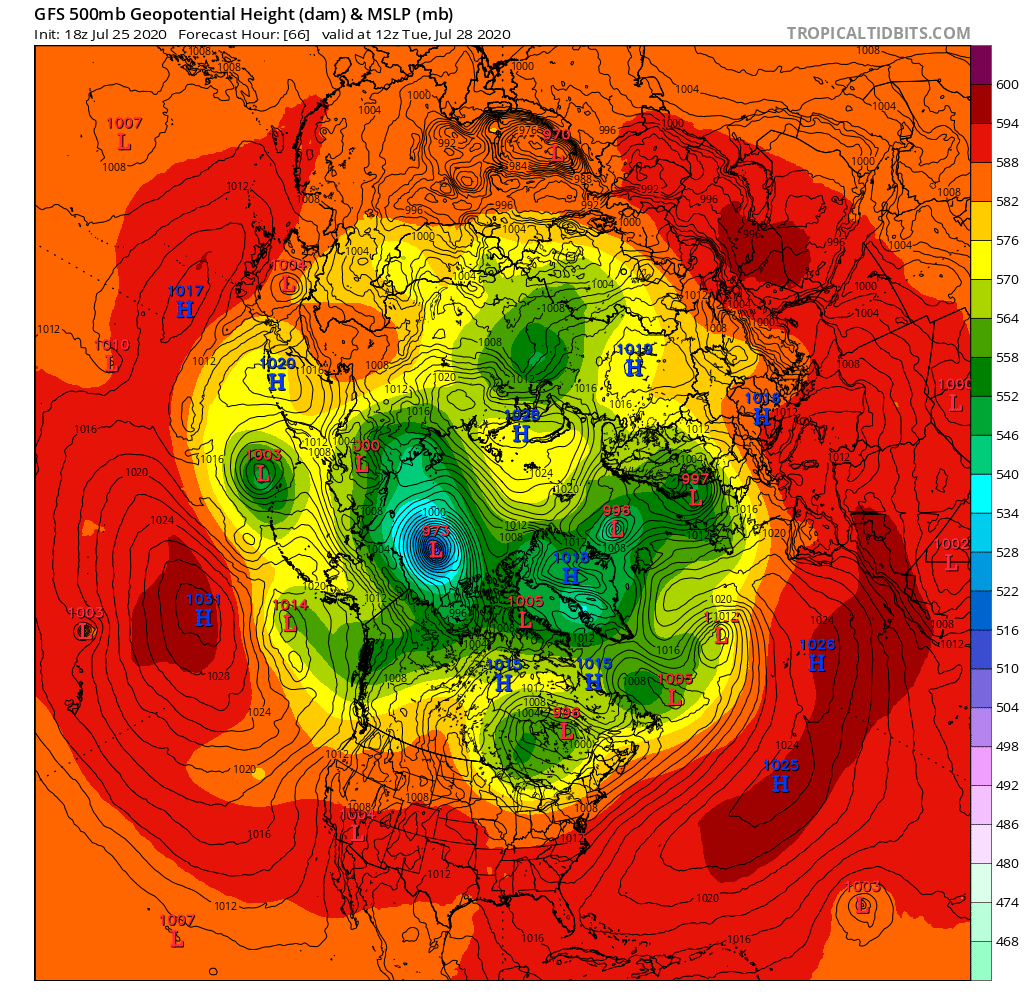
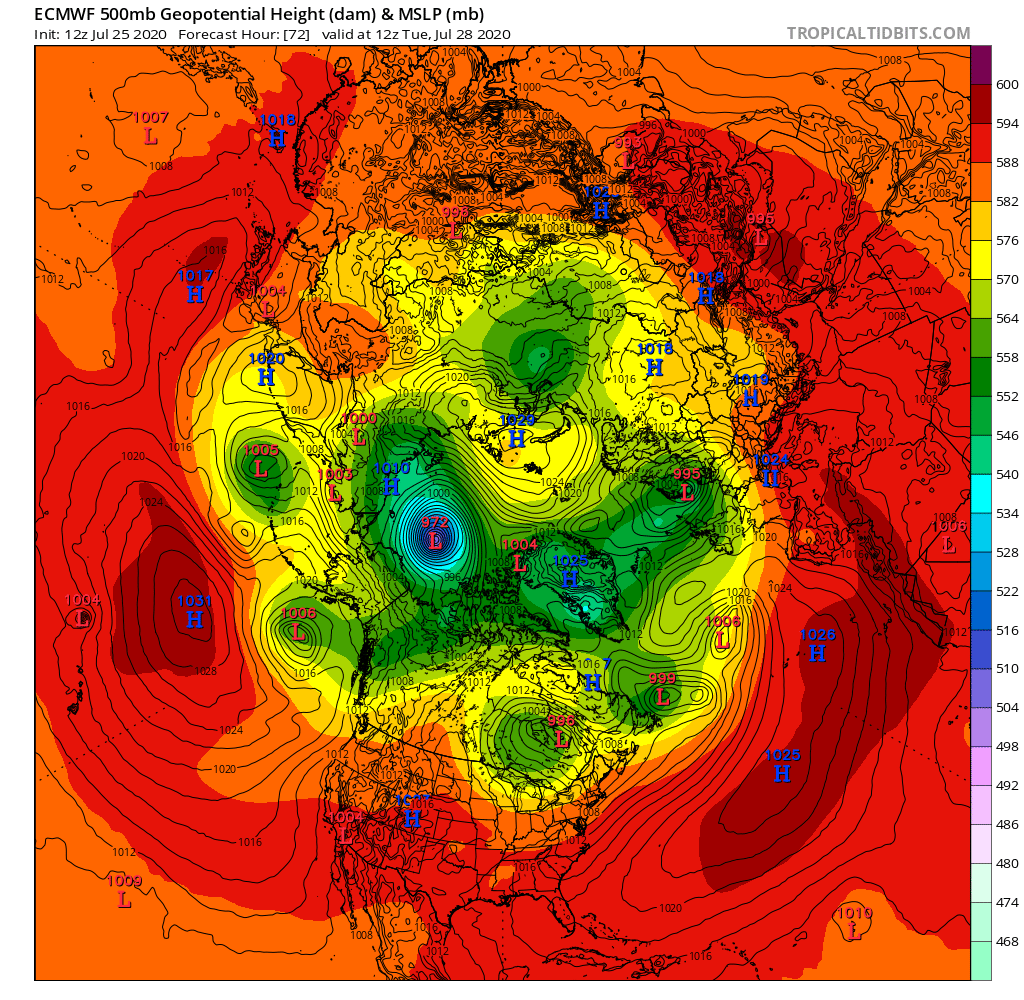
A mere three days away, and the GFS and ECMWF forecasts are in agreement, so there is a decent chance this setup will materialise in the real world:
A 972(ish) hPa MSLP cyclone sitting over the ice Beaufort Sea by 12Z on Tuesday.
[Edit – July 27th]
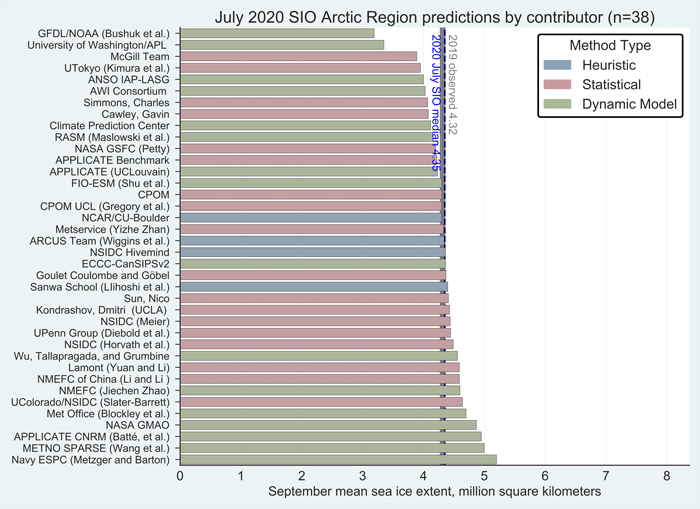
The Sea Ice Prediction Network July forecast for this year’s September minimum extent have been released. Here’s the graphical overview:
This year’s median projected value from the July forecasts of 4.3 million square kilometers is essentially identical to the median from the June forecasts. Quartiles are 4.1 and 4.6 million square kilometers. As was also the case for June, only two projections, both by dynamic models, are for a new record low, below the mark of 3.57 million square kilometers set in 2012. One dynamical model predicts the September sea-ice extent above 5.0 million square kilometers, compared to two in the June report.
Note that the numbers quoted are for the average NSIDC extent across the month of September, not the lowest daily JAXA extent, which I suggested earlier would be “below 4 million km²” this year.
Meanwhile over on Twitter this evening (UTC):
Stronger summer Arctic storms seems to be a consequence of climate change. But a deep cyclone in the central Arctic can help to accelerate sea ice melt even further.
The MSLP of the (Great?) Arctic cyclone sank below 970 hPa overnight:
After a fitful night's sleep what with one thing and another I wake to find that the (great?) #Arctic cyclone of July 2020 has sunk to a new low of 969 hPa.
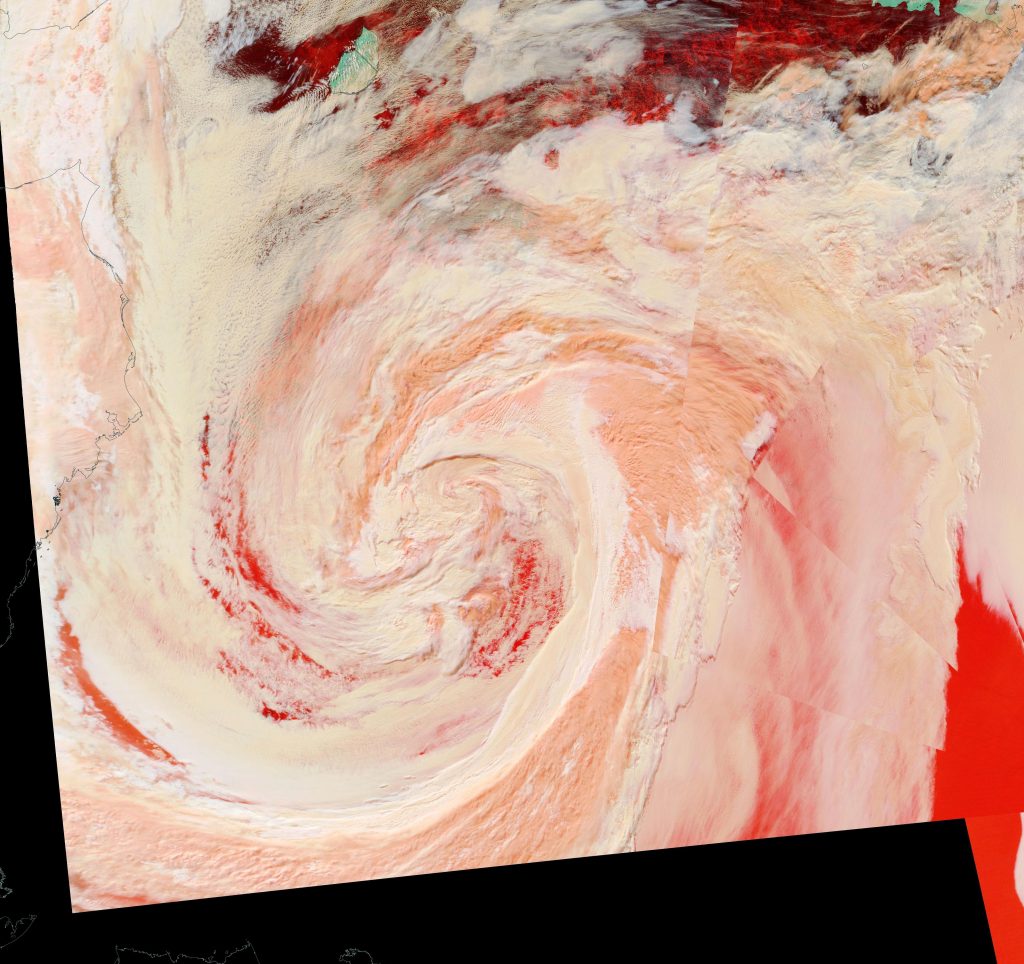
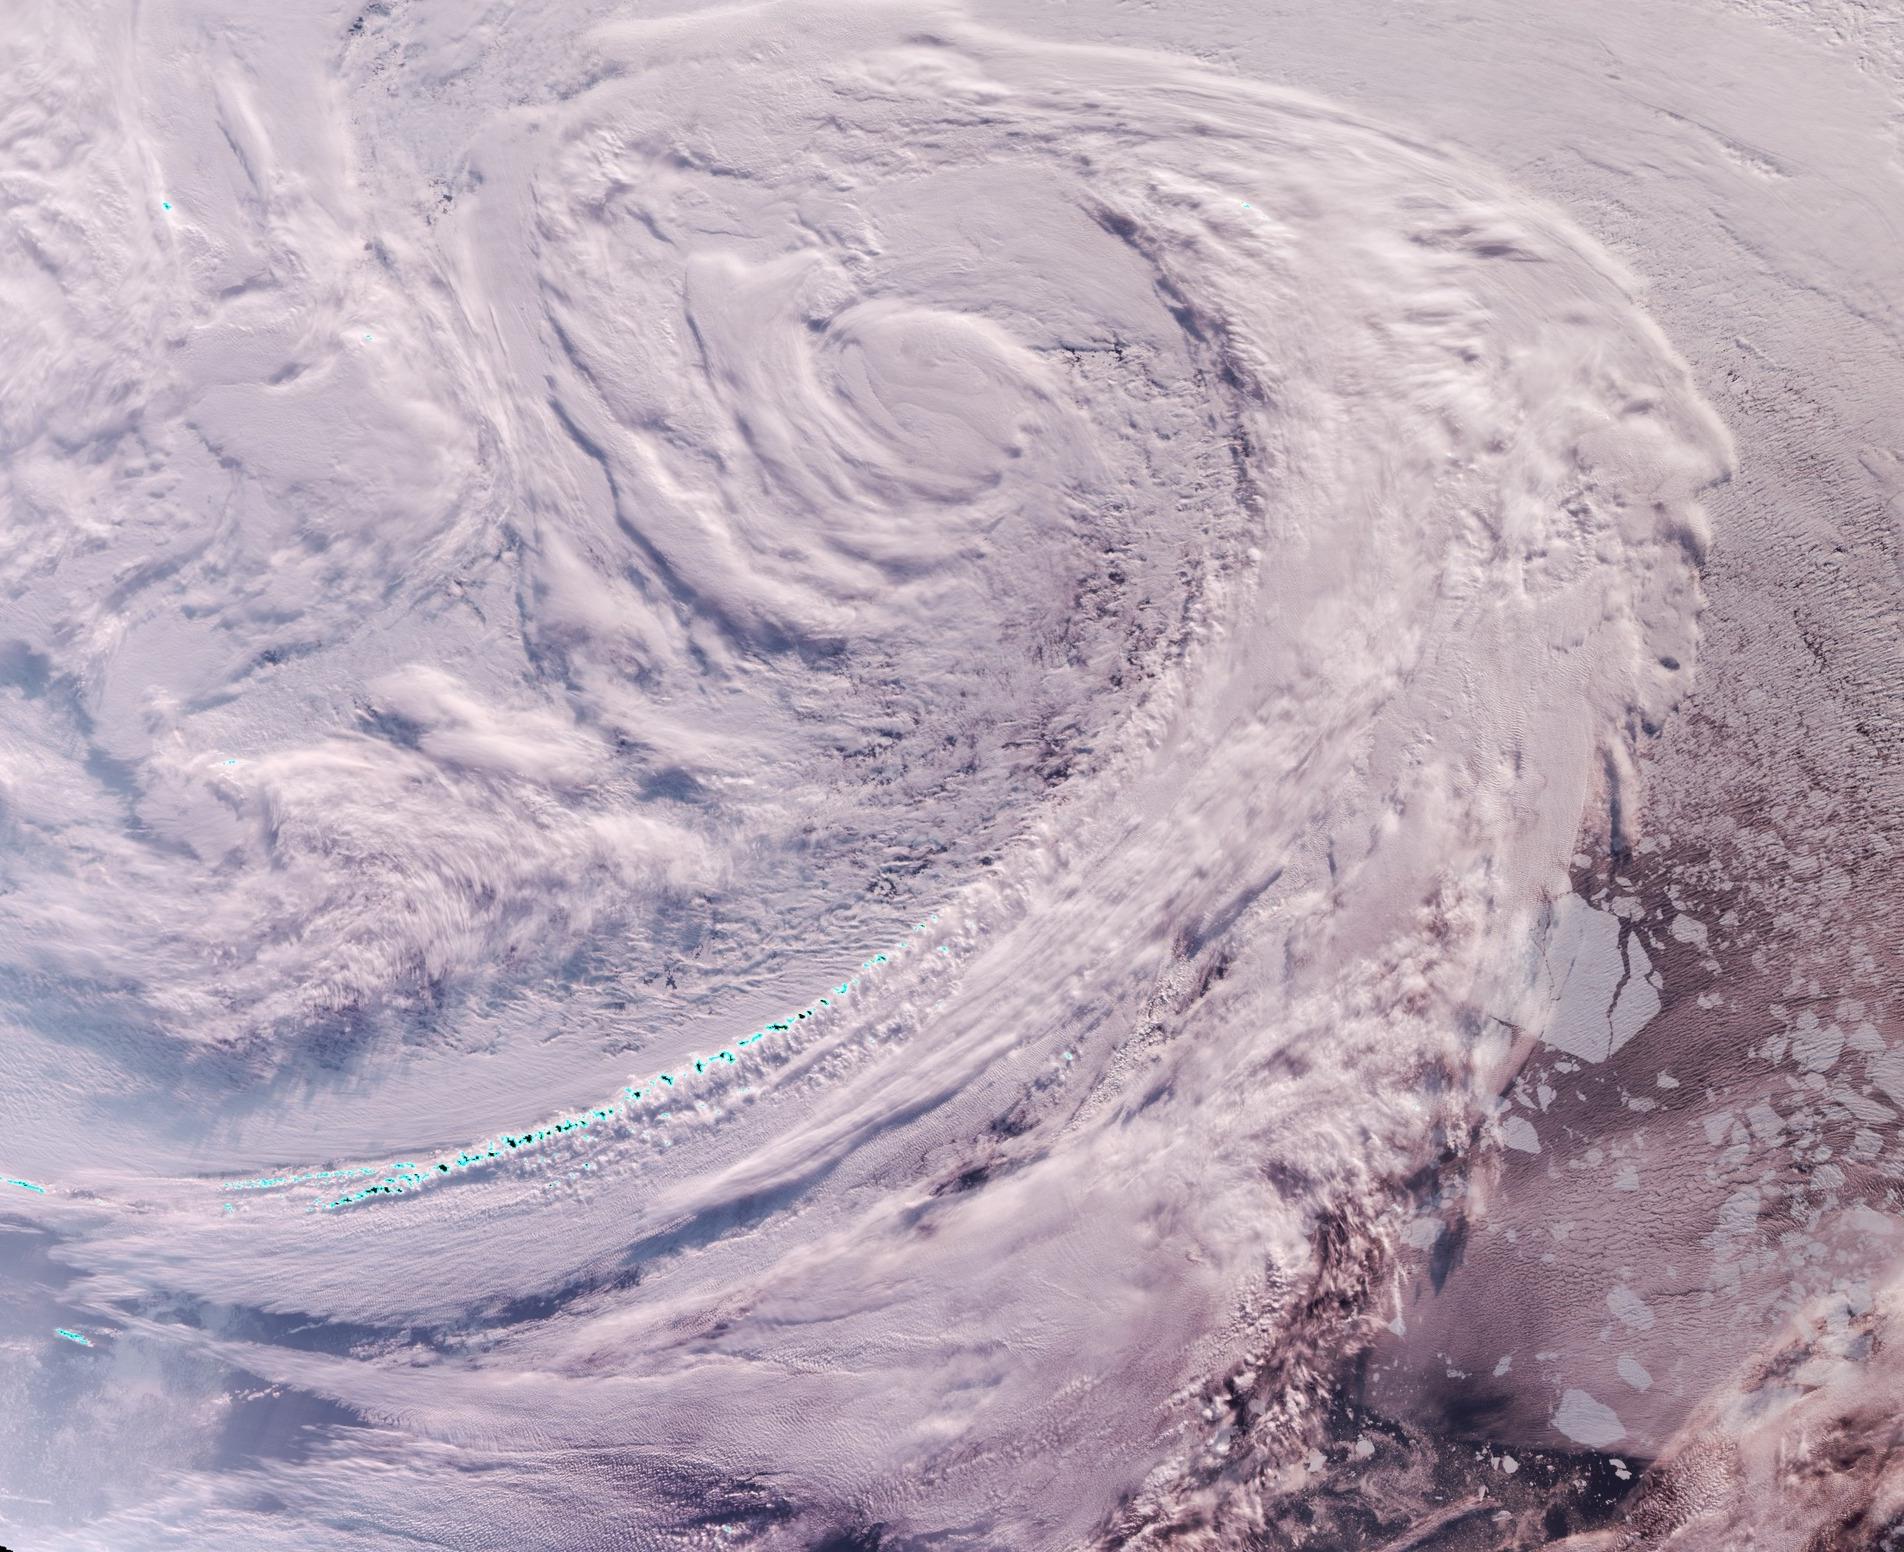
Here’s an early false colour snapshot of how (s)he looks from on high this afternoon (UTC), courtesy of the MODIS instrument on the Terra satellite:
[Edit – July 29th]
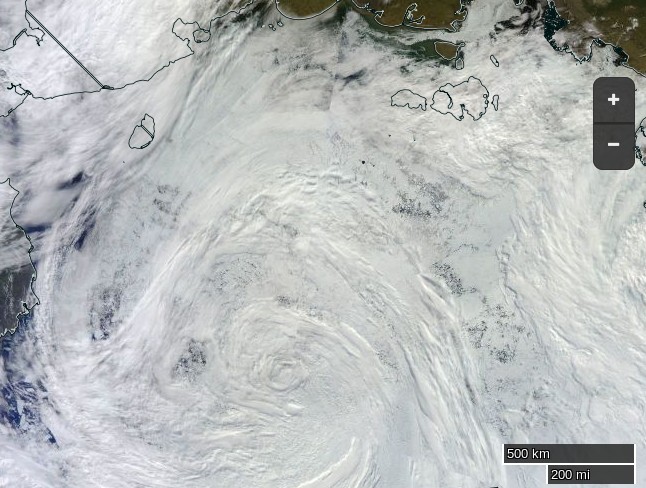
First up today we have a more complete “true colour” image of the cyclone doing its worst yesterday, including a fairly clear view in the bottom left corner of the initial damage to the sea ice covering the eastern Beaufort Sea. This one is from the Aqua satellite:
A reader writes to ask us to explain the answer to the above question in more detail. Are you sitting comfortably once again? Then let us begin.
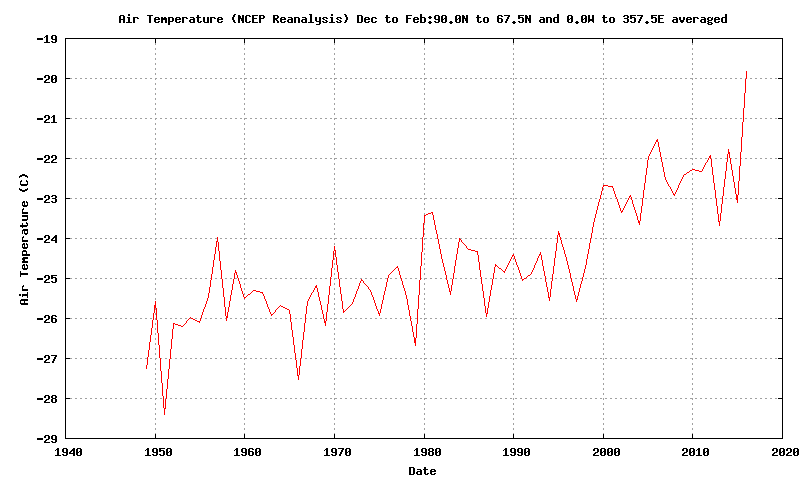
There has been a lot of unusual “weather” in the Arctic over the last twelve months. First of all there was an anomalously warm winter:
Then came what we dubbed the Great Arctic Anticyclone of 2016 in April. Take a look at what happened to the sea ice north of Alaska and Canada during the Spring and early Summer:
The ice was put through the mincer for the first time. Then during August there were a series of strong cyclones, collectively the Great Arctic Cyclone of 2016. The ice was put through the mincer once again, but in an anti-clockwise direction this time. Watch what happens in the Northwest Passage as summer turns to Autumn:
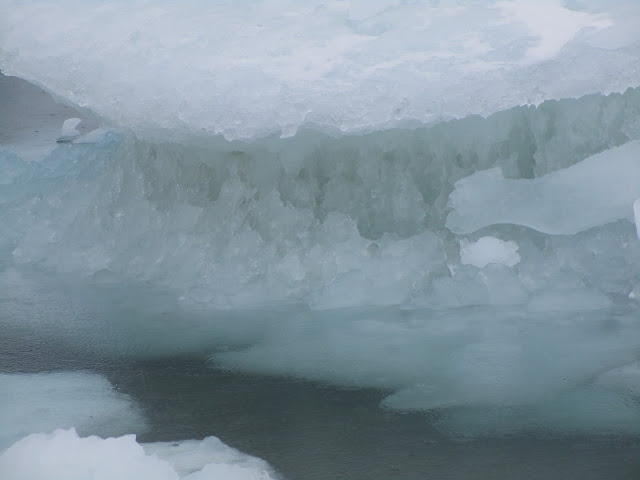
Some of the oldest, thickest ice in the Arctic has been chopped into small pieces which then easily flow through the channels of the Canadian Arctic Archipelago and into the Northwest Passage. Hence when the yacht Northabout (amongst others) was racing to reach Baffin Bay it wasn’t to avoid “the refreeze” as claimed in certain quarters. It was in fact to try and avoid the worst of the chopped up chunks of old sea ice being carried swiftly in their direction by winds and currents. Here’s what some of them looked like in close up:
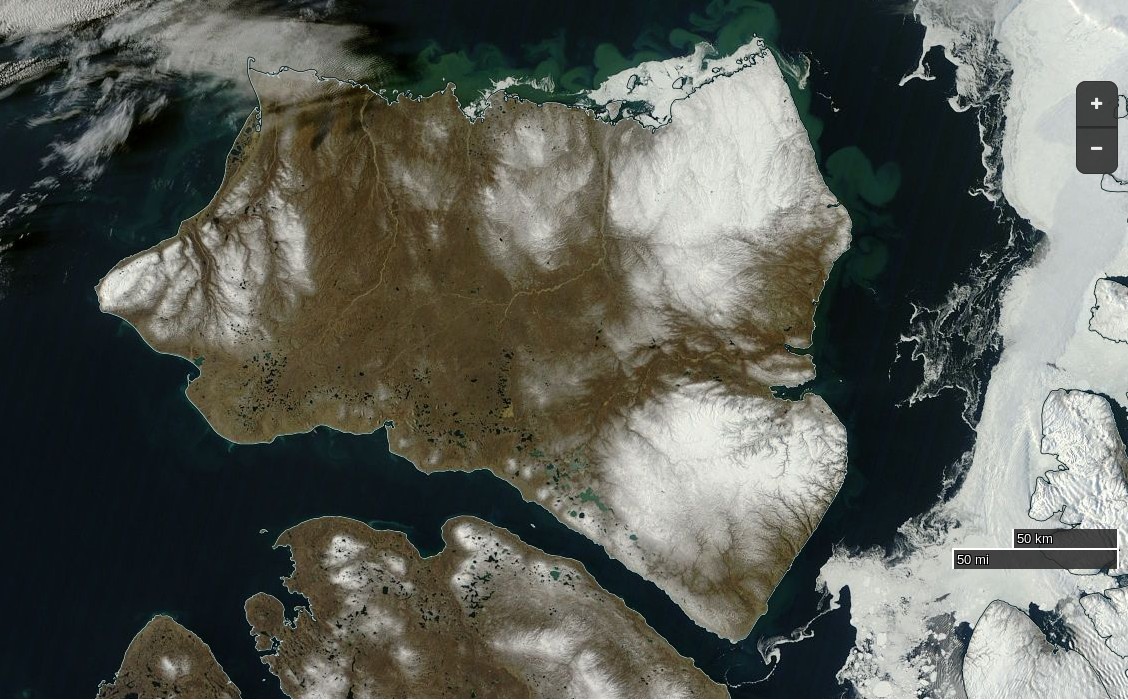
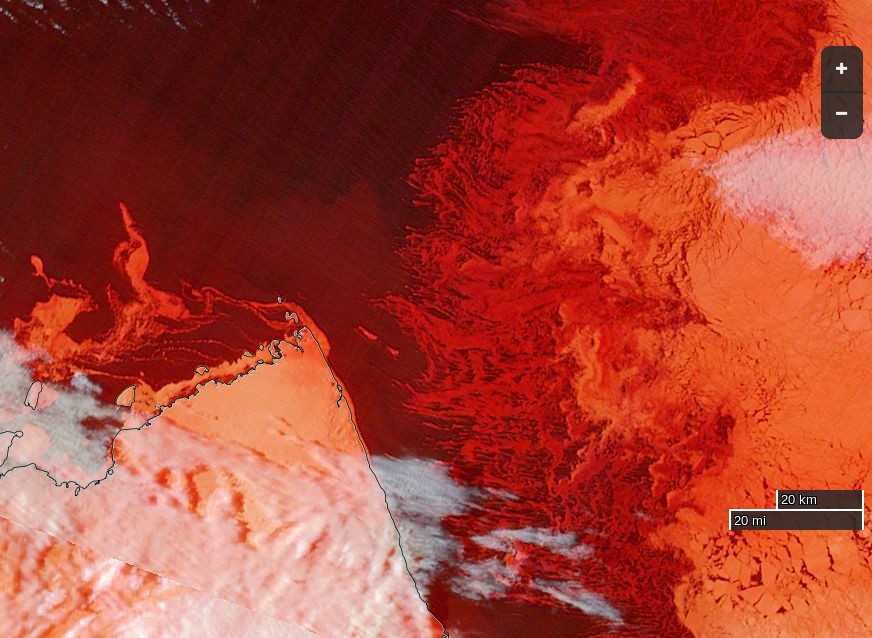
The next question then becomes, if the Northwest Passage wasn’t refreezing then, is it freezing now? The answer is not yet. In fact the favourite talking point of the cryodenialista, McClure Strait at the western end of the “main” route through the Passage has recently become navigable:
NASA Worldview “true-color” image of Banks Island on September 24th 2016, derived from the MODIS sensor on the Terra satellite
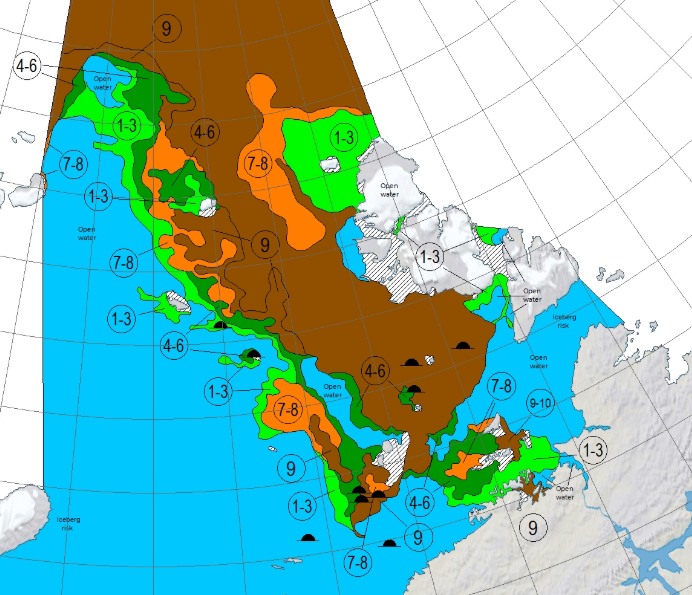
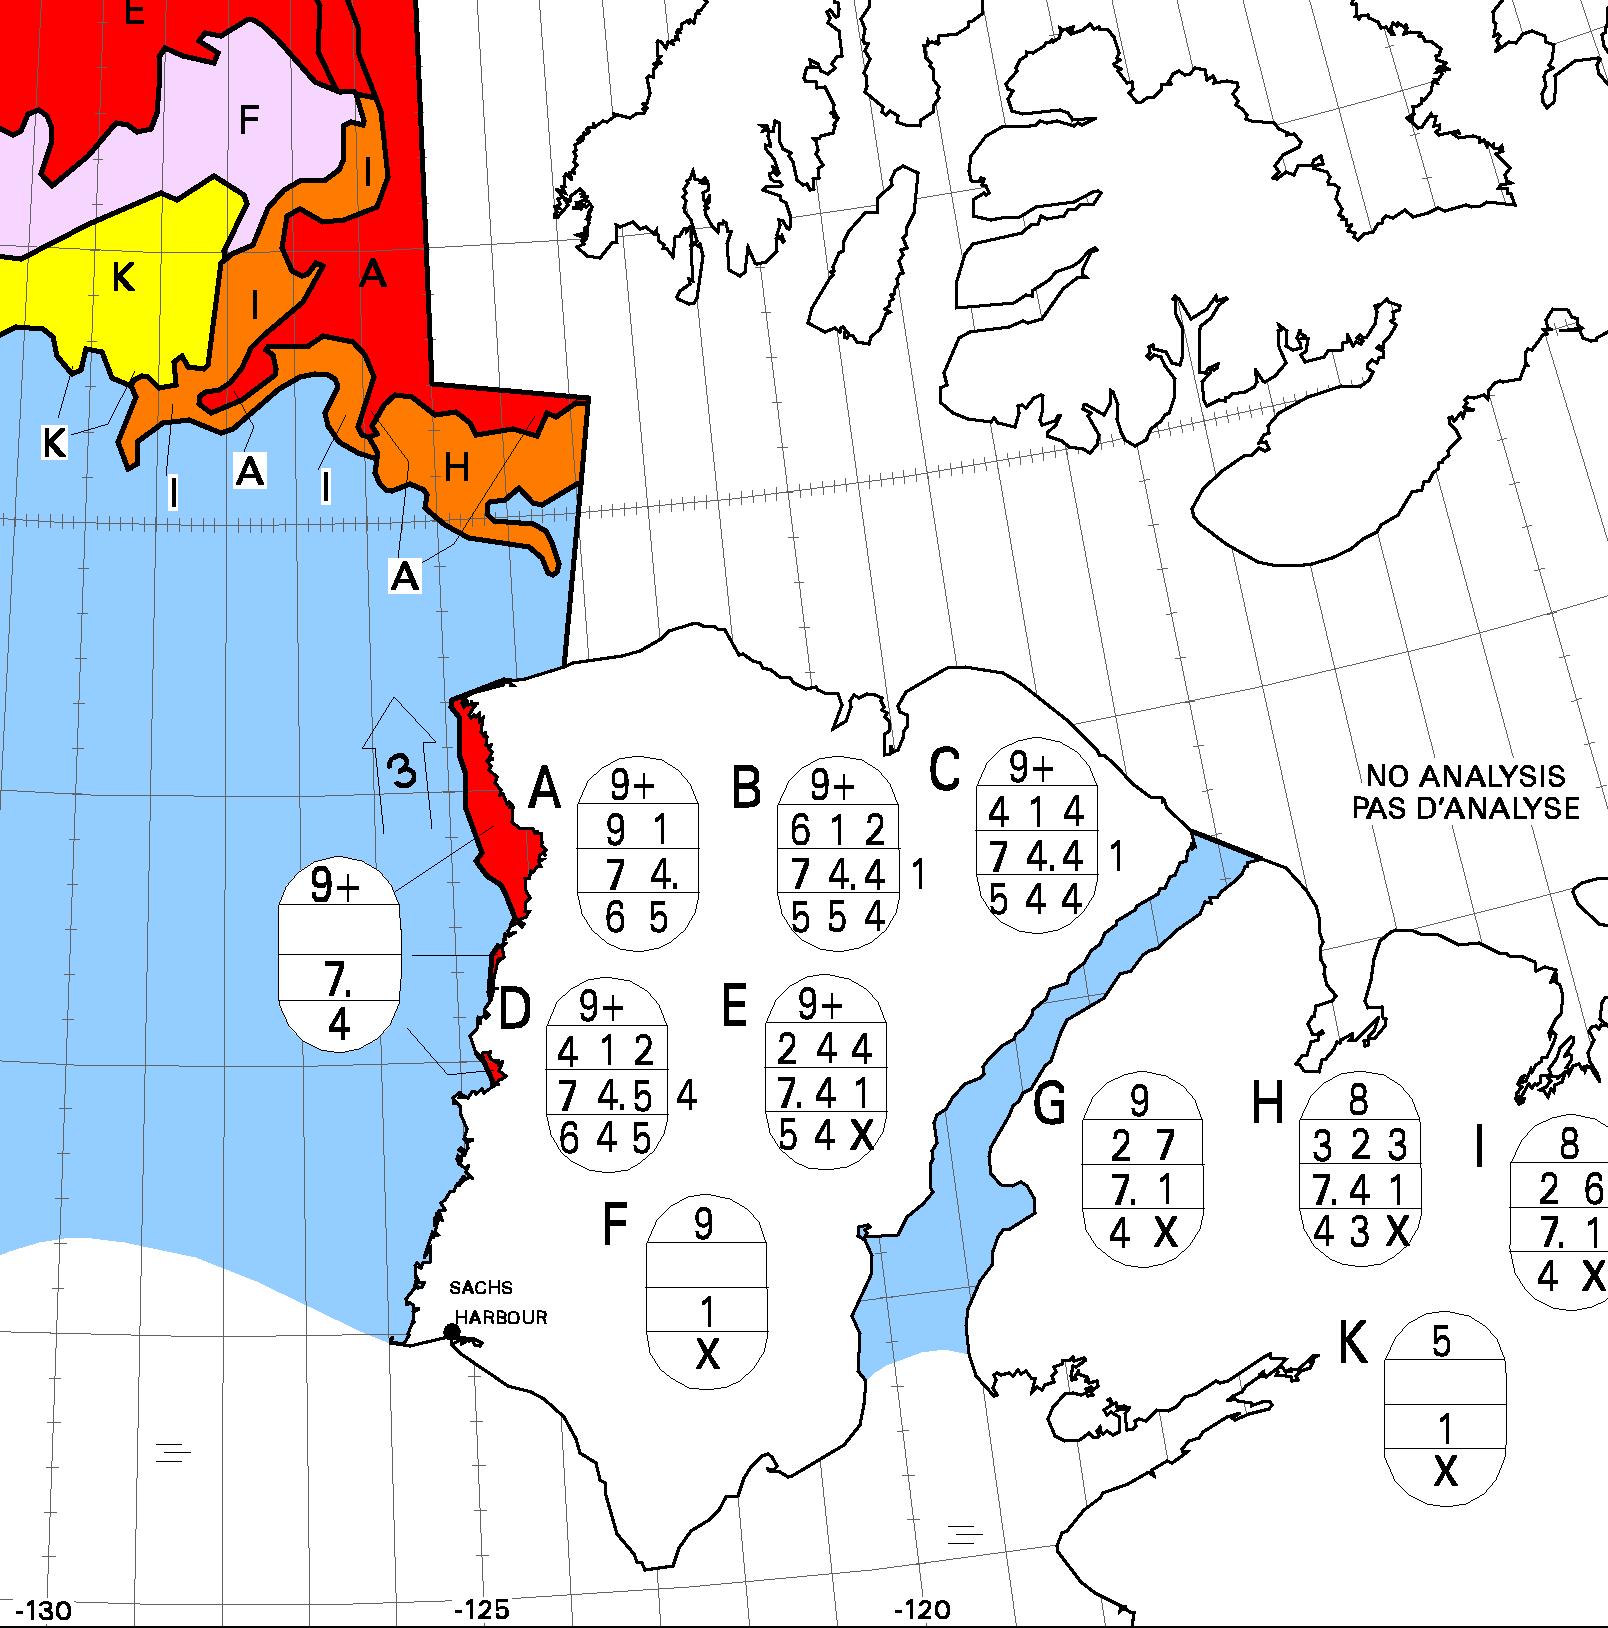
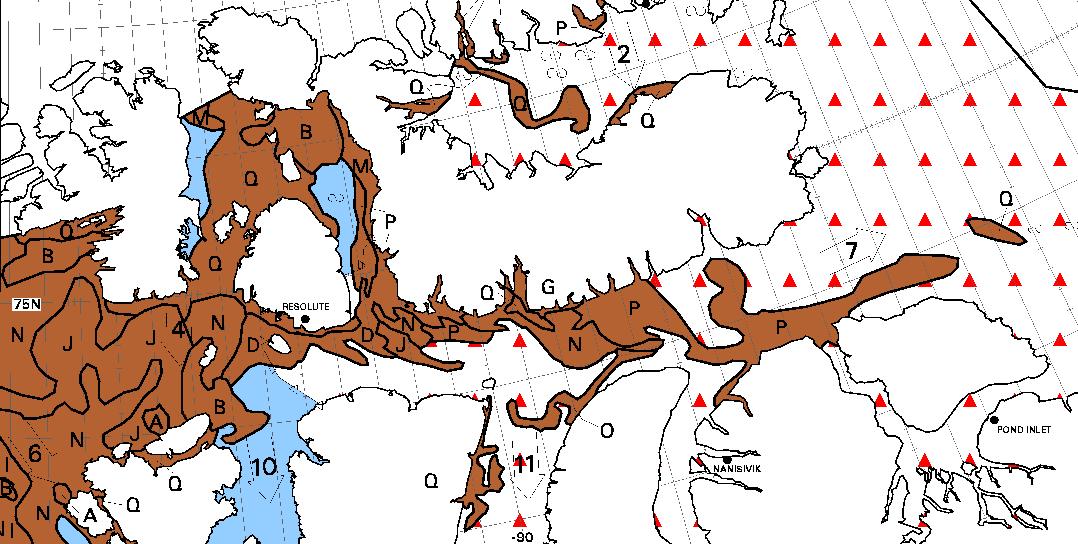
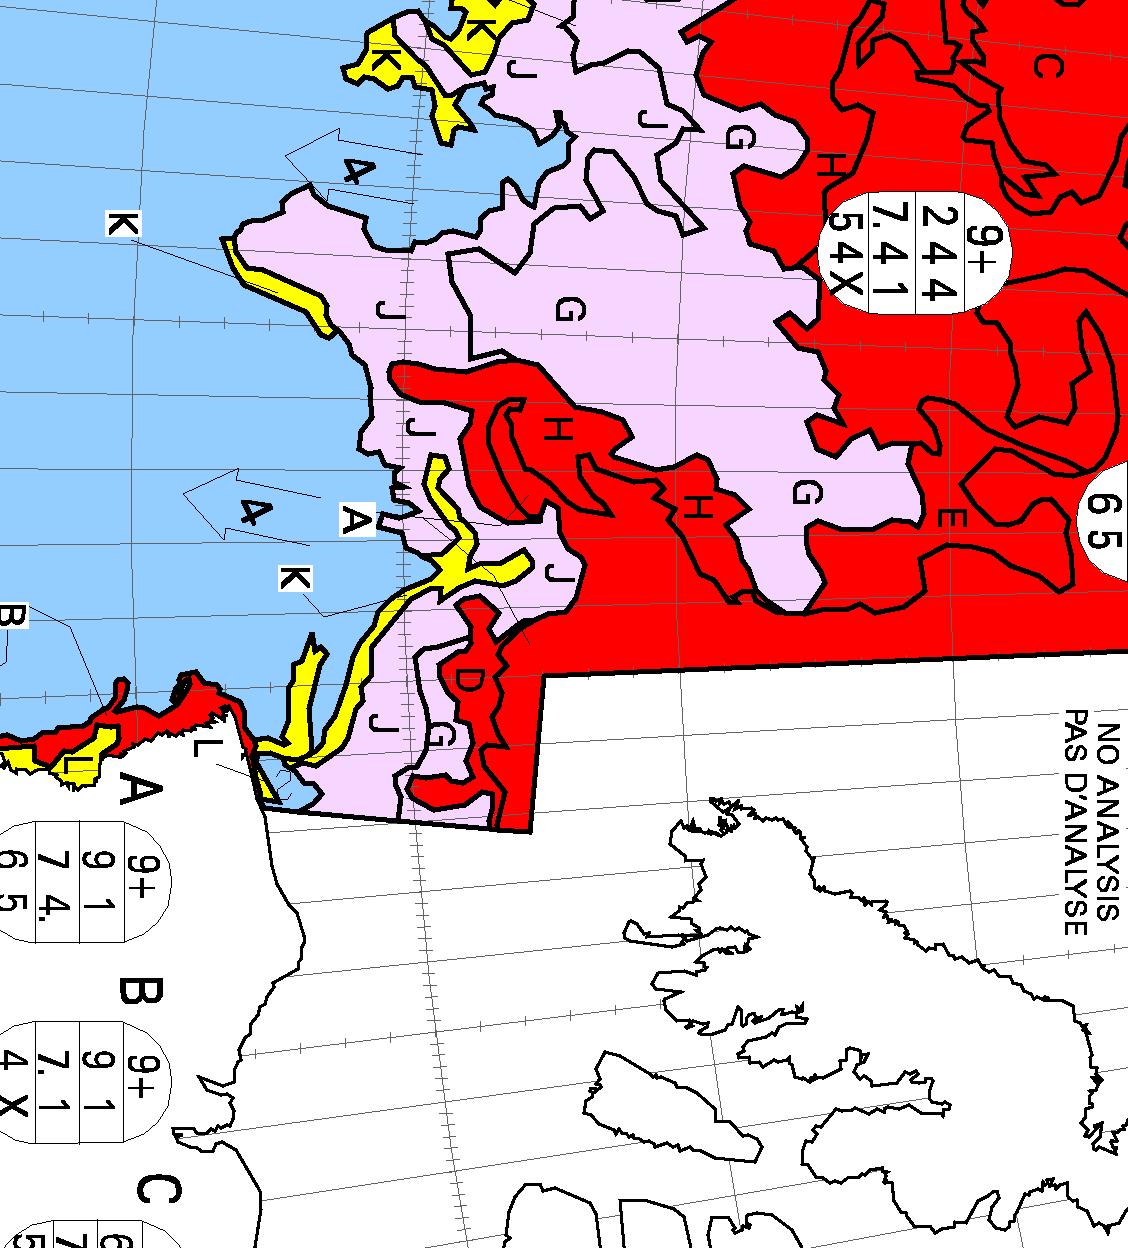
The “pretty pink” area towards the top left of the chart reveals “new ice”. The Northwest Passage will have started to refreeze when some of that shows up on a “stage of development” chart of the Passage itself, but that hasn’t happened yet. Here’s yesterday evening’s chart of the “Approaches to Resolute“:
Lots of old ice! It was raining in Resolute yesterday, and the old ice there was still melting:
[Edit – September 27th]
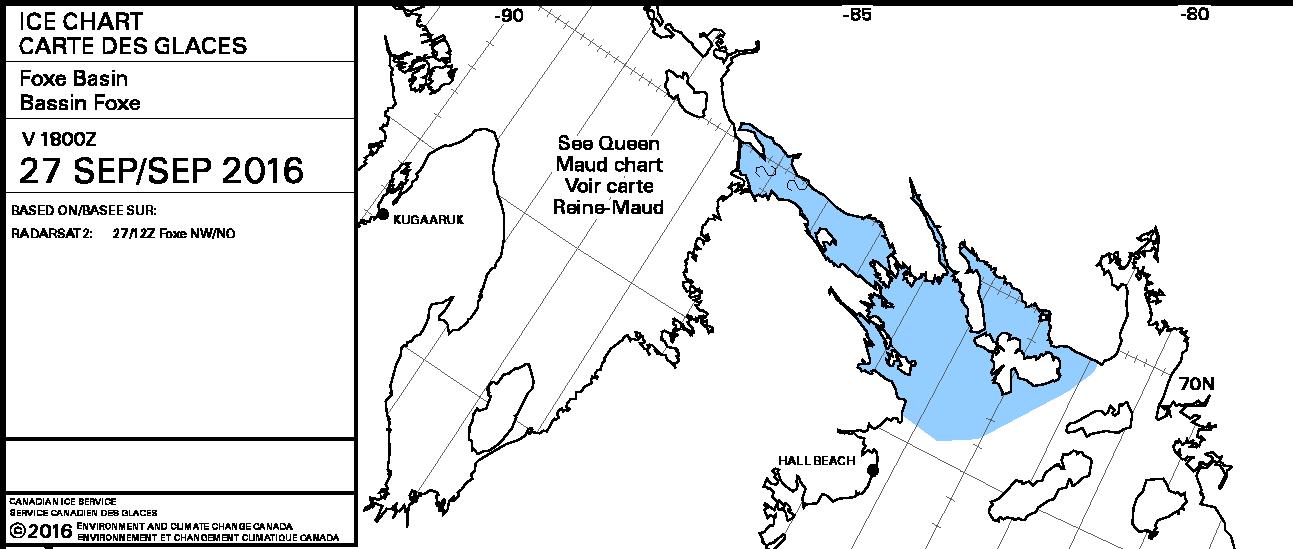
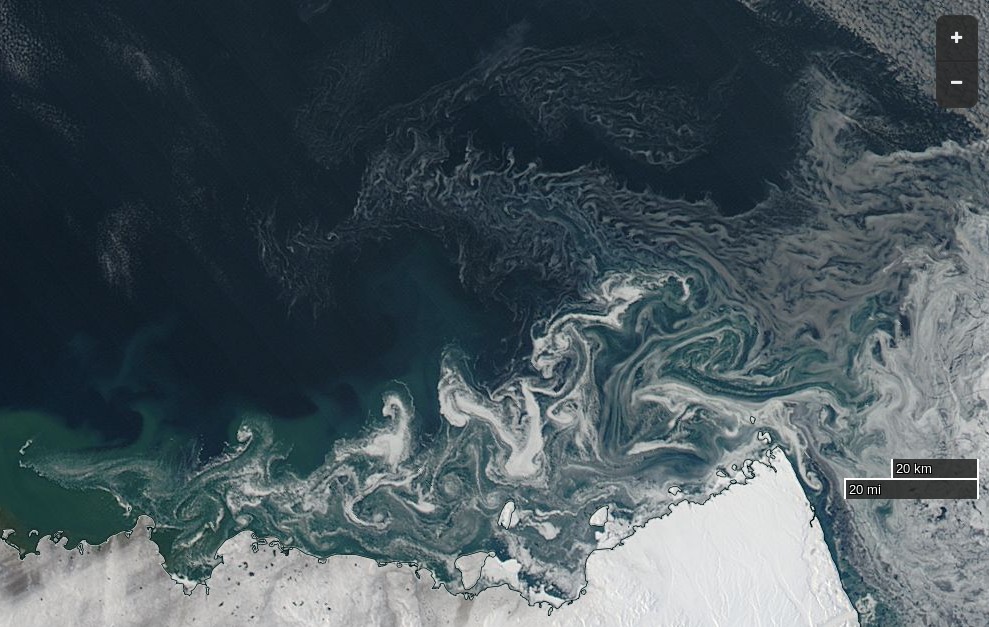
No sooner said than done! This evening’s ice charts from the CIS do now show some “pretty pink” new ice in the Northwest Passage:
The wispy areas of new ice are also visible on this “false-color” image of the Parry Channel:
NASA Worldview “false-color” image of the Parry Channel on September 27th 2016, derived from the MODIS sensor on the Terra satellite
However even if Northabout were still in Prince Regent Inlet she wouldn’t be “trapped in ice”. There is still a way back to Bristol via Fury and Hecla Strait:
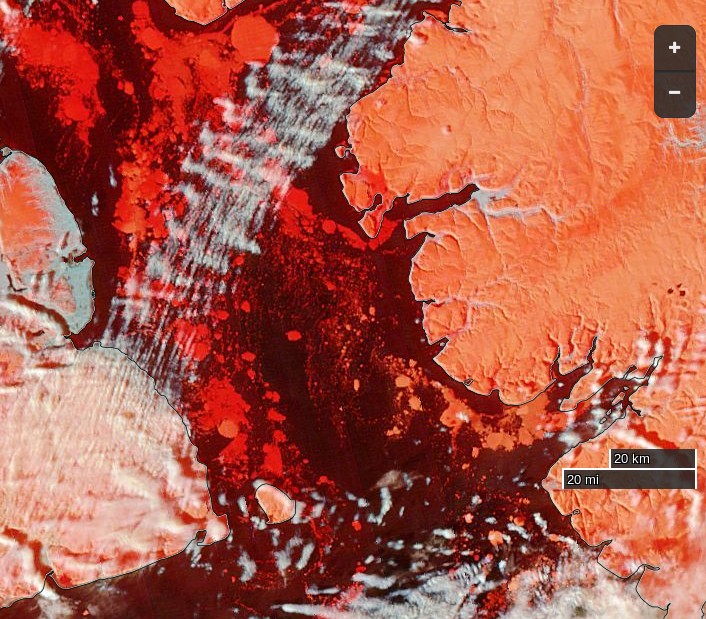
A clear view of McClure Strait from the Terra satellite in “false colour”:
NASA Worldview “false-color” image of the McClure Strait on September 30th 2016, derived from the MODIS sensor on the Terra satellite
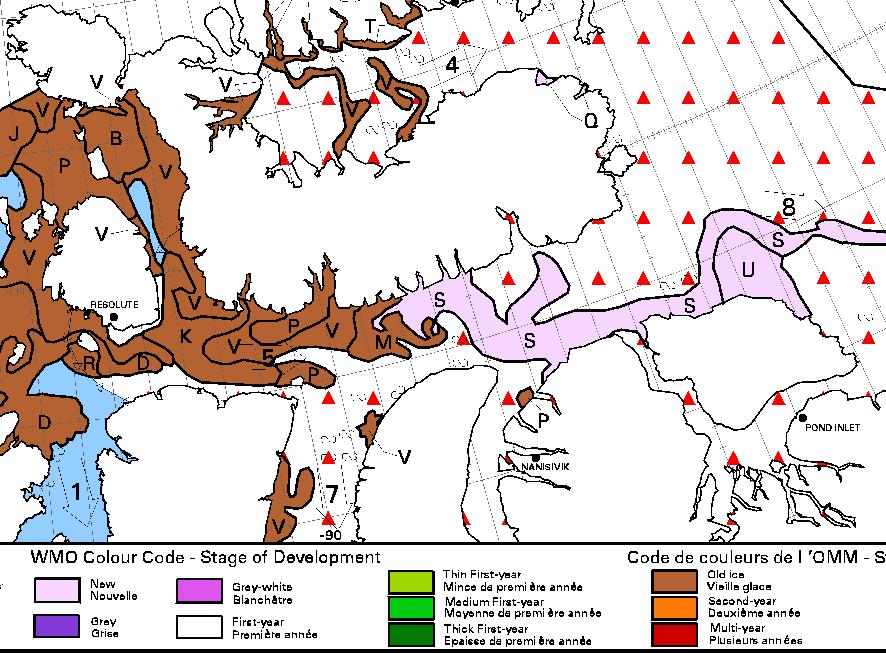
The inclusion of some infra red reveals the thicker old ice on the right noticeably paler than the new ice to its left. Compare also with the CIS ice chart, which has been rotated to match the orientation of the satellite image:
[Edit – October 2nd]
Pretty patterns in the new sea ice forming at the western entrance to McClure Strait:
NASA Worldview “true-color” image of the McClure Strait on October 1st 2016, derived from the MODIS sensor on the Aqua satellite
The freshly frozen new ice in the Northwest Passage has been spotted by the AMSR2 instrument aboard the Japanese “Shizuku” satellite:
On the latest CIS “stage of development” chart the brown “old ice” has turned to deep red “multi-year ice”, and there’s lots more pretty pink out in the Beaufort Sea:
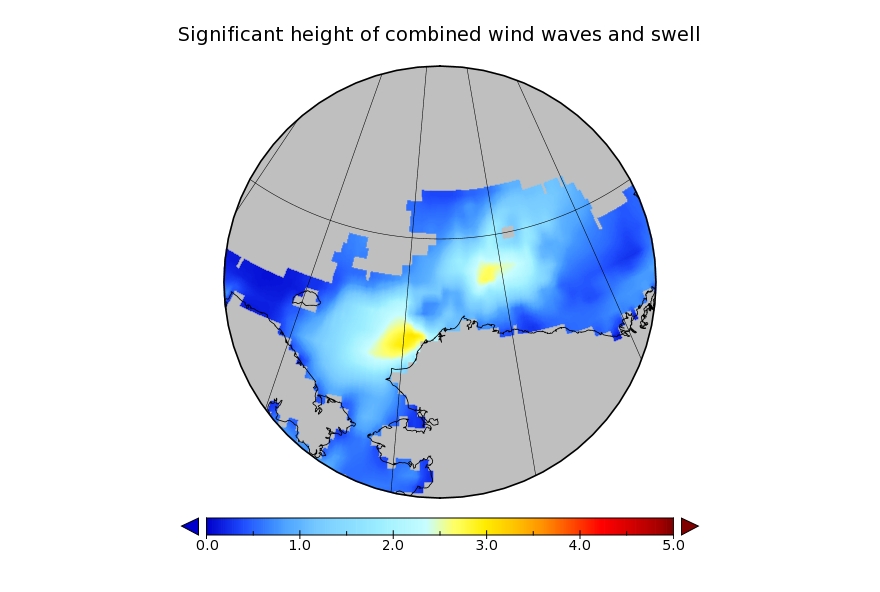
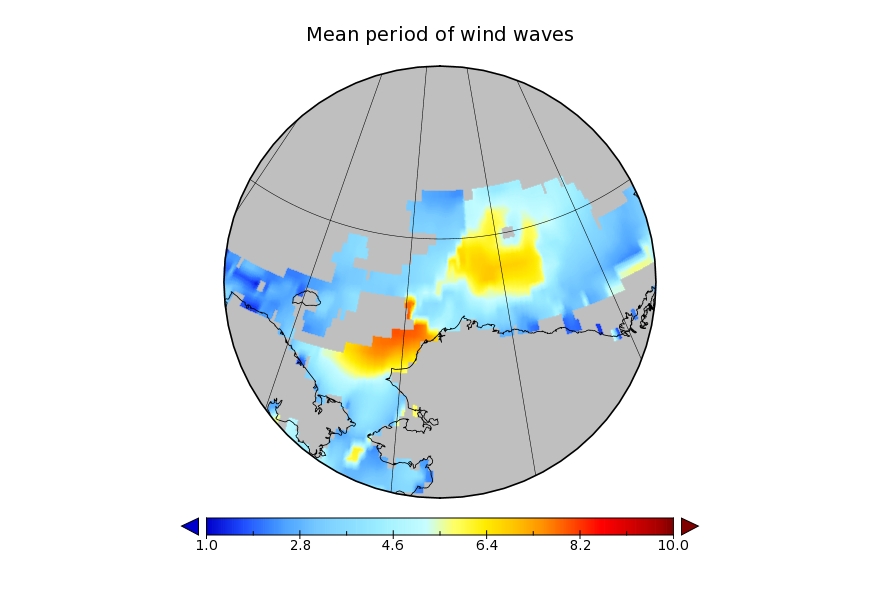
It looks like a storm is brewing in the Arctic. The long range weather forecasts for the Arctic have been remarkably unreliable recently, but this one is for a mere three days from now. WaveWatch III suggests there will be some significant waves in the Chukchi and Beaufort Seas this coming weekend, travelling in the direction of the ice edge:
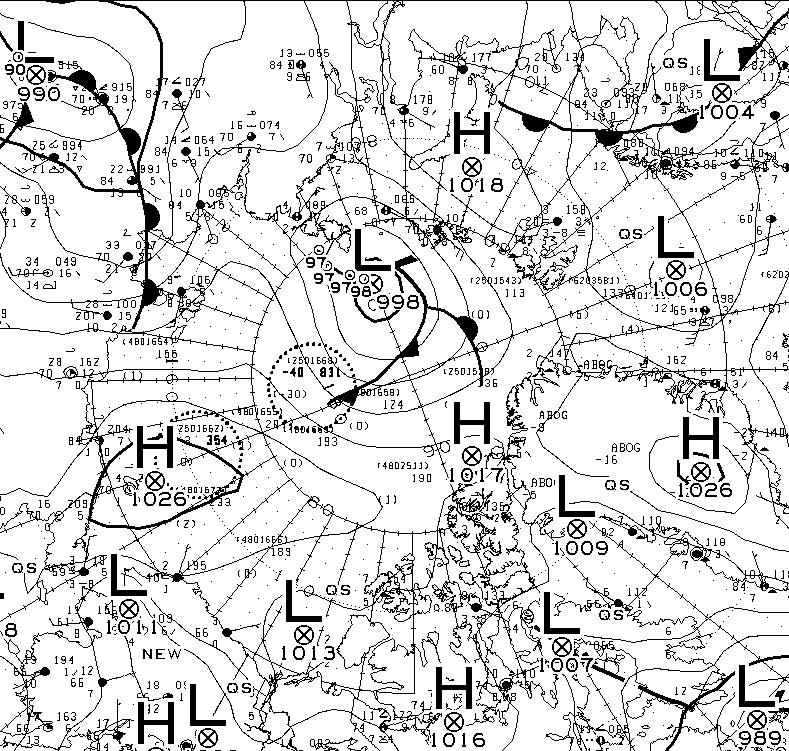
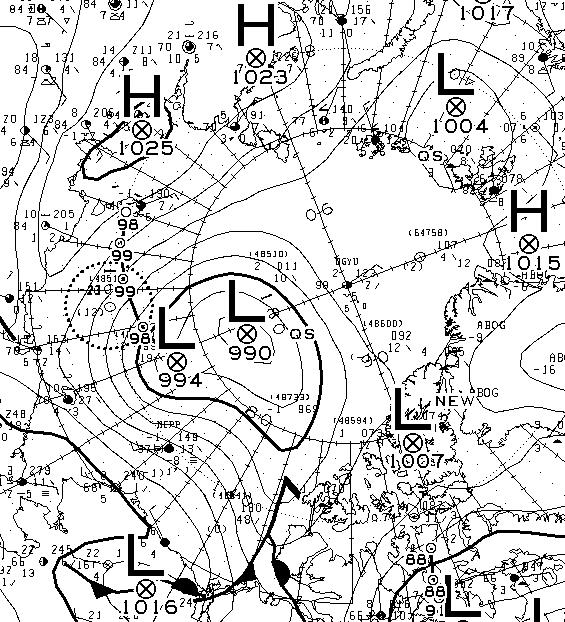
Another day has dawned, and the Environment Canada synoptic chart shows that the low pressure system currently over the Arctic has reached a central pressure of 990 hPa:
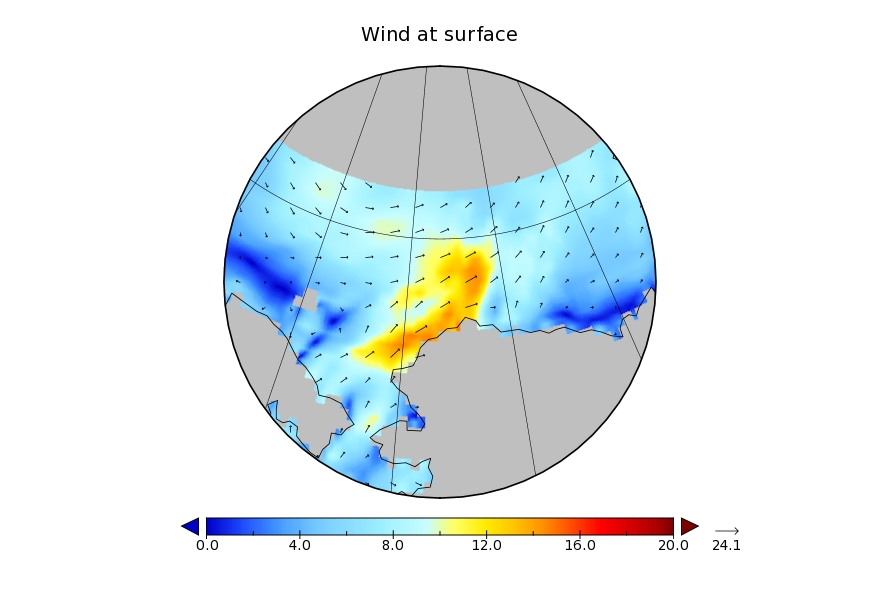
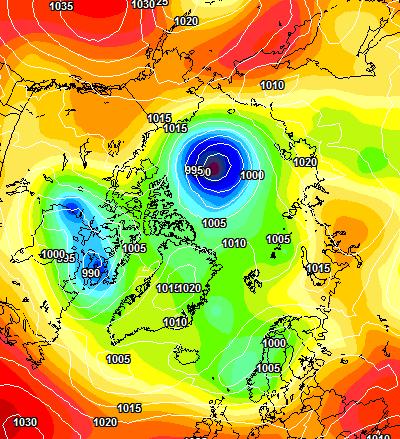
The latest ECMWF SLP forecast for tomorrow is firming up:
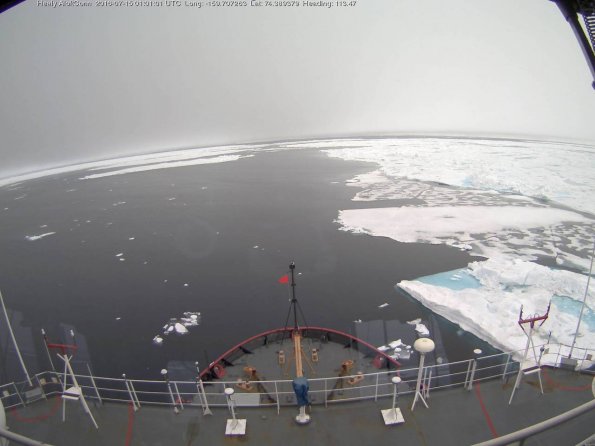
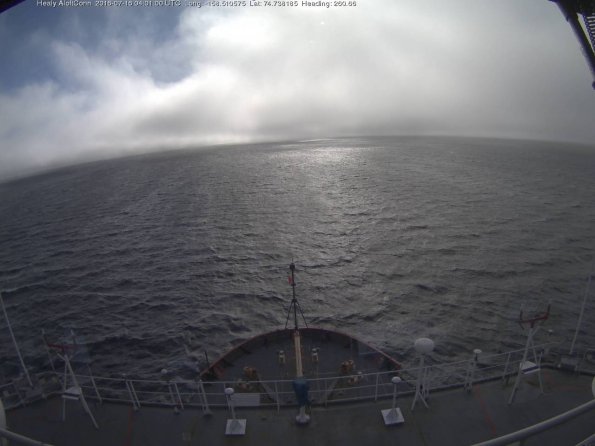
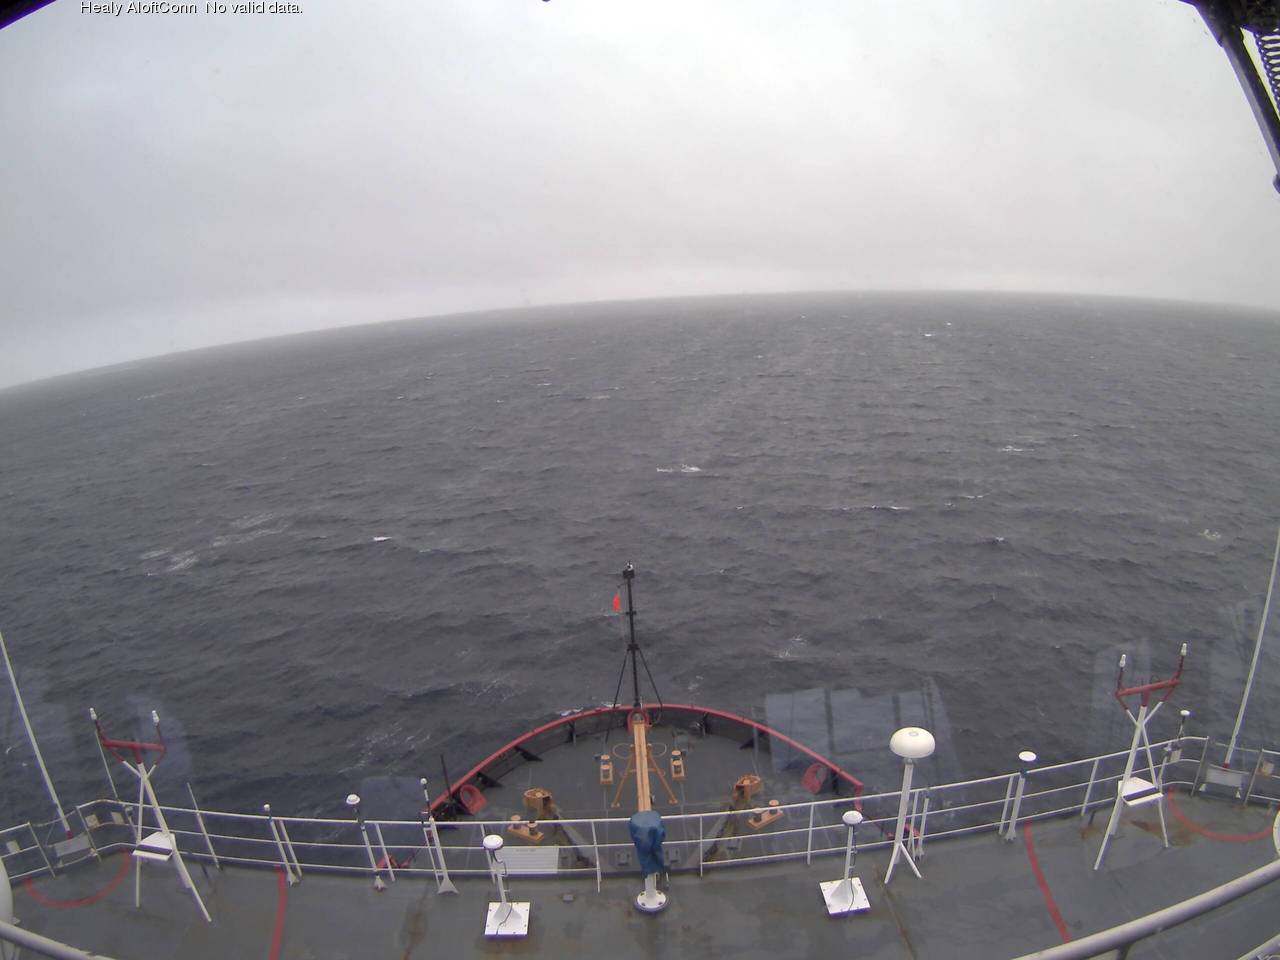
A modest swell is now visible from USCGC Healy’s “AloftCon” webcam:
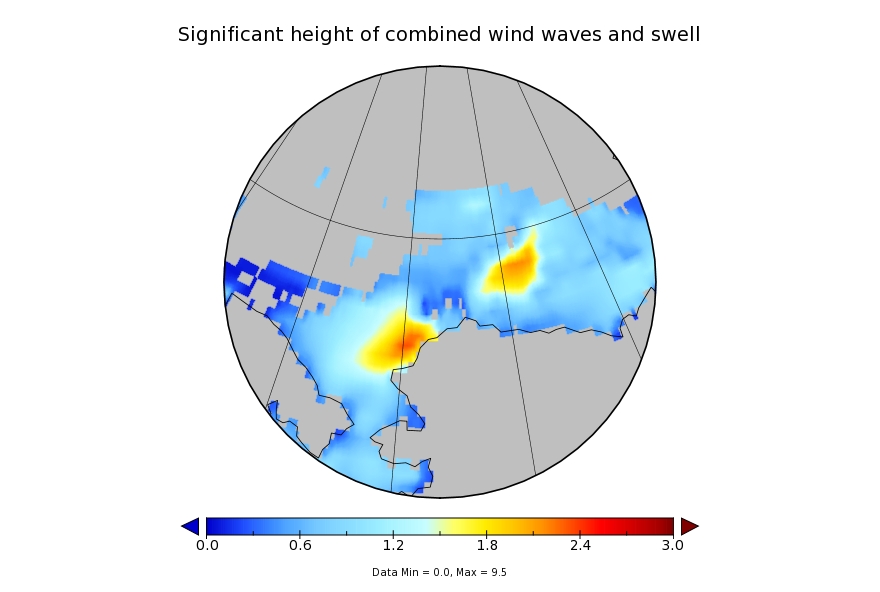
whilst the WaveWatch III forecast for tomorrow has dropped off to a significant wave height of around 2 metres with an average period of 7 seconds:
Meanwhile an image from the VIIRS instrument on the Suomi NPP satellite reveals the current storm in all its glory, together with confirmation that the “Big Block” multi-year ice floe north of Barrow has split asunder overnight:
[Edit July 17th 2016]
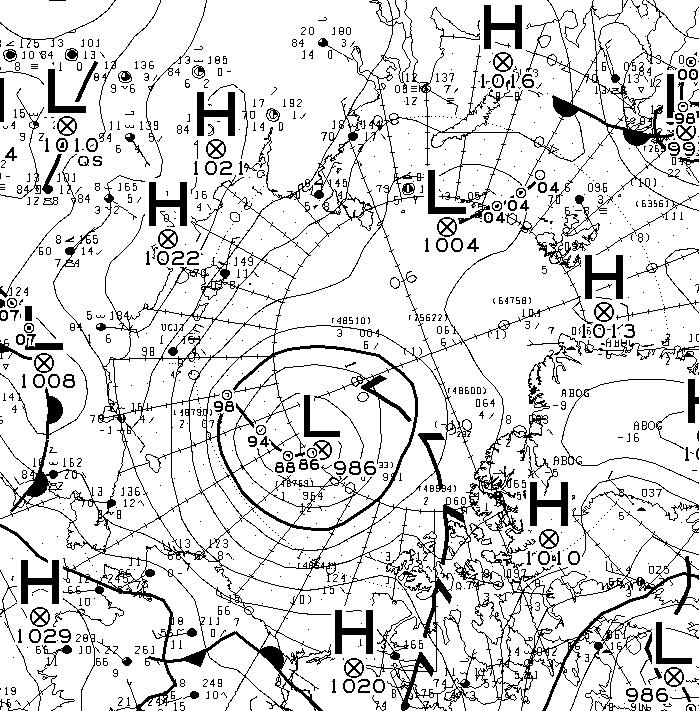
Sunday morning has now arrived. The storm in the Arctic looks to have bottomed out at 986 hPa central pressure. Here’s the Environment Canada synoptic chart for 00:00 this morning:
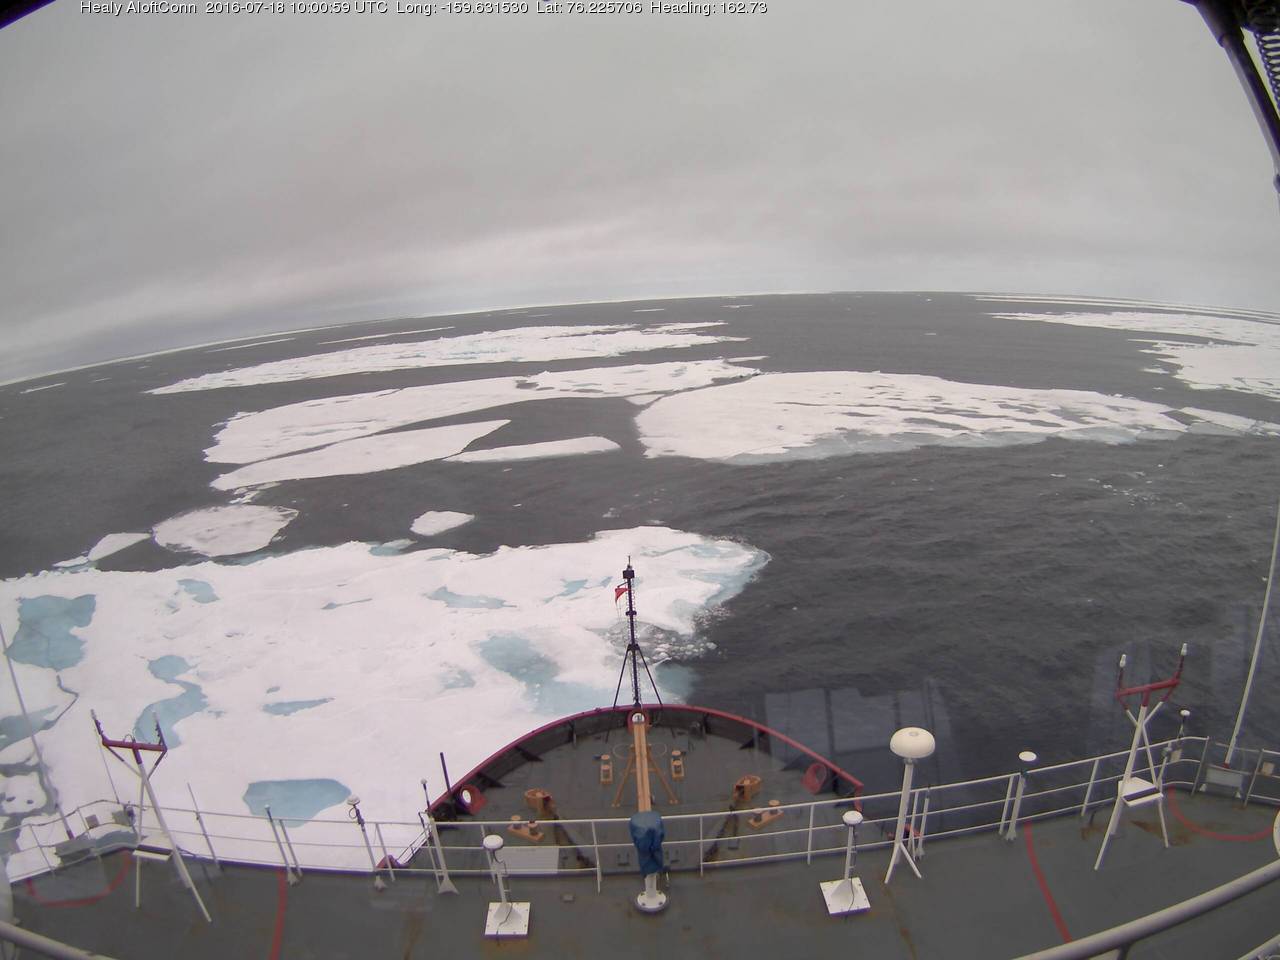
This is how the resultant swell looked from USCGC Healy at 06:00:
[Edit July 18th 2016]
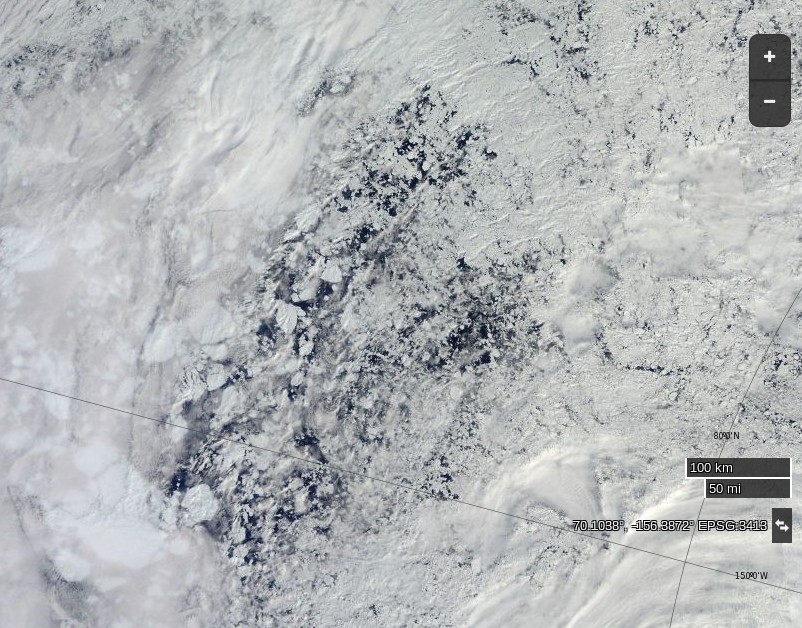
Here’s what the Beaufort and Chukchi Sea north of Barrow look like this morning through the clouds:
NASA Worldview “true-color” image of the Beaufort Sea on July 18th 2016, derived from the MODIS sensor on the Terra satellite
The remains of the now not so “Big Block” can just be made out in the bottom left. For a cloud free image here’s the latest AMSR2 passive microwave imagery of the area from the University of Hamburg:
The USCGC Healy and the remnants of the swell are in amongst the ice:
[Edit July 20th 2016]
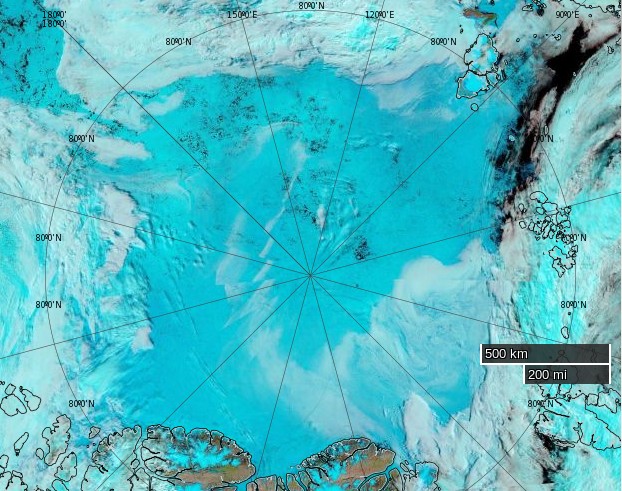
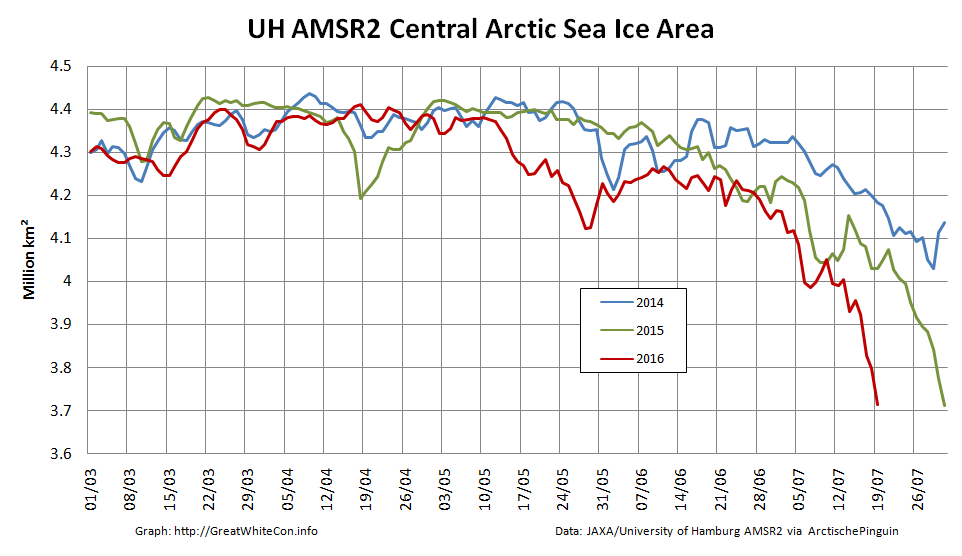
As the remnants of the storm head off across the Canadian Arctic Archipelago here is what it has left in its wake in the Central Arctic Basin:
NASA Worldview “false-color” image of the Central Arctic Basin on July 19th 2016, derived from the MODIS sensor on the Aqua satellite
University of Hamburg AMSR2 concentration visualisation of the Central Arctic on July 19th 2016
[Edit July 21st 2016]
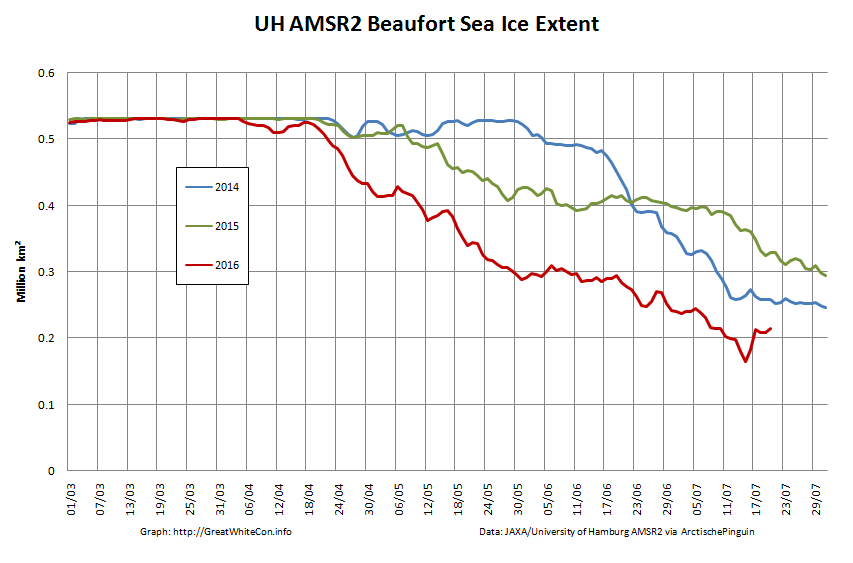
The storm has dispersed the remaining ice in the Beaufort Sea over the last few days:
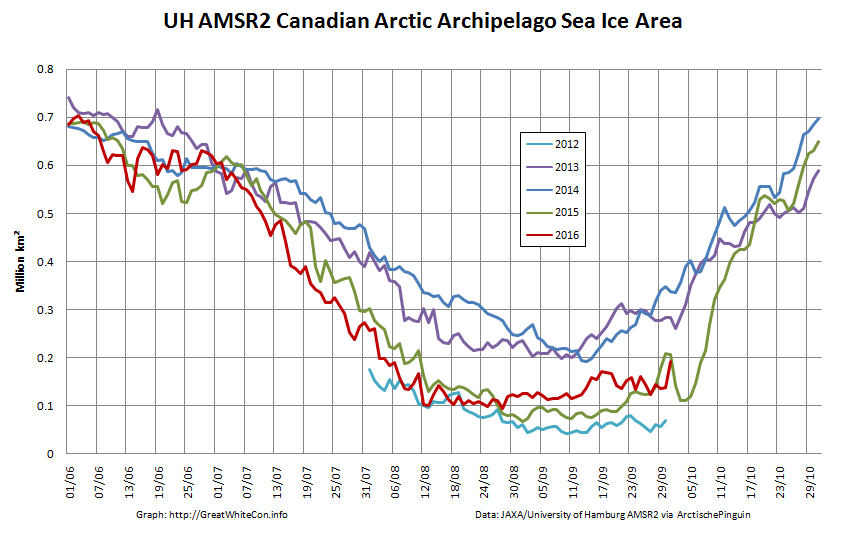
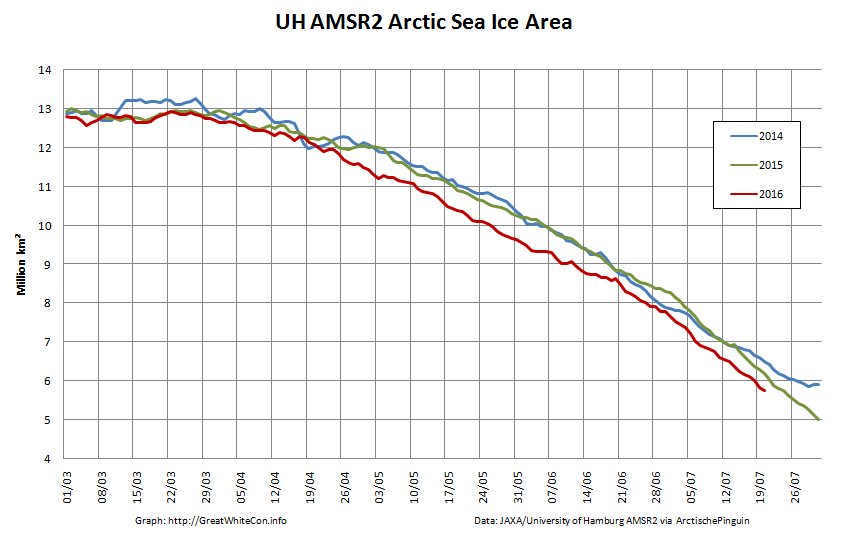
However across the Arctic as a whole sea ice area continues its downward trend:
This website uses cookies to improve your experience. We'll assume you're ok with this, but you can opt-out if you wish. Cookie settingsACCEPT
Privacy & Cookies Policy
Privacy Overview
This website uses cookies to improve your experience while you navigate through the website. Out of these, the cookies that are categorized as necessary are stored on your browser as they are essential for the working of basic functionalities of the website. We also use third-party cookies that help us analyze and understand how you use this website. These cookies will be stored in your browser only with your consent. You also have the option to opt-out of these cookies. But opting out of some of these cookies may affect your browsing experience.
Necessary cookies are absolutely essential for the website to function properly. This category only includes cookies that ensures basic functionalities and security features of the website. These cookies do not store any personal information.
Any cookies that may not be particularly necessary for the website to function and is used specifically to collect user personal data via analytics, ads, other embedded contents are termed as non-necessary cookies. It is mandatory to procure user consent prior to running these cookies on your website.