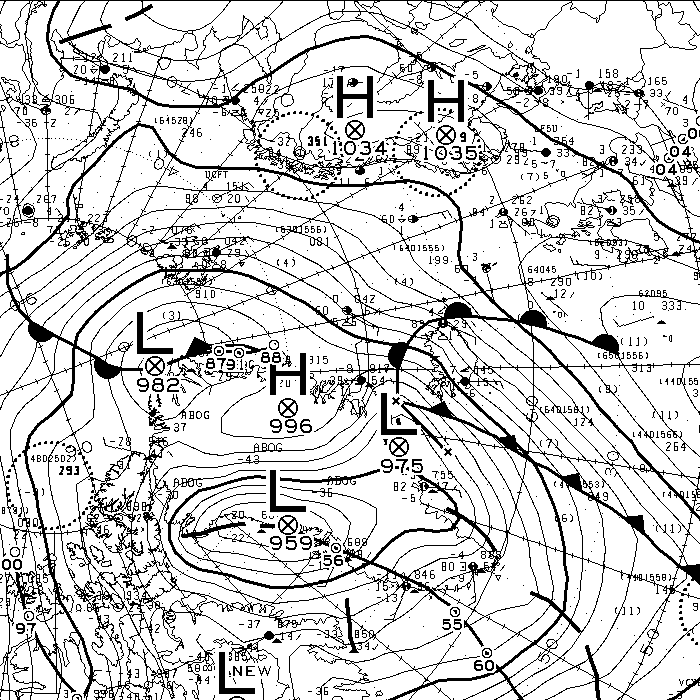
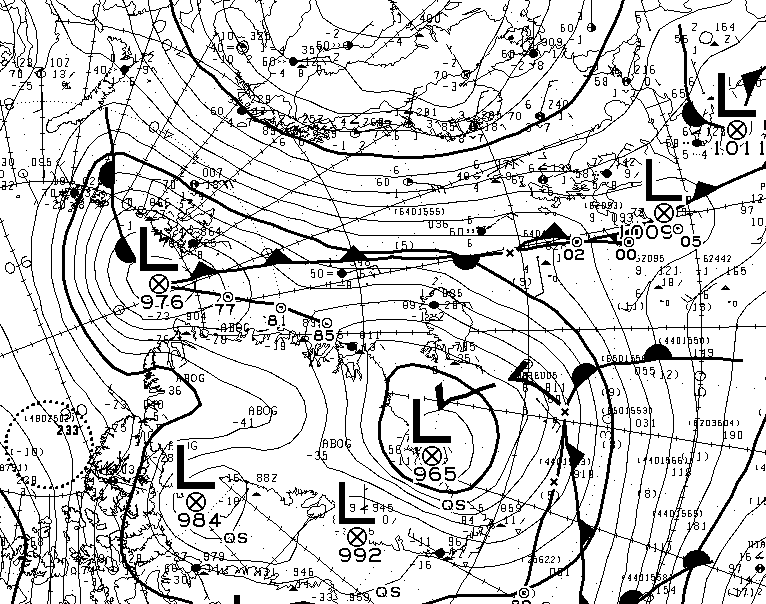
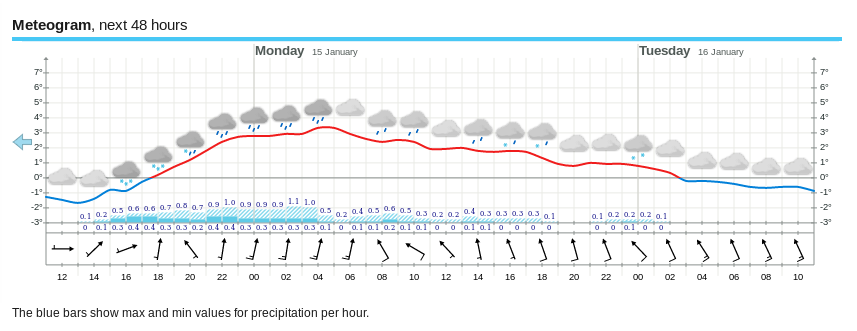
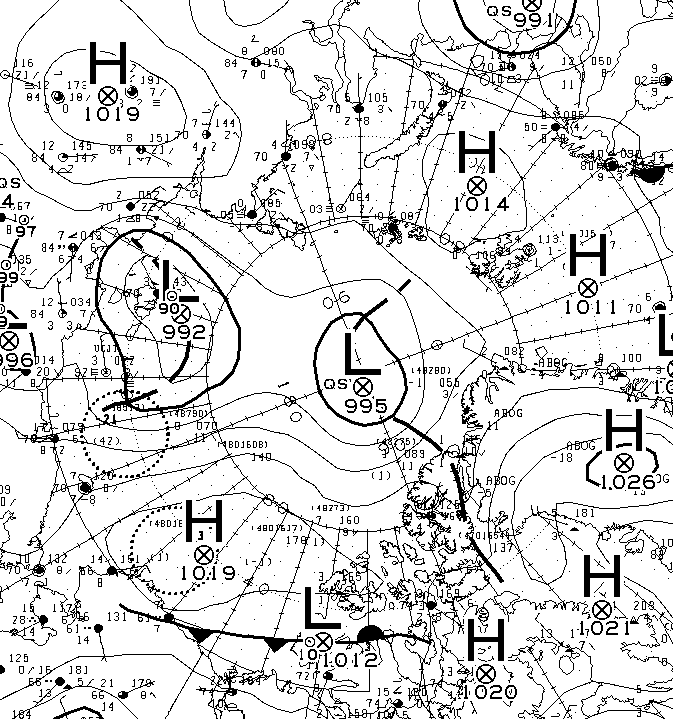
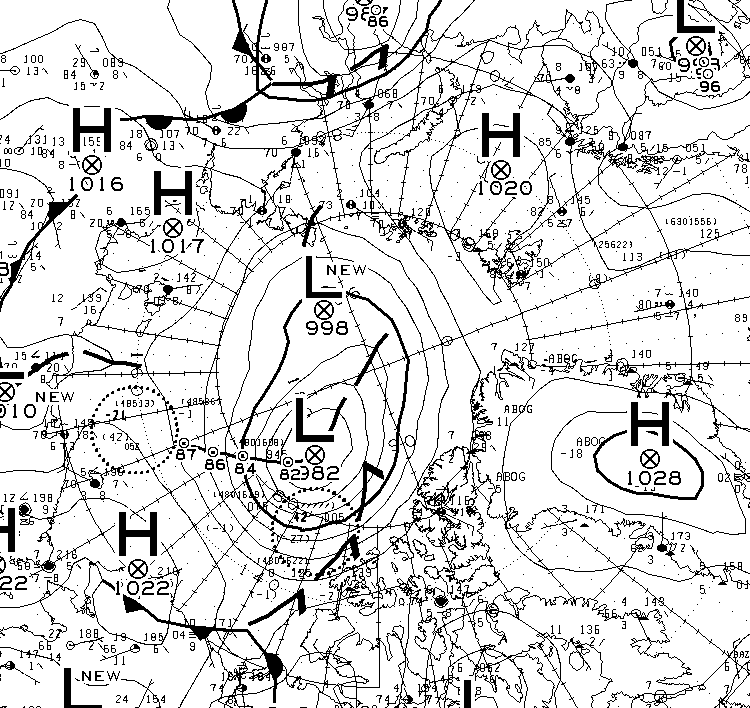
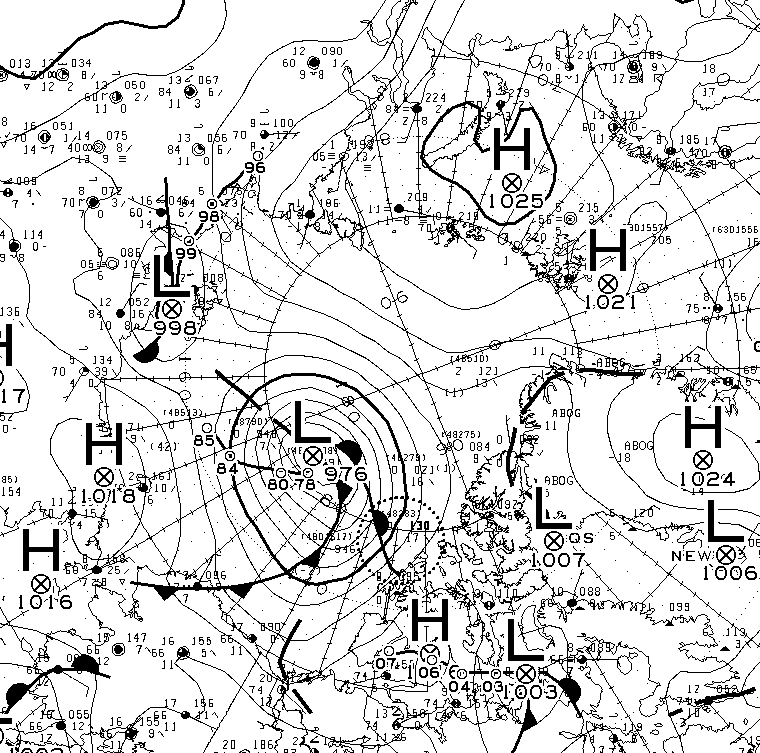
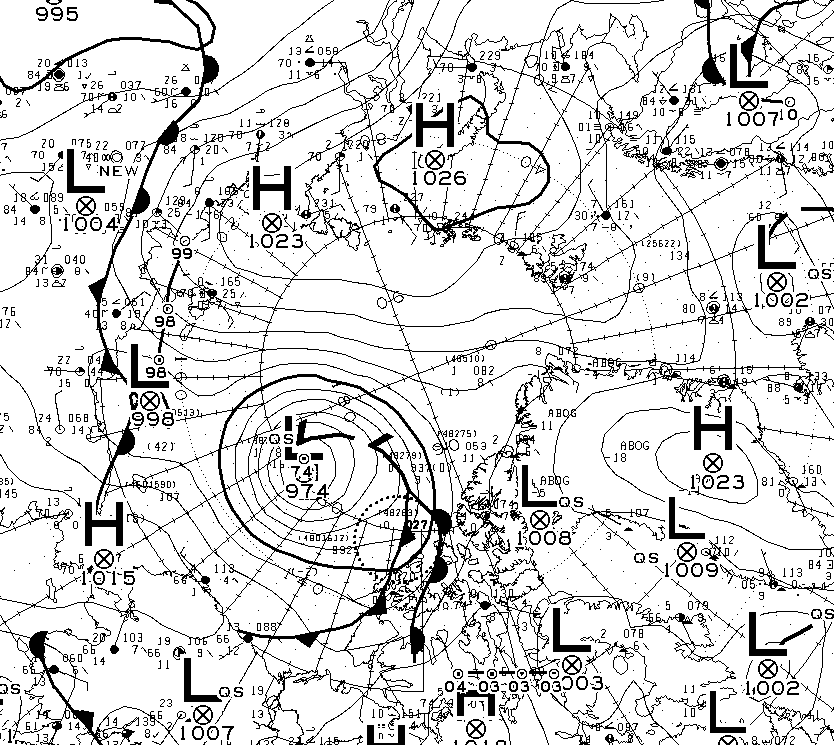
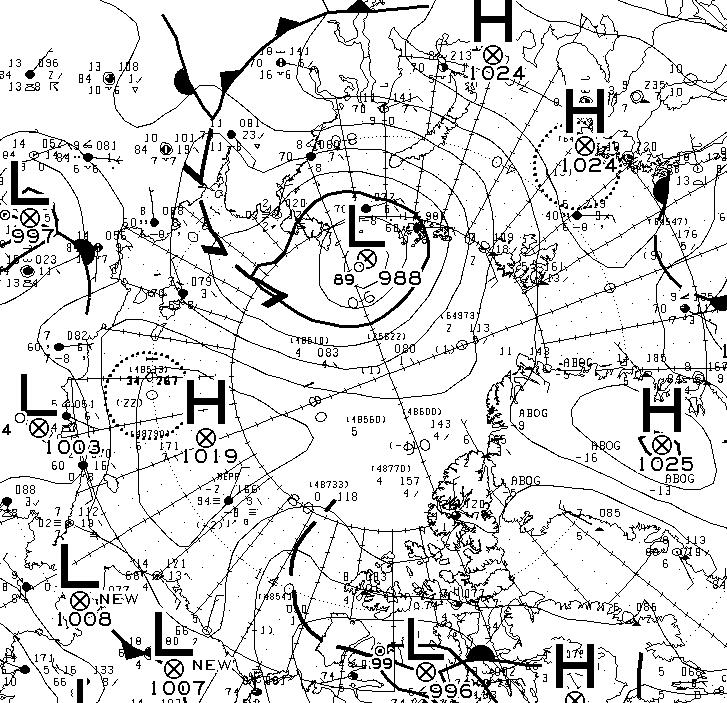
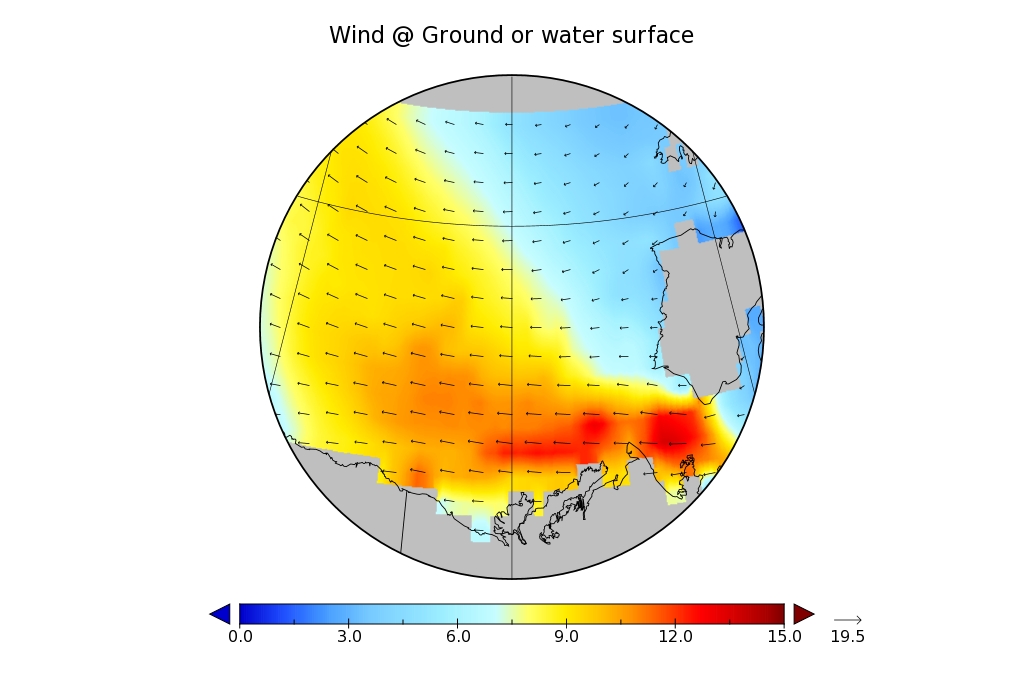
Much like last month, temperatures are above zero and rain is forecast. That’s because once again the current synoptic chart from Environment Canada shows a warm wet flow from way down south over Svalbard and on into the Central Arctic:
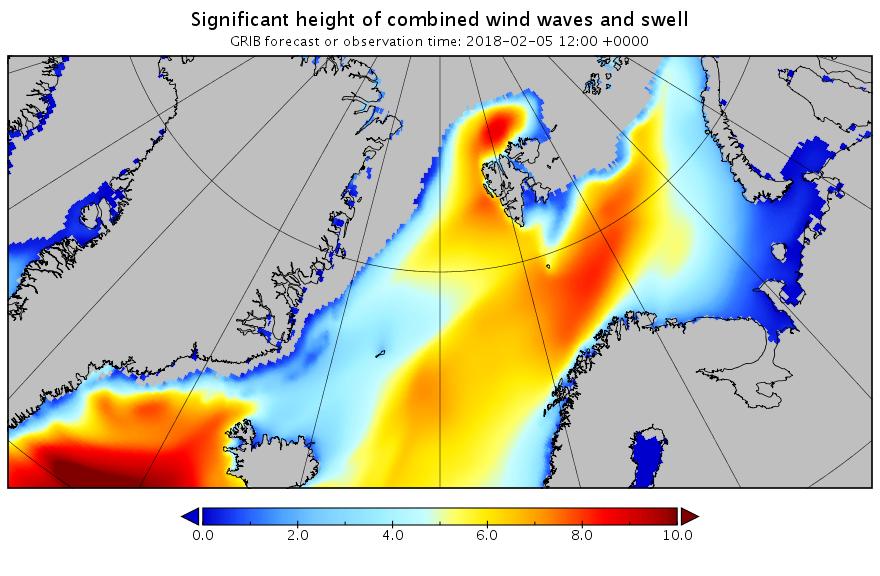
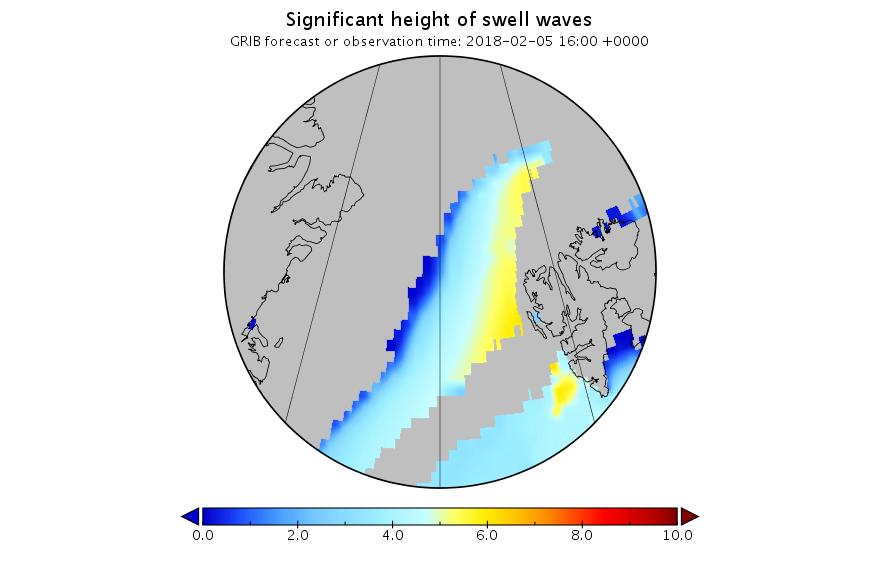
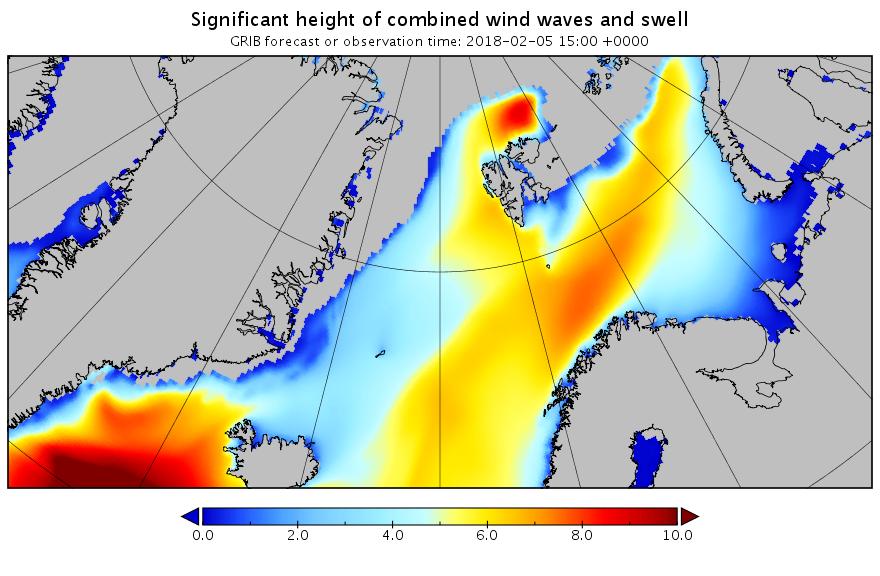
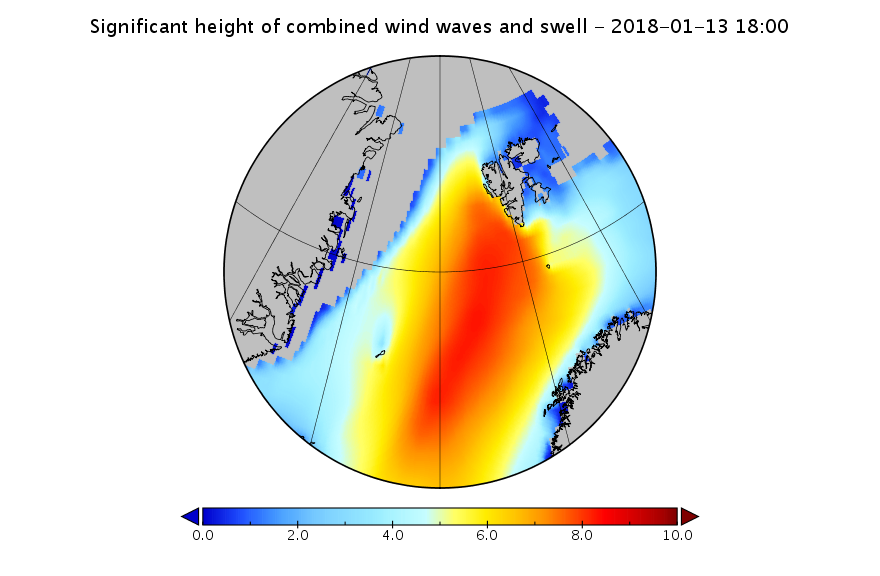
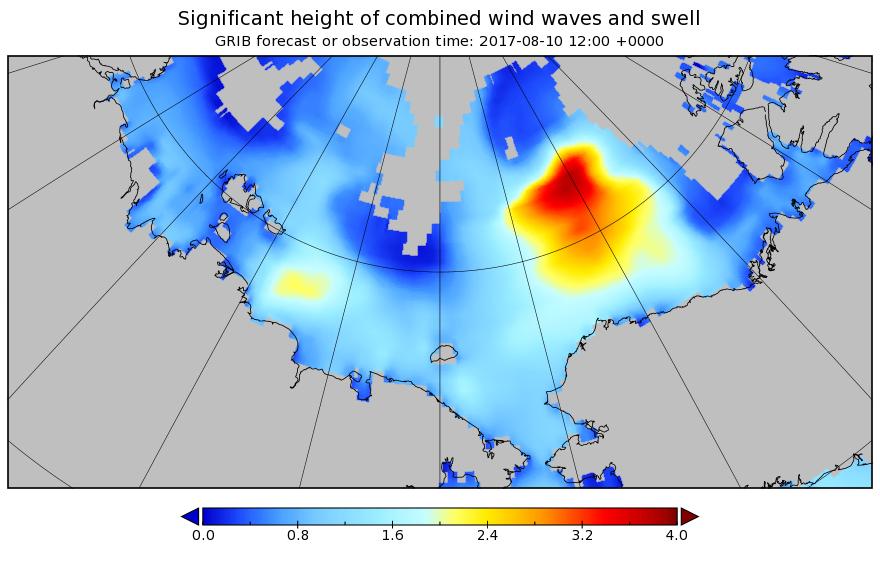
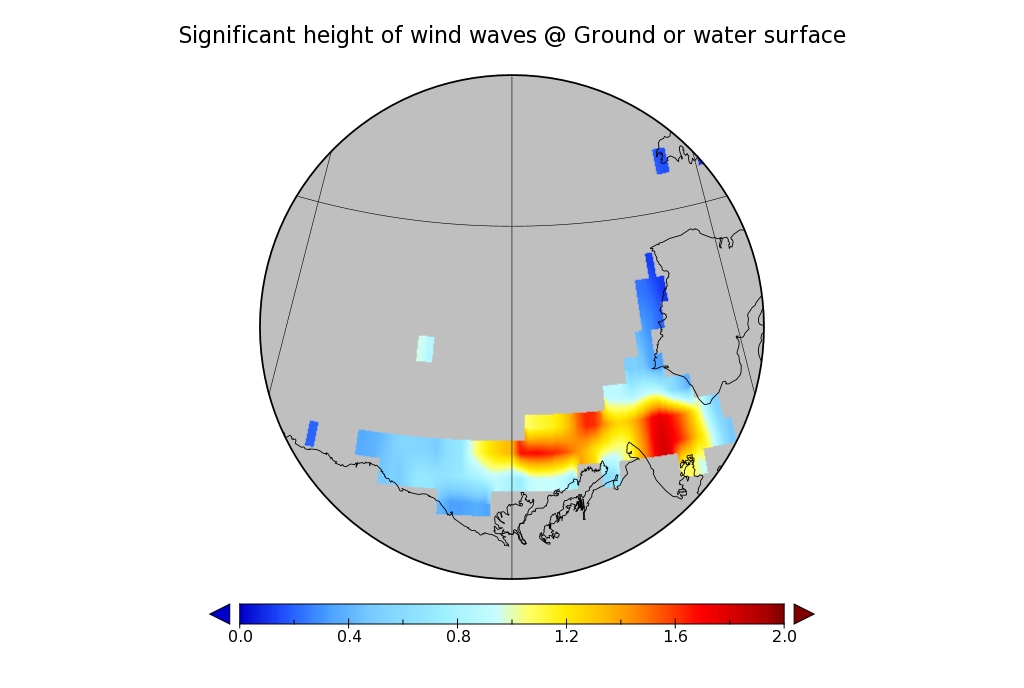
Next here’s the current combined wave and swell height forecast for the Svalbard area:
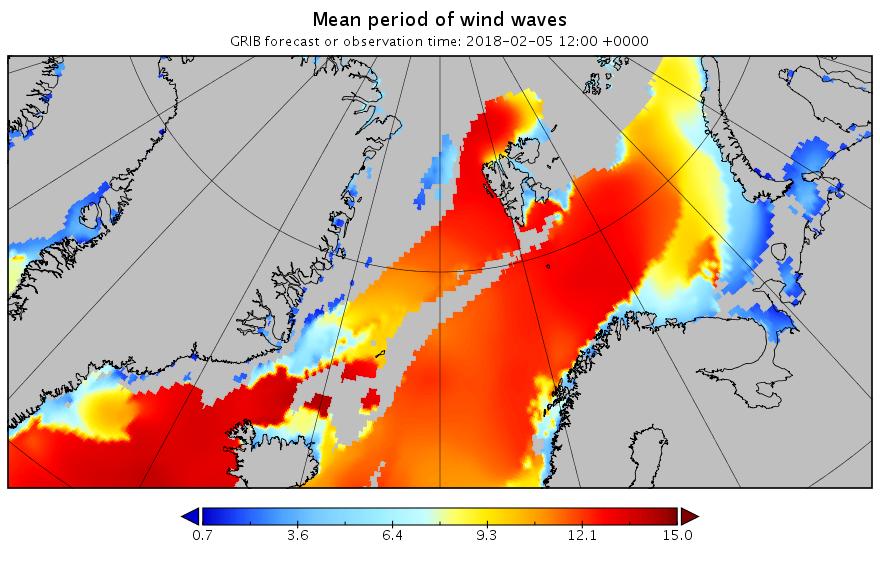
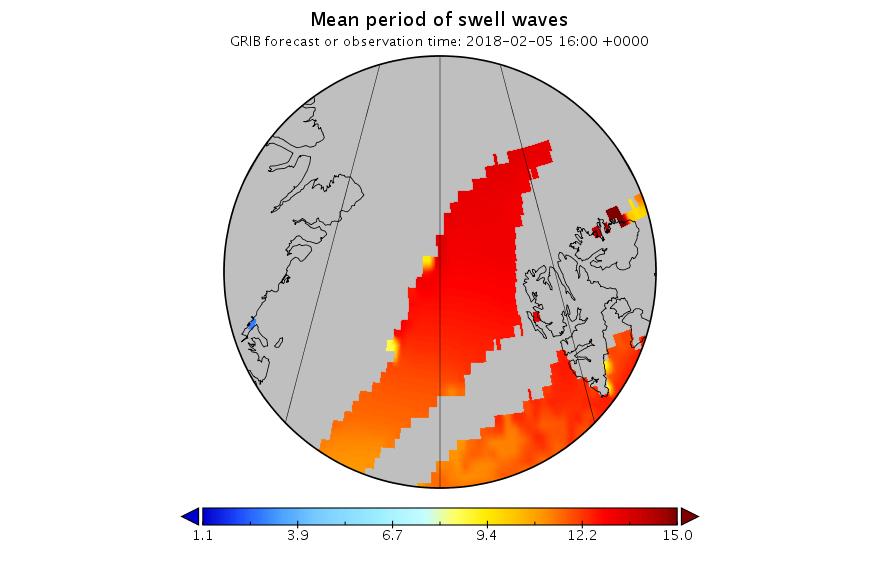
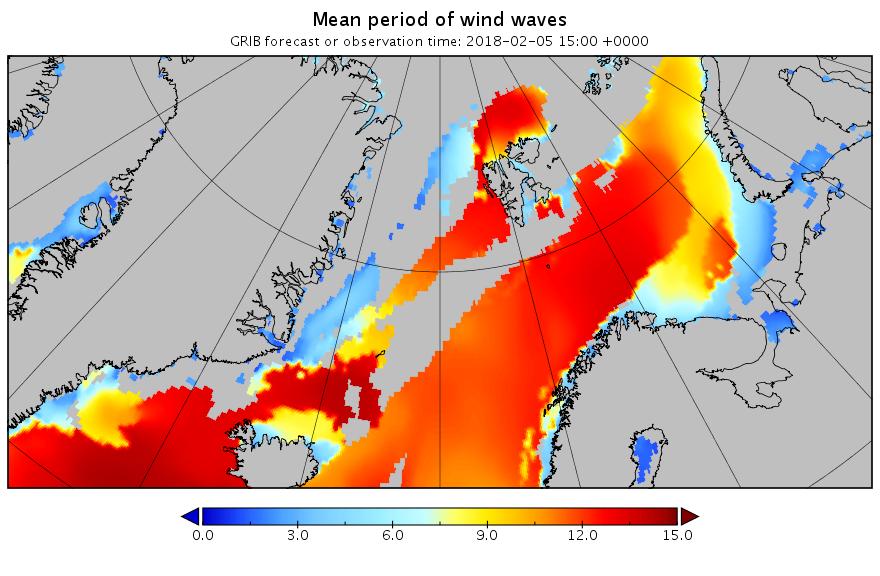
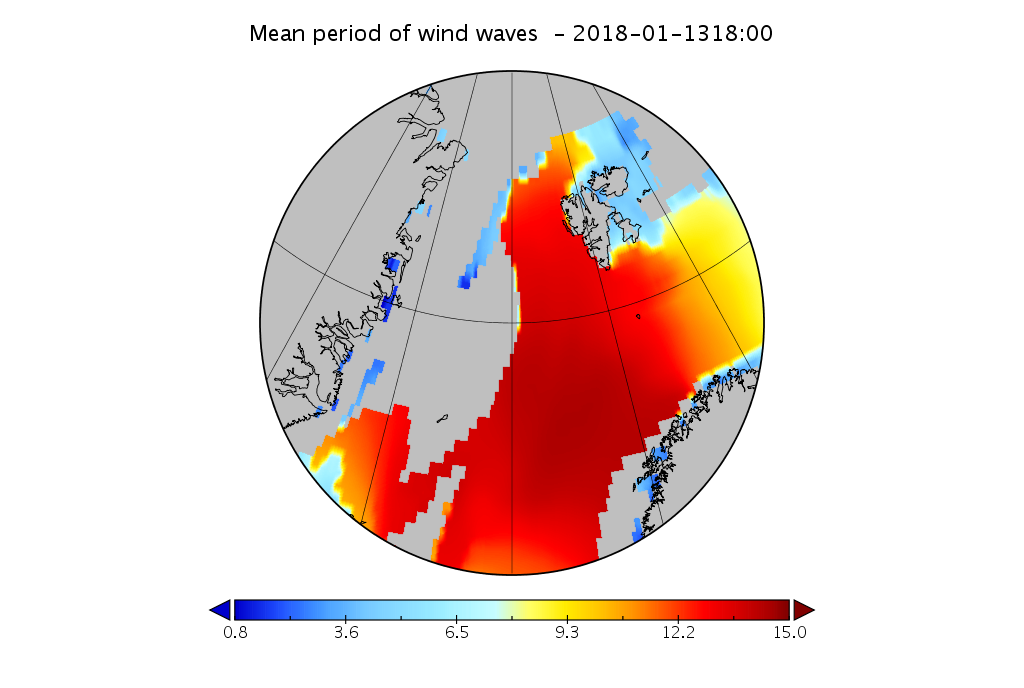
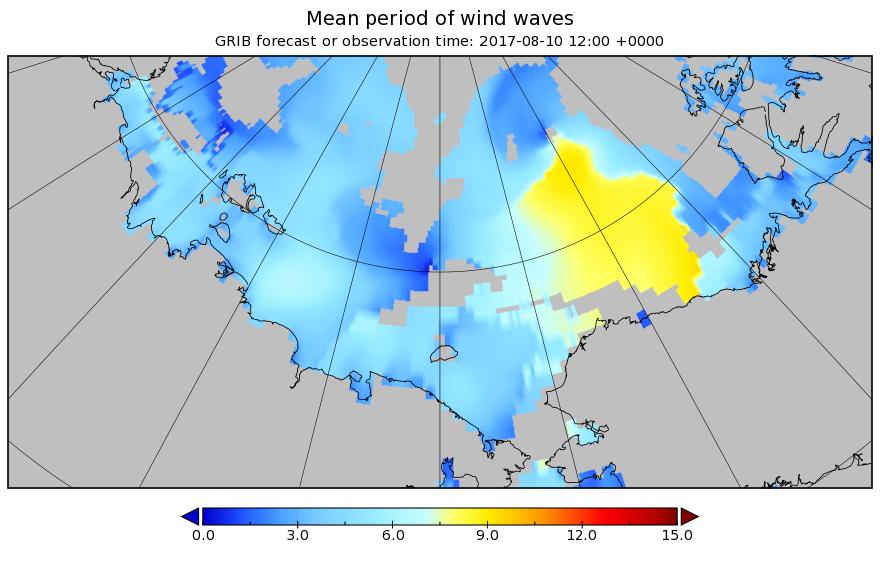
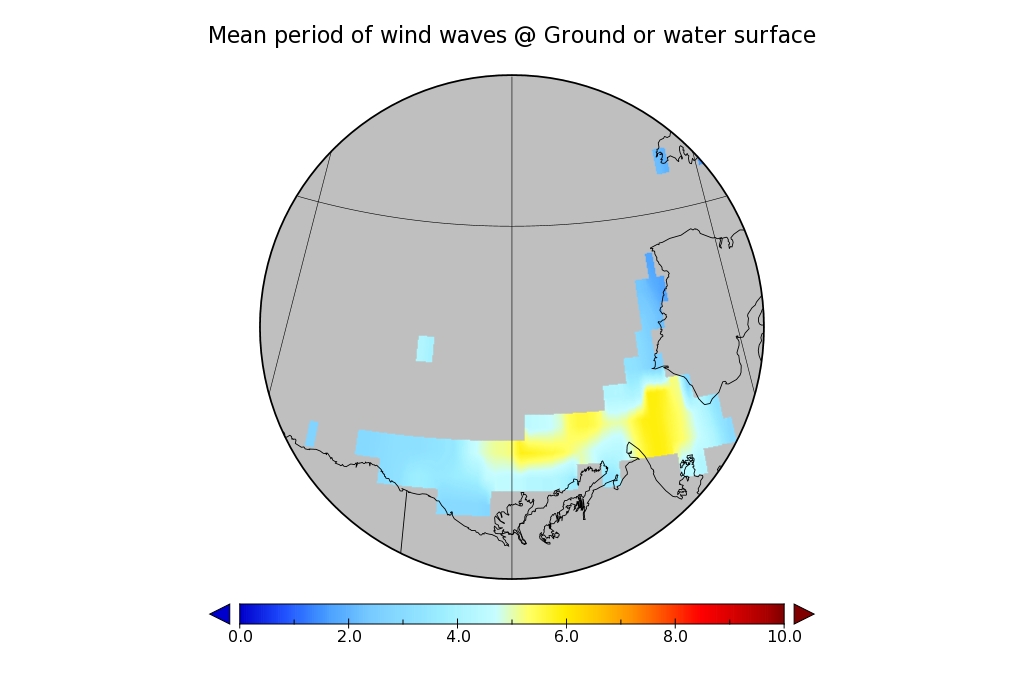
and here’s the associated wave period forecast:
It’s still showing 10 meter waves with a 15 second period north of Svalbard tomorrow lunchtime. Somewhat unusually for the Arctic these aren’t merely giant wind waves. Zooming in on the Fram Strait and breaking out the underlying primary swell reveals:
A long distance swell of that magnitude is going to cause some damage.
[Edit – February 5th]
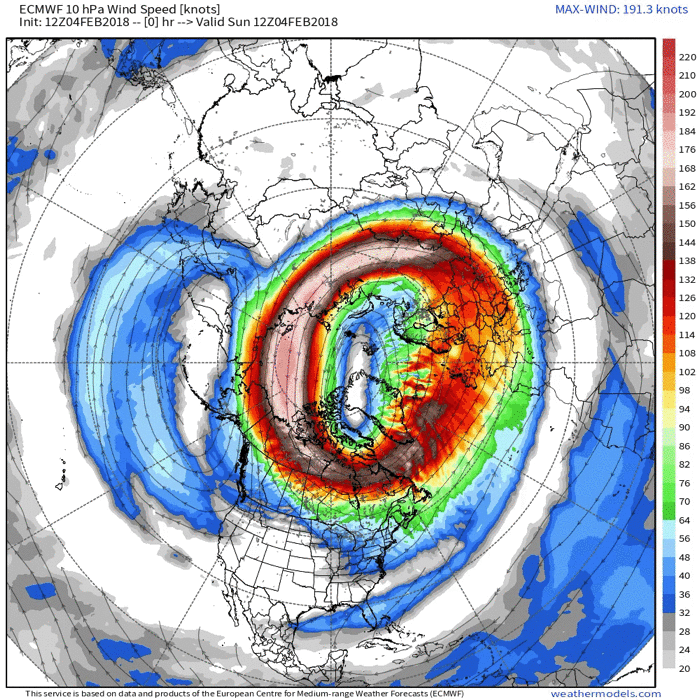
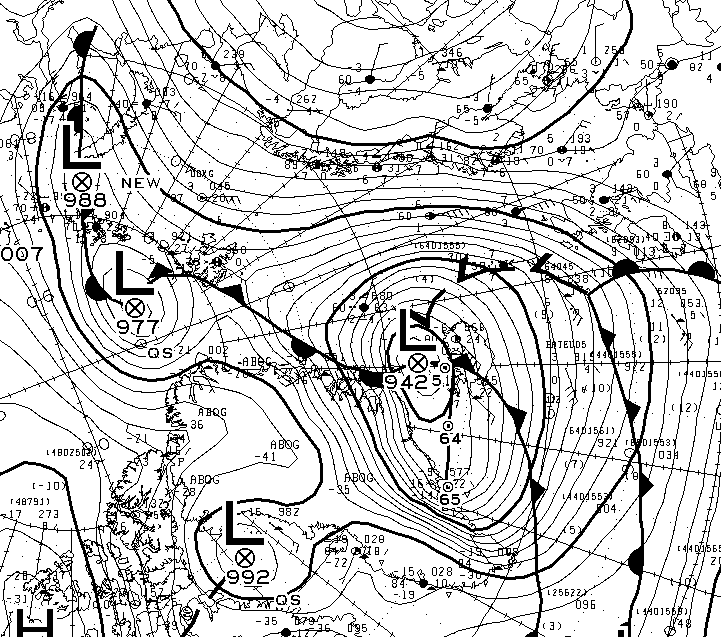
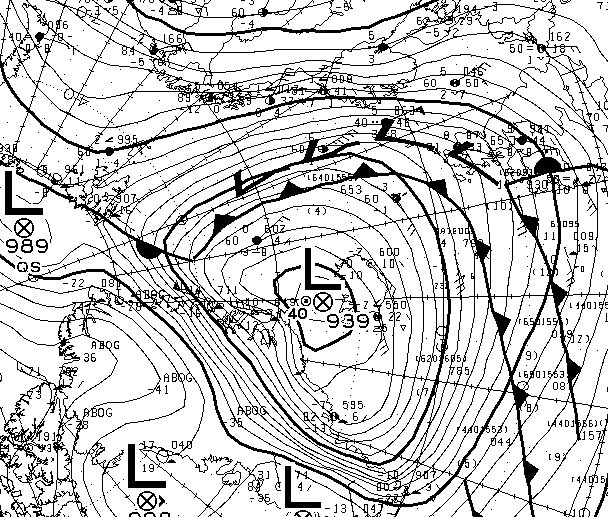
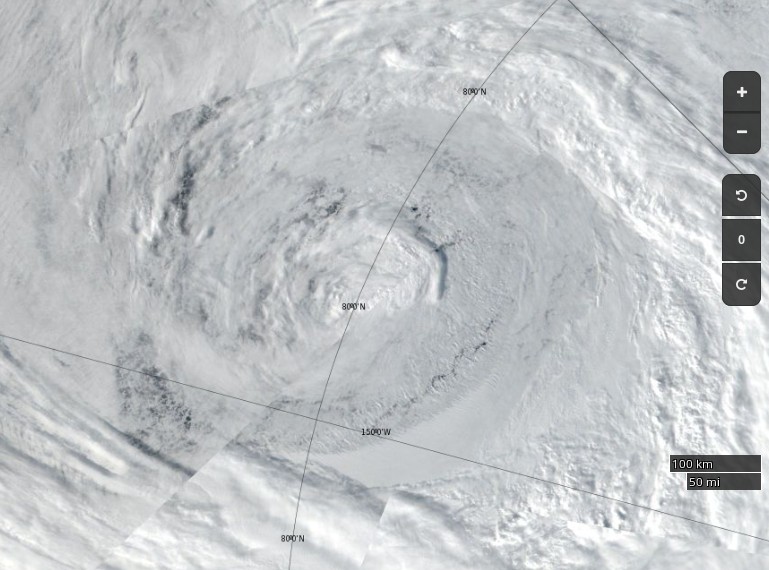
The current ECMWF forecast for a split polar vortex, courtesy of Ice Shieldz on the Arctic Sea Ice Forum:
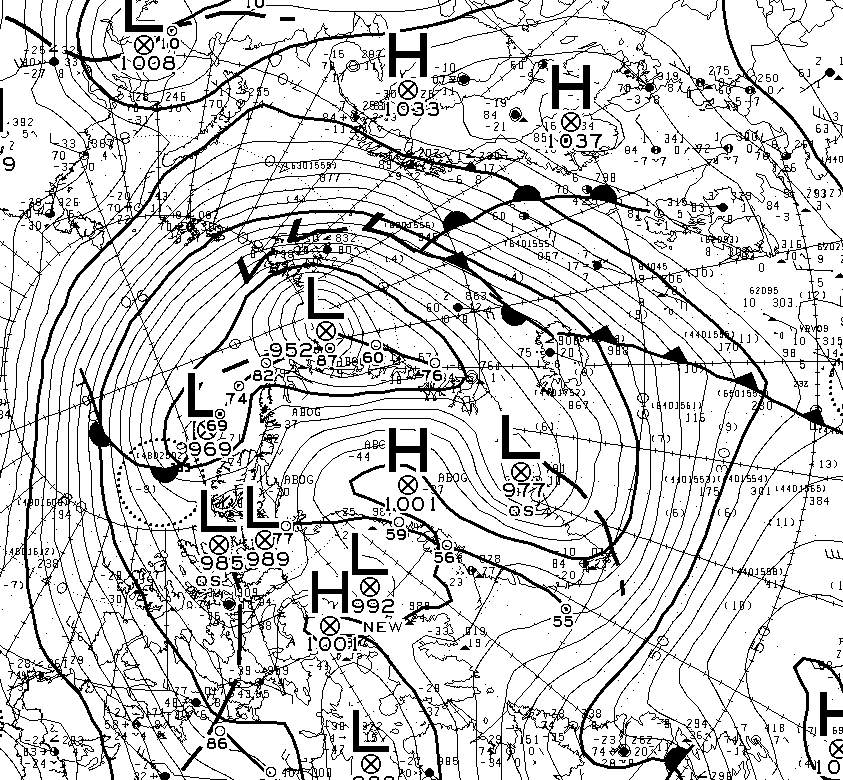
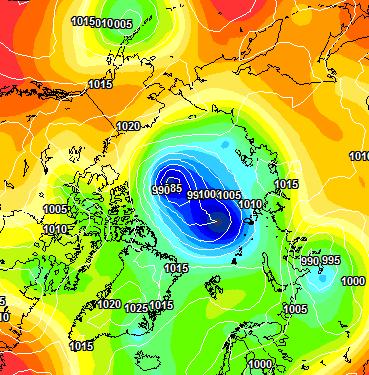
This is suggestive of more cyclones to come, but sticking with the current one for now, here is the MSLP chart at 00:00 UTC this morning showing the cyclone’s central pressure has dropped to 952 hPa:
Here too is the current WaveWatch III forecast for 15:00 UTC today:
The peak of the swell north of Svalbard is now slightly later than originally forecast, but it’s still enormous!
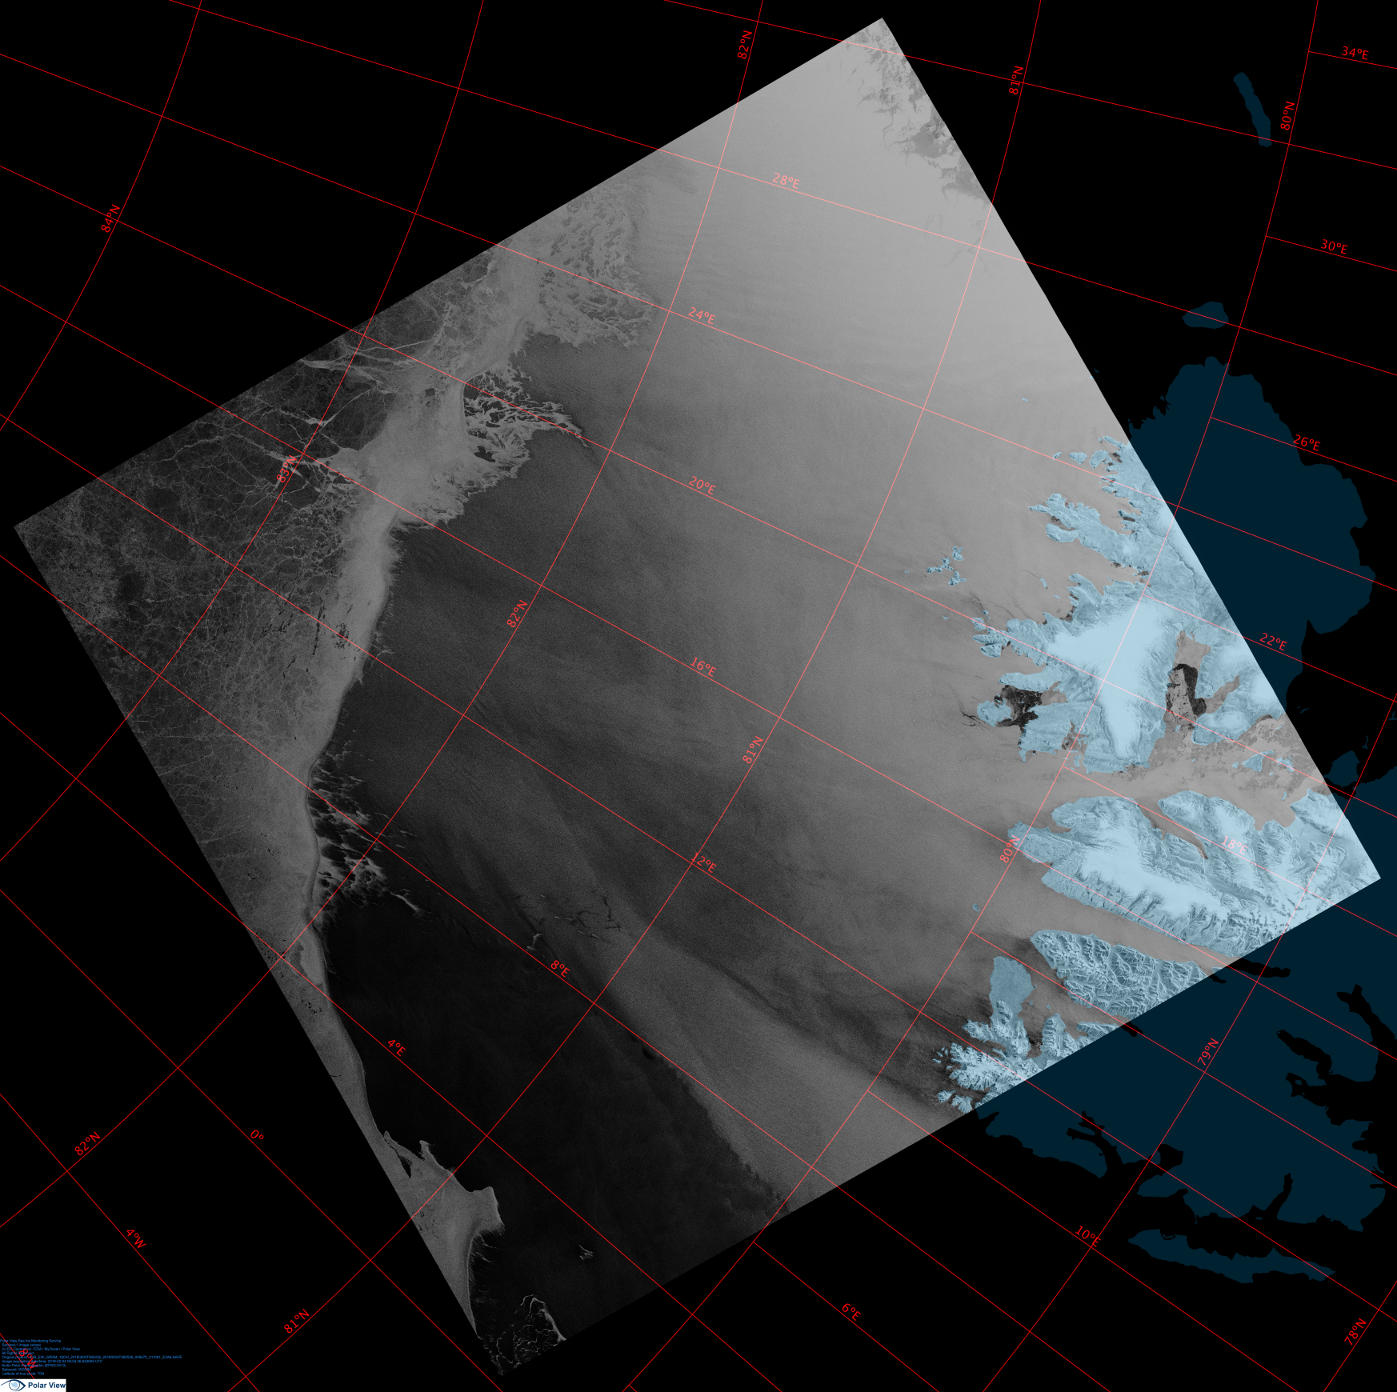
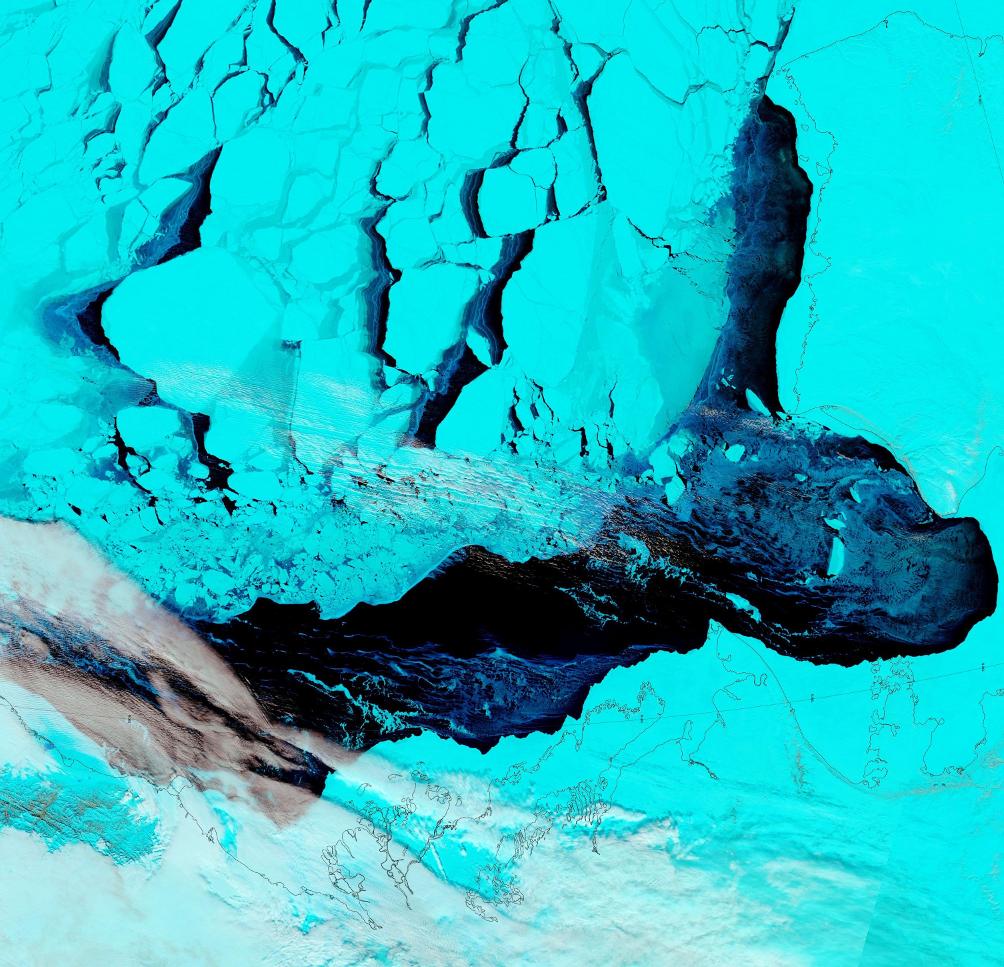
Here’s a single Sentinel 1B synthetic aperture radar image that captures the position of the ice edge north of Svalbard yesterday quite nicely:
[Edit – February 7th]
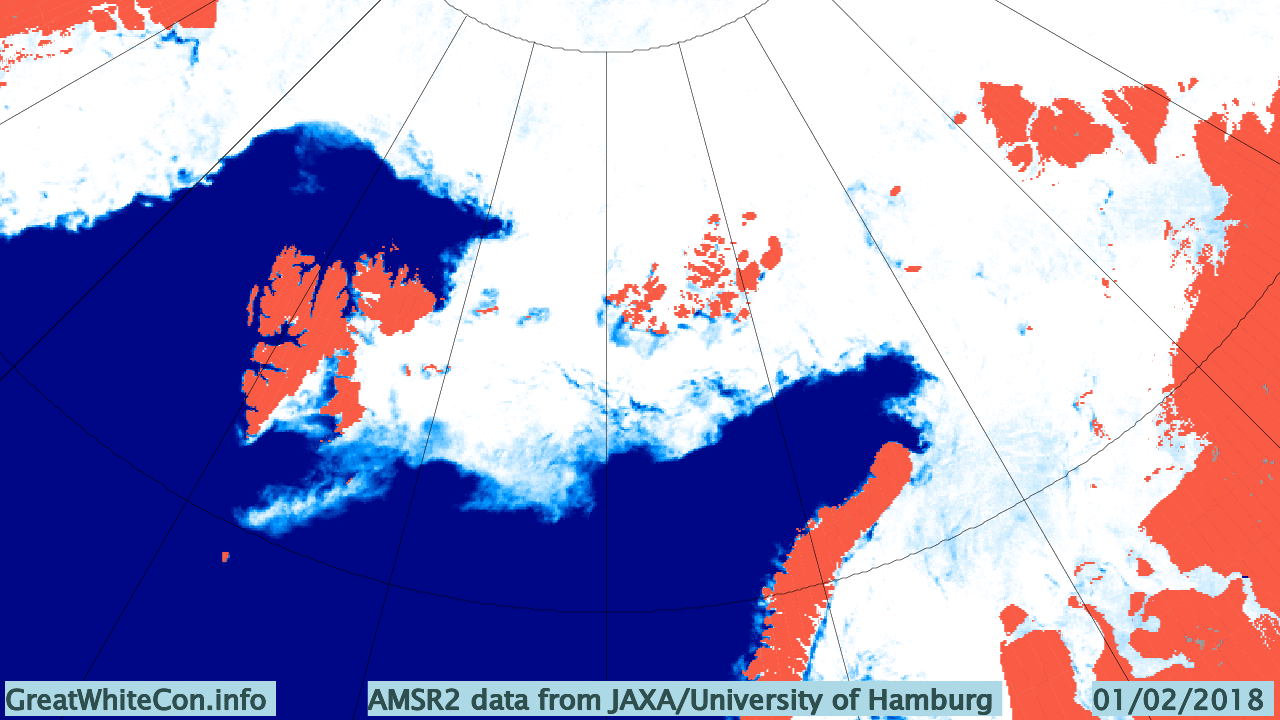
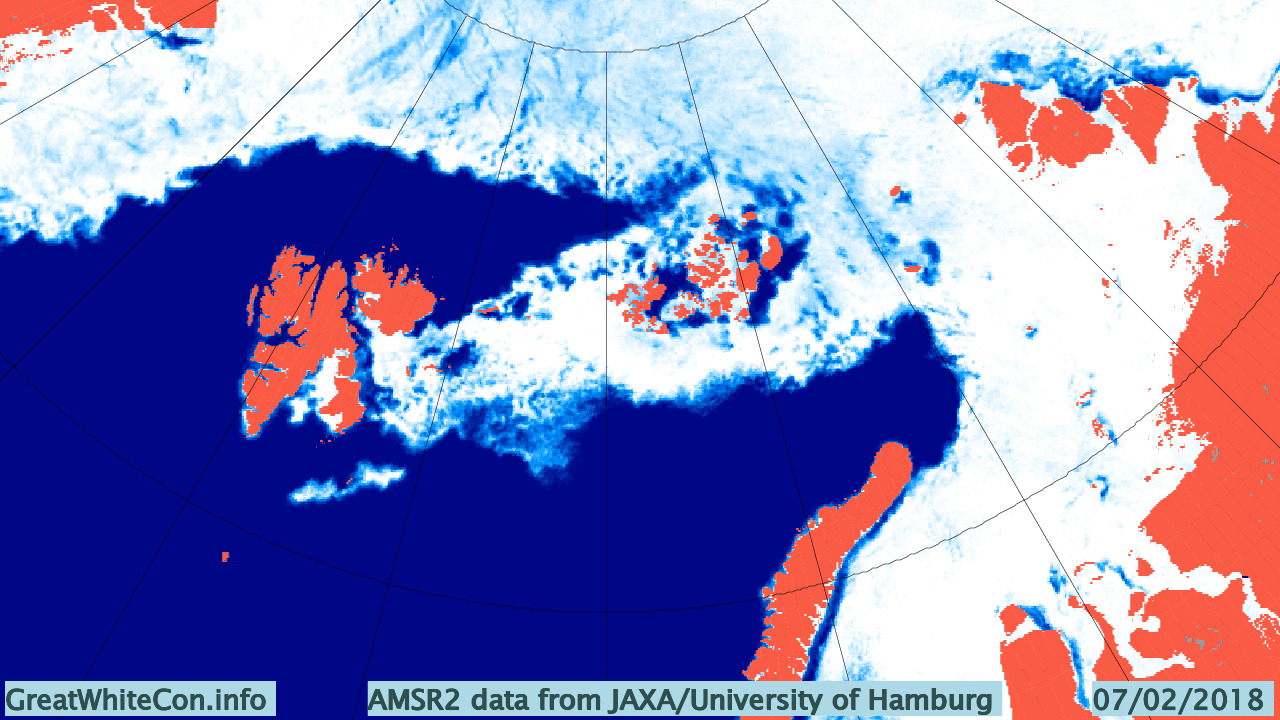
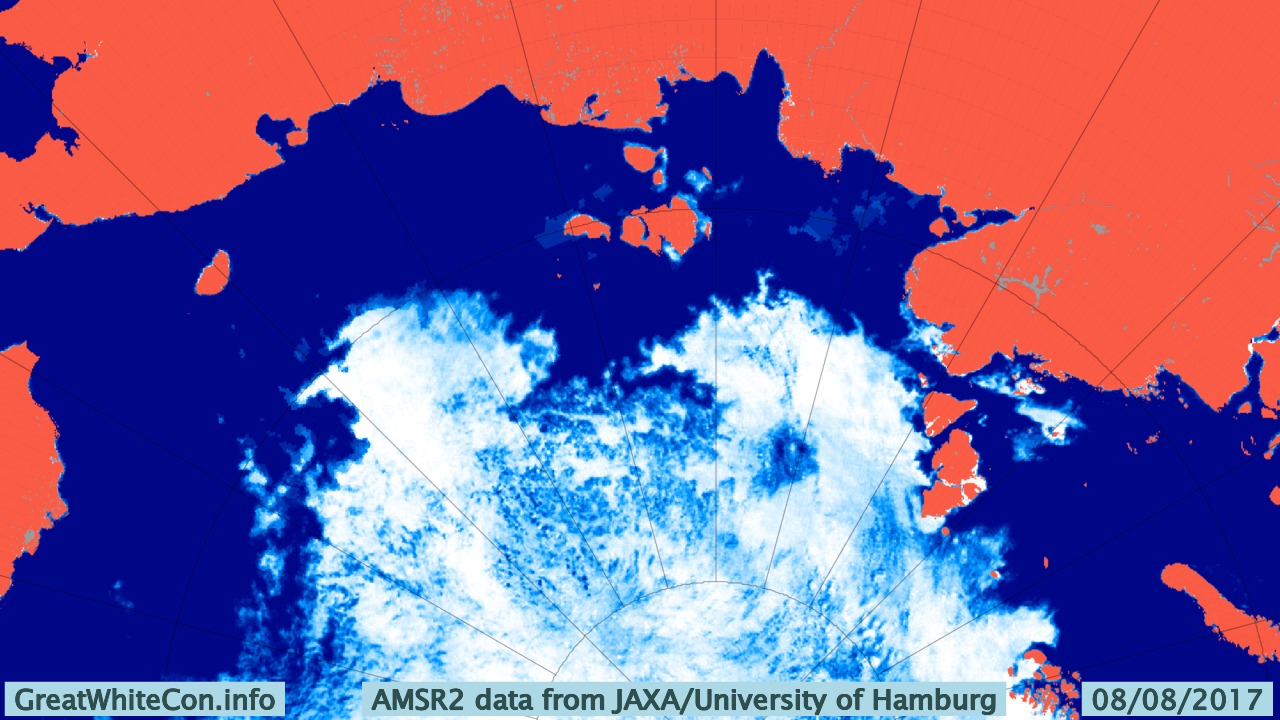
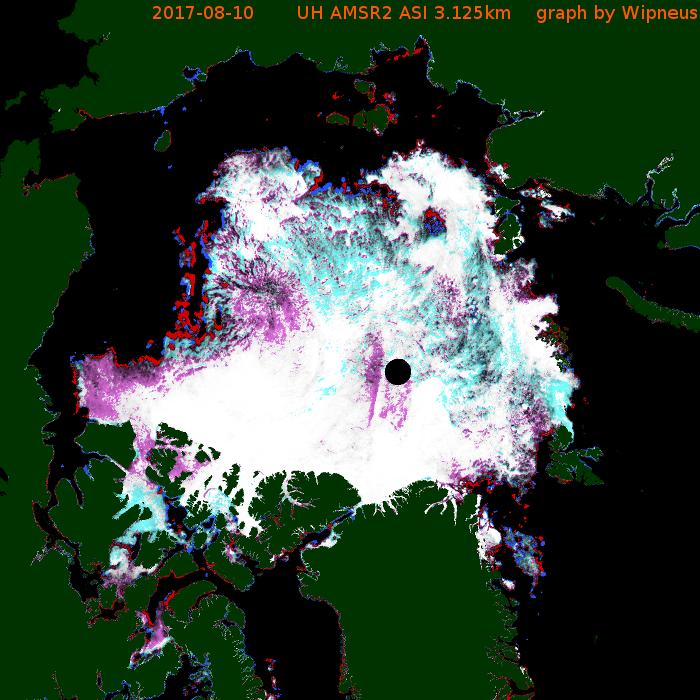
A brief overview of the effect of the recent cyclone on the sea ice in the Arctic via AMSR2:
Click the image to animate it.
[Edit – February 8th]
An Arctic wide take via Thomas Lavergne on Twitter:
Your daily update on the "big low entering #SeaIce". The "spin" in motion moves East towards Severnaya Zemlya. Some opening from land there, increased flushing through Fram Strait. pic.twitter.com/q4m1CRhmtS
An interesting insight into CryoSat-2 sea ice thickness measurements from Stefan Hendricks on Twitter:
Radar altimetry tells you how far the surface waves penetrate into the #seaice cover. Unfortunetaly via a bias in #Cryosat freeboard information. 😉 pic.twitter.com/OxUTcFH94h
GFS wants to keep major #PolarVortex (PV) center over Western Canada after the split and is consistent with predicted westward shift of troughing and #cold across North America but this is not typical following significant PV disruptions. pic.twitter.com/zX7n3rnMpo
Here’s the 6 hour wave forecast for the Fram Strait from 12:00 UTC this afternoon:
Look at the scales carefully then compare the wave height and period with previous similar events. Here’s the cause of those giant waves, two powerful cyclones off Greenland pumping heat and moisture northwards from a long way south:
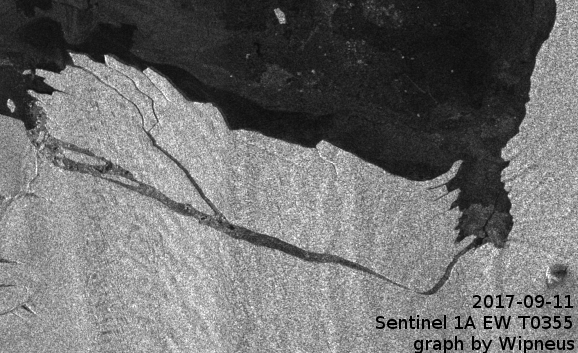
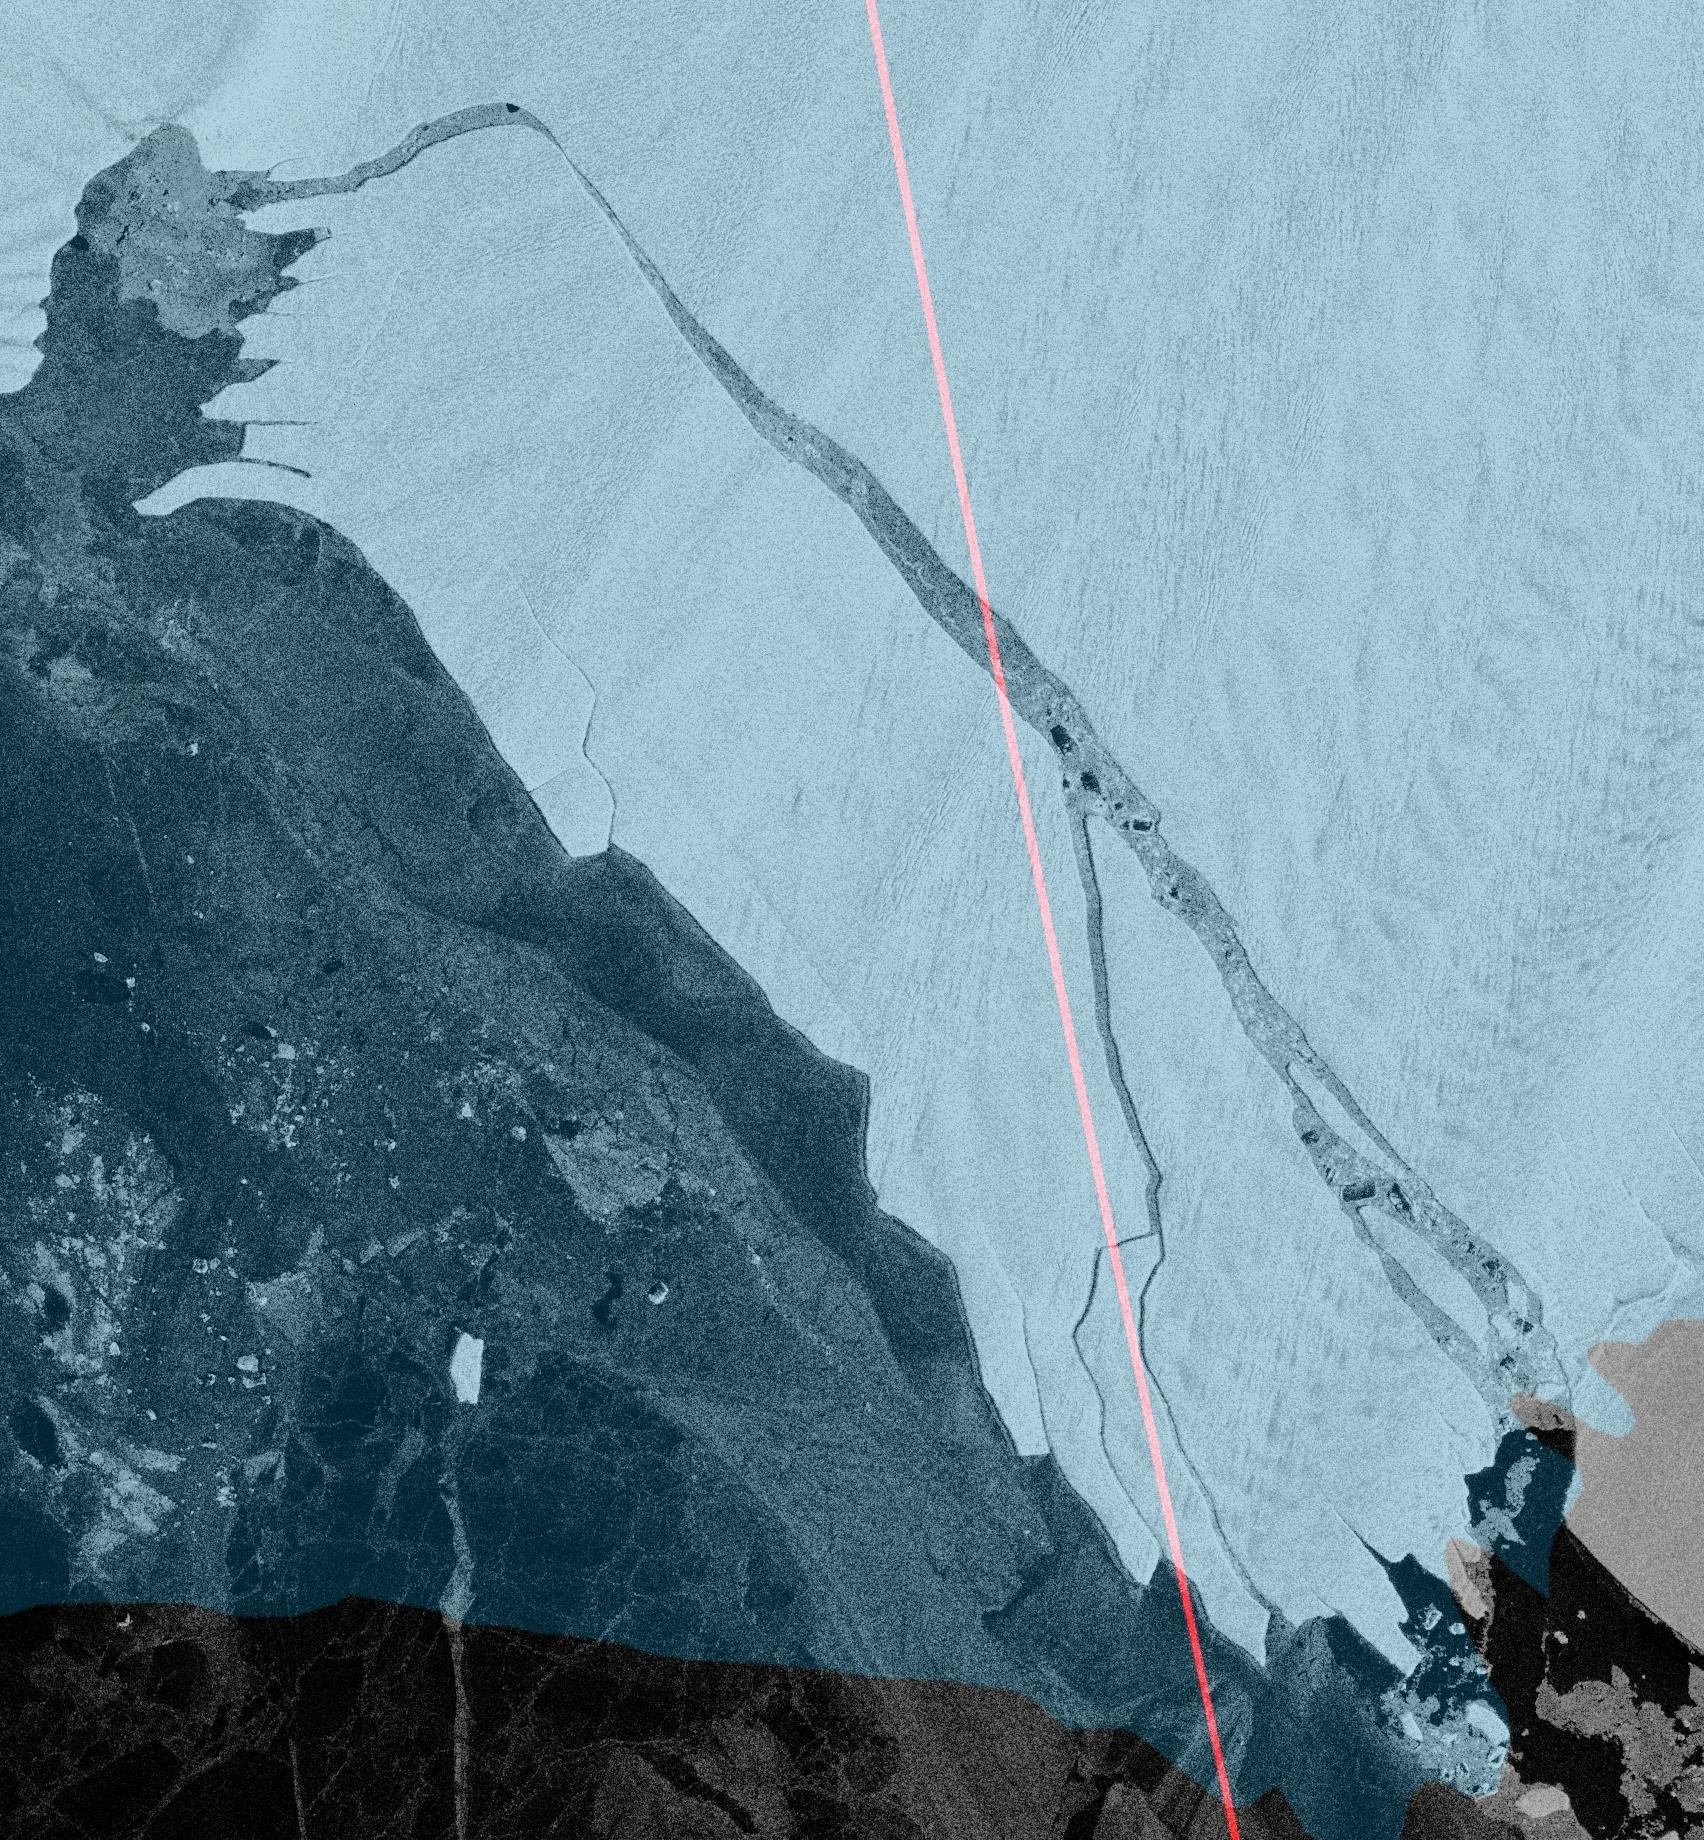
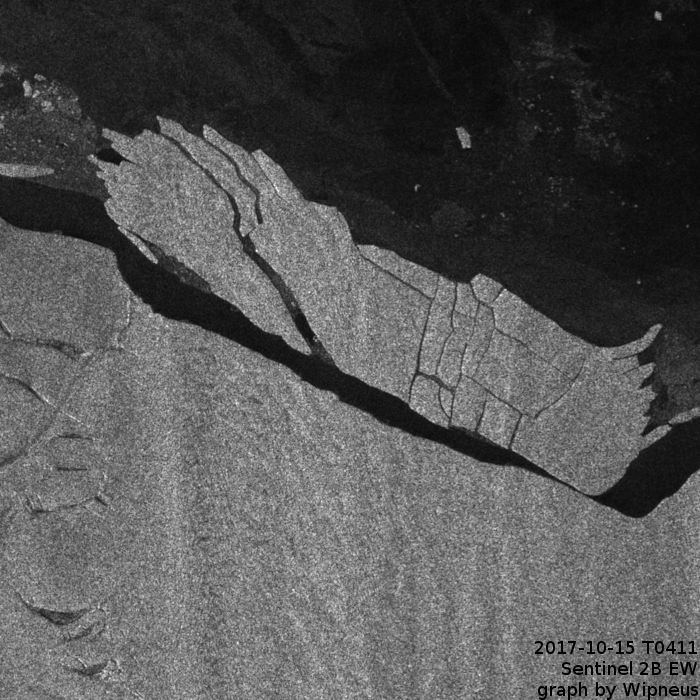
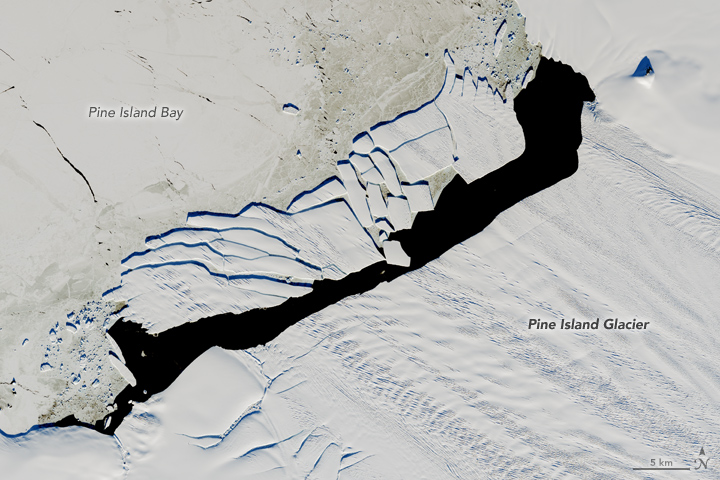
An image captured earlier this morning by the Sentinel 1A satellite’s synthetic aperture radar reveals that another huge chunk of the Pine Island Glacier in Antarctica has broken loose:
.@NASAEarth 's MODIS satellite gives an overview of #PIG's glacier front location since 2009 + corresponding 3 major calving locations 7/n pic.twitter.com/miP1RAUCBF
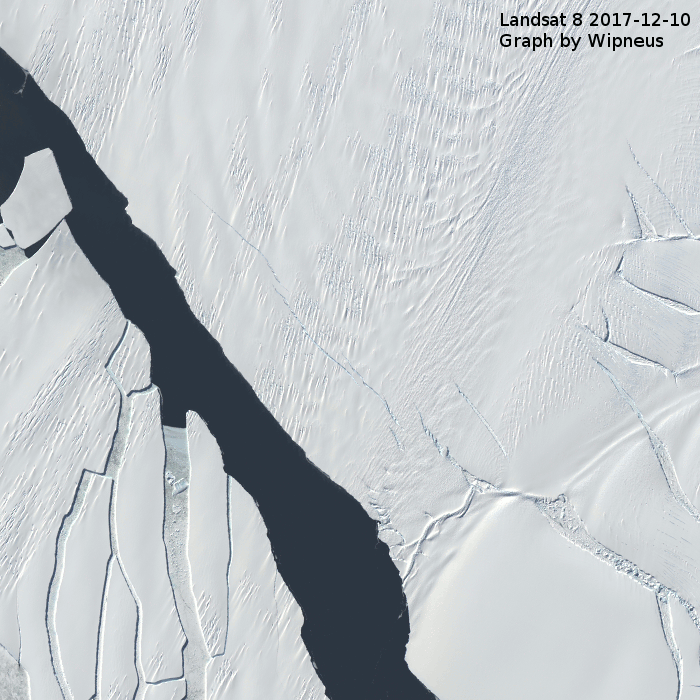
In September 2017, a new iceberg calved from Pine Island Glacier—one of the main outlets where the West Antarctic Ice Sheet flows into the ocean. Just weeks later, the berg named B-44 shattered into more than 20 fragments.
On December 15, 2017, the Operational Land Imager (OLI) on Landsat 8 acquired this natural-color image of the broken berg. An area of relatively warm water, known as a polyna, has kept the water ice free between the iceberg chunks and the glacier front. NASA glaciologist Chris Shuman thinks the polynya’s warm water could have caused the rapid breakup of B-44.
The image was acquired near midnight local time. Based on parameters including the azimuth of the Sun and its elevation above the horizon, as well as the length of the shadows, Shuman has estimated that the iceberg rises about 49 meters above the water line. That would put the total thickness of the berg—above and below the water surface—at about 315 meters.
Depending on whether you’re reading an “alarmist” or a “skeptical” web site you may have been told either that the Northern Sea Route is already “open” or that the “icebreaker stuck in the sea ice off Pevek” escaped very late this summer. Here at Great White Con we like to think of ourselves as “realists”, so what are the actual facts of the matter.
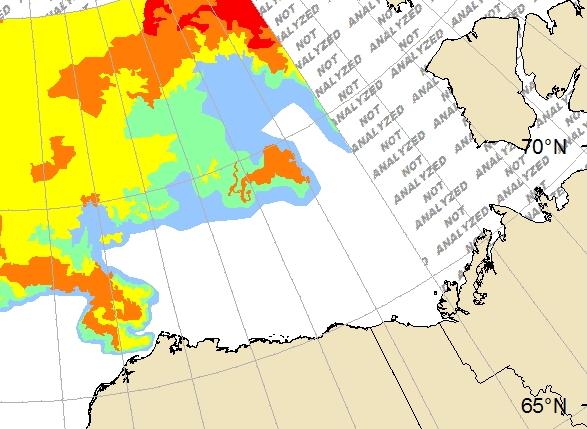
Our customary way of looking at such things is to use the Canadian Ice Service’s definition of “open” for the Northwest Passage, which seems to be 3/10 or less concentration along the entire route. That would allow an intrepid little yacht like Northabout through without too much trouble, but that point has not quite been reached yet this year. The NSR looks to be eminently “open” already if you only look at an AMSR2 concentration map:
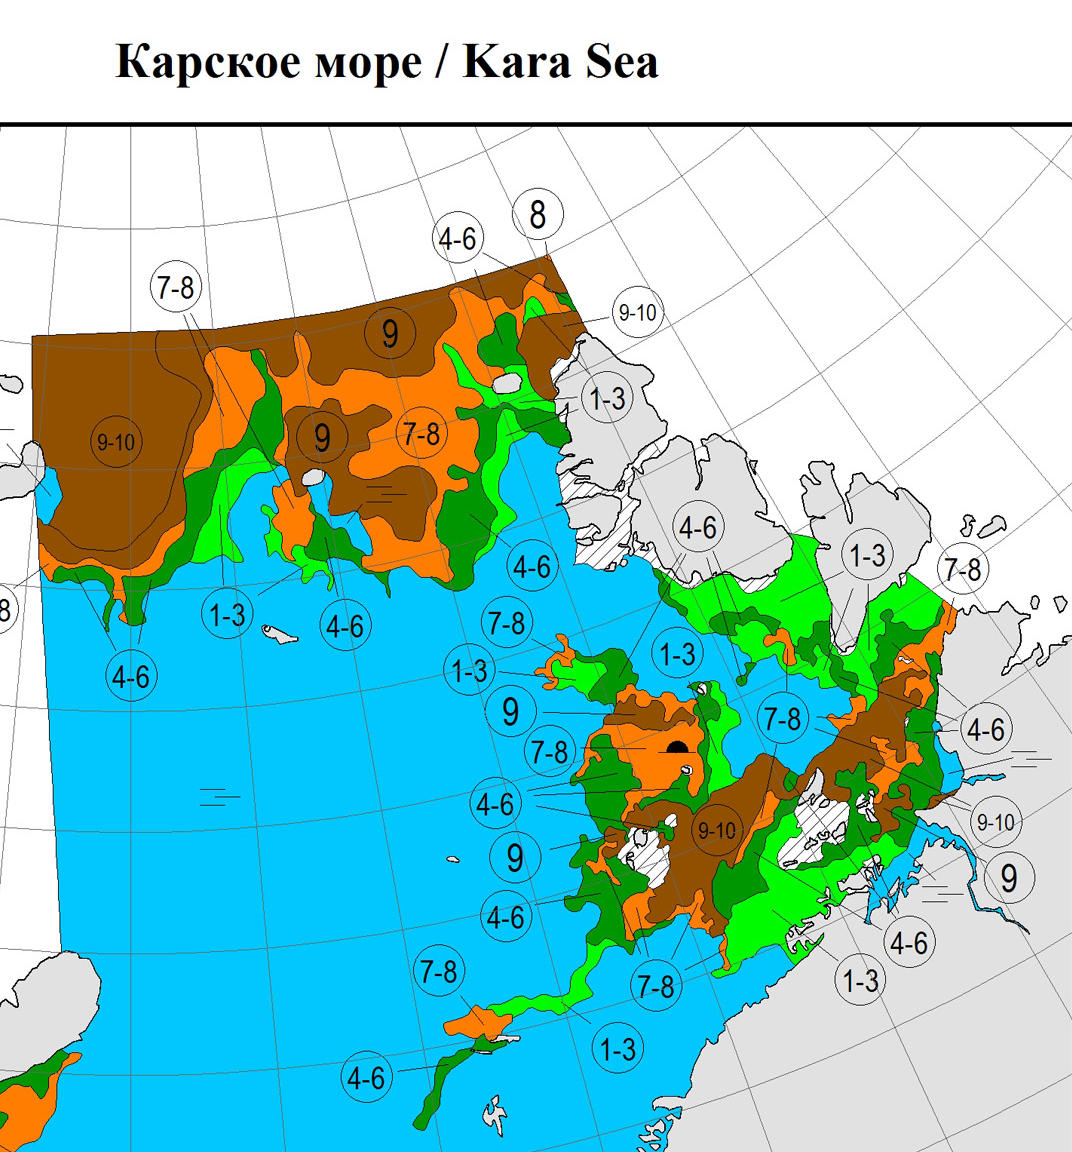
However according to the Russian Arctic and Antarctic Research Institute (AARI for short) there is still not a suitably simple way through Vilkitsky Strait. Here’s their latest ice chart of the area:
Convoys led by nuclear powered icebreakers have already passed through the Vilkitsky Strait this summer. See for example this tracking map of Yamal from a few days ago:
Also an unaccompanied liquid natural gas carrier has made it through the Vilkitsky Strait already this year. According to a Total press release:
After loading its cargo at the Snøhvit LNG export terminal in Norway, in which Total has an 18.4% interest, the Christophe de Margerie is taking the Northern Sea Route to Boryeong in South Korea, where it will deliver a cargo for Total Gas & Power. It’s the first unescorted merchant LNG vessel ever to take this route, which makes it possible to reach Asia via the Bering Strait in 15 days versus 30 days via the Suez Canal.
This technological feat was made possible through the participation of Total teams to the design of these next-generation LNG carriers. Compilations of technology, they efficiently transport large quantities of LNG year-round, without requiring escort icebreakers during the period from July to November. The Christophe de Margerie is the first of a total of 15 planned LNG carriers that will be gradually deployed.
As you can see, whilst it travels forwards in open water the Christophe de Margerie goes into reverse when breaking ice! Little yachts and other unaccompanied vessels lacking an ice class certificate will have to wait just a little longer however, unless of course they are inclined to be “intrepid”.
[Edit – August 19th]
As Cesium points out below, there is now a <= 3/10 concentration channel through the Vilkitsky Strait on the AARI maps.
Here’s a couple of Sentinel 1A tiles from this morning stitched together:
We can now safely declare the Northern Sea Route “open”, even for less intrepid little yachts.
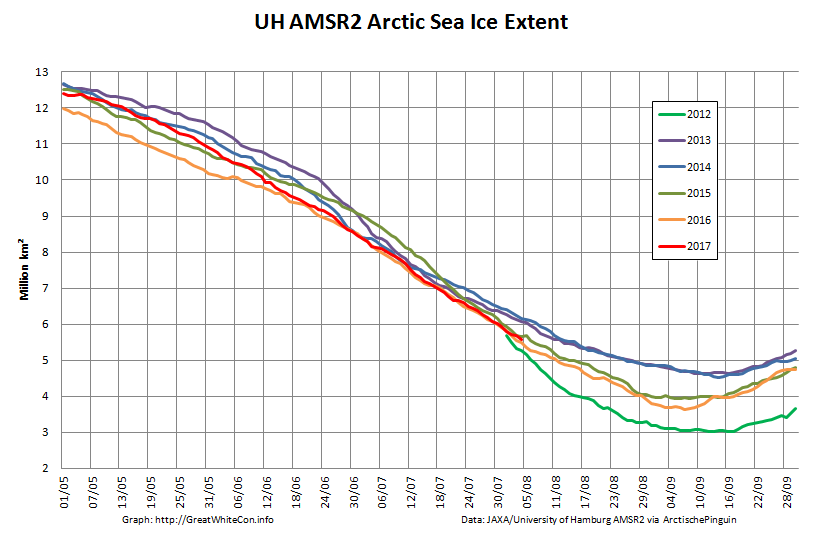
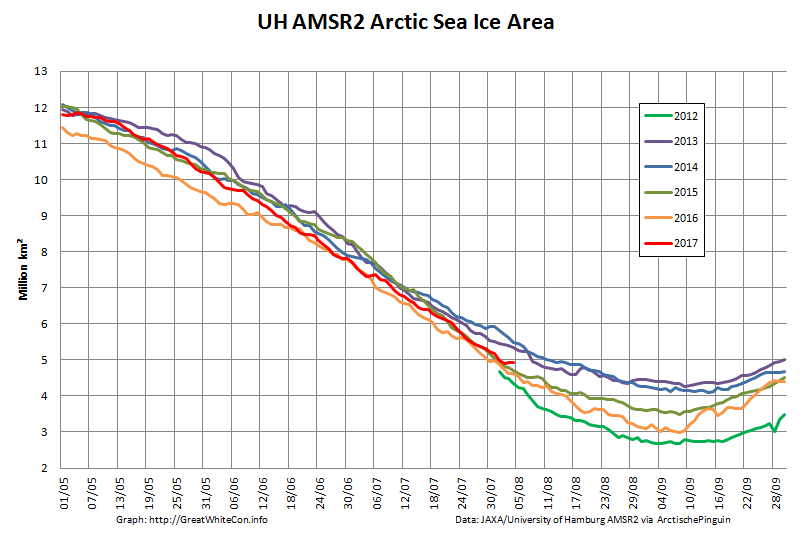
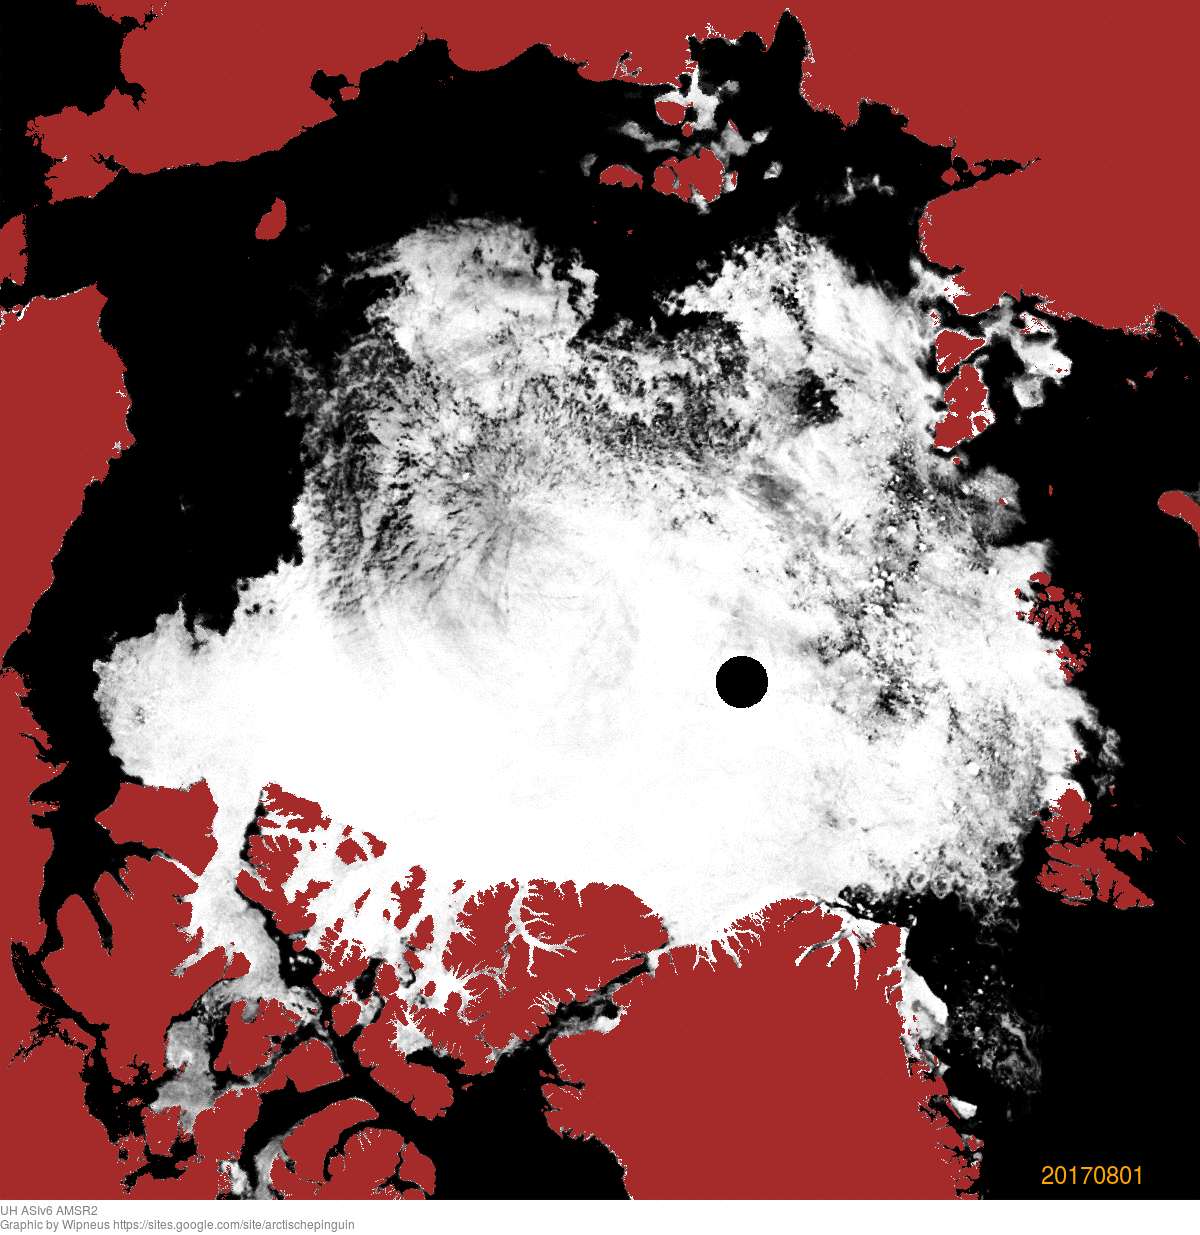
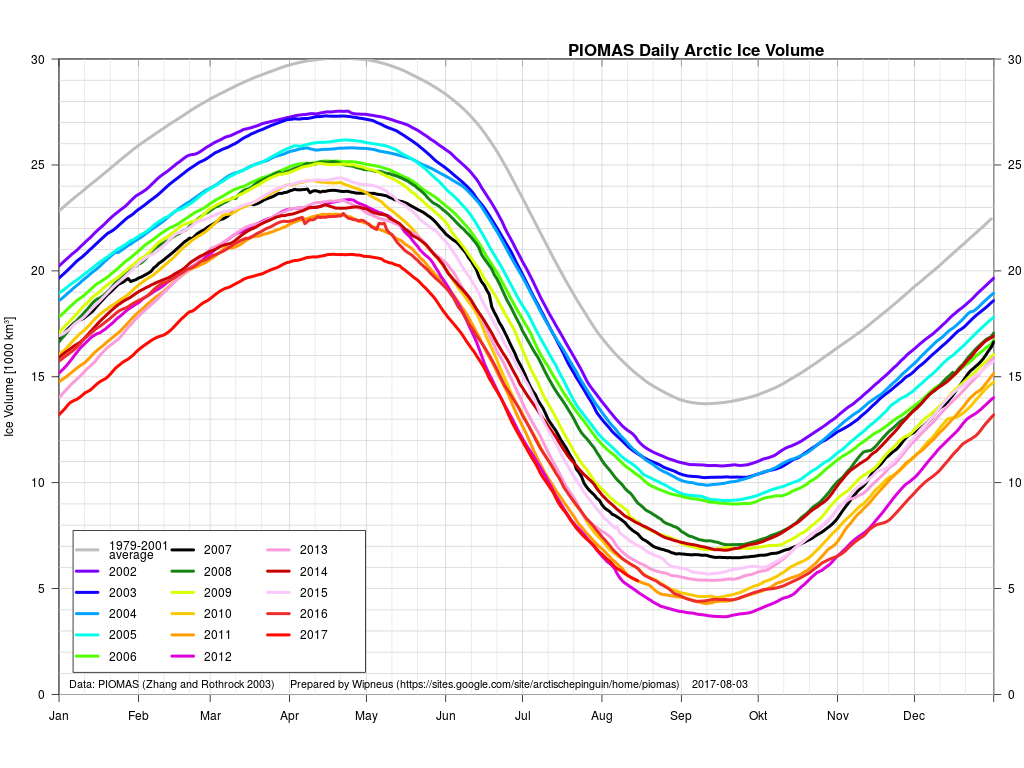
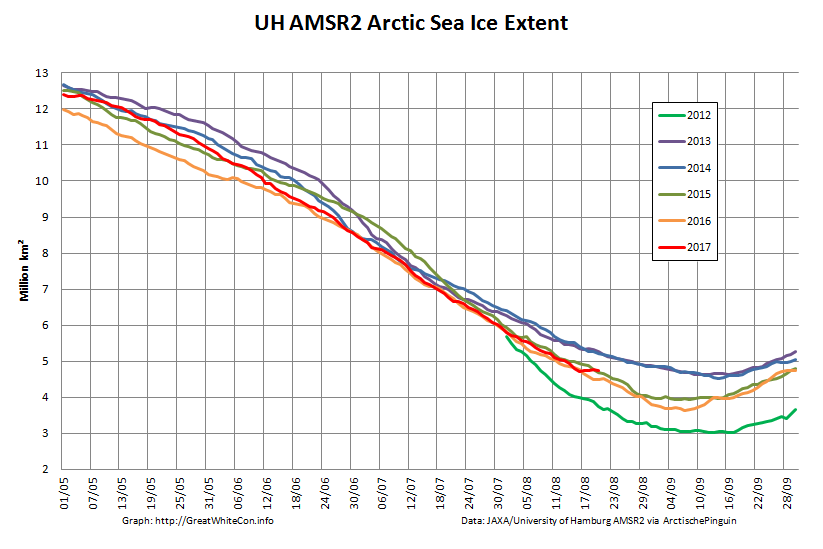
What seems likely to be the most interesting period of the 2017 Arctic sea ice melting season is upon us! The PIOMAS gridded data hasn’t been released yet, but the overall volume numbers reveal that 2017 has now relinquished its “lowest ever” position to 2012. Here’s Wipneus’ graph of the volume data:
plus his anomaly plot:
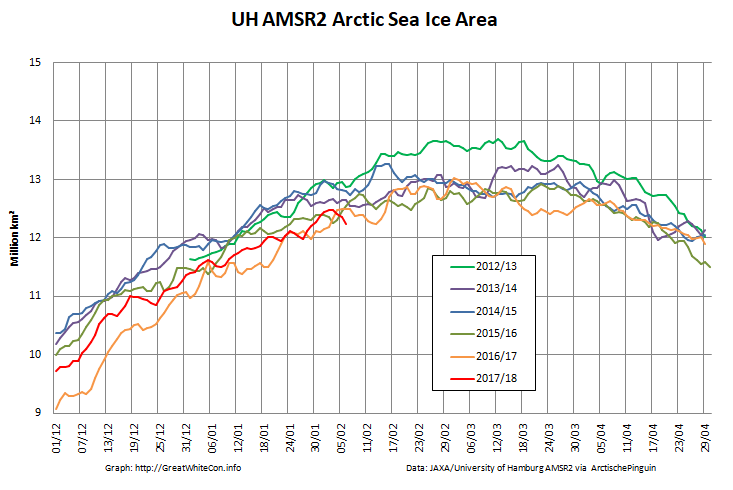
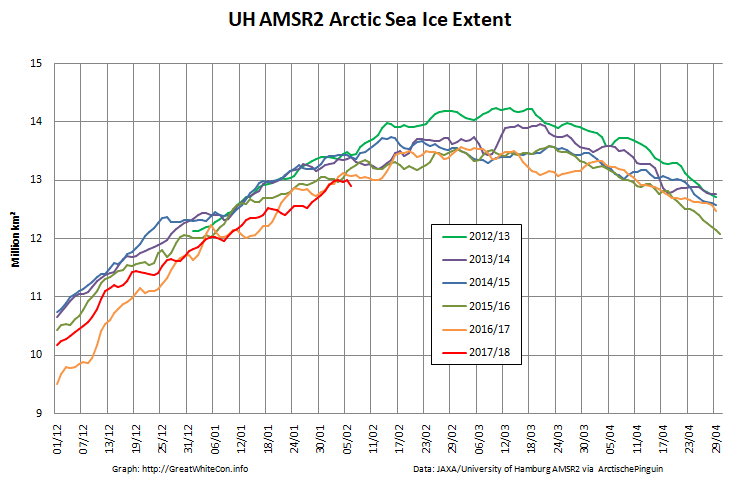
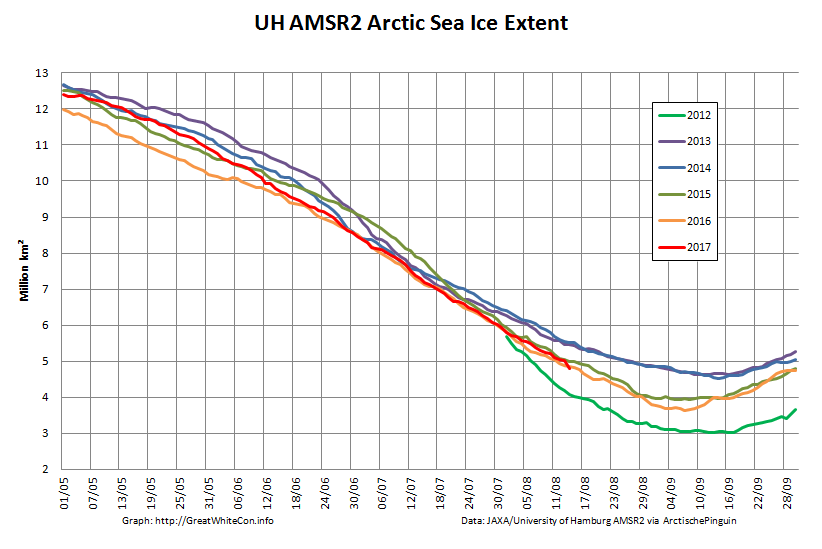
Our favourite high resolution AMSR2 area and extent graphs now also allow comparison with 2012. Here’s how they look at the moment:
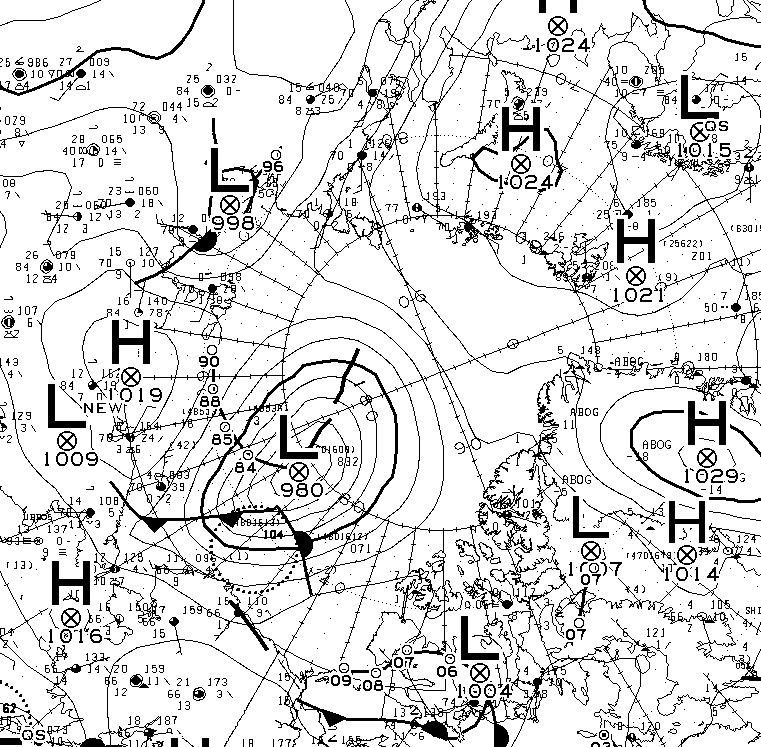
As you can see, round about now is when 2012 Arctic sea ice extent started to noticeably race ahead of the rest of the pack. Will 2017 follow suit? Are there any Arctic cyclones on the horizon for example? Well, the one forecast for August 4th hasn’t materialised. Here’s this morning’s Environment Canada synopsis:
However both ECMWF and GFS agree that a sub 985 hPa storm should have arrived by Sunday morning. Here’s the ECMWF version from MeteoCiel:
There’s stronger storms in the forecast further out, but once again we’ll believe them if and when we see them!
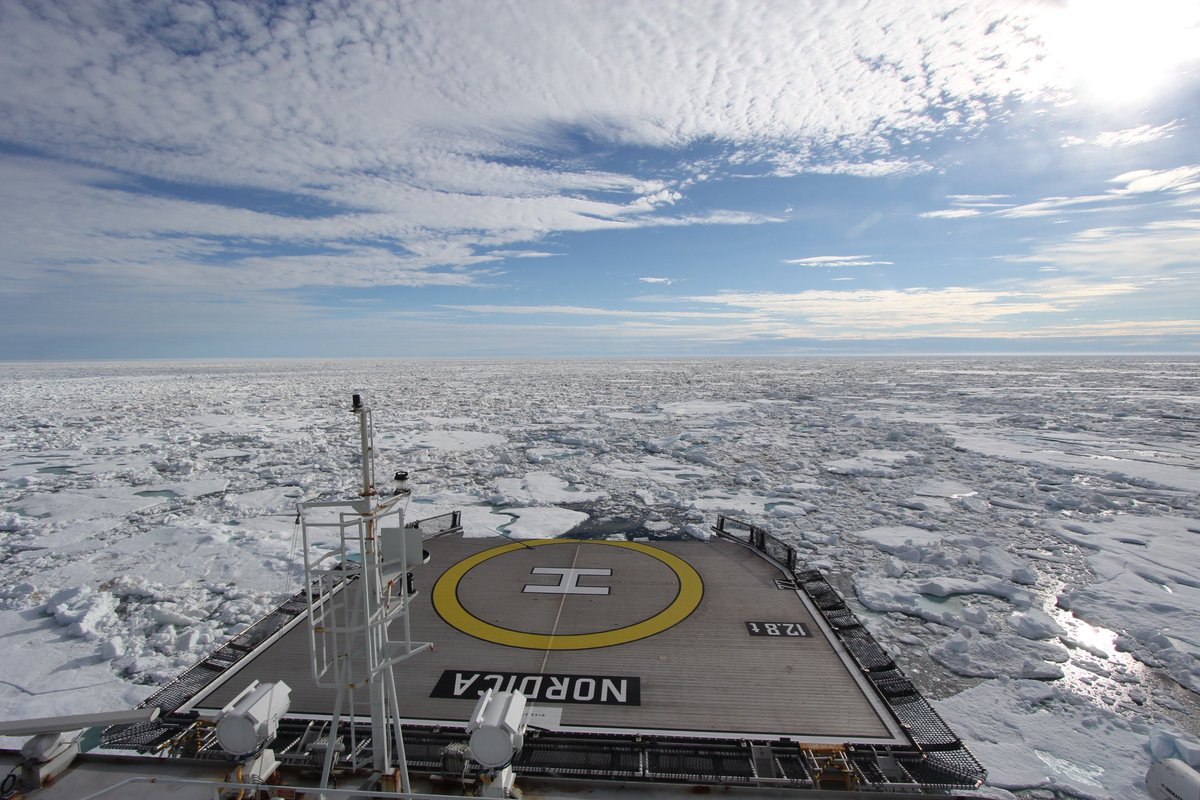
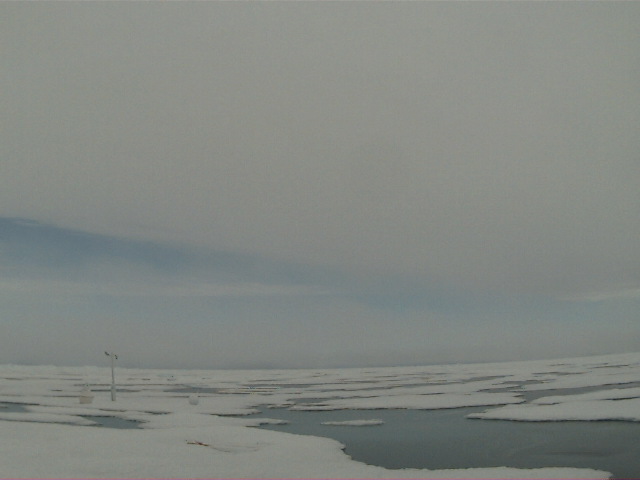
We’re keeping a close eye on the Northwest Passage once again this year. Most of the southern route is open already, but as we predicted the old ice in Larsen Sound has a lot of melting still to do. Here’s how it looked from the icebreaker Nordica a few days ago:
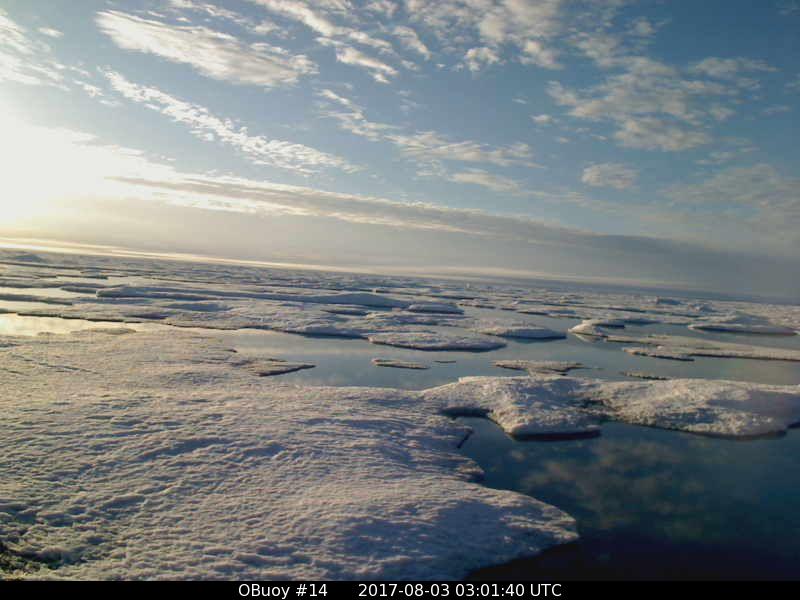
On top of that the old ice around O-Buoy 14 is currently rushing south down the McClintock Channel to replenish it. Here’s how that looks at the moment:
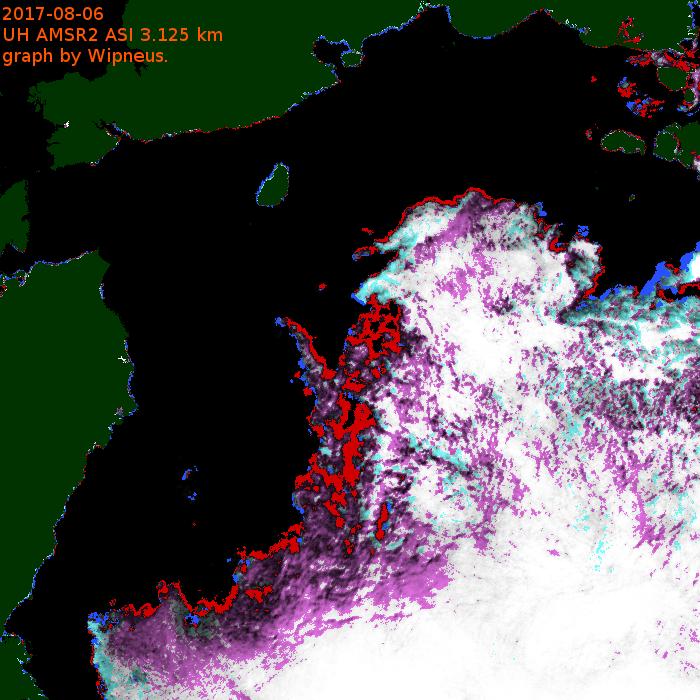
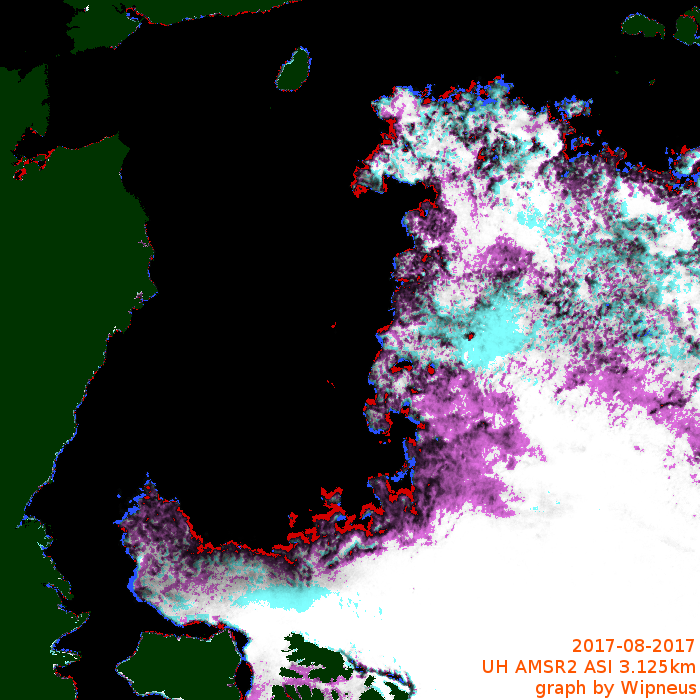
Meanwhile the melt along the Northern Sea Route is well ahead of last year. Here’s the University of Hamburg AMSR2 concentration map of the area:
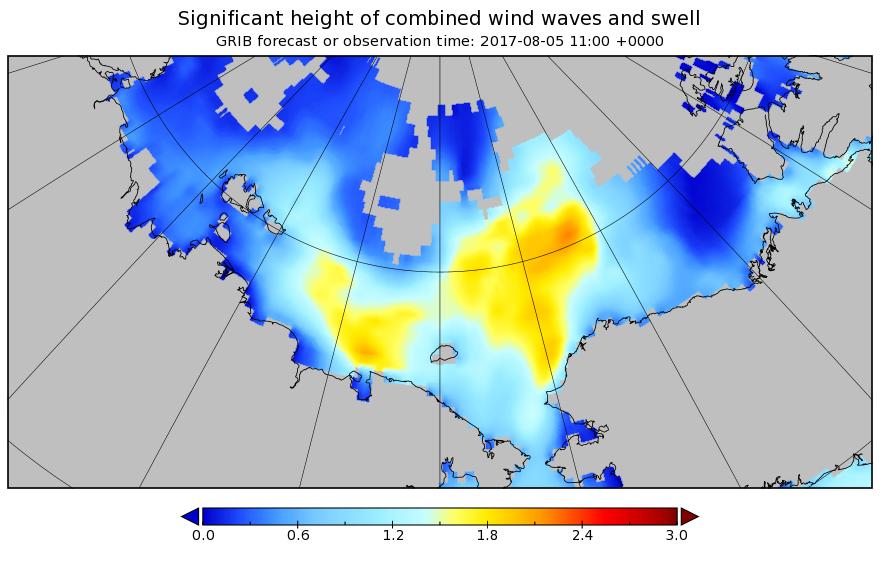
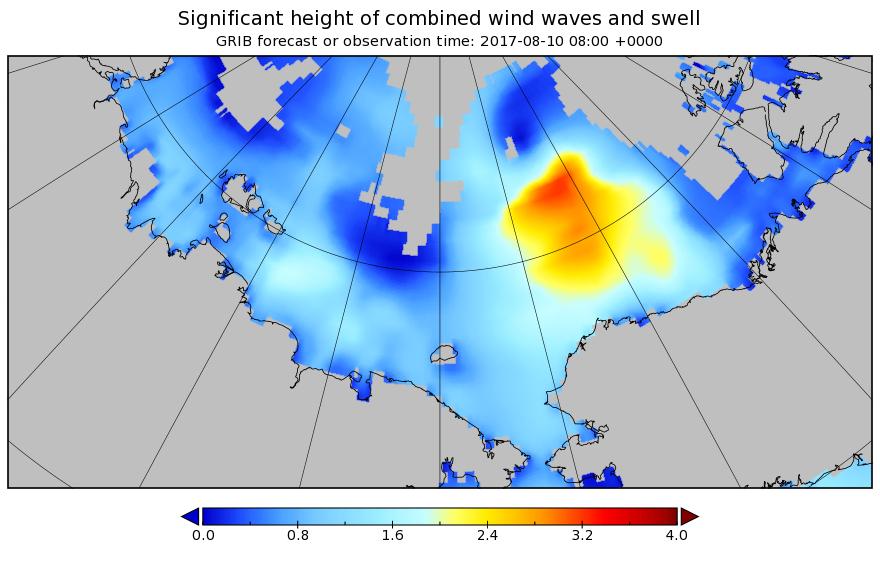
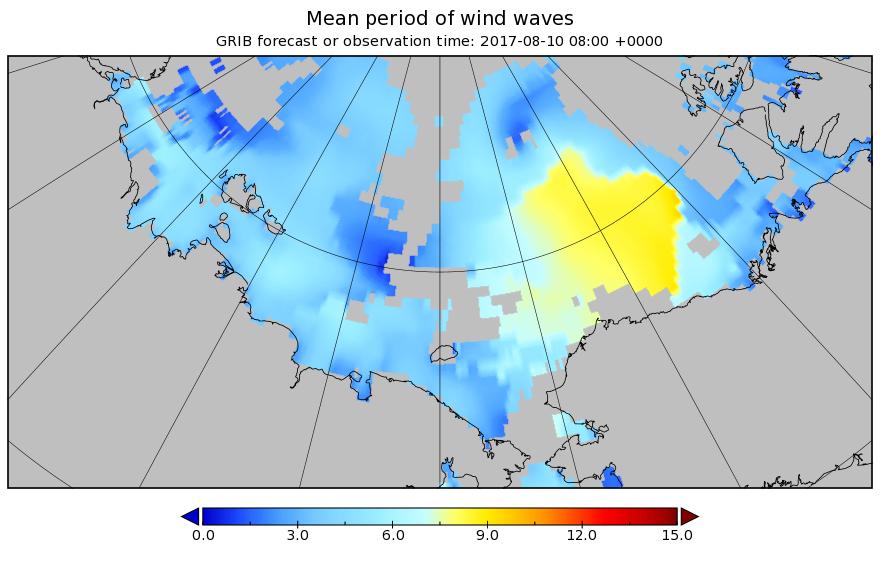
There’s also now a lot of open water on the Pacific side of the Arctic, and Sunday’s cyclone is forecast to create a large area of 2 meter plus waves heading in the direction of the ice edge:
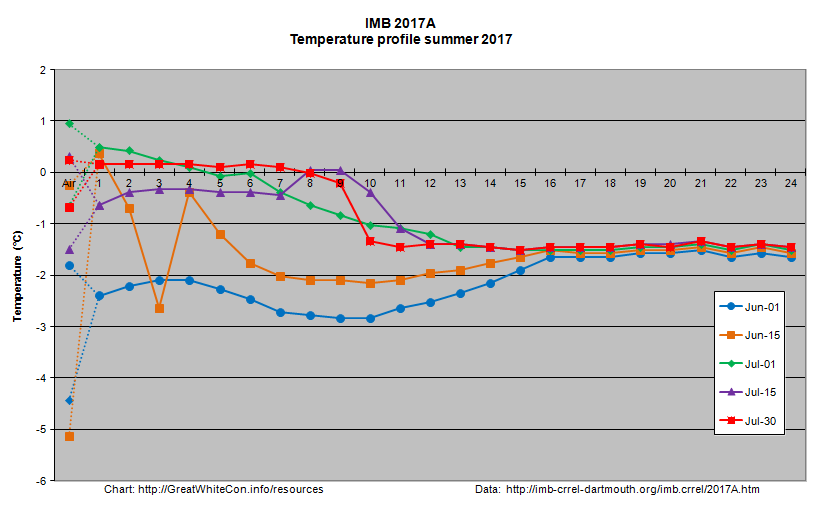
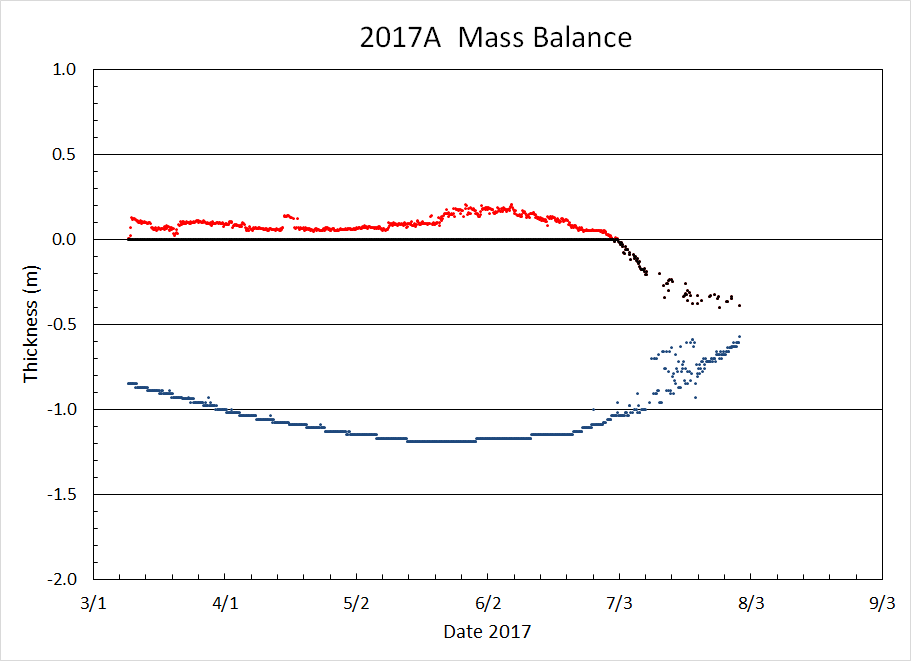
I expect that to have a noticeable effect on the already fragile sea ice by early next week, assuming the storm arrives as forecast! There is an ice mass balance buoy handily placed out on the ice in the path of the storm. Buoy 2017A is currently located near 77 N, 147 W, and its assorted sensors suggest the ice underneath it is now less than 20 cm thick:
Here’s how the area around the buoy looked a couple of weeks ago:
Image of 2017A from WARM 6 on July 18th 2017. NSF project: NSF OPP #1603548
The $64,000 question now is will the 2017 Arctic sea ice metrics stay in amongst the recent pack, or race after 2012 instead?
[Edit – August 6th]
This morning’s synopsis from Environment Canada suggests the cyclone has bottomed out at a MSLP of 982 hPa:
Here’s how the cyclone looked from space yesterday:
NASA Worldview “true-color” image of the sea ice north of the Beaufort Sea on August 5th 2017, derived from the VIIRS sensor on the Suomi satellite
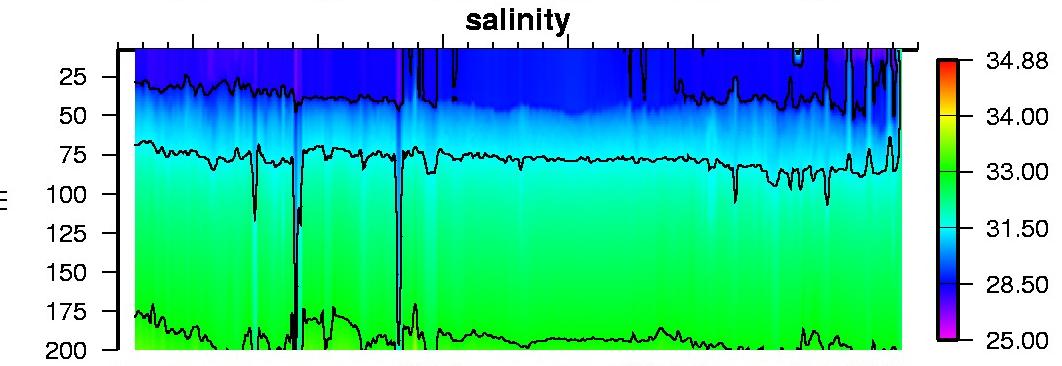
I think that I can convince myself that the salinity profile from ice tethered profiler 97, currently located at 73° N, 134° W, reveals mixing from depth in the wake of the storm:
The synthetic aperture radar on the Sentinel 1B satellite can certainly see through the clouds, and reveals open water in the Central Arctic north of the Beaufort Sea yesterday evening (UTC):
Sentinel 1B image of Arctic sea ice at 79° N, 160° W on August 5th 2017
The effects of this weekend’s storm are readily apparent! Just in case you’re wondering Wipneus reports:
Area: -172.0 (+324k vs 2016, +138k vs 2015, -669k vs 2014, -523k vs 2013, +493k vs 2012)
[Edit – August 8th]
The next pulse of swell is currently forecast to be somewhat higher and longer period than the last one. This one is also taking aim at the Beaufort Sea MIZ:
[Edit – August 9th]
According to Environment Canada the latest cyclone is already down to 980 hPa MSLP:
[Edit – August 9th PM]
The MSLP of the current cyclone is now down to 976 hPA:
The latest WaveWatch III forecast has increased the predicted peak height and period of the resulting waves once again:
[Edit – August 10th]
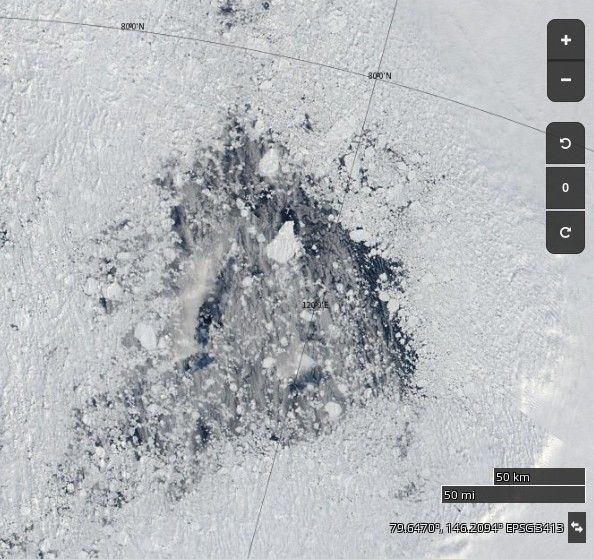
Large holes are appearing in the sea ice on the other side of the Arctic too. Take a look north of the Laptev Sea for example:
NASA Worldview “true-color” image of the “Laptev Bite” polynya on August 10th 2017
Meanwhile the current cyclone on the Pacific side of the North Pole appears to have bottomed out at 974 hPa:
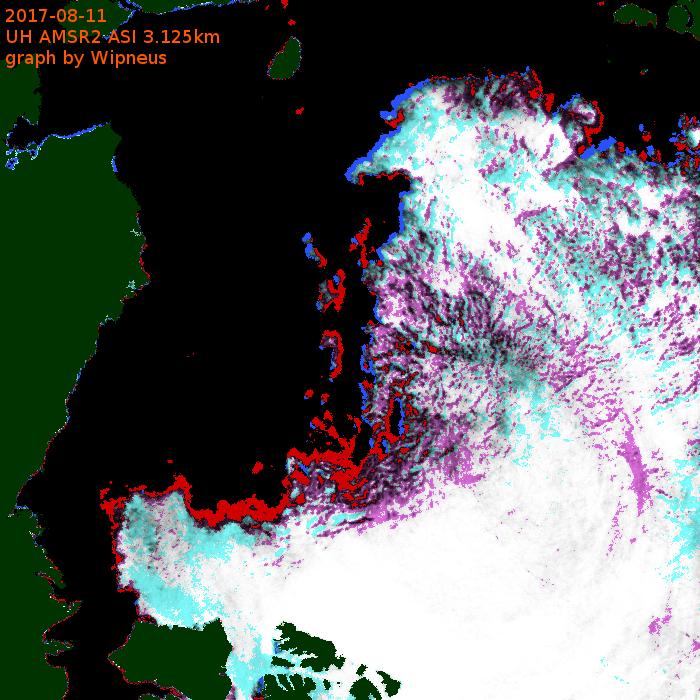
[Edit – August 11th]
Here’s the latest sea ice concentration one day delta map from Wipneus:
Despite the expected divergence caused by a low pressure area crossing the ice, both are and extent of sea ice on the Pacific side of the Arctic are still falling.
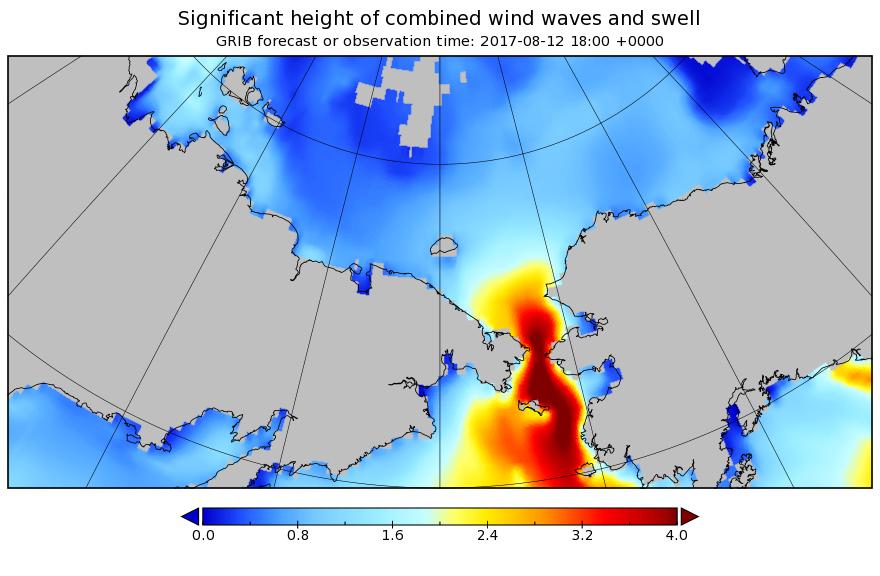
[Edit – August 12th]
The waves are considerably smaller in the Beaufort Sea today, but not in the Bering Strait!
Here’s the latest one day delta map:
and here’s video showing the motion of sea ice in the Beaufort & Chukchi Seas so far this summer:
[Edit – August 13th]
Here’s an animation from Wipneus revealing the effect of the two recent cyclones on the Pacific side, plus everything else that’s been going on in the Arctic:
Click the image to see a much larger (3.3 Mb) version.
[Edit – August 16th]
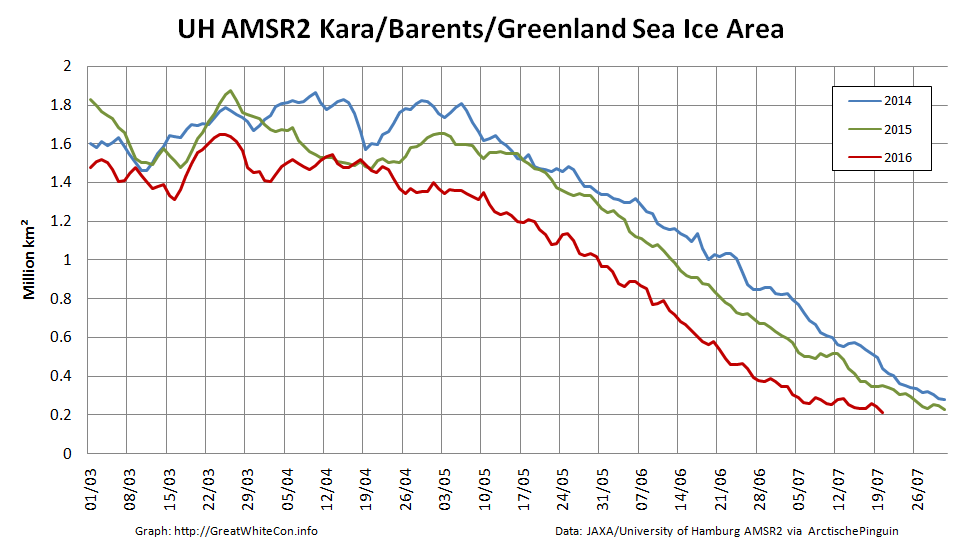
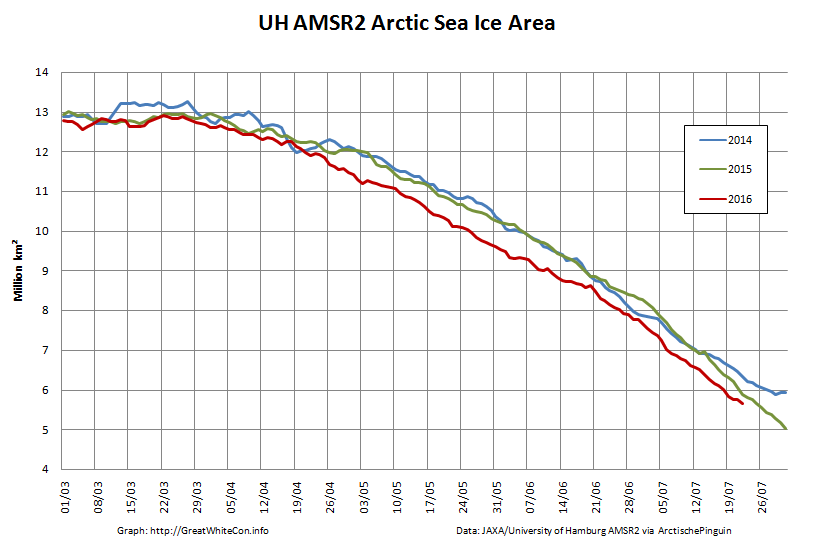
AMSR2 Arctic sea ice extent has taken another tumble, and has dropped below 2016:
Only 2012 left to beat!
[Edit – August 18th]
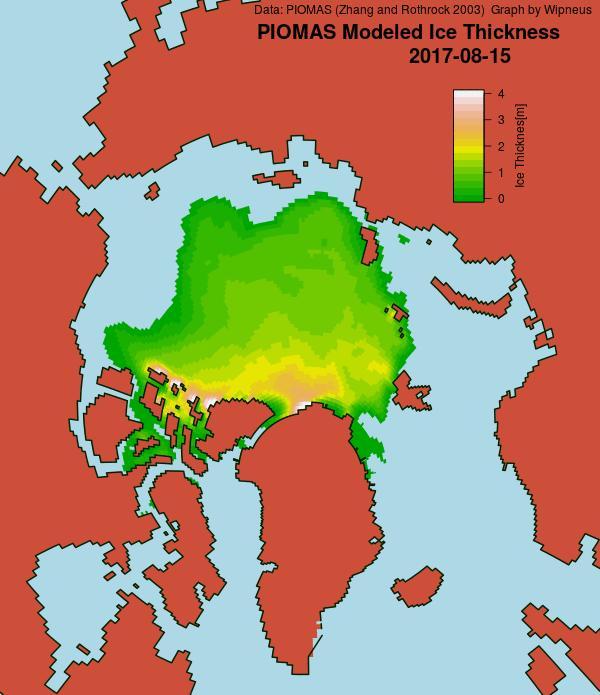
A PIOMAS mid month update has been released, including gridded thickness data. 2017 modelled volume has failed to follow 2012’s trajectory towards the September minimum, and is now on a par with 2011:
[Edit – August 21st]
After a “brief hiatus” in the wake of the recent cyclones Arctic sea ice area has posted a new low for the year:
Extent has yet to follow suit:
The main loss of area has been in the “Beaufort Bite” once again:
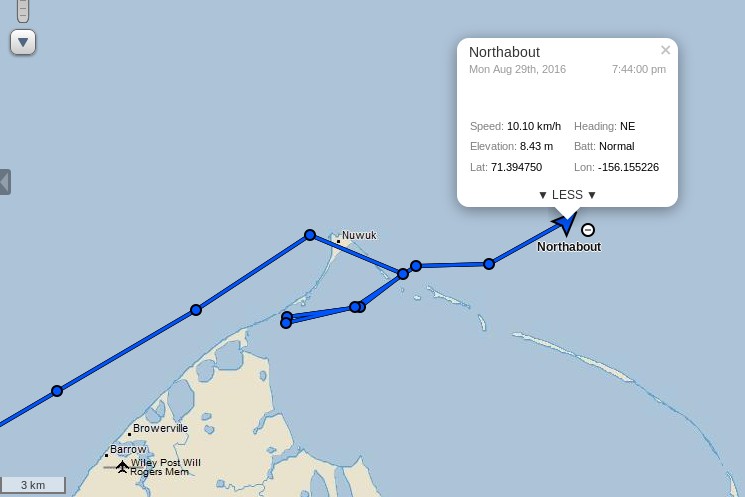
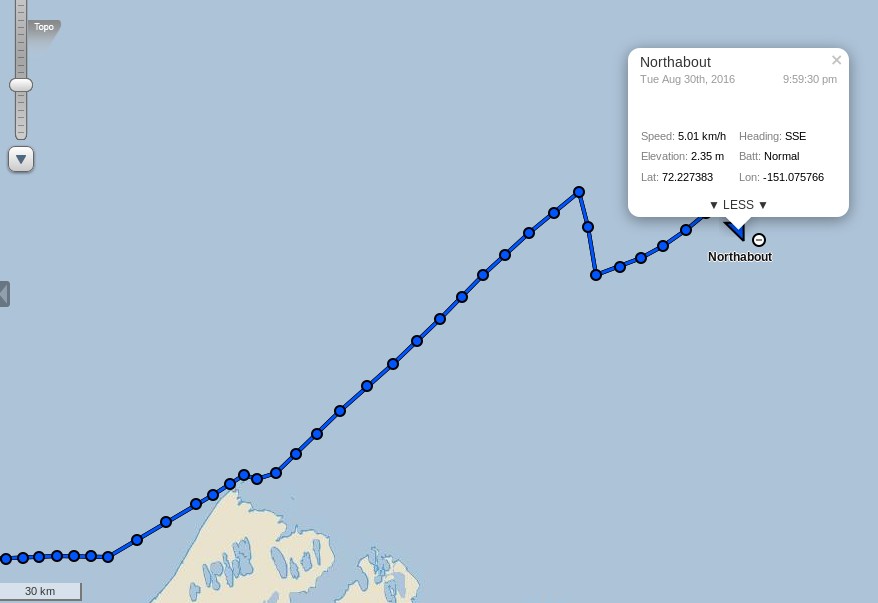
After the briefest of stops in Elson Lagoon behind Point Barrow Northabout is on the move once again:
She’s currently heading out into the Beaufort Sea before following in the giant footsteps of the cruise liner Crystal Serenity in the direction of the Amundsen Gulf and the Canadian Arctic Archipelago. Here’s the United States National Weather Service’s current ice chart for Alaskan waters:
There looks to be far less to worry about ice wise on the next leg of the Polar Ocean Challenge than on the previous one! The weather forecast isn’t too bad either, with high pressure over the Beaufort Sea and a fair bit of sunshine. Here’s the Weather Underground forecast for Ulukhaktok, Crystal Serenity’s first port of call in the CAA:
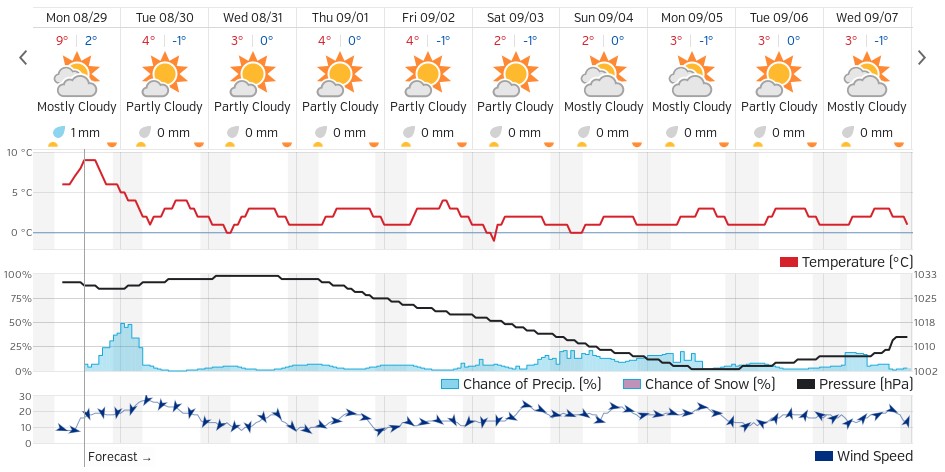
There is currently a “small craft advisory” warning in effect for the Beaufort Sea coast:
CAPE HALKETT TO FLAXMAN ISLAND-
207 PM AKDT MON AUG 29 2016
…SMALL CRAFT ADVISORY IN EFFECT FROM TUESDAY MORNING THROUGH
TUESDAY AFTERNOON…
TONIGHT
E WINDS 20 KT. SEAS BUILDING TO 4 FT.
TUE
E WINDS 25 KT. SEAS 5 FT.
TUE NIGHT
E WINDS 20 KT. SEAS 6 FT.
WED
E WINDS 20 KT. SEAS 6 FT.
WED NIGHT
E WINDS 20 KT. SEAS 5 FT.
THU
NE WINDS 20 KT. SEAS 4 FT.
THU NIGHT
NE WINDS 15 KT. SEAS 4 FT.
FRI
N WINDS 10 KT. SEAS 2 FT.
SAT
N WINDS 15 KT. SEAS 3 FT.
All in all it looks like fairly plain sailing for the foreseeable future, with only occasional moderate headwinds to contend with.
[Edit – August 30th]
It seems my “fairly plain sailing” conclusion was overly hasty. According to the latest “Ship’s Log“:
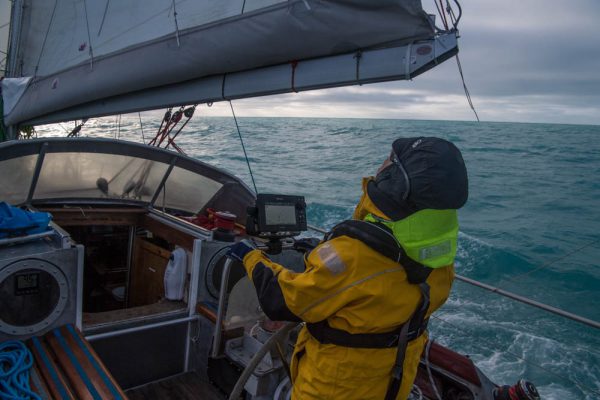
The weather forecast is pants. A 30/35 knot headwind along the coast . No one has the appetite for it, so we are heading North, slacker winds, staysail out, still a choppy sea and uncomfortable, but not as bad as 30 knots. Hopefully no ice tonight on my watch.
This is the end result:
As Phil points out below:
Our next stop along the North West Passage is Tuktoyaktuk. That’s when we can use a pontoon, get rid of our rubbish, fill the tanks, do the laundry and have a shower. 500nm away.
[Edit – August 31st]
The Polar Ocean Challenge team report via Twitter:
They have some more to carry out in Tuk too. Despite the great “groove” displayed above Ben Edwards reports that:
Joy of joys, the auto-helm’s stopped working. Dad (Steve Edwards, crew), thinks he knows why so we’ll hopefully be able to fix it in Tuk. In the meantime we’re back to helming by hand. This is a mixed blessing, on the one hand it’s really irritating to have to helm in large swells and with a strong headwind because any movement you make is at first ignored, and then exaggerated by, the wind. So it’s hard to keep a decent track and it makes it harder to look out for ice. On the other hand, moving and putting effort into the steering keeps you warm which is nice and it means you don’t have to put as many clothes on which is also nice because when you go down stairs and it’s twenty four degrees it can get quite uncomfortable.
We all had our job lists, ice lights, bilge pumps, laundry, shopping but the man who gets the Vodka Salute is unquestionably Steve.
I dropped him off wth Willard. Two peas in a pod. They made a broken Pilot Spigot. That sounds quite easy but it took the whole day in a machine shop in a container, working to fine tolerances, and many modifications. Fitting it in the bowels of the Lazzerette in cold weather and driving rain. It worked first time. Brilliant effort.
Issued 07:00 AM MDT 04 September 2016
Today Tonight and Monday
Wind – Northwest 15 knots diminishing to light late this morning then becoming northwest 15 Monday morning.
Waves
Seas – 1 metre.
Weather & Visibility – Chance of showers changing to periods of rain near noon then to chance of showers tonight and Monday. Fog patches dissipating early this evening.
My famous last words? Plain sailing by the look of it!
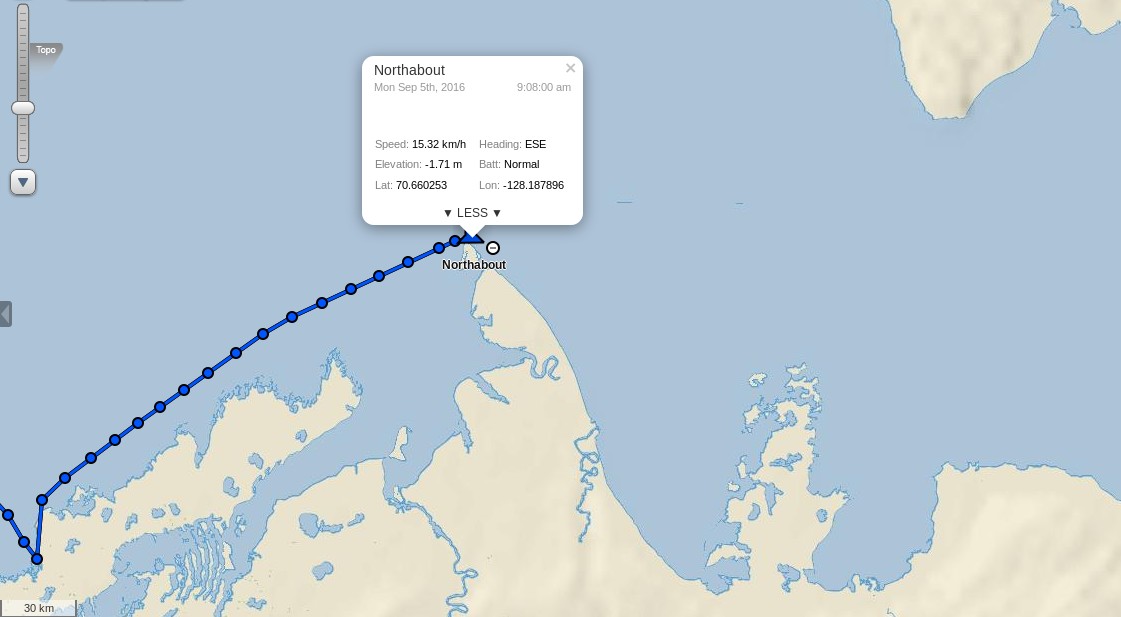
[Edit – September 5th]
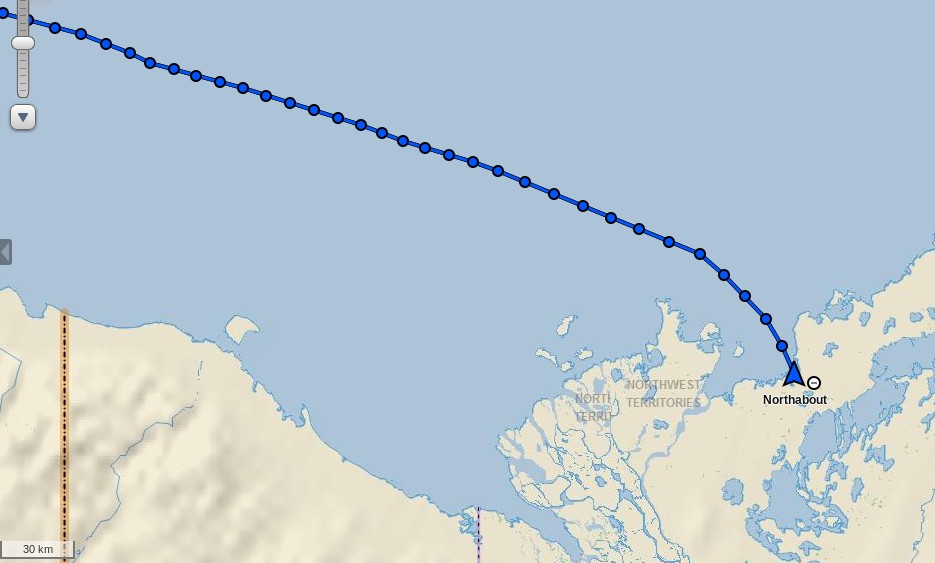
Northabout has just rounded Cape Bathurst, the northernmost point of mainland Northwest Territories:
I wonder if her crew will take a close look at the nearby Smoking Hills?
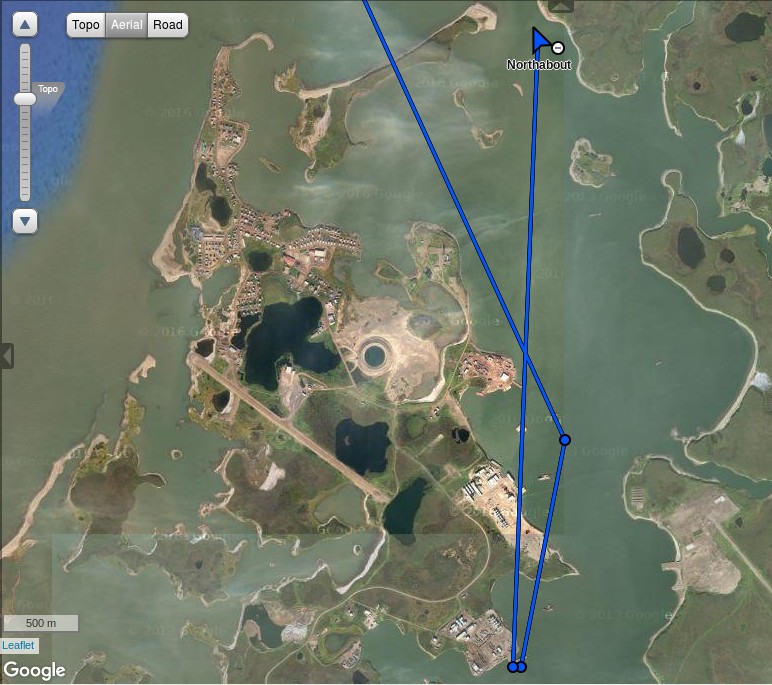
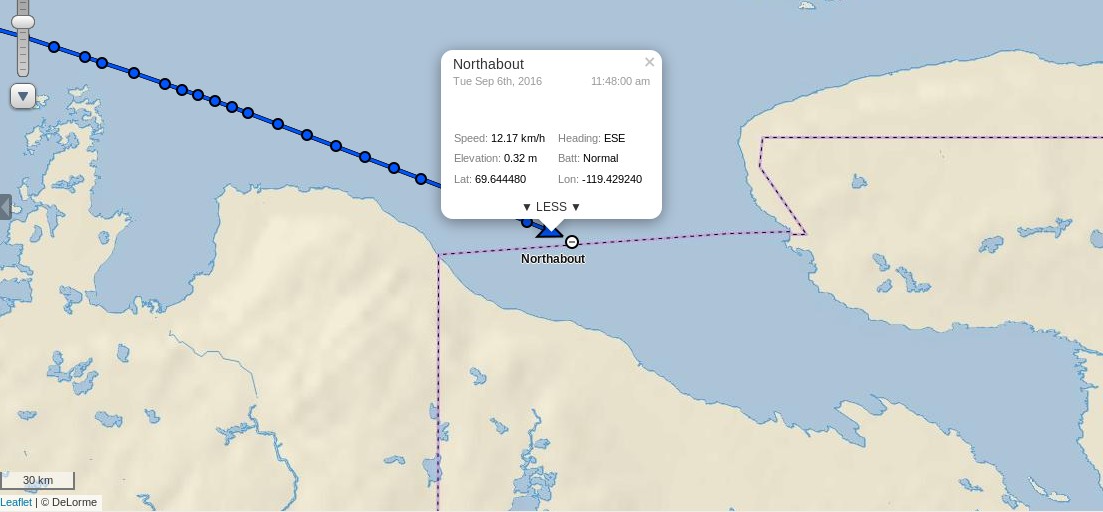
[Edit – September 6th]
Northabout gave the Smoking Hills a miss and headed strait for Cape Parry. She has already crossed the Amundsen Gulf and is heading into the Dolphin & Union Strait:
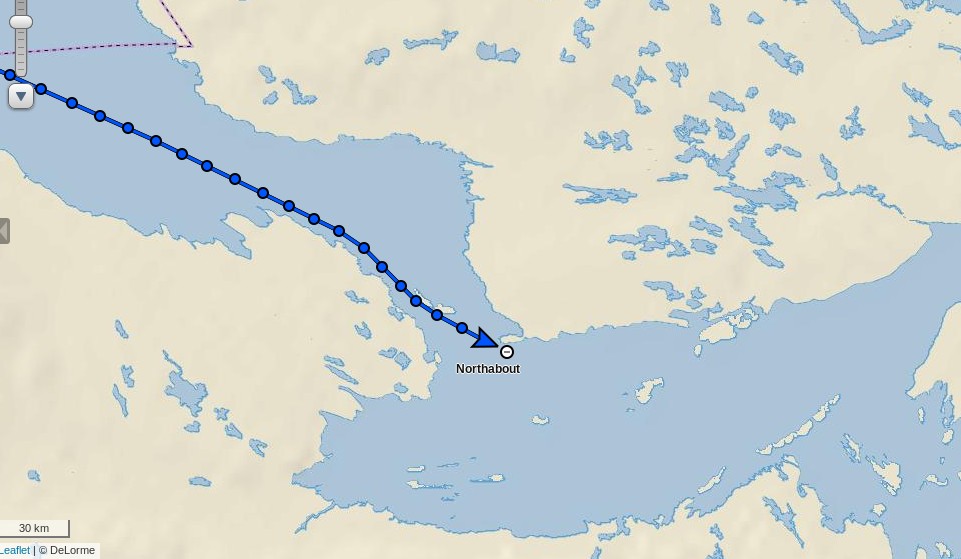
In light of the lack of ice and in the spirit of saving time we’ve decided not to stop in Cambridge Bay or Pond Inlet and go straight on to Upernavik in Greenland before doing our crew change. Looking at the ice maps at the moment it seems we’ll be able to get through with little or no trouble, though this is almost bound to change, if it stays that way we’ll reach Upernavik in about fourteen days. I’m looking forward to it!
This morning Northabout is rapidly approaching the western entrance to Bellot Strait:
Their stated intentions are to head past Pond Inlet and across Baffin Bay to Upernavik in Greenland. Assuming they initially follow the same route as Crystal Serenity they will soon to need to pick their way past some bergy bits in Prince Regent Inlet before negotiating some currently “wispy” areas of sea ice as they enter Lancaster Sound. Here is the current Canadian Ice Service chart for the area:
plus a rather cloudy “visual” image:
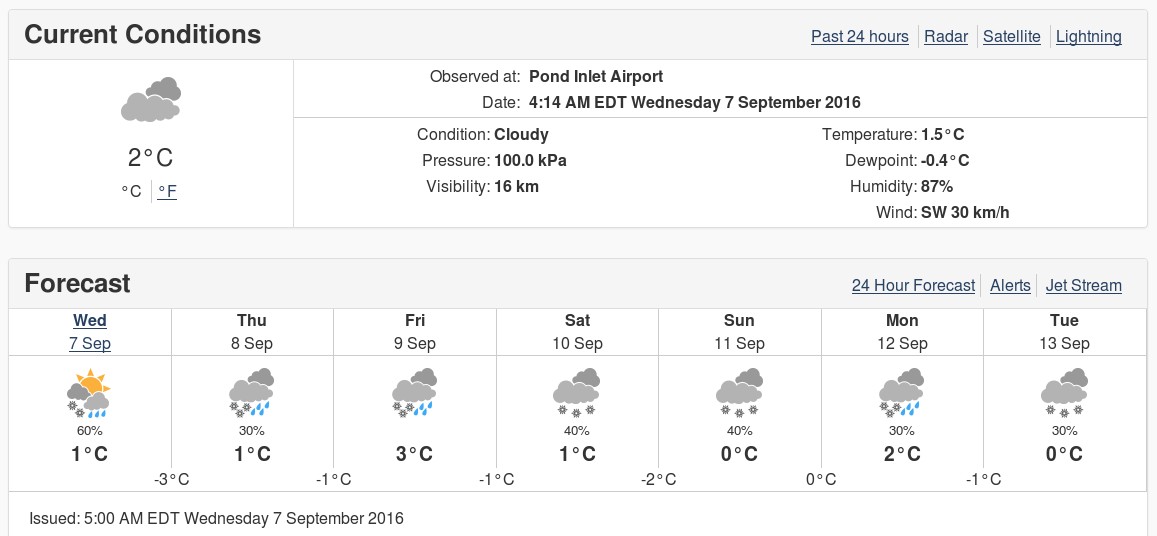
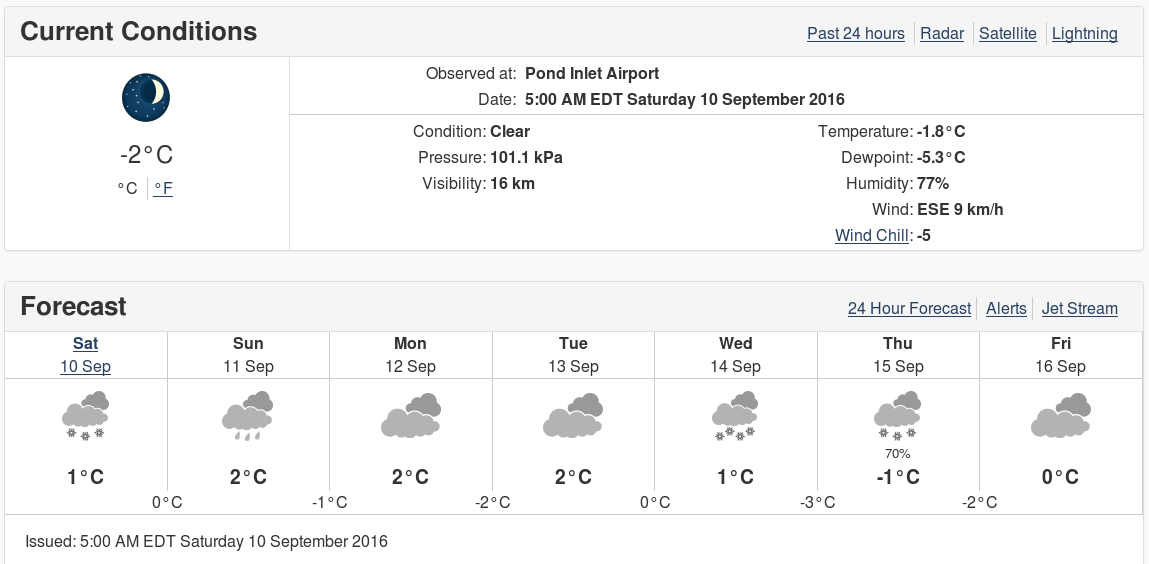
The current weather forecast for Pond Inlet doesn’t suggest the parts of the Northwest Passage still on Northabout’s route are going to start refreezing just yet:
Currently there is an obvious passage past the existing ice, but that may of course have changed by the time Northabout gets there.
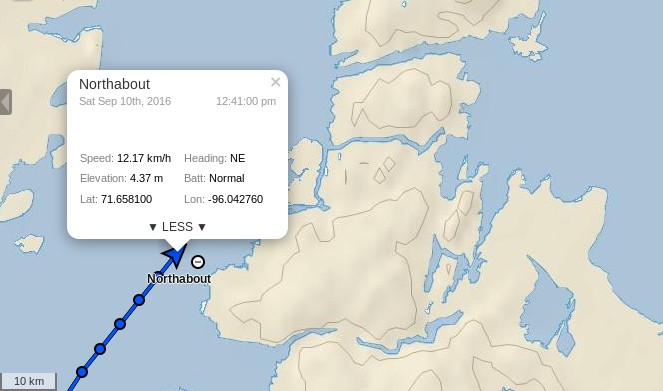
[Edit – September 10th PM]
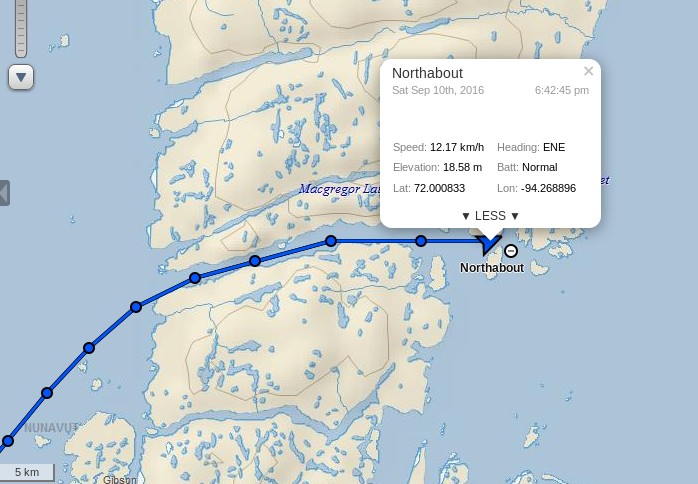
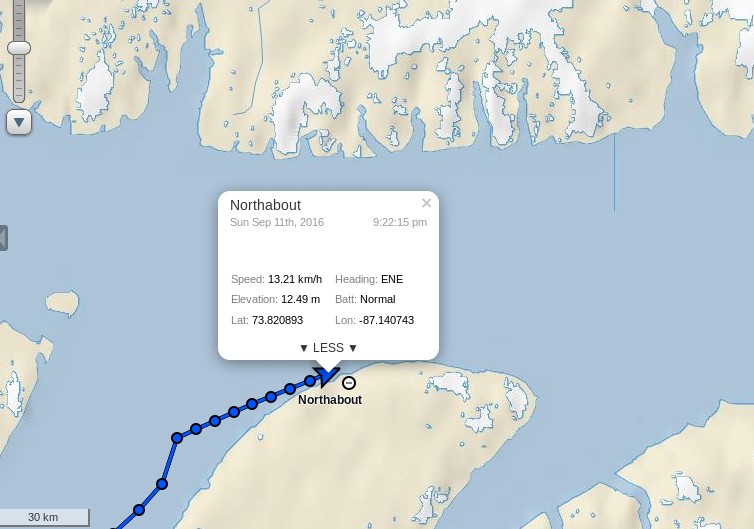
Northabout has just emerged safely from the eastern end of Bellot Strait:
I wonder if her crew will stop to make a new entry in the visitors book at Fort Ross?
[Edit – September 11th]
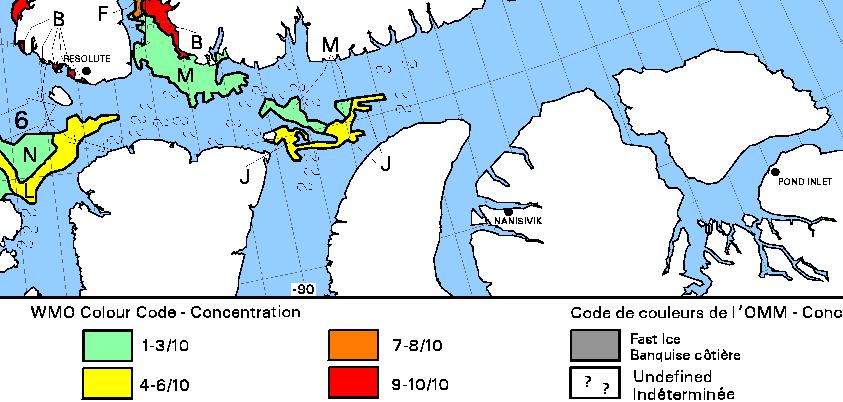
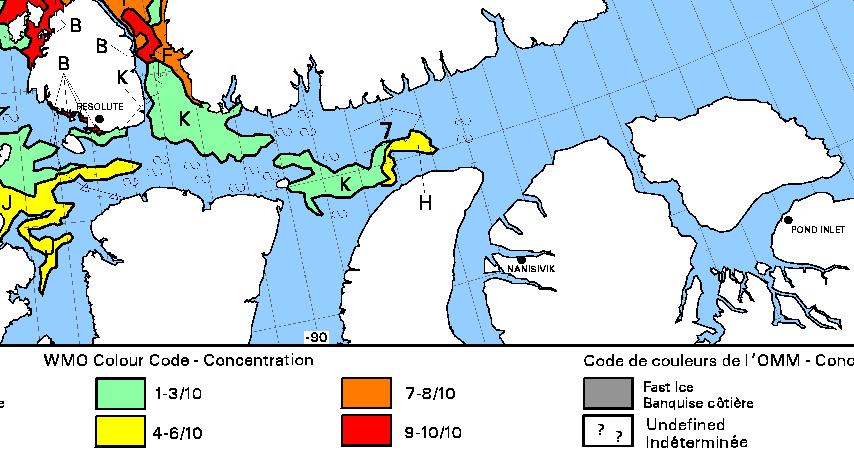
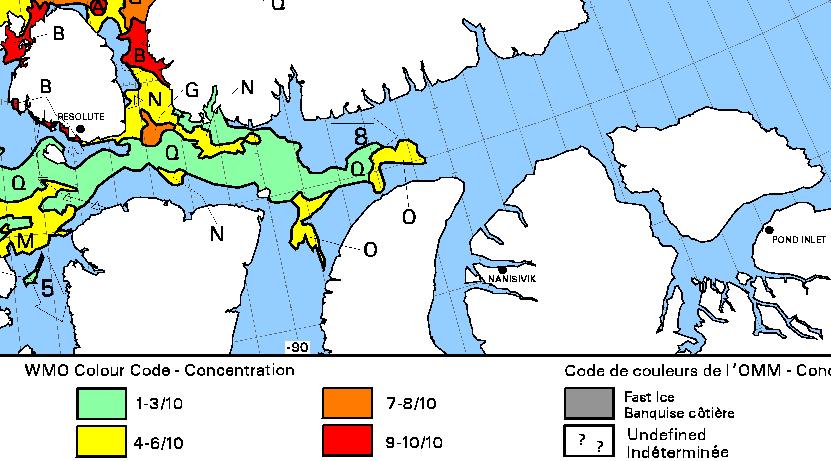
Here’s the latest CIS ice chart:
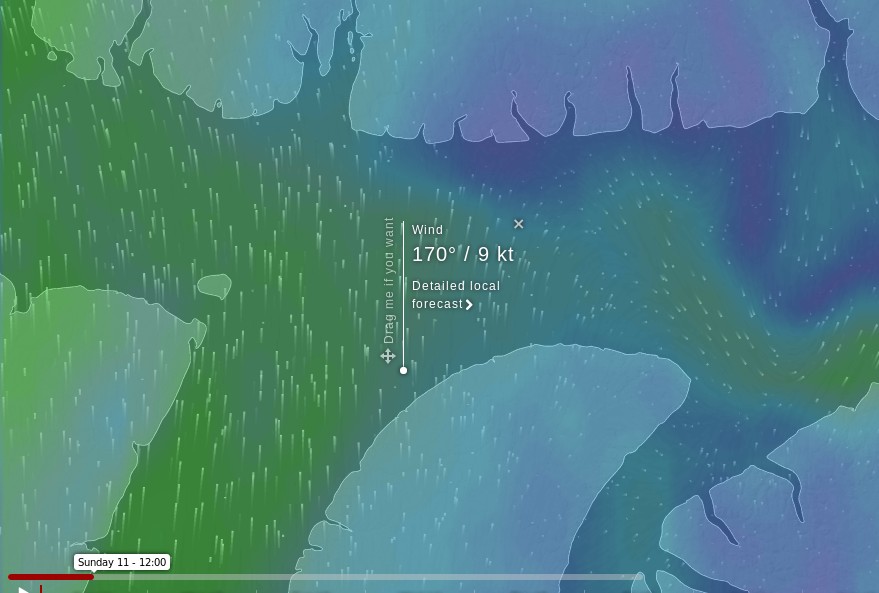
The gap between the coast and the yellow area of 4-6/10 concentration ice has closed considerably, and there’s now a broad expanse of 1-3/10 ice which Northabout may be forced to try and wend her way through. A change in wind direction would come in very handy, and that’s just what the ECMWF forecast at Windyty is suggesting for Sunday 11th:
Just what the doctor ordered?
[Edit – September 11th PM]
Video shot from Northabout’s drone of her ice-free passage through Bellot Strait:
However the passage from Prince Regent Inlet into Lancaster Sound has not proved to be ice-free!
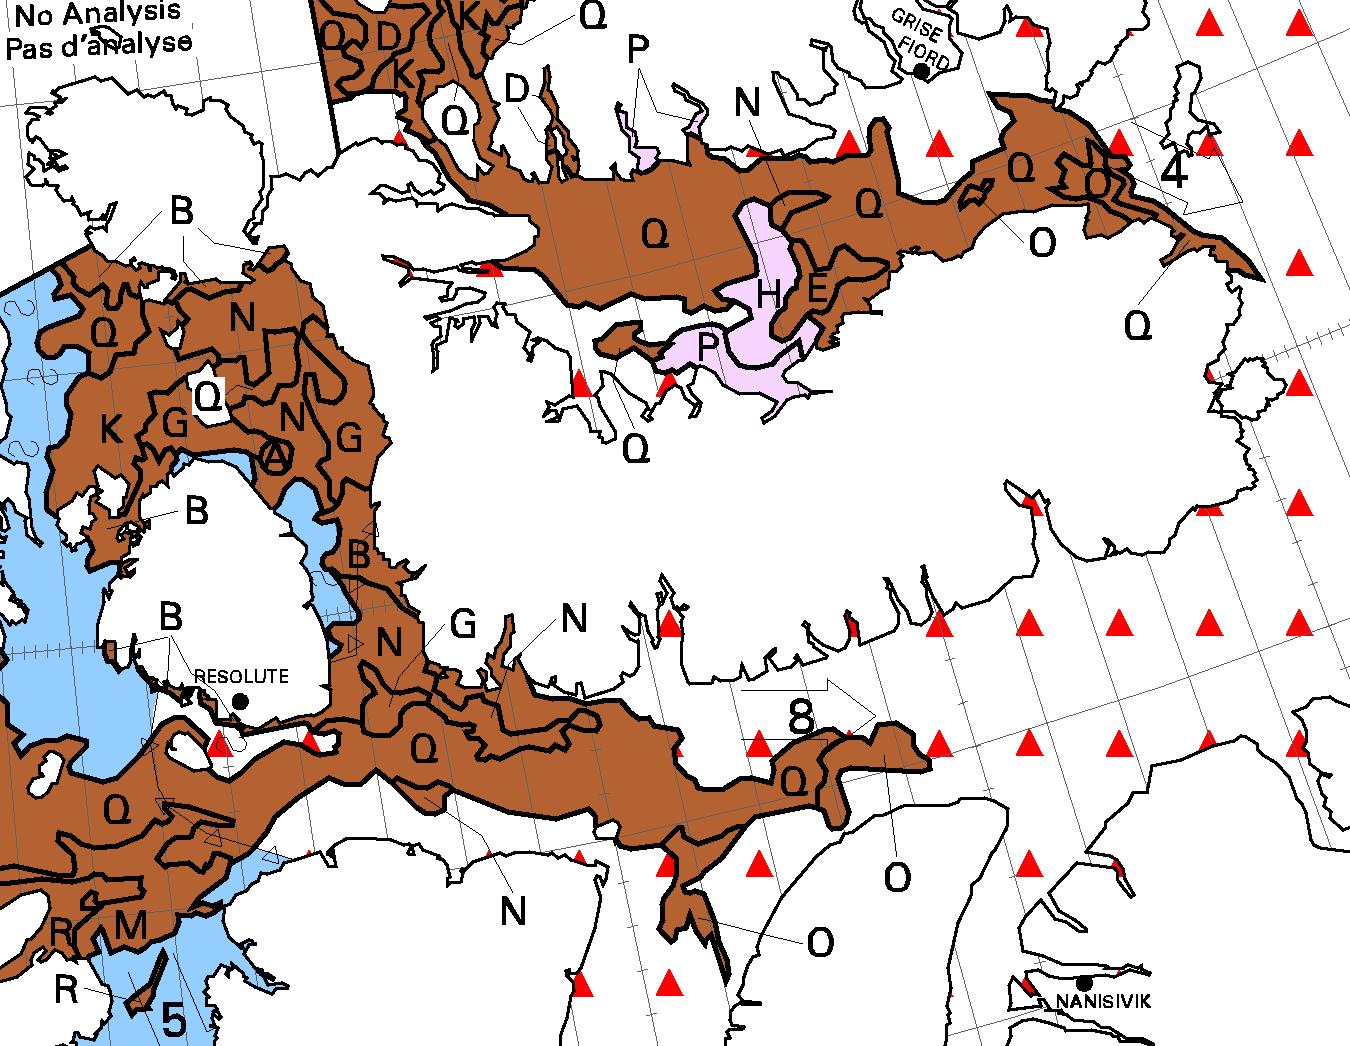
Northabout is obviously endeavouring to skirt around the eastern edge of the 4-6/10 old ice in her path:
Today’s CIS ice concentration chart suggests there isn’t much room to spare:
The stage of development chart does reveal some new ice, but it’s well to the north of Northabout’s route through Lancaster Sound to Pond Inlet:
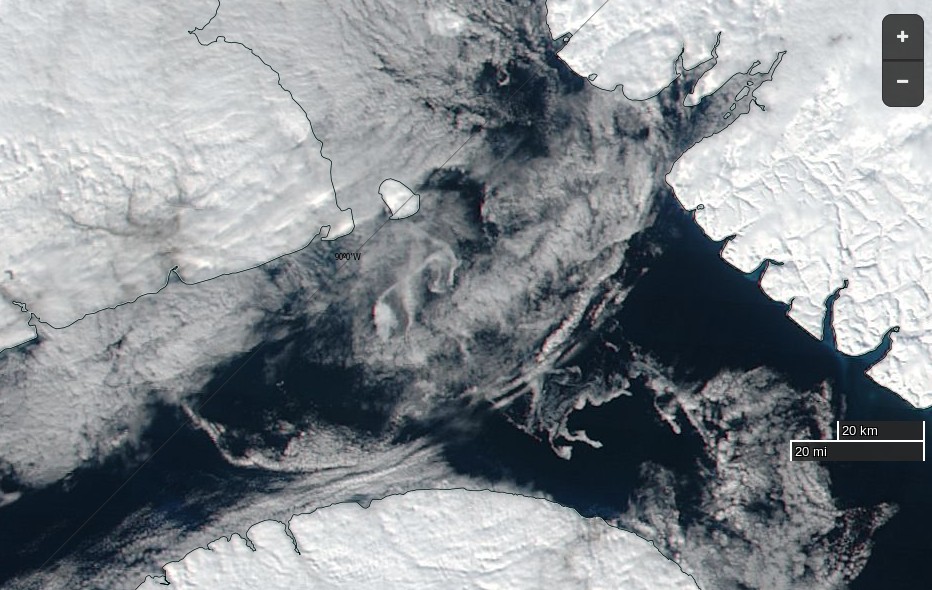
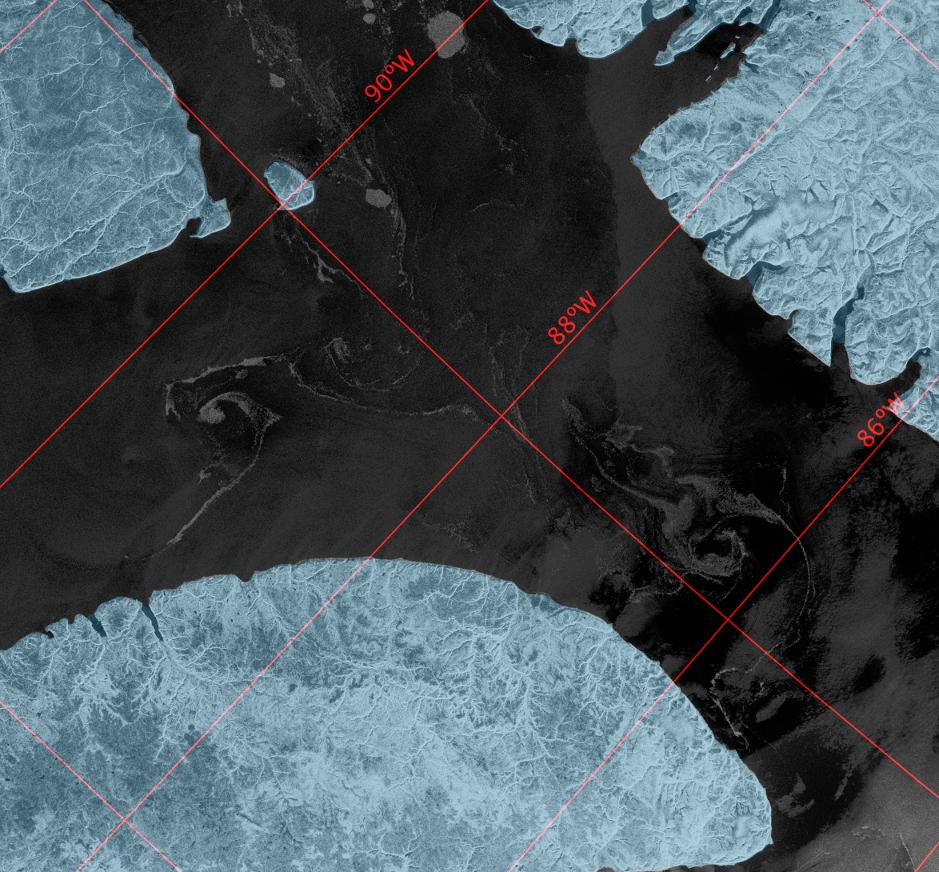
Somewhat belatedly, here’s a Sentinel 1A synthetic aperture radar image of the sea ice Northabout is squeezing past as we speak:
[Edit – September 12th]
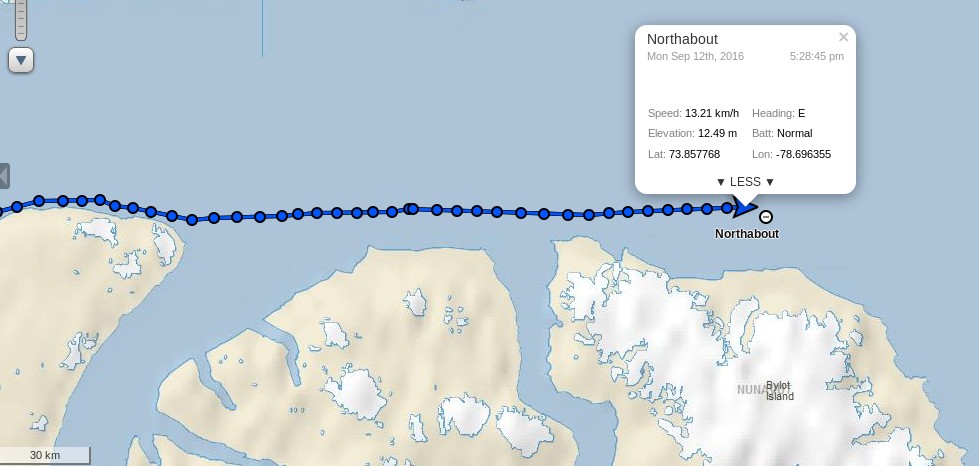
Northabout has emerged safely into Lancaster Sound, and is bypassing Pond Inlet in order to head strait across Baffin Bay:
Here are a couple of videos of some remnants of sea ice on her once again eastward travels:
There are several more on the Polar Ocean Challenge web site.
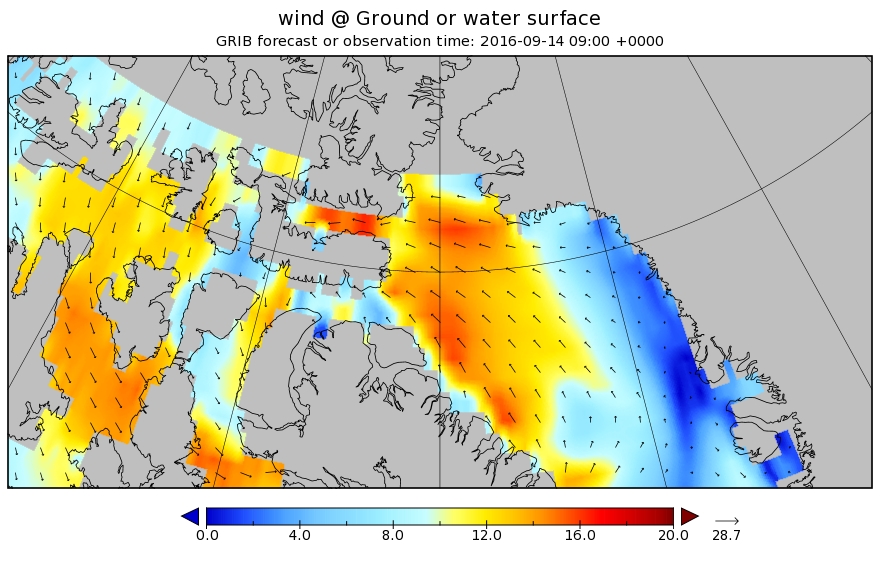
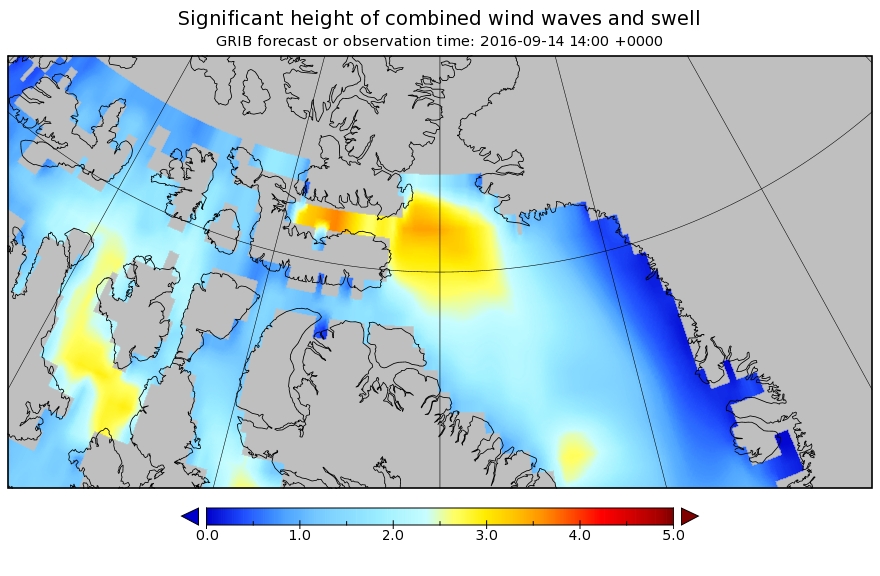
With all that ice now safely behind her Northabout has new dangers to face. Wind and waves! Let’s take a look at the WaveWatch III “surf forecast” for Baffin Bay over the next few days. A low pressure area is heading in Northabout’s direction from across the Canadian Arctic Archipelago. By Wednesday morning (UTC) the resultant wind field looks like this:
By Wednesday afternoon those winds of around 15 m/s will have produced waves in Baffin Bay that are forecast to have reached over 3 meters high:
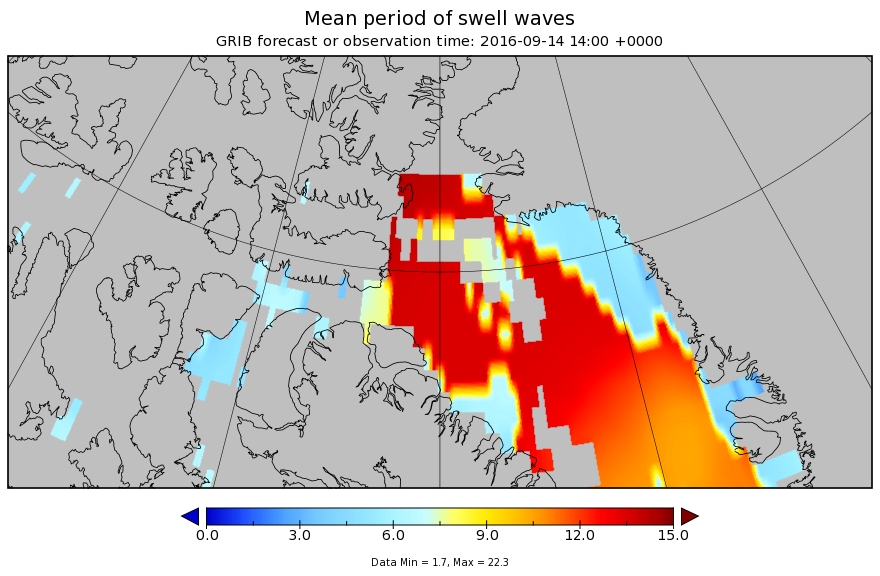
and what’s more they won’t be just wind waves. A modest swell with a period of over 12 seconds is predicted too:
I’m sure the Polar Ocean Challenge team will be doing their level best to be safely on the opposite side of Baffin Bay by the time the worst of the weather arrives!
According to the old saying “A change is as good as a rest”, so rather than plagiarise today’s title from a “skeptical” web site we’ve invented this one all by ourselves. Northabout is a small yacht with big ideas. (S)he wants to circumnavigate the North Pole in one summer season. However certain cryoblogospheric commenters are somewhat skeptical that this can be achieved this year. Take Tony Heller for example:
There has been very little melt going on in the Arctic Ocean the last few days, due to cold cloudy weather.
A group of climate clowns were planning on sailing around the entire Arctic Ocean through the Northeast and Northwest Passages (to prove there isn’t any ice in the Arctic) but are stuck in Murmansk because the Northeast Passage is completely blocked with ice.
The “group of climate clowns” aboard Northabout that Mr. Heller refers to are led by David Hempleman-Adams. According to the Polar Ocean Challenge web site:
David is one of the most experienced and successful adventurers in the world.
In his forty years as an adventurer, David was the first person to reach the highest peaks on all seven continents and journey fully to the North and South Geographical and Magnetic Poles. He has broken forty-seven Federation Aeronautique Internationale ballooning records
My name is Tony Heller. I am a whistle blower. I am an independent thinker who is considered a heretic by the orthodoxy on both sides of the climate debate.
I have degrees in Geology and Electrical Engineering, and worked on the design team of many of the world’s most complex designs, including some which likely power your PC or Mac. I have worked as a contract software developer on climate and weather models for the US government.
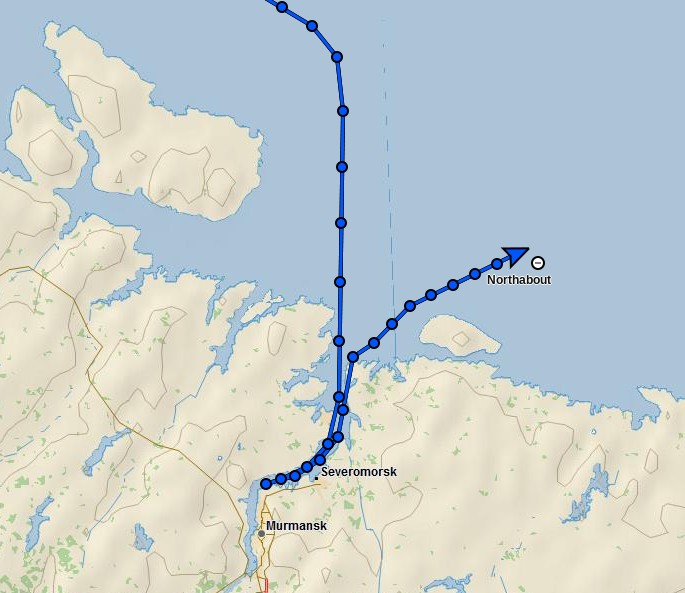
However despite Tony’s long list of qualifications he is evidently currently quite confused, since according to the Polar Ocean Challenge live tracking map David and Northabout are not in actual fact “stuck in Murmansk” at all:
This shouldn’t come as surprise to anyone with an internet connection and a desire to check the facts, since as we speak there is currently remarkably little sea ice cover on the Atlantic side of the Arctic Ocean:
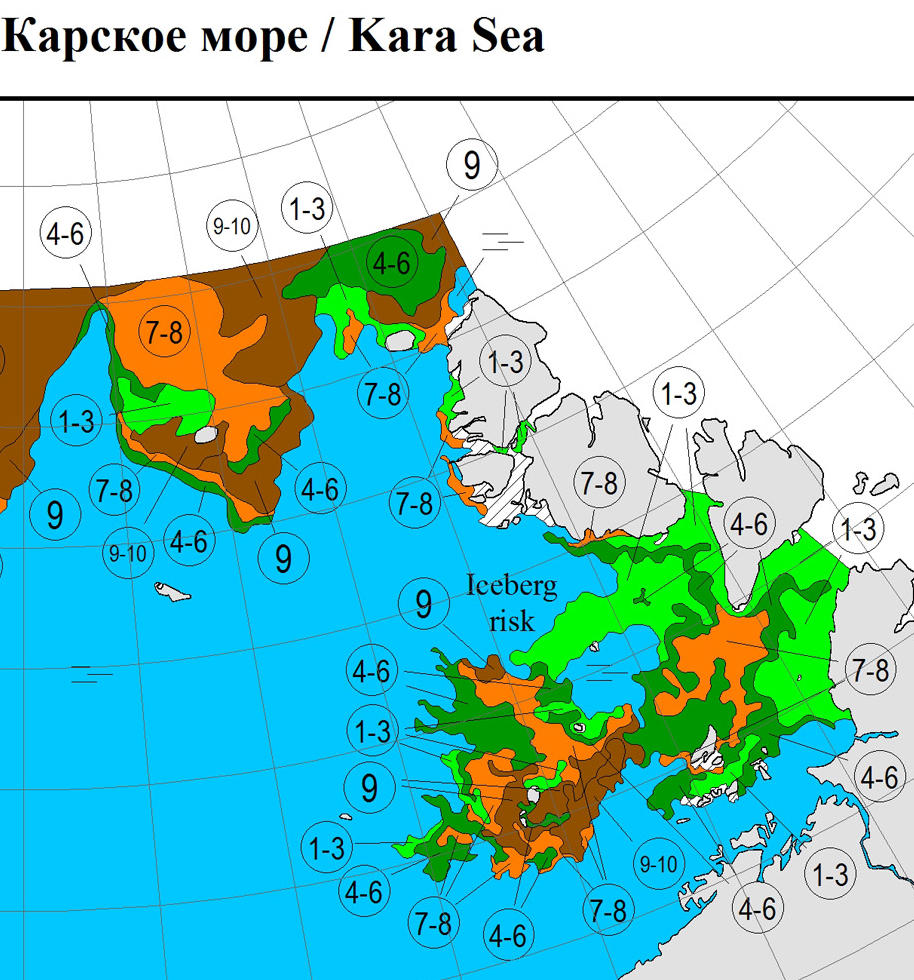
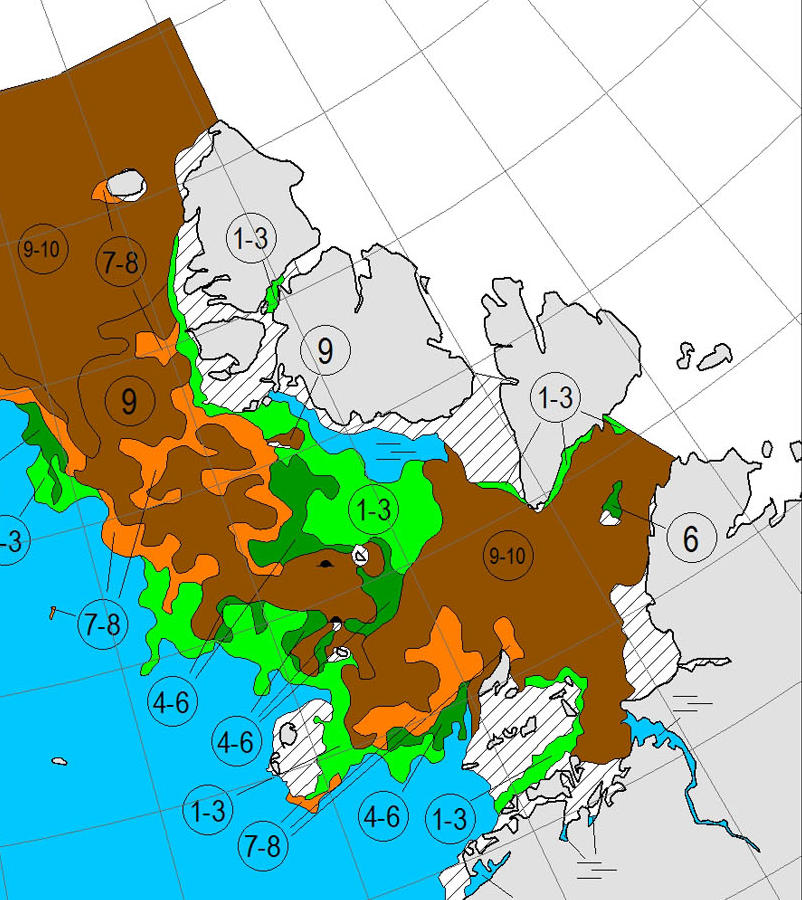
Hence Northabout should find the next leg of his/her voyage across the Barents and Kara Seas pretty plain sailing. However Vilkitsky Strait, the passage from the Kara into the Laptev Sea, is currently looking a trifle tricky:
NASA Worldview “true-color” image of the Vilkitsky Strait on July 20th 2016, derived from the MODIS sensor on the Terra satellite
Do you suppose Tony Heller suffers from precognitive dreams?
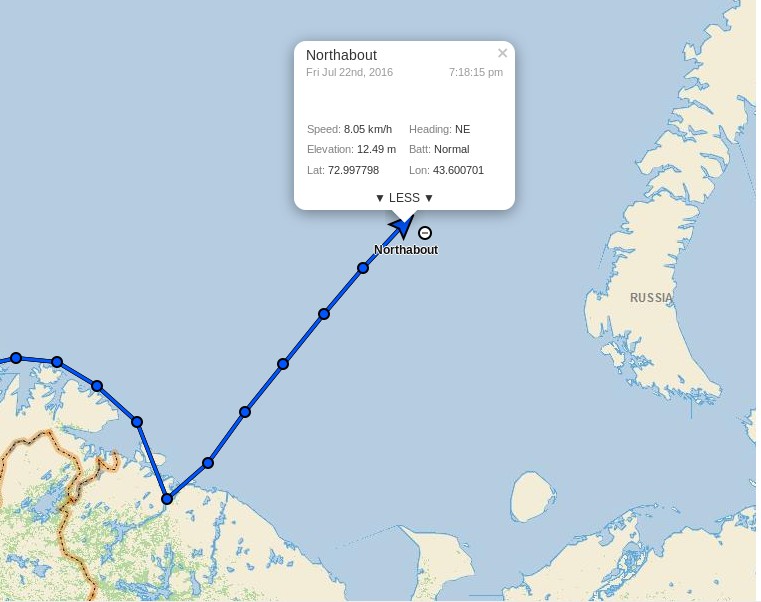
[Edit – July 22nd 2016]
According to Environment Canada this morning there’s a 988 hPa central pressure cyclone causing a bit of a blow in the Vilkitsky Strait at the moment:
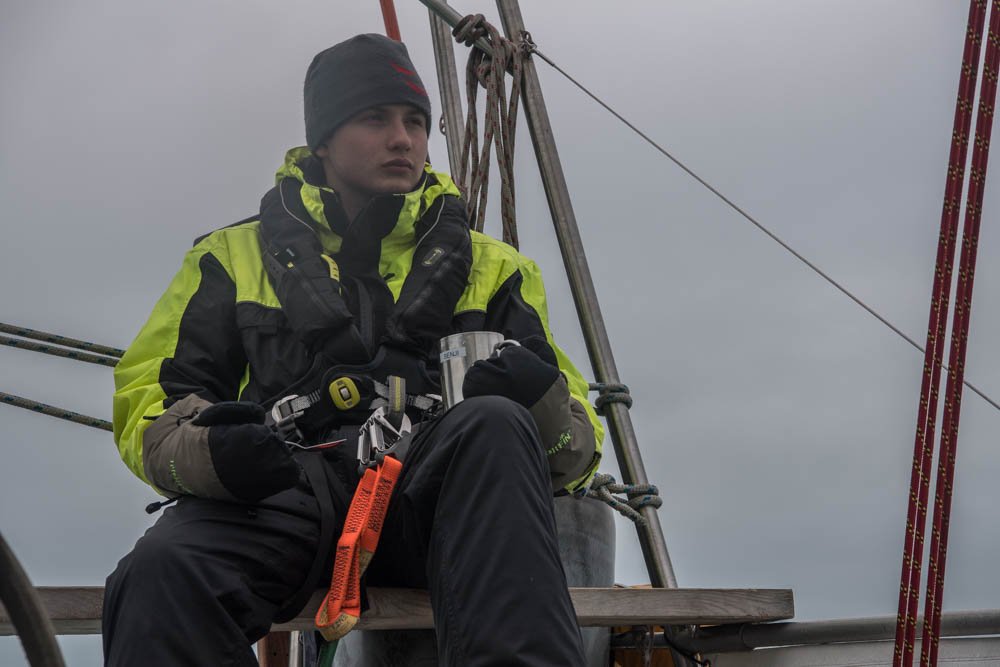
Sea and air temperature getting colder as we venture further north. Saw quite a lot of Dolphins for the first time around the Yacht. Still sea gulls flying behind and skimming the waves.
Had some promising Canadian ice charts yesterday, but that’s a long way off. Today we should get an update with the Russian side. fingers crossed it is still not solid around the cape and Laptev sea. That could slow us down considerably. The wind has been blowing the pack ice against the land, so very difficult to get around the shore, but let’s see what Santa brings.
P.S. Maintaining his usual modus operandi, Tony Heller has penned a new article today, containing a satellite image remarkably similar to the one just above. Under the headline “The 2016 Franklin Expedition” he tells his loyal readership:
The Polar Ocean Challenge is headed off into the ice.
They will run into this in three days – hundreds of miles of solid ice. Without an icebreaker, they are going nowhere. I asked them on Twitter if they have an icebreaker. I haven’t received a response, and will be monitoring them by satellite to see if they are cheating.
By some strange coincidence we’re “monitoring them by satellite” too:
As for ice melt, yet another totalitarian propaganda expedition intended to “raise awareness” of climate “catastrophe” by trying to sail around the Arctic in the summer has just come a cropper owing to – er – too much ice. Neither the North-East Passage nor the North-West Passage is open, so the expedition is holed up in – of all ghastly places – Murmansk. That’ll teach Them.
However my corrective comment has yet to see the light of day at WUWT:
Meanwhile Northabout resolutely presses on regardless, and has just passed 74 degrees North:
whilst the sea ice edge in the north-eastern Kara Sea has retreated somewhat over the last three days:
NASA Worldview “true-color” image of the Vilkitsky Strait on July 23rd 2016, derived from the MODIS sensor on the Terra satellite
Here’s the July 20-22nd AARI map of the Vilkitsky Strait area:
On the topic of Arctic sea ice melt in general Viscount Monckton opines over on WUWT that:
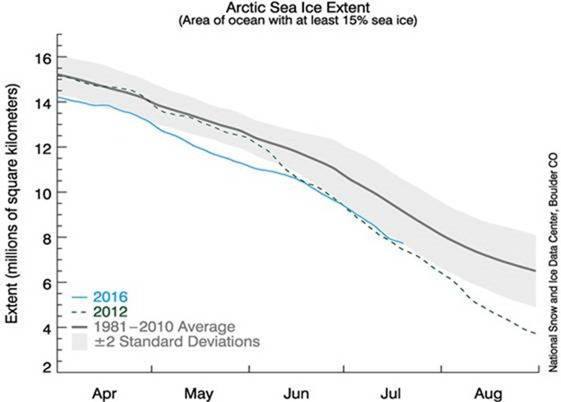
According to the National Snow and Ice Data Center’s graph, also available at WUWT’s sea-ice page, it’s possible, though not all that likely, that there will be no Arctic icecap for a week or two this summer:
Even if the ice disappears for a week or two so what? The same was quite possibly true in the 1920s and 1930s, which were warmer than today in the northern hemisphere, but there were no satellites to tell us about it.
The Good Lord seems to have a very tenuous grasp on reality, since the NSIDC’s graph shows nothing of the sort. Perhaps he is merely indulging in irony?
[Edit – July 24th 2016]
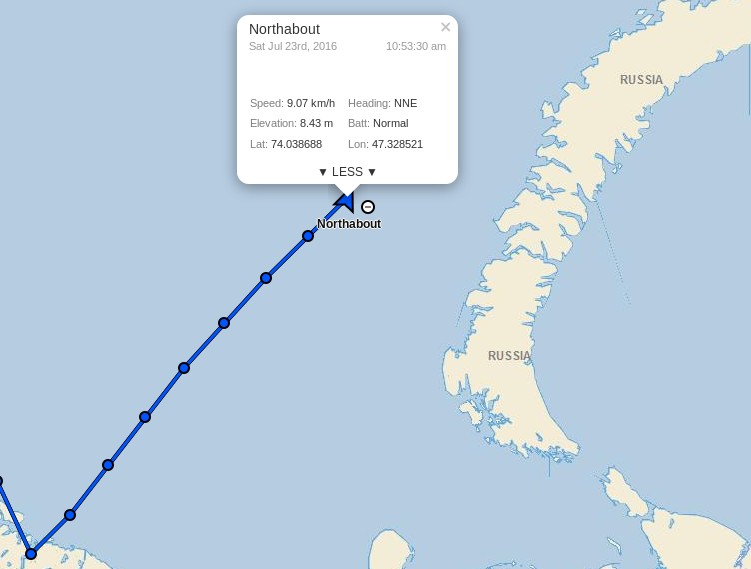
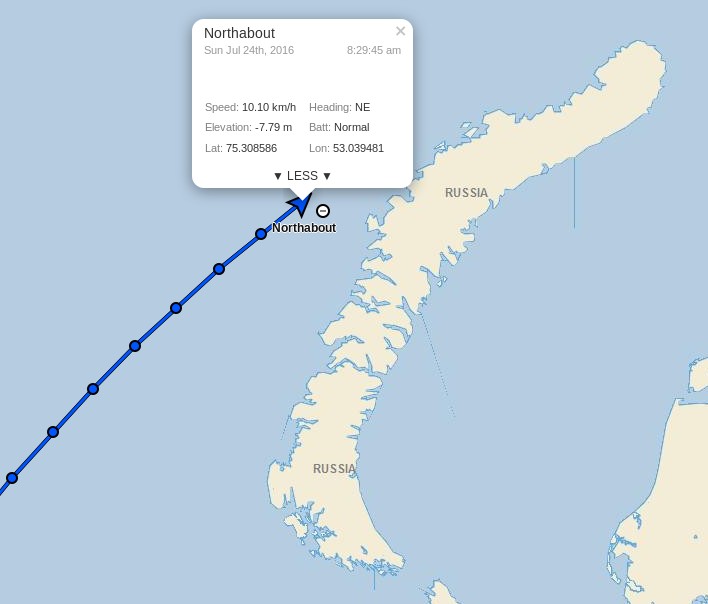
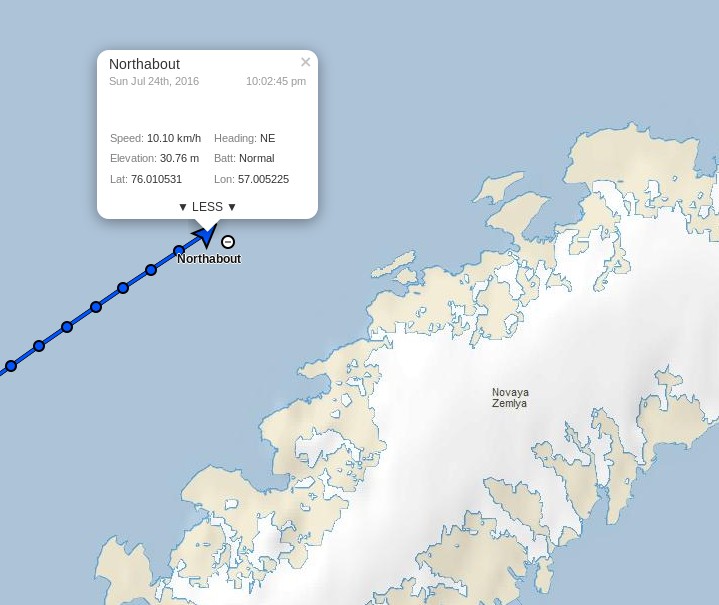
Northabout passed the 75 degrees North milestone overnight:
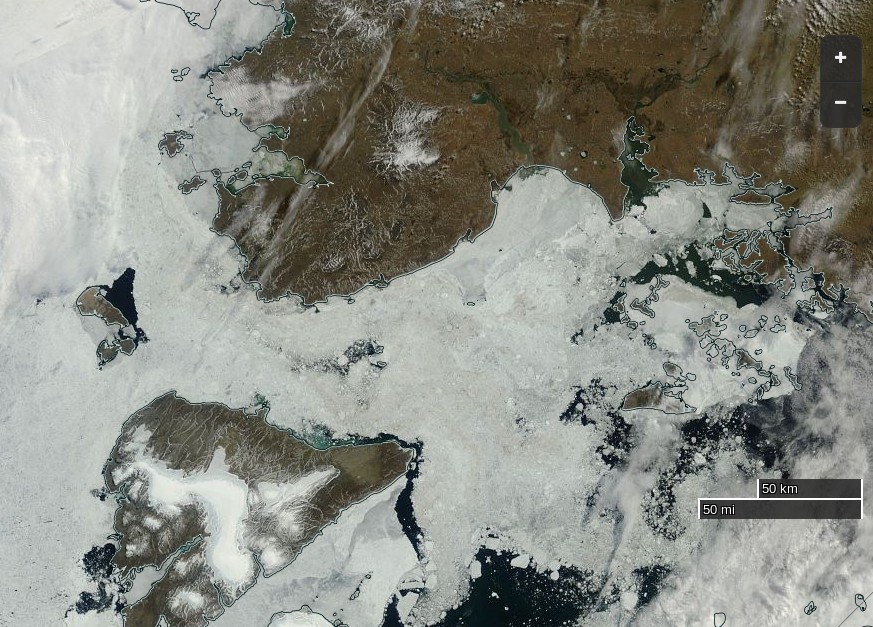
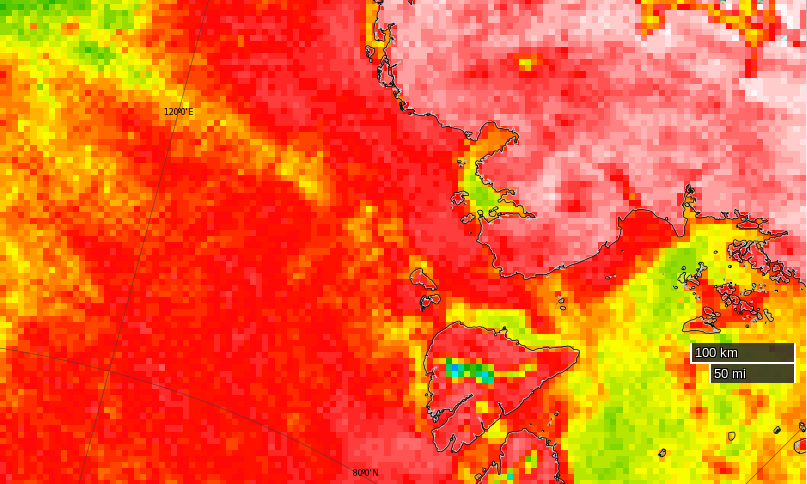
Clouds obscure the Vilkitsky Strait in visible light this morning but passive microwaves make it through the murk, albeit with reduced resolution. They reveal the sea ice edge in the Kara Sea receding and a narrow passage opening up along the Northern side of the Strait (North is down in the image):
NASA Worldview passive microwave image of the Vilkitsky Strait on July 24th 2016, derived from the AMSR2 instrument on the Shizuku satellite
According to Ben Edwards’ latest blog post from the Barents Sea:
I just wore a T-shirt on my first watch out of Murmansk. Today I wore my trawler suit and a primaloft under it with gloves and a hat….
As the cryodenialosphere continue to retweet and reblog their regurgitated rubbish here’s a picture from last year of Northabout amidst some ice, especially for those apparently unable to distinguish a small yacht from a large icebreaker:
Meanwhile Arctic sea ice continues its inexorable decline:
[Edit – July 24th 2016 PM]
Shock News! Tony Heller has just published yet another article about Northabout’s Great Adventure, and yours truly gets a mention. In the headline no less!! Read all about it at:
Meanwhile the commenters over at unReal Science keep blathering on about icebreakers even though one of the more inquisitive denizens posted thisextract from the “Ship’s Log” over there yesterday:
Partly checked the new ice charts on www.nsra.ru, we still have no chance of getting through yet, not past the cape or through the Laptev sea. Nikolai, Our Russian Captain who is very familiar with this route, impresses on me that this is a very unusual year and normally clear, Not what I want to hear. We are under sail, so saving fuel, and will find a small island to shelter until we get improvements. We are still 5 days from the ice, so lets hope for some southerly winds to push the ice from shore.
Northabout is heading for the Kara Sea past the northern tip of Novaya Zemlya, and has now passed 76 degrees North:
[Edit – July 25th 2016]
The skies are still cloudy over the Vilkitsky Strait and Cape Chelyuskin, so here’s another AMSR2 passive microwave visualisation of the state of play. Note the change of scale:
NASA Worldview passive microwave image of the Vilkitsky Strait on July 25th 2016, derived from the AMSR2 instrument on the Shizuku satellite
The sea ice area in the Laptev Sea has finally started decreasing at a more “normal” rate for late July, but still has a lot of catching up to do compared to recent years:
Meanwhile over at “Watts Up With That” at least one reader of Christopher Monckton’s purple prose is clearly confused. Needless to say my clarifying comment is still invisible to him:
Finally, for the moment at least, here’s some moving pictures of dolphins having fun in the Barents Sea:
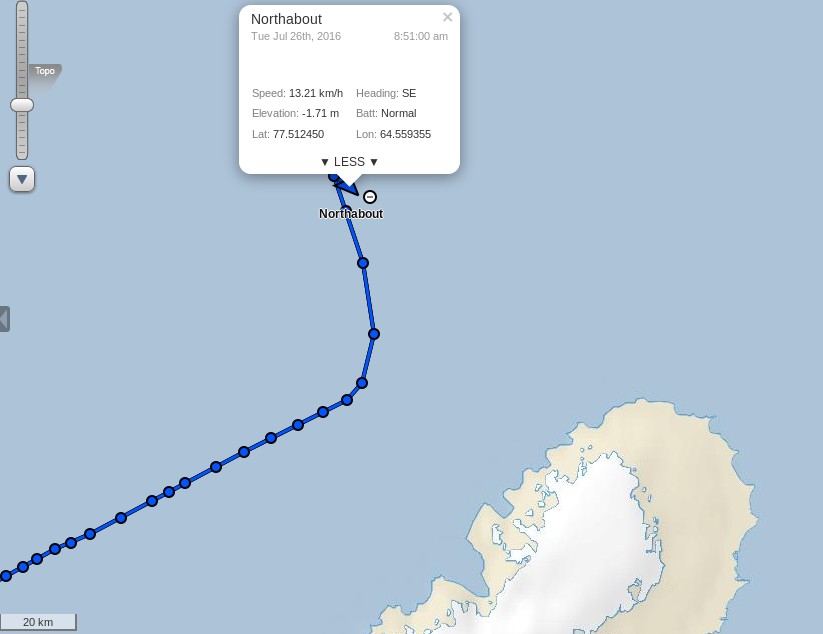
[Edit – July 26th 2016]
I was expecting Northabout to have entered the Kara Sea by now, but instead (s)he has headed north, and is now well above the 77th parallel:
It’s still pretty cloudy up there so here once again is the latest AMSR2 passive microwave visualisation of the Vilkitsky Strait area, with a few place names added for a bit of variety:
NASA Worldview passive microwave image of the Vilkitsky Strait on July 26th 2016, derived from the AMSR2 instrument on the Shizuku satellite
P.S. The Polar Ocean Challenge team explain via Twitter:
@GreatWhiteCon Ha ha! Thanks for interest! Waiting game, manoeuvring, strategy. Difficult to update in choppy conditions! New SHIPSLOG now
— PolarOceanChallenge (@PolarOceanChall) July 26, 2016
Choppy sea, taking four hour tacks. These sea conditions make it hard to sleep, cook or relax.
We are considering many elements all the time. We are due new Russian Ice charts today.
We know the North west is pretty clear, but this year is a very unusual year in the north east passage. Normally the Laptev Sea would be pretty open now as in previous years. It is not. This is also partly due to the wind blowing the pack ice down south and consolidating next to the land.
So, we need to get through the straight and through the Laptev Sea. So where do we wait until we can do this? We have deliberately taken our time to get to this point, and used the wind as much as we can to conserve fuel.
Now the weather has changed, the wind direction has also changed. From the calm turquoise seas, to choppy short seas, wet, windy and cold.
So we took a long tack north, and then tacked east again. There is No hurry. We will slowly make our way east, and if we can find an island with no fast ice around, will look for a sheltered spot, until we get better ice conditions.
The other options are to Heave to and wait, but this is a sailing Yacht, she needs to sail. And if we get a Southerly blow, it could change our chances very quickly to get around, so we need to be close to react.
So, another day at the office.
There was a report on the BBC Radio 4 Today programme this morning from the crew of Northabout, and an interview with Dr. Ed Blockley from the UK Met Office about the current state of sea ice in the Arctic:
Note in particular the part at 2:59:00 where Justin Webb says to Ed:
I thought that I’d read somewhere that [Northabout] had got stuck.
I cannot help but wonder what on Earth gave him that idea?
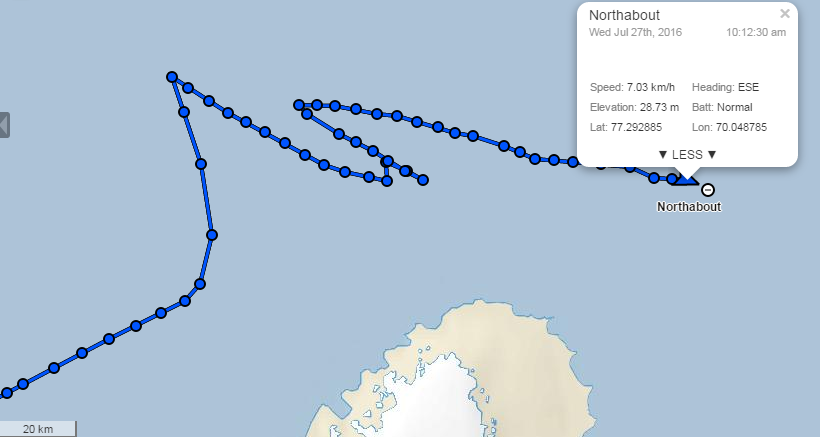
[Edit – July 27th 2016]
After “going round in circles” north of Novaya Zemlya yesterday Northabout is now heading East across the Kara Sea:
Synthetic aperture radar images from the European Space Agency’s Sentinel 1A satellite have started flowing through Polarview once again, so here’s one of where Northabout is heading:
Sentinel 1A synthetic aperture radar image of the Vilkitsky Strait on July 26th 2016
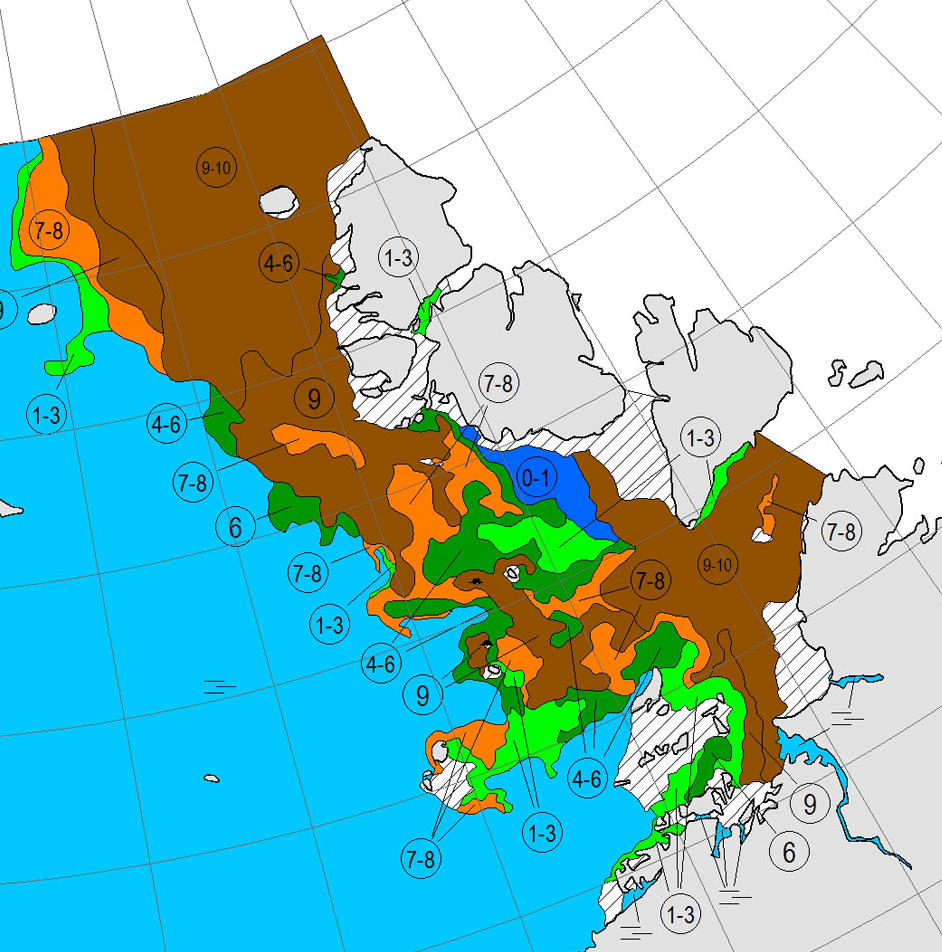
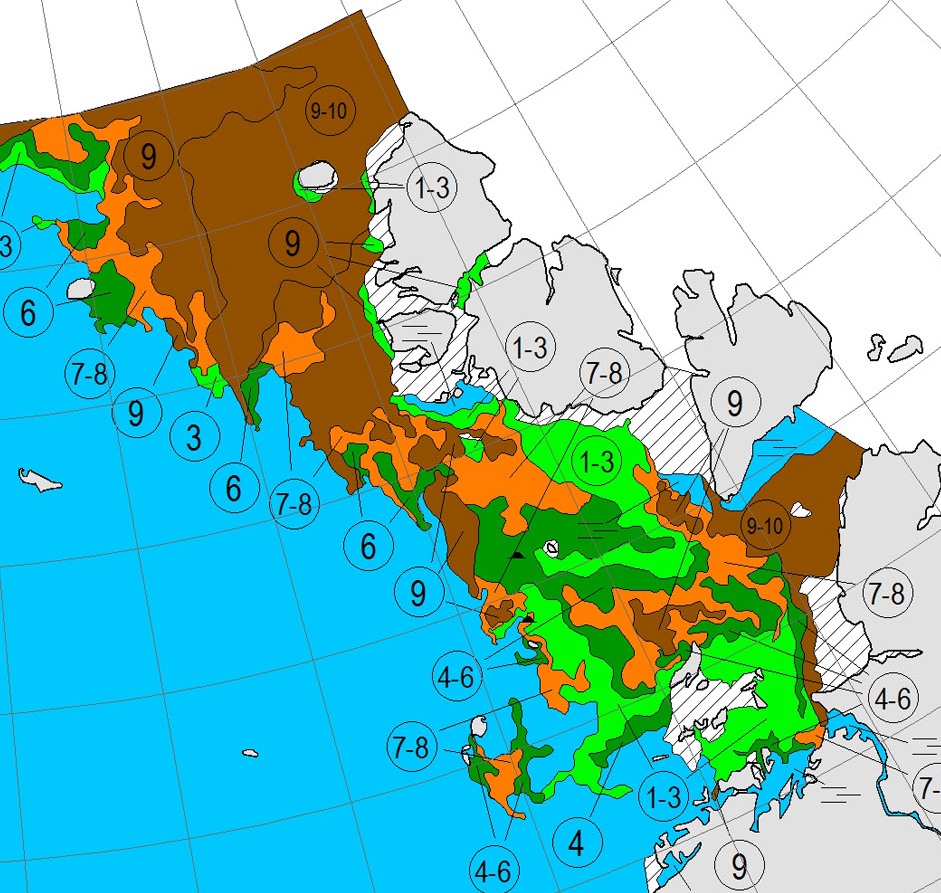
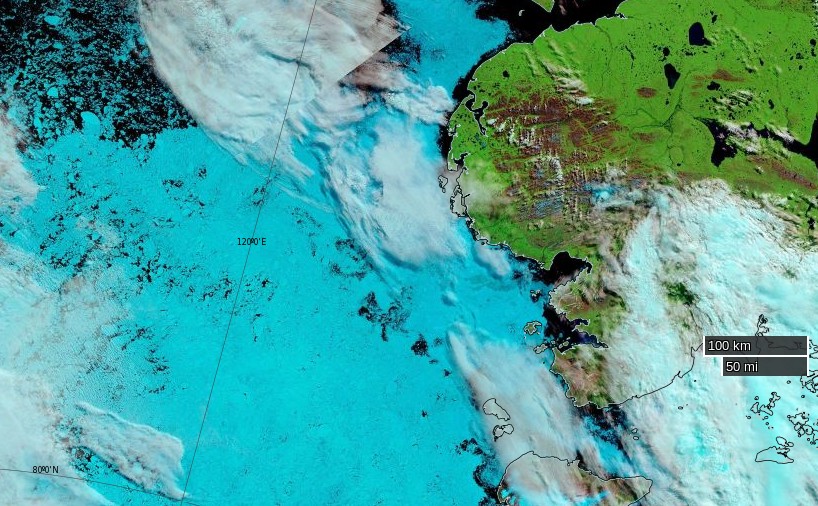
Here’s the current Arctic and Antarctic Research Institute map of the same area:
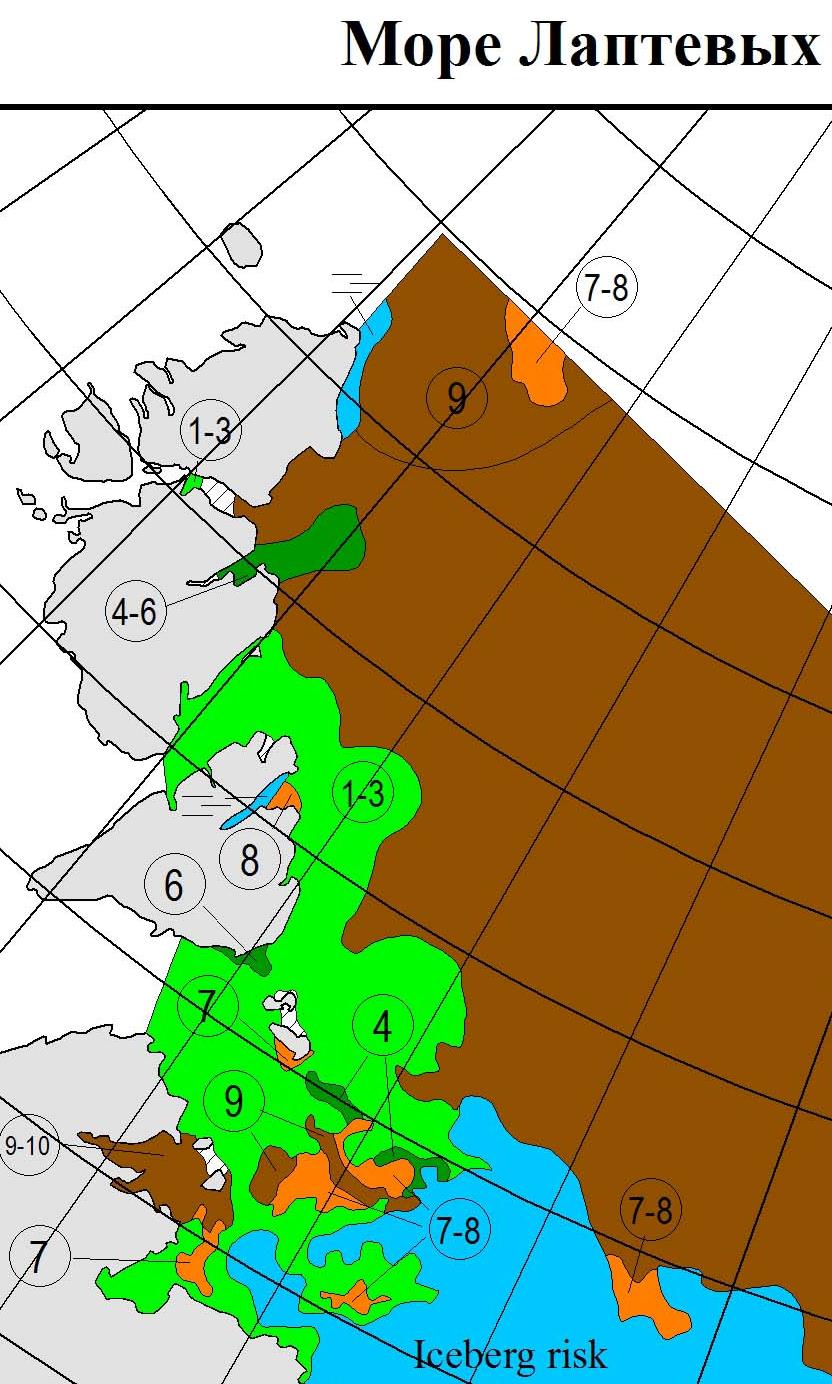
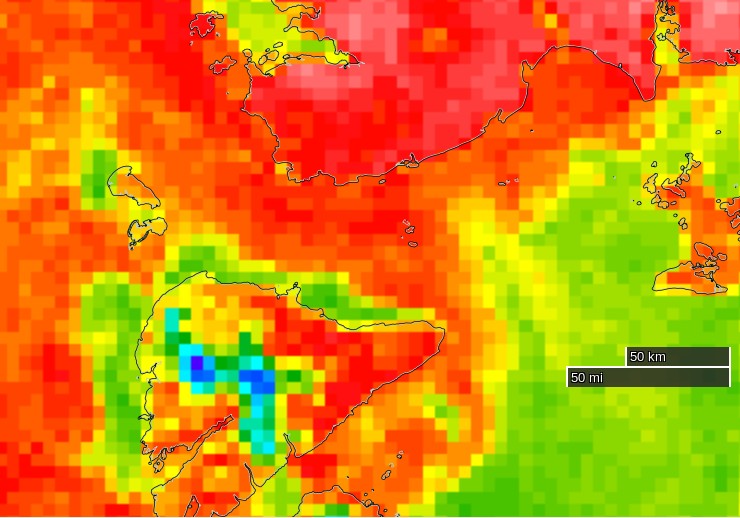
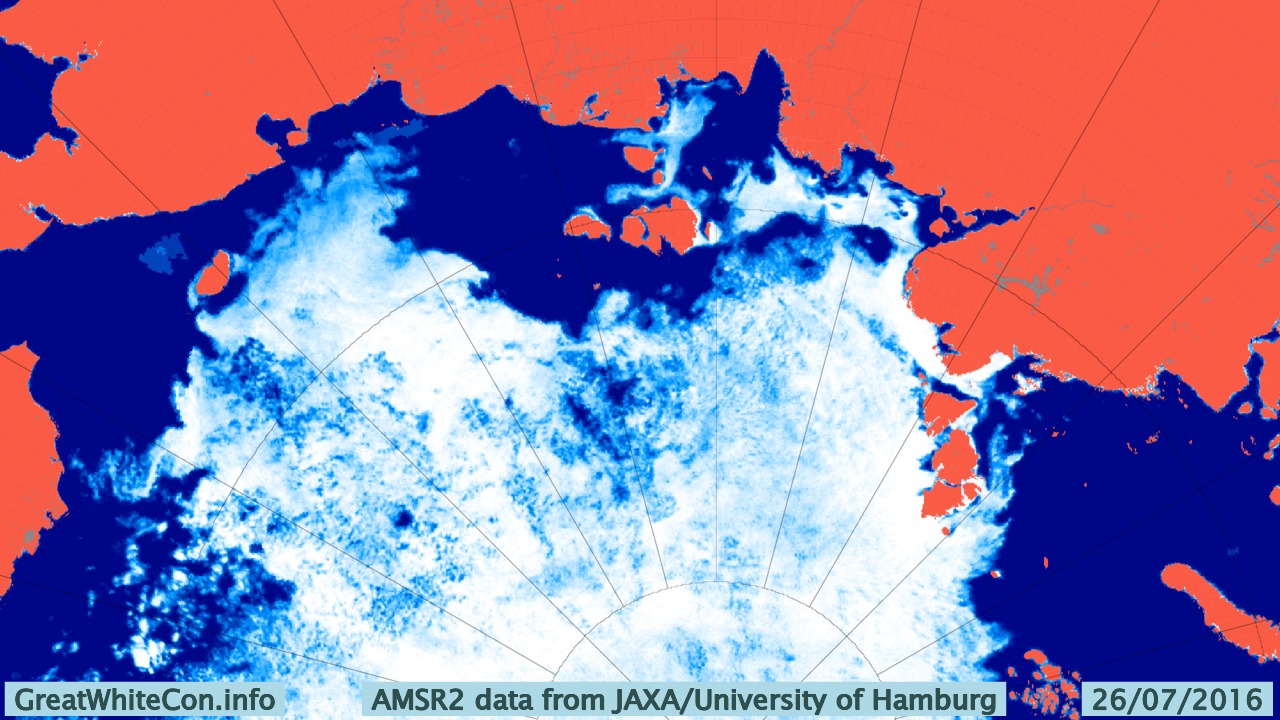
There’s still no way through by which Northabout might avoid an encounter with 9-10 tenths sea ice coverage. Then of course there’s the Laptev Sea to contend with too. Here’s the latest AMSR2 visualisation from the University of Hamburg:
It’s not exactly plain sailing there either just yet!
[Edit – July 28th 2016]
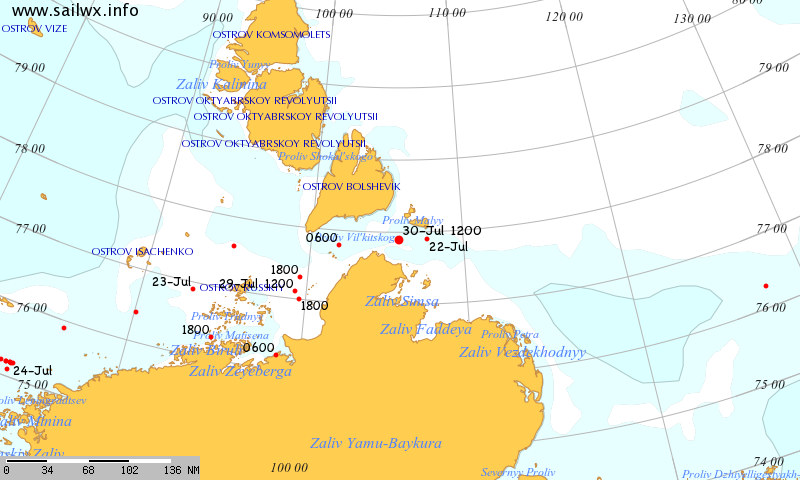
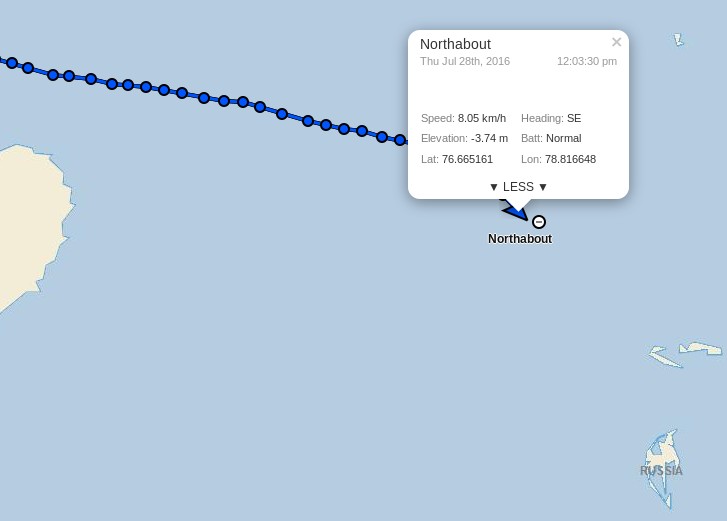
This morning Northabout has almost reached 79 degrees East, and appears to be heading in the direction of Ostrov Troynoy:
The clouds over the Laptev Sea have cleared somewhat as the recent cyclone heads for the Beaufort Sea, to reveal that the “brick wall” of ice referred to in certain quarters now looks more like Swiss cheese:
NASA Worldview “false-color” image of the Laptev on July 28th 2016, derived from the MODIS sensor on the Terra satellite
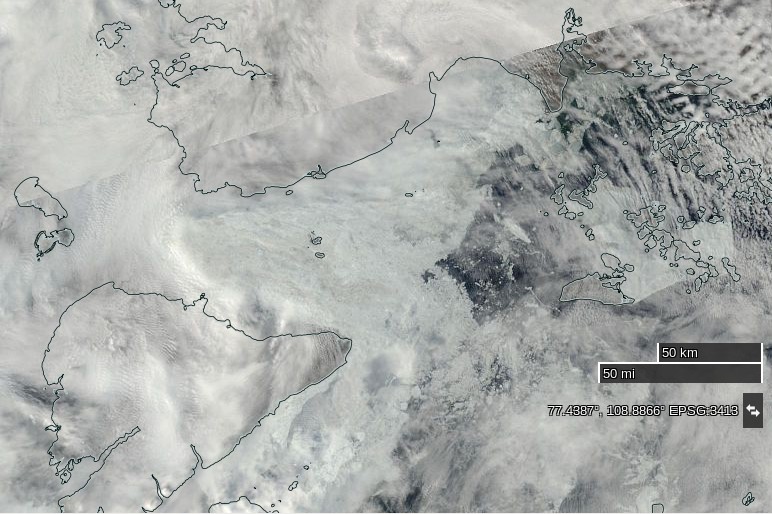
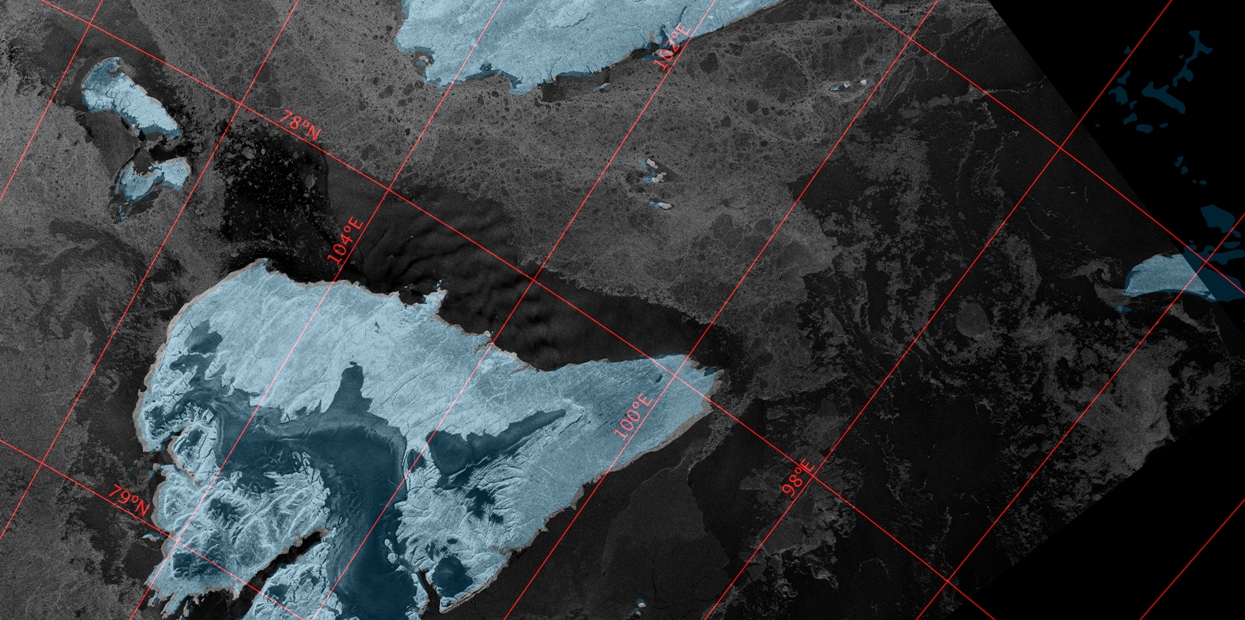
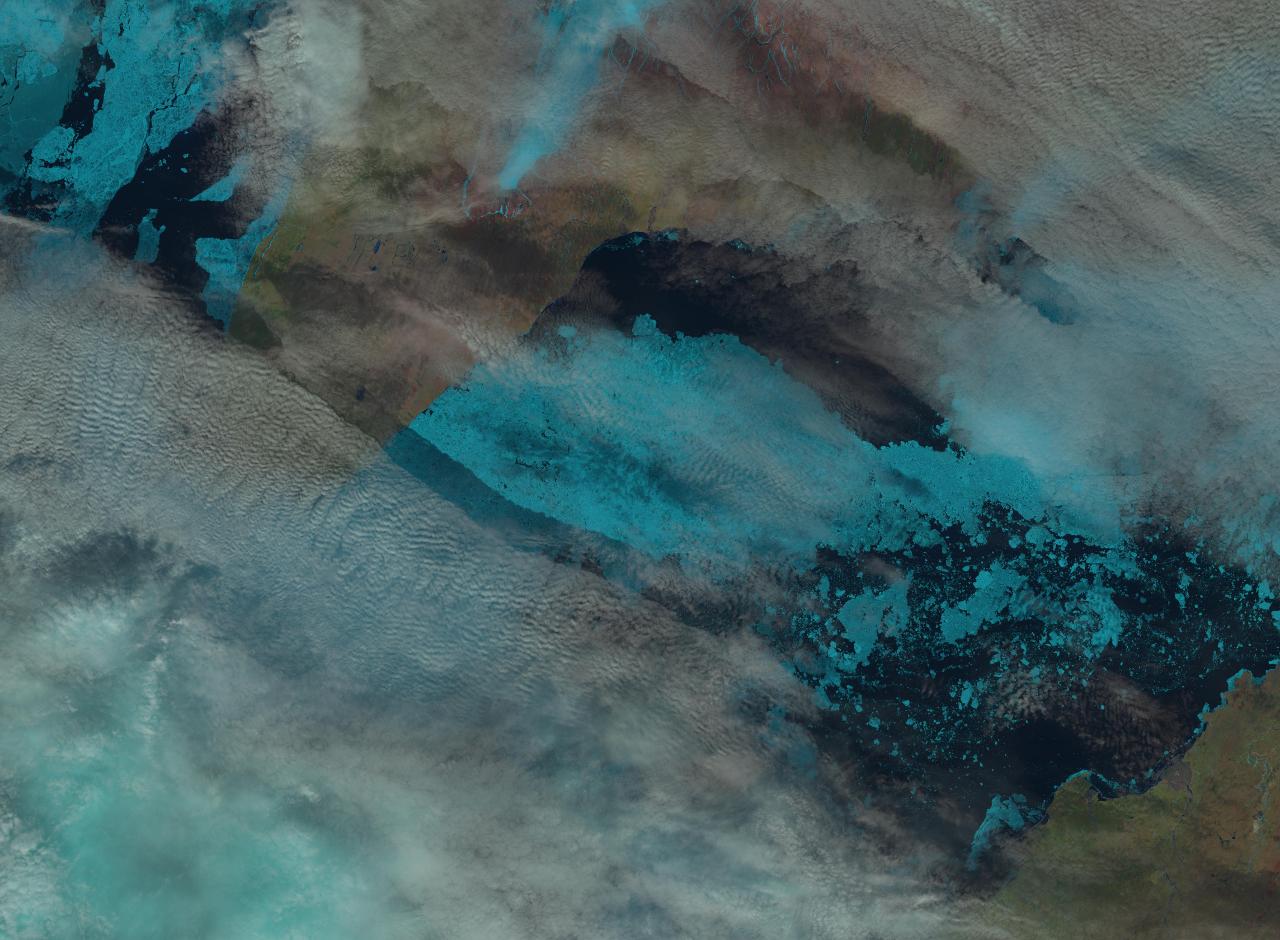
Here’s a close up look at the Vilkitsky Strait from the Landsat 8 satellite this morning. Note that unlike the MODIS image above, north is at the top of this one:
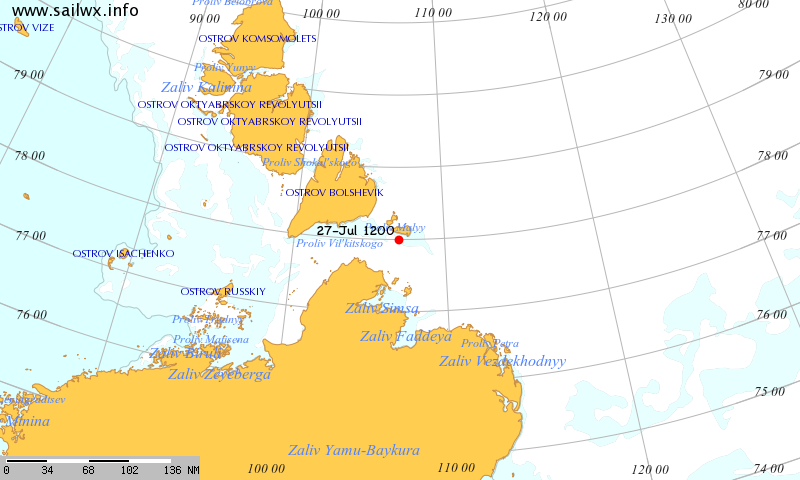
Meanwhile according to SailWX the Russian icebreaker Yamal is traversing the Vilkitsky Strait from east to west:
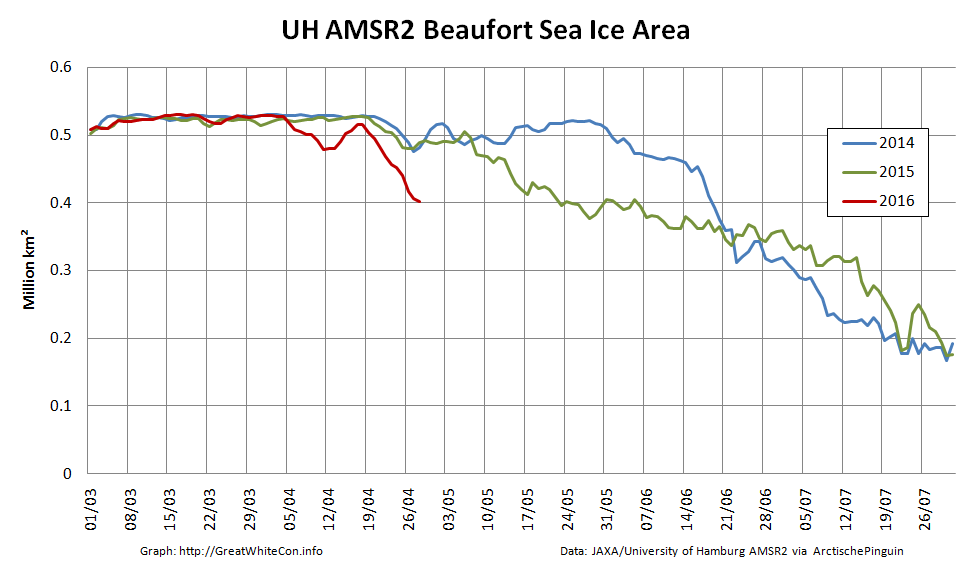
As regular readers will be aware we have been following the progress of the Great Arctic Anticyclone of 2016 for the last 3 weeks or so and the generation of increasingly large waves in the Beaufort Sea in August and September for the last 3 years or so. Today we combine the two to bring you news of anomalously large waves in the Beaufort Sea earlier this week. In actual fact any sort of waves in the Beaufort Sea at this time of year would be anomalous, since normally the Beaufort is still covered in sea ice in April!
Firstly a bit of background information. In the continuing absence of the DMSP F-17 satellite data used by the NSIDC for their Arctic sea ice metrics, here’s a close up look at Arctische Pinguin’s current Beaufort Sea ice area data:
Now here’s NOAA’s WaveWatch III “hindcast” of the winds over the Beaufort Sea on April 26th 2016:
WaveWatch III wind hindcast for the Beaufort Sea on April 26th 2016
Notice the continuing easterly winds from the persistent high pressure system centred to the north of the Beaufort Sea. Next here’s the resultant wind wave height:
WaveWatch III wave height hindcast for the Beaufort Sea on April 26th 2016
and the associated wind wave period:
WaveWatch III wave period hindcast for the Beaufort Sea on April 26th 2016
Wind waves with a height of around 1.5 meters and a period of 6 seconds wouldn’t tempt me to go out on a surfing expedition, but they would certainly be enough to interfere with the sea ice formation process, as you can see from this “pseudo-color” image of the Beaufort Sea on April 26th from the MODIS instrument on the Terra satellite:
Unfortunately the Jason 2 and recently launched Jason 3 satellites don’t measure wave heights in bodies of water as far north as the Beaufort Sea, so we’ll have to content ourselves with the modelled data from WaveWatch III. However here’s a brief video explaining how Jason 3 measurements are now used to assist WaveWatch forecasts further south:
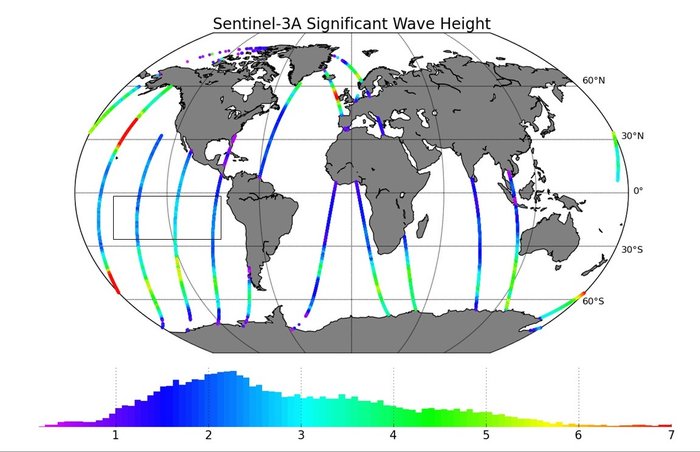
Whilst Jason 3 won’t be watching waves in the Arctic Ocean it looks as though the European Space Agency’s Sentinel 3A satellite will be providing wave height data for the Beaufort Sea in the not too distant future:
It also looks as though CryoSat-2 is already potentially providing such data, but as far as I can ascertain it’s not available in handy gridded format in the same way that the CS2 near real time ice thickness data is.
The Zachariæ Isstrøm glacier in North East Greenland is in the news at the moment. Here’s a recent article from The Guardian for example, which states that:
A major glacier in Greenland that holds enough water to raise global sea levels by half a metre has begun to crumble into the North Atlantic Ocean, scientists say. The calving of the glacier into chunks of floating ice will set in train a rise in sea levels that will continue for decades to come, the US team warns.
“Even if we have some really cool years ahead, we think the glacier is now unstable,” said Jeremie Mouginot at the University of California, Irvine. “Now this has started, it will continue until it retreats to a ridge about 30km back which could stabilise it and perhaps slow that retreat down.”
Mouginot and his colleagues drew on 40 years of satellite data and aerial surveys to show that the enormous Zachariae Isstrom glacier began to recede three times faster from 2012, with its retreat speeding up by 125 metres per year every year until the most recent measurements in 2015.
The same records revealed that from 2002 to 2014 the area of the glacier’s floating shelf shrank by a massive 95%, according to a report in the journal Science. The glacier has now become detached from a stabilising sill and is losing ice at a rate of 4.5bn tonnes a year.
Eric Rignot, professor of Earth system science at the University of California, Irvine, said that the glacier was “being hit from above and below”, with rising air temperatures driving melting at the top of the glacier, and its underside being eroded away by ocean currents that are warmer now than in the past.
“The glacier is now breaking into bits and pieces and retreating into deeper ground,” he said. The rapid retreat is expected to continue for 20 to 30 more years, until the glacier reaches another natural ledge that slows it down.
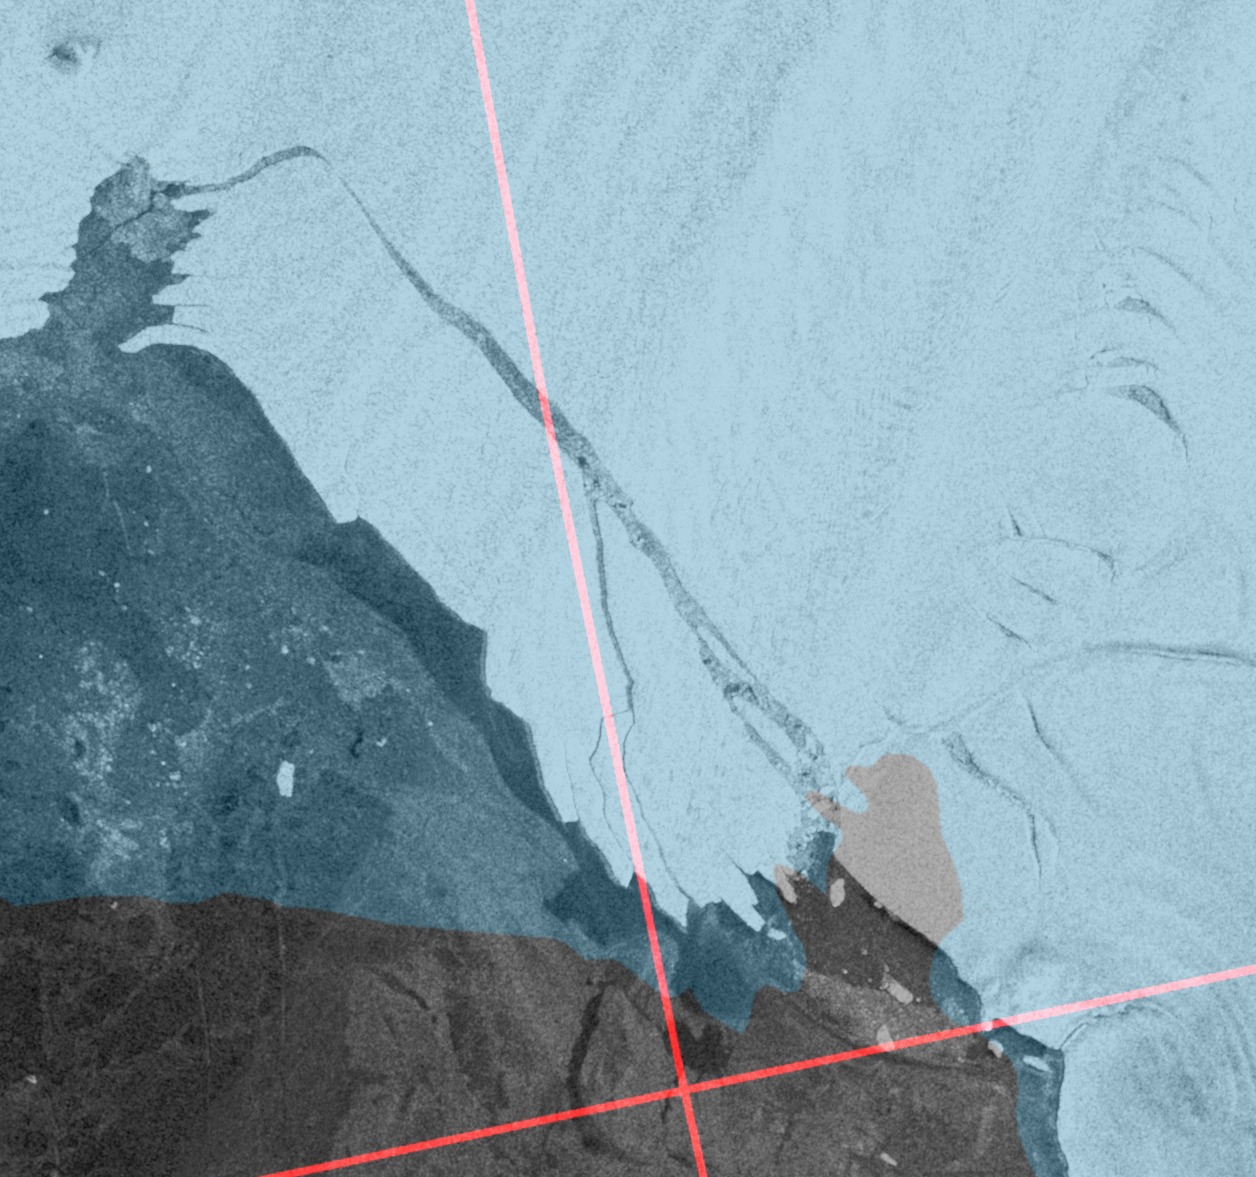
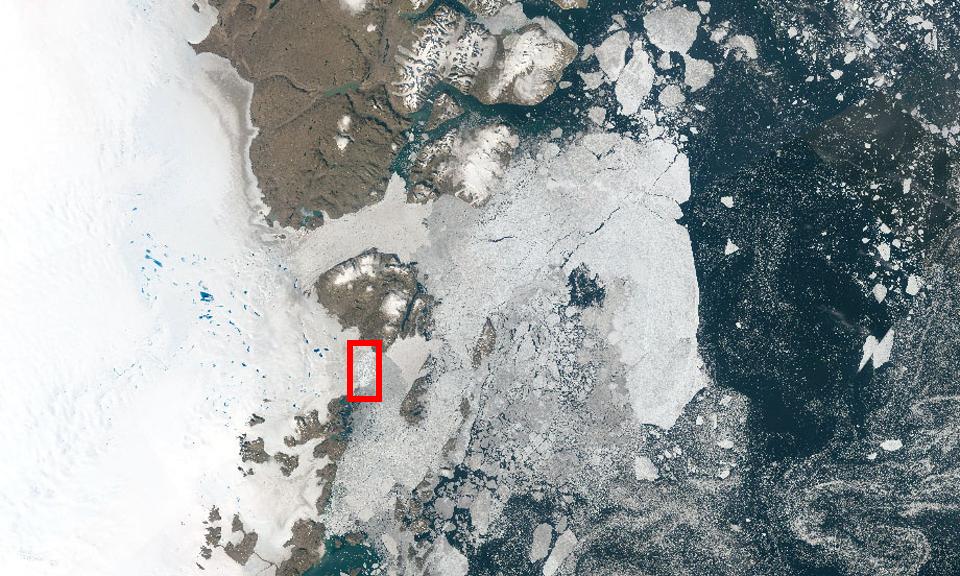
The Guardian article includes a picture of Zachariæ Isstrøm, along with much of the rest of North East Greenland. Here it is again, together with a helpful annotation revealing the location of the calving face of Zachariæ Isstrøm in amongst all the snow and ice:
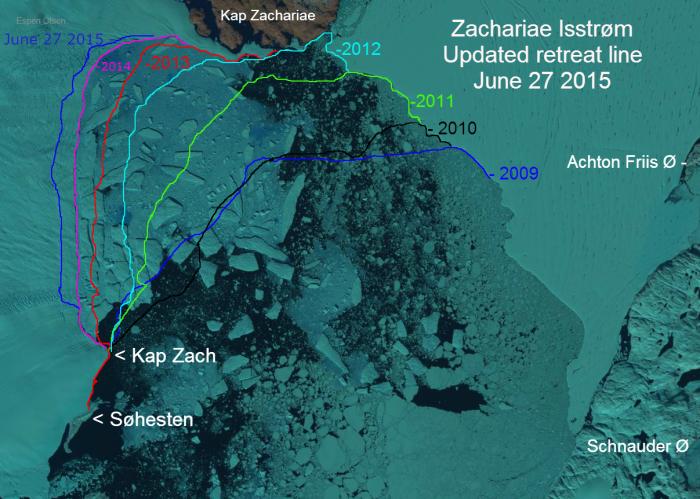
That’s still not really much help when it comes to visualising the “retreat speeding up by 125 metres per year”, so here’s a closer look at Zachariae Isstrom using an image prepared by Espen Olsen for the Arctic Sea Ice Forum, which is based on a Landsat 8 satellite image from September 2014:
Retreat of the calving face of the Zachariae Isstrøm glacier between 2009 and 2015
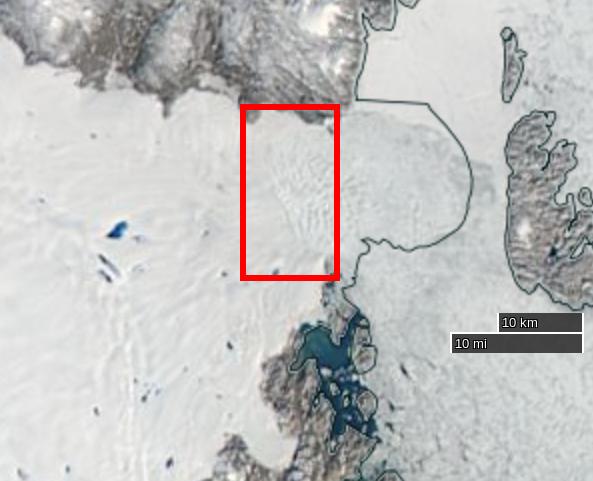
North East Greenland is in the dark at the moment, but if you want to take a closer look at recent changes to Zachariæ Isstrøm for yourself you can do so with the aid of NASA’s EOSDIS Worldview web site, which allows you to scroll through images from both the Aqua and Terra satellites. Here’s one from August 26th 2015:
NASA Worldview “true-color” image of the Zachariae Isstrøm glacier on August 26th 2015, derived from the MODIS sensor on the Aqua satellite
Our headline for today announces that yet another large chunk of ice has just detached itself from Zachariæ Isstrøm. You may wonder how we can be so sure of that when it’s dark in North East Greenland? That’s because yet another satellite can “see” in the dark, using synthetic aperture radar. Here’s an animation prepared earlier today by “Wipneus” using data from the European Space Agency’s Sentinel 1A satellite, once again for the Arctic Sea Ice Forum:
Animated comparison of Sentinel 1A visualisations of the Zachariae Isstrøm calving face on 4th and 16th November 2015
Can you spot “The new iceberg [that] seems to lie on its side”?
The conclusion to all this frantic activity, according to Mouginot, Rignot et al. at least, is that:
The Zachariæ Isstrøm / Nioghalvfjerdsfjorden sector is one of three major marine-based basins in Greenland along with the Jakobshavn Isbræ and Petermann–Humboldt glaciers, each holding a 0.6-m sea-level equivalent. Jakobshavn Isbræ started a rapid retreat (18 km in 2001-2015) following the collapse of its ice shelf and has undergone massive calving events since 2010. The central channel of the Petermann ice shelf lost 250 m of ice in 2002-2010, and the ice front retreated 33 km in 2010-2012. The Nioghalvfjerdsfjorden ice shelf will become vulnerable to break up in the near future if thinning continues. These observations combined suggest that all three major marine-based basins are undergoing significant changes at present. Jakobshavn Isbræ and Zachariæ Isstrøm have already transitioned to tidewater glacier regime, with increased calf-ice production and ice melting by the ocean. The retreat of these marine-based sectors is likely to increase sea-level rise from Greenland for decades to come.
Jakobshavn Isbræ is a glacier in Western Greenland made (more?) famous by James Balog in his “Chasing Ice” movie. Here’s the “official video”:
which claims that it:
Captures [the] largest glacier calving ever filmed. On May 28, 2008, Adam LeWinter and Director Jeff Orlowski filmed a historic breakup at the Ilulissat Glacier in Western Greenland.
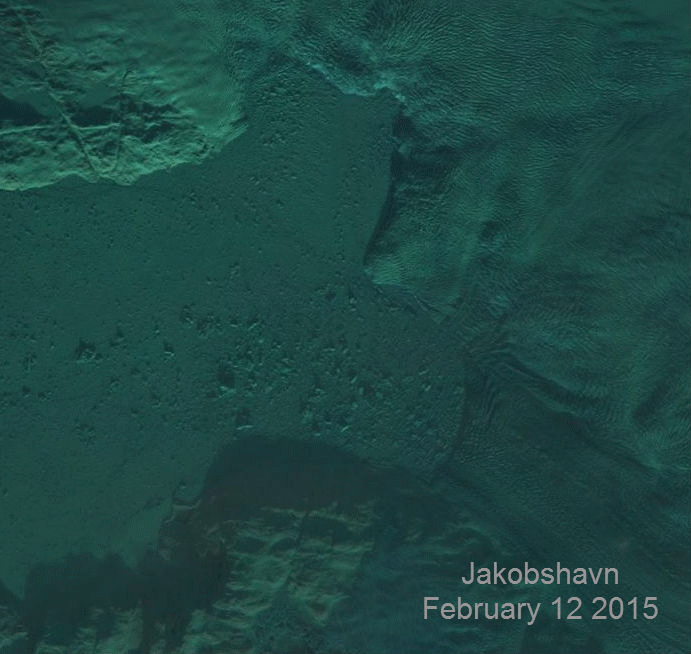
Depending on which languages you prefer to mix and match “Ilulissat Glacier” is another name for the self same glacier. So is “Sermeq Kujalleq”. Now comes news that something similar has just happened, albeit captured only by satellites in the twilight of the Arctic “spring”. Over on the Arctic Sea Ice Forum Espen Olsen posted late last night (UTC):
Believe it or not! Massive calving seen at the southern branch of Jakobshavn Isbræ
together with this animation created using images from the Landsat 8 Operational Land Imager:
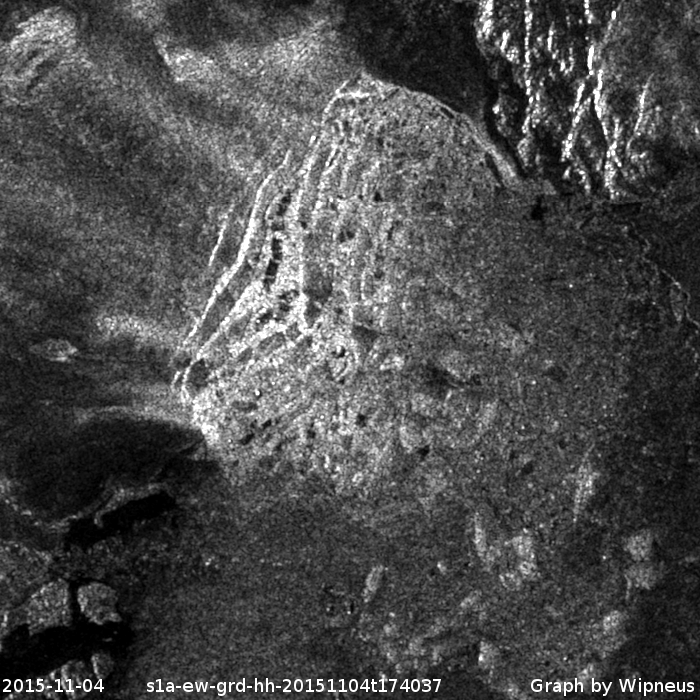
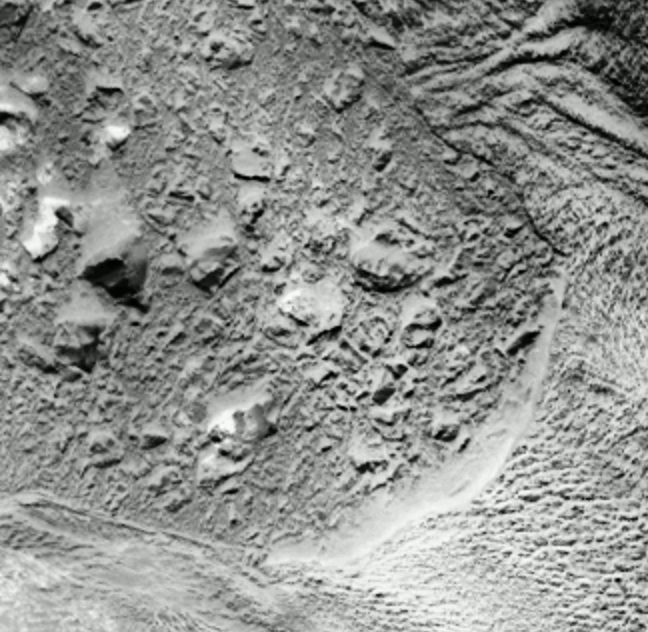
We’ve just grabbed this Sentinel-1A synthetic aperture radar image from February 15th 2015 via Polarview, which appears to suggest that the calving took place before 20:38 UTC on that date:
Here’s a Sentinel-1A image via “nukefix” at the Arctic Sea Ice Forum, which confirms that the calving took place on or before February 16th:
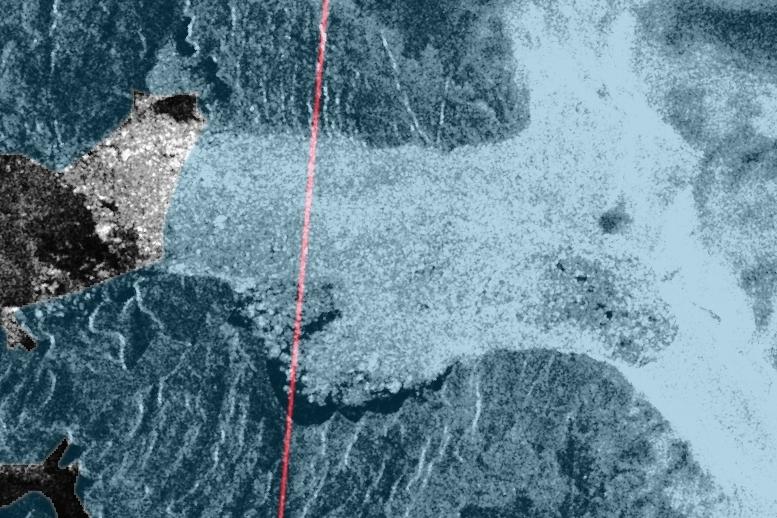
This is a before/after animation from “A-Team” on the Arctic Sea Ice Forum, using 15m resolution Landsat images:
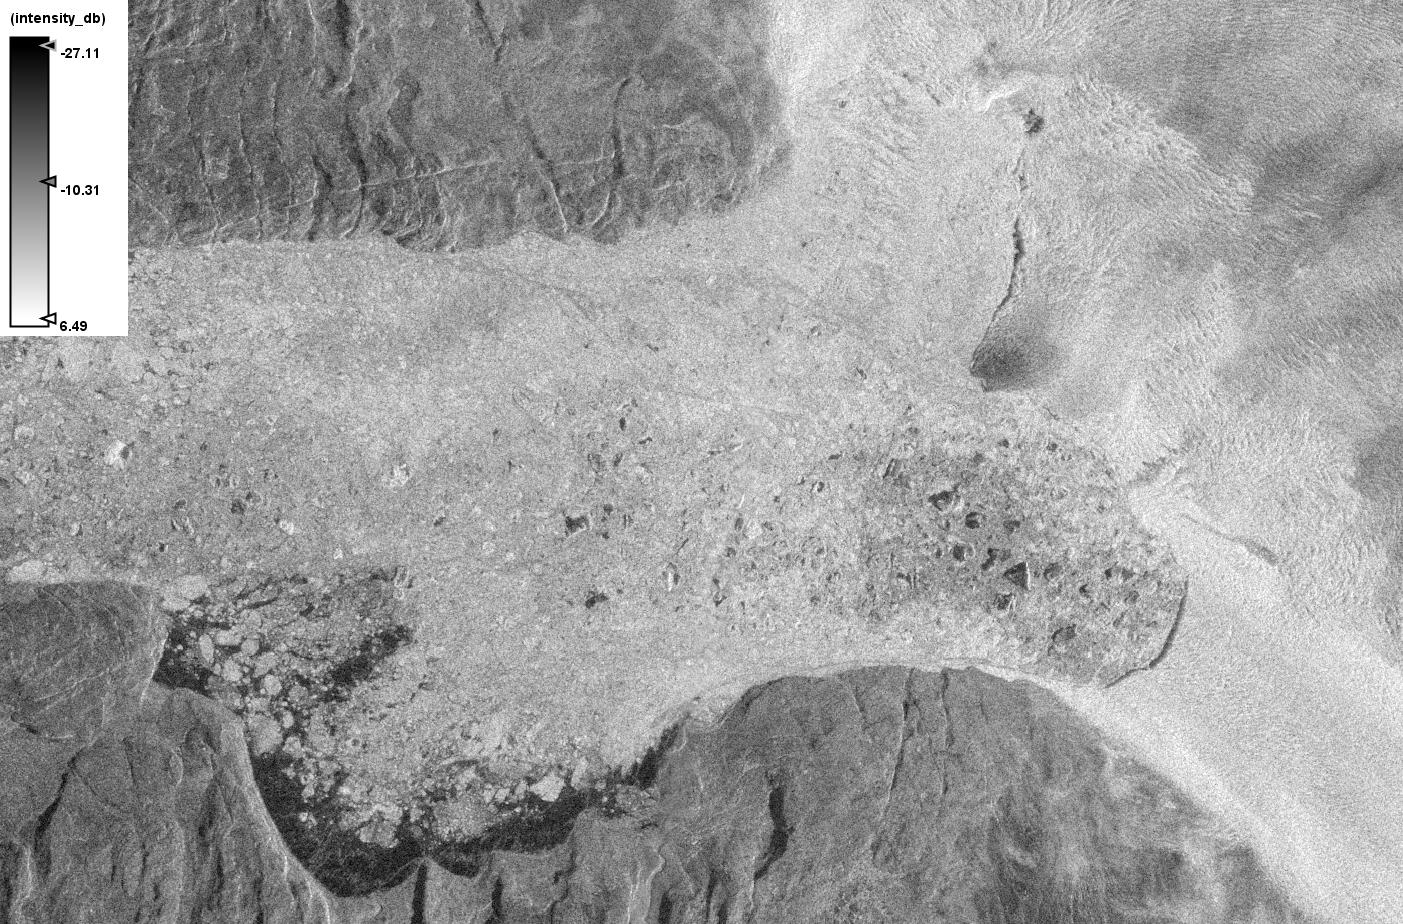
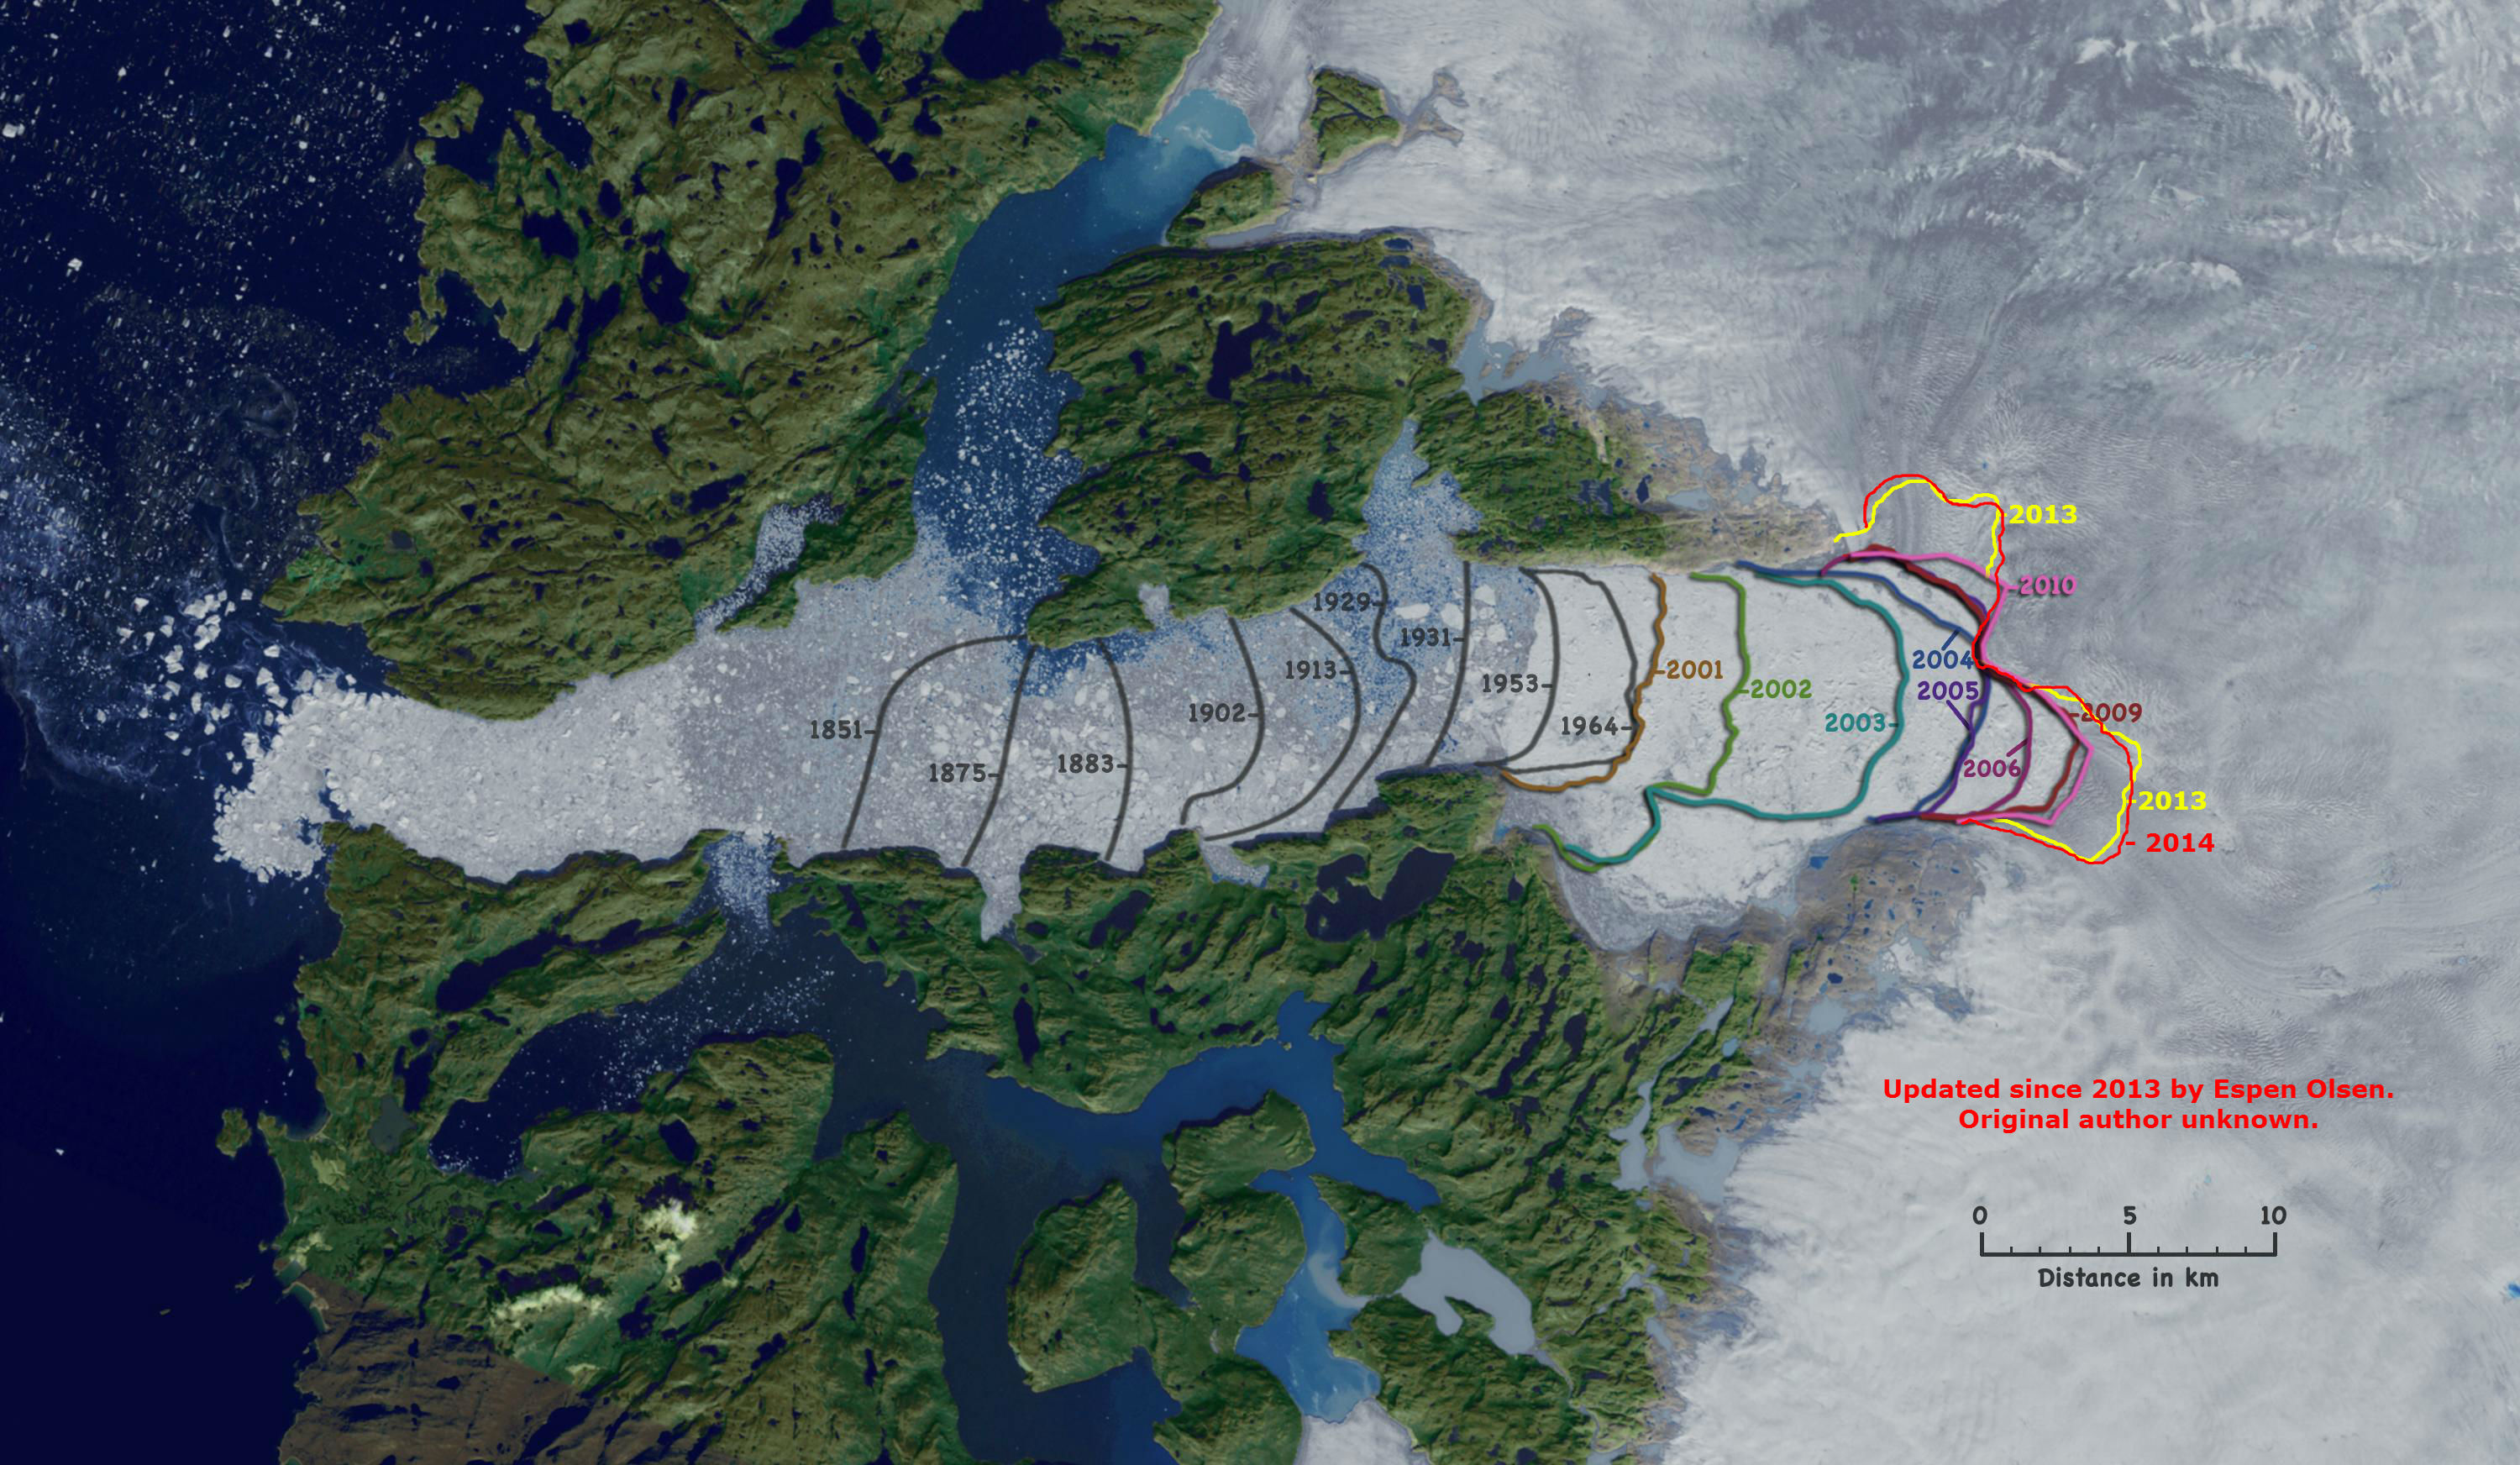
Finally, for the moment at least, Espen Olsen provides an illustration of the retreat of the calving face of Jakobshavn Isbræ since 1851:
This most recent event does not bring the calving face further east than the position in summer 2014. However the sun’s rays are only just returning to that part of the planet, and the next one may well do so.
[Edit – 24/02/2015]
We’ve phoned DMI and NSIDC as well, but Jason Box who is a Professor at the Geological Survey of Denmark and Greenland has been the first to respond with an opinion about how unusual this event is:
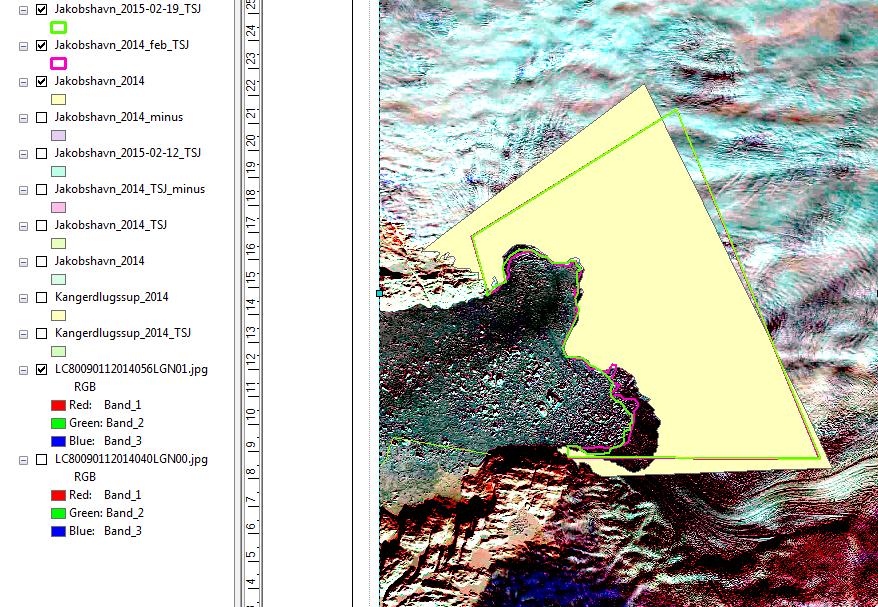
It’s an interesting finding. In the attached prepared by Karina Hansen you will see a light yellow polygon illustrating the end of melt season 2014 ice. Jakobshavn front position retreated from the Feb 2014 (pink line) and Feb 2015 (green line) positions. The Feb 2014 and Feb 2015 positions are roughly the same with 2014 Feb being further retreated than Feb 2015:
A cautious response: even if this calving were abnormal, we will likely see an advance in the next weeks that will fill the void. Why?
A) This glacier flows fast, and
B) Now with less flow resistance there will likely be an acceleration making the void filling happen even faster.
Here are annual end of melt season area changes measured by PROMICE.org. These are being updated. I will ask Karina Hansen today to update for 2014 and 2015. We could have that result in a few hours.
1999/00
-2.750
2000/01
-2.473
2001/02
-16.357
2002/03
-45.617
2003/04
-21.235
2004/05
-10.015
2005/06
-4.151
2006/07
-3.830
2007/08
-3.202
2008/09
-2.174
2009/10
-8.725
2010/11
-6.693
2011/12
-13.743
2012/13
-2.826
In context of the ongoing retreat, I would speculate that this retreat could make further retreat more likely because the acceleration from B) would cause ‘dynamic thinning’ that through a positive feedback would reduce glacier bed friction facilitating further thinning and acceleration. This feedback is an amplifier and not runaway but being activated would precondition Jakobshavn glacier for further retreat.
This website uses cookies to improve your experience. We'll assume you're ok with this, but you can opt-out if you wish. Cookie settingsACCEPT
Privacy & Cookies Policy
Privacy Overview
This website uses cookies to improve your experience while you navigate through the website. Out of these, the cookies that are categorized as necessary are stored on your browser as they are essential for the working of basic functionalities of the website. We also use third-party cookies that help us analyze and understand how you use this website. These cookies will be stored in your browser only with your consent. You also have the option to opt-out of these cookies. But opting out of some of these cookies may affect your browsing experience.
Necessary cookies are absolutely essential for the website to function properly. This category only includes cookies that ensures basic functionalities and security features of the website. These cookies do not store any personal information.
Any cookies that may not be particularly necessary for the website to function and is used specifically to collect user personal data via analytics, ads, other embedded contents are termed as non-necessary cookies. It is mandatory to procure user consent prior to running these cookies on your website.