Jakobshavn Isbræ is a glacier in Western Greenland made (more?) famous by James Balog in his “Chasing Ice” movie. Here’s the “official video”:
which claims that it:
Captures [the] largest glacier calving ever filmed. On May 28, 2008, Adam LeWinter and Director Jeff Orlowski filmed a historic breakup at the Ilulissat Glacier in Western Greenland.
Depending on which languages you prefer to mix and match “Ilulissat Glacier” is another name for the self same glacier. So is “Sermeq Kujalleq”. Now comes news that something similar has just happened, albeit captured only by satellites in the twilight of the Arctic “spring”. Over on the Arctic Sea Ice Forum Espen Olsen posted late last night (UTC):
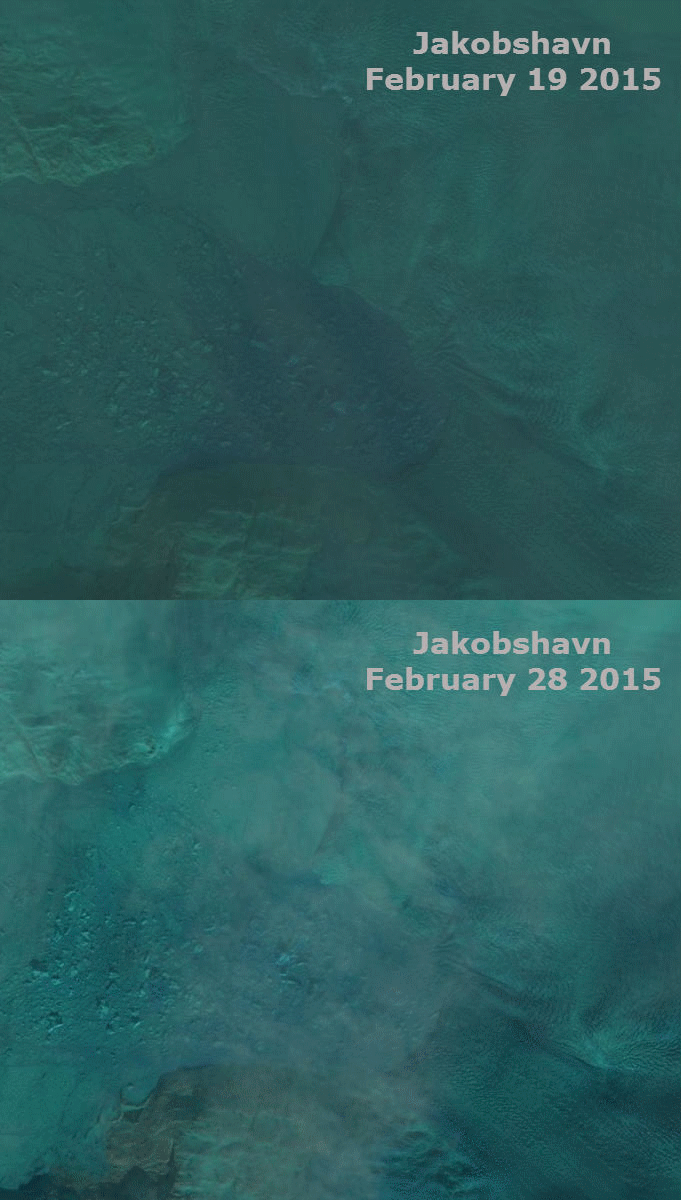
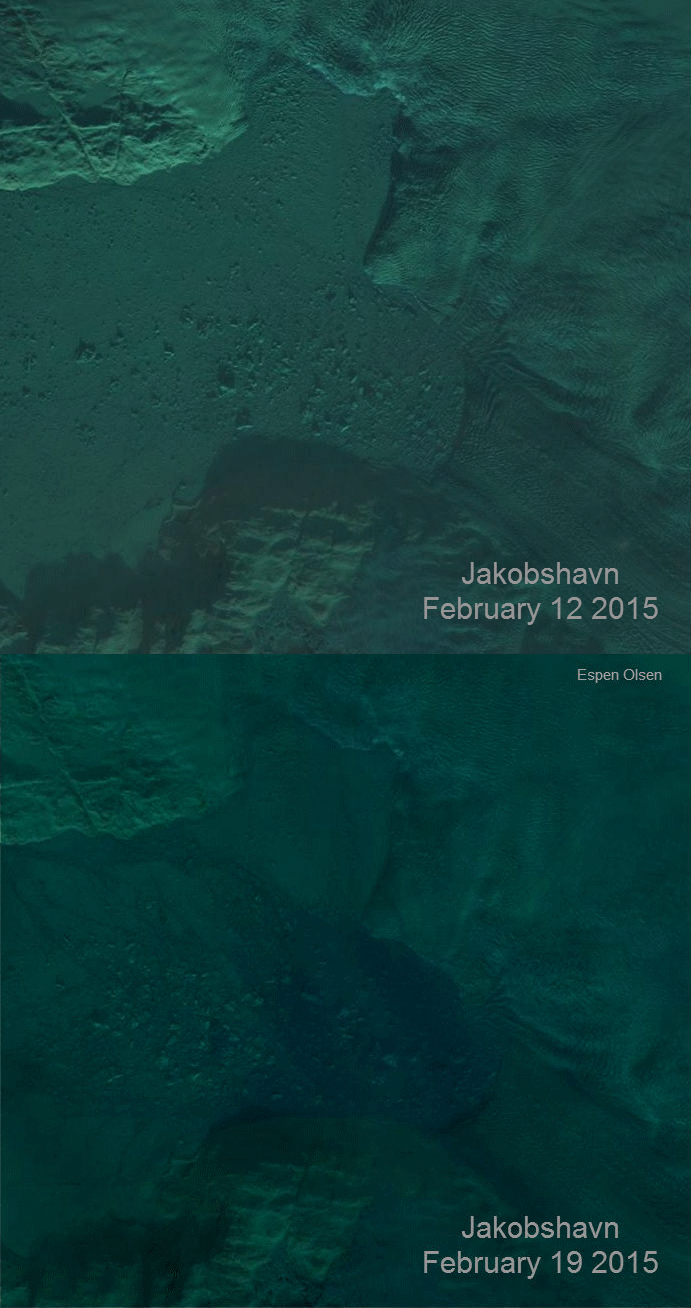
Believe it or not! Massive calving seen at the southern branch of Jakobshavn Isbræ
together with this animation created using images from the Landsat 8 Operational Land Imager:
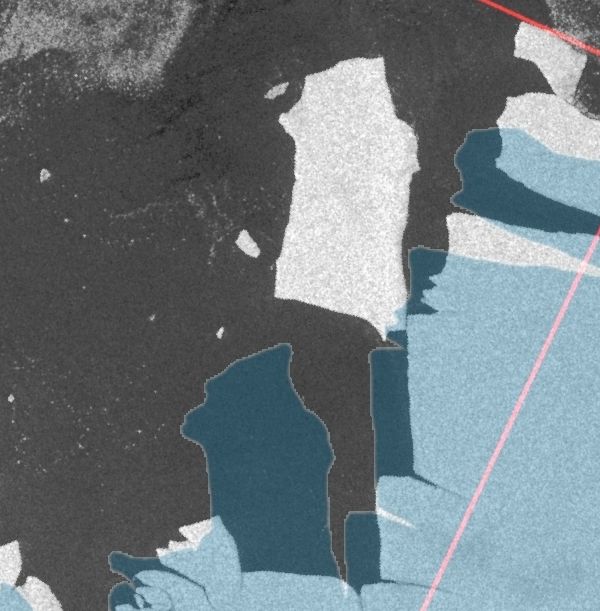
We’ve just grabbed this Sentinel-1A synthetic aperture radar image from February 15th 2015 via Polarview, which appears to suggest that the calving took place before 20:38 UTC on that date:
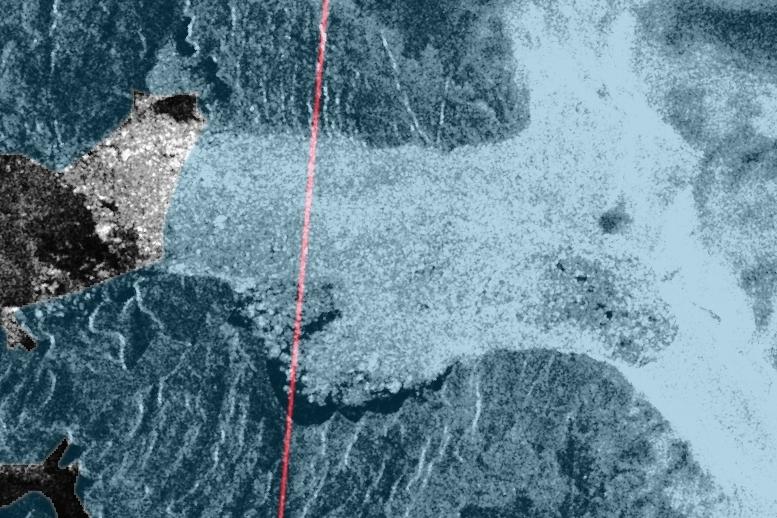
Here’s a Sentinel-1A image via “nukefix” at the Arctic Sea Ice Forum, which confirms that the calving took place on or before February 16th:
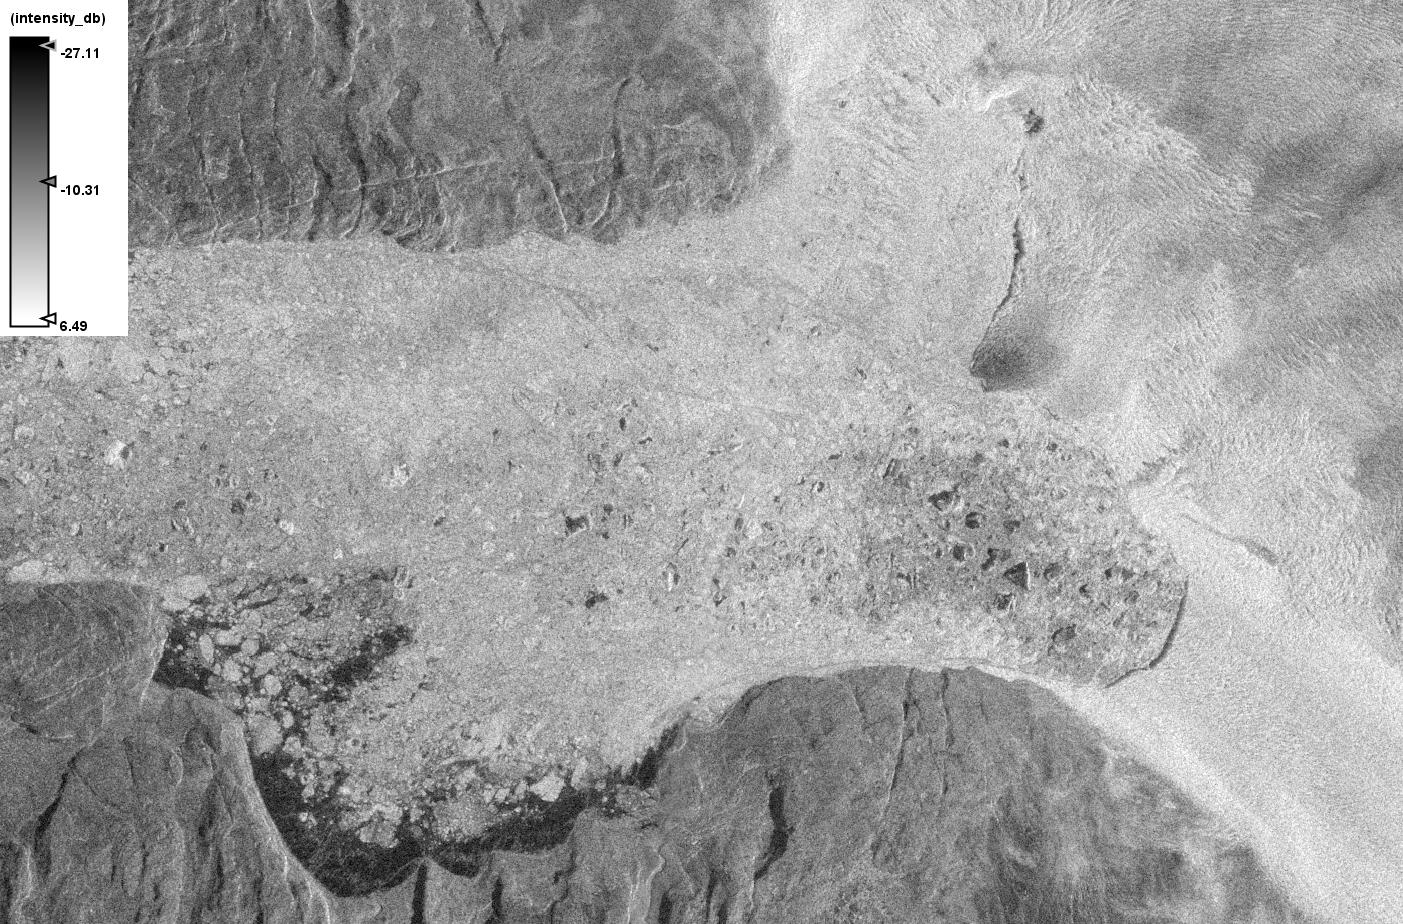
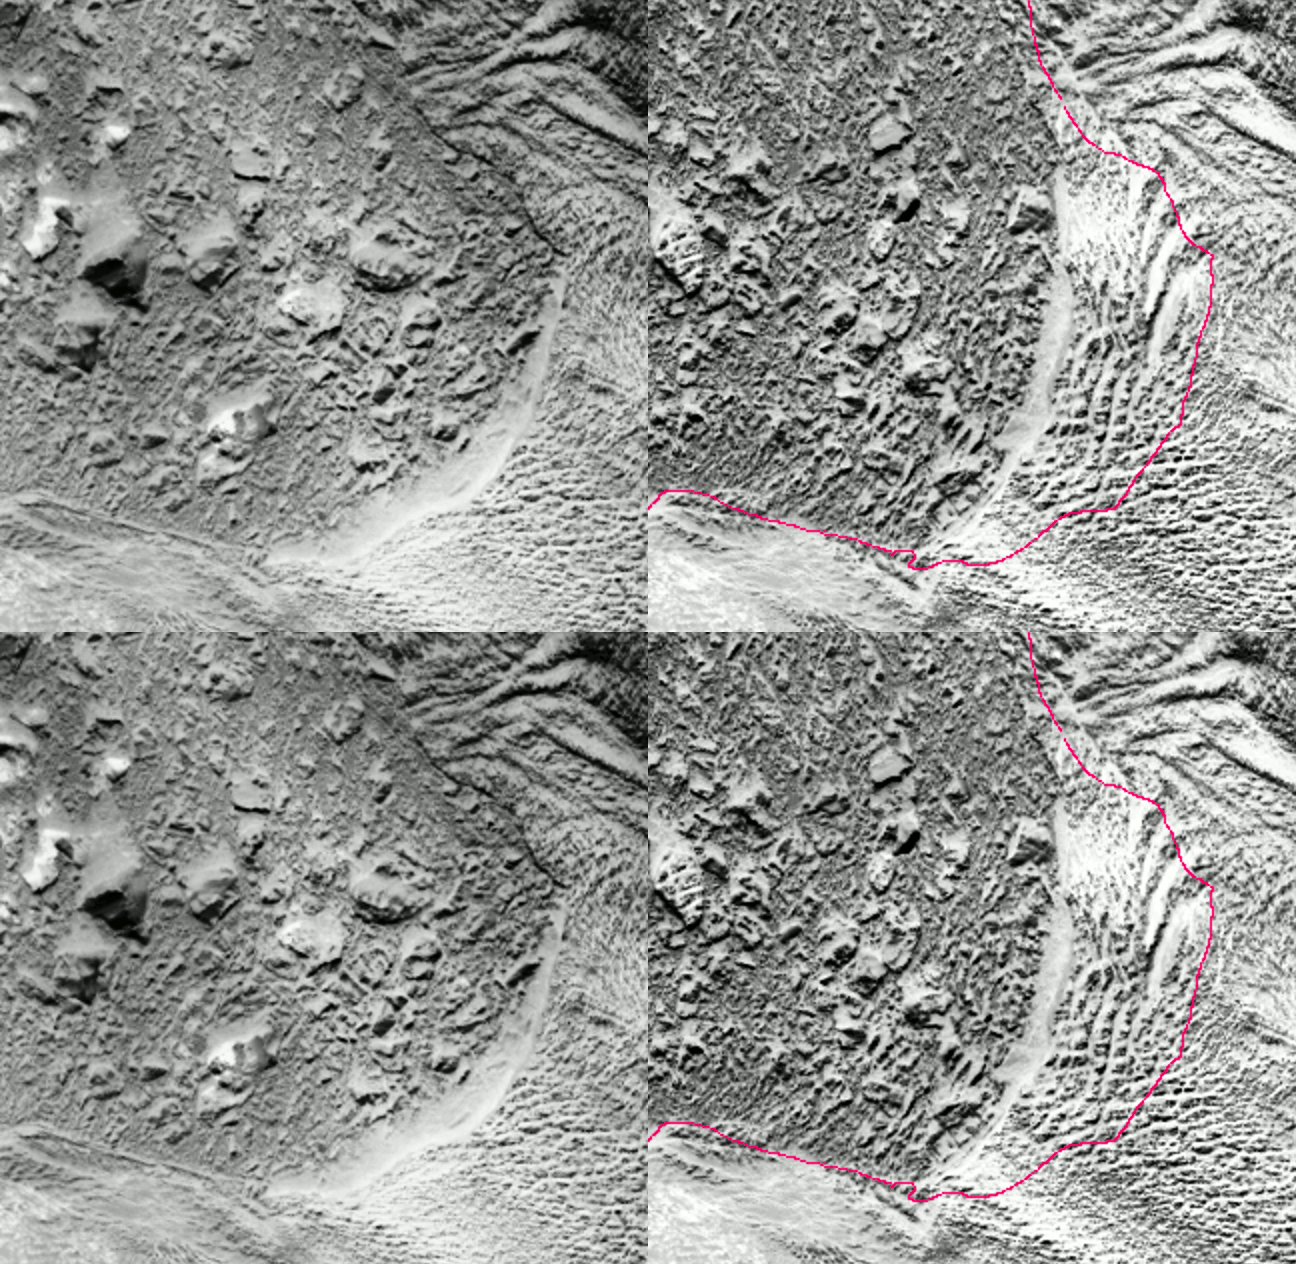
This is a before/after animation from “A-Team” on the Arctic Sea Ice Forum, using 15m resolution Landsat images:
Finally, for the moment at least, Espen Olsen provides an illustration of the retreat of the calving face of Jakobshavn Isbræ since 1851:
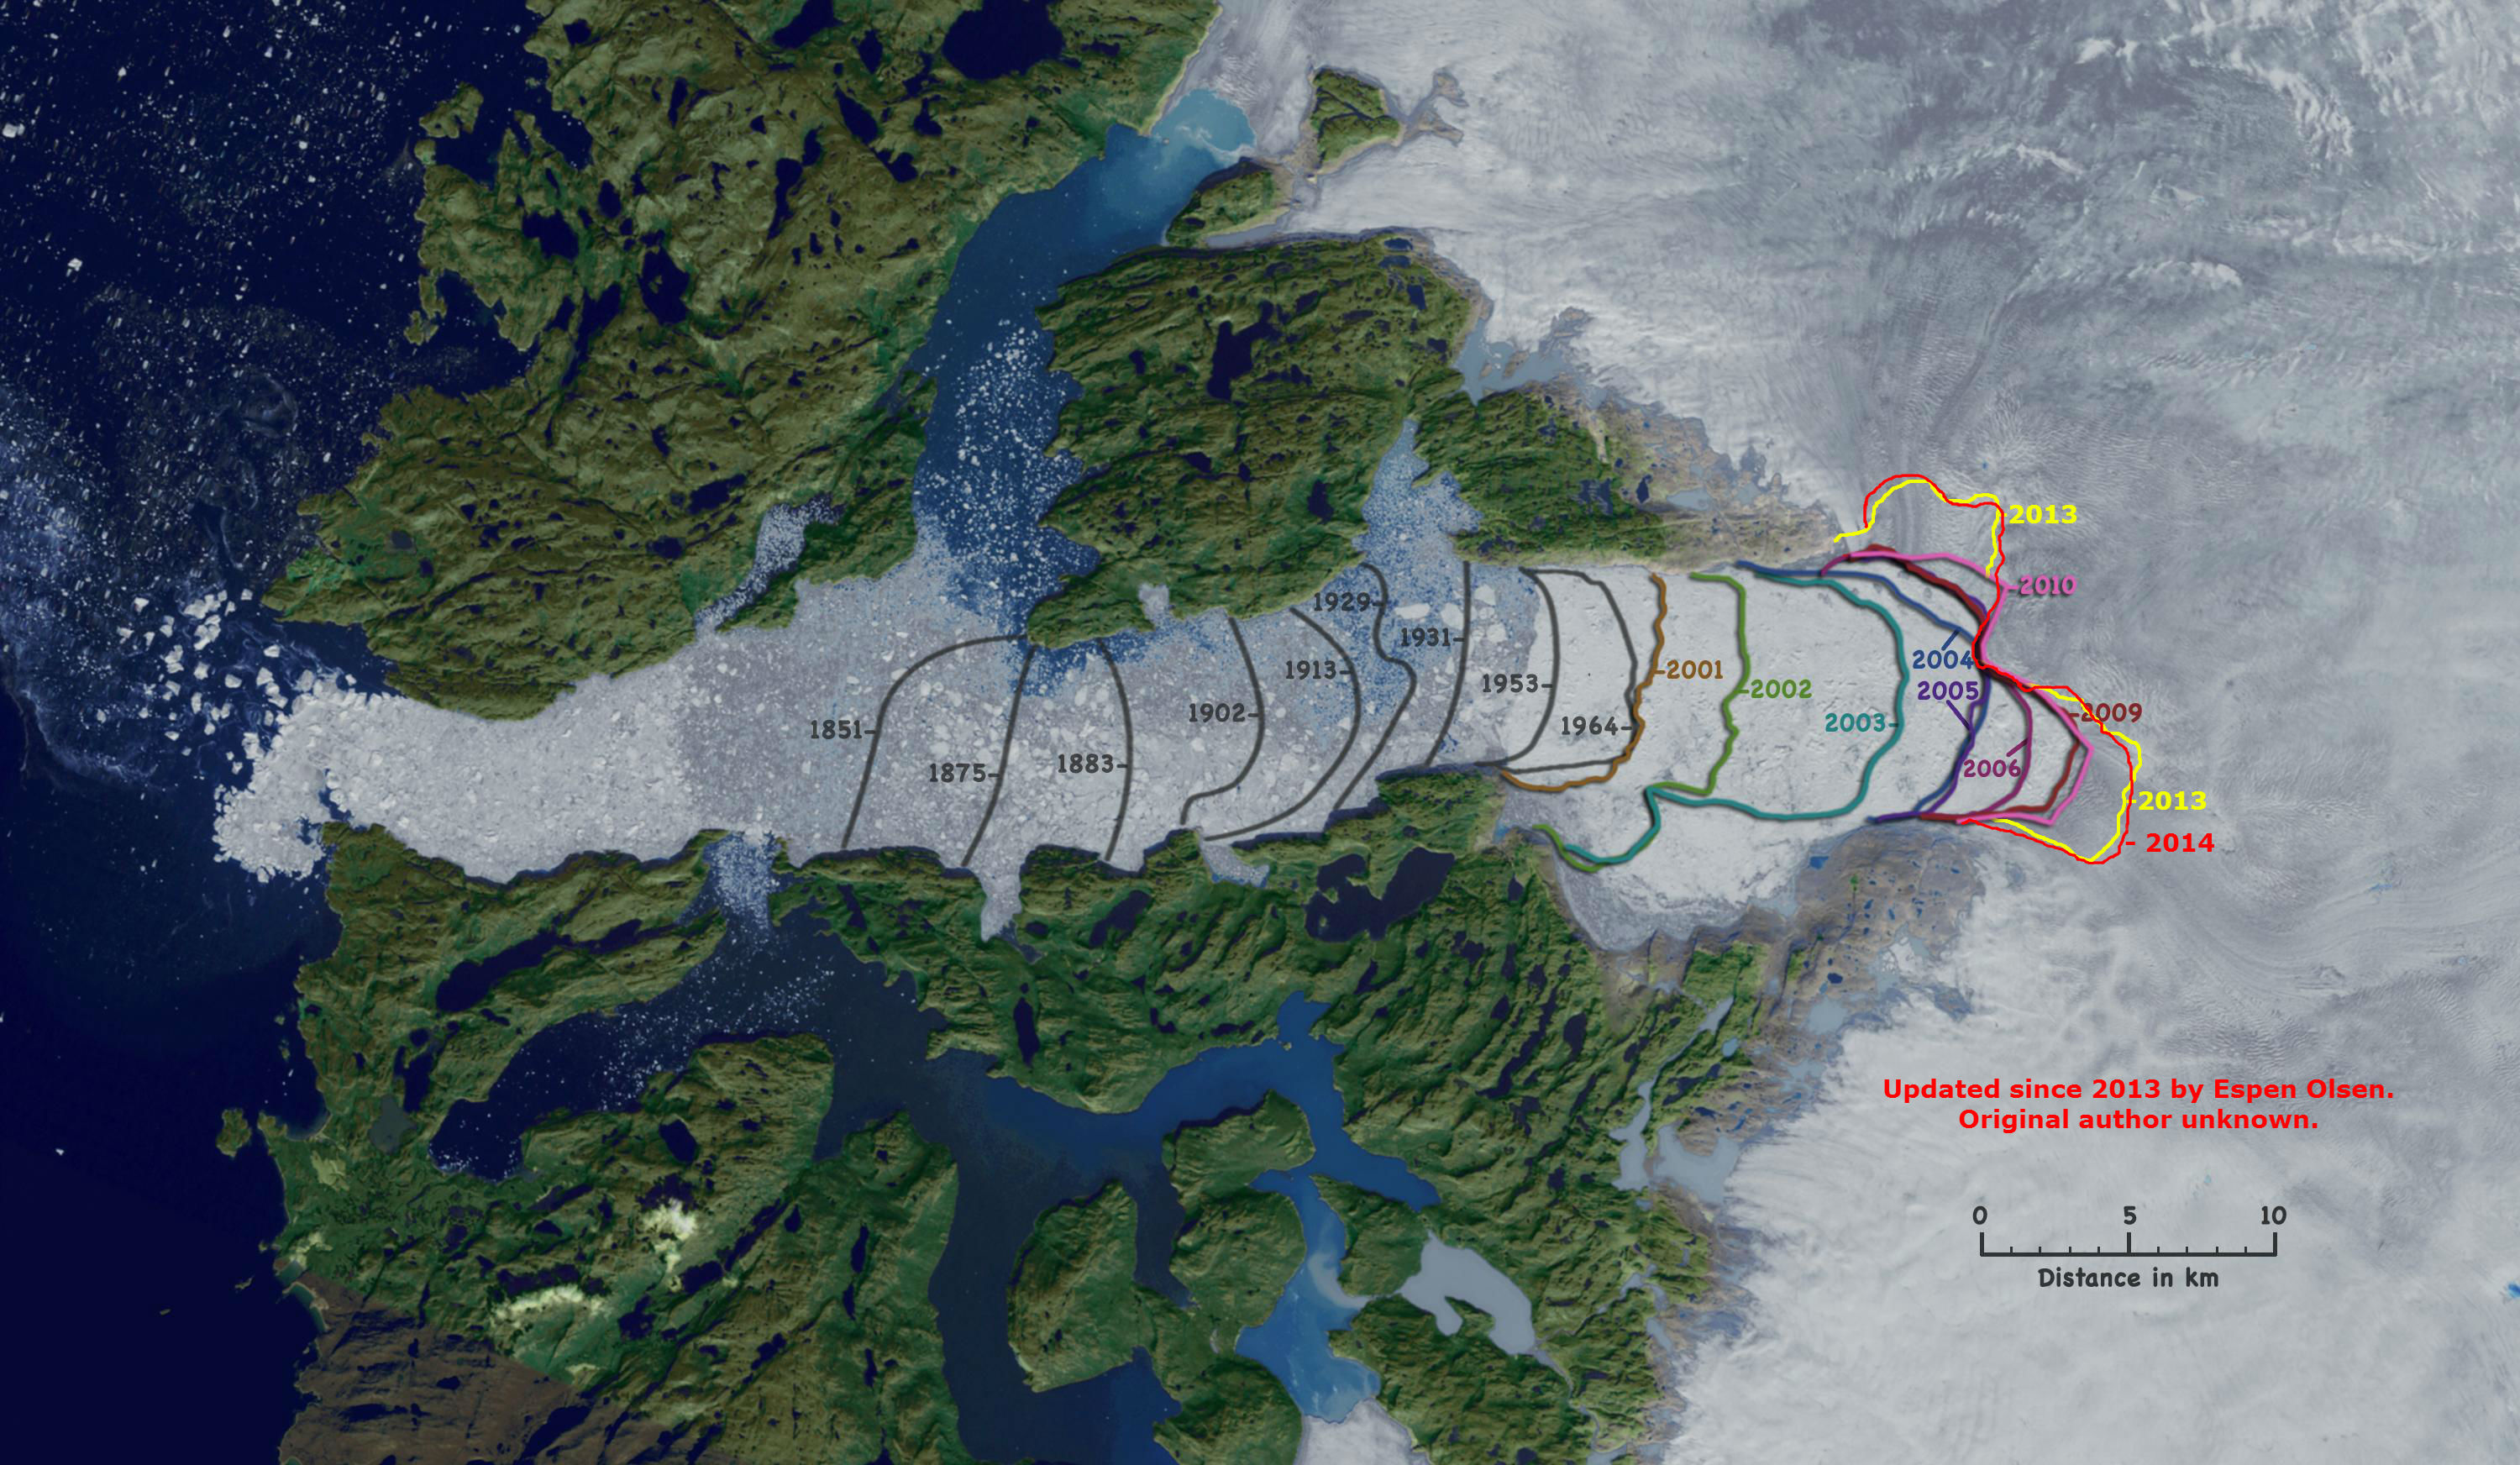
This most recent event does not bring the calving face further east than the position in summer 2014. However the sun’s rays are only just returning to that part of the planet, and the next one may well do so.
We’ve phoned DMI and NSIDC as well, but Jason Box who is a Professor at the Geological Survey of Denmark and Greenland has been the first to respond with an opinion about how unusual this event is:
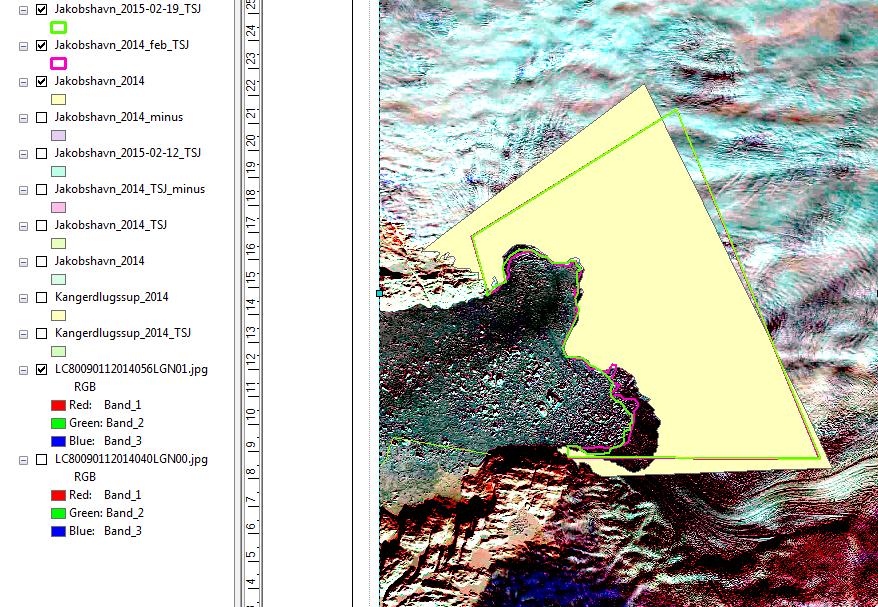
It’s an interesting finding. In the attached prepared by Karina Hansen you will see a light yellow polygon illustrating the end of melt season 2014 ice. Jakobshavn front position retreated from the Feb 2014 (pink line) and Feb 2015 (green line) positions. The Feb 2014 and Feb 2015 positions are roughly the same with 2014 Feb being further retreated than Feb 2015:
A cautious response: even if this calving were abnormal, we will likely see an advance in the next weeks that will fill the void. Why?
A) This glacier flows fast, and
B) Now with less flow resistance there will likely be an acceleration making the void filling happen even faster.
Here are annual end of melt season area changes measured by PROMICE.org. These are being updated. I will ask Karina Hansen today to update for 2014 and 2015. We could have that result in a few hours.
| 1999/00 | -2.750 |
| 2000/01 | -2.473 |
| 2001/02 | -16.357 |
| 2002/03 | -45.617 |
| 2003/04 | -21.235 |
| 2004/05 | -10.015 |
| 2005/06 | -4.151 |
| 2006/07 | -3.830 |
| 2007/08 | -3.202 |
| 2008/09 | -2.174 |
| 2009/10 | -8.725 |
| 2010/11 | -6.693 |
| 2011/12 | -13.743 |
| 2012/13 | -2.826 |
In context of the ongoing retreat, I would speculate that this retreat could make further retreat more likely because the acceleration from B) would cause ‘dynamic thinning’ that through a positive feedback would reduce glacier bed friction facilitating further thinning and acceleration. This feedback is an amplifier and not runaway but being activated would precondition Jakobshavn glacier for further retreat.
Espen Olsen suggests on the Arctic Sea Ice Forum:
Watch the speed of Jakobshavn over 9 days: