Sadly I missed the advance publicity for this event, part of which looked like this:
I’ve belatedly discovered that on November 27th at Westminster Central Hall:
Ten of the UK’s leading experts briefed an invite-only audience of around 1,250 politicians and leaders from business, culture, faith, sport and the media with the latest implications for health, food, national security and the economy.
According to the National Emergency Briefing’s web site:
These briefings are the clearest, most up-to-date picture of the climate and nature crisis in Britain. For the first time, the UK’s top experts give one integrated, unfiltered account of the risks and the solutions. This is the baseline the national conversation must now start from. Every policymaker needs to see it.
The talks will be available on our YouTube channel in the coming days…
A 45 minute documentary is now in production for release early next spring.
Whilst we wait for the official videos, here’s a summary of the event via Dave Borlace’s “Just Have a Think” YouTube channel:
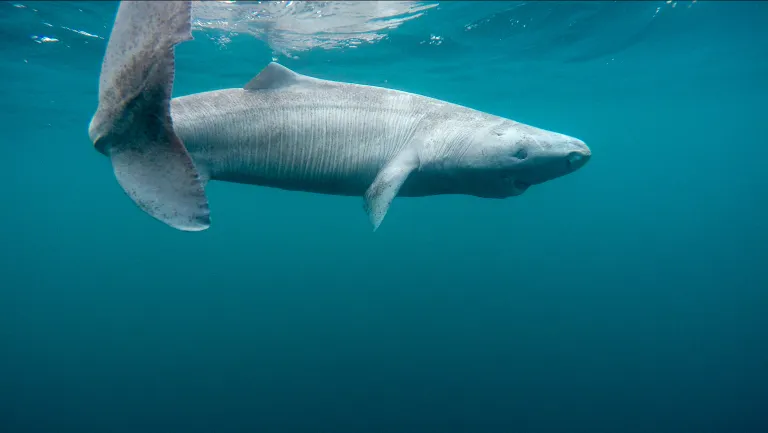
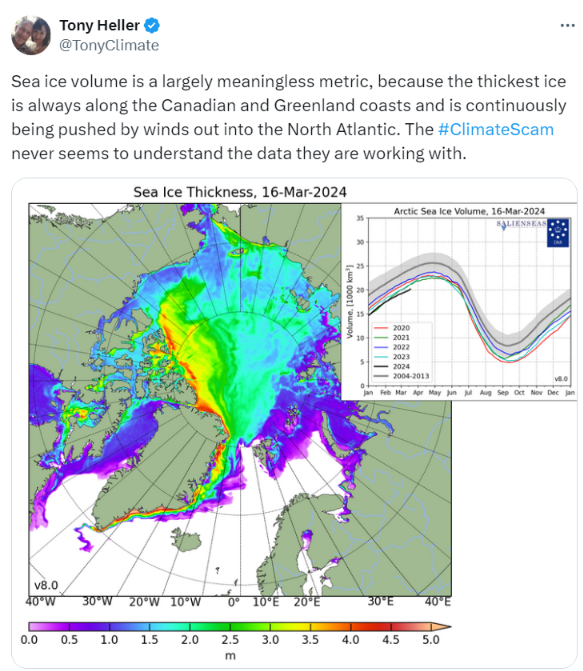
You will no doubt be astonished to learn that shark jumping supremo Tony Heller has just jumped over the entire East Greenland population of this long lived but officially vulnerable species. Without harming a single one!
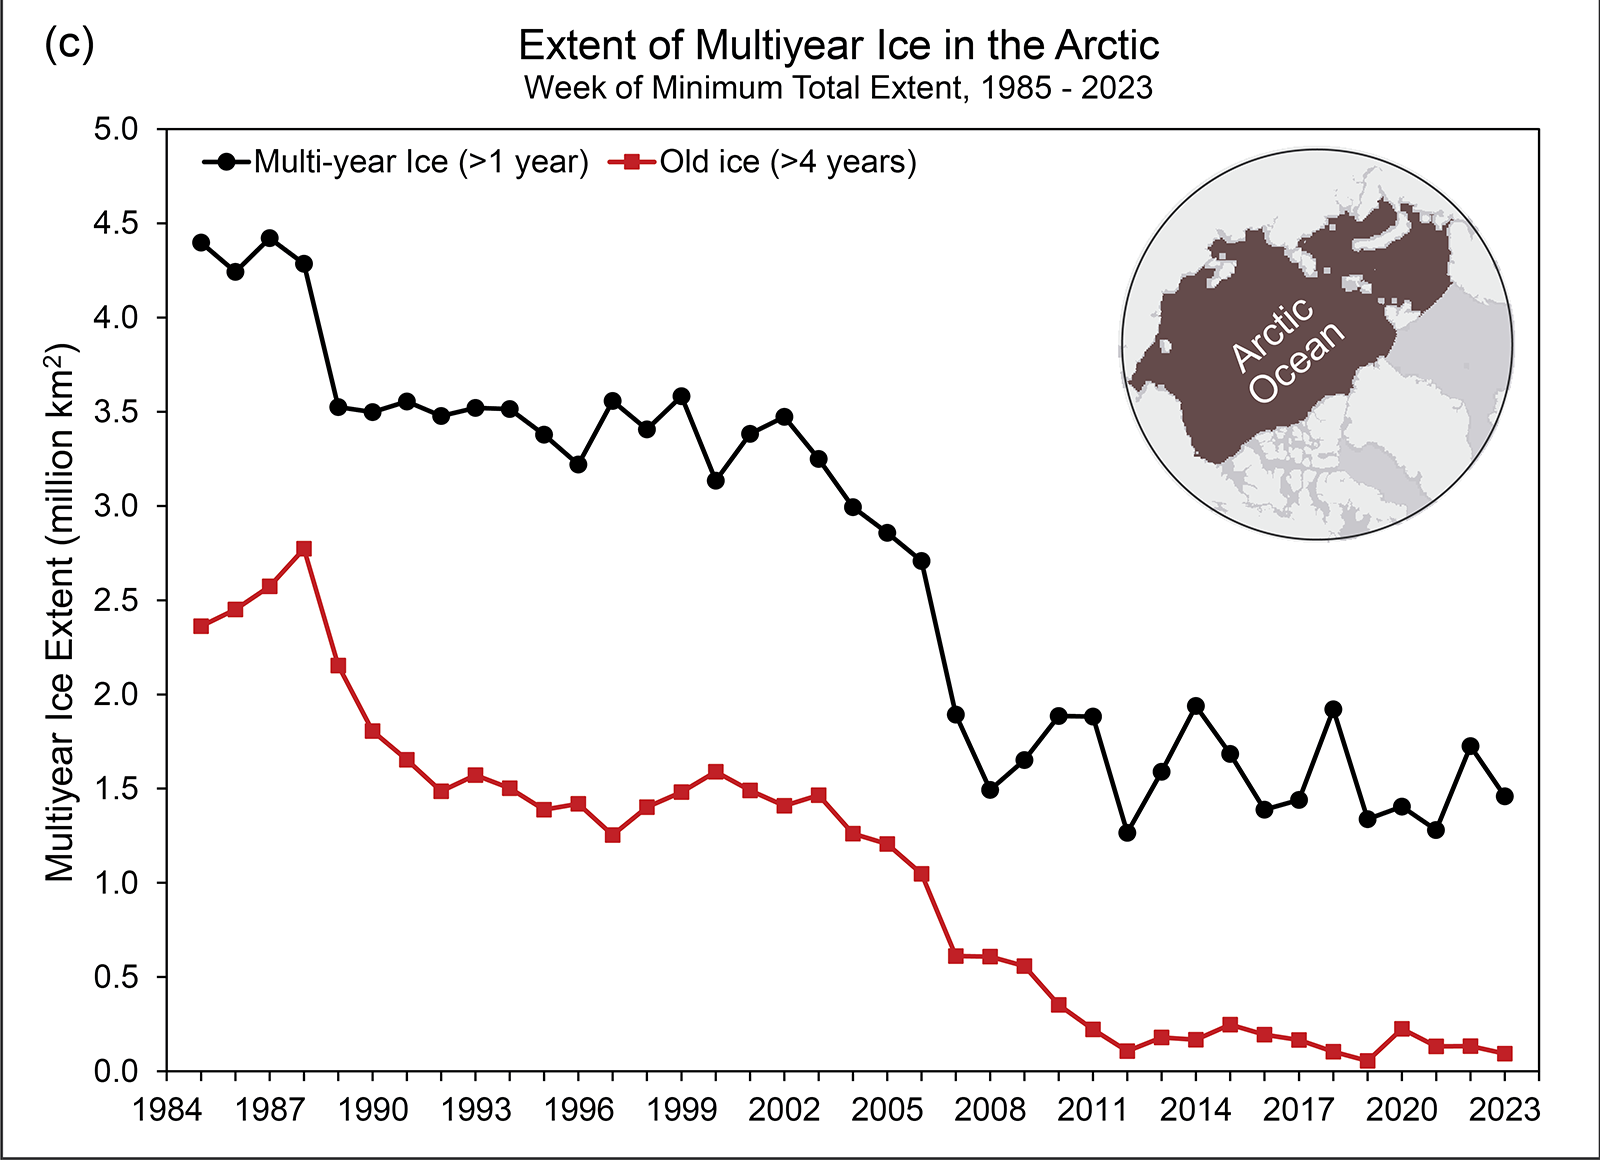
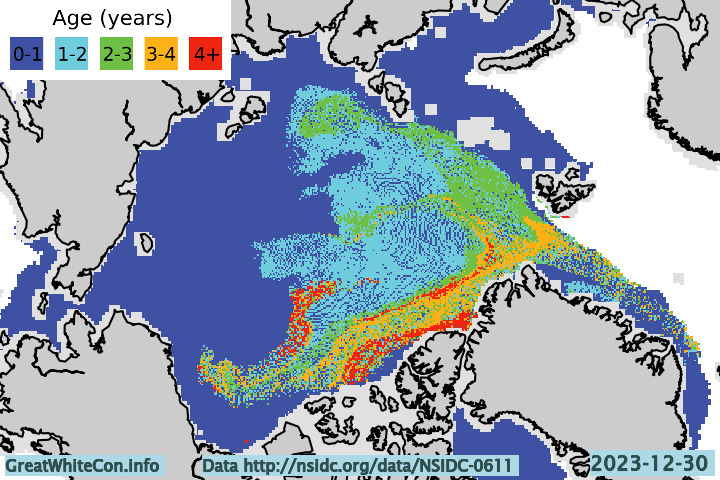
Over on XTwitter “Steve”/Tony was recently shown this video which graphically reveals the declining age of the sea ice in the Arctic Ocean:
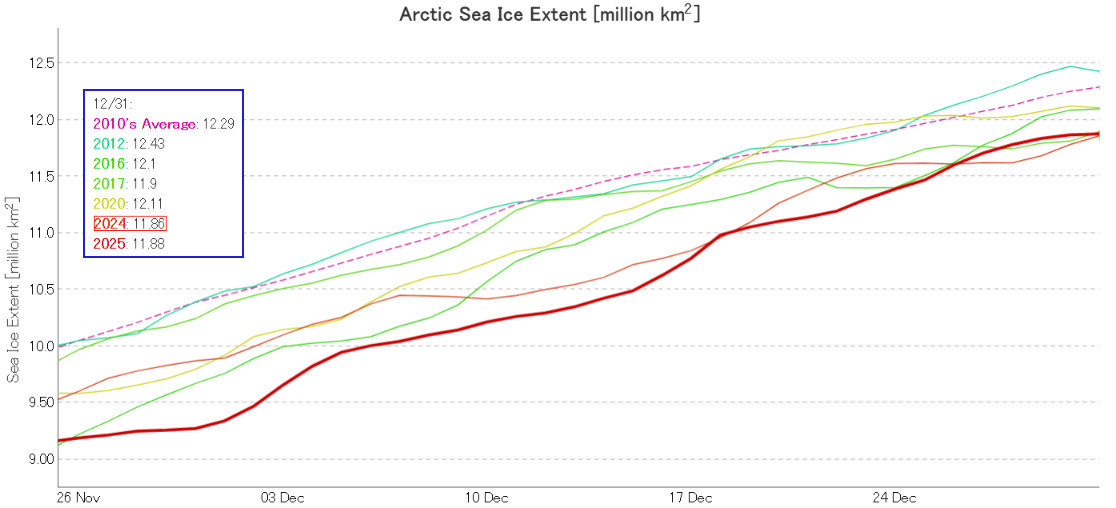
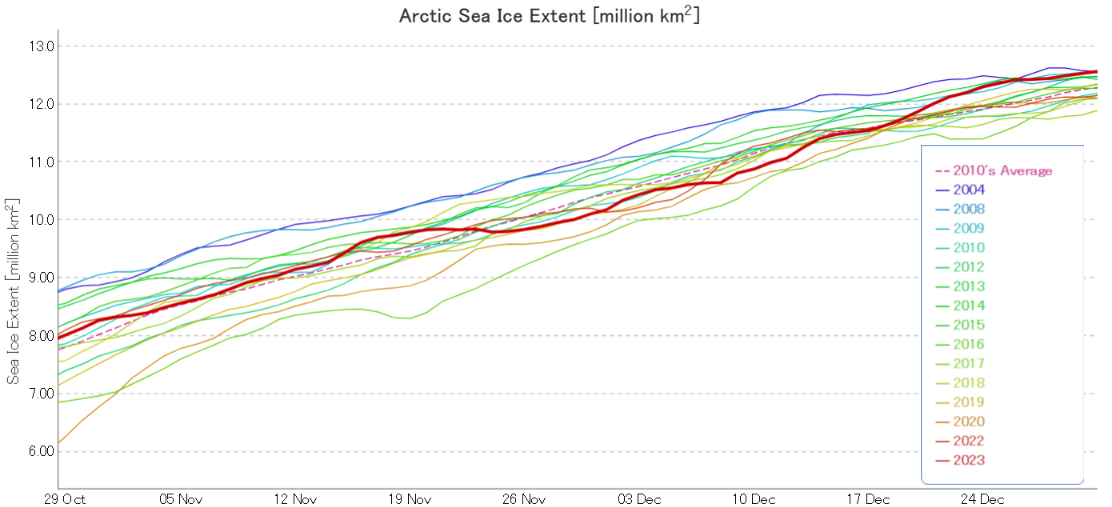
Whilst waiting for the all important thickness and volume data to arrive, we’ll start the new year in traditional fashion with a graph of JAXA extent:
The 2023 calendar year finished with this particular extent metric sitting at 15th lowest in the satellite era.
From Niall Dollard on the Arctic Sea Ice Forum comes evidence via the Sentinel 1A satellite that an arch formed in the Nares Strait between Greenland and Ellesmere Island in late December:
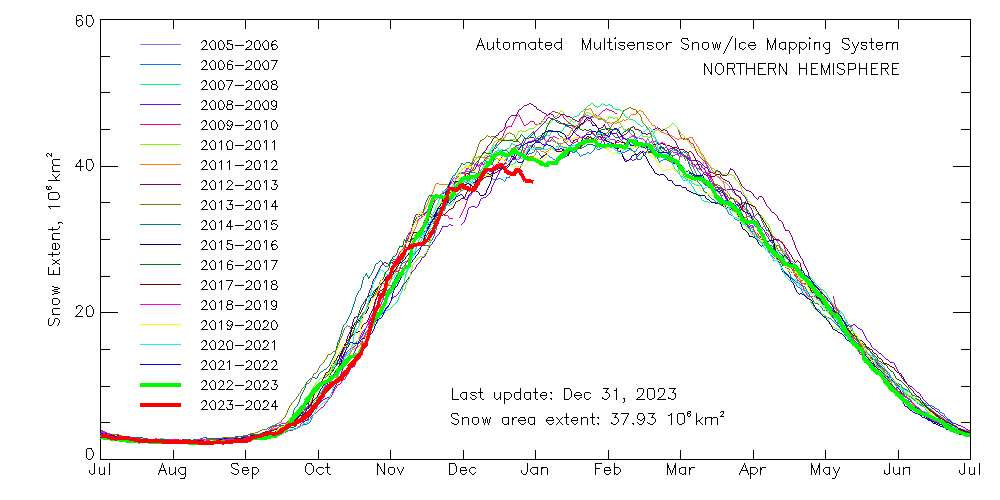
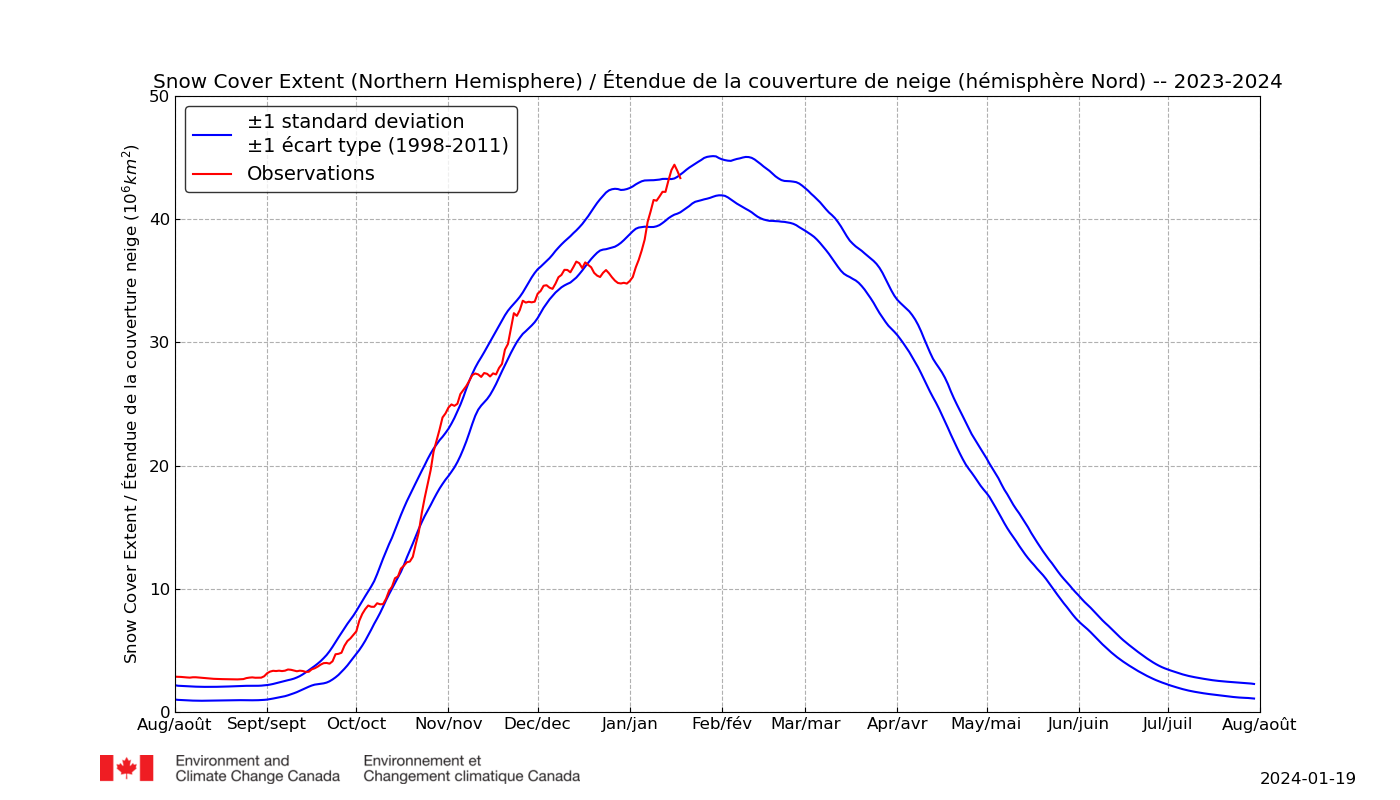
Please note the current record low NH snow extent. Matt predicts all that is about to change:
How sure? And in what way "totally different"?
Have you pointed out to Tony yet that the current daily snow cover data you cite utterly negates his recent assertion that "Autumn/Winter snow cover has been increasing for almost 60 years"?
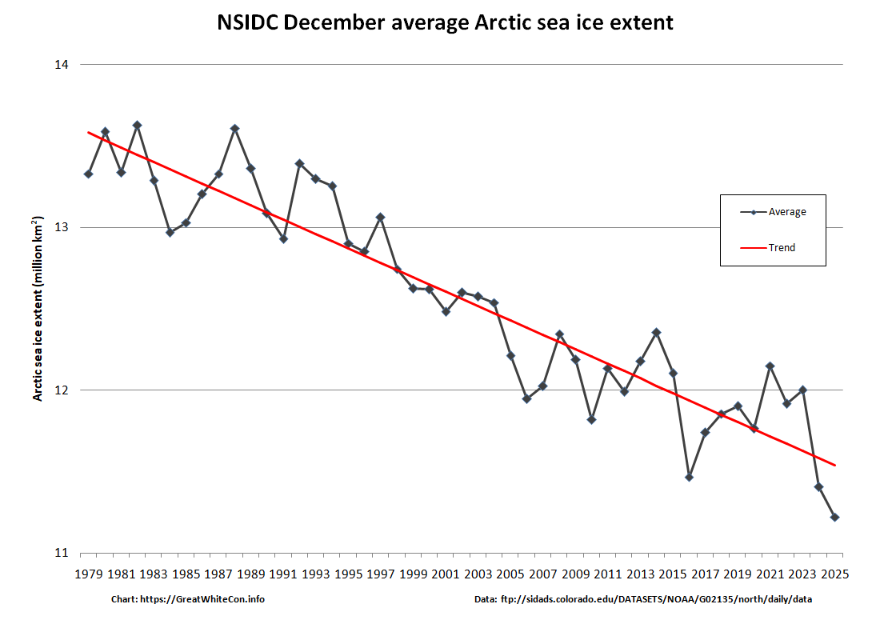
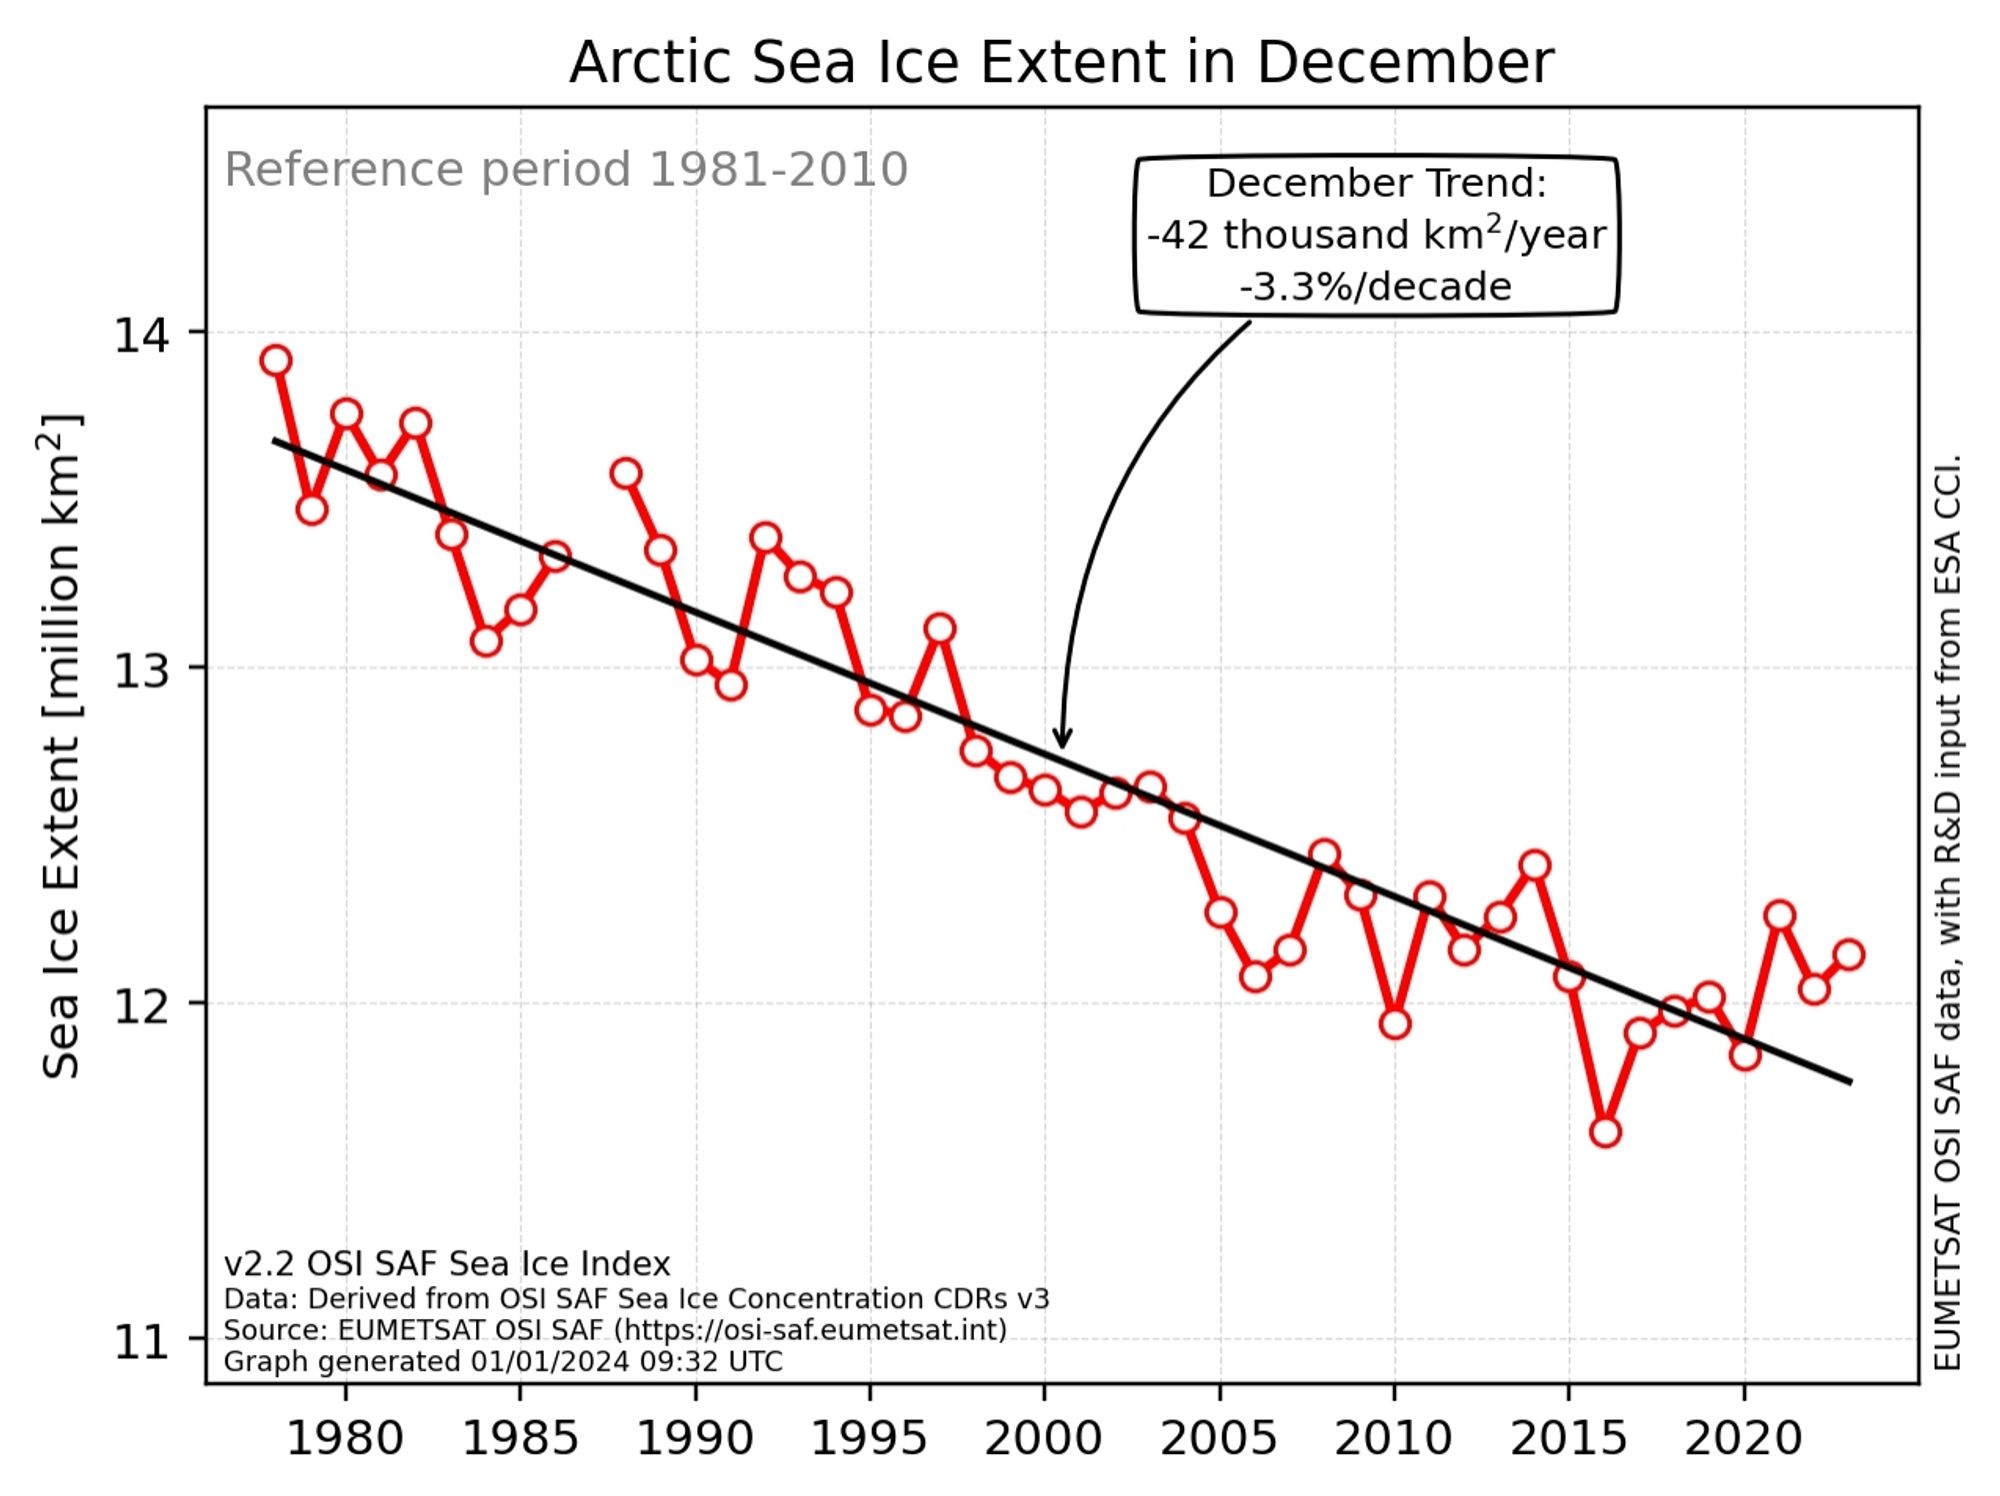
Hot off the Scandinavian virtual printing presses, here is the official December Arctic sea ice extent trend graph from the OSI SAF:
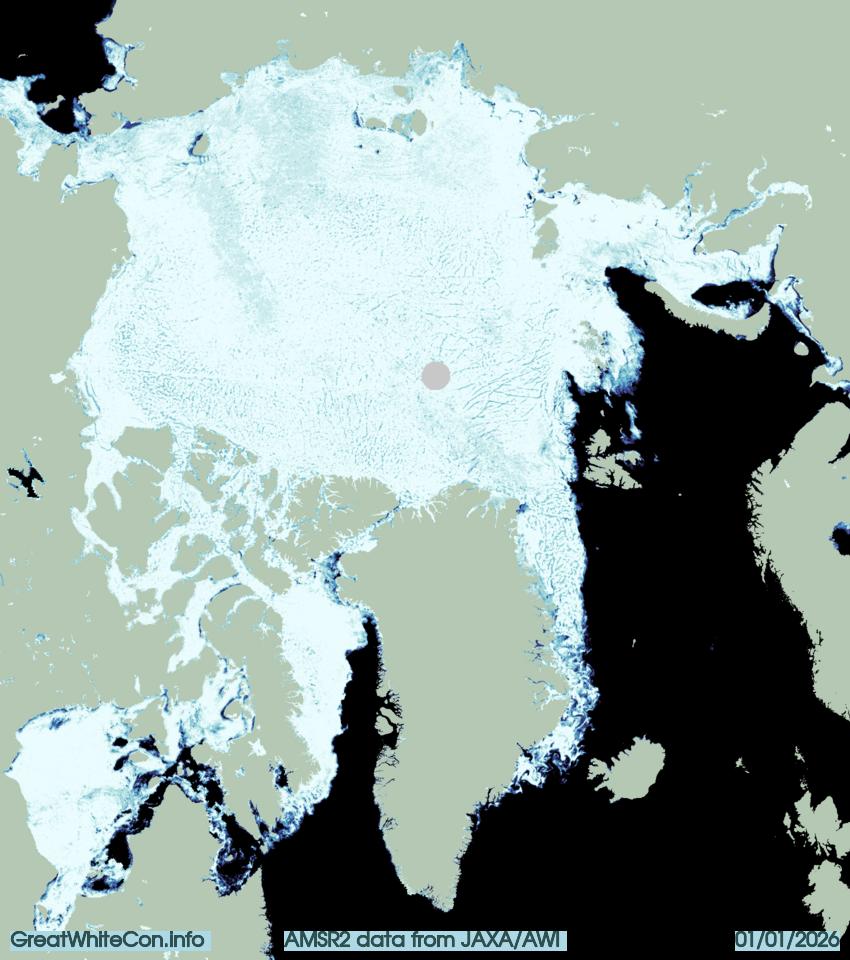
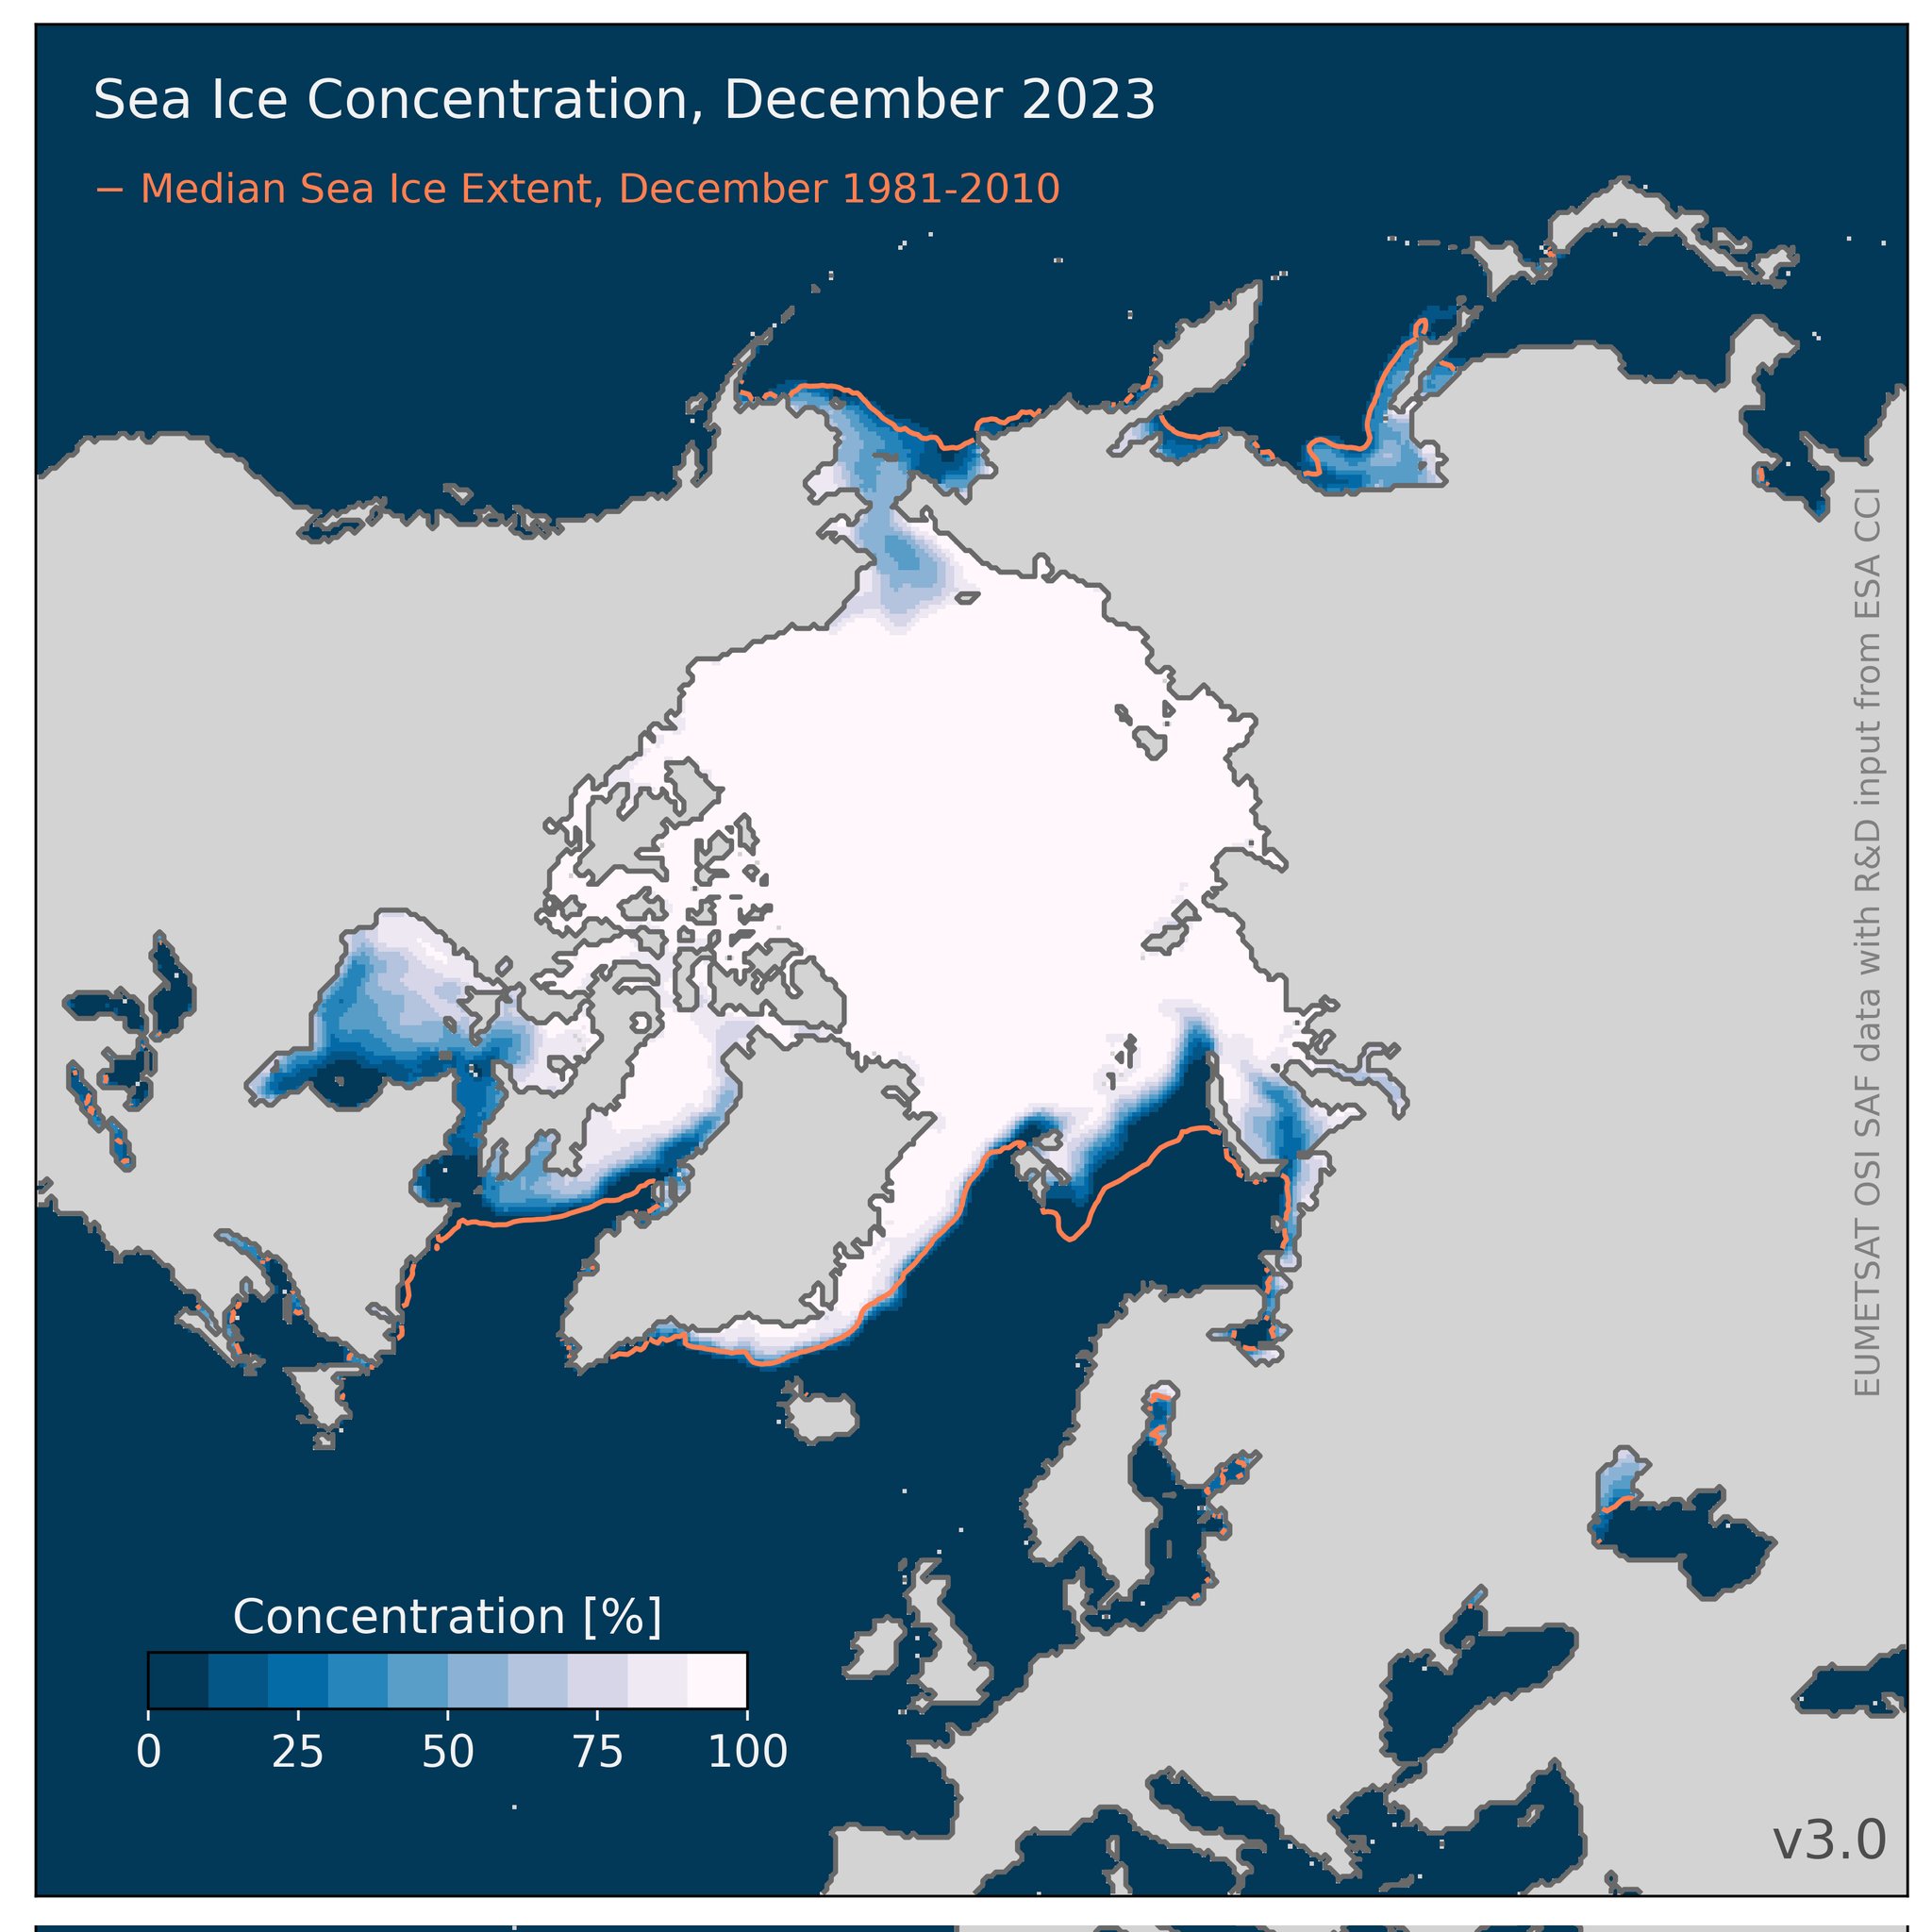
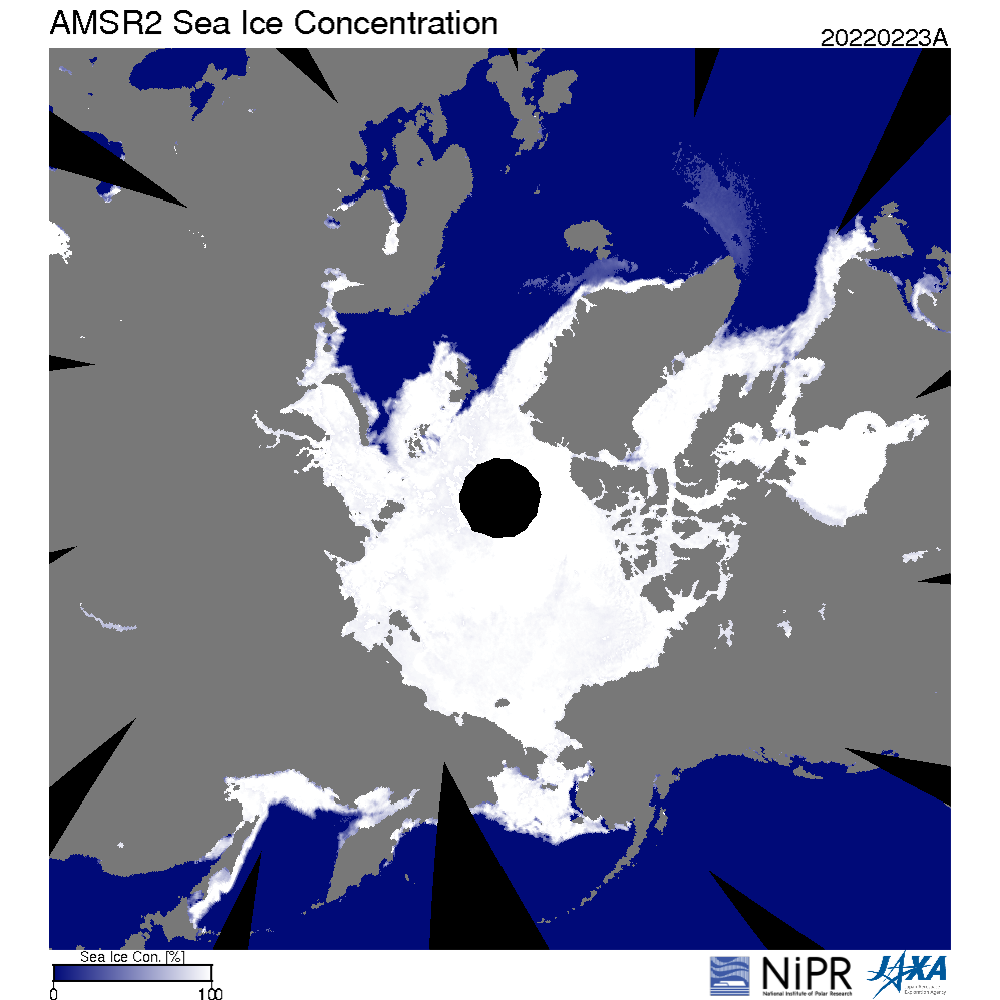
That’s “Steve”/Tony’s current metric du jour. When do you suppose he will bring it to the attention of his horde of regular readers? It’s accompanied by this matching concentration map:
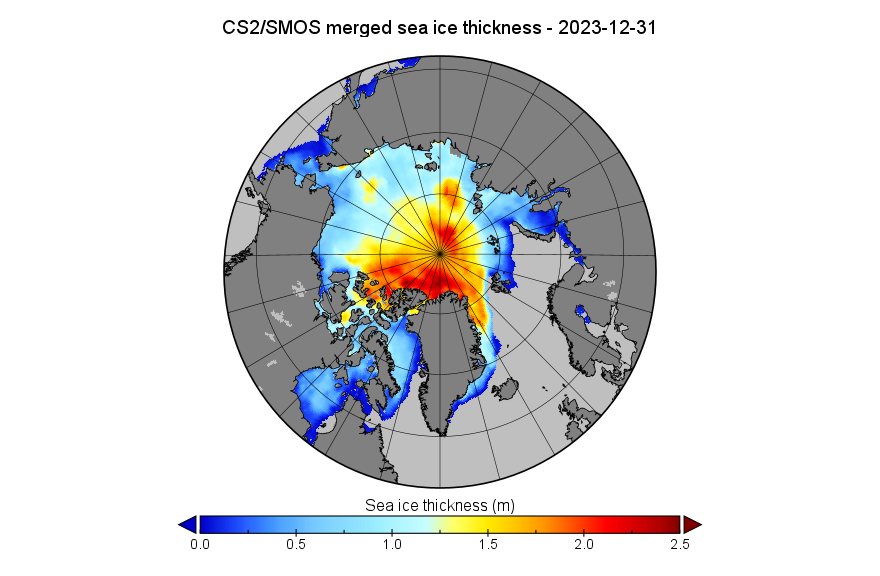
Here too is the CryoSat-2/SMOS thickness map for December 31st, in a different format to the one usually used here:
[Update – January 3rd]
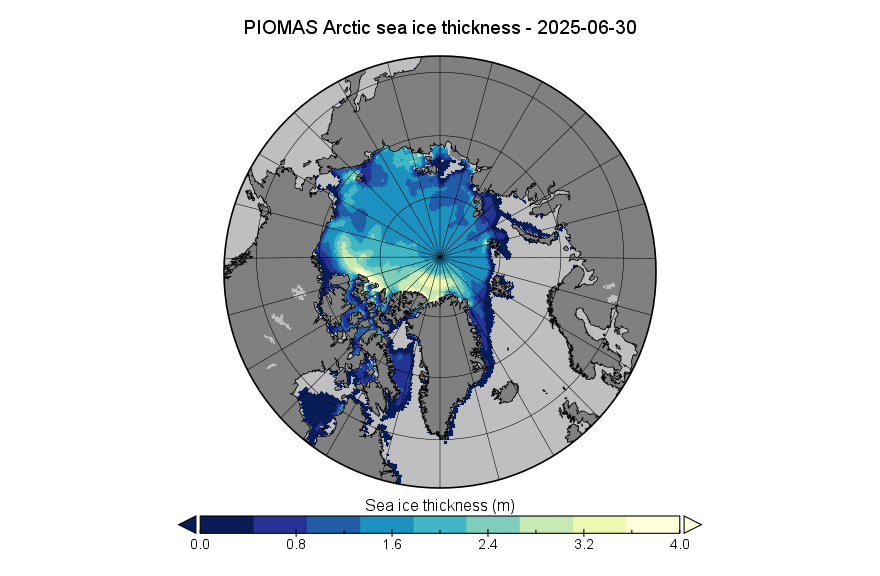
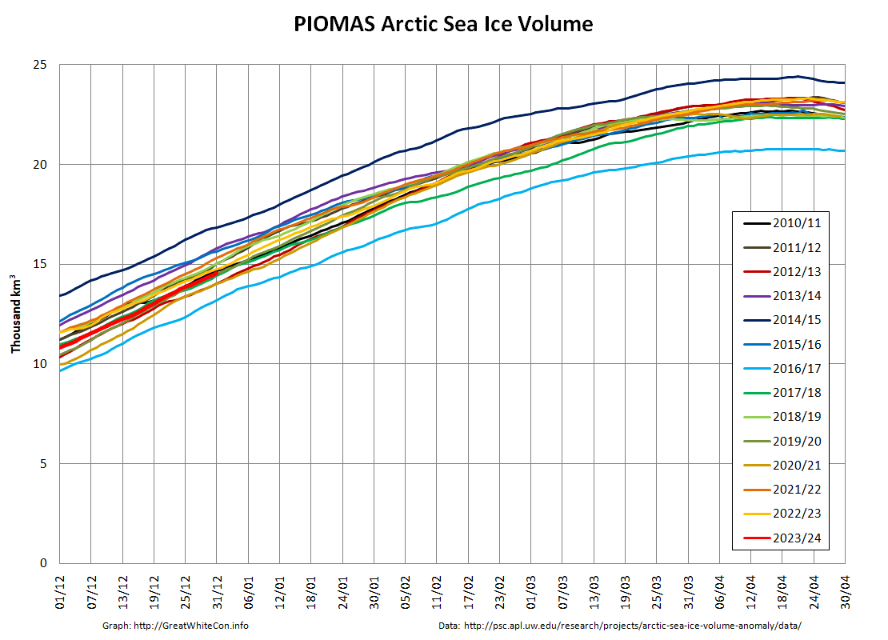
The December PIOMAS modelled gridded thickness data has been released. The calculated volume is 6th lowest in the satellite era:
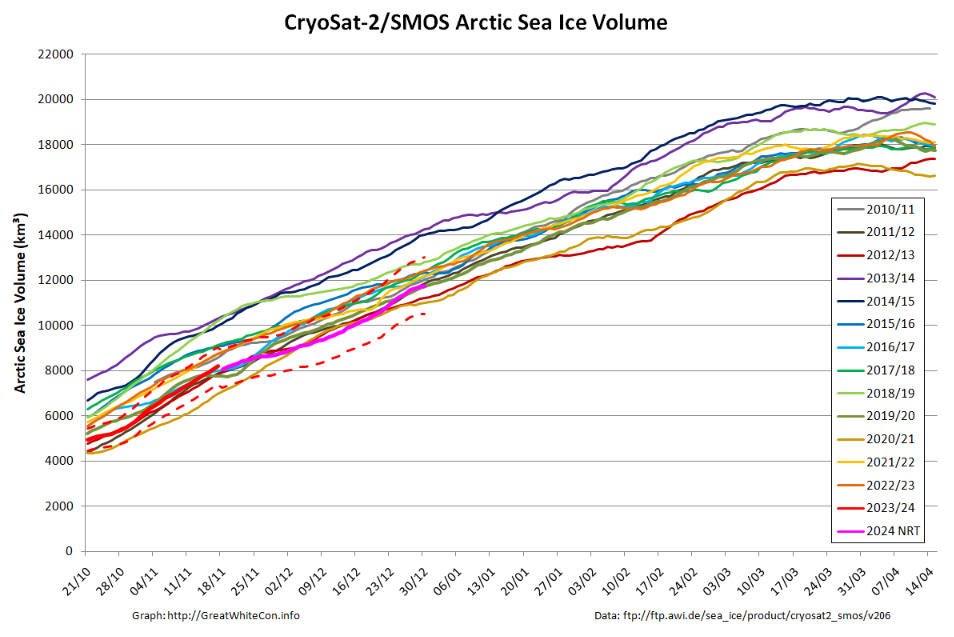
Here is the equivalent CS2/SMOS volume graph
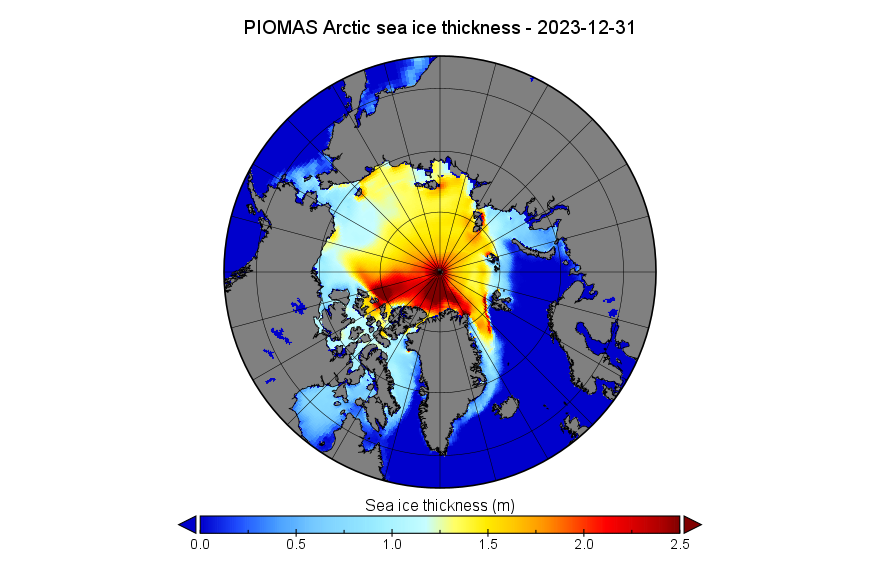
Here too is the PIOMAS thickness map for December 31st:
This uses the same Greenland down orientation and 2.5 meter maximum scale value as the CS2/SMOS map above.
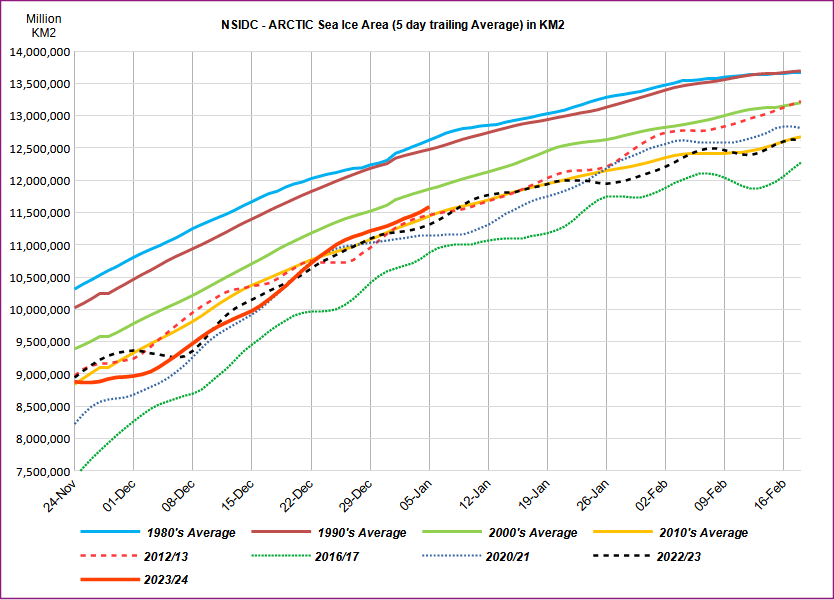
The end of 2023 had above average sea ice growth, bringing the daily extent within the interdecile range, the range spanning 90 percent of past sea ice extents for the date. Rapid expansion of ice in the Chukchi and Bering Seas and across Hudson Bay was responsible.
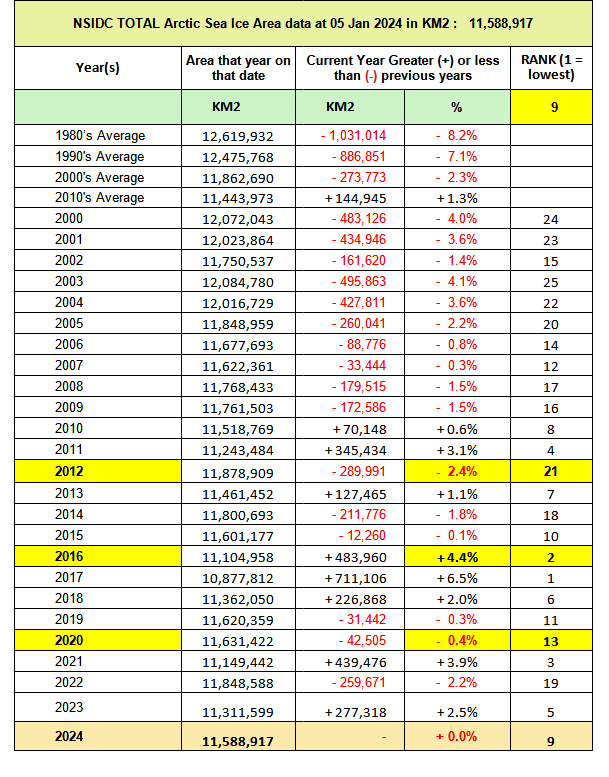
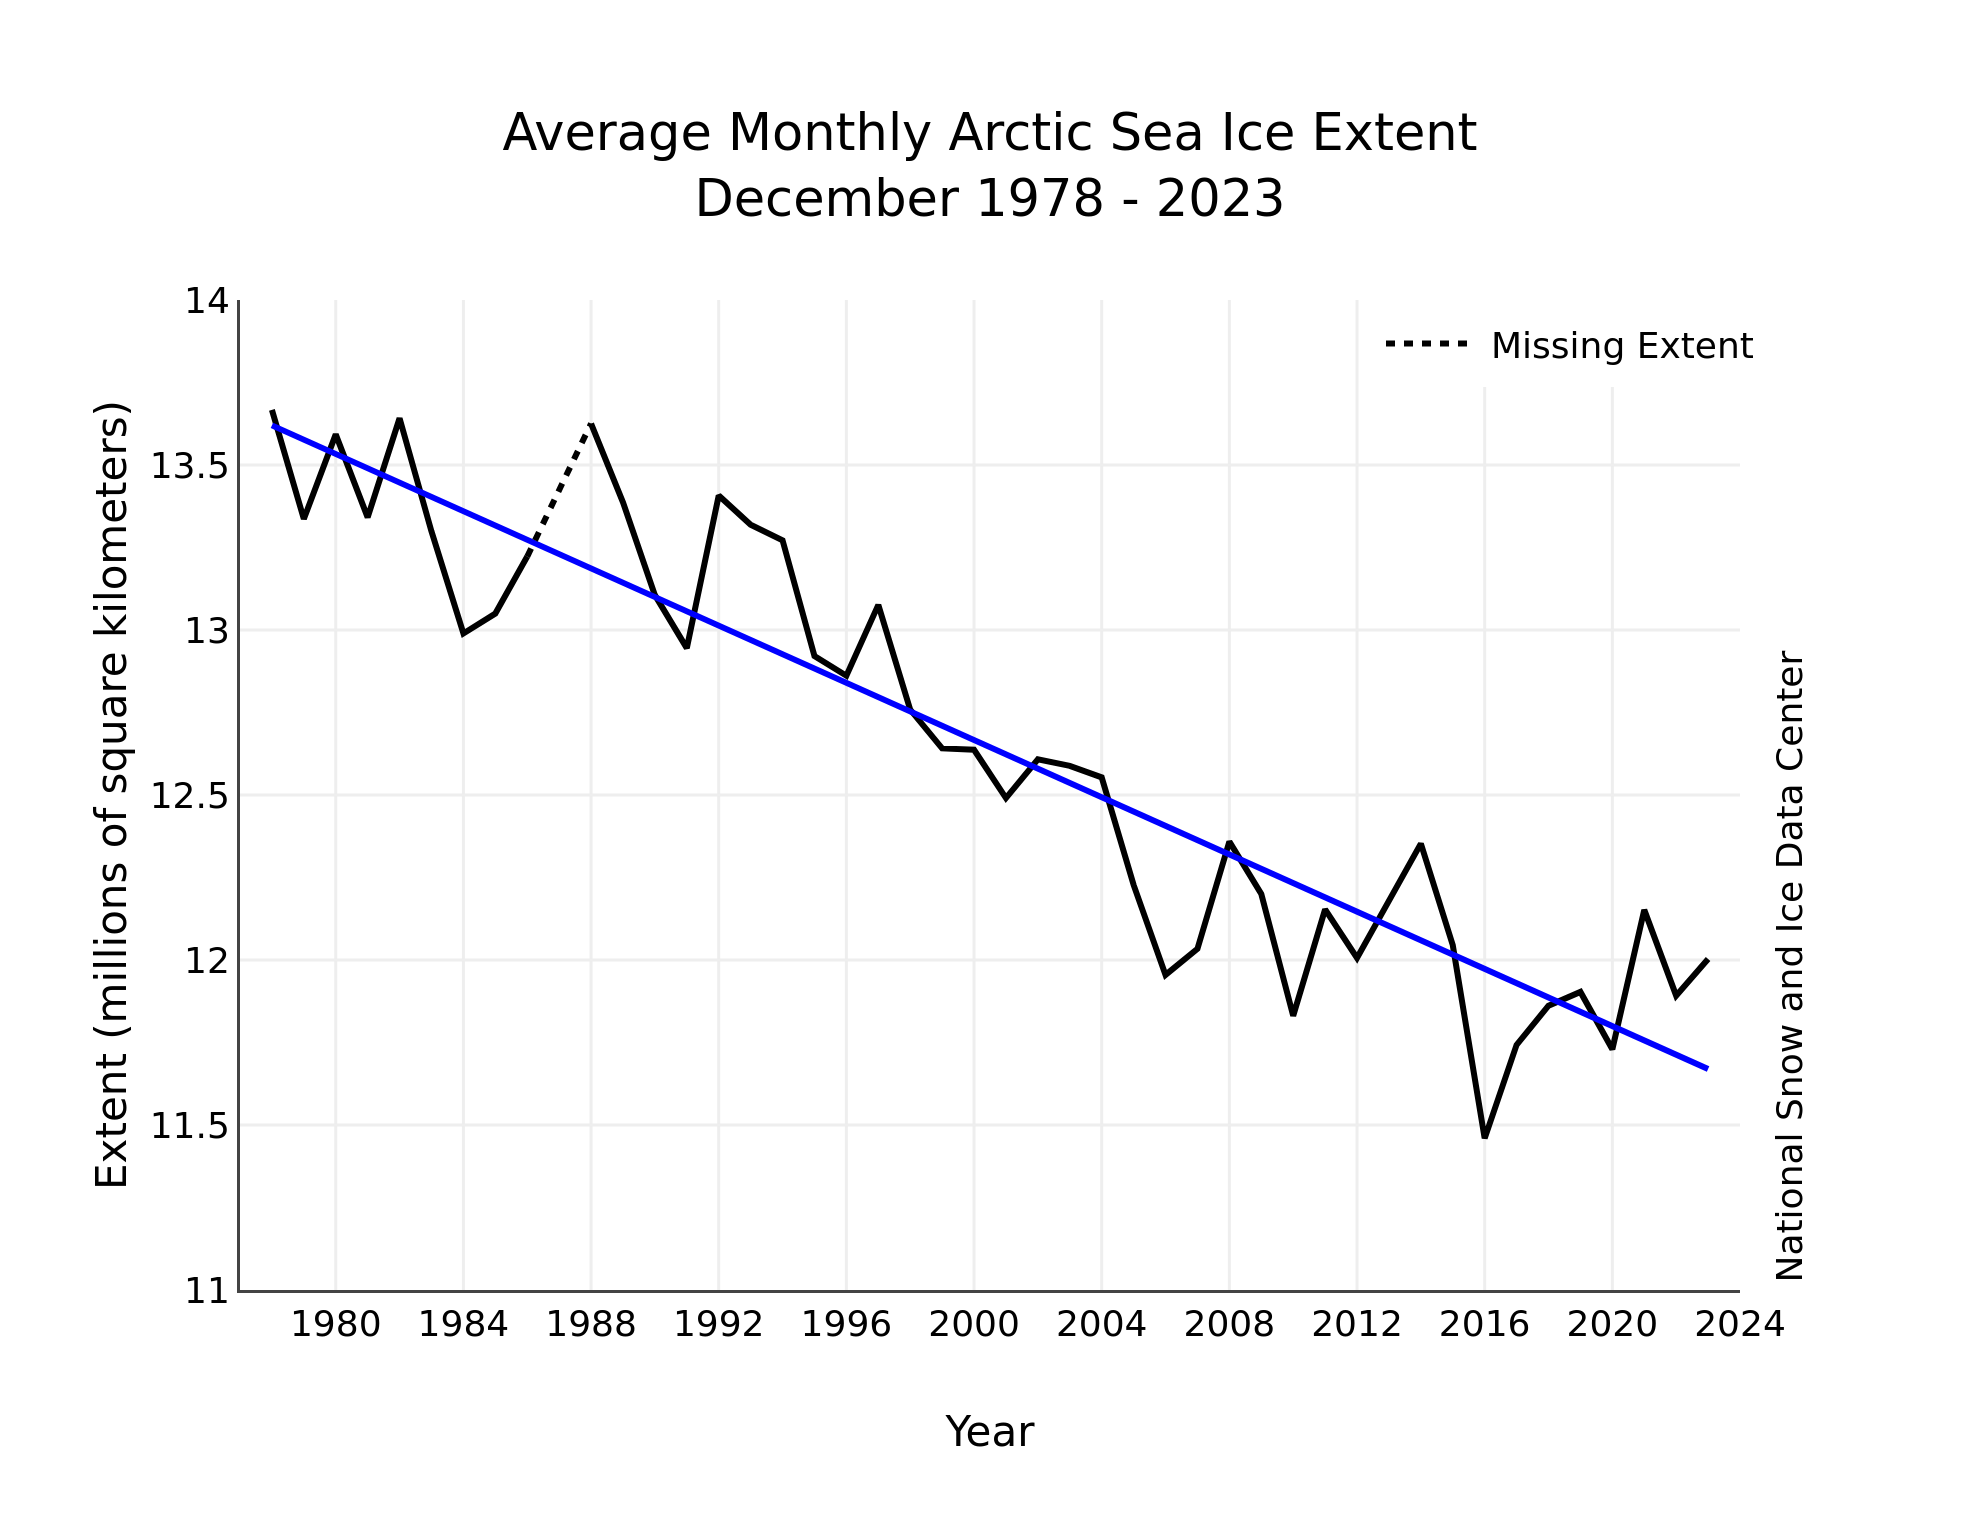
Average Arctic sea ice extent for December 2023 was 12.00 million square kilometers, ninth lowest in the 45-year satellite record . Sea ice extent increased by an average of 87,400 square kilometers per day, markedly faster than the 1981 to 2010 average of 64,100 square kilometers per day.
After a delayed start to the freeze-up in Hudson Bay, sea ice formed quickly from west to east across the bay, leaving only a small area of open ocean near the Belcher Islands at month’s end. In the northern Atlantic, sea ice extent remained below average extent, as has been typical for the past decade.
For December overall, 2023 had the third highest monthly gain in the 45-year record at 2.71 million square kilometers, behind 2006 at 2.85 million square kilometers and 2016 at 2.78 million square kilometers.
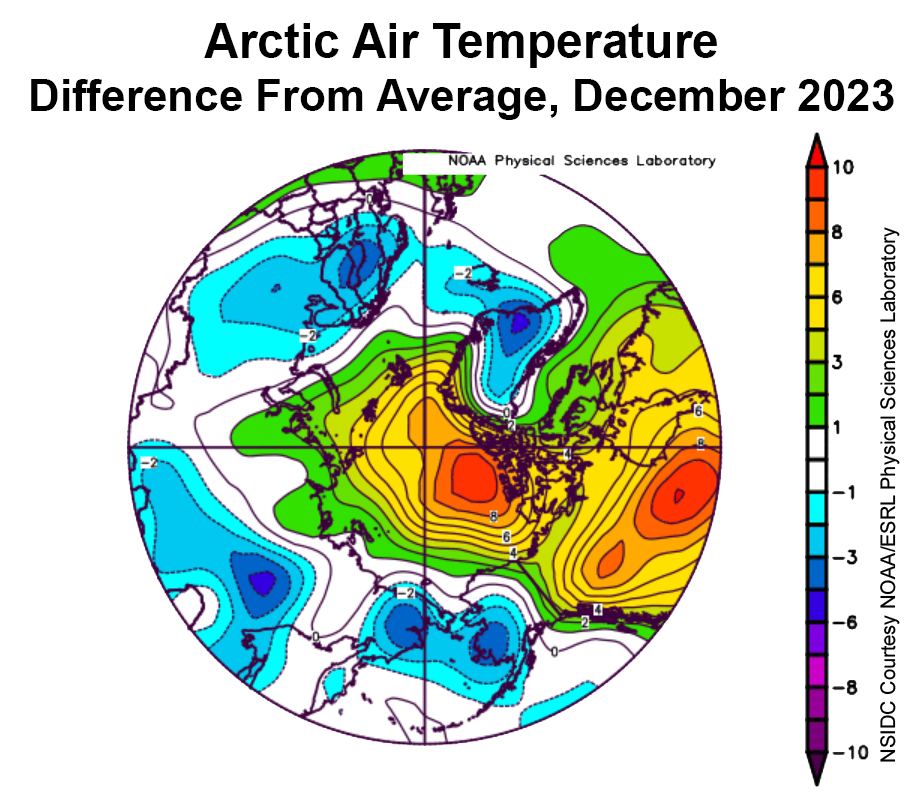
Moving on to the “Conditions in context” section:
Warm conditions prevailed over the central Arctic Ocean and Beaufort Sea regions, as well as over Hudson Bay and much of northern Canada, with air temperatures at the 925 millibar level (around 2,500 feet above sea level) 8 to 9 degrees Celsius above the 1991 to 2020 average. Elsewhere, relatively cool conditions prevailed, with air temperatures 2 to 4 degrees Celsius below average in southwestern Alaska, easternmost Russia, Scandinavia, and southeast Greenland. Cool conditions in the Bering and southern Chukchi Seas explain the rapid ice growth there. By contrast, the warm conditions over Hudson Bay, continuing since November, explain its delayed start of ice formation there.
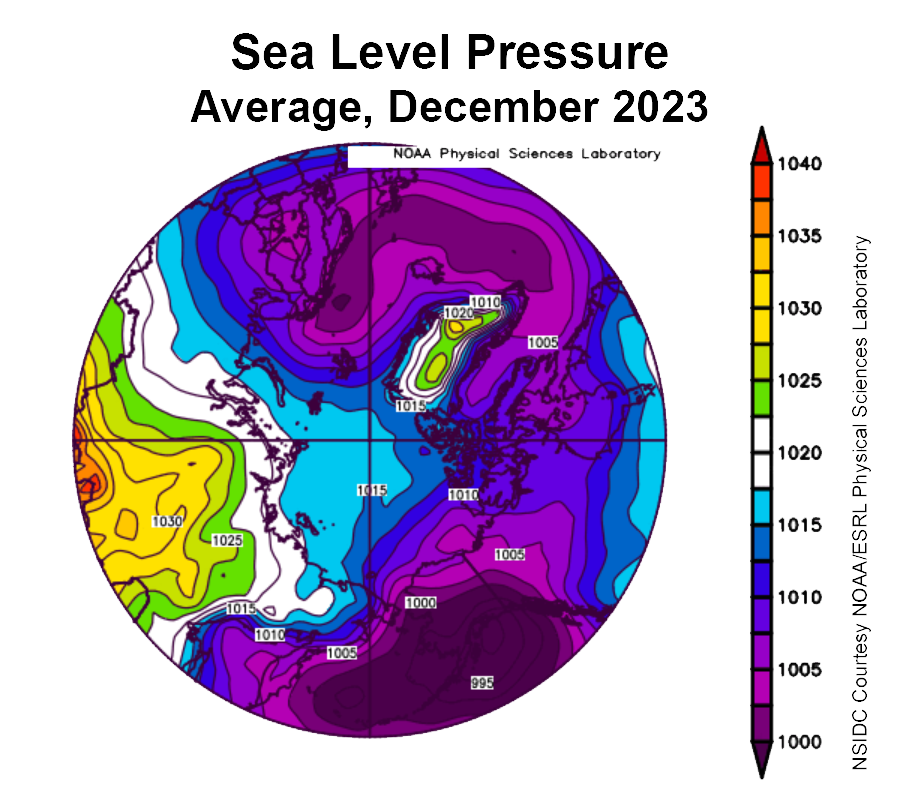
The atmospheric circulation pattern for December was marked by low sea level pressure over the Gulf of Alaska and northern Europe and high sea level pressure over central Russia. This pattern led to cold Arctic air flowing across the Chukchi Sea and into the Bering Sea as well as advection of relatively warm air across Canada into the Beaufort Sea:
Here’s a taste, but there’s much more at the dedicated article linked to above:
[Update – January 12th]
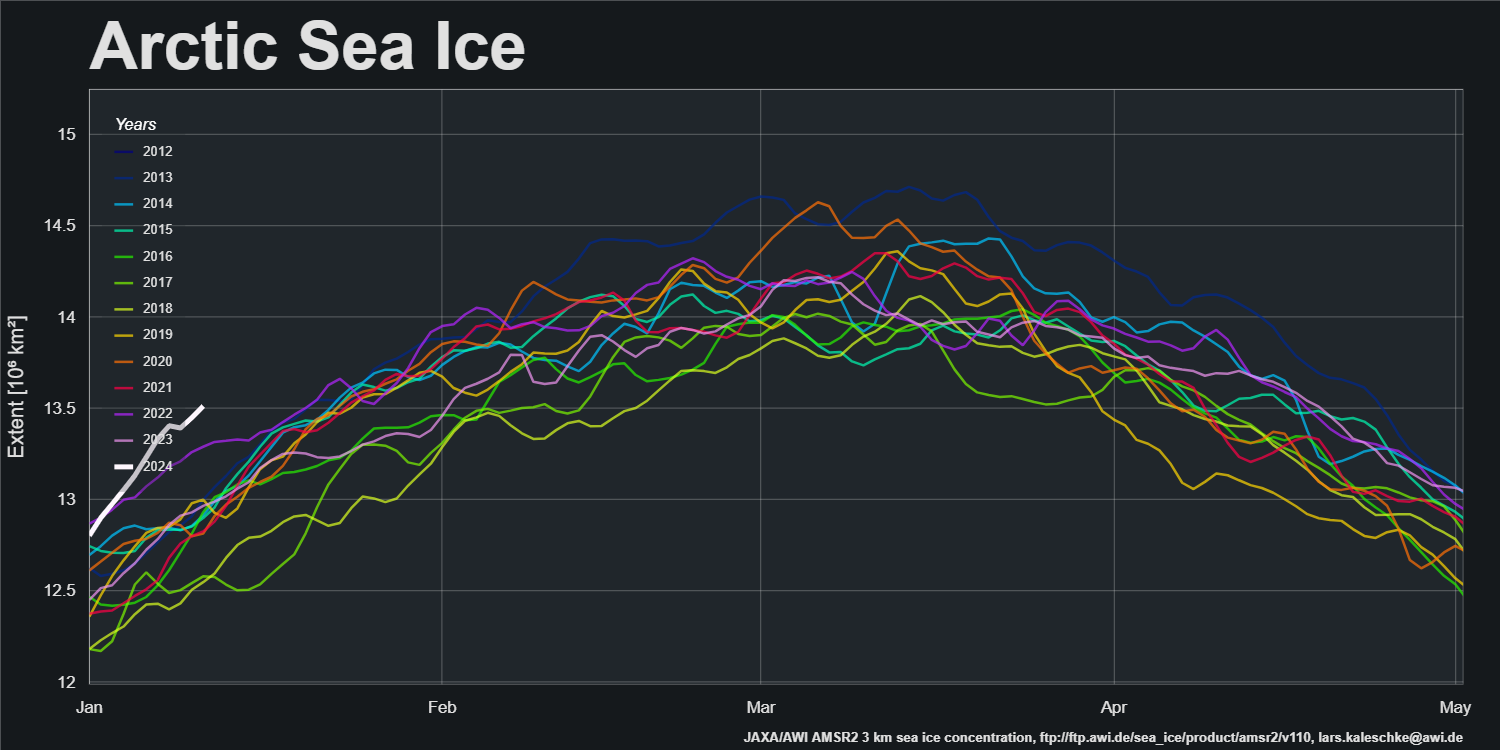
A change is as good as a rest, so here’s the AWI “high resolution” AMSR2 Arctic wide sea ice extent graph
It’s currently highest for the date in the AMSR2 era by a significant margin.
Here too is the ice age map for the end of 2023:
[Update – January 19th]
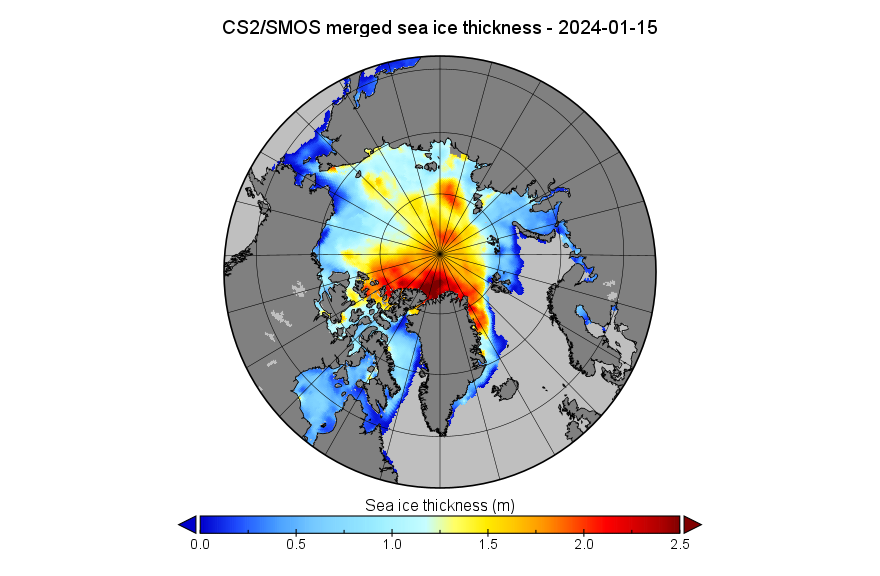
Something seems to have gone wrong with the processing of the mid-month PIOMAS gridded thickness data. For the moment we’ll have to make do with just the CryoSat-2/SMOS thickness map:
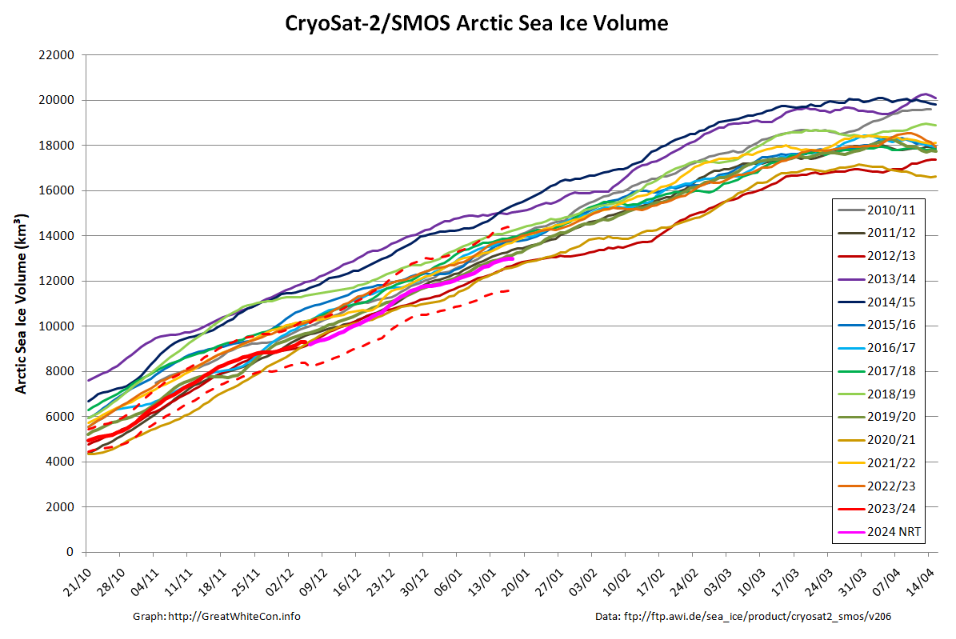
and volume graph:
With the perennial caveat of a probable upward revision when the reanalysed data is released, Arctic sea ice volume is still close to the bottom of the range during the CryoSat-2 era.
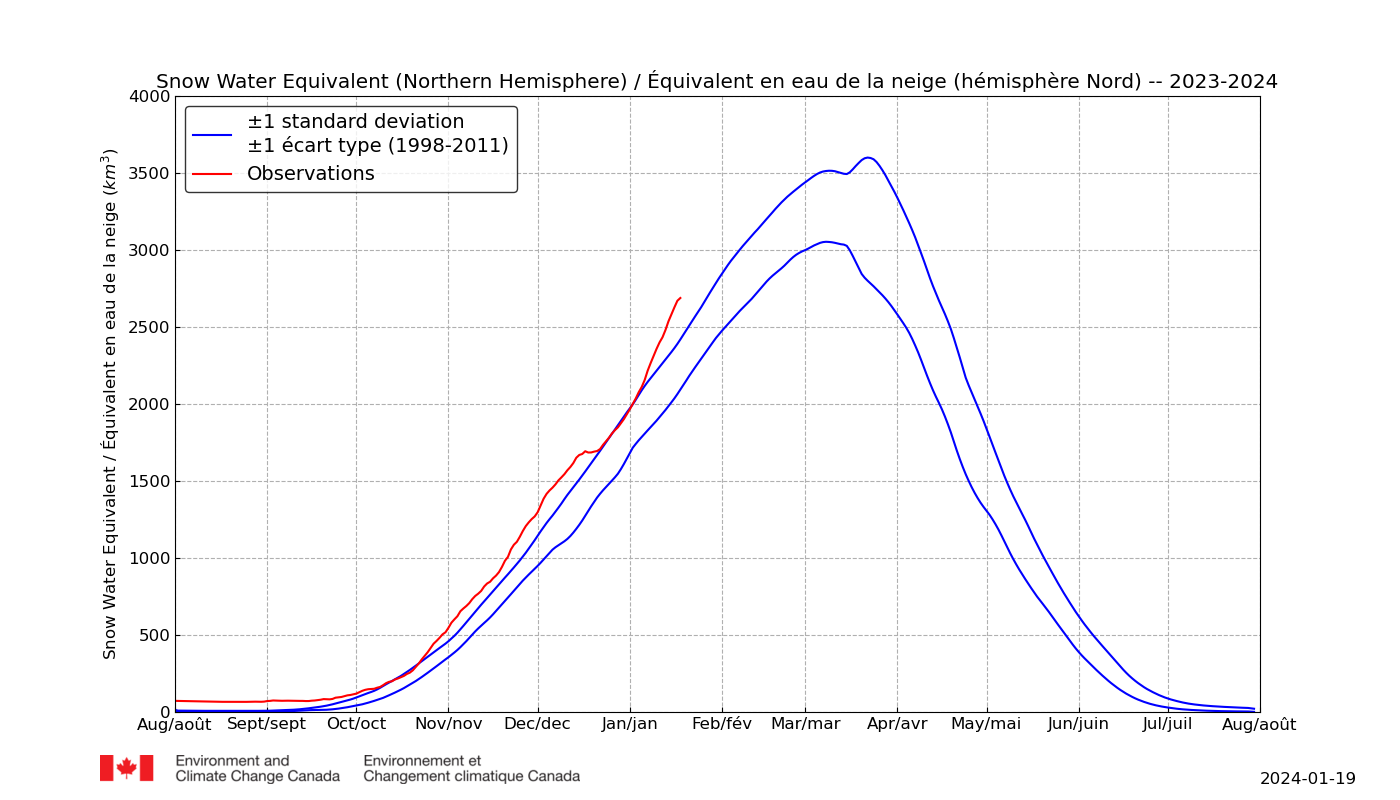
In addition especially for Matt, “Steve”/Tony and numerous others of a “skeptical” persuasion, here are the latest Environment & Climate Change Canada snow extent and snow water equivalent graphs for the northern hemisphere:
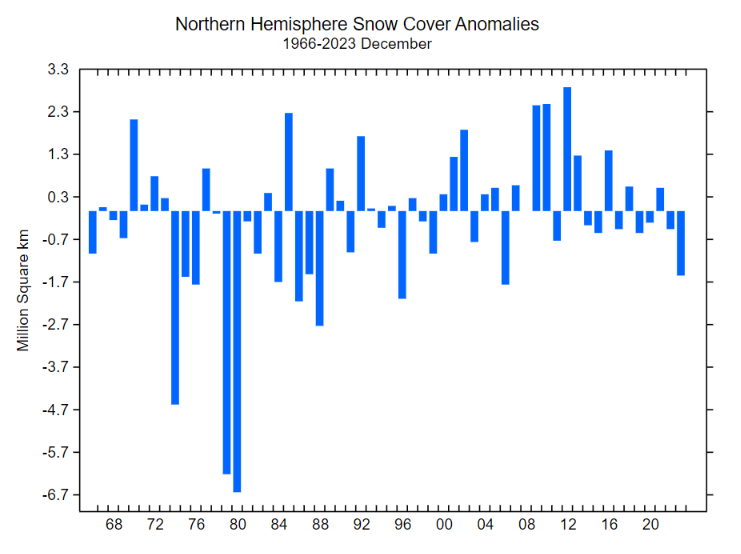
Last but certainly not least is the Rutgers Global Snow Lab northern hemisphere snow cover anomaly chart for December:
[Update – January 29th]
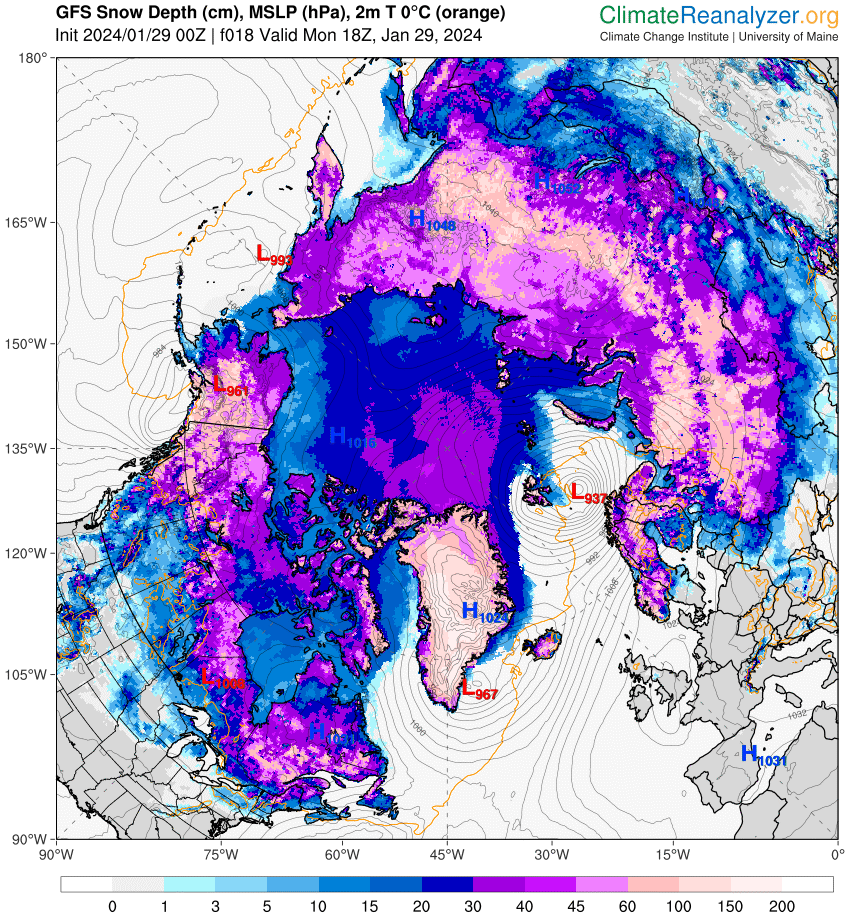
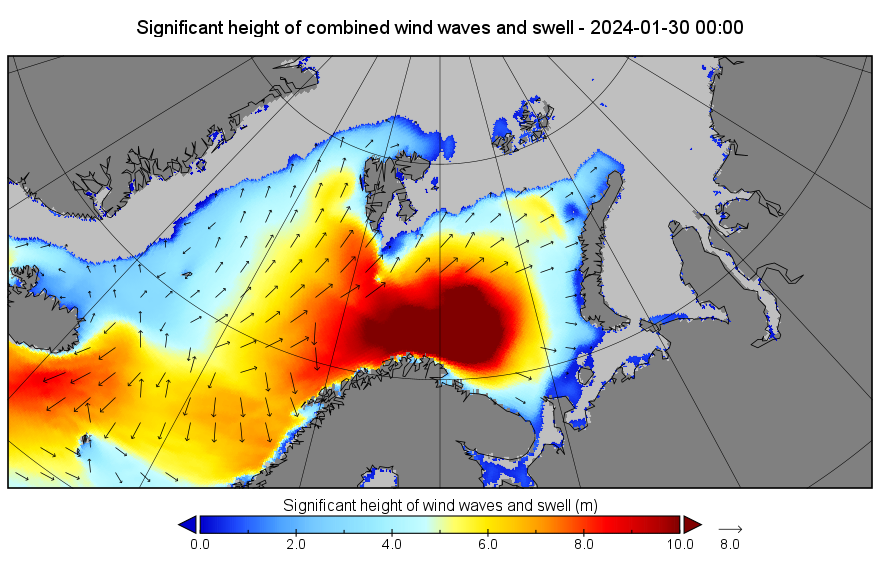
A winter cyclone is stirring up the far North Atlantic. It’s currently forecast to bottom out later today with a minimum MSLP of 937 hPa:
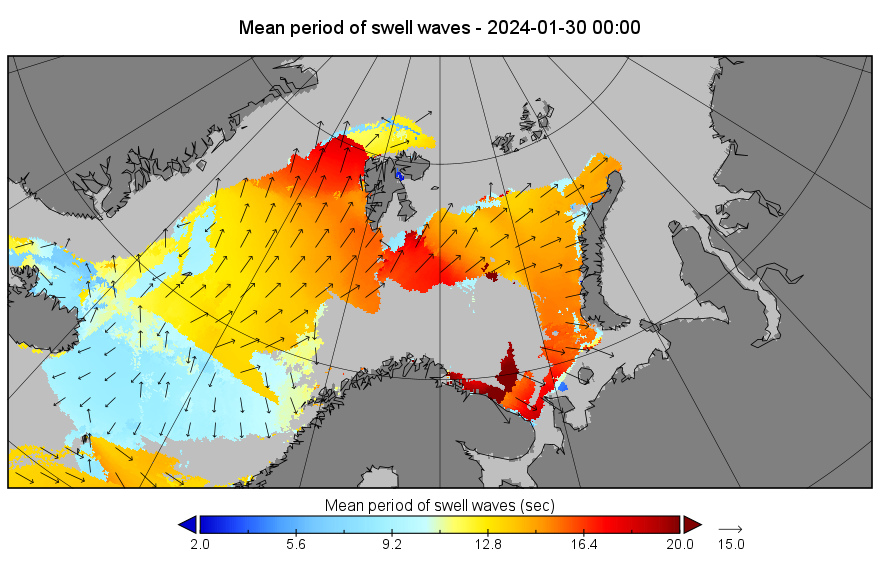
The storm has been creating a long period swell directed at the ice edge in the Barents Sea. By midnight that swell will be battering the ice in the Fram Strait too:
[Update – January 30th]
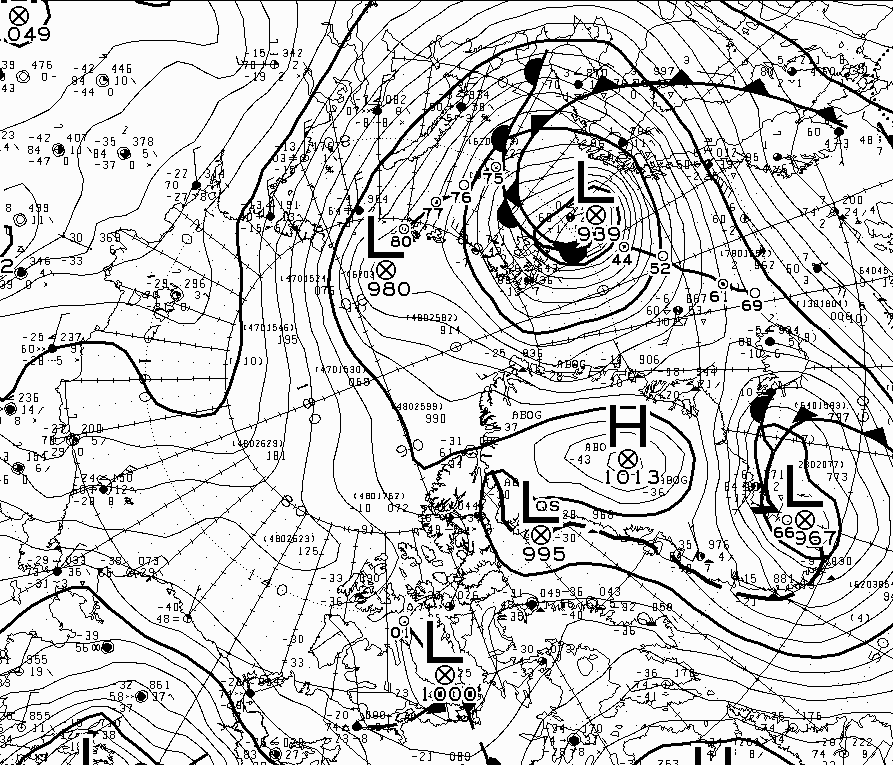
According to Environment Canada the cyclone bottomed out with an MSLP of 939 hPa at 12 PM UTC yesterday:
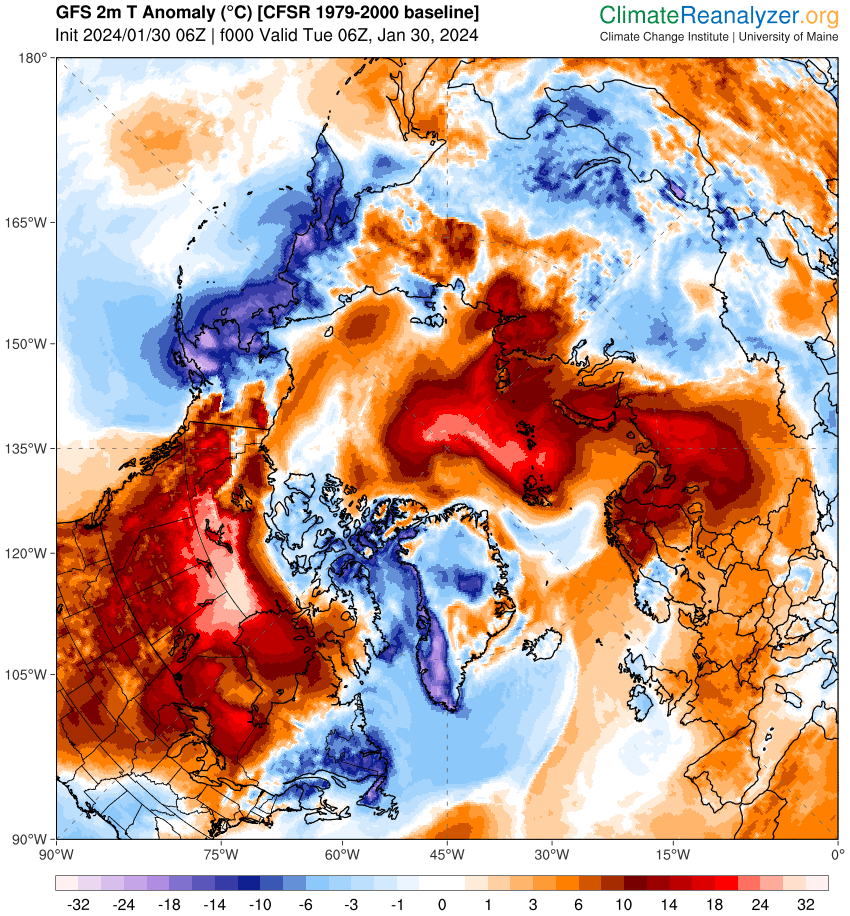
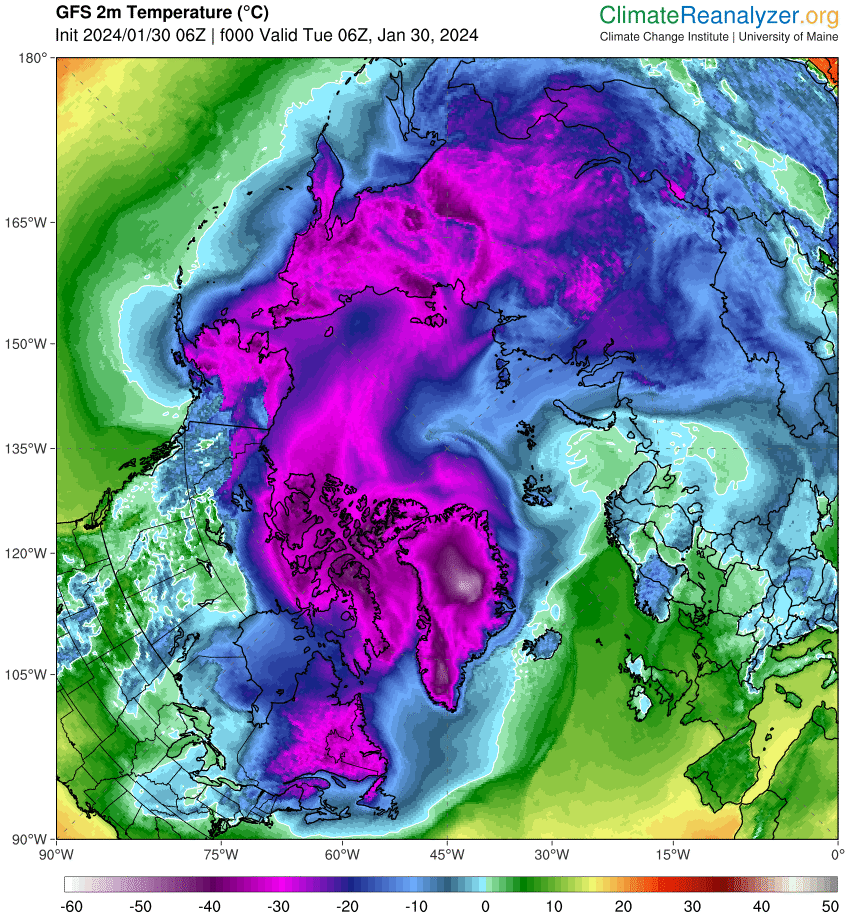
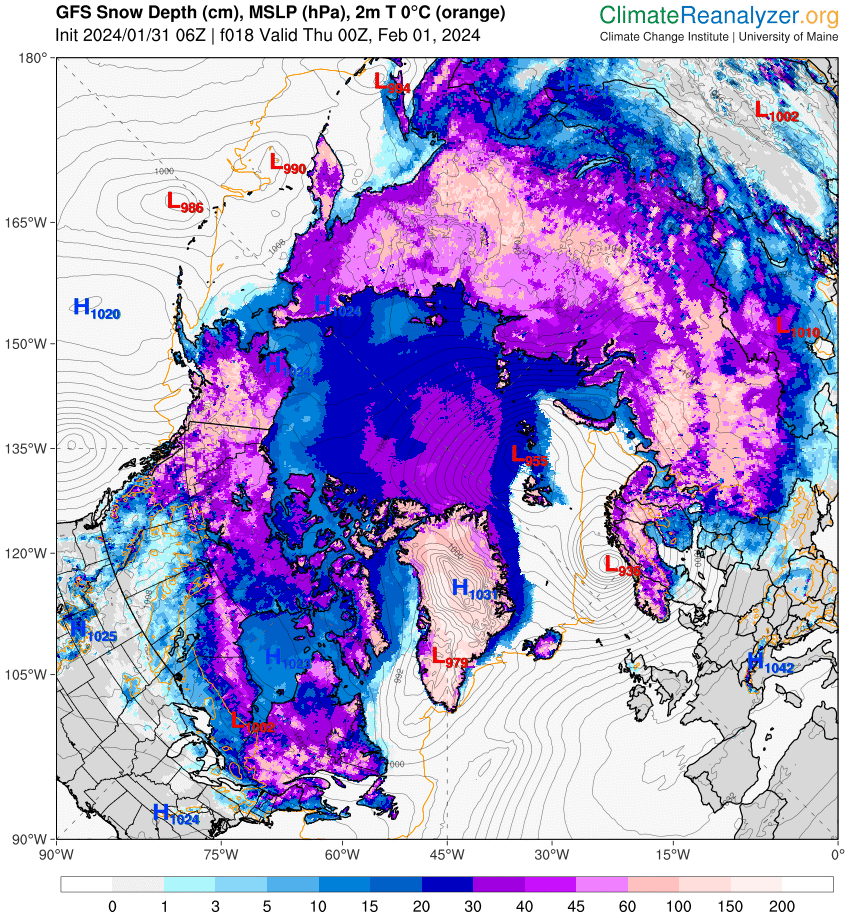
Associated with the storm is a pulse of abnormally warm air reaching to the North Pole and beyond:
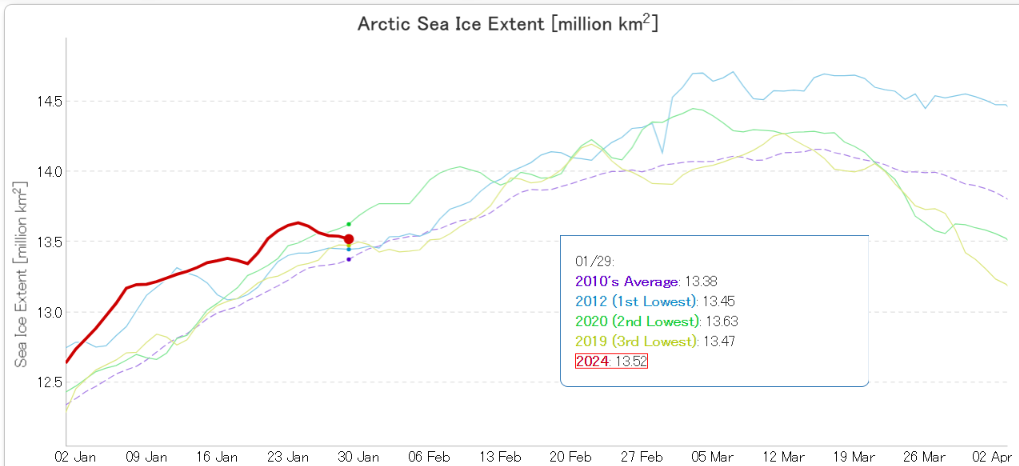
Here’s how JAXA extent looks as the big swell arrives:
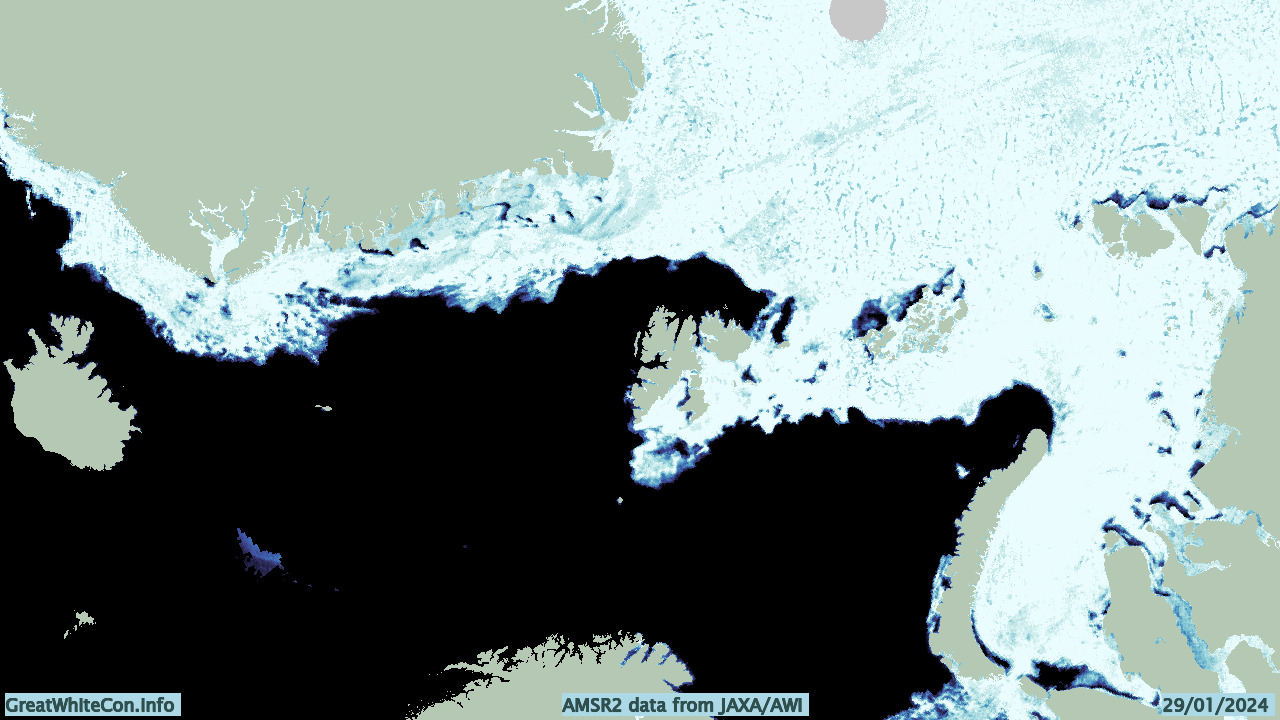
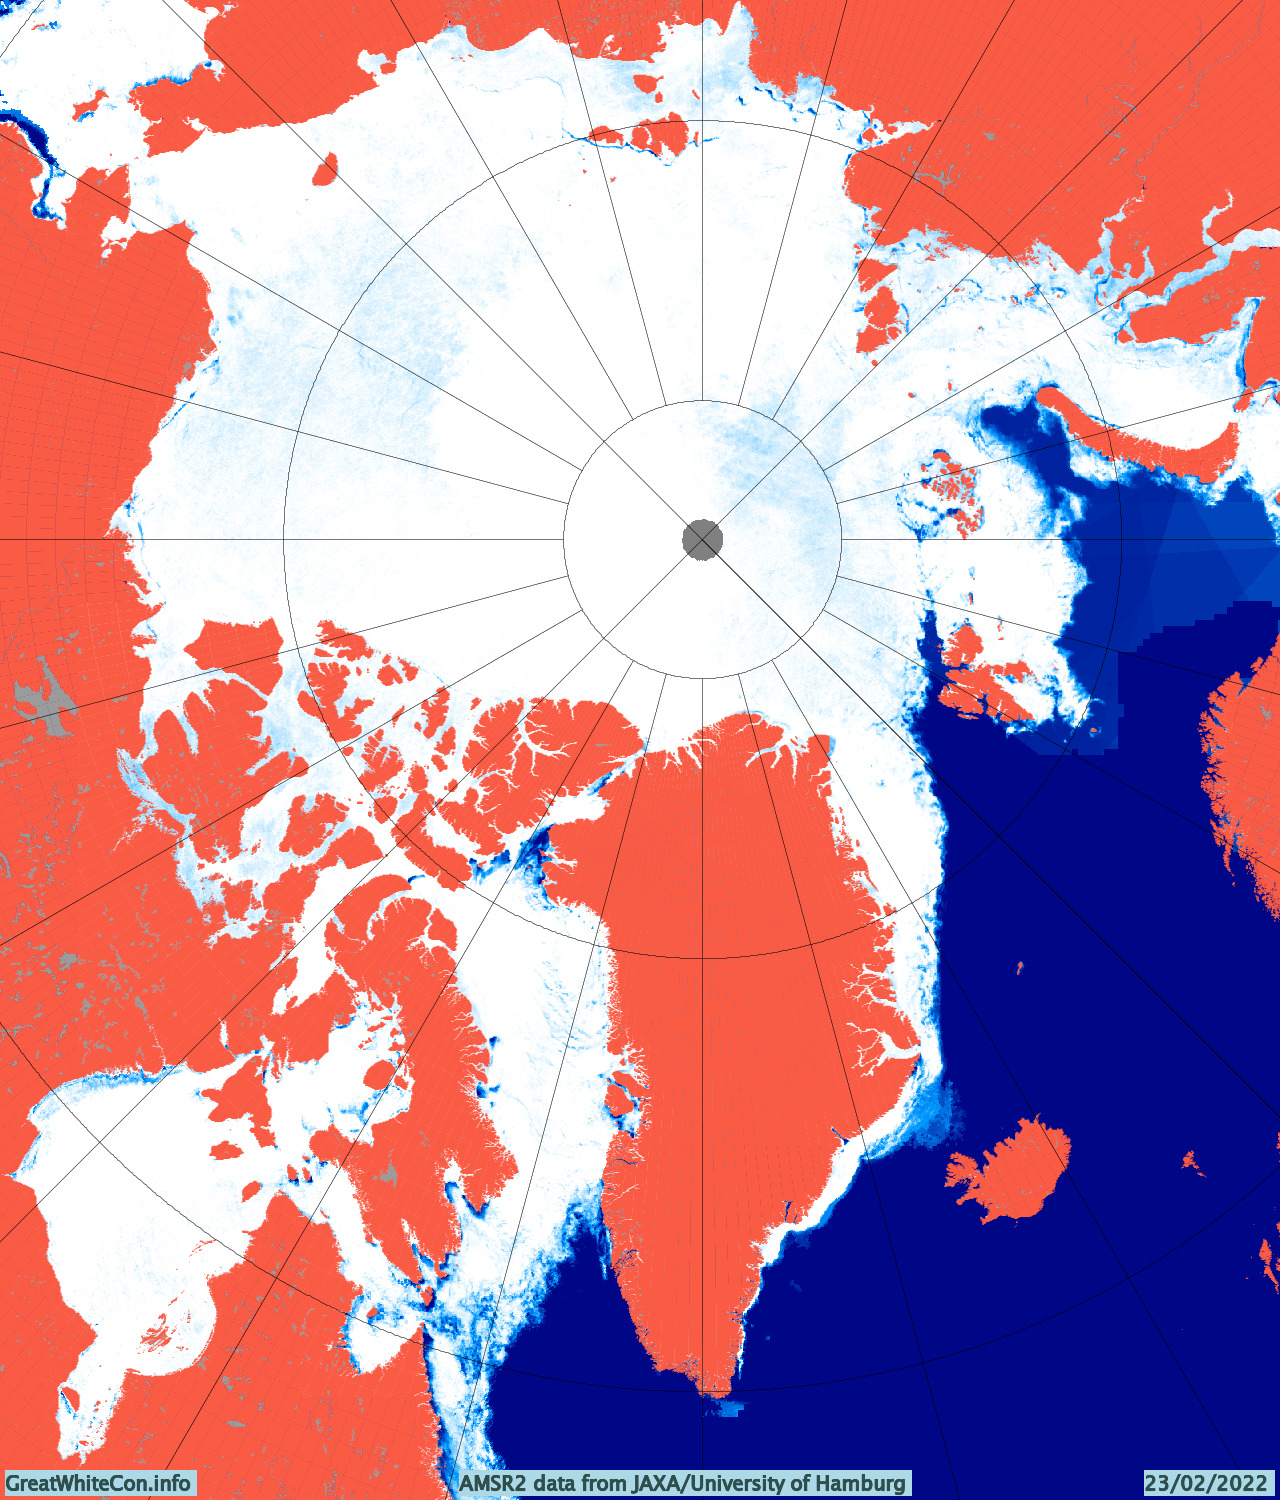
And here’s the lead enhanced AWI AMSR2 concentration map of the Atlantic periphery:
Let’s see how things change over the next few days.
[Update – January 31st]
Here’s a preliminary look at the effect of the recent Arctic cyclone and other “weather” on the sea ice in the Fram Strait and Barents & Kara Seas:
There is also another cyclone heading for the Barents Sea. This one is forecast to bottom out at 936 hPa at around midnight tonight near the Norwegian coast:
P.S. The cyclone mentioned just above has been named Storm Ingunn by the Norwegian Meteorological Institute:
👀 This swirl of cloud is #StormIngunn – an intense area of low pressure that's still rapidly deepening
😮 Wind gusts of over 120 mph have been reported in the Faroe Islands with the storm now moving towards Norway pic.twitter.com/TNuo52L7MW
We have grandchildren visiting this week, so it seems prudent to get the new open thread started a day early, and before they wake up!
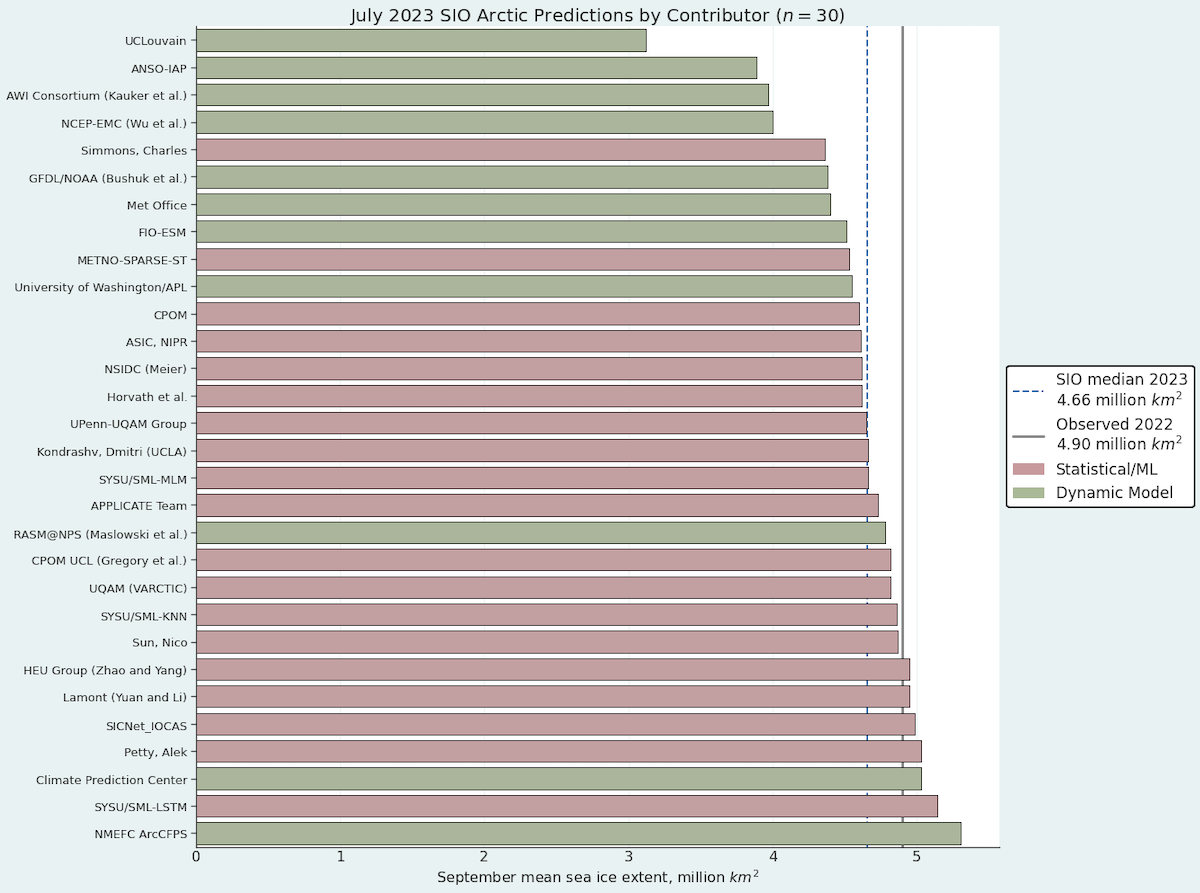
The ARCUS Sea Ice Prediction Network July report has recently been published. Here’s the graphic overview of the 30 predictions for September sea ice monthly average extent:
The July median forecasted value for pan-Arctic September sea-ice extent is 4.66 million square kilometers with interquartile values of 4.51 and 4.87 million square kilometers, while individual forecasts range from 3.12 and 5.30 million square kilometers. We note the lowest forecast is an outlier, and the only forecast that predicts a new record September sea-ice extent value (current record is September 2012, with a sea-ice extent of 3.57 million square kilometers).
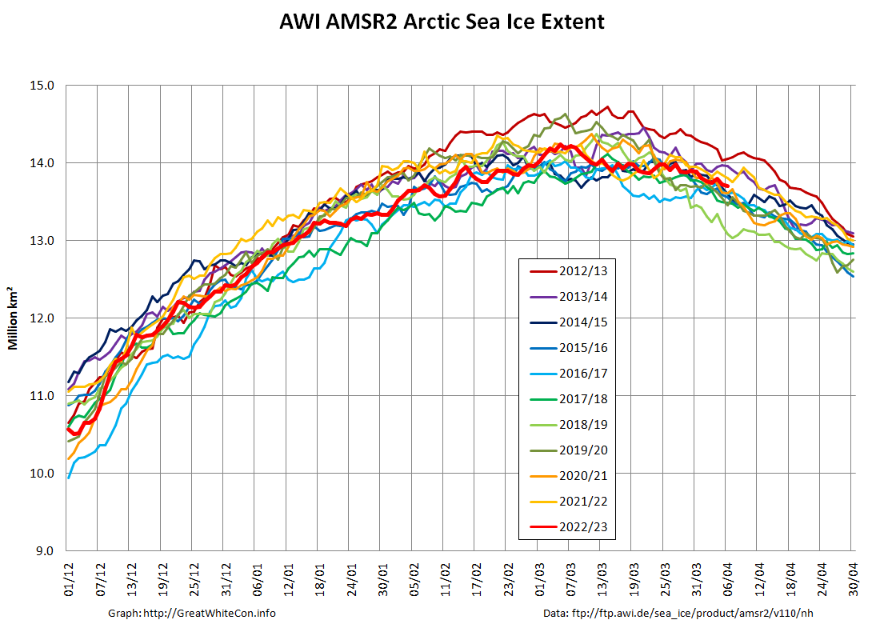
Arctic sea ice extent in early April is singularly unexceptional. Here’s the AWI AMSR2 version:
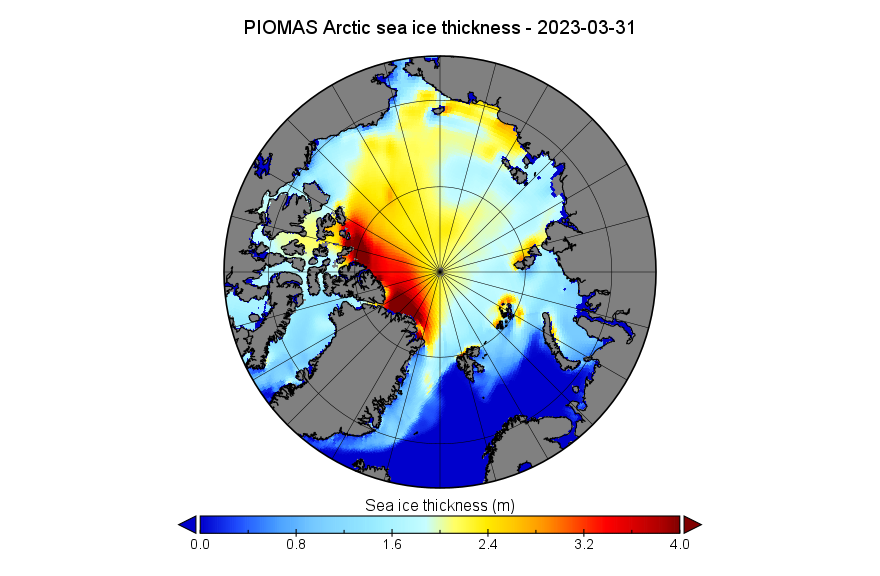
Things start to become more interesting when looking at the third dimension. Here’s the PIOMAS gridded thickness map for March 31st:
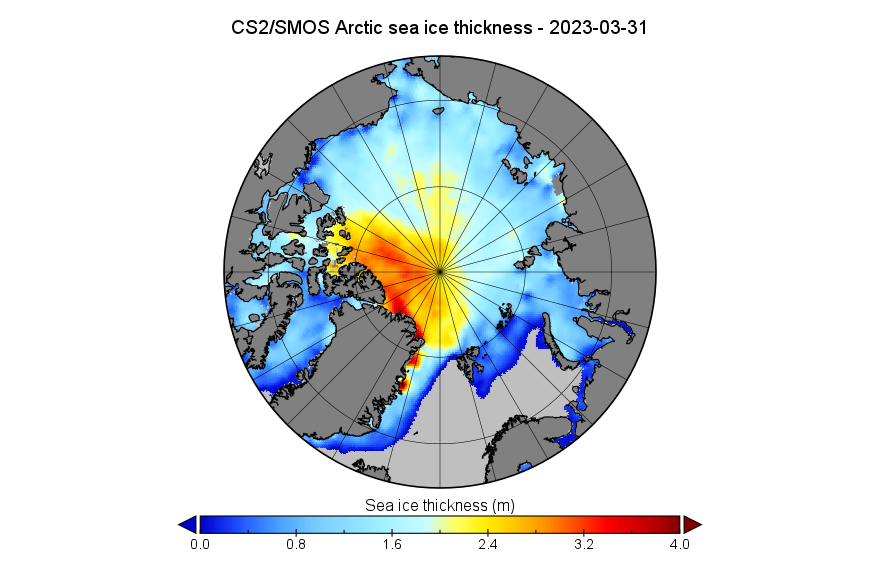
and the CryoSat-2/SMOS map for the same date:
Note the differing distribution of thick ice north of Greenland and the Canadian Arctic Archipelago between the two maps. Note also the area of thinner ice along the coast of the Beaufort Sea visible on the CS2/SMOS map.
By way of explanation for that phenomenon see the March sea level pressure map from the latest edition of the NSIDC’s Arctic Sea Ice News:
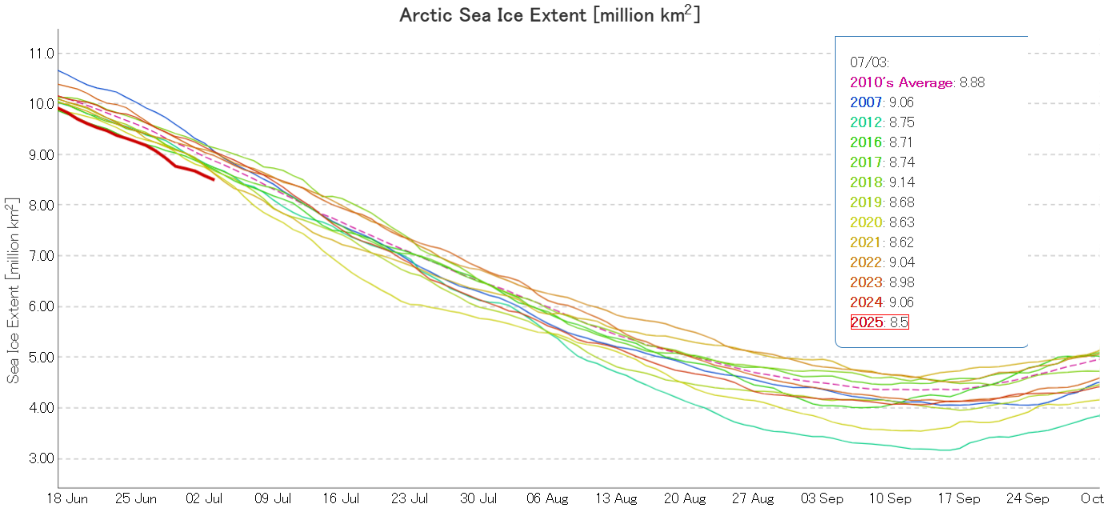
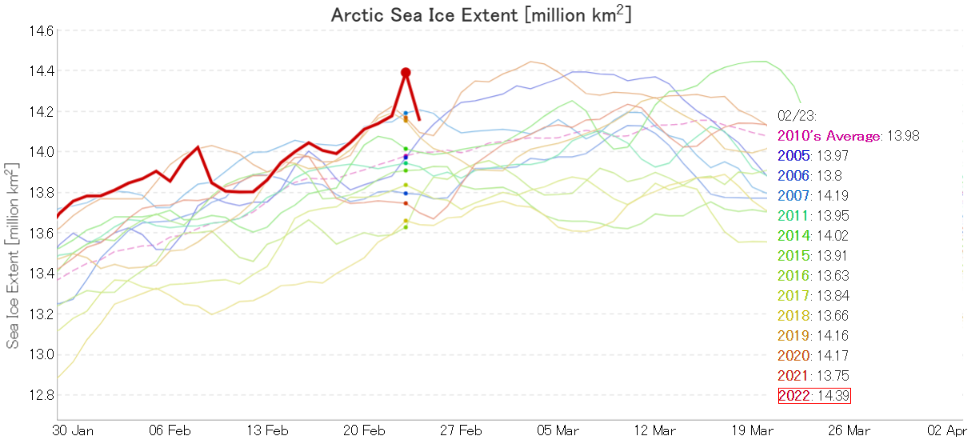
Here’s the latest graph of Arctic sea ice extent from JAXA/ViSHOP, which looks a bit unusual to say the least:
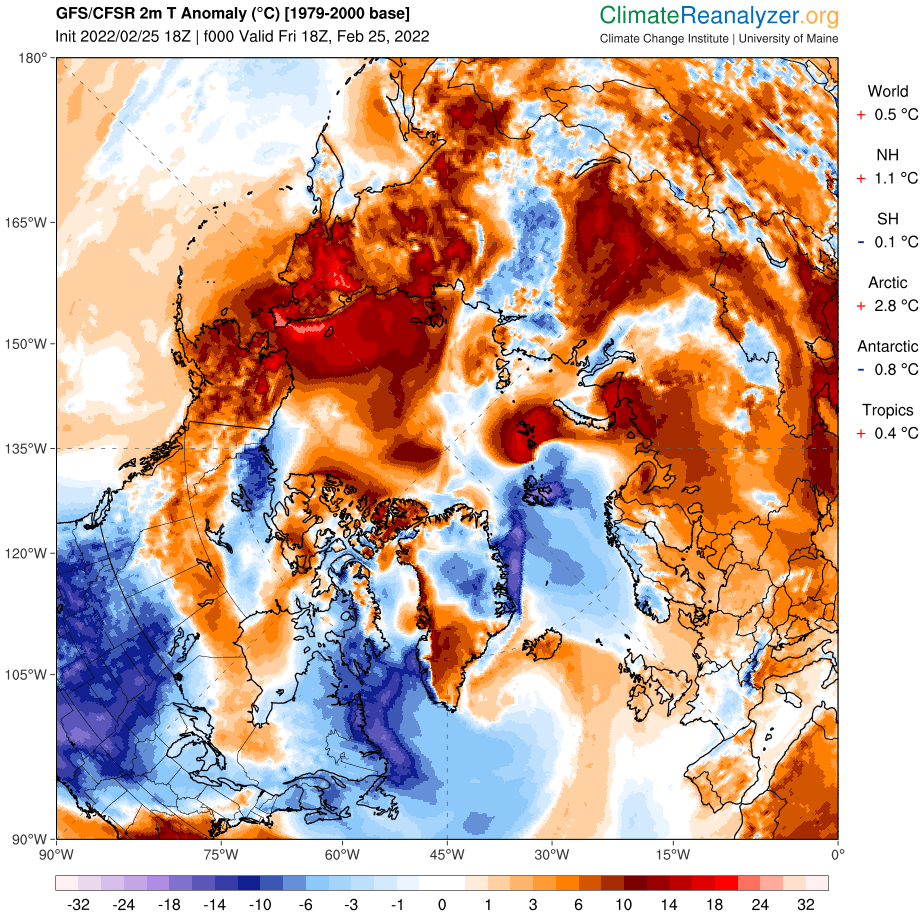
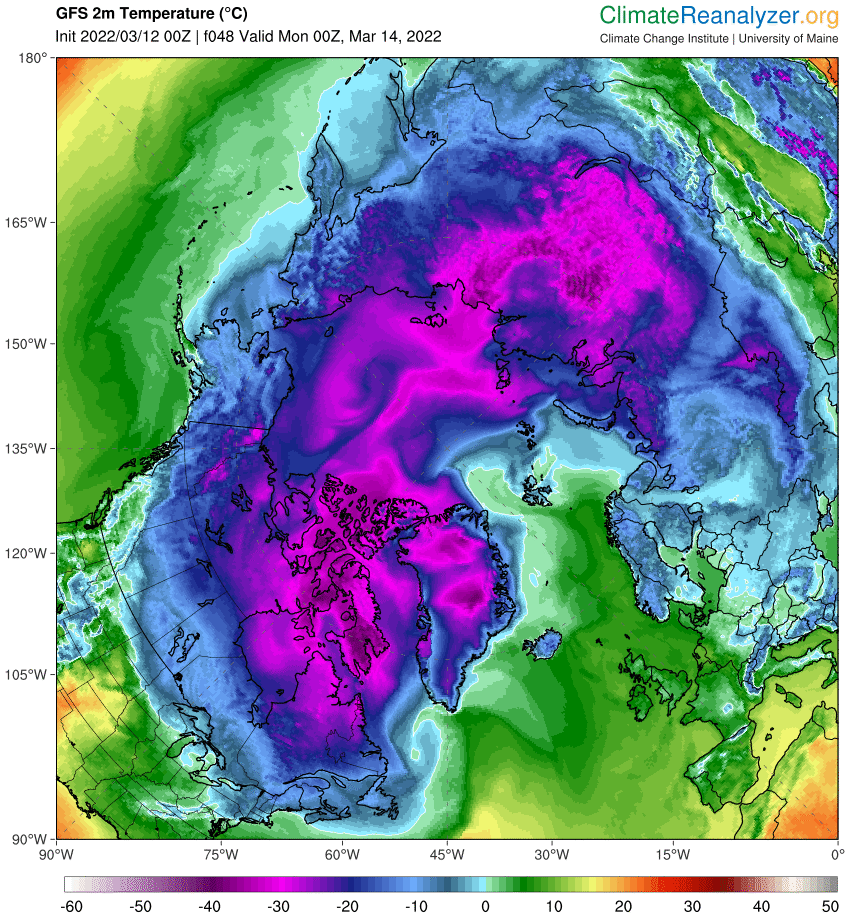
It certainly caught my eye! Could that sudden peak on February 23rd be the maximum extent for the year? To be frank it looks more like an artifact in the underlying gridded AMSR2 concentration data, but it’s not wholly beyond the bounds of possibility. The Pacific side of the Arctic is anomalously warm at the moment:
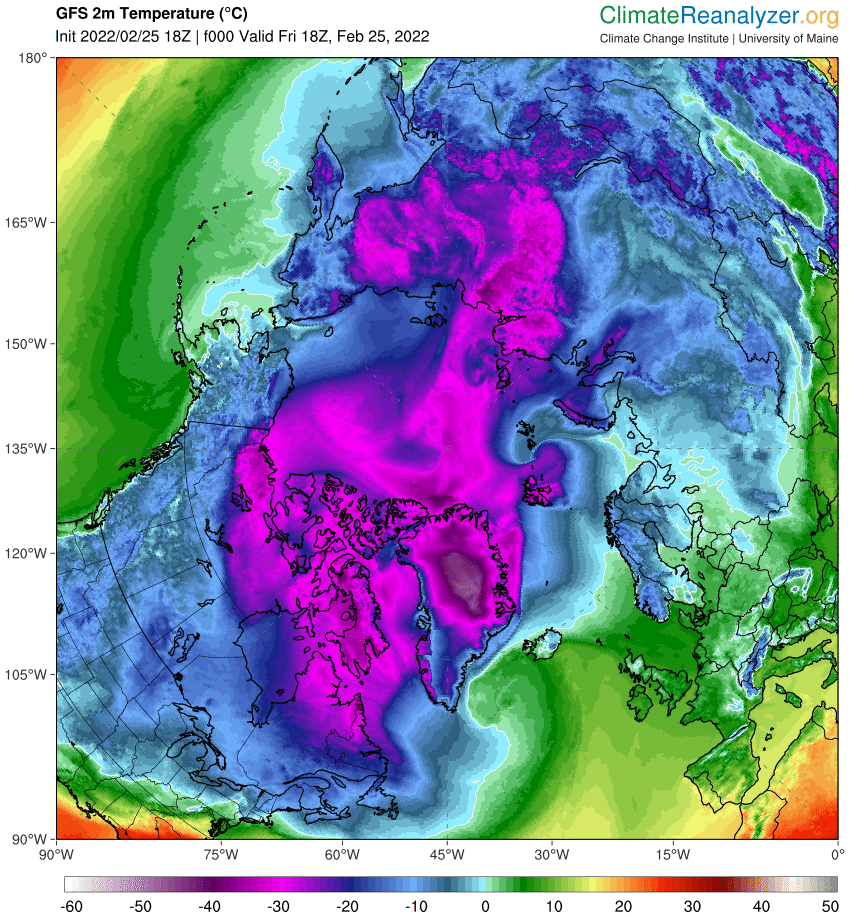
and parts of the Bering Sea are above freezing point:
For the moment then the (extremely!) provisional JAXA Arctic sea ice maximum extent for 2022 is 14.39 million km².
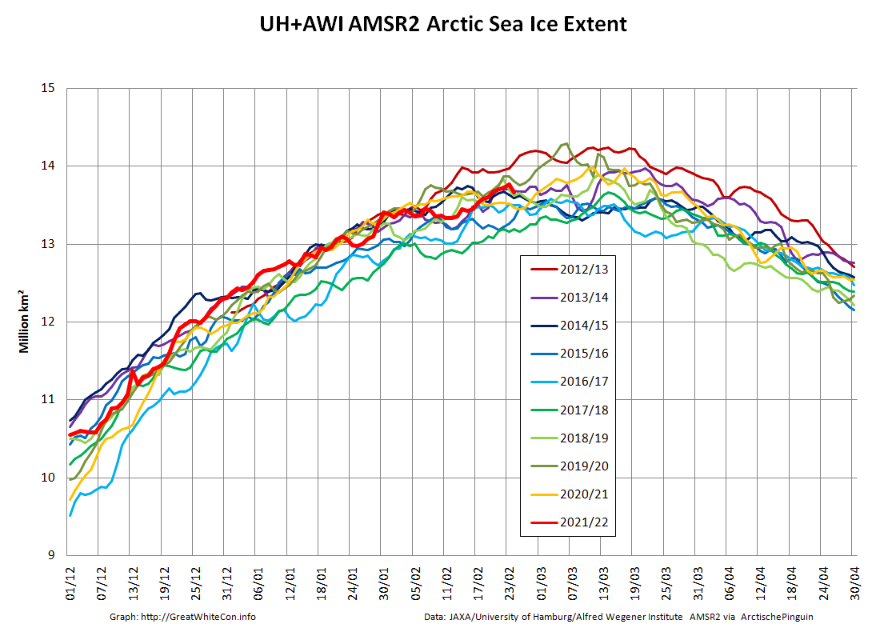
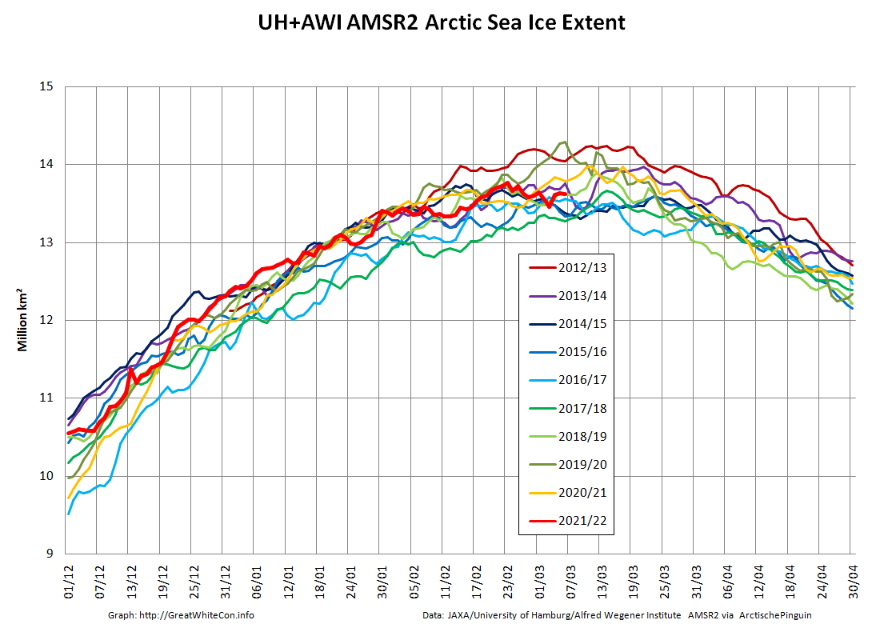
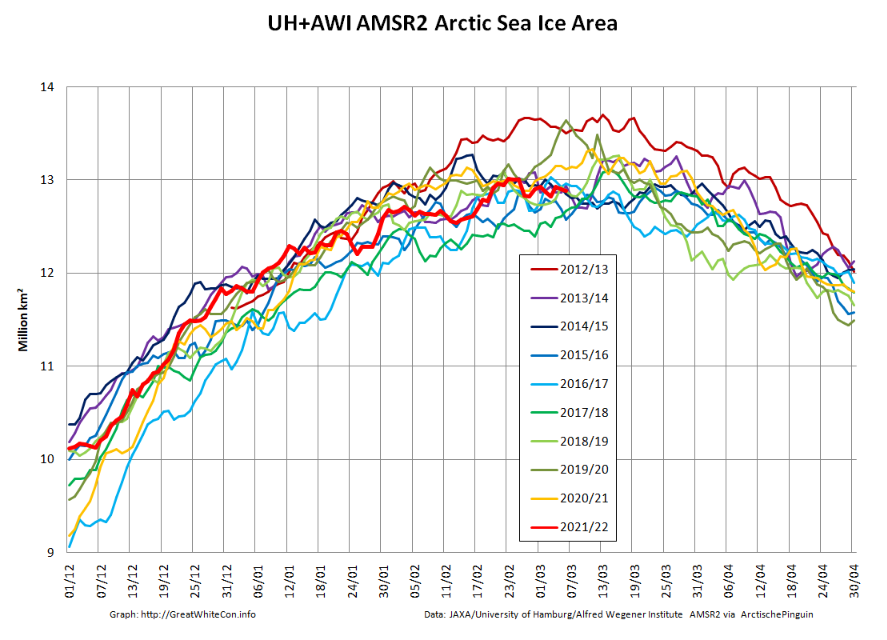
By way of an AMSR2 second opinion let’s also take a look at our favourite “high resolution” AMSR2 metrics, which combine recent data from the Alfred Wegener Institute with historical data from the University of Hamburg:
The extent peak on the 23rd is of much smaller magnitude, and it’s almost non existent on the area graph.
Curiouser and curiouser.
[Edit – March 1st]
The JAXA maximum on February 23rd is definitely an artifact of dodgy AMSR2 data. Take a look at the Denmark Strait between Greenland and Iceland in particular:
The University of Hamburg version also shows an anomaly in the Barents Sea:
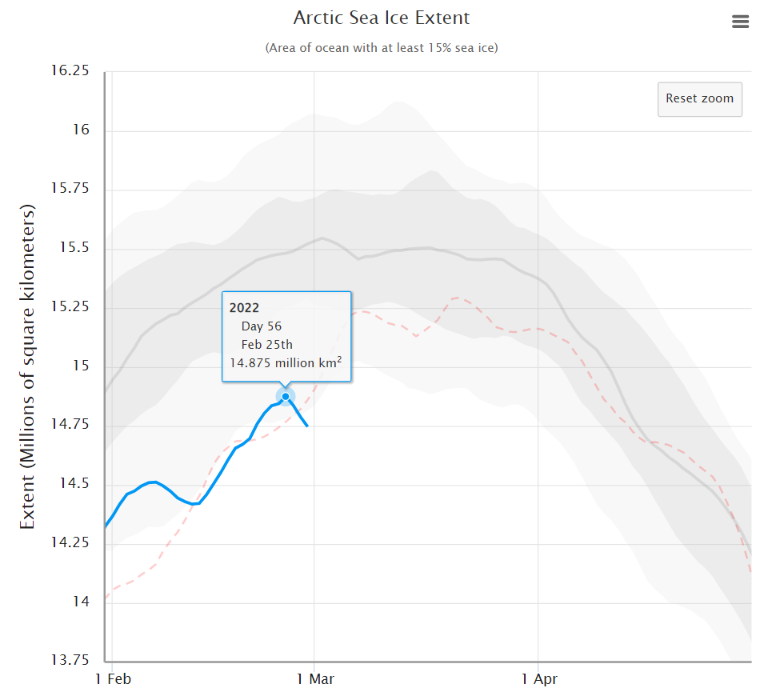
However the 5 day averaged NSIDC extent graph now shows a significant peak on February 25th:
Is anybody willing to put money on 14.875 million km² just yet?
[Edit – March 7th]
Here are the latest “high resolution” AMSR2 graphs:
The February 23rd maximum holds, for the moment at least.
[Edit – March 11th]
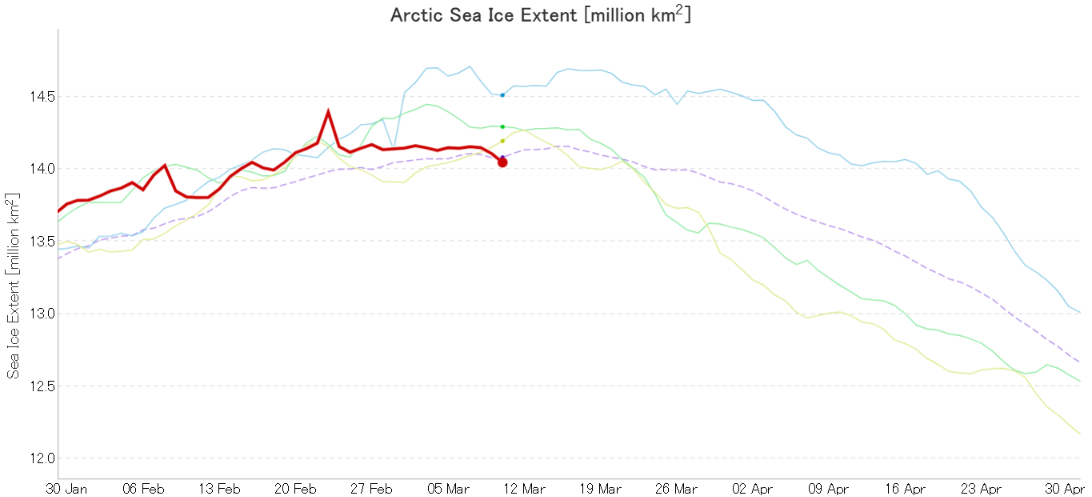
Here’s the latest JAXA Arctic sea ice extent graph:
A late surge is now looking exceedingly unlikely. However given that the maximum seems to have occurred during the brief period of dodgy data around February 23rd, what magnitude and date should be assigned to the 2022 maximum?
Whilst I ponder that thorny problem…
[Edit – March 12th]
Now I’ve really gone and done it! Started the “2022 melting season” thread on the Arctic Sea Ice Forum that is:
Arctic sea ice has likely reached its maximum extent for the year, at 14.88 million square kilometers (5.75 million square miles) on February 25. The 2022 maximum is the tenth lowest in the 44-year satellite record. On the same day, on the other pole, Antarctic sea ice reached a record minimum extent, at 1.92 million square kilometers (741,000 square miles).
The date of the maximum this year, February 25, was fifteen days earlier than the 1981 to 2010 average date of March 12. Only two years had an earlier maximum, 1987 and 1996, both on February 24. This year is the second earliest date on the satellite record, tying with 2015, which also reached its maximum extent on February 25.
A recent paper by Kent Moore et al. has caused something of a stir in the mainstream media recently, as well as in cryospheric circles and amongst the cryodenialista:
The area to the north of Ellesmere Island and Greenland contains the Arctic’s thickest ice and it is predicted to be the last to lose its perennial ice, thus providing an important refuge for ice-dependent species. There is however evidence that this Last Ice Area is, like the entire Arctic, undergoing rapid changes that may reduce its suitability as a refuge. During May 2020, a polynya developed to the north of Ellesmere Island in a region where there are no reports of a previous development. We use a variety of remotely sensed data as well as an atmospheric reanalysis to document the evolution and the dynamics responsible for the polynya. In particular, we argue that anomalously strong divergent winds associated with an intense and long-lived Arctic anti-cyclone contributed to the development of the polynya as well as similar previously unreported events in May 1988 and 2004.
Curiously the paper neglects to mention a polynya in the same region that we reported on, albeit in passing, in August 2018. Here’s an updated video of that event, with the addition at the start of a yellow arrow to highlight the part of the Arctic’s “Last Ice Area” investigated by Moore et al. and a pale blue arrow to highlight Kap Morris Jesup, the most northerly point in Greenland:
Next here’s another animation, covering the time period discussed in the paper and continuing throughout the summer of 2020:
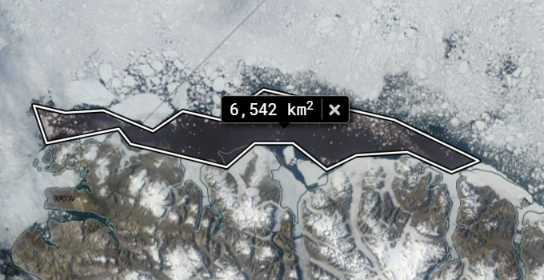
Comparing the two animations it is obvious that the August 2018 polynya is much larger than the one in May 2020, confirmed by a quick area computation using NASA WorldView:
The introduction to the paper states that:
Flaw leads, elongated regions of open water that develop along the interface between land fast and pack ice (Barber & Massom, 2007) are common in the region. Indeed Peary’s 1909 sledding expedition to the North Pole was delayed as a result of a large flaw lead that developed north of Ellesmere Island (Peary, 1910). However, the development of a polynya in this region has not been reported previously.
To my eye the image above reveals something far too wide to be described as a “flaw lead”, but let’s delve deeper into the paper:
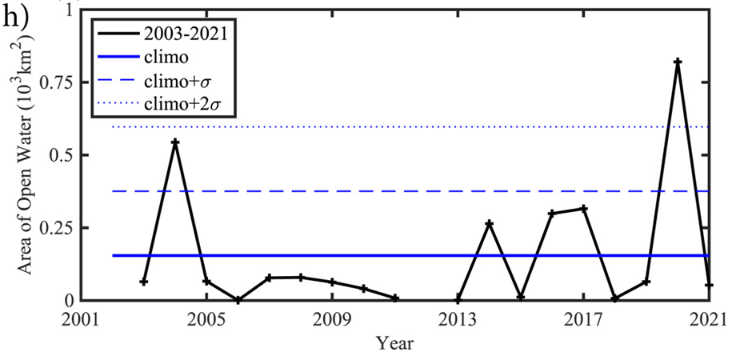
A perspective on the unique nature of the May 2020 event is provided by the monthly mean area of open water in the area of interest during May for the entire period of the ASI data set, 2003–2021 (Figure 2h). Typically the area of open water during May in the region is less than 160 km2. May 2020 is the only year in which the area of open water exceeds 2 standard deviations above the mean.
Perhaps the polynya in question is indeed “unique in the month of May”, in which case it would no doubt have been helpful if the abstract and/or the introduction to the paper had mentioned this subtlety. Then the plethora of erroneous statements in the media like the one recently referenced by Mark Lynas on Twitter might have been avoided?
The polynya is the first one that has been identified in this part of the Last Ice Area, according to a new study detailing the findings in the AGU journal Geophysical Research Letters.
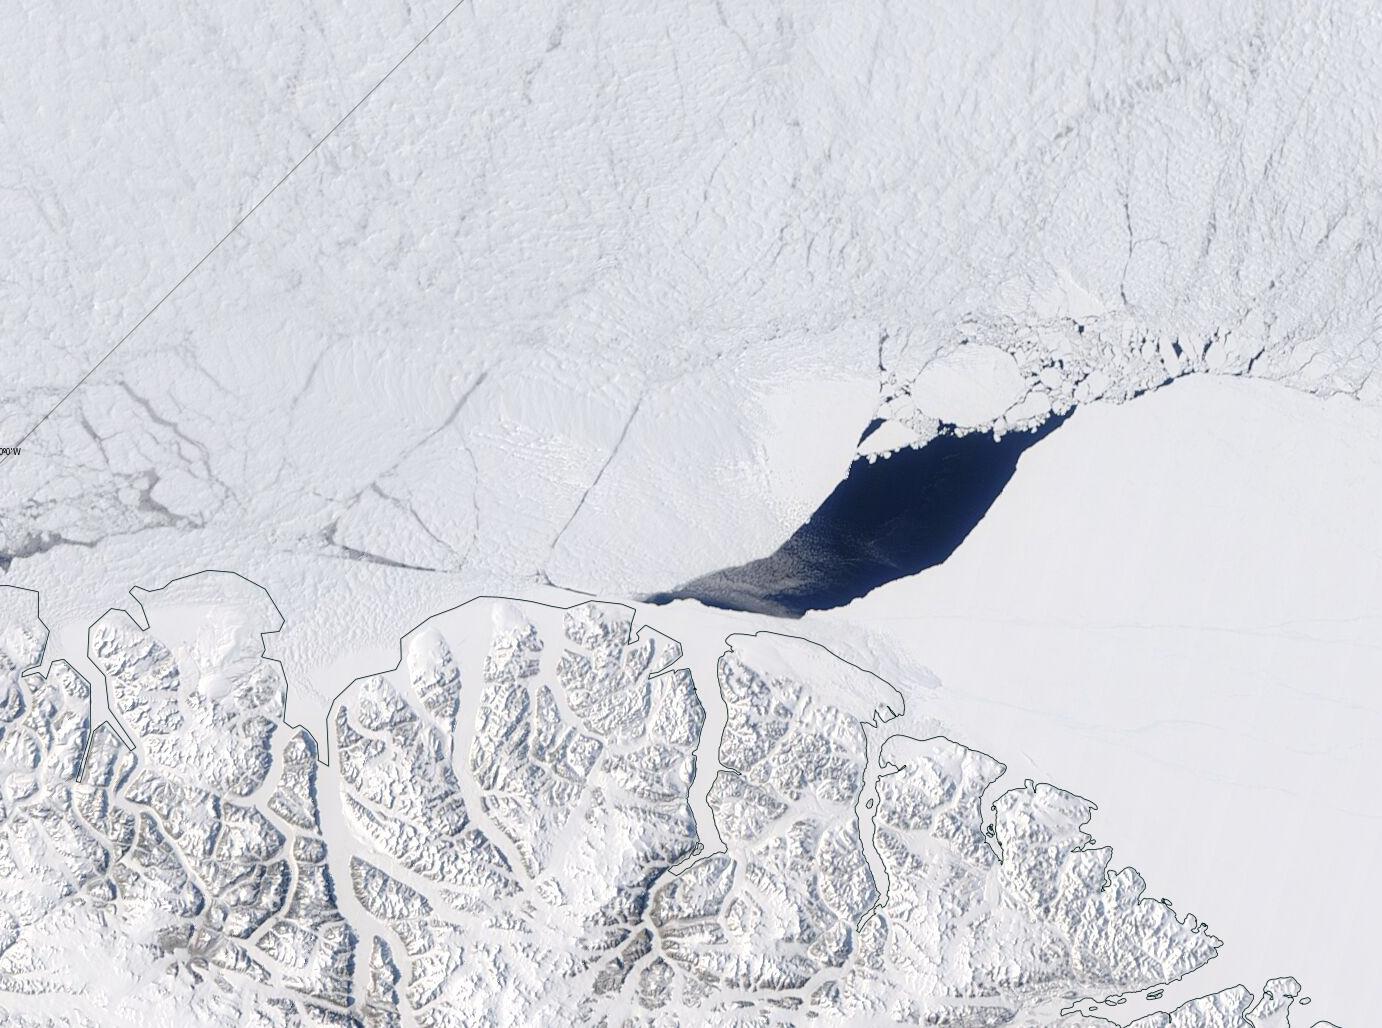
Since Mark, amongst others, seem to be suffering from the misapprehension that “The Arctic’s ‘Last Ice Area’ is cracking, just in time for COP26” here is what’s been happening in the “Last Ice Area” this year, in the run up to next month’s conference in Glasgow:
Finally, for the moment at least, are MODIS images of the May 20th 2020 polynya:
and the one on May 12th 2004:
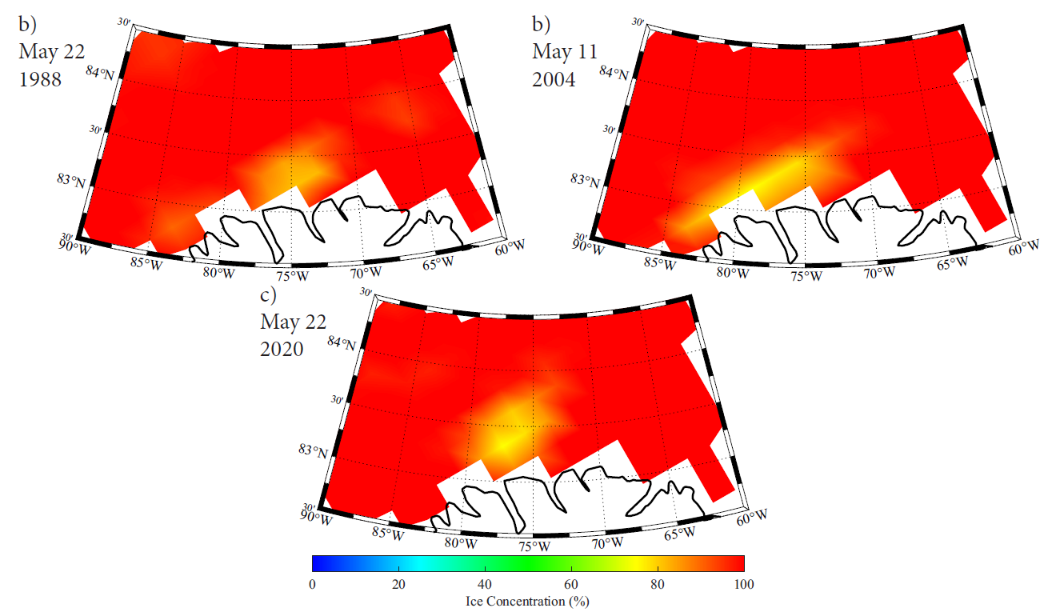
Neither Aqua or Terra had been launched in 1988 of course, and Landsat 5 didn’t cover the north of Ellesmere Island. This is the SSM/I & SSMIS visualisation of all three May polynyas from the supplement to Moore’s paper:
A detailed dissection of the 2021 minimum of various Arctic sea ice extent metrics can be found on a dedicated thread. All other Arctic news in September will be found below.
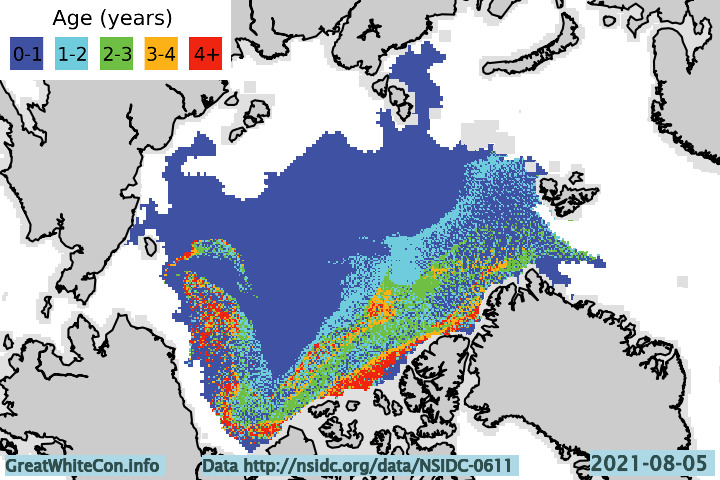
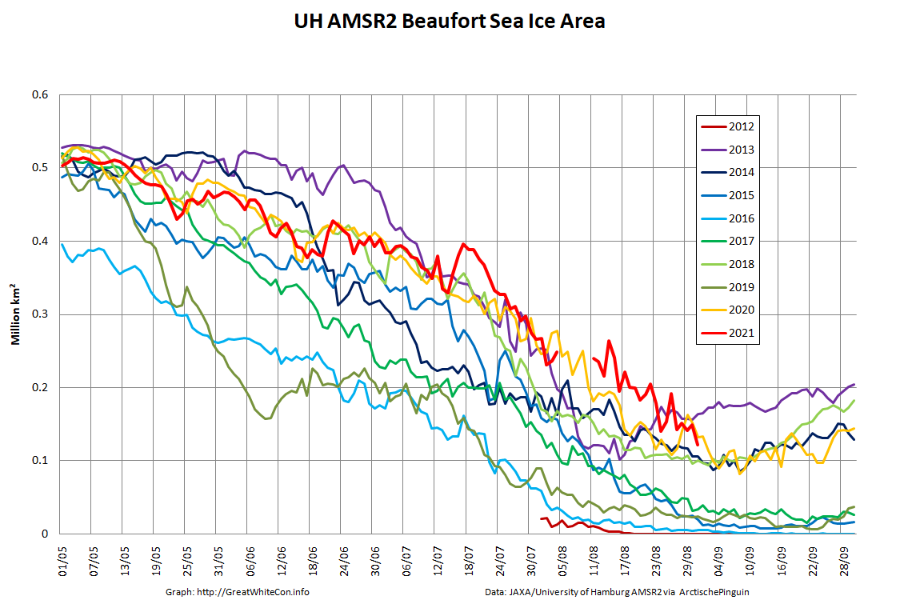
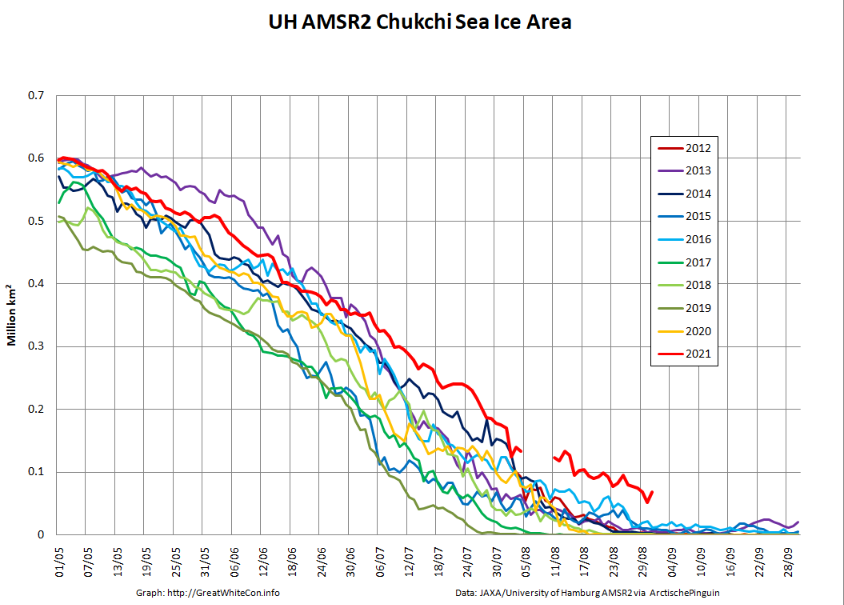
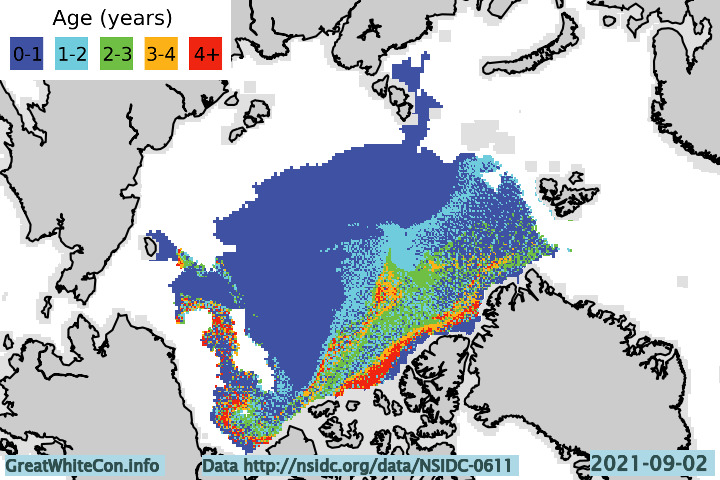
Let’s start with a map of sea ice age at the beginning of August:
Firstly notice the absence of 3+ year old ice off the coast of north east Greenland. Also visible is a band of 4+ year old ice across the Pacific side of the Arctic Basin, which has slowed melting in the region and explains the following regional sea ice area graphs:
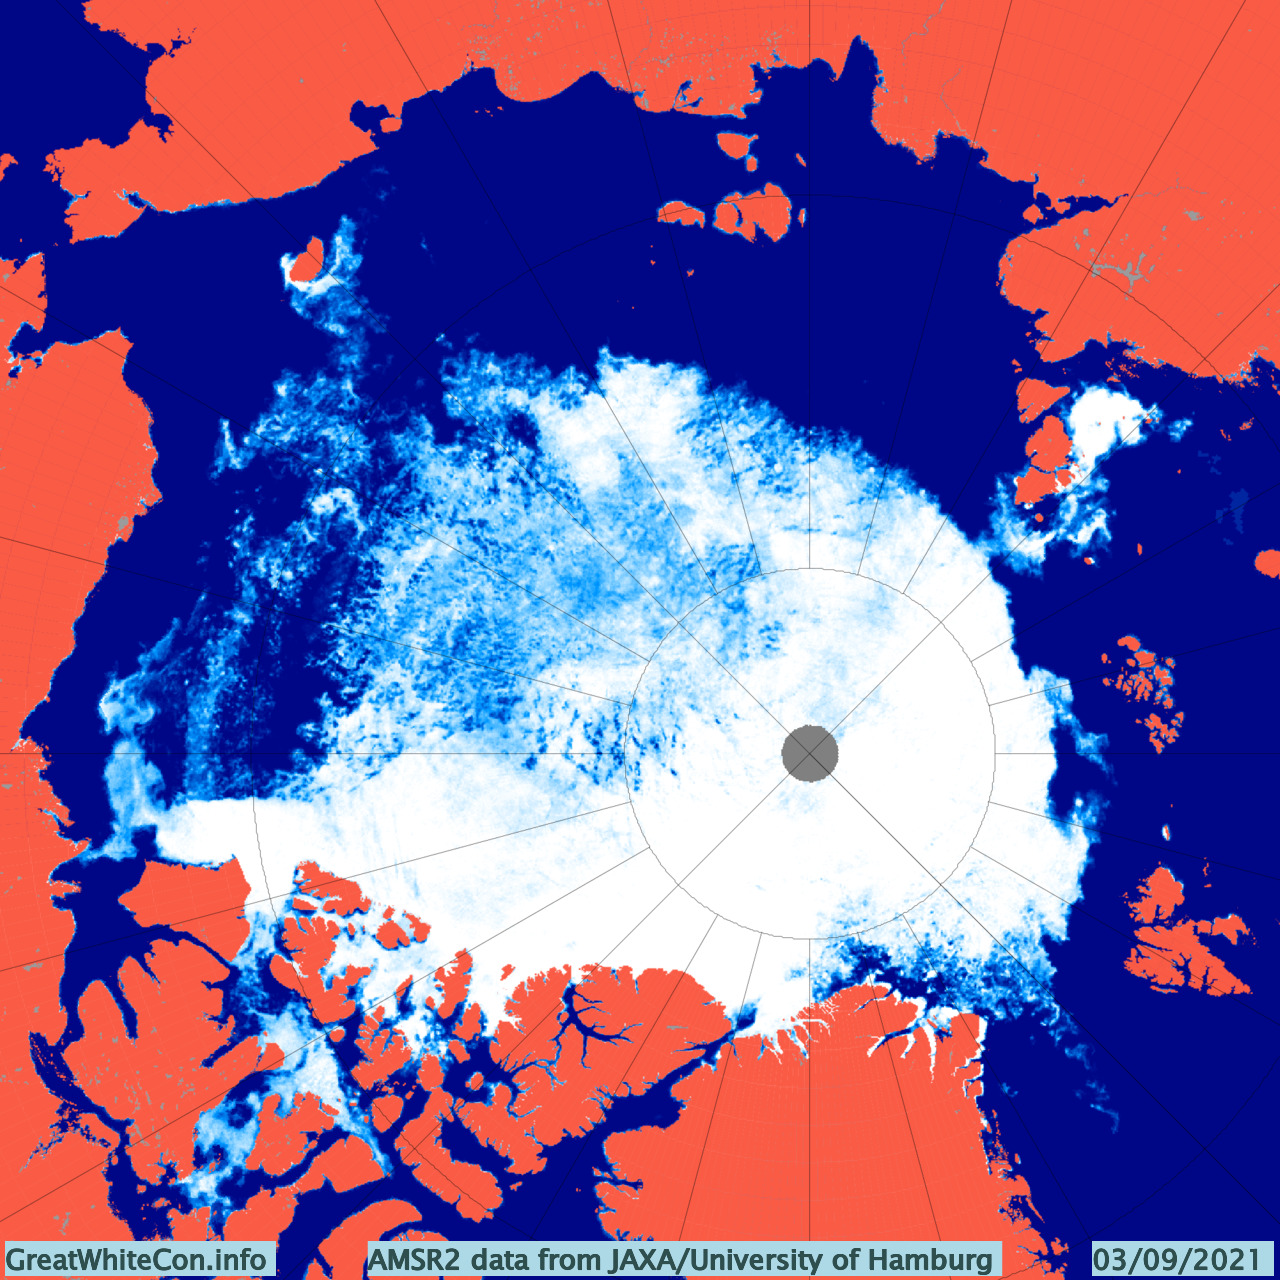
Next here’s the current AMSR2 concentration map:
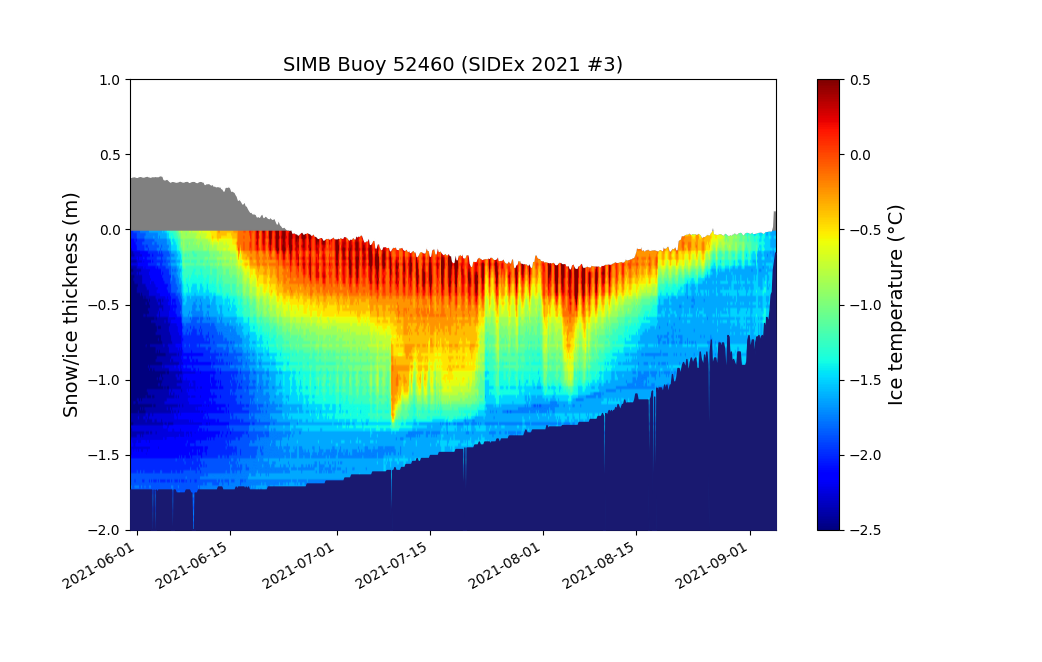
There is currently a large area of open water in the Wandel Sea to the north of Greenland. There is also an arm of old ice across the Beaufort and Chukchi Seas which is still clearly visible, but also visible is the recent reduction in sea ice concentration in the region. By way of explanation, here’s another look at the thickness of an ice floe currently situated to the north of the Chukchi at 74.84 N, 164.29 W, as measured by an ice mass balance buoy:
As the 2021 melting season draws towards its conclusion the floe is experiencing rapid bottom melt. How much longer will this floe and others like it last? Will it survive to become an “old ice” dot on next year’s ice age maps?
[Edit – September 6th]
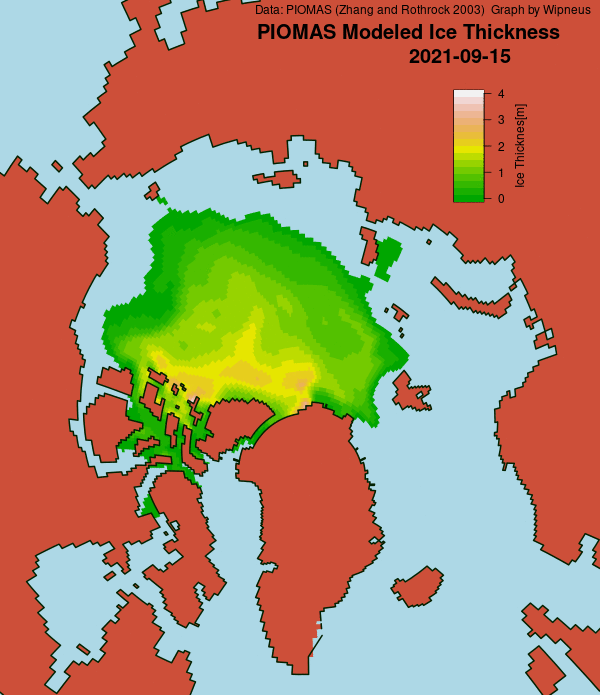
As Wipneus puts it on the Arctic Sea Ice Forum, “PIOMAS has updated the gridded thickness data up to the 31st of August”. Here’s the latest modelled thickness map, which shows the thickest remaining ice located north of the Canadian Arctic Archipelago rather than north of Greenland:
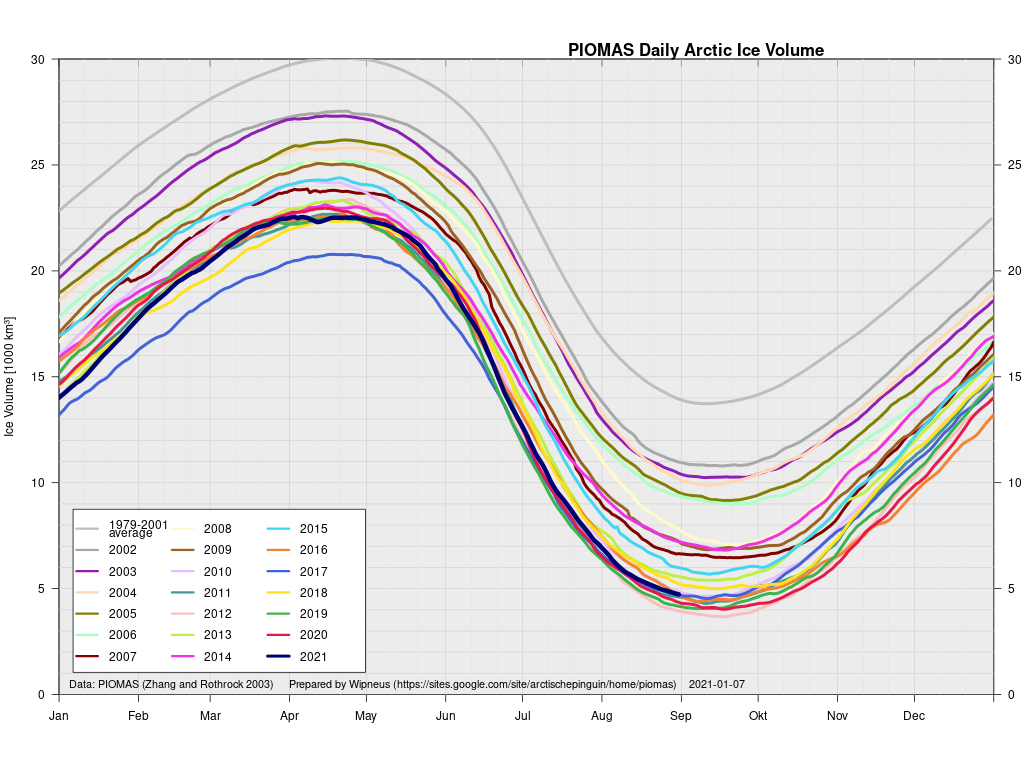
The accompanying volume graph shows 2021 in 7th lowest position, at 4.7 thousand km3:
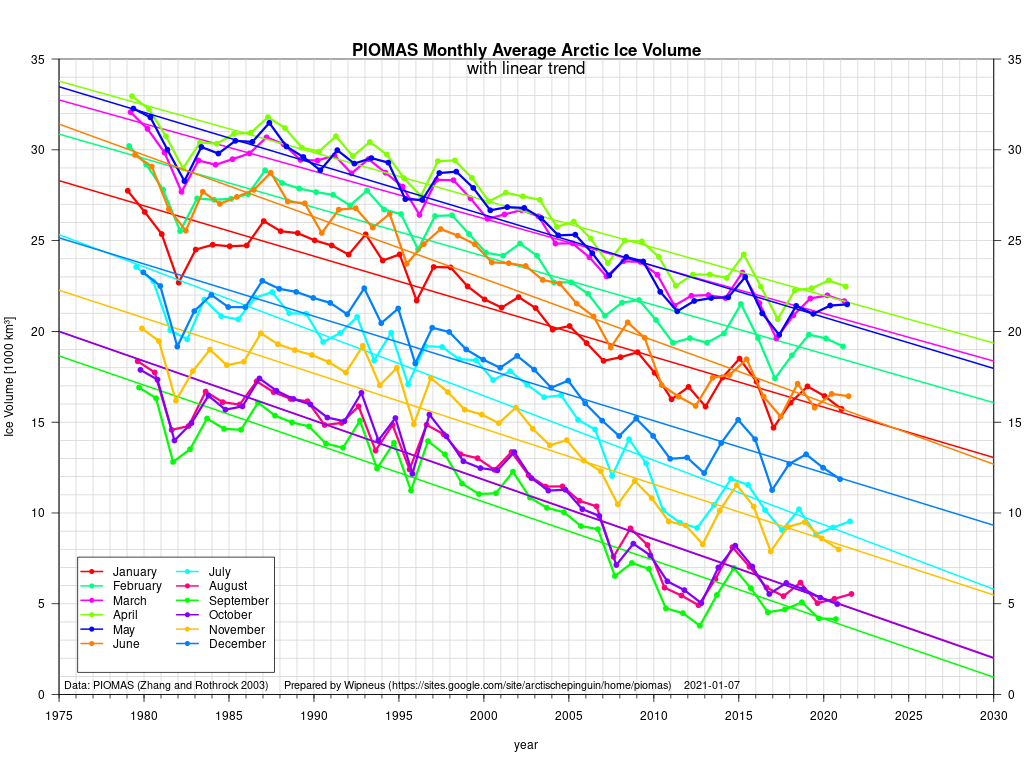
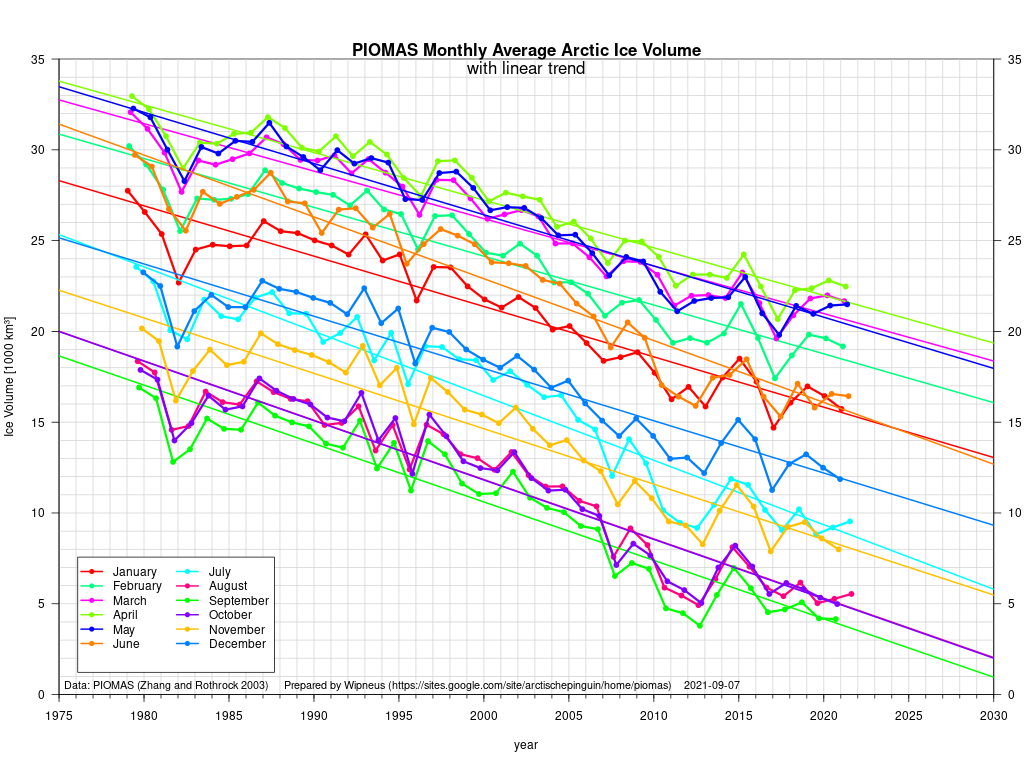
Here too are the current PIOMAS volume trends for each month of the year:
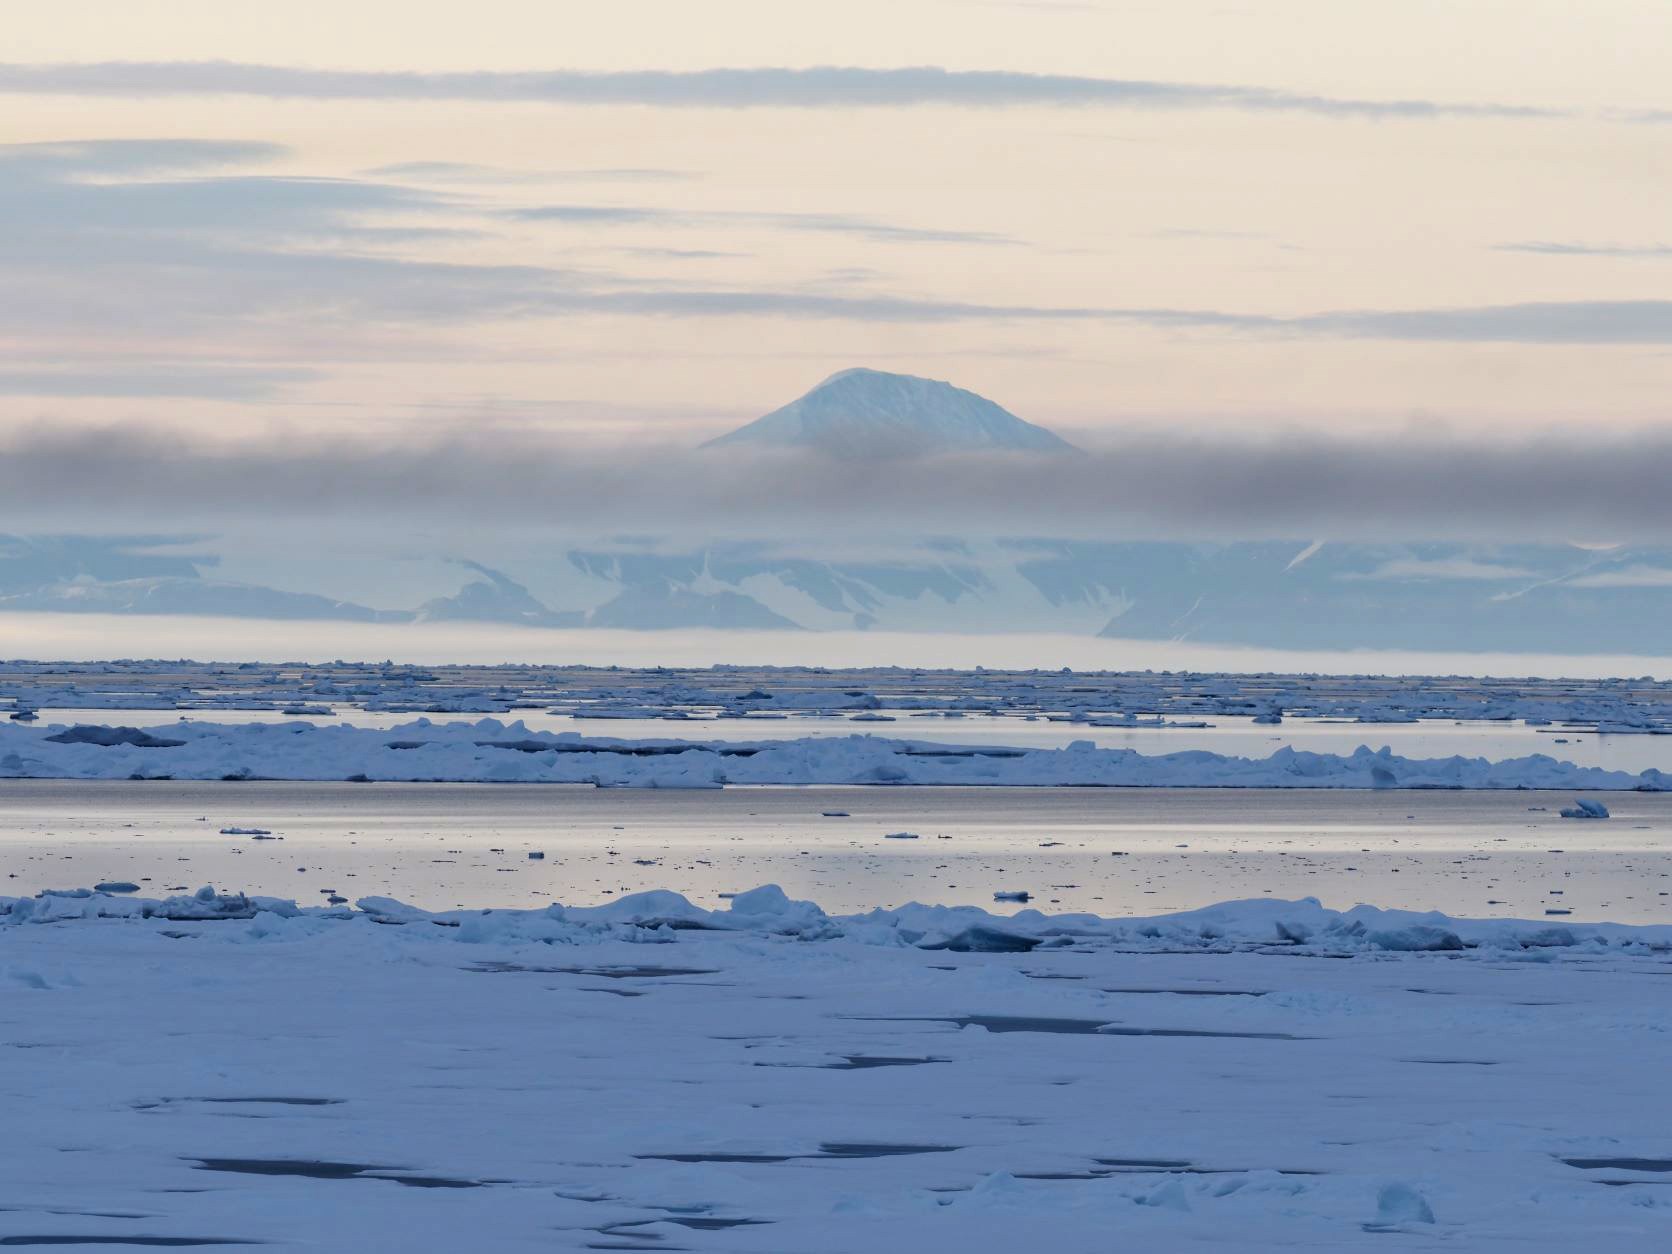
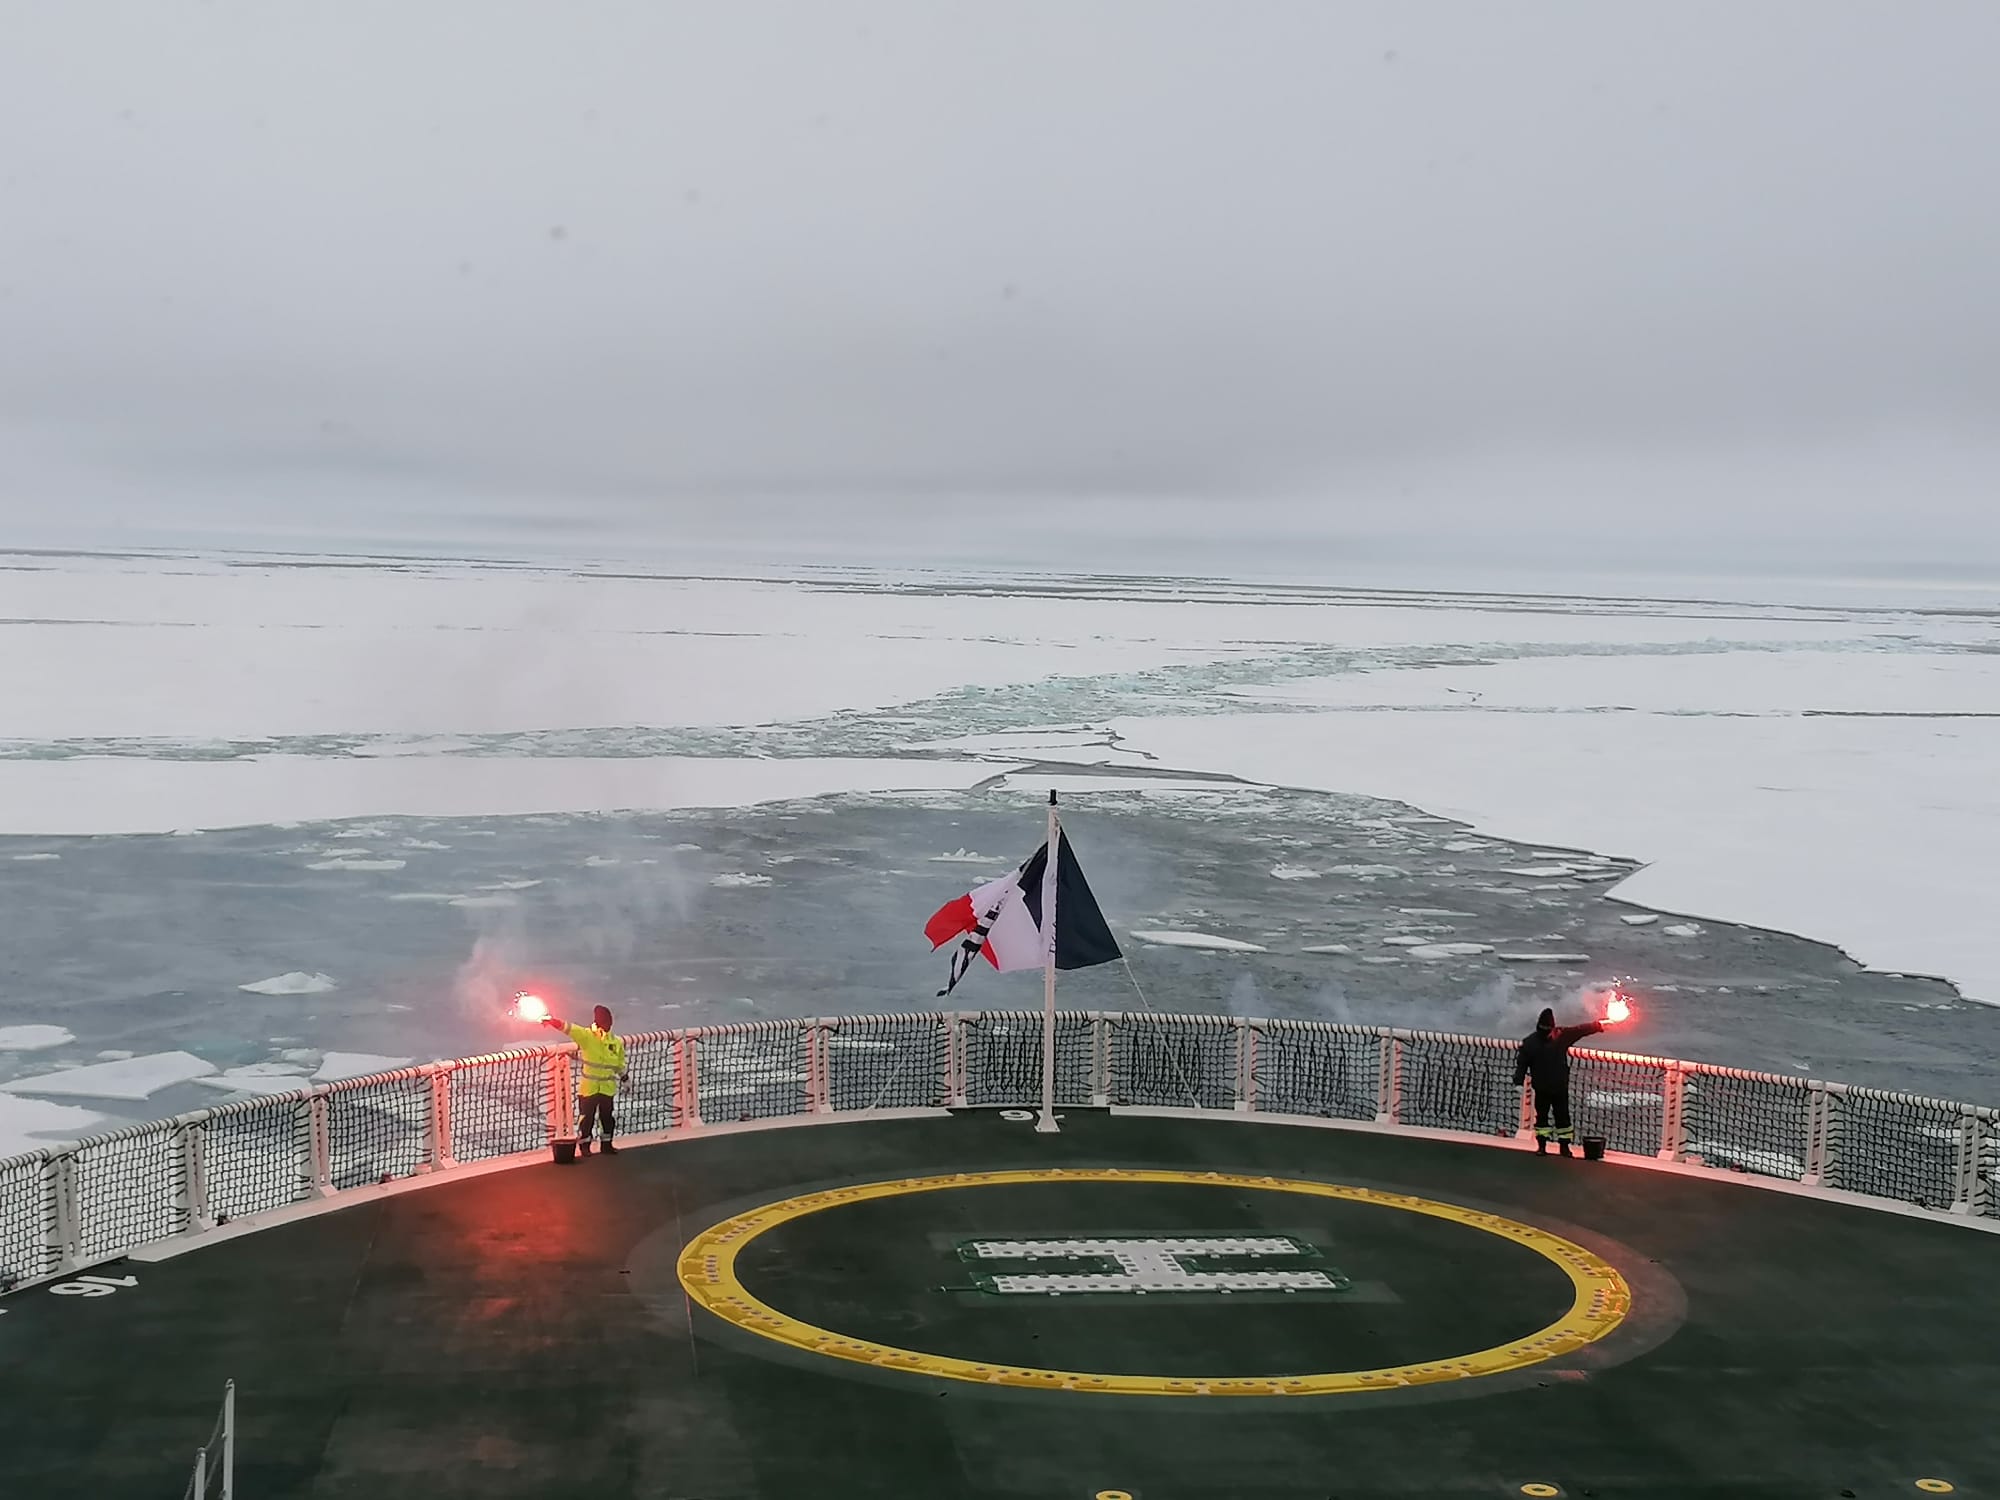
The Swedish icebreaker Oden has recently been exploring the area between northern Greenland and the North Pole as part of the Synoptic Arctic Survey expedition:
Here are the measurements of water temperature it has recorded over the past few days:
Ranging between -0.4 °C and -1.0 °C it doesn’t look as though the 2021 refreeze will be starting in the Wandel Sea just yet.
That shows plenty of old ice still left in the Beaufort Sea. However ice mass balance buoy 52460 now appears to floating free of its ice floe at 75.56 N, 165.99 W:
[Edit – September 14th]
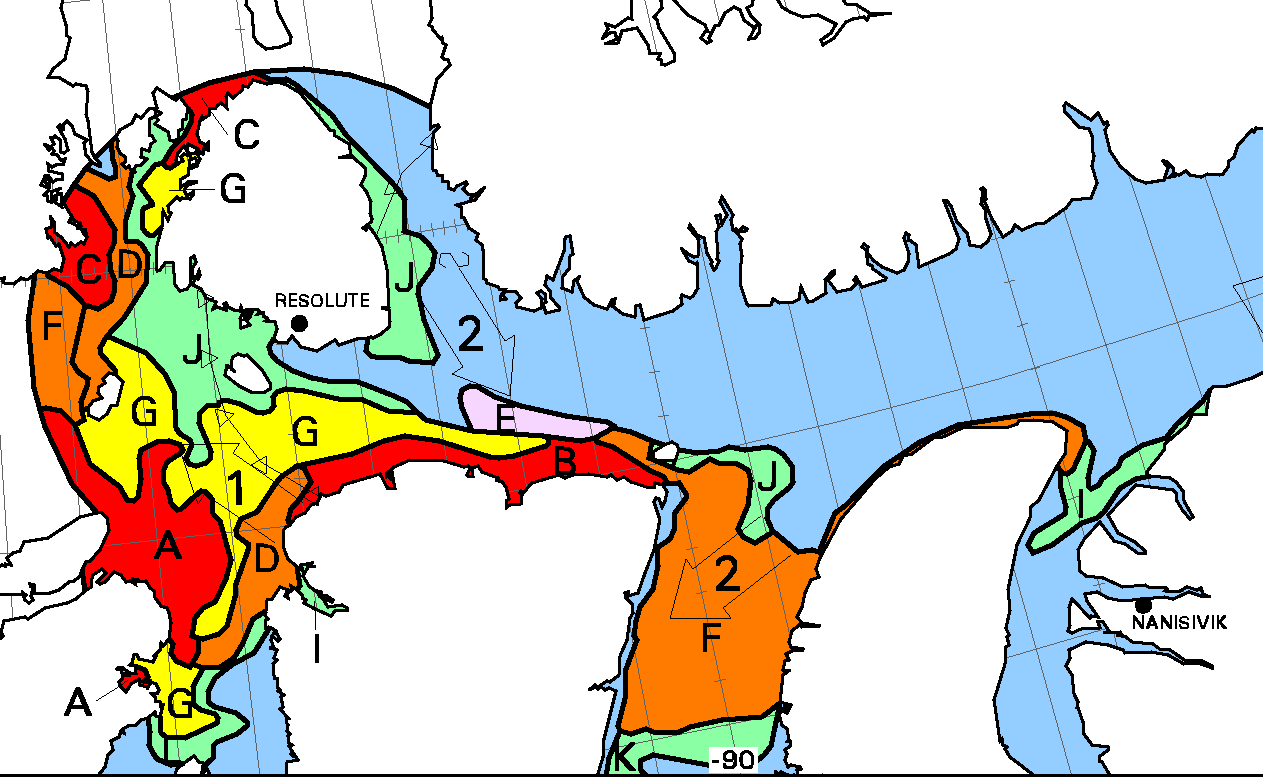
“New ice” has started to appear in previously open water on the Canadian Ice Service charts. See area E south east of Resolute:
Volume calculated from the thickness data currently show that 2021’s minimum was reached on September 7th at 4.64 thousand km3, which is the 8th lowest value in the Polar Science Center’s record.
[Edit – September 23rd]
NASA have just announced a new paper about clouds in the Arctic. Highly relevant given their recent overview of the 2021 melting season!
Clouds are one of the biggest wildcards in predictions of how much and how fast the Arctic will continue to warm in the future. Depending on the time of the year and the changing environment in which they form and exist, clouds can both act to warm and cool the surface below them.
For decades, scientists have assumed that losses in Arctic sea ice cover allow for the formation of more clouds near the ocean’s surface. Now, new NASA research shows that by releasing heat and moisture through a large hole in sea ice known as a polynya, the exposed ocean fuels the formation of more clouds that trap heat in the atmosphere and hinder the refreezing of new sea ice.
The findings come from a study over a section of northern Baffin Bay between Greenland and Canada known as the North Water Polynya. The research is among the first to probe the interactions between the polynya and clouds with active sensors on satellites, which allowed scientists to analyze clouds vertically at lower and higher levels in the atmosphere.
The approach allowed scientists to more accurately spot how cloud formation changed near the ocean’s surface over the polynya and the surrounding sea ice.
Watch this space!
This website uses cookies to improve your experience. We'll assume you're ok with this, but you can opt-out if you wish. Cookie settingsACCEPT
Privacy & Cookies Policy
Privacy Overview
This website uses cookies to improve your experience while you navigate through the website. Out of these, the cookies that are categorized as necessary are stored on your browser as they are essential for the working of basic functionalities of the website. We also use third-party cookies that help us analyze and understand how you use this website. These cookies will be stored in your browser only with your consent. You also have the option to opt-out of these cookies. But opting out of some of these cookies may affect your browsing experience.
Necessary cookies are absolutely essential for the website to function properly. This category only includes cookies that ensures basic functionalities and security features of the website. These cookies do not store any personal information.
Any cookies that may not be particularly necessary for the website to function and is used specifically to collect user personal data via analytics, ads, other embedded contents are termed as non-necessary cookies. It is mandatory to procure user consent prior to running these cookies on your website.