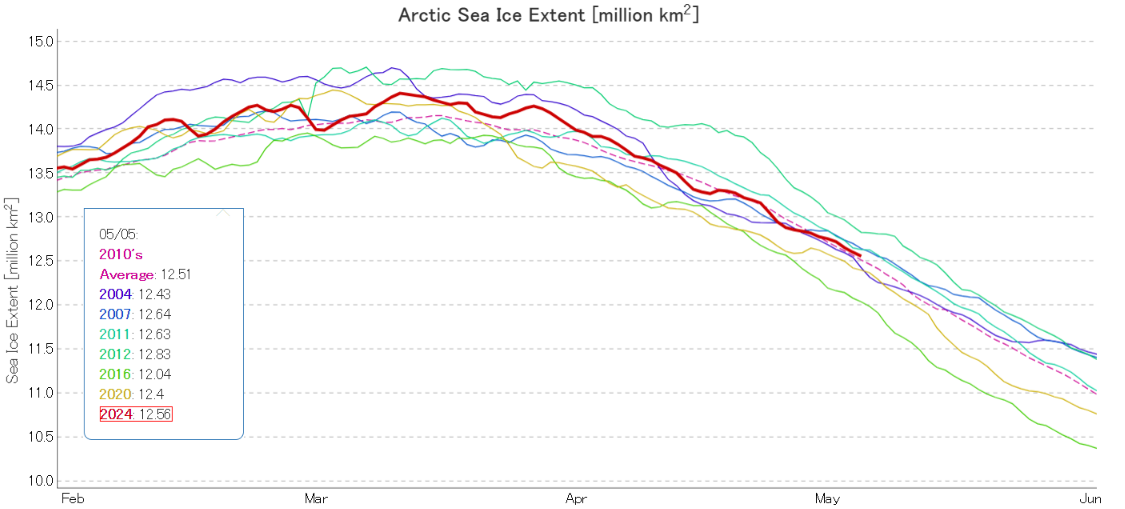
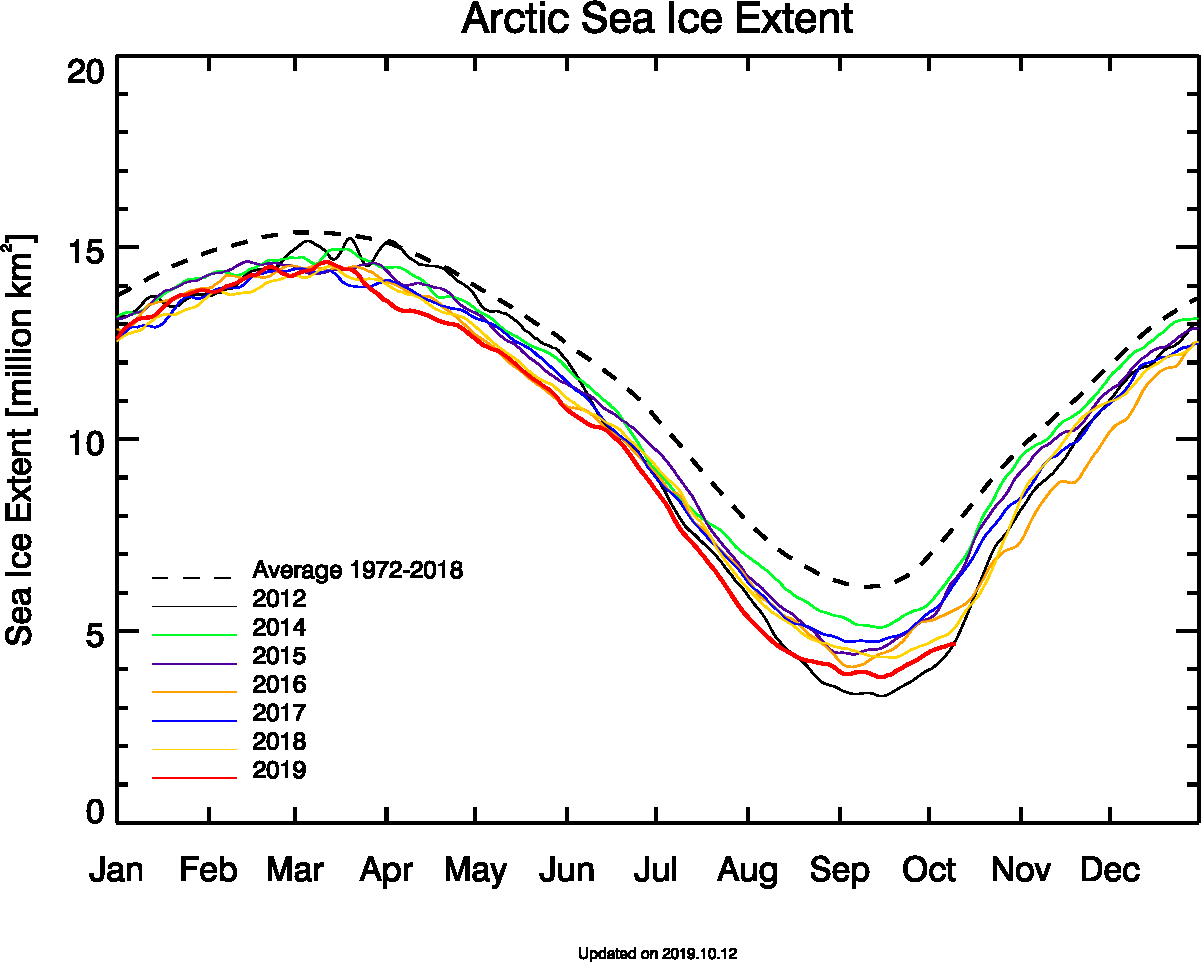
Since a certain “sceptic” has recently been comparing 2024 sea ice extent to “20 years ago”, here’s the current JAXA/ViSHOP extent graph of selected years, including 2004:
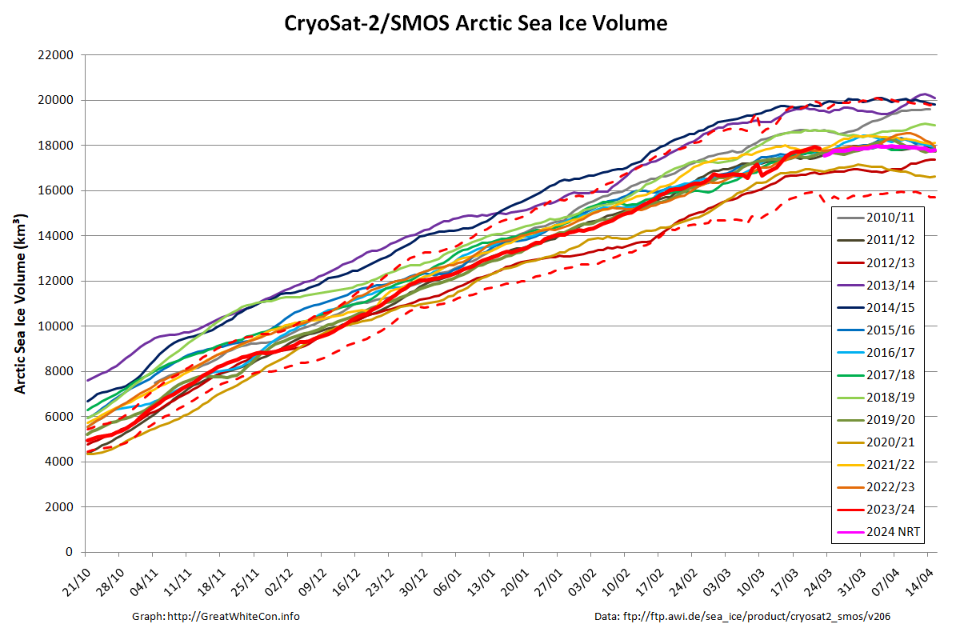
The CryoSat-2/SMOS merged Arctic sea ice volume graph finishes on April 15th, but older data is being reanalysed and here is the latest version:
The gap in the near real time data due to the problem with the SMOS satellite during the first half of March has been filled in, but the result doesn’t look very convincing to say the least!
The PIOMAS gridded thickness data for April 2024 is now available. Here’s the end of month volume graph:
In a press release last week the Alfred Wegener Institute announced that:
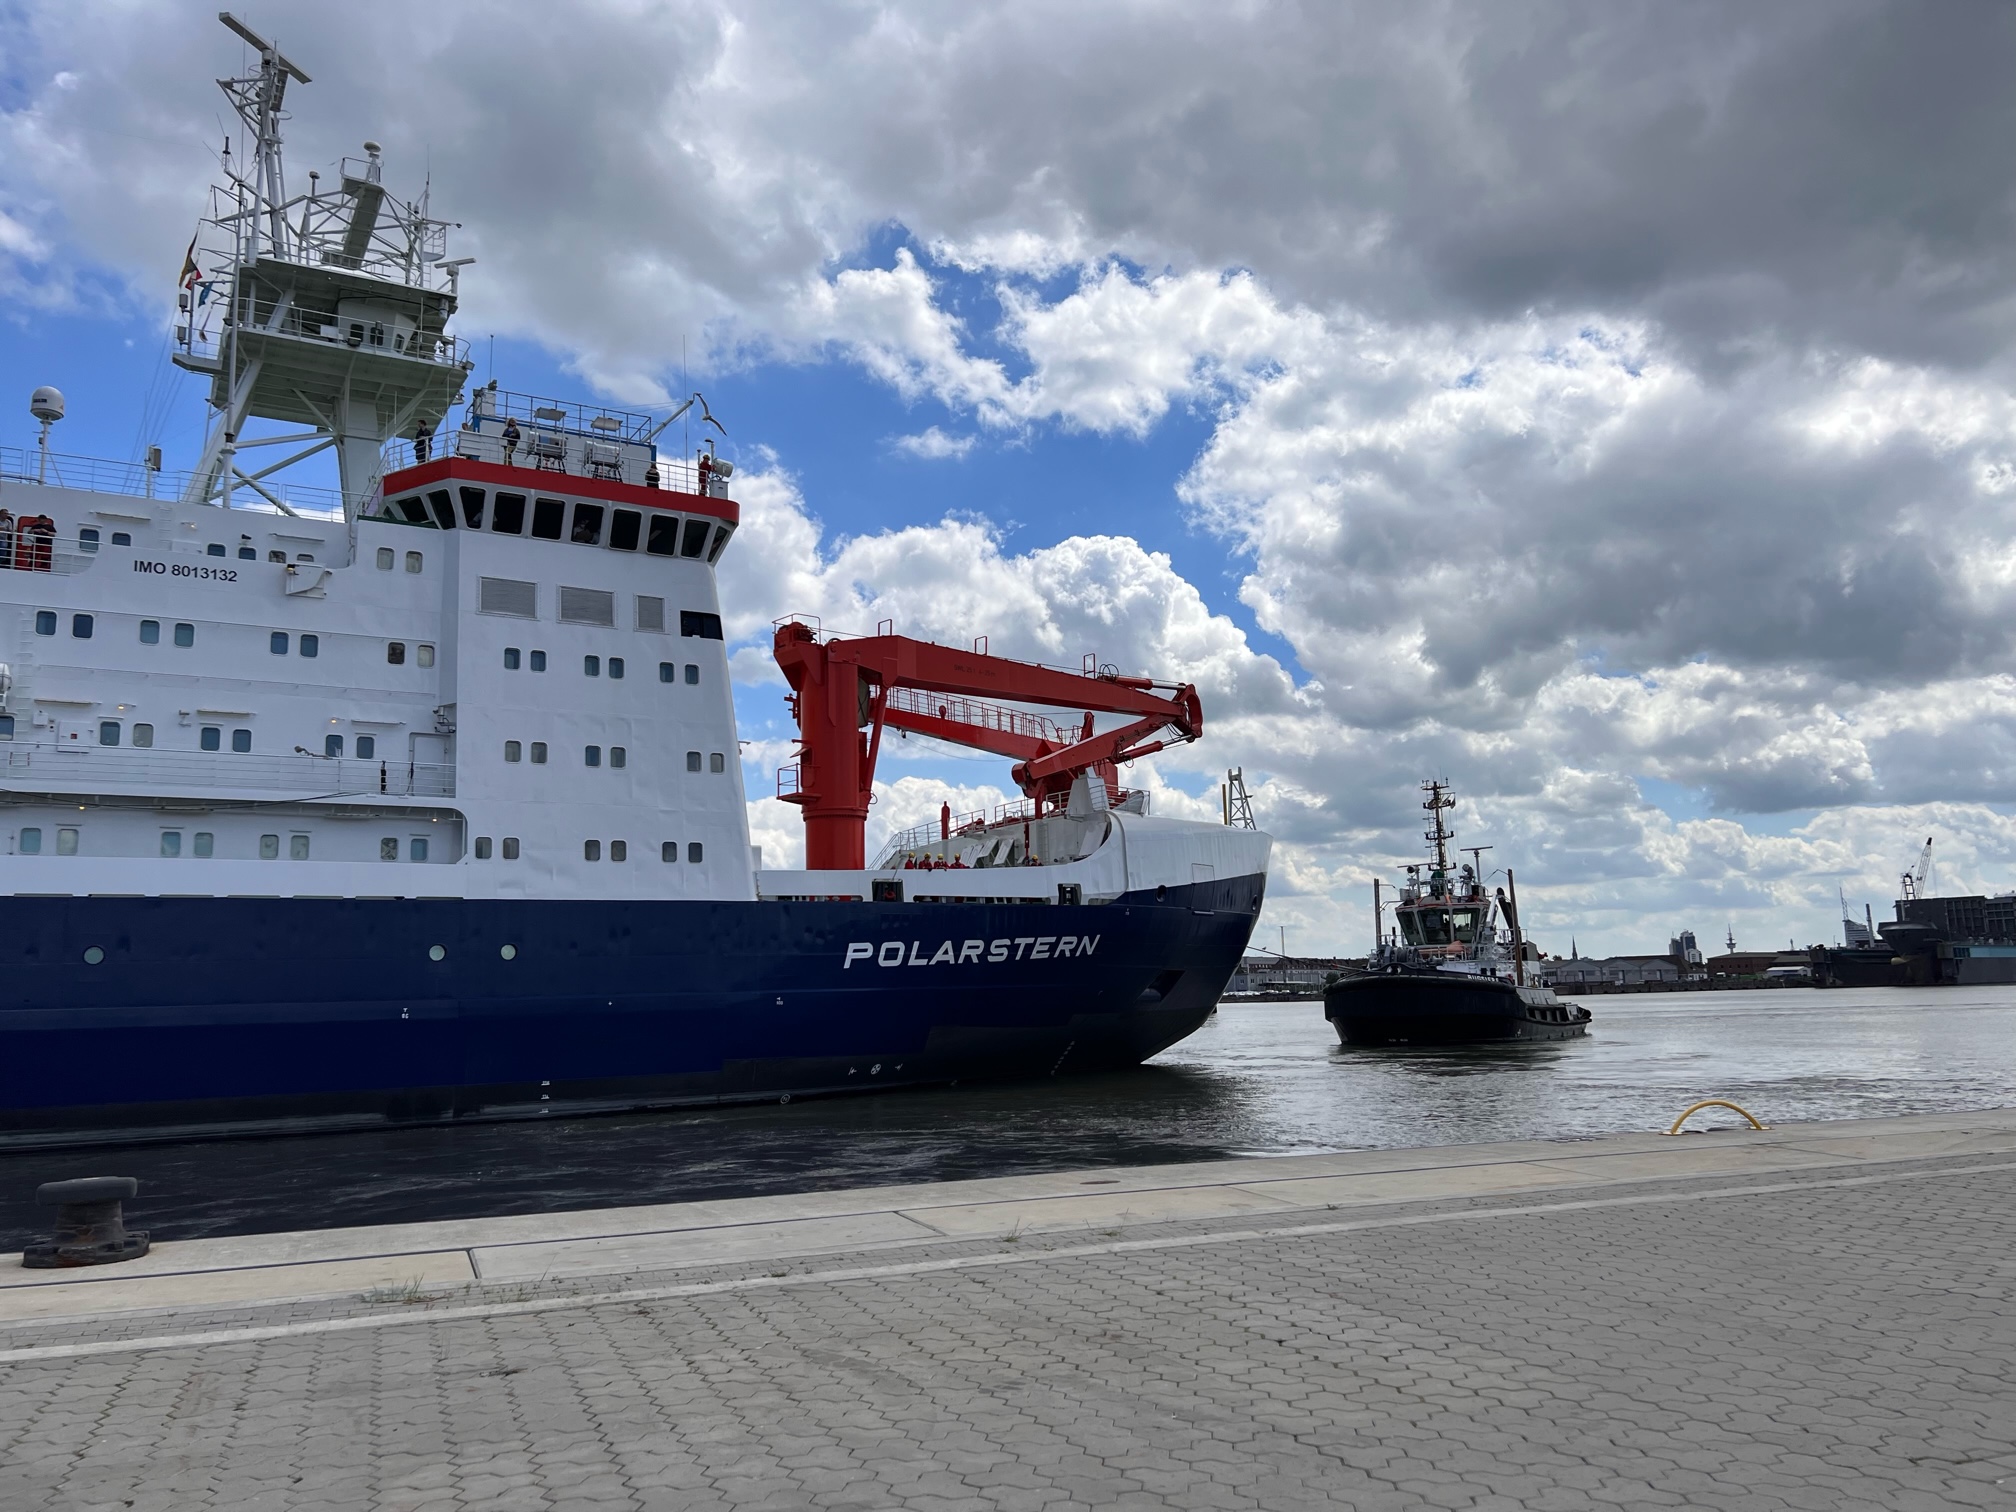
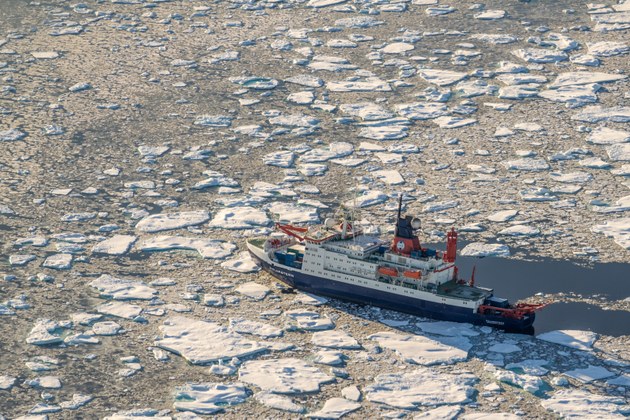
From her home port in Bremerhaven, the Polarstern will set course for Fram Strait and the marginal ice zone north of Svalbard, where warm, nutrient-rich Atlantic Water flows into the Arctic Ocean.
The Polarstern starts its voyage to the Arctic from its home port of Bremerhaven. Photo: Nina Machner
Closely monitoring energy and material flows in the marginal ice zone from the ship and from on ice floes is the goal of the team led by Prof Torsten Kanzow, expedition leader and a physical oceanographer at the Alfred Wegener Institute, Helmholtz Centre for Polar and Marine Research (AWI). “We will make transects from the open water into the dense sea ice and back. Along the way, we will gather a variety of physical, chemical and biological measurements in the marginal ice zone, which is especially productive and therefore especially interesting,” explains Kanzow.
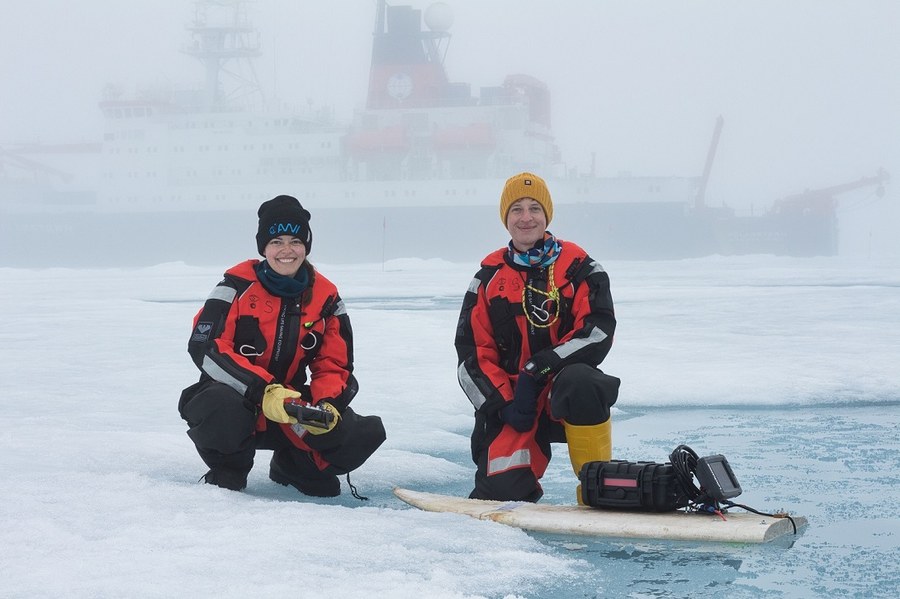
“The team will also venture onto the ice to take a closer look at the thickness and characteristics of the sea ice and measure ocean currents and eddies away from the ship. We’ll also deploy so-called gliders in the ocean, buoys on the ice and moorings on the seafloor, all of which will record valuable data for the next several years. Lastly, we’ll extend our research radius with helicopter flights, during which we’ll observe, for instance, the melt ponds on the ice.”
Following the work in the MIZ north of Svalbard Polarstern will be heading for Northeast Greenland:
The two glaciers there (79 N Glacier and Zachariae Isstrom) are both characterised by ocean-driven ice loss and accelerated ice flows, making them contributors to sea-level rise. “We plan to install moorings in order to gauge the sensitivity of ocean-driven glacier melting to changing environmental conditions,” says Kanzow, who’s been pursuing research in the region since 2016. Accompanying geodetic-glaciological studies will be conducted on Greenland. On the one hand, they will assess how the solid ground is rising on extremely small scales, because it is still rebounding from the past weight of ice masses that melted after the last glacial maximum. On the other, they will explore temporal variations in supraglacial lakes; their drainage out to sea can have considerable effects on glacier flow speeds and glacier melting.
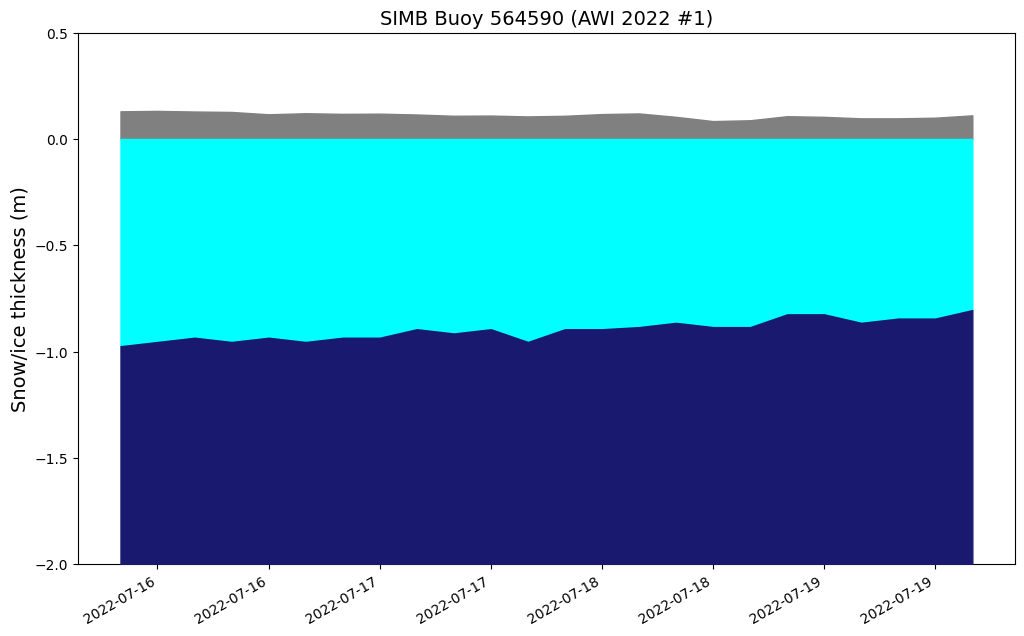
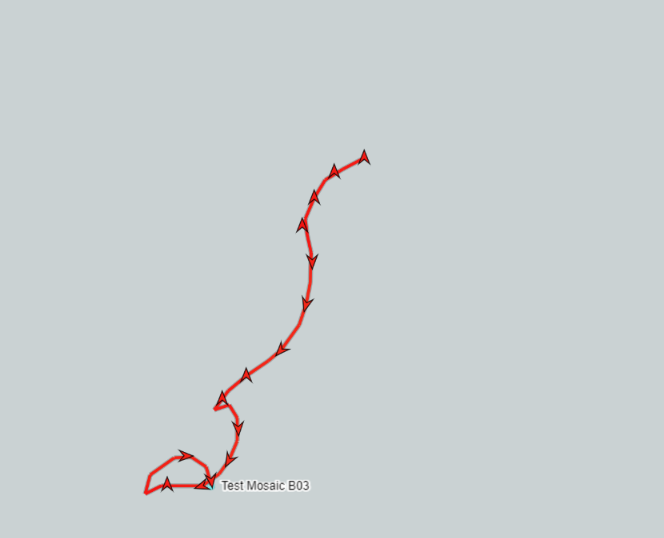
The AWI team have installed three seasonal ice mass balance buoys in the MIZ, without the usual thermistor string but with a new conductivity, temperature, depth (CTD) sensor fitted to measure salinity instead. Less colourful than usual sea ice thickness graphs can be viewed on the 2022 ice mass balance buoy page. Here’s one example:
[Edit – July 25th]
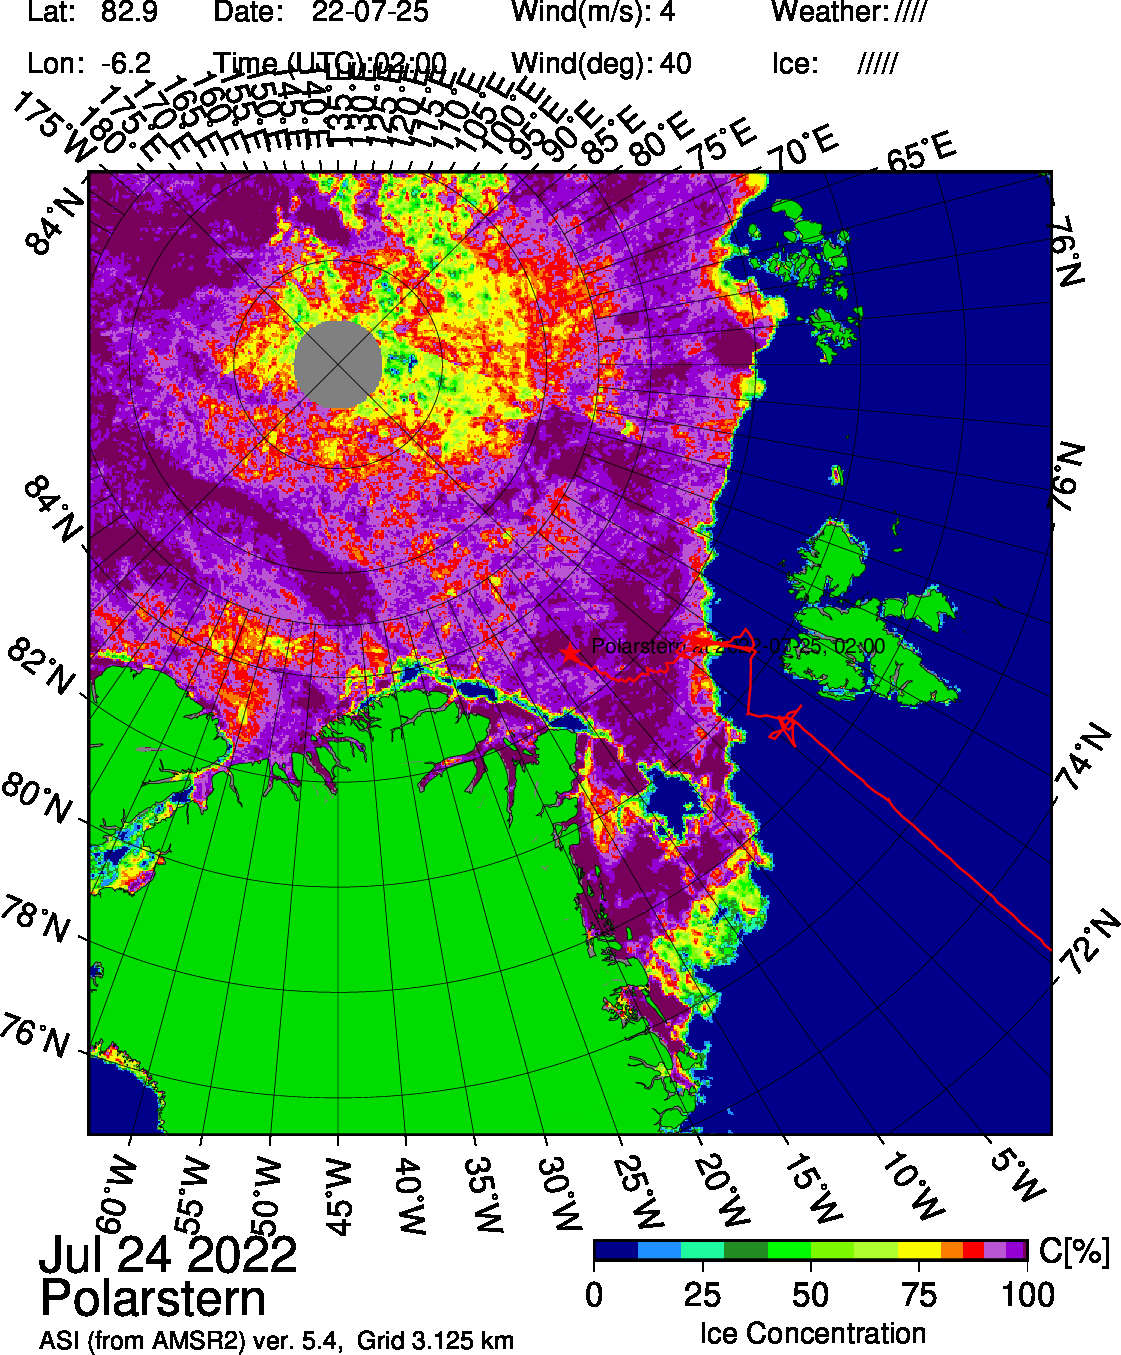
The image above updates on a daily basis, but today’s version is worth preserving for posterity:
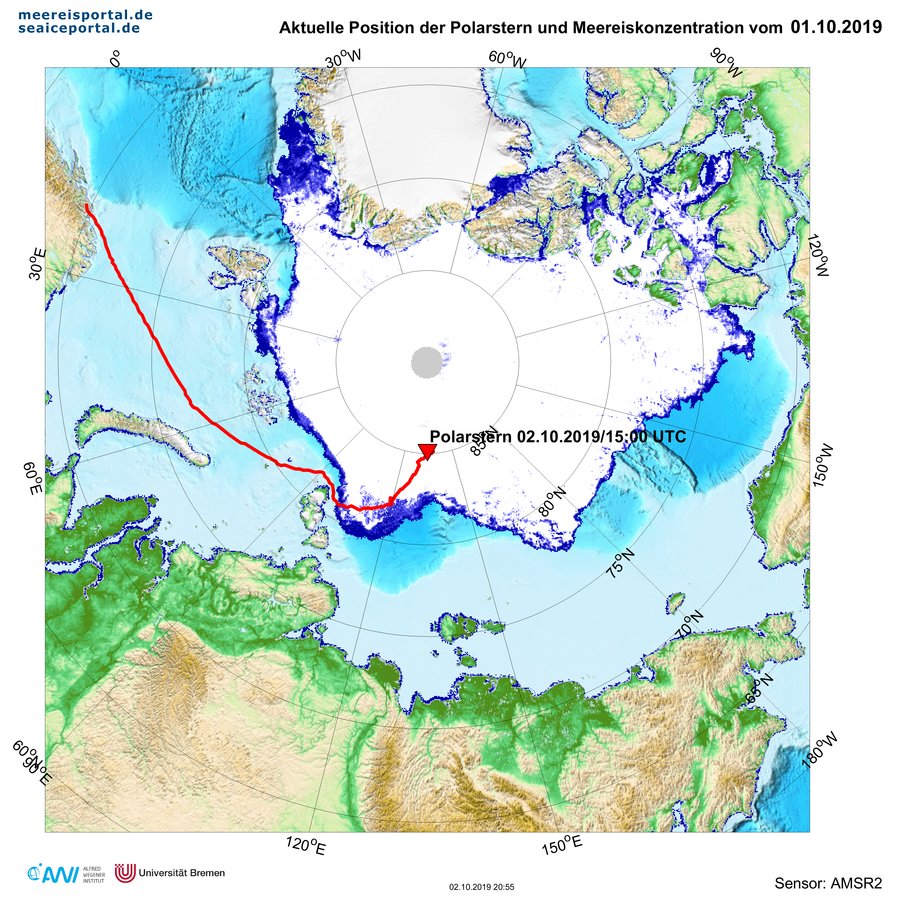
There is currently a large area of low concentration sea ice around the North Pole, and Polarstern has left its station in the marginal ice zone and is currently heading north of Greenland rather than in the direction of the 79N/ZI glaciers.
Polarstern has been heading even further north to the Aurora Vent field (about 130 nautical miles northwest). As part of an extensive lithospheric study, ocean bottom seismometers will be deployed at depths of more than 4000 meters to record seismological activity as well as the physical properties of the hydrothermal plume.
Polarstern north east of Greenland – Photo: Christian R. Rohleder
Polarstern is now heading south again, where a team from the Technical University of Dresden will be deploying a modified surfboard on supra-glacial lakes! Here’s a test run in a melt pond:
Photo: Erik Loebel[Edit – July 29th]
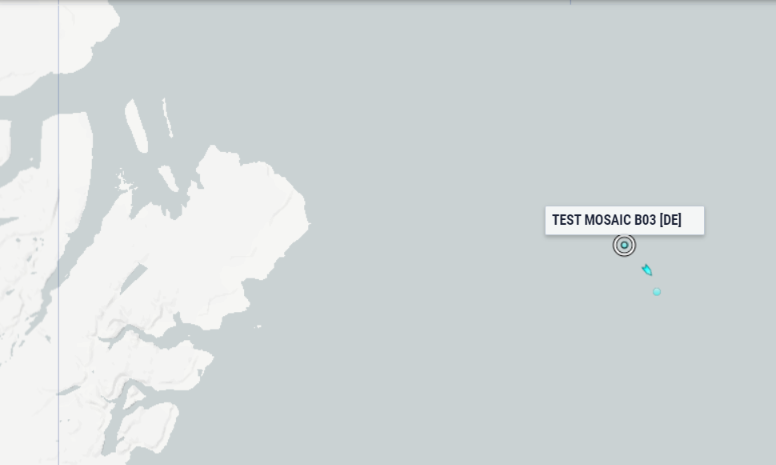
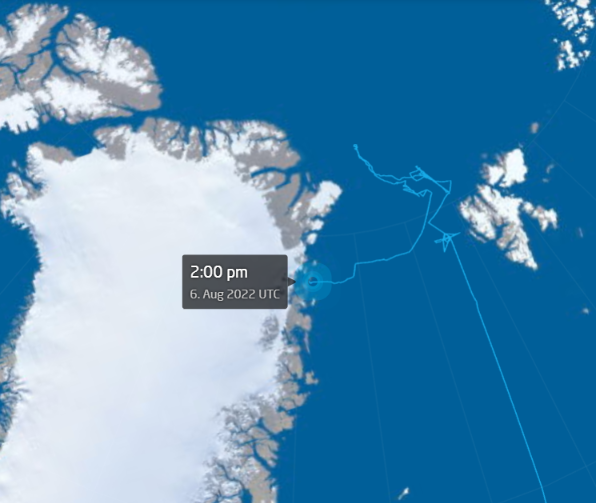
I discovered something rather interesting whilst browsing the Marine Traffic ship tracking web site this morning:
It appears as if the AWI have recently installed two buoys that support AIS position reporting, as indeed does Polarstern itself:
[Edit – August 6th]
Polarstern is now approaching the 79 N and Zachariae Isstrom glaciers:
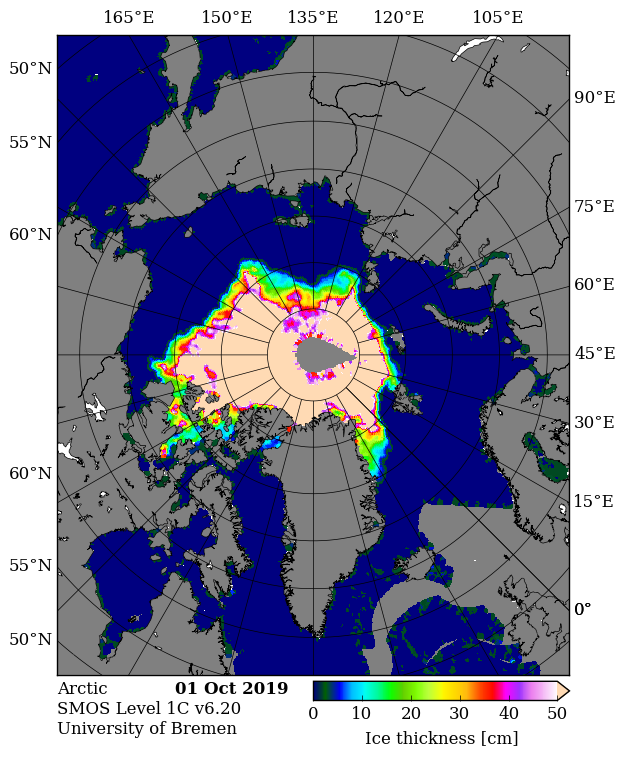
Whilst we await the PIOMAS volume numbers which generally arrive around the 5th of each month, and before we look at graphs of extent, with the refreeze well under way some “measured” thickness maps are coming back! Here’s the first SMOS map this autumn:
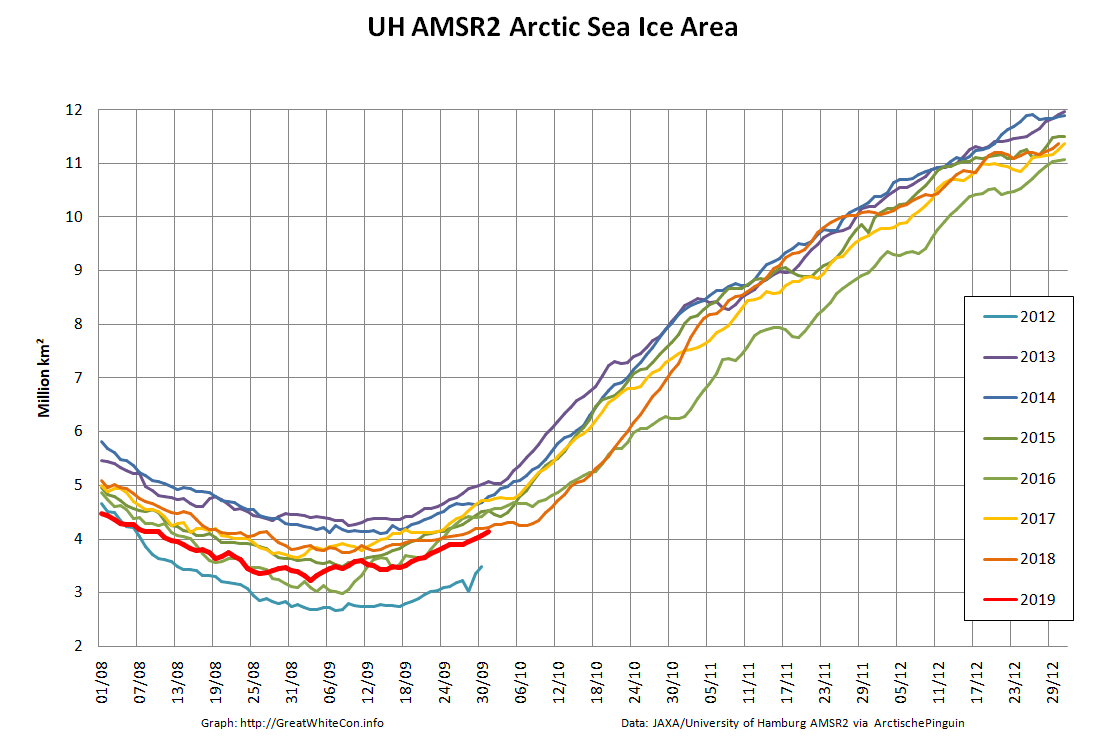
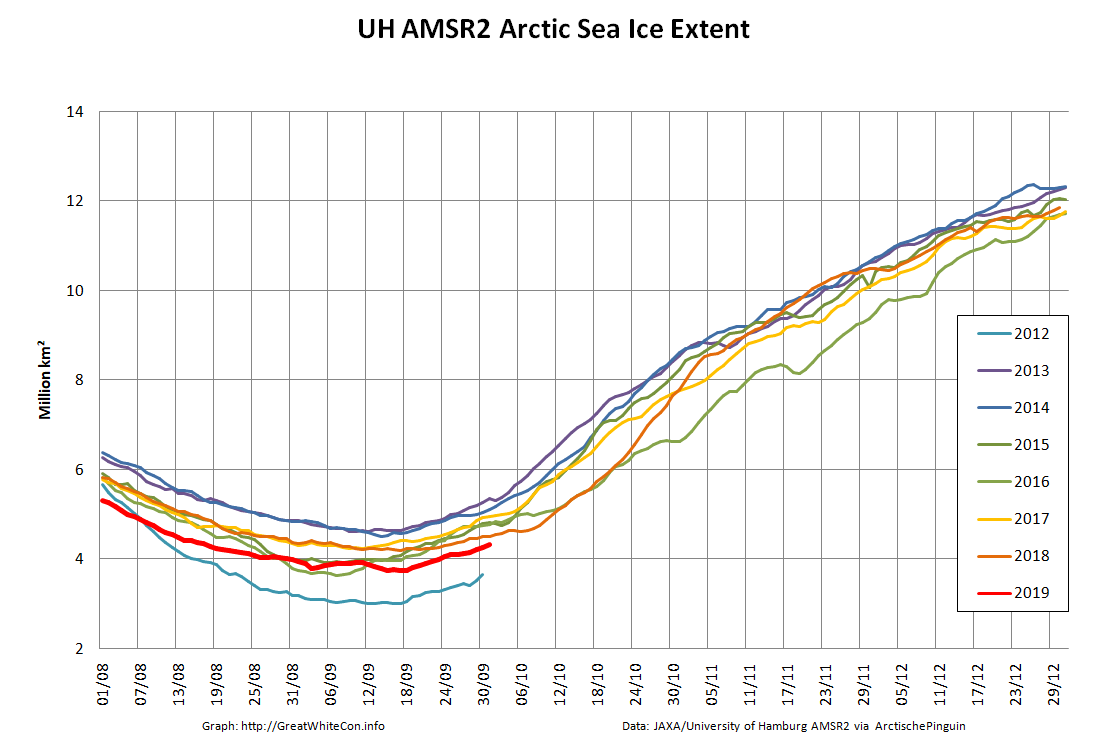
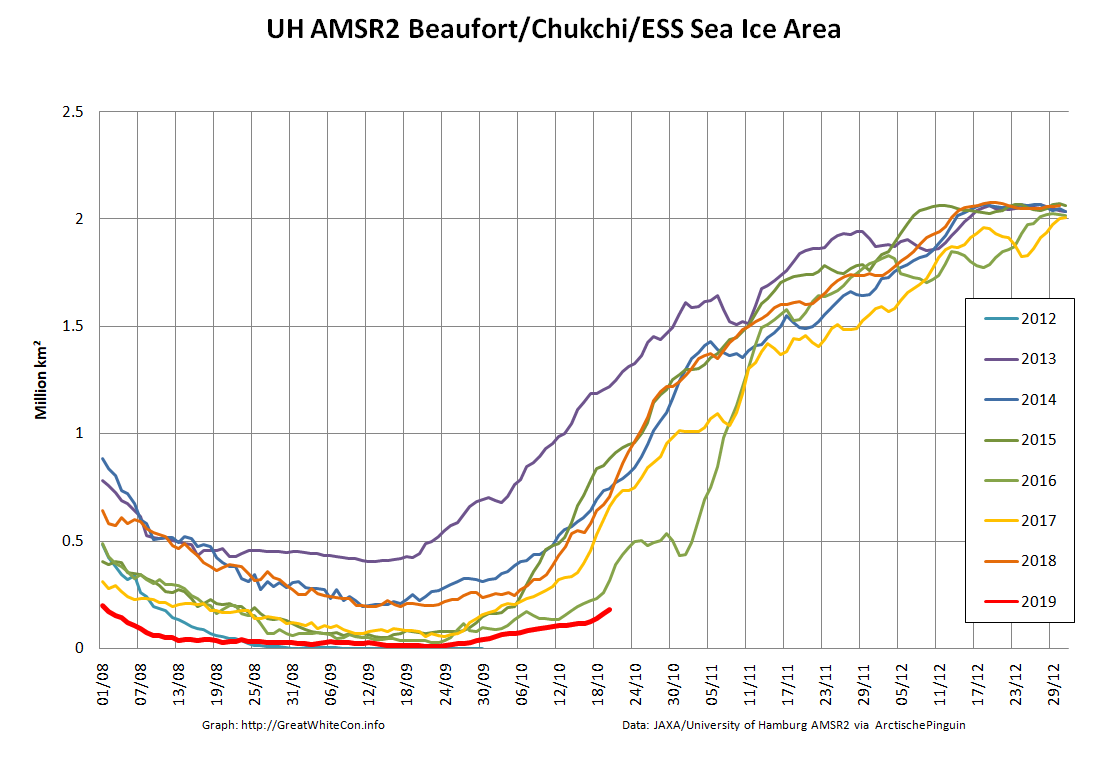
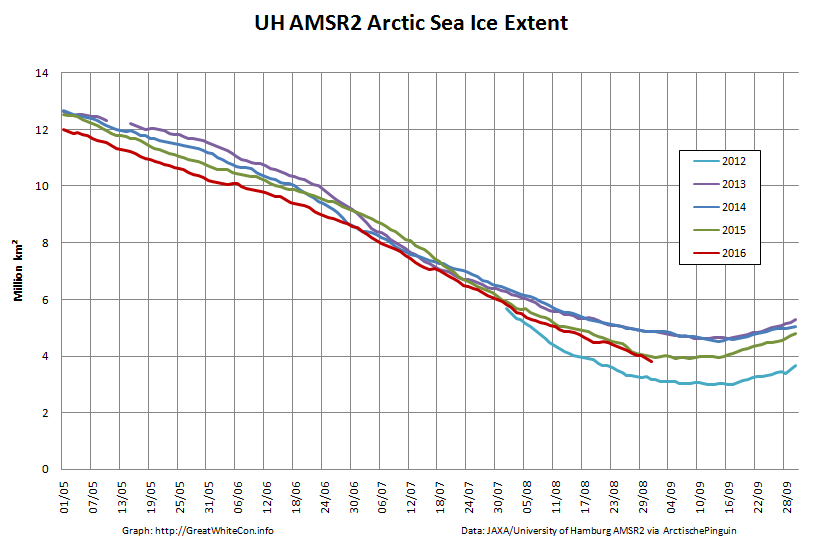
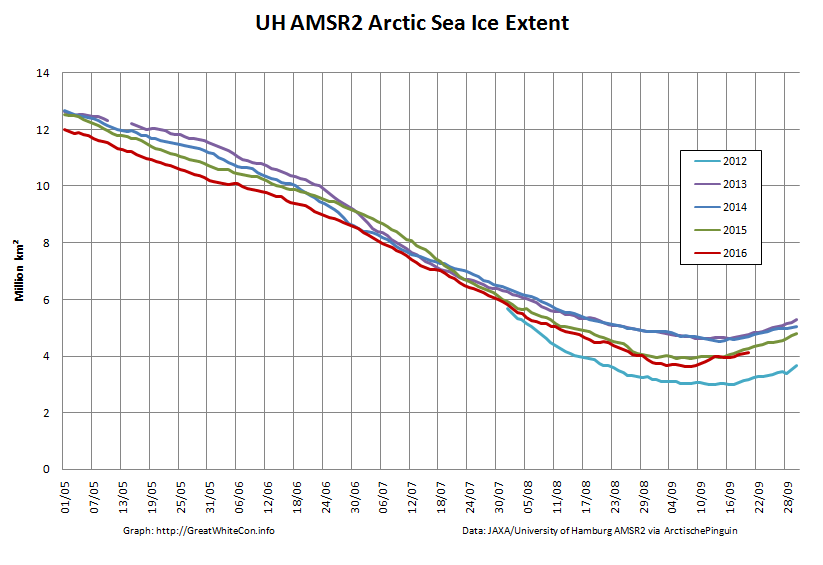
Then of course there’s our usual Arctic wide high resolution AMSR2 area and extent graphs:
They reveal both metrics currently still second lowest (in the brief AMSR2 record) after 2012. It looks as though that may well change soon, particularly area.
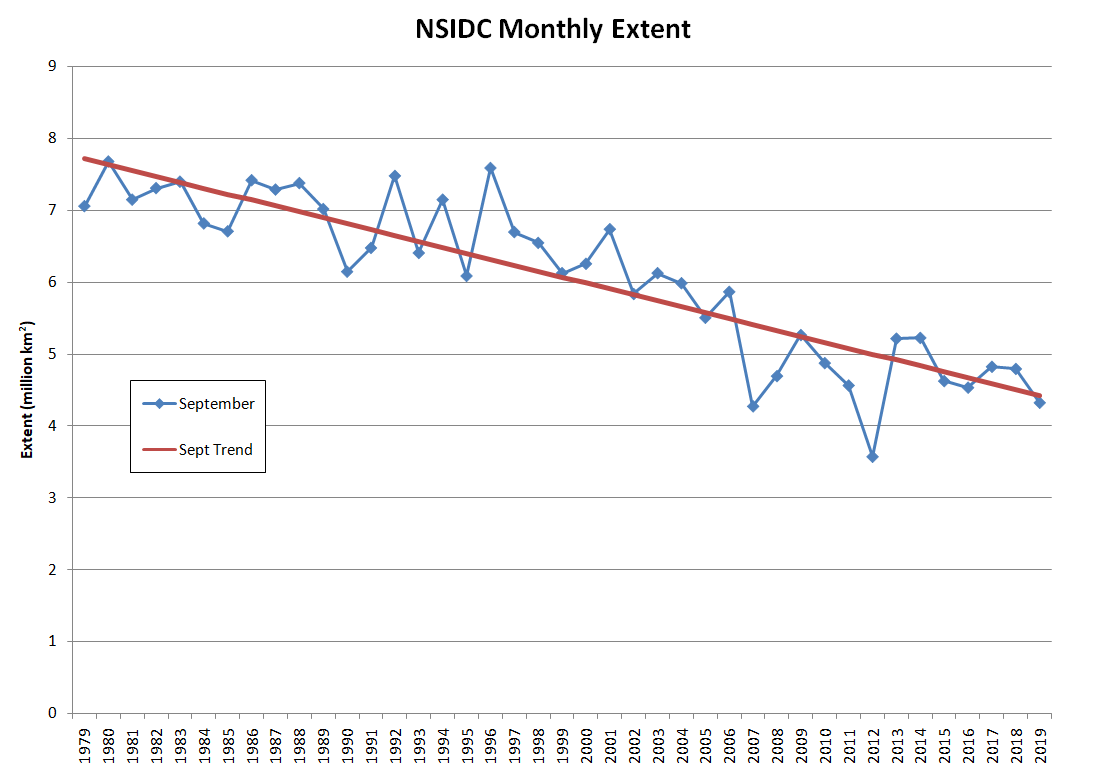
The near real time NSIDC monthly extent for September is 4.32 million km². Here’s the graph:
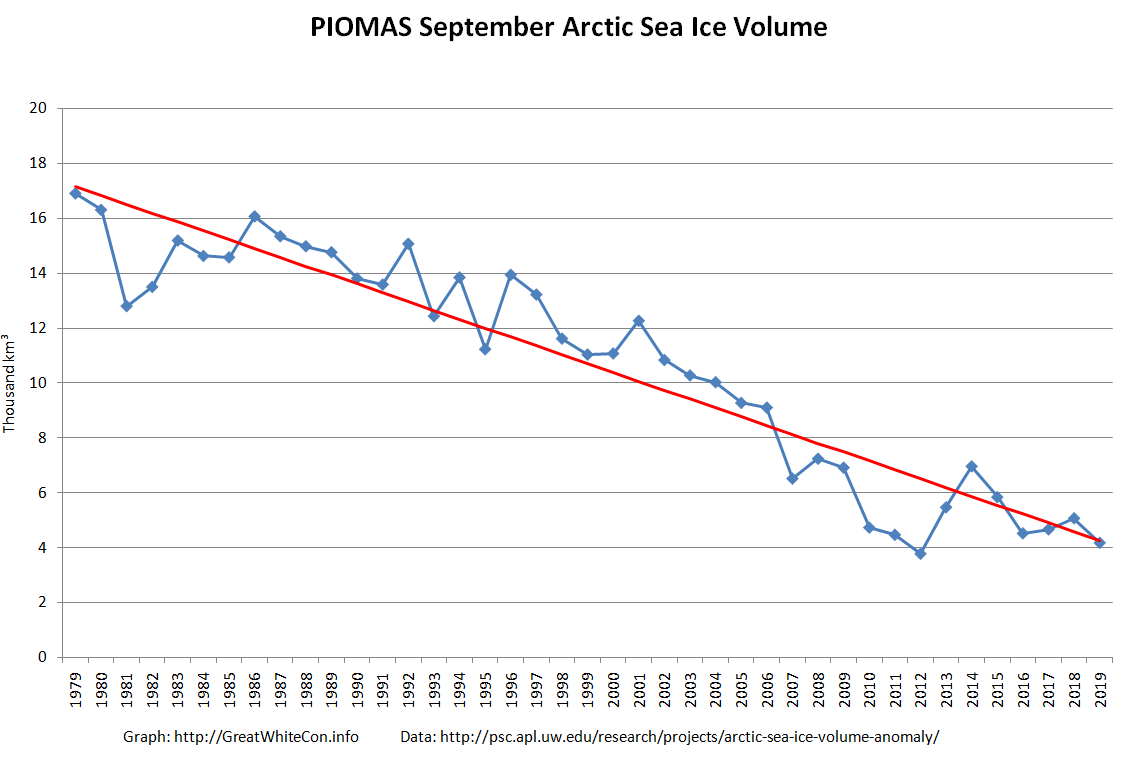
We’re eagerly awaiting the first ice mass balance buoy “near real time” data, but for now the 2019 PIOMAS minimum volume is expected to be revealed real soon now, so:
[Edit – October 5th]
As previously perfectly predicted, the PIOMAS numbers have arrived over at the ASIF. Here’s the thickness map for the end of September:
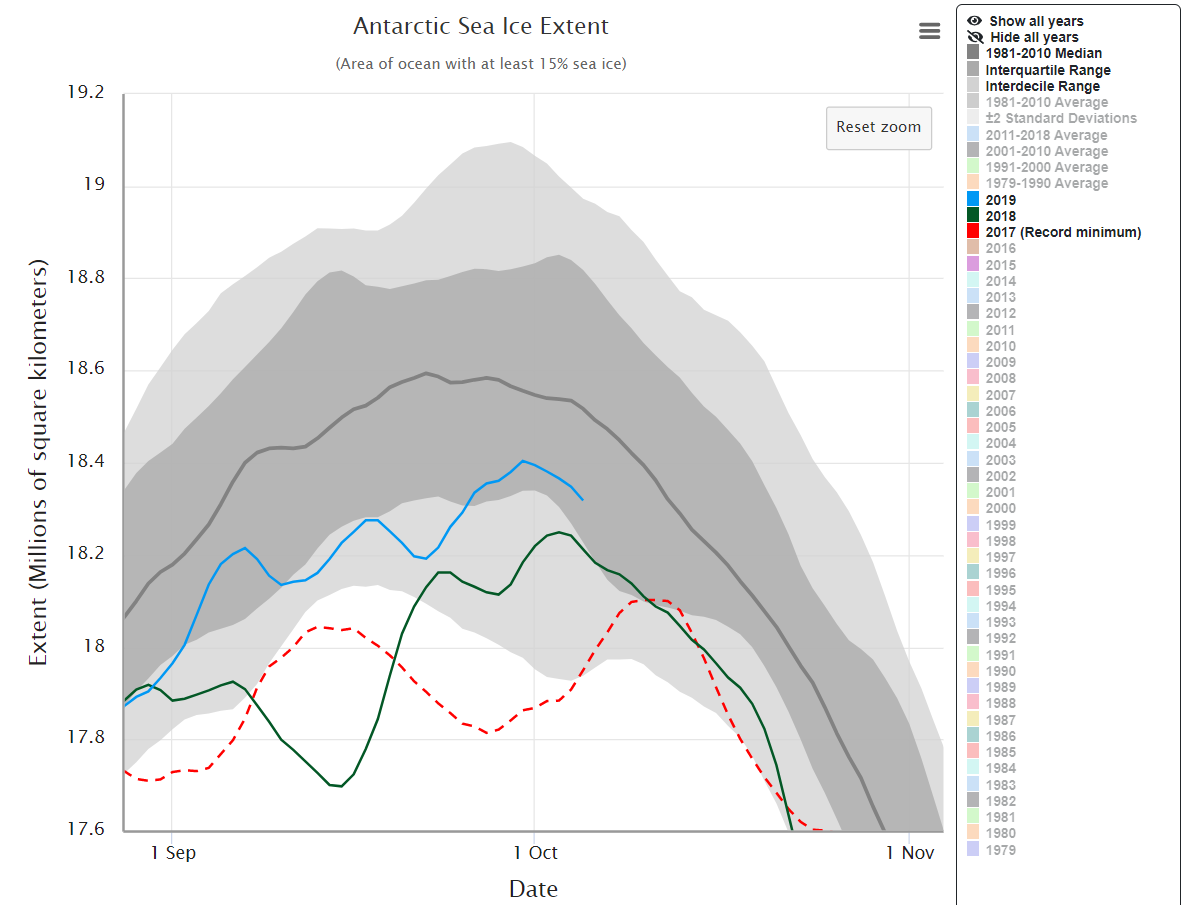
A marginally off topic excursion down under. The NSIDC 5 day average Antarctic sea extent looks to have peaked at 18.40 million km² on September 30th:
[Edit – October 7th]
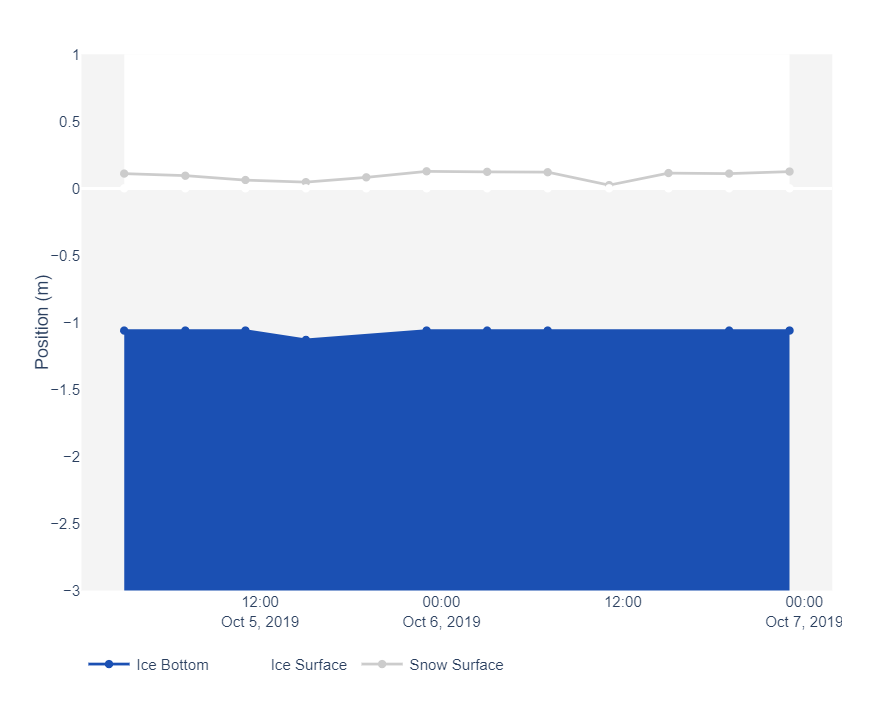
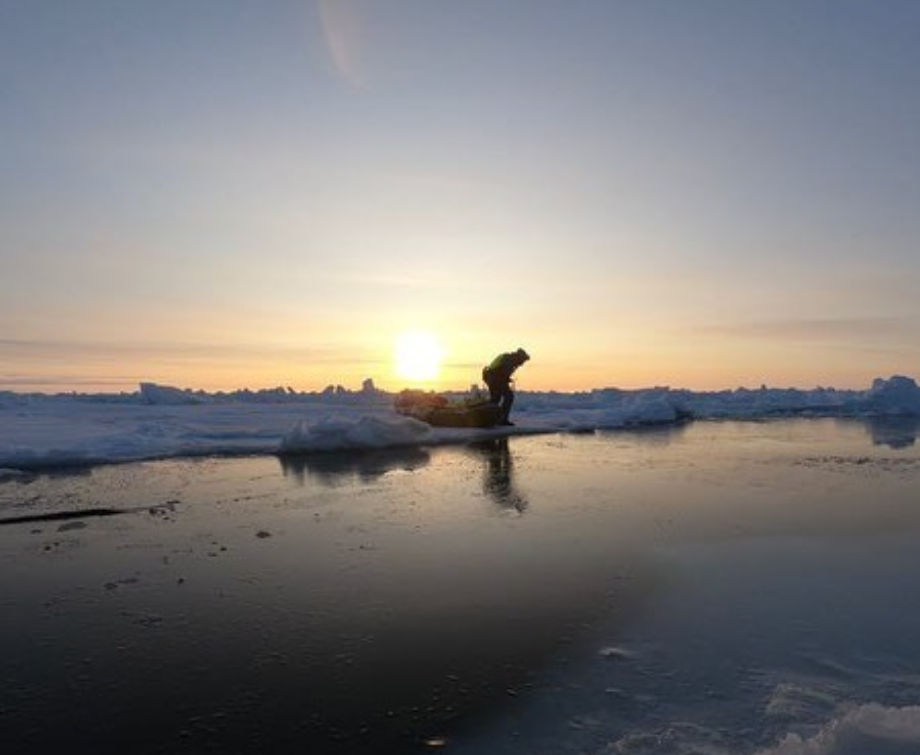
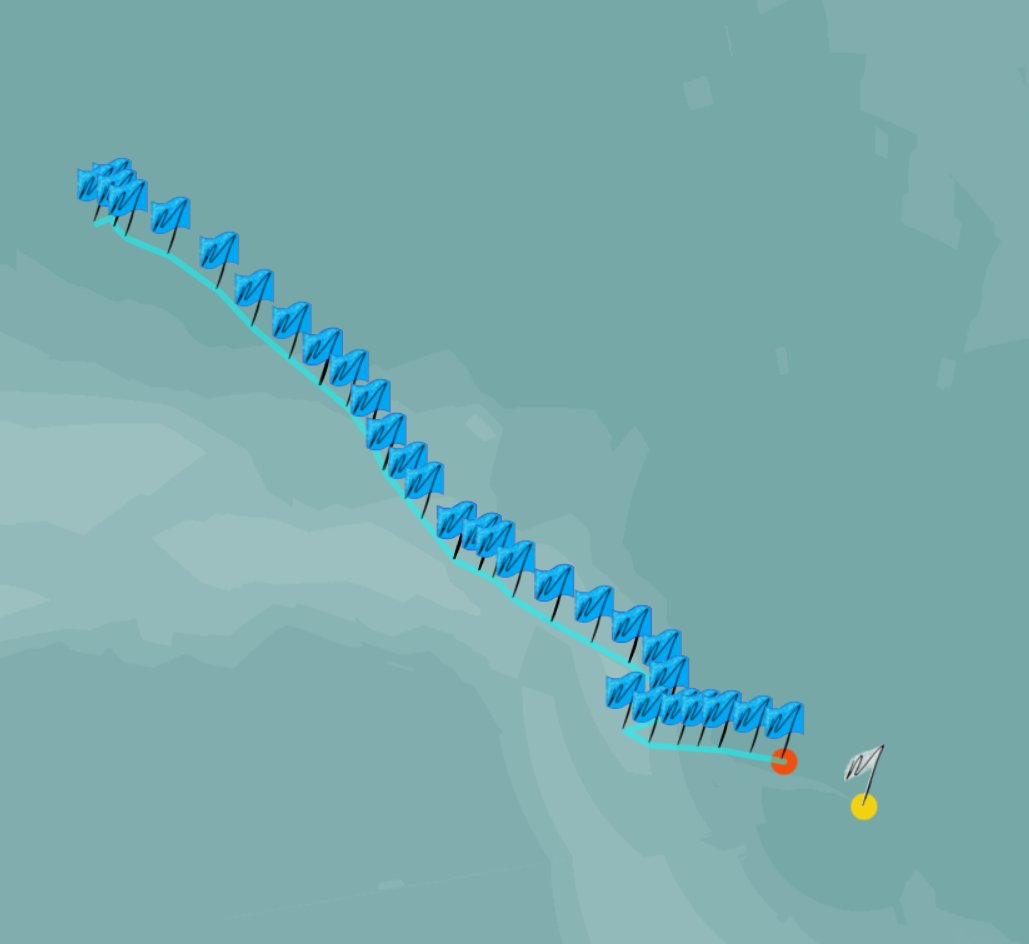
The first of the MOSAiC Expedition’s Ice Mass Balance buoys has been installed, presumably on the ice floe Polarstern is moored to. It reveals sea ice that is currently just over 1 meter thick with a sprinkling of snow on top:
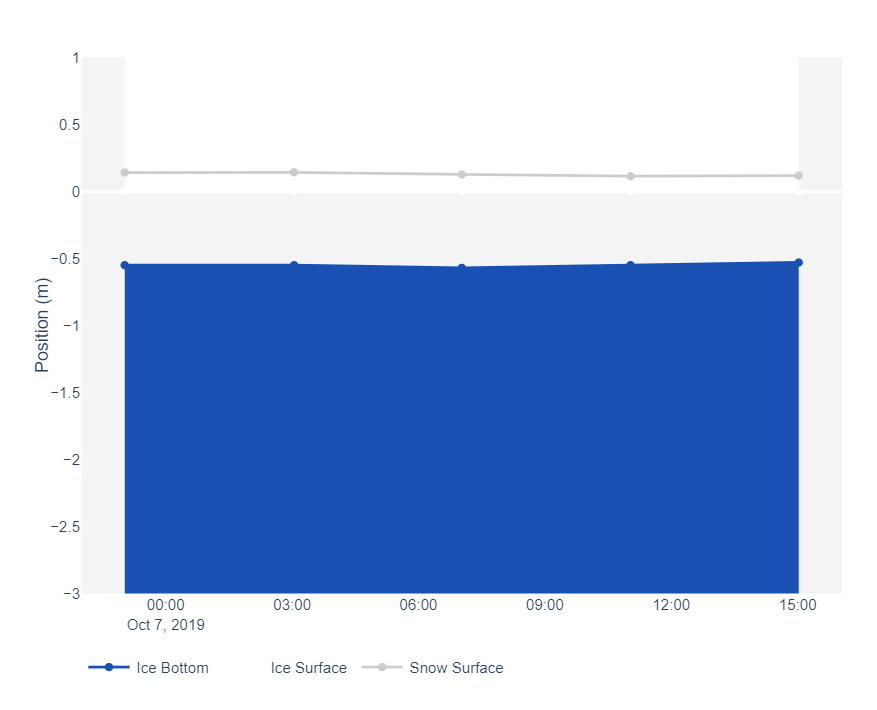
P.S MOSAiC IMB buoy #3 has gone live today too:
There’s currently only 0.5 meters of ice under this one.
[Edit – October 9th]
Here’s the latest annual PIOMAS “ice cube” animation from Andy Lee Robinson:
[Edit – October 10th]
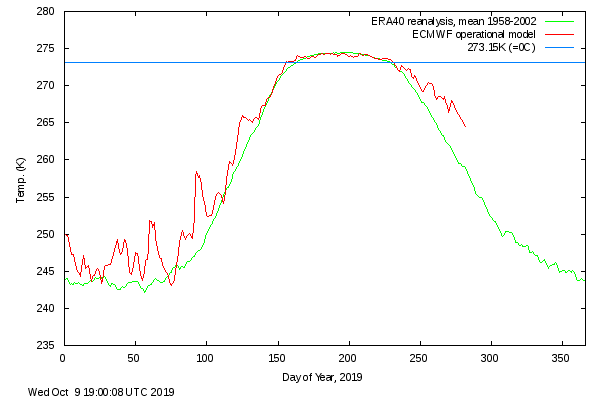
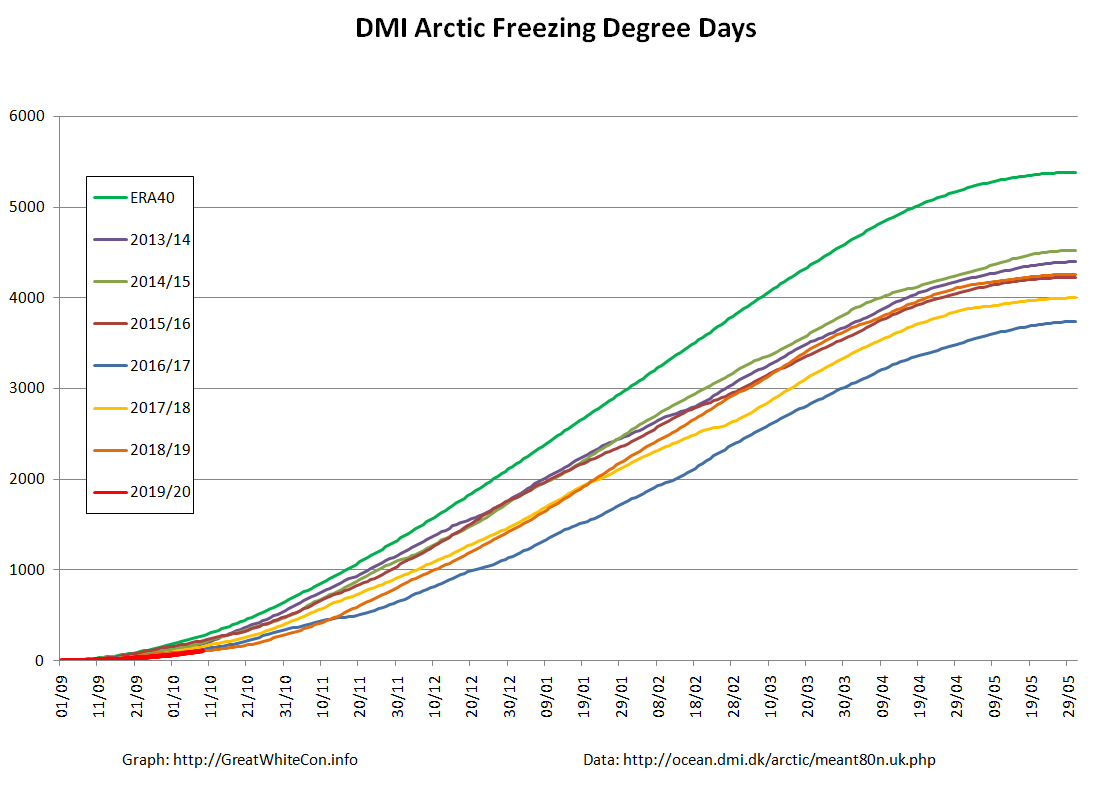
Here’s the latest DMI “high Arctic” temperature graph:
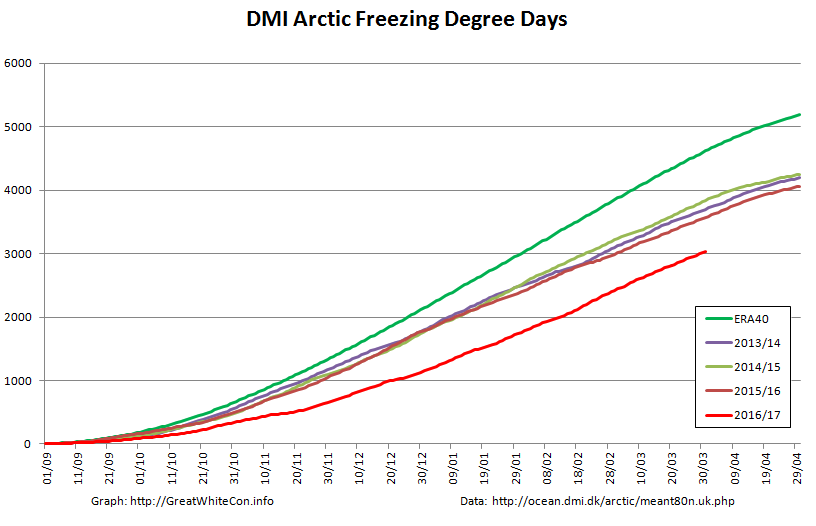
Needless to say that means the DMI Freezing Degrees Days graph is tracking the lowest readings in the DMI’s records:
[Edit – October 11th]
MOSAiC IMB buoy #2 has now been installed and is beaming back data:
The sea ice at this location is decidedly on the thin side at present. A mere 20 cm or thereabouts!
[Edit – October 12th]
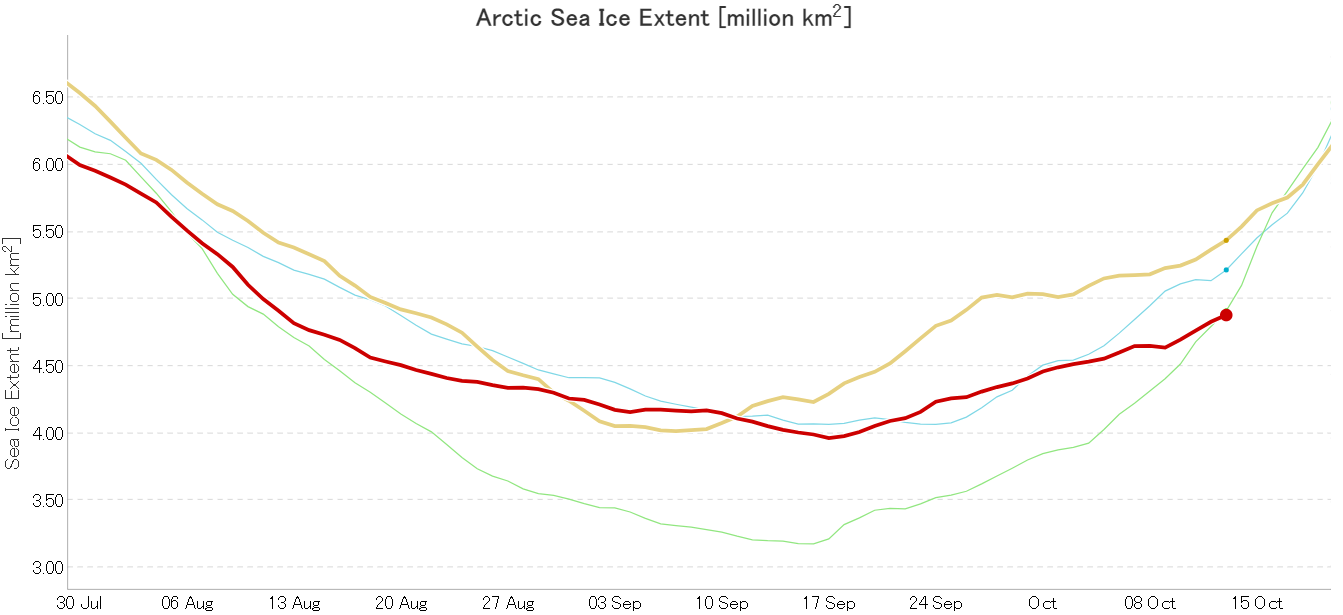
The JAXA ViSHOP web site is down at the moment, so by way of a change here is the University of Bremen’s AMSR2 based extent graph instead:
2019 Arctic sea ice is extent is now once again “lowest for the date” (since AMSRx satellite records began).
[Edit – October 14th]
The JAXA/ADS/ViSHOP web site is back online after being down over the weekend, presumably due to the effects of Typhoon Hagibis:
Sure enough the Japanese flavour of AMSR2 based extent is also now “lowest for the date”.
Mike and Borge’s current position was reported yesterday as: 89°35′51″N 140°30′32″E
[Edit – October 15th]
The latest SMOS Arctic sea ice “thinness” map shows sea ice starting to form on the shores of the Laptev Sea:
[Edit – October 16th]
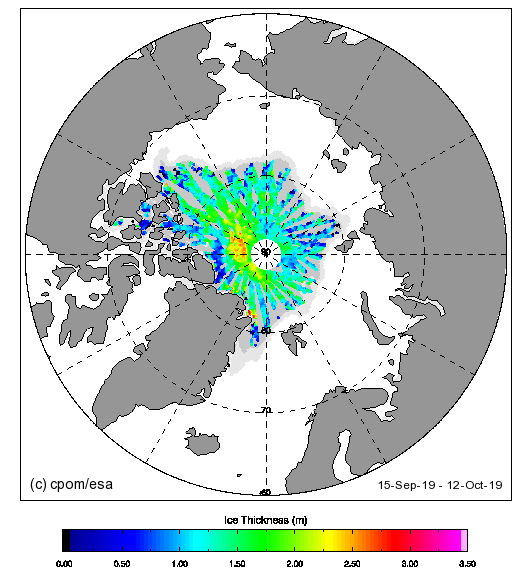
The Centre for Polar Observation and Monitoring (CPOM) have just published the first CryoSat-2 Arctic sea ice thickness map of the 2019/20 freezing season:
Note in particular the dark blue area north of the Canadian Arctic Archipelago.
[Edit – October 20th]
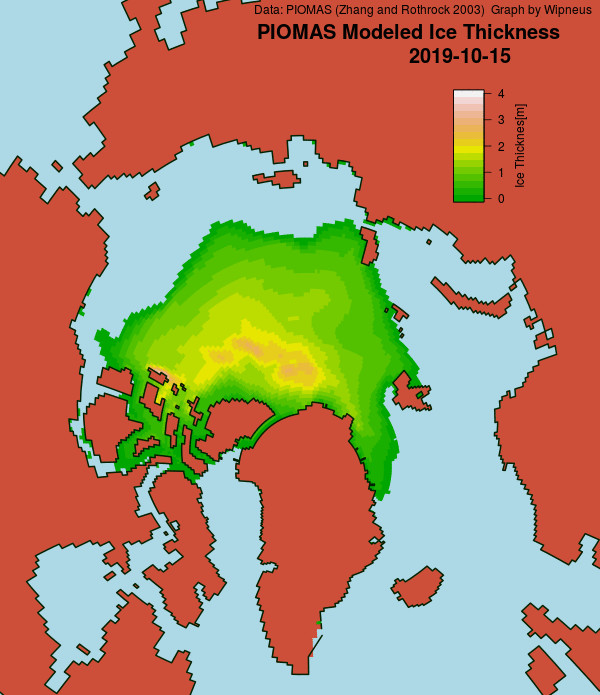
Wipneus has just crunched the October mid month PIOMAS numbers. Here are the results. Not only the modelled Arctic sea ice thickness map:
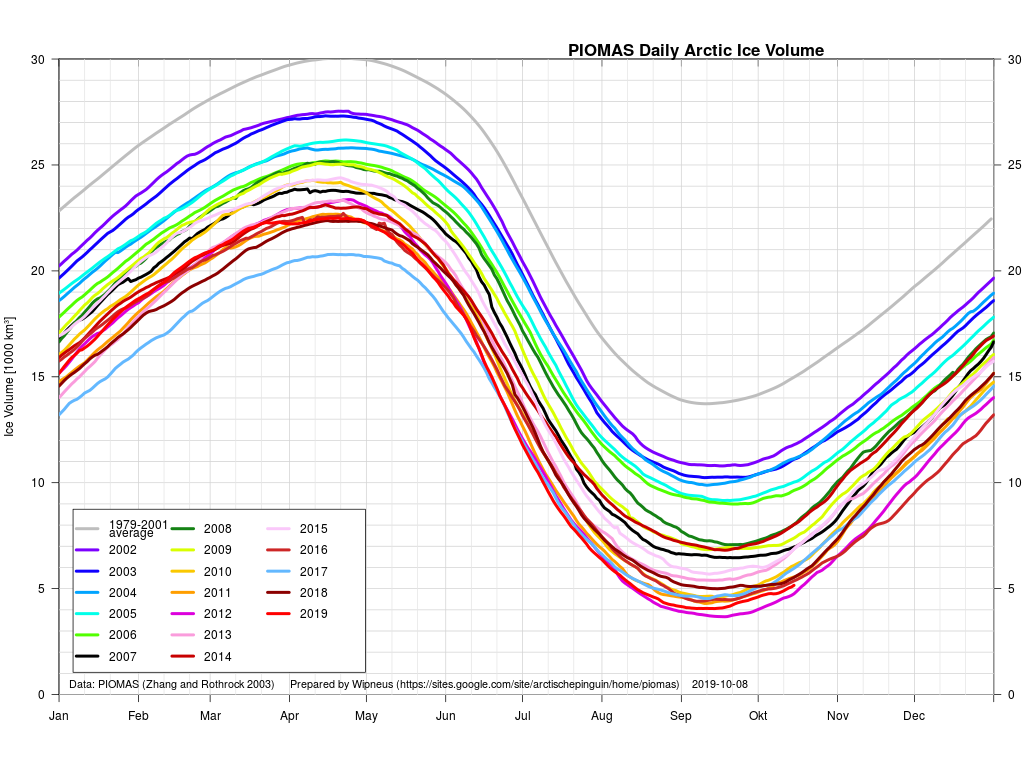
but also the Arctic sea ice volume graph:
[Edit – October 21st]
Over on Twitter Judah Cohen suggests that:
Maybe I will discuss more in the next blog but the #Arctic sea ice growth season on the North Pacific side of the Arctic is just nuts, like it is drunk! Looks unprecedented to me. This needs to be watched through the #winter. Already had 2 unprecedented winters in the Bering sea pic.twitter.com/sAVoZXgNAX
I have been trying to bring the implications of this to the attention of the denizens of Judith Curry’s “Climate Etc.” blog, thus far with remarkably little success! This is the gist of my argument:
“Summer solar heat absorption by the surface waters has increased fivefold over the same time period, chiefly because of reduced sea ice coverage.”
“The effects of an efficient local ice-albedo feedback are thus not confined to the surface ocean/sea ice heat budget but, in addition, lead to increased heat accumulation in the ocean interior that has consequences far beyond the summer season.”
“In the coming years, however, excess Beaufort Gyre halocline heat will give rise to enhanced upward heat fluxes year-round, creating compound effects on the system by slowing winter sea ice growth.”
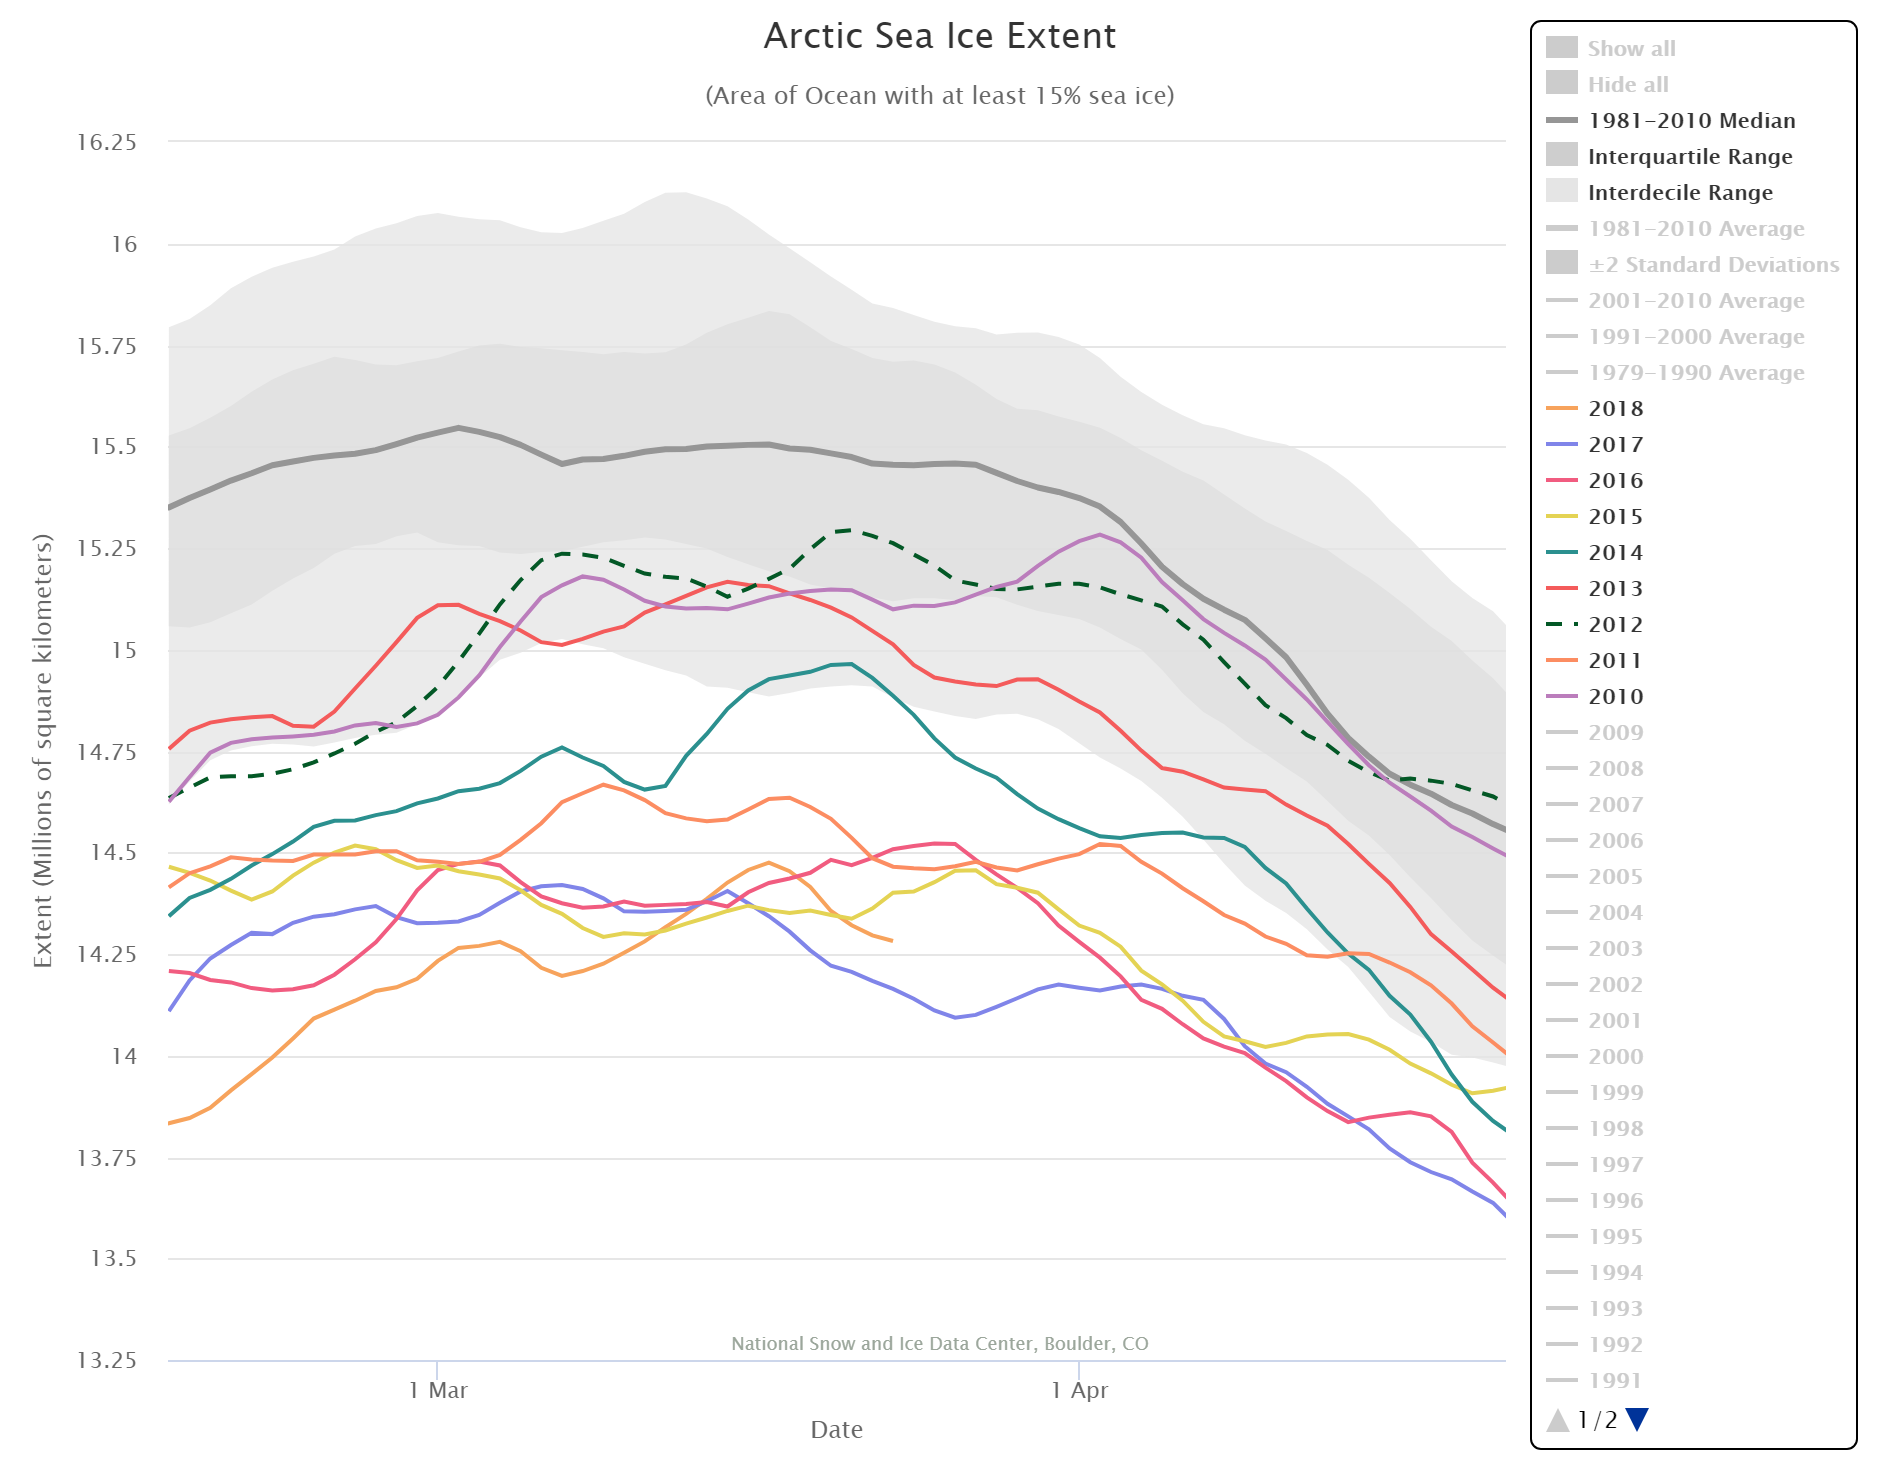
According to the latest edition of the National Snow and Ice Data Center’s “Arctic Sea Ice News”
On March 17, 2018, Arctic sea ice likely reached its maximum extent for the year, at 14.48 million square kilometers (5.59 million square miles), the second lowest in the 39-year satellite record, falling just behind 2017. This year’s maximum extent is 1.16 million square kilometers (448,000 square miles) below the 1981 to 2010 average maximum of 15.64 million square kilometers (6.04 million square miles).
The four lowest seasonal maxima have all occurred during the last four years. The 2018 maximum is 60,000 square kilometers (23,200 square miles) above the record low maximum that occurred on March 7, 2017.
Here’s a close up view of recent maxima via the NSIDC’s Charctic interactive sea ice graph:
Next let’s take a look at extent data from the Japanese National Institute of Polar Research, colloquially referred to as “JAXA extent”
In this case the maximum was 13.89 million square kilometers, also on March 17th.
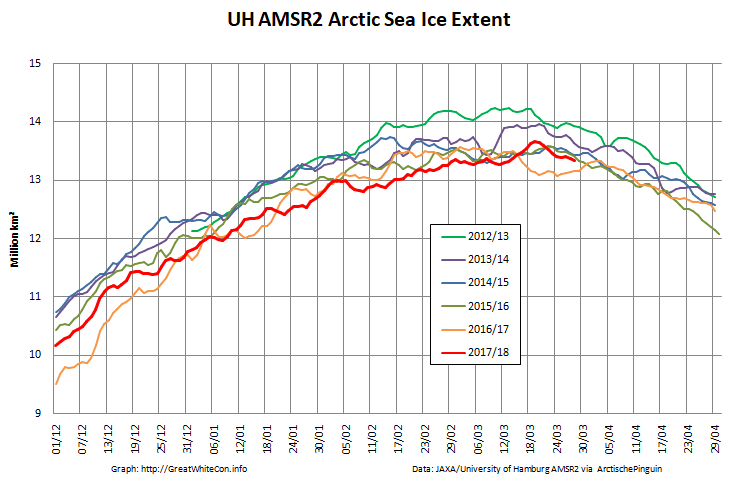
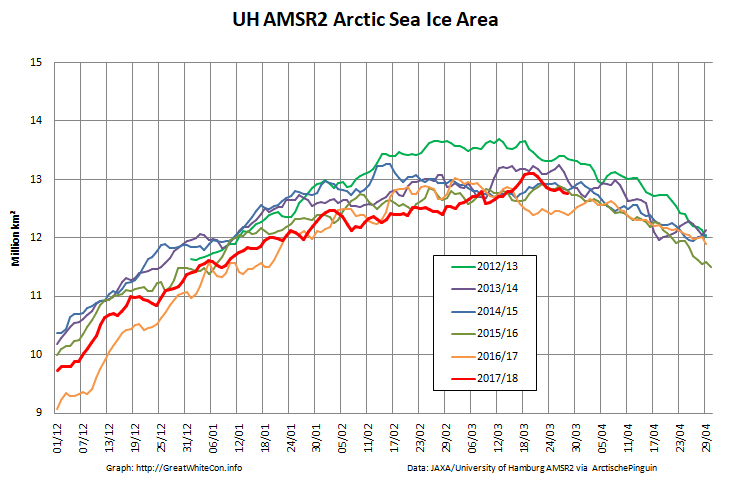
Here too are the extent and area graphs based on Wipneus’ processing of the University of Hamburg’s AMSR2 based concentration data:
They highlight the surge in Arctic sea ice area in the middle of March due to the sudden “cold snap”:
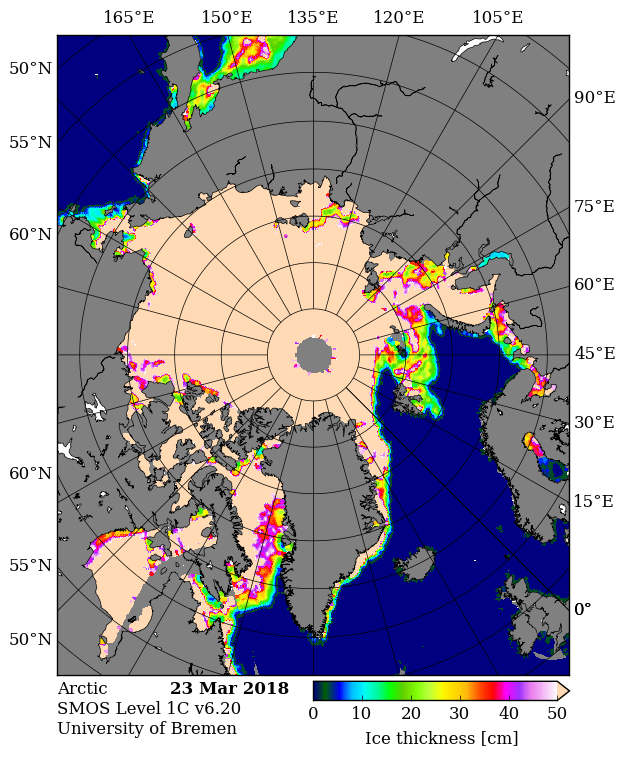
Looking at the third Arctic dimension, here’s the latest SMOS thickness map from the University of Bremen:
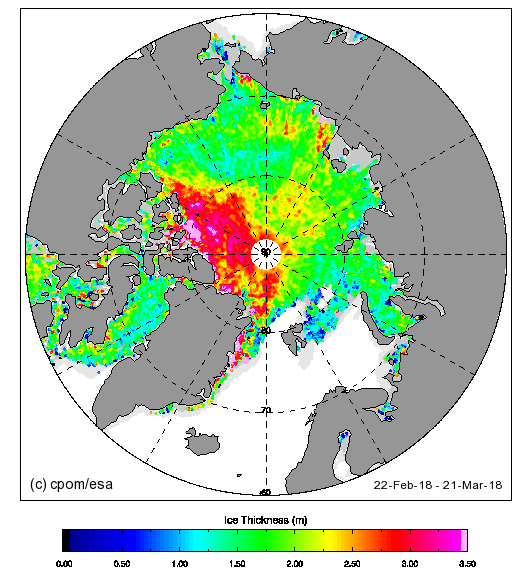
and here’s the latest CryoSat-2 thickness map:
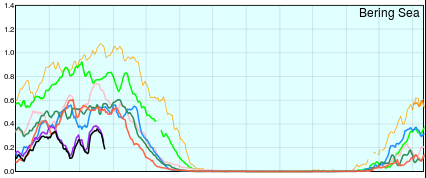
They reveal large areas of relatively thin sea ice in the Okhotsk and Barents Seas where the ice can now be expected to melt as quickly as it formed. There is also remarkably little sea ice in the Bering Sea for the time of year:
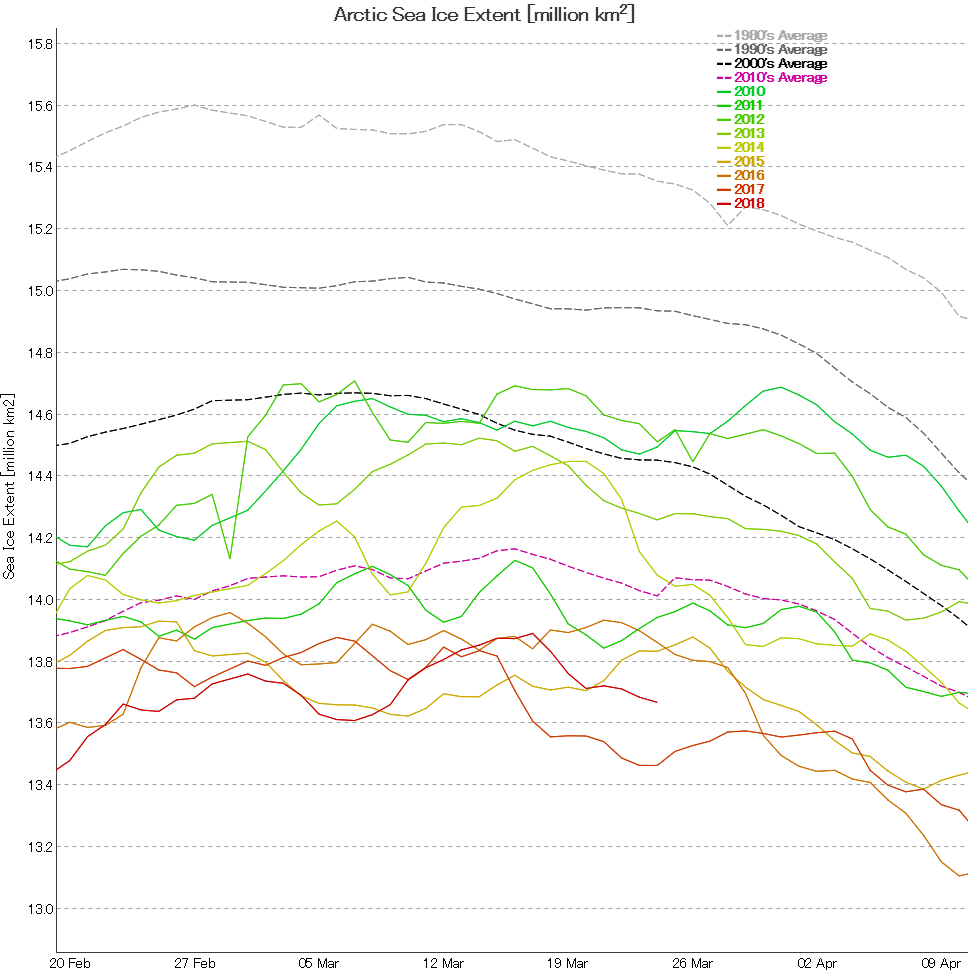
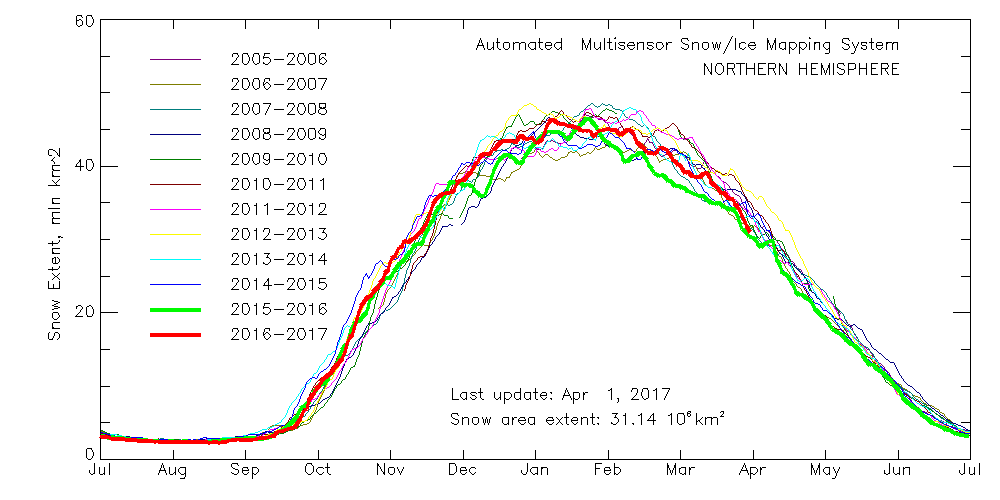
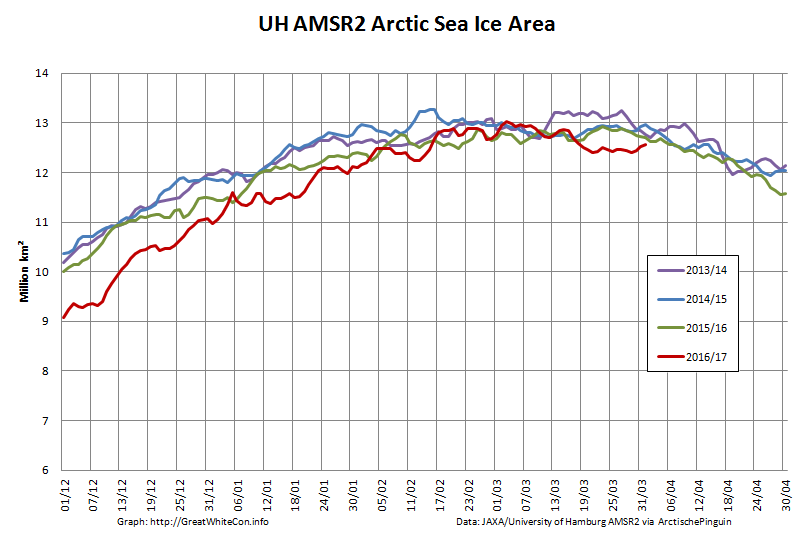
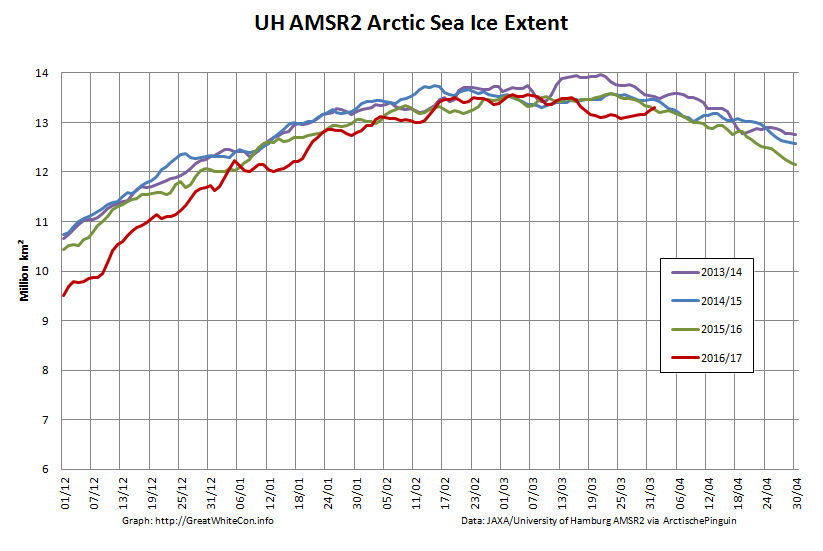
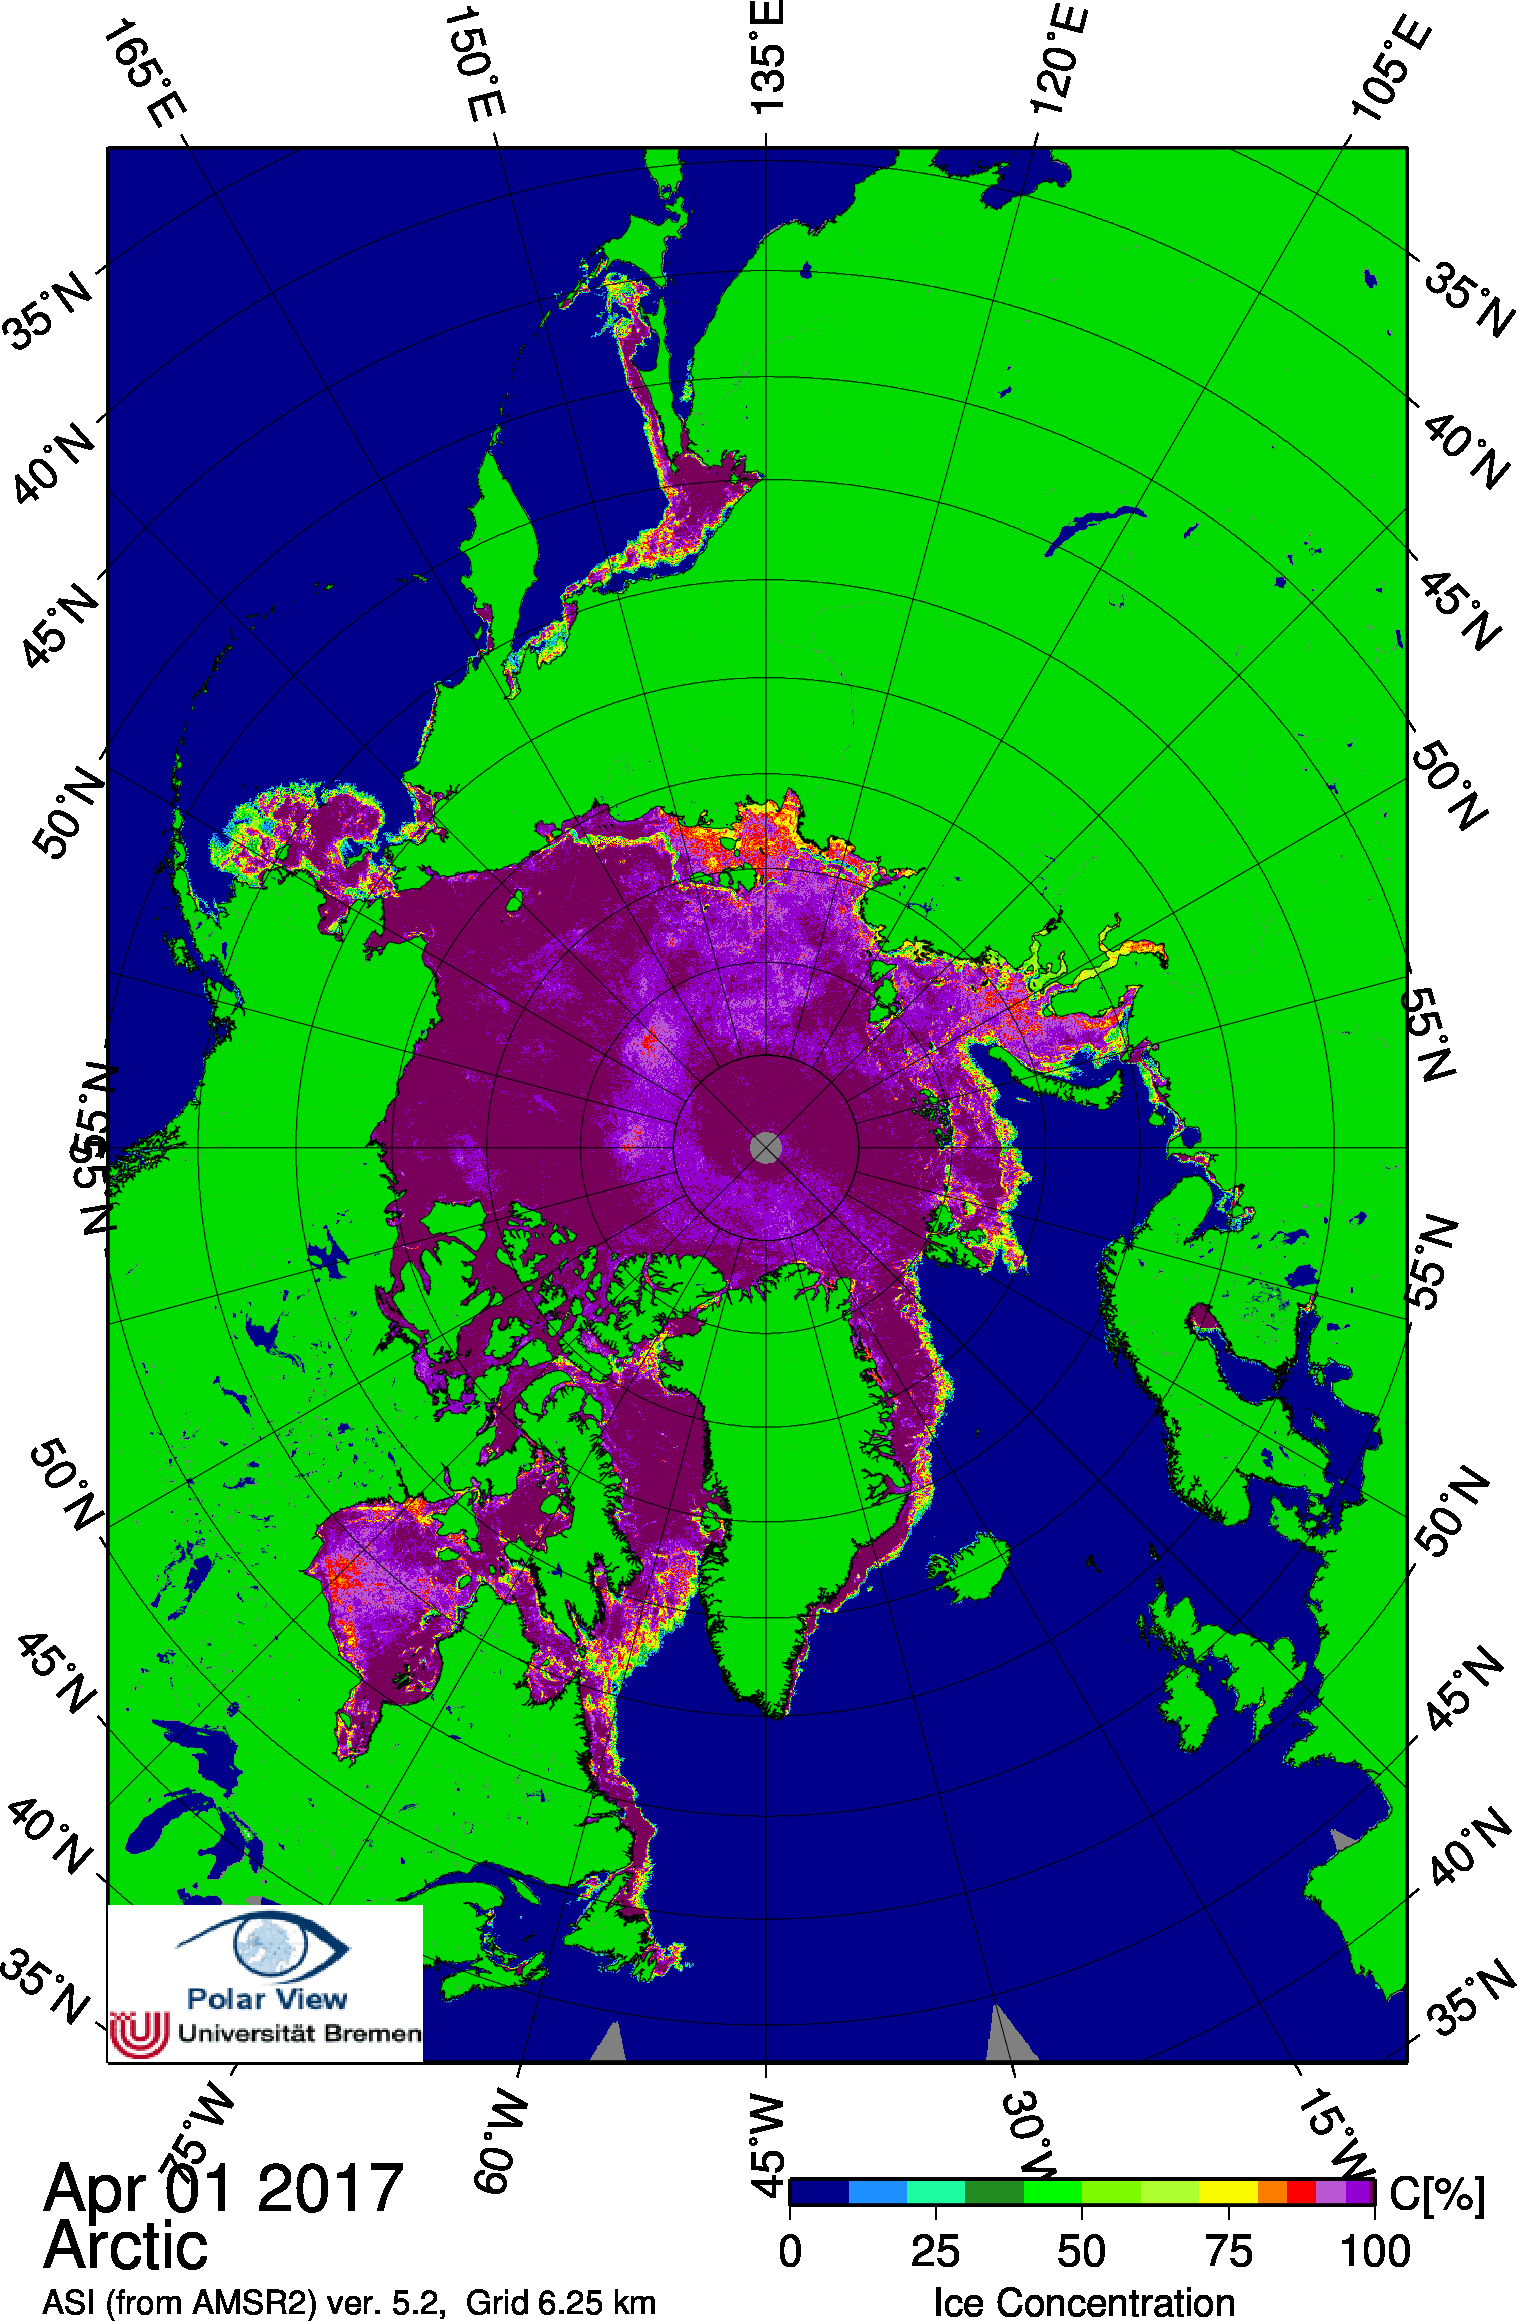
Particularly in view of all the balderdash concerning “climate science” being spouted in Washington DC on Wednesday lets first of all run through some Arctic sea ice facts from April 1st 2017 or thereabouts:
Northern Hemisphere Snow Extent:
Arctic Sea Ice Area:
Arctic Sea Ice Extent:
Arctic Sea Ice Concentration:
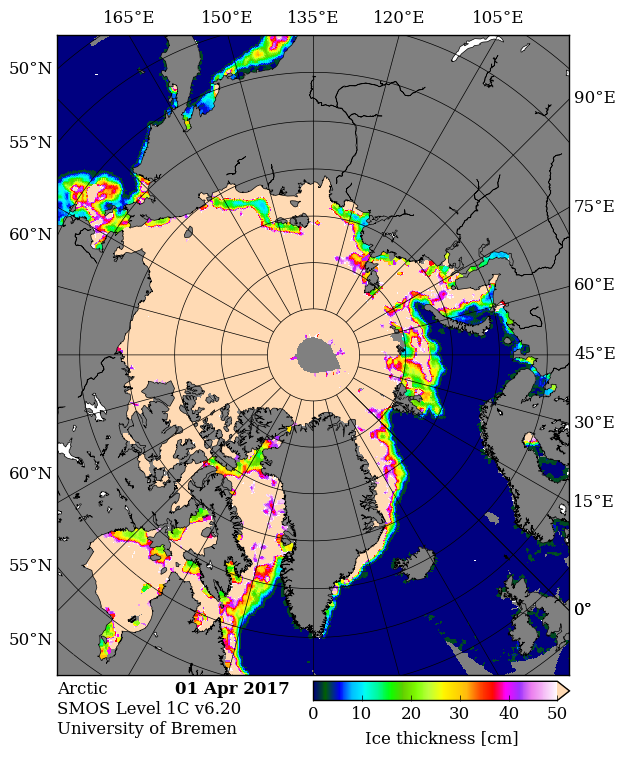
Thin ice map from the University of Bremen SMOS:
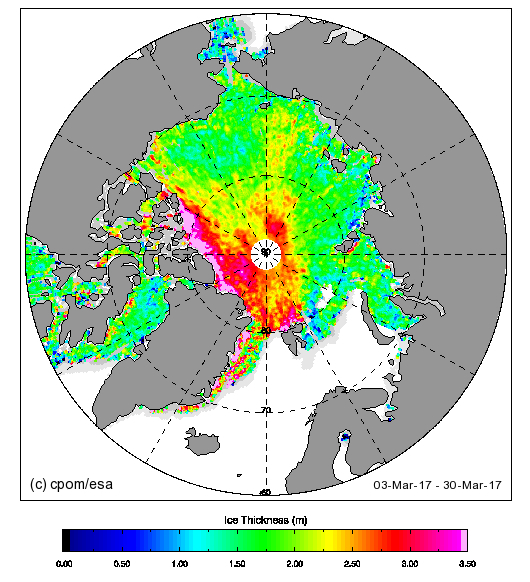
Thick ice map from CPOM CryoSat-2
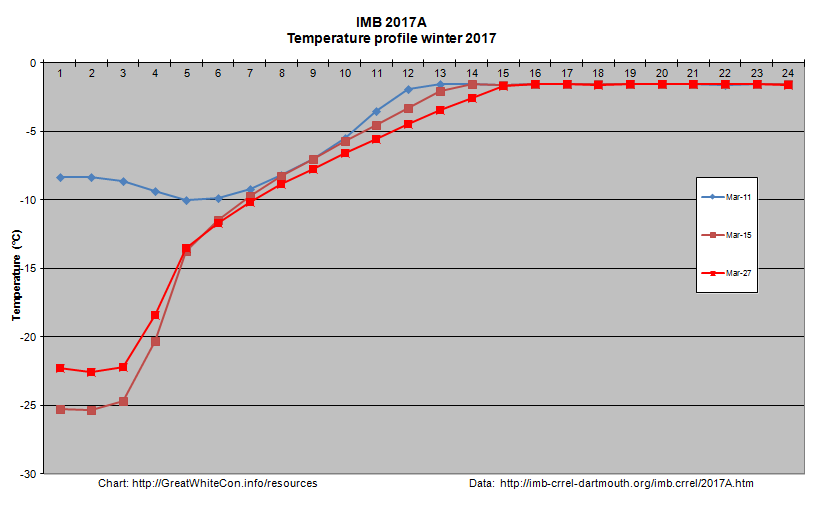
Beaufort Sea ice thickness growth graph:
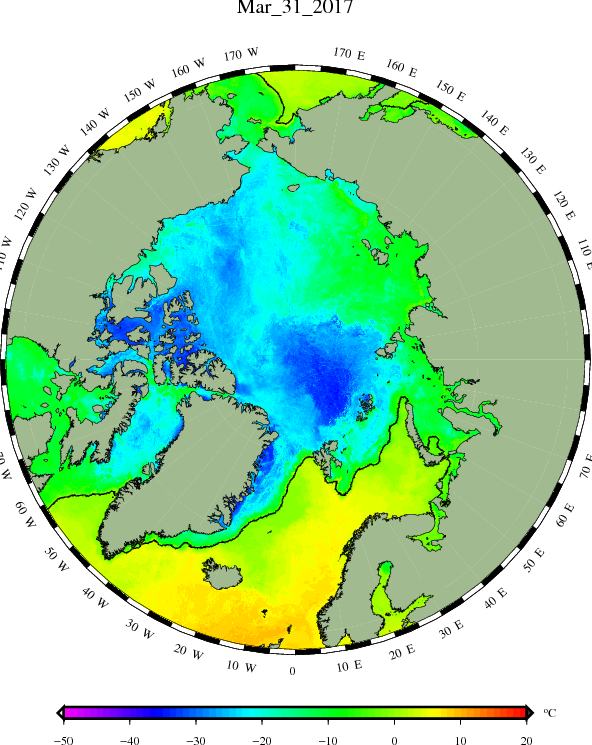
DMI sea ice temperature map:
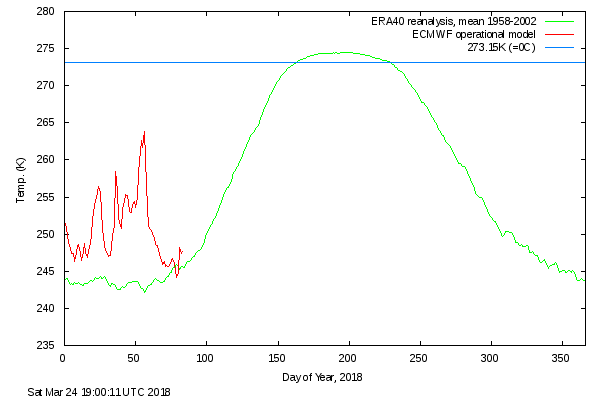
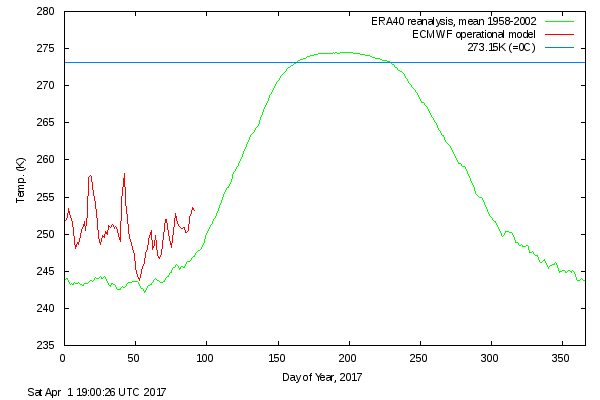
DMI atmospheric temperature graph:
DMI Arctic Freezing Degree Days:
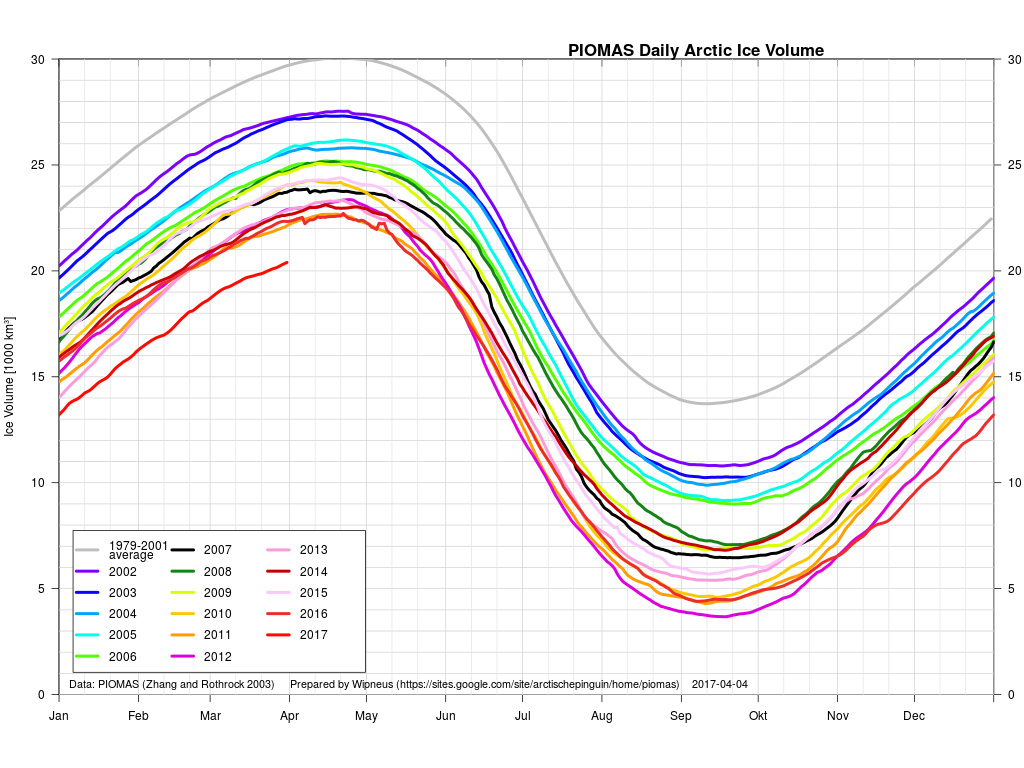
PIOMAS volume for March will follow in a few days, but it’s extremely unlikely to be anything other than “lowest for the date”.
What preliminary conclusions can we draw from this plethora of pretty pictures? First of all the Arctic hasn’t suddenly gone into “deep freeze” mode. Temperatures above 80 degrees north are rising again and are well above the climatology. Freezing degree days are still the lowest on record by a wide margin. Northern hemisphere snow cover is falling fast and is currently just above last year.
In contrast to last year, and thanks to lots of cyclones and very little in the way of anticyclones, there’s plenty of sub half meter sea ice in the Laptev and East Siberian Seas and hardly any in the Beaufort Sea. There’s also plenty of thin ice to be seen on both the Atlantic and Pacific peripheries.
The usual southerly arch hasn’t formed in the Nares Strait between Greenland and Ellesmere Island, and as SMOS shows the sea ice in the strait is consequently very thin. That leads one to wonder when the northern arch in the Lincoln Sea might give way.
It’s not immediately apparent from the still images above, but there’s been relatively large amounts of “old ice” exported from the Central Arctic on the Atlantic side, hence the recent increase in overall extent which is now second lowest for the date (since satellite records began). Area has been creeping up as well over recent days, but is still lowest for the date, as it has been for most of the last year. Sea ice “compactness” has decreased somewhat and given all the thin ice around the edges extent will soon start dropping once again.
All in all, the Arctic sea ice prognosis is not good. Are you watching Lamar Smith? (Pun intended!)
[Edit – April 4th]
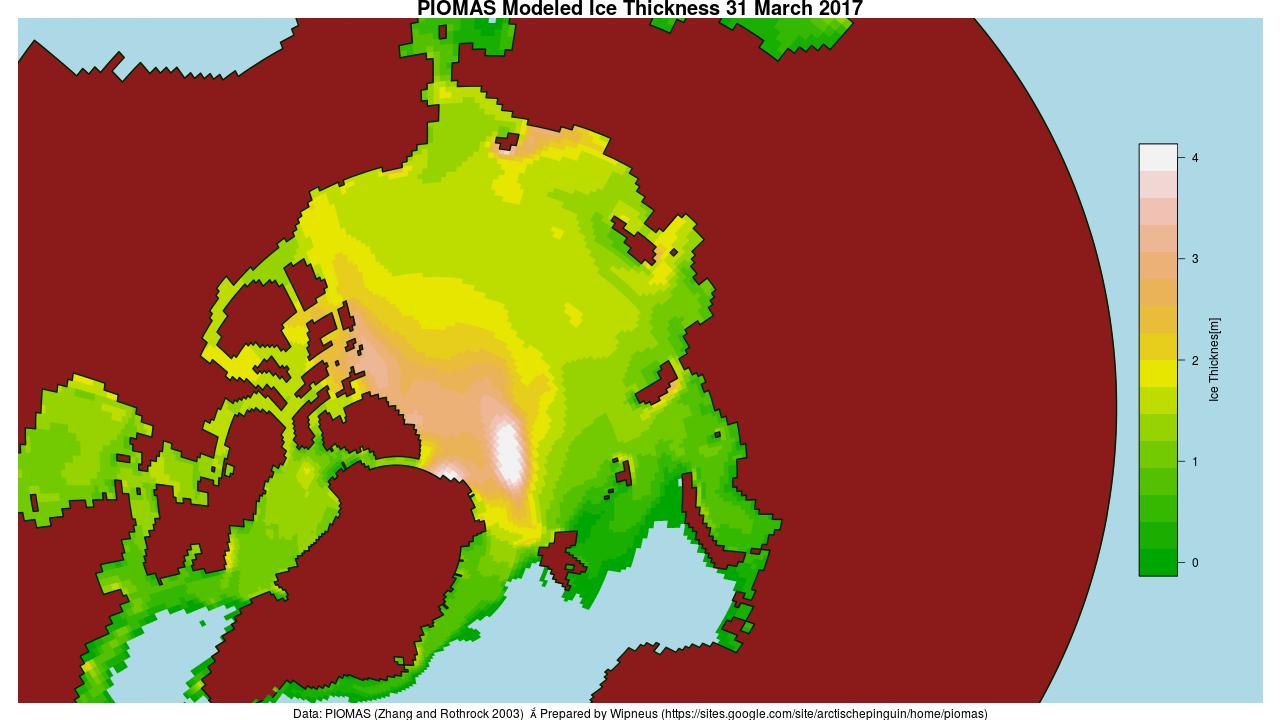
The March PIOMAS update is out! As suspected, Arctic sea ice volume is still by far the lowest on record:
Volume on March 31st 2017 was 20.398 thousand cubic kilometers. The previous lowest volume for the date was 22.129 thousand km³ in 2011.
Here too is the PIOMAS modelled Arctic sea ice thickness map:
PIOMAS daily gridded thickness for March 31st 2017
[Edit – April 12th]
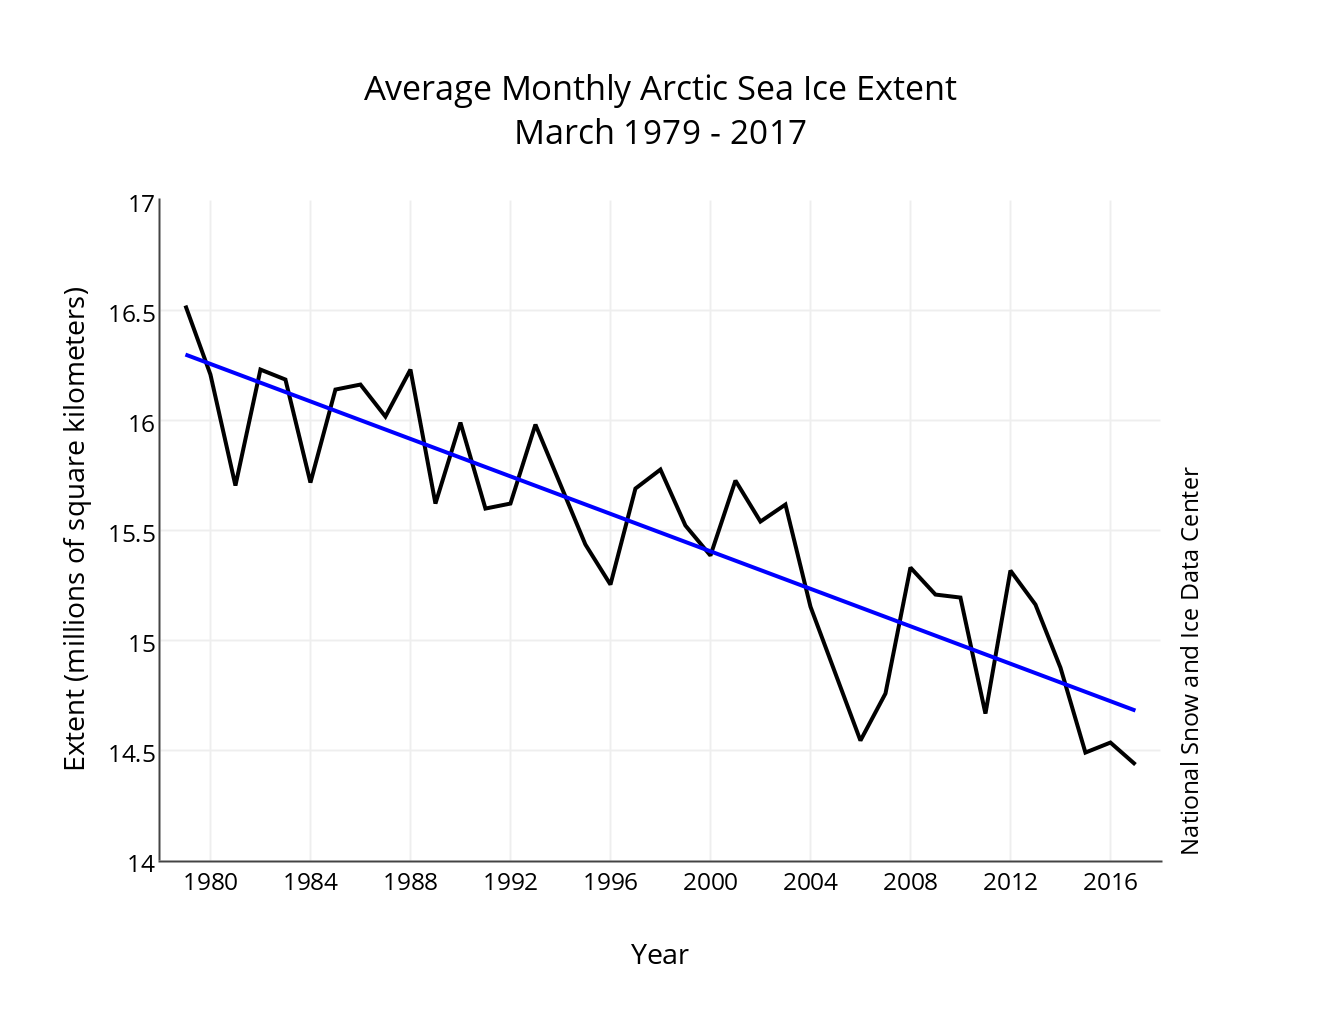
The latest edition of the NSIDC’s Arctic Sea Ice News confirms that their monthly extent metric for March 2017 was the lowest in the satellite record for the month:
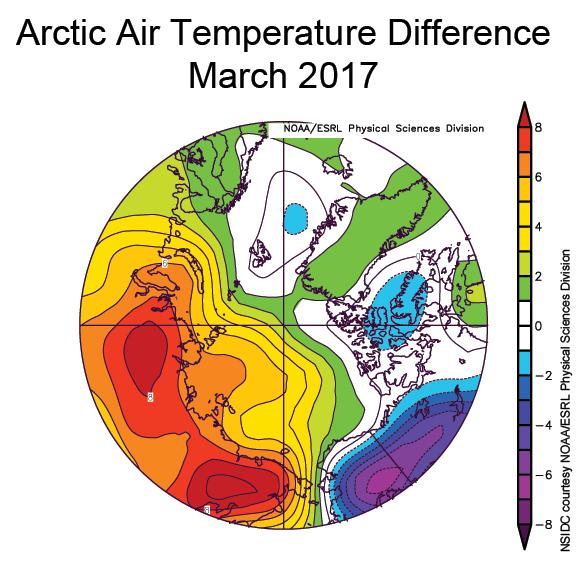
As well as highlighting the anomalously warm temperatures across much of the Arctic:
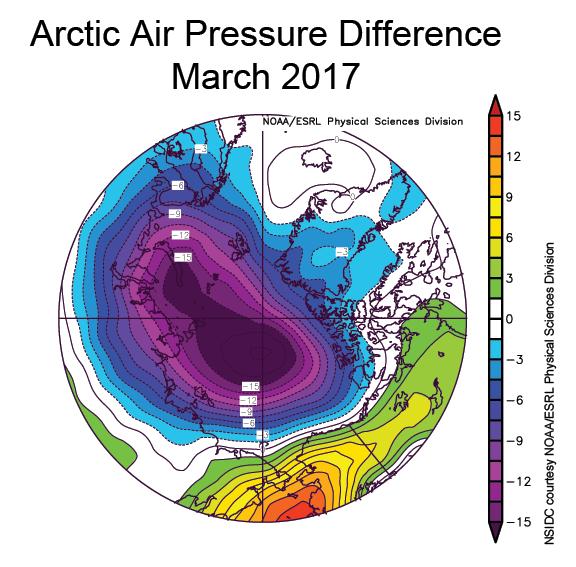
the NSIDC article includes this telling pressure anomaly map:
New work by an international team led by Igor Polyakov of the University of Alaska Fairbanks provides strong evidence that Atlantic layer heat is now playing a prominent role in reducing winter ice formation in the Eurasian Basin, which is manifested as more summer ice loss. According to their analysis, the ice loss due to the influence of Atlantic layer heat is comparable in magnitude to the top down forcing by the atmosphere.
Our old friend Tony Heller has been publishing a glorious Gish gallop of articles showing OSI-SAF Arctic sea ice type maps and claiming amongst other things:
A decade after declaring the end of Arctic multi-year sea ice, it has increased 116% and now covers nearly half of the Arctic.
That is of course not true. In actual fact it’s an “alternative fact” par excellence!
I have been endeavouring to point out to Tony the error of his ways for weeks now, but my words have wisdom have fallen on deaf ears. My graphic graphics have been viewed only by “snow blind” eyes. My incontrovertible arguments have been misapprehended by purpose built dumb and dumberer wetware illogic. By way of example, here’s a refreshingly ad hom free riposte from a typical commenter:
Jimmy Boy actually thinks his honesty and integrity are equally to that of Anthony Watts???
No doubt we’ll get around to discussing Anthony Watts “honesty and integrity” again soon, but for now let’s see if we can finally set this particular badly warped record straight shall we?
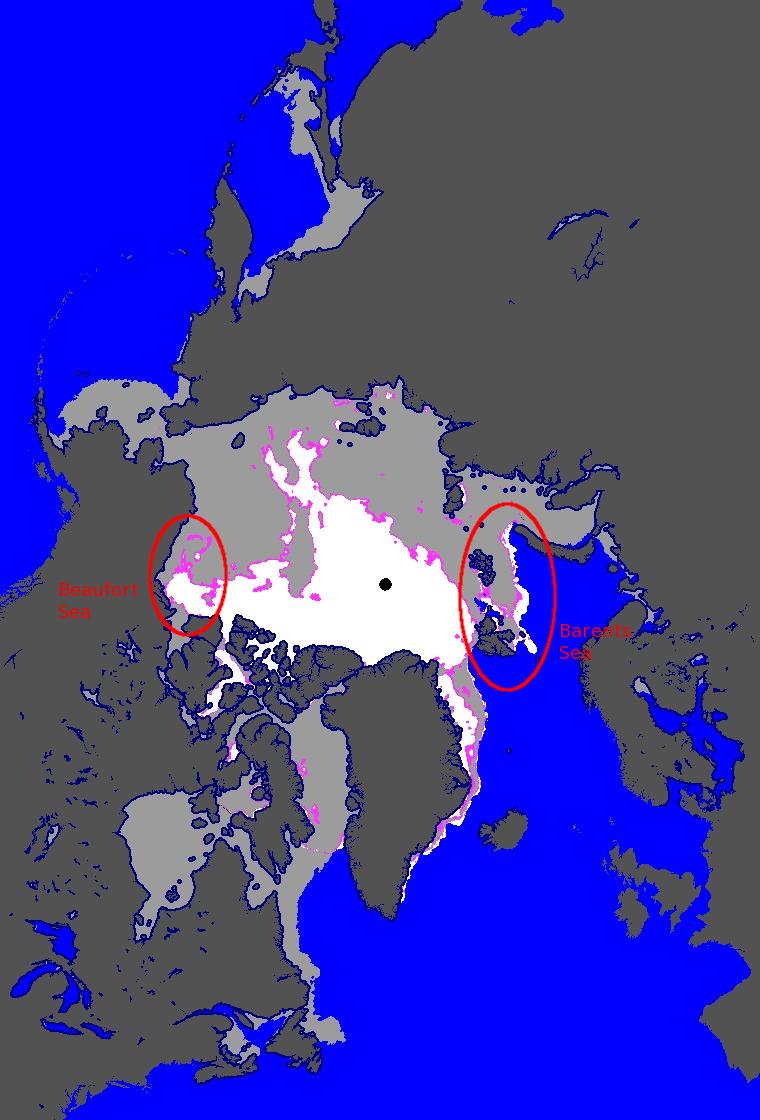
Here is the latest OSI-SAF ice type map, for March 16th 2017:
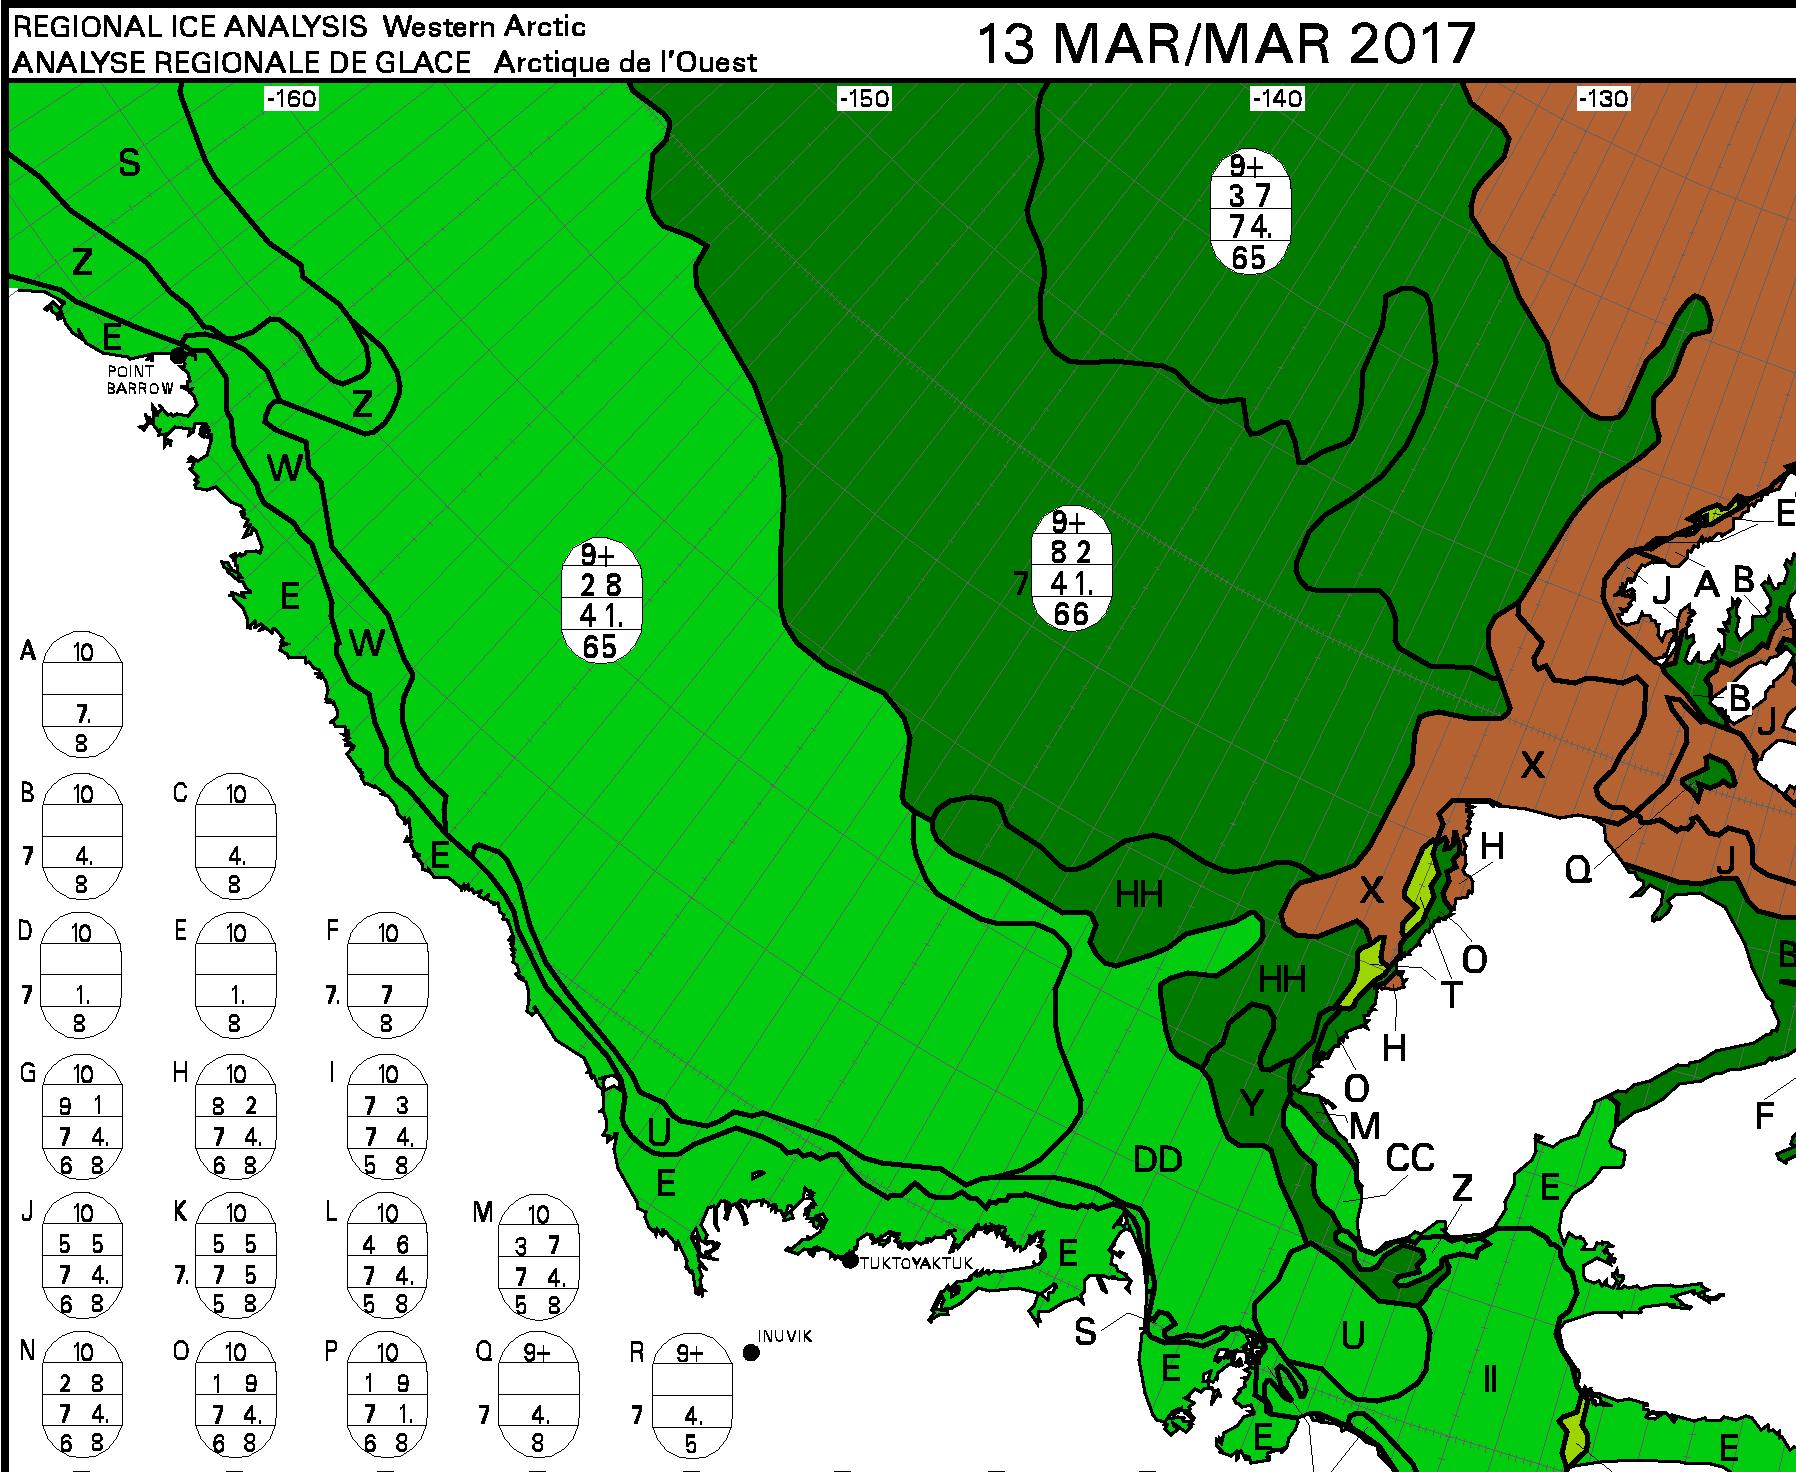
The highlighted area on the left is the Beaufort Sea to the north of Canada. If you’re not “snow blind” you can no doubt readily perceive a large area of allegedly “multi-year sea ice” coloured white. Let’s now take a look at the most recent Canadian Ice Service map of the same area, for March 13th 2017:
Canadian Ice Service sea ice stage of development on March 13th 2017
Can you see a large area of brown “old ice” covering most of the surface of the Beaufort Sea?
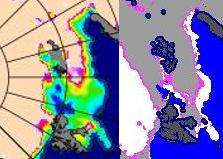
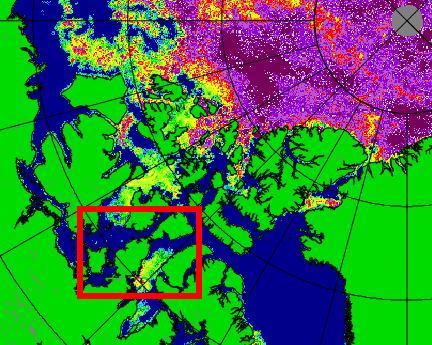
Now let’s take a look on the other side of the Arctic at the area north of the Barents Sea. Can you see a large area of allegedly “multi-year sea ice” coloured white inside the red ellipse on the OSI-SAF map? Next let’s take a look at the most recent University of Bremen SMOS map of the Arctic, for March 15th 2017:
On this map the brightly coloured areas show sea ice that’s less than 50 cm thick. Even when two people explain this point slowly to them the “deplorable denizens” at Mr. Heller’s blog do not manage to get the message! So now let’s look at a closeup comparison between the OSI-SAF ice type map and the University of Bremen SMOS sea ice thickness map:
As I popped the question to the deplorable denizens over on Tony Heller’s Deplorable Climate Science blog:
For anybody else here who isn’t deaf, dumb and blind, please note all the young, thin sea ice around Svalbard identified by SMOS that OSI-SAF currently classifies as “multi-year” ice.
At the risk of (repeating myself)^n, n → ∞:
Why do Tony, Tommy and Andy persist with this nonsense?
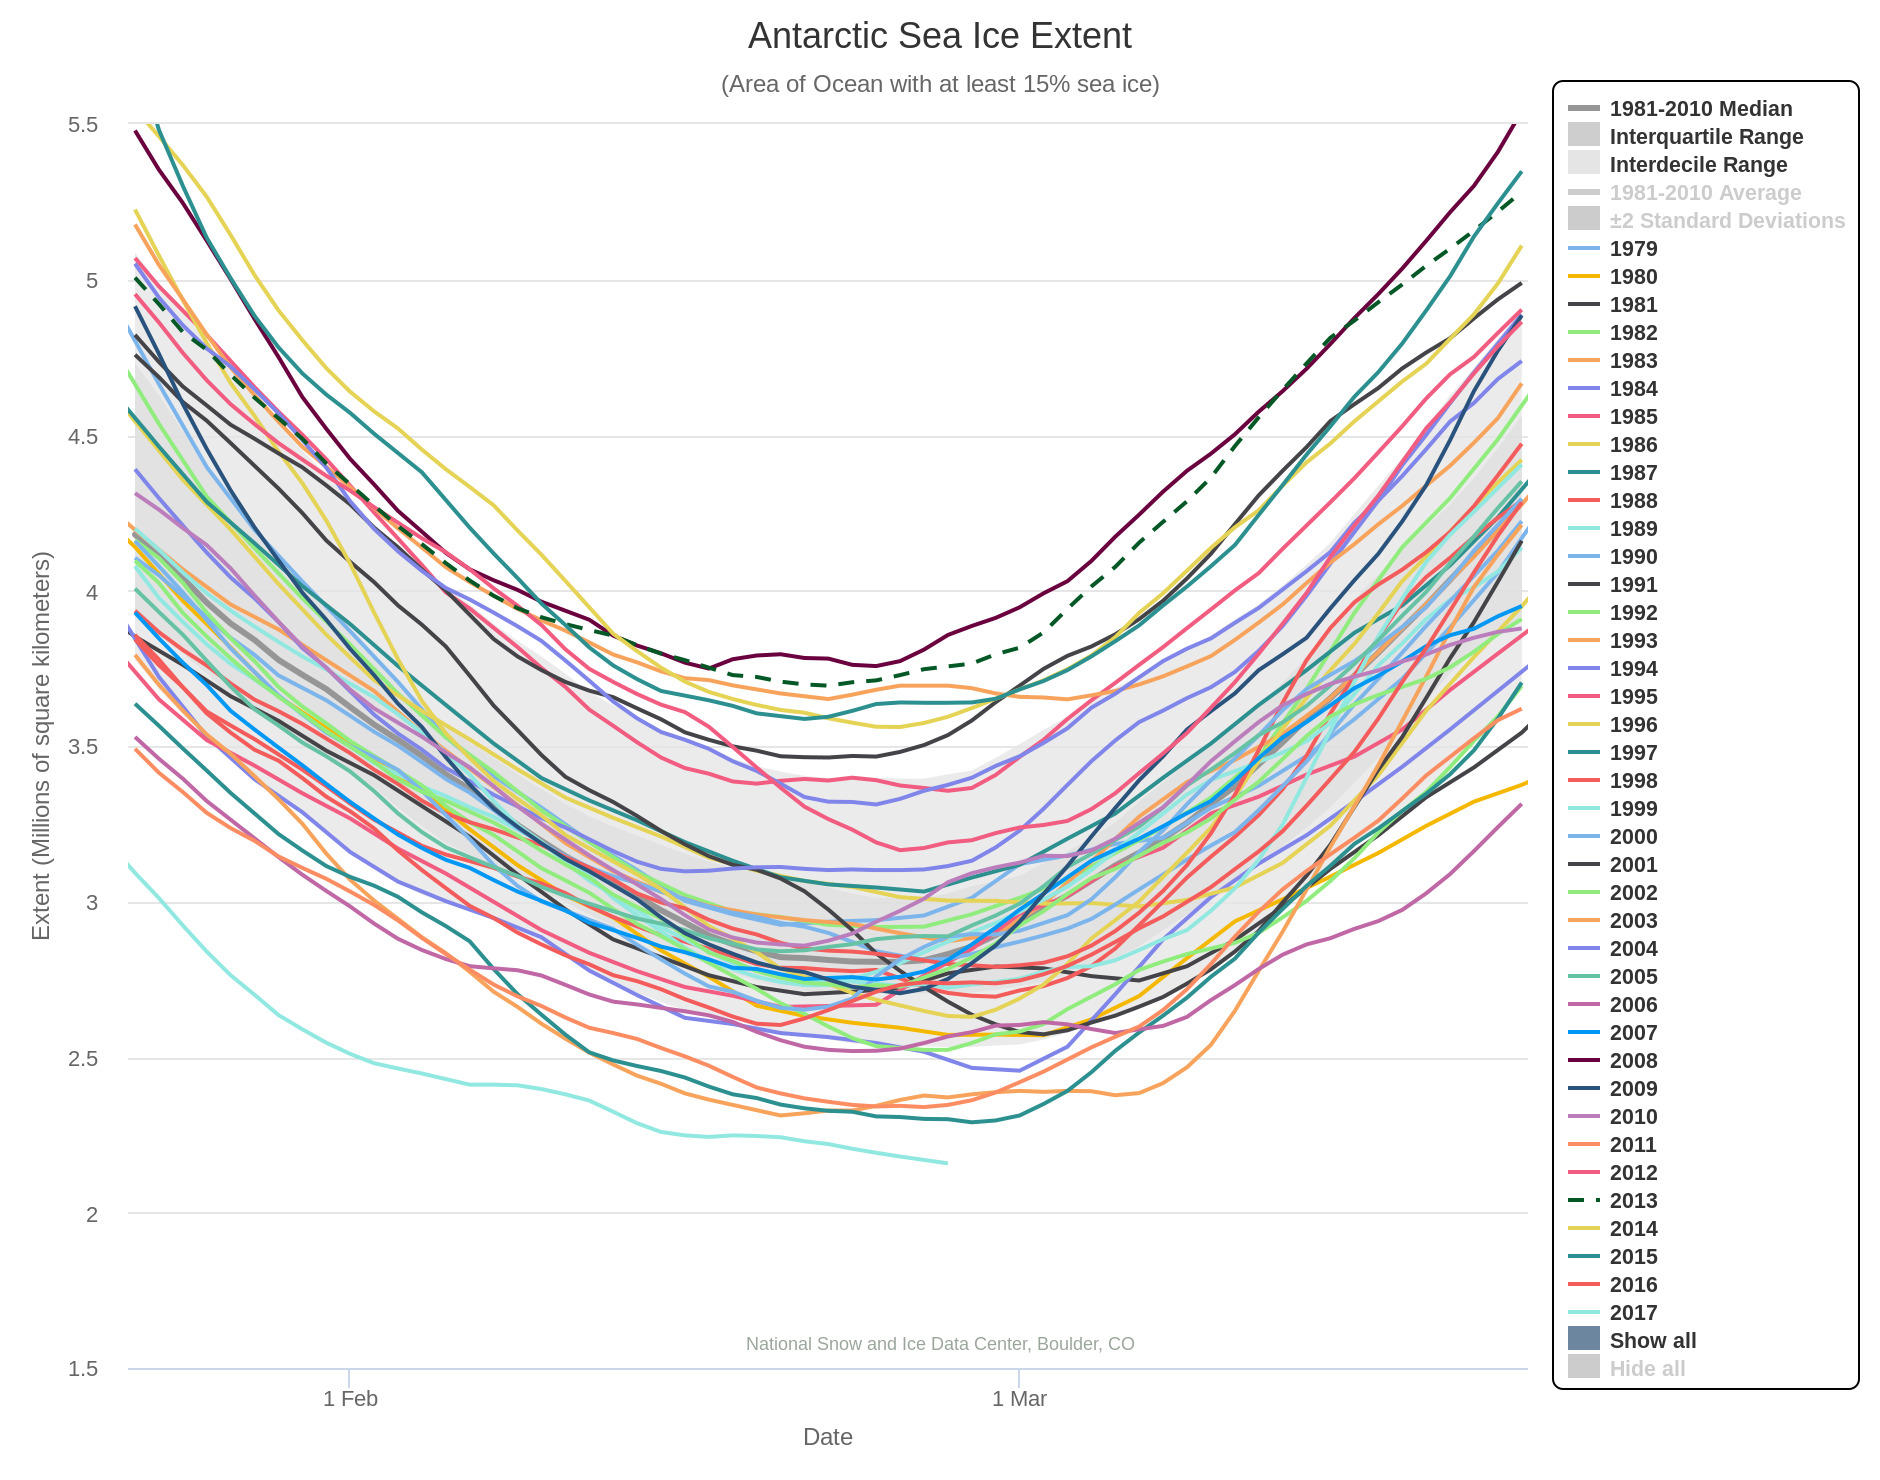
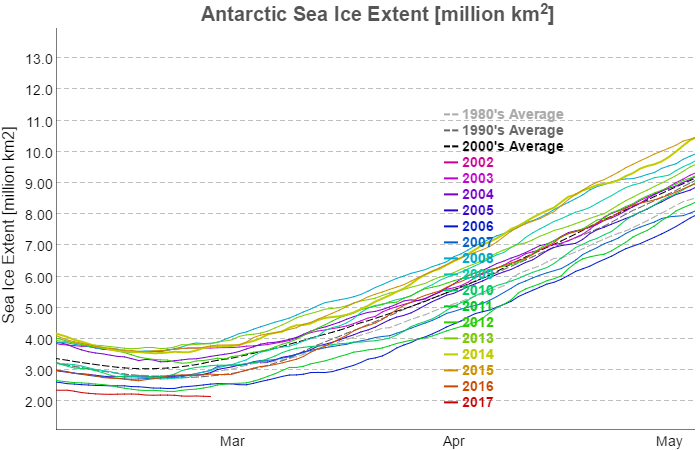
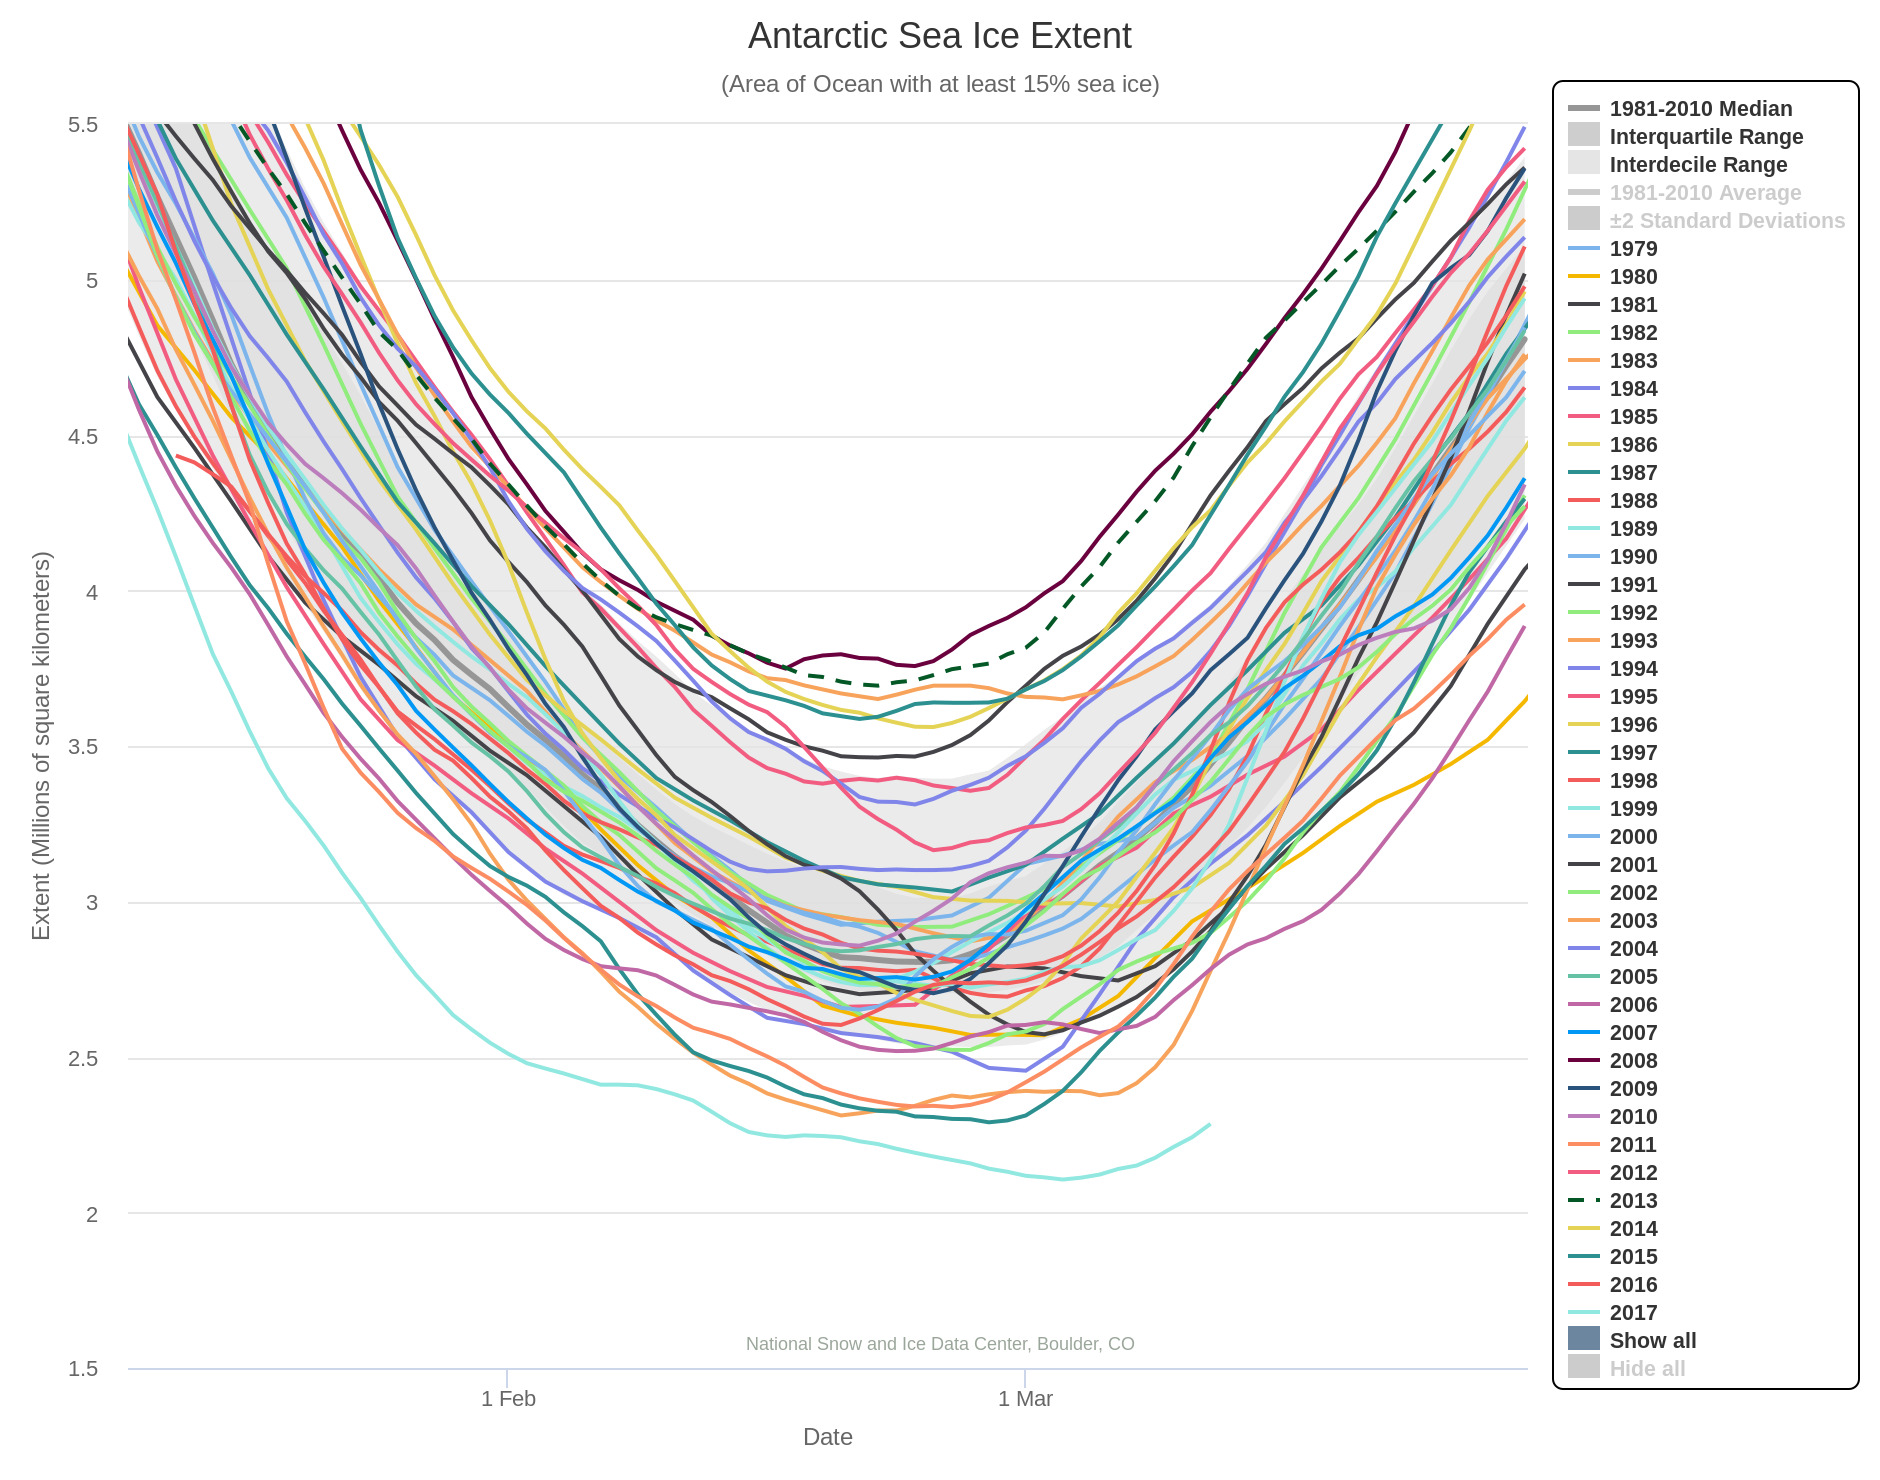
In 2017 Antarctic sea ice extent is beating all the records. All flavours of the metric are already below the minimum of all previous years in the satellite record, and it looks like there’s still some more melting left to go. Here’s the NSIDC’s 5 day averaged extent:
It seems highly likely that the 2017 Antarctic sea ice minimum extent has now been reached. Here’s the NSIDC 5 day averaged extent graph:
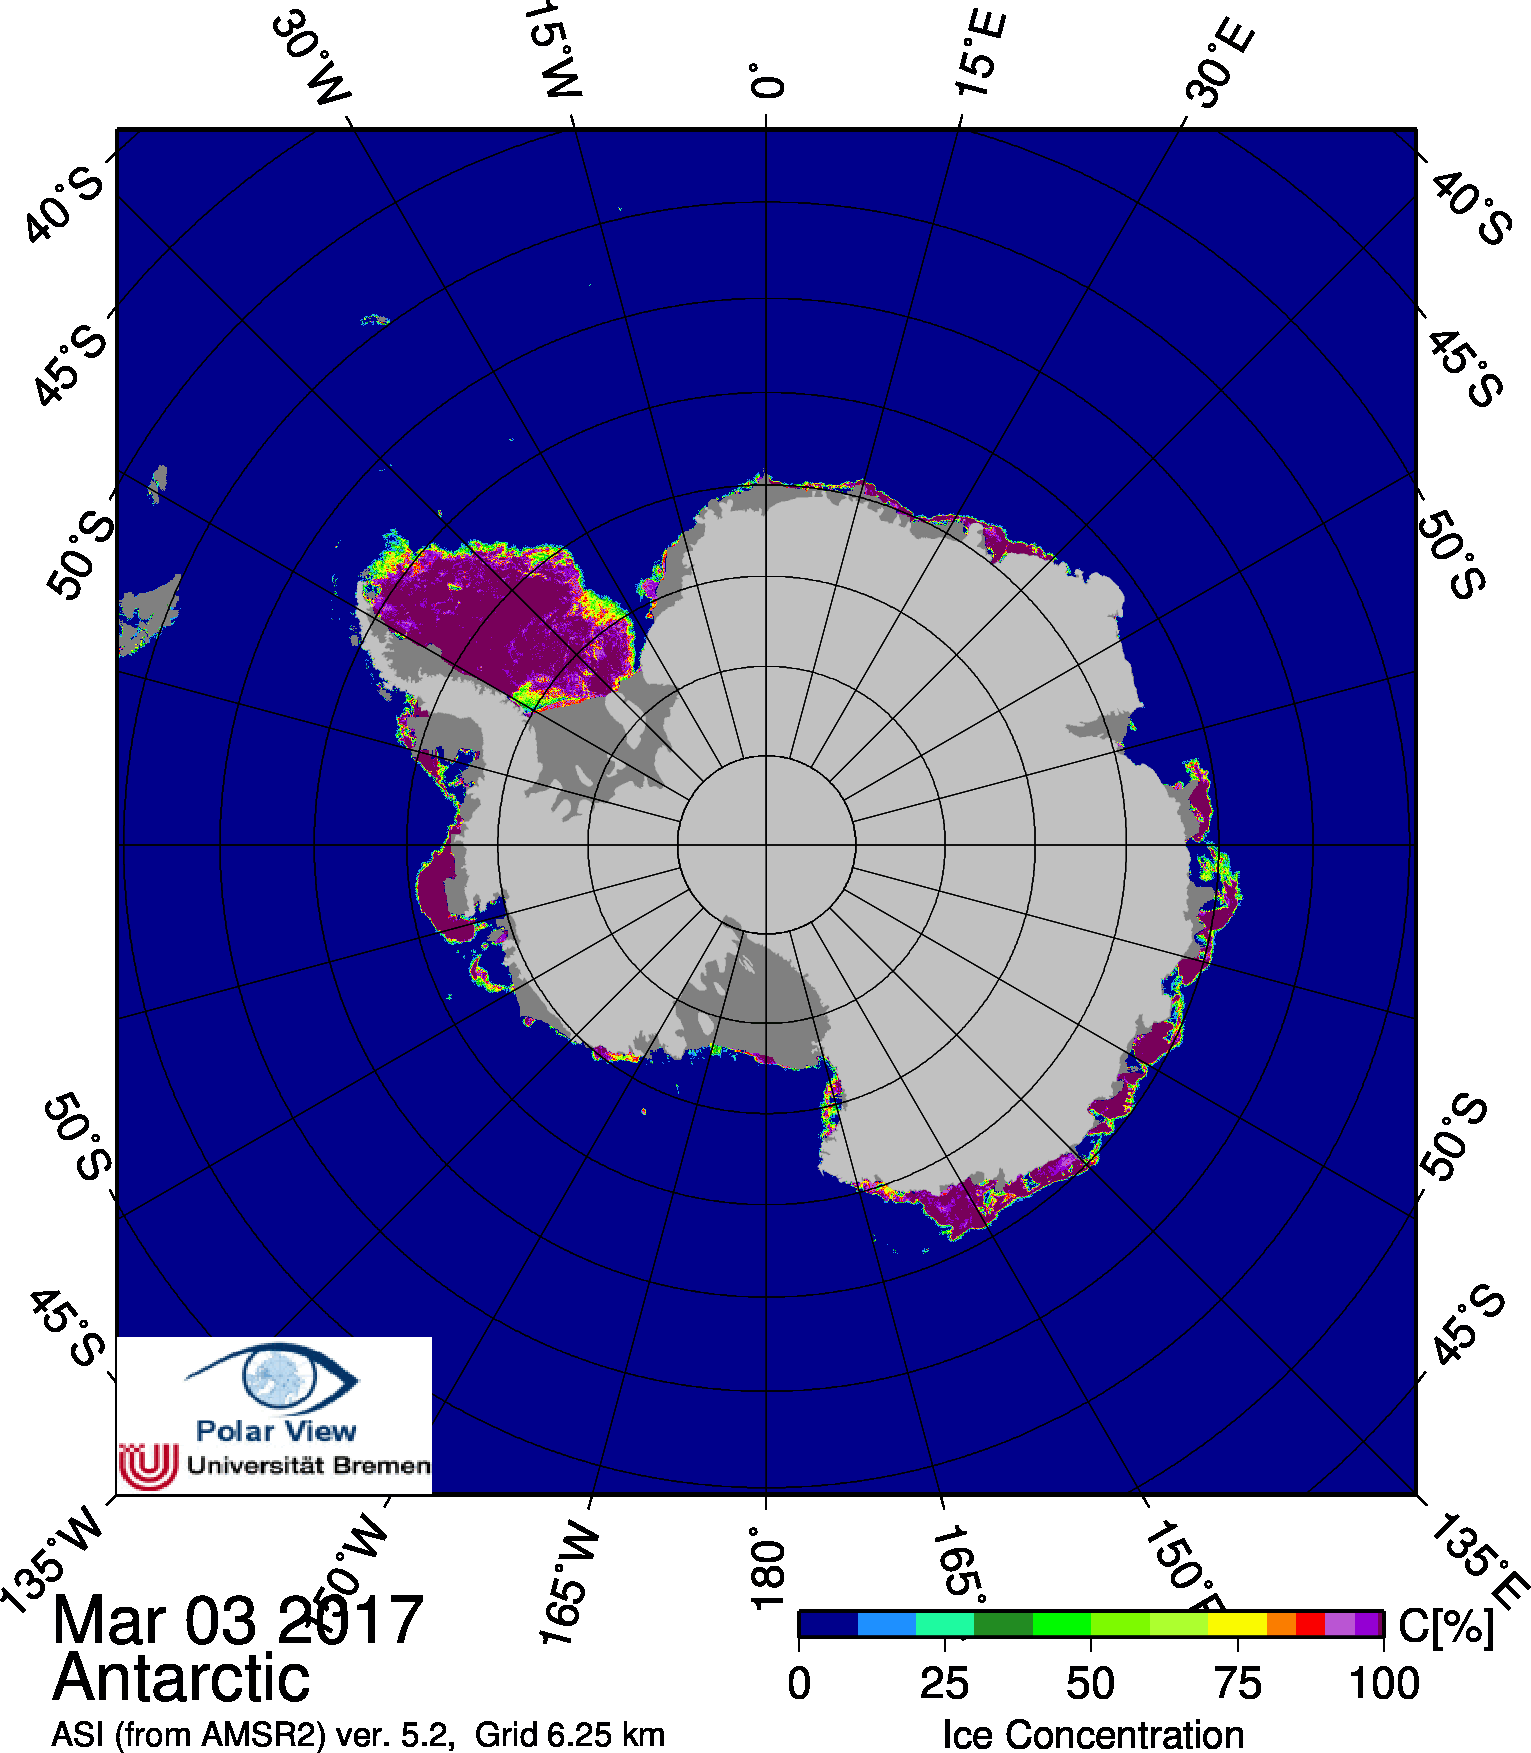
The minimum extent of 2.106 million square kilometers was reached on March 3rd. Here’s the University of Bremen’s Antarctic sea ice concentration map for March 3rd:
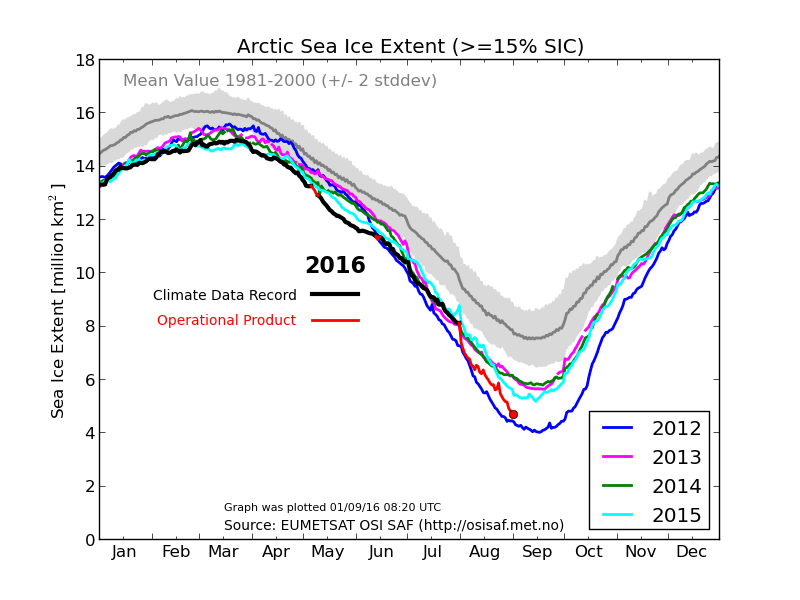
September 2016 is here at last! I posed this question at the start of the recent “Great Arctic Cyclone“:
I wonder what the minimum for 2016 will be, and on what date?
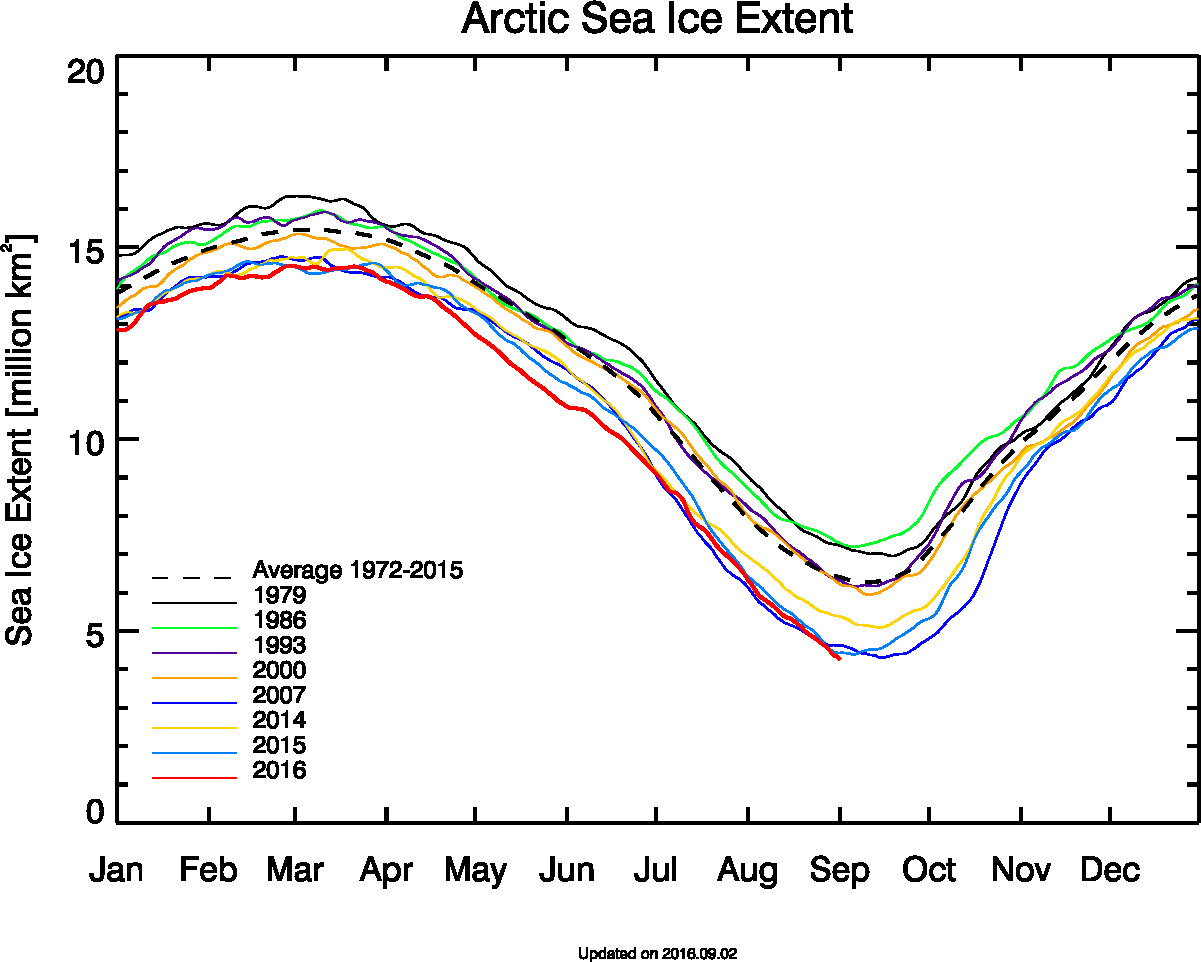
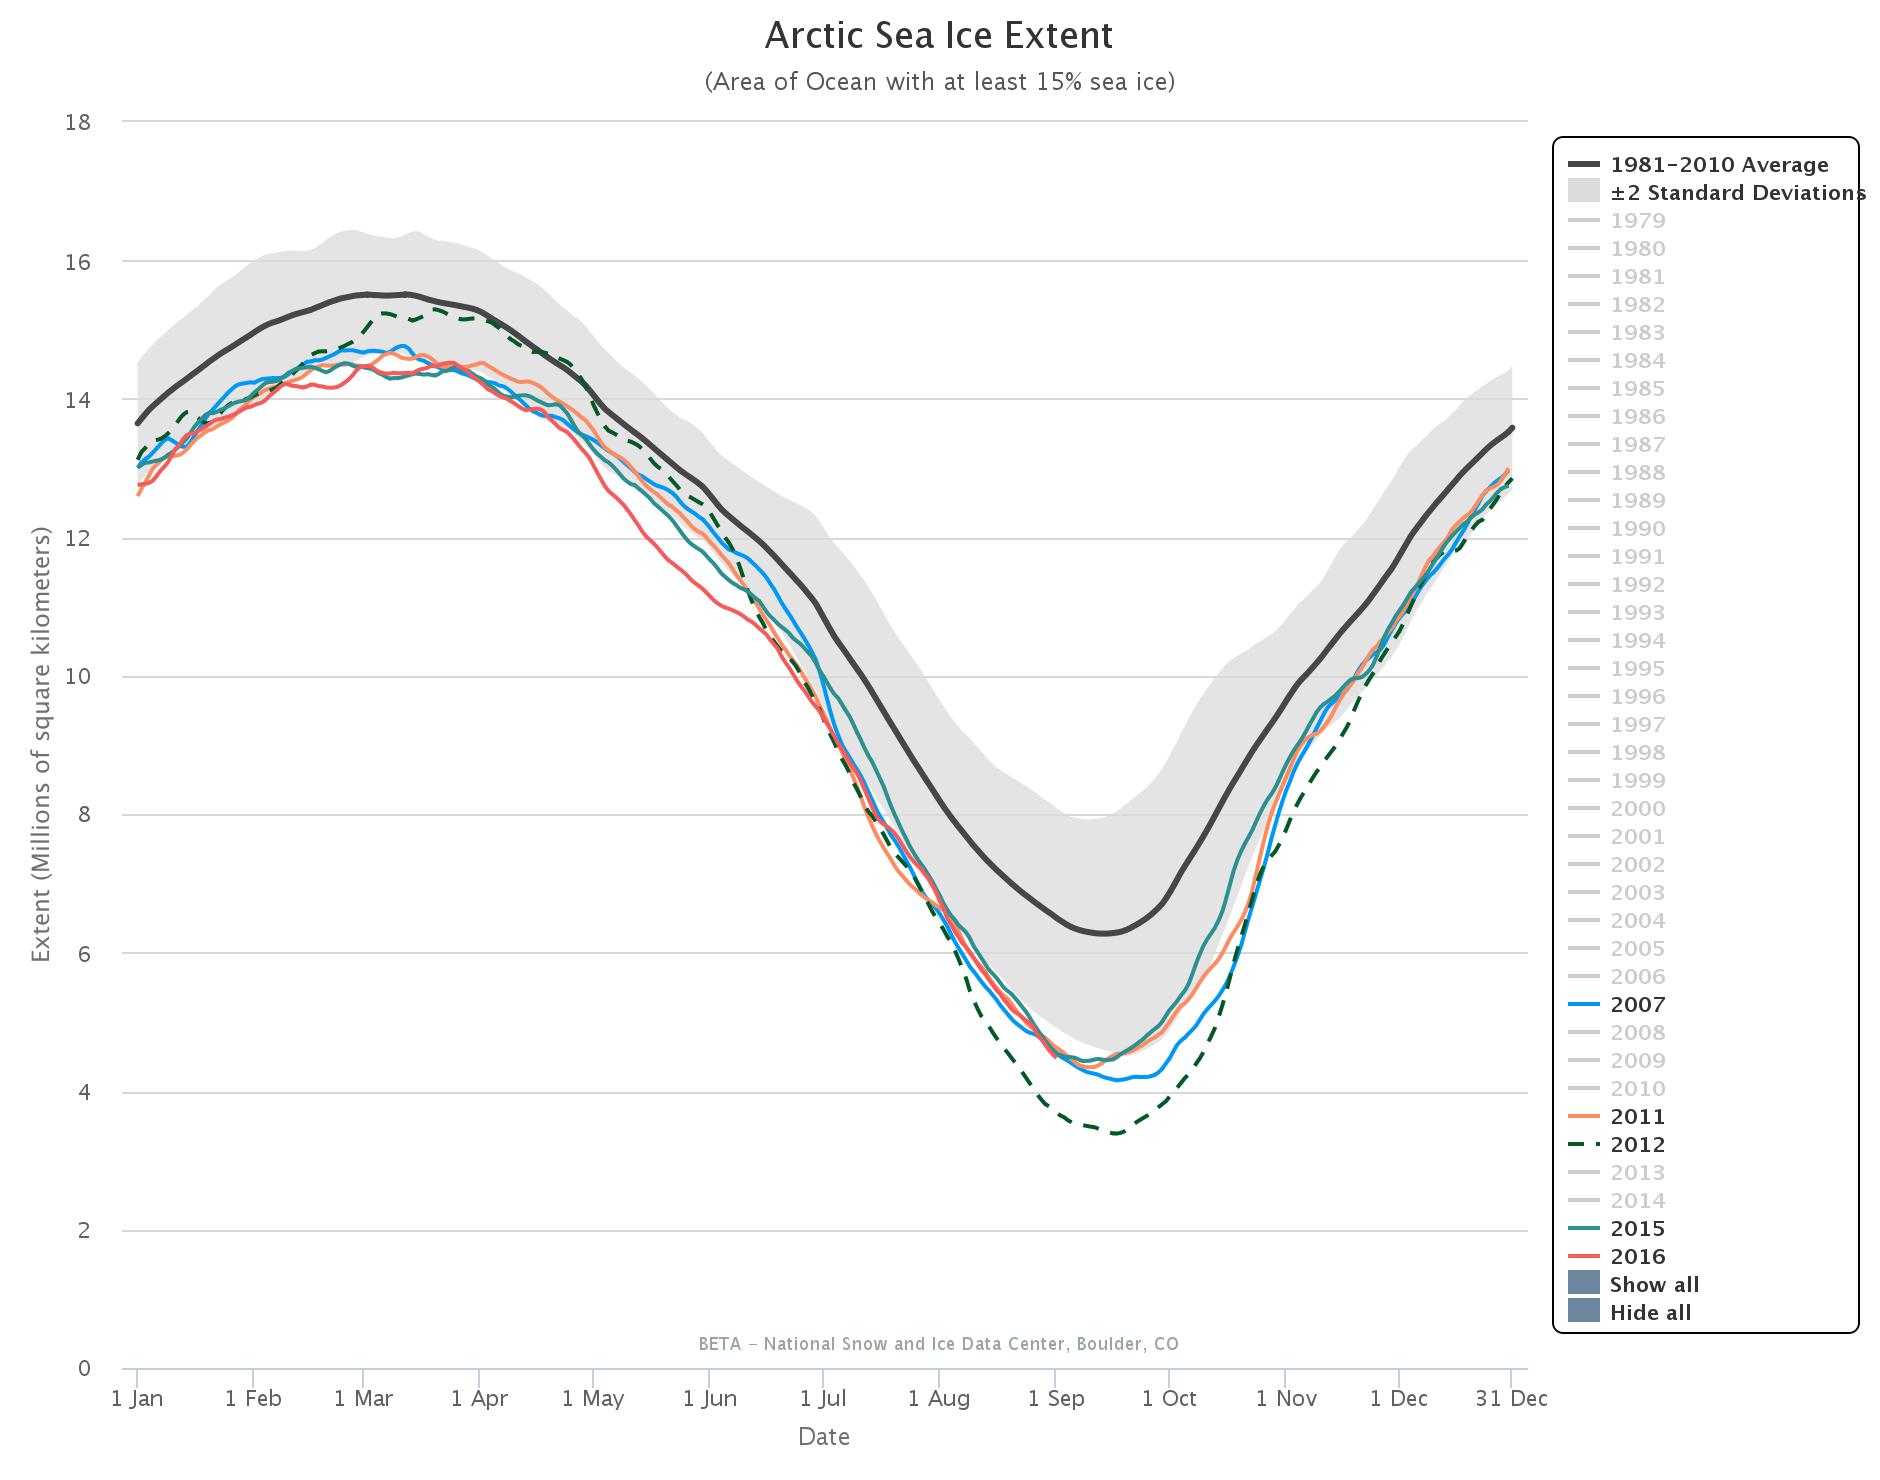
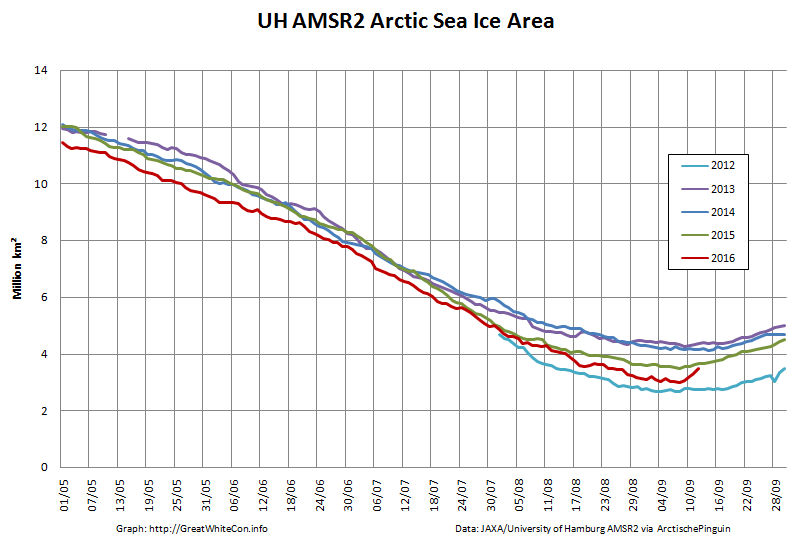
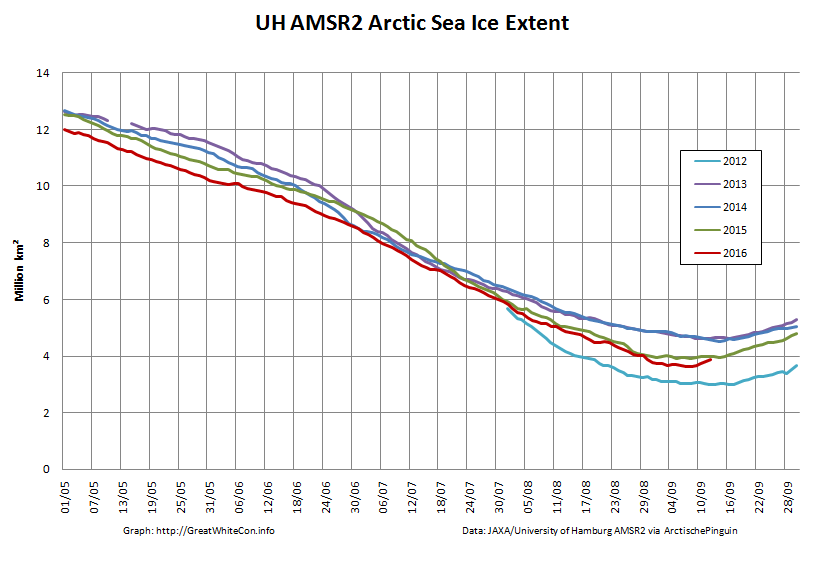
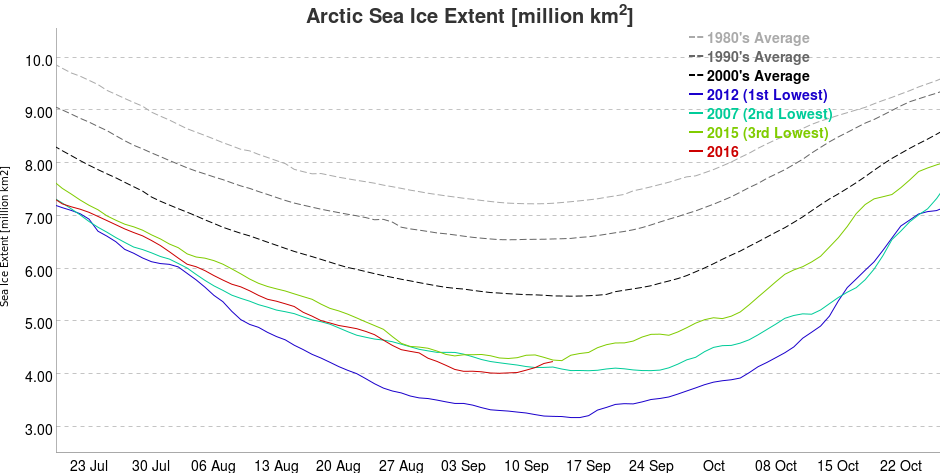
I’m still wondering, and the answer does of course depend on which Arctic sea ice metric you happen to be looking at. Here’s a few examples to be going on with. Firstly there’s Tony Heller’s extent metric du jour, from the University of Bremen:
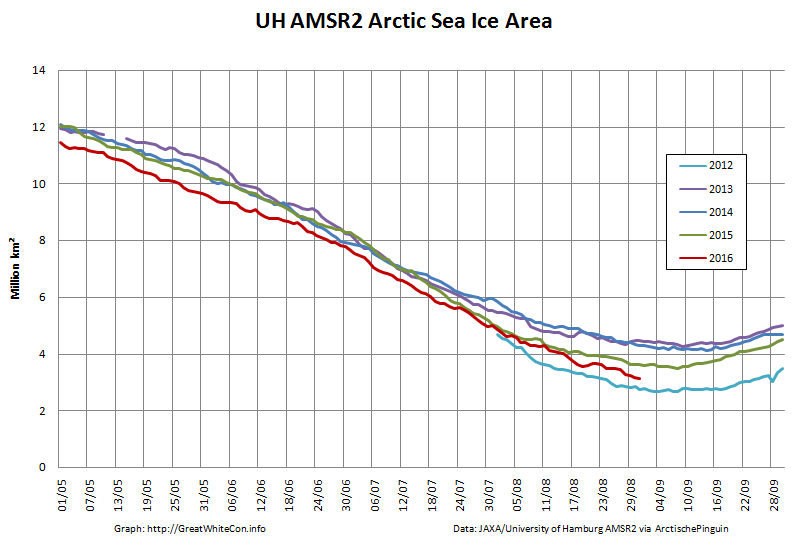
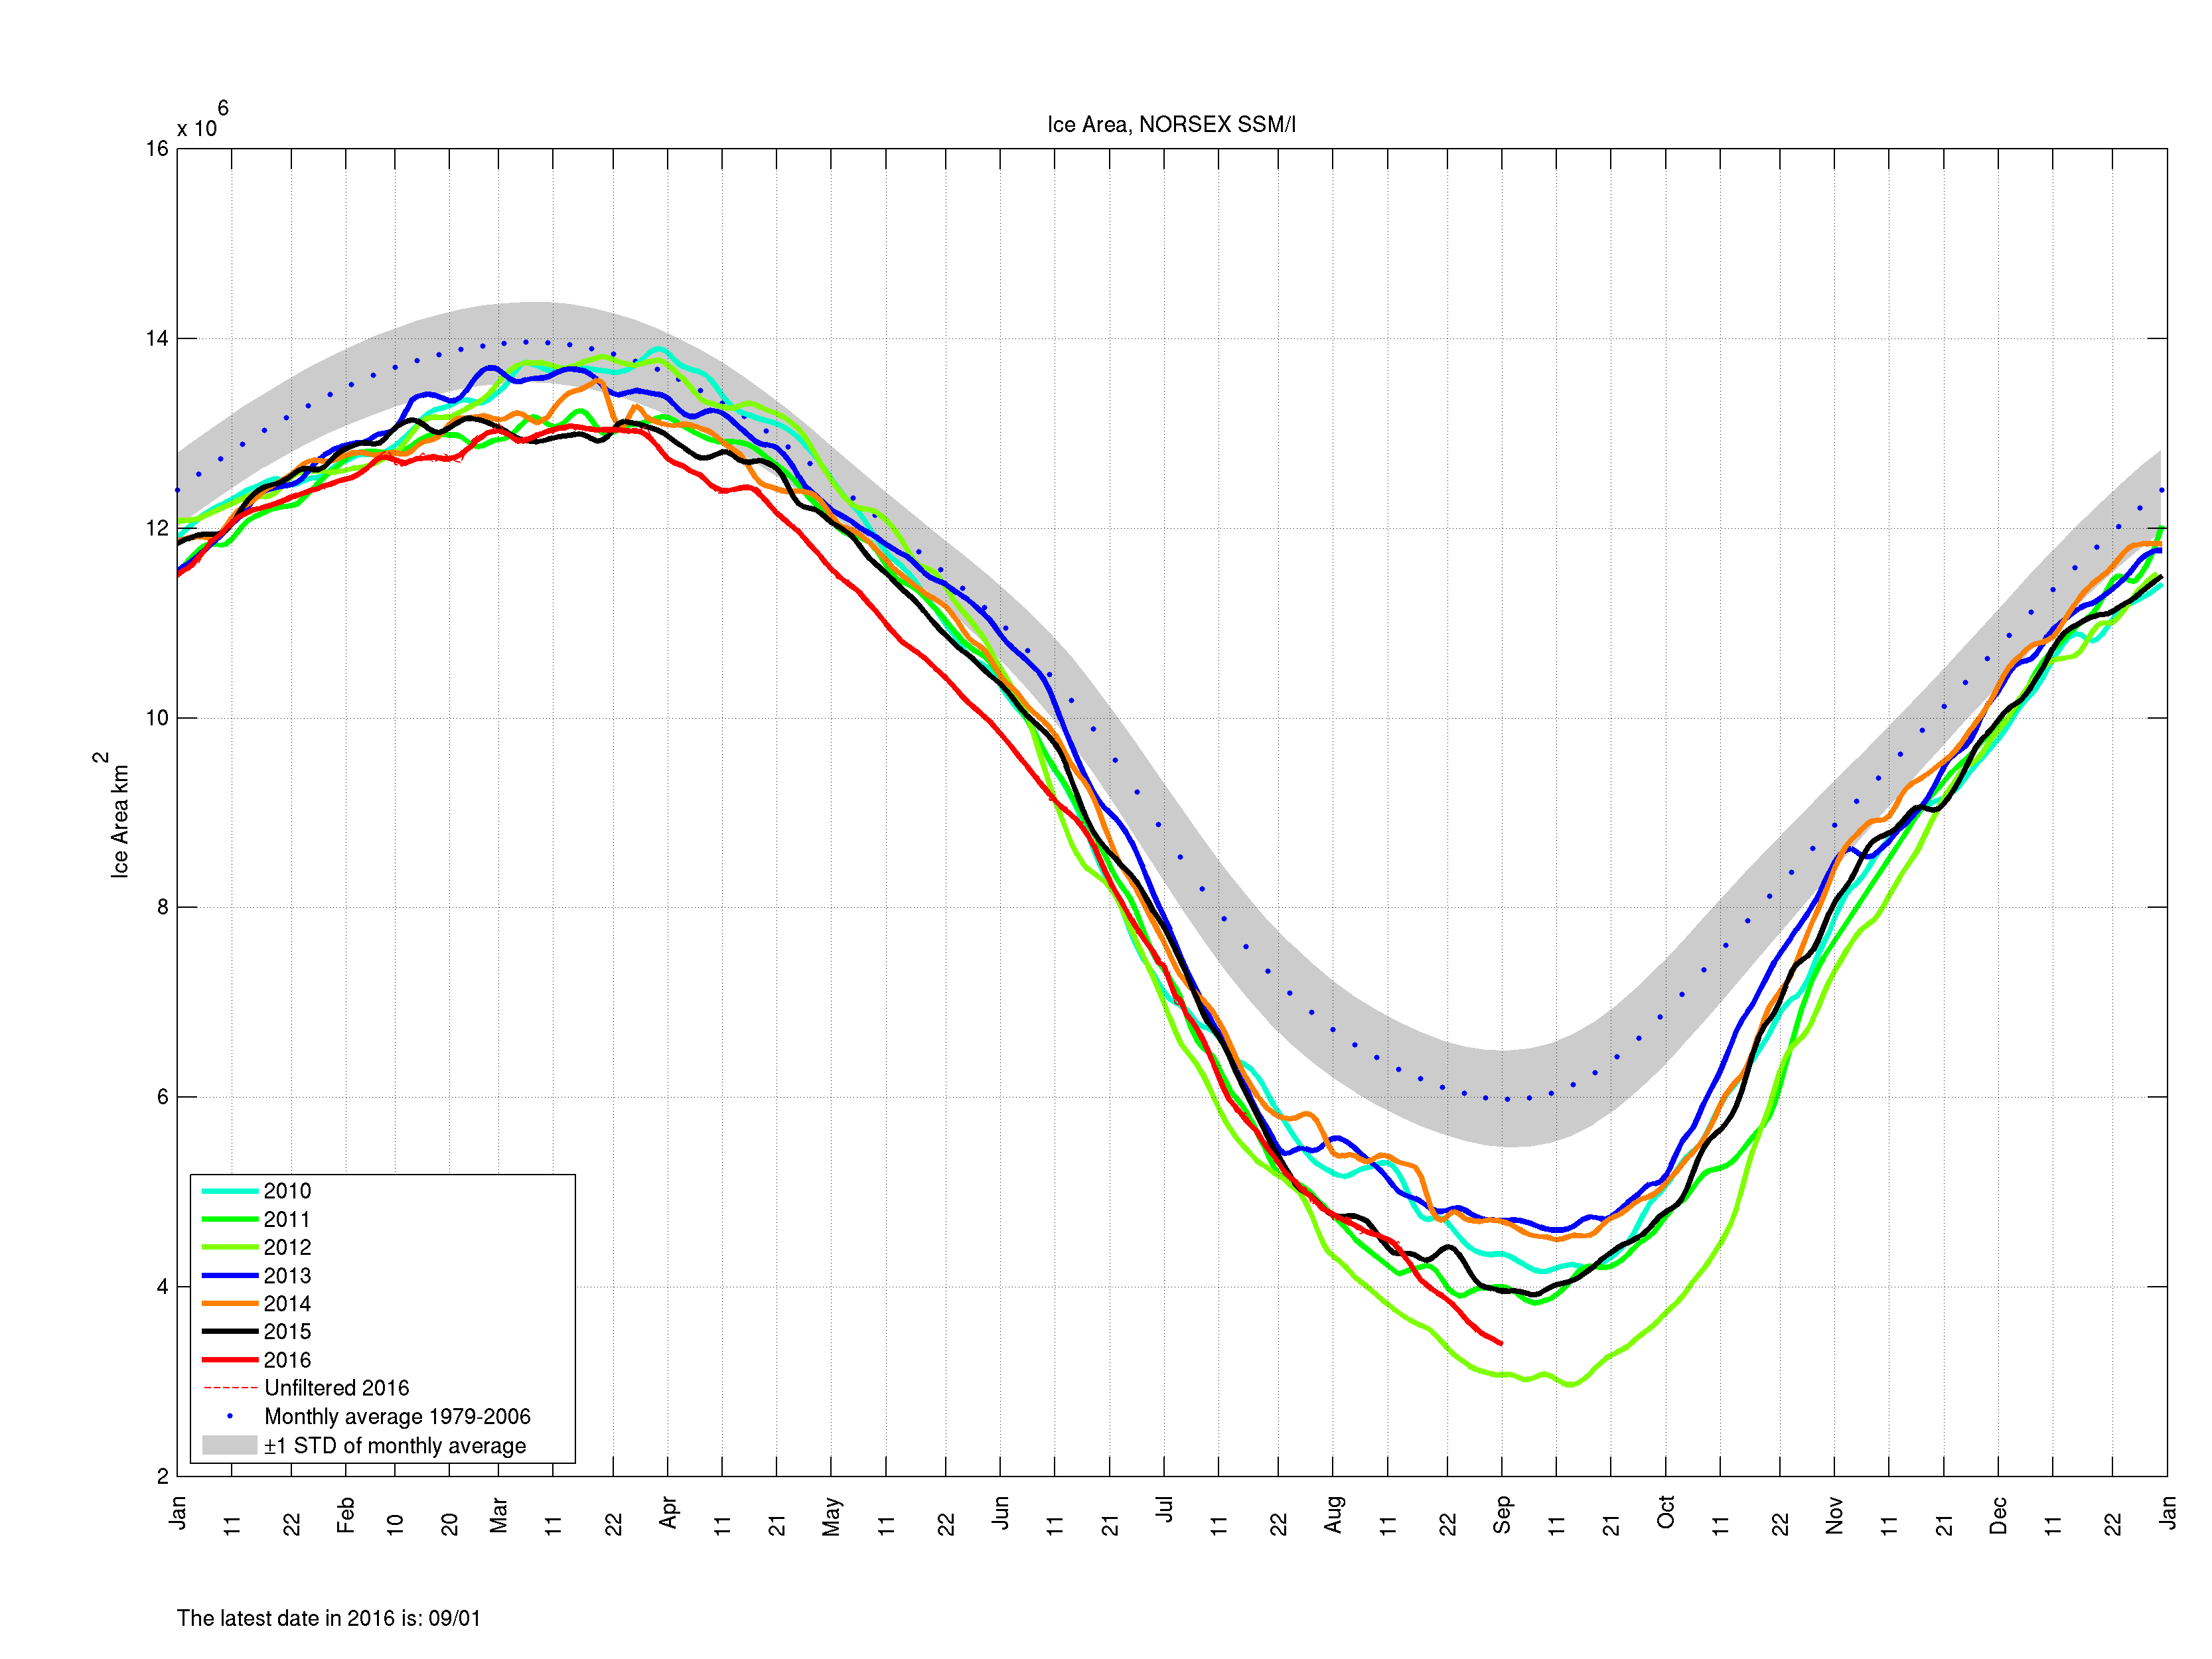
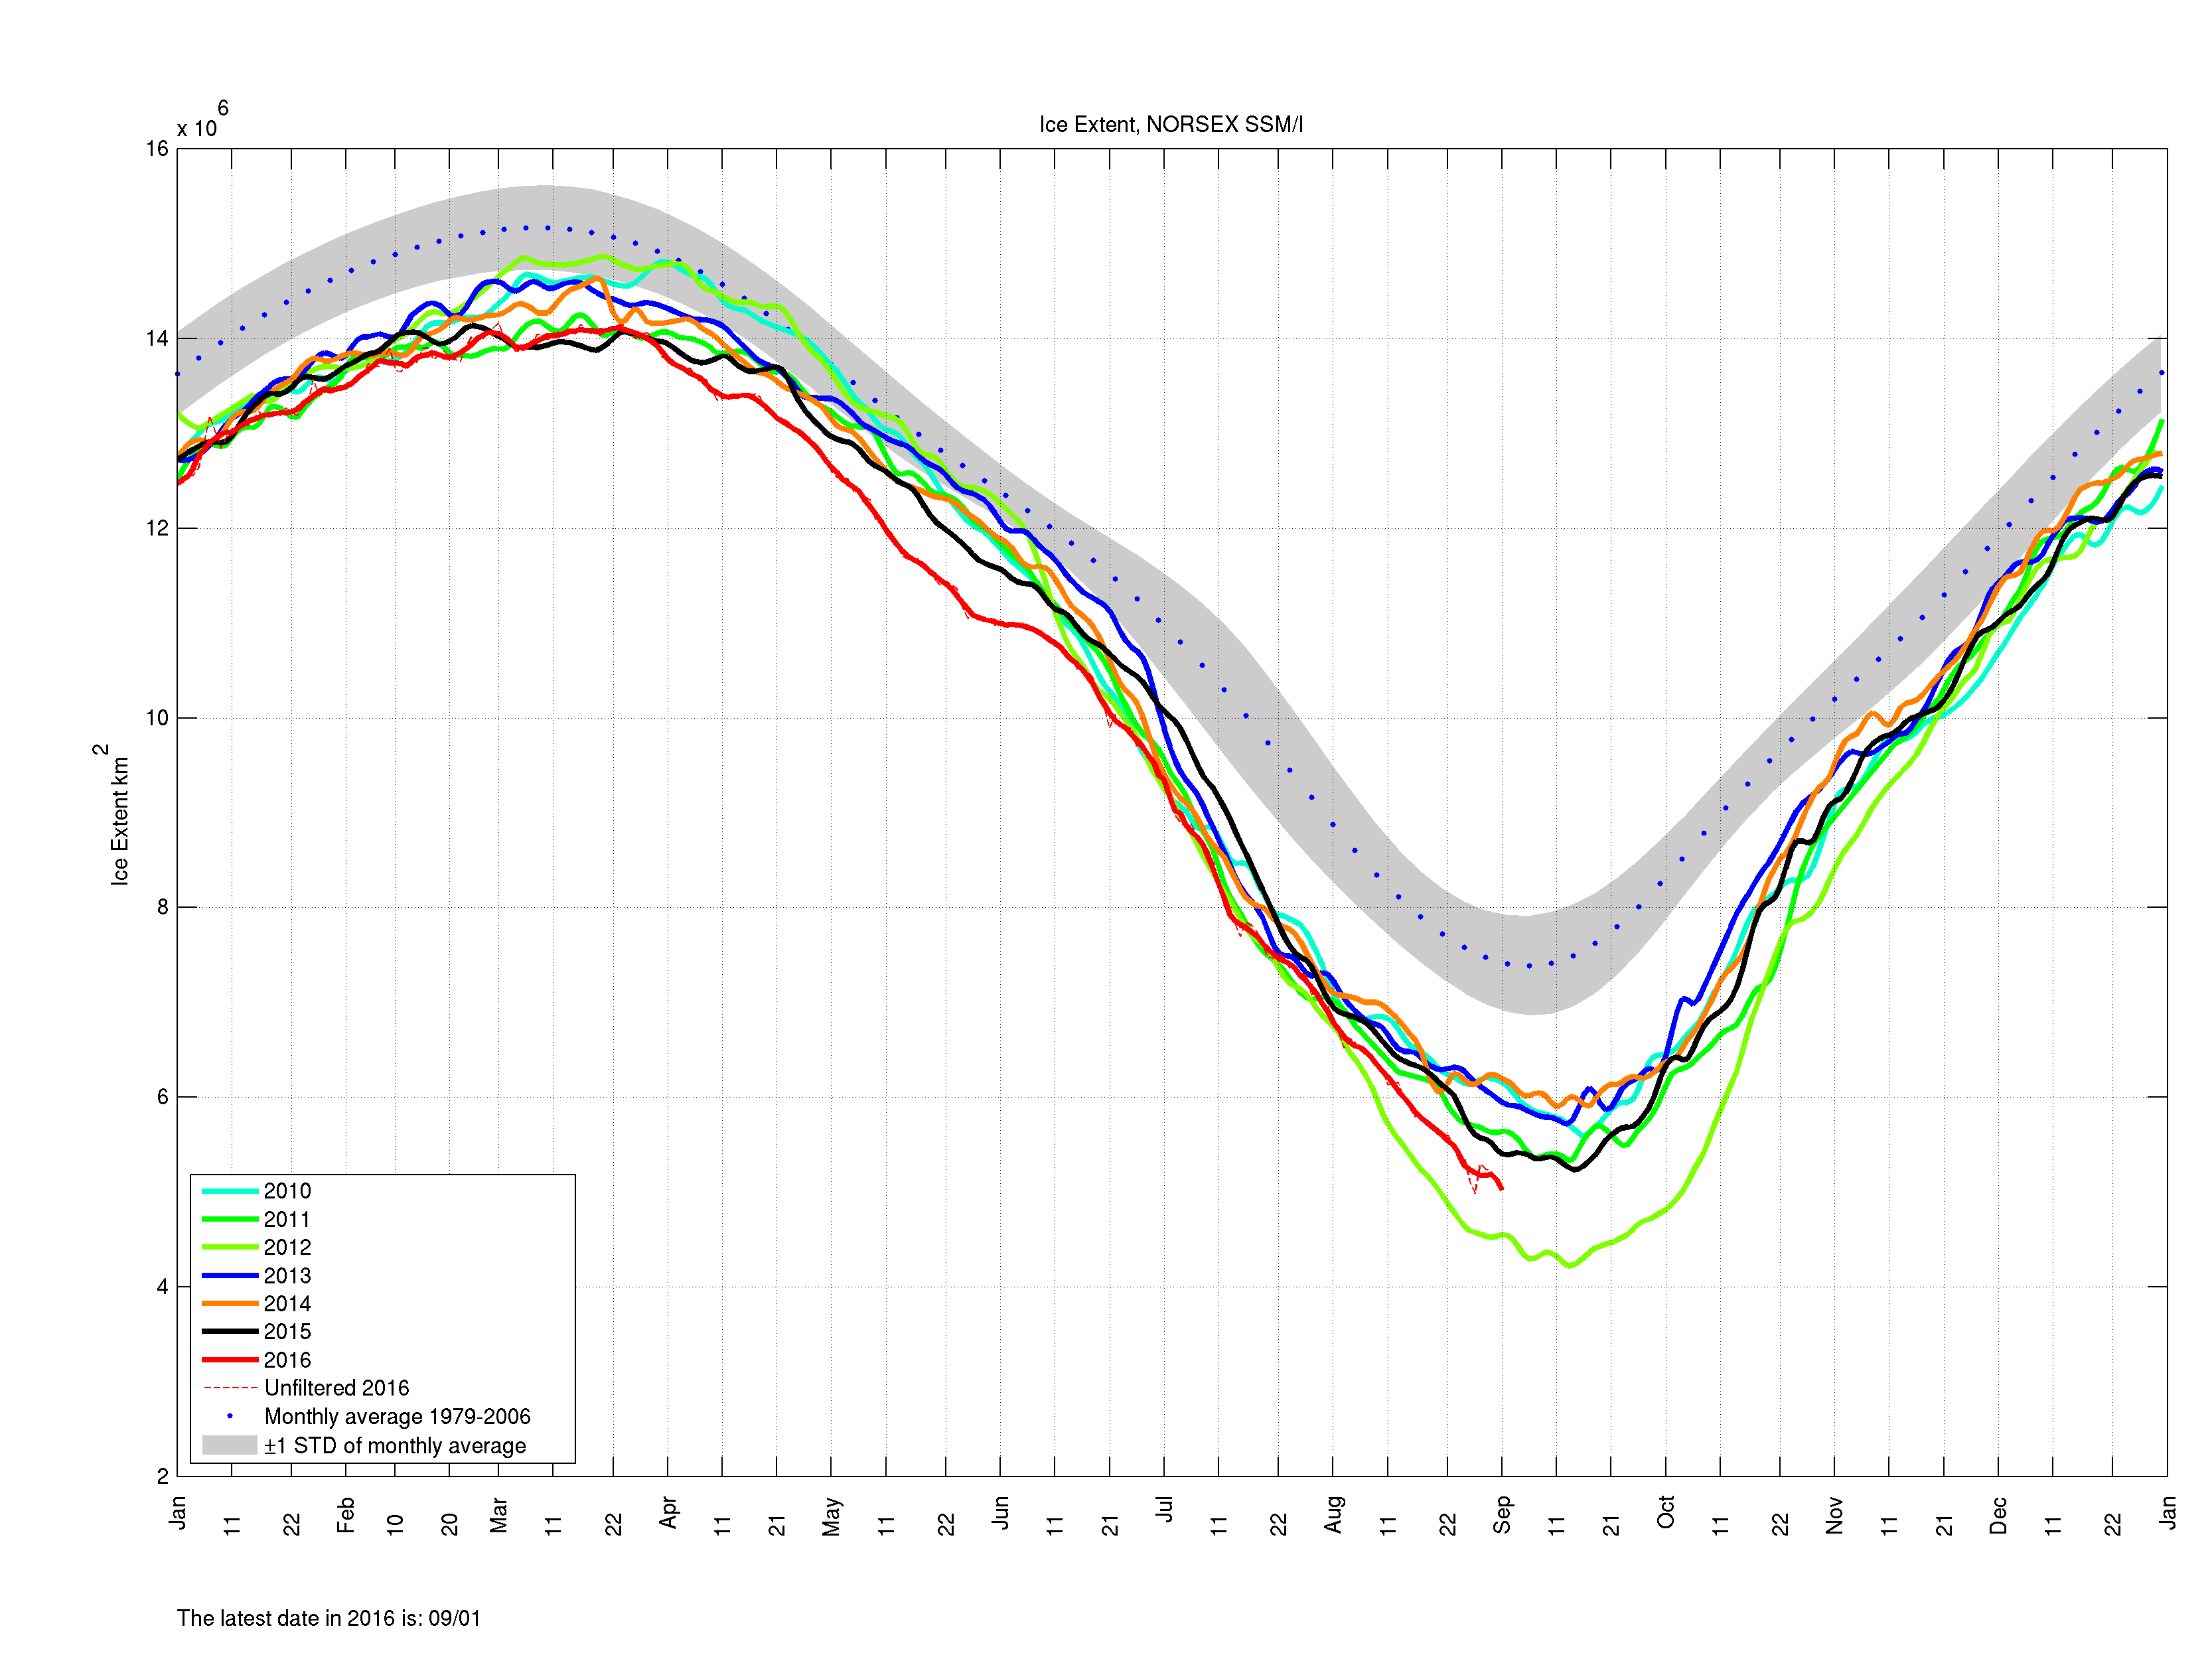
Finally here are “Snow White’s” favourite high resolution AMSR2 metrics derived by “Wipneus” from University of Hamburg AMSR2 concentration data:
Are there any other suggestions for numbers to keep a close eye on over the next few weeks?
[Edit – September 3rd]
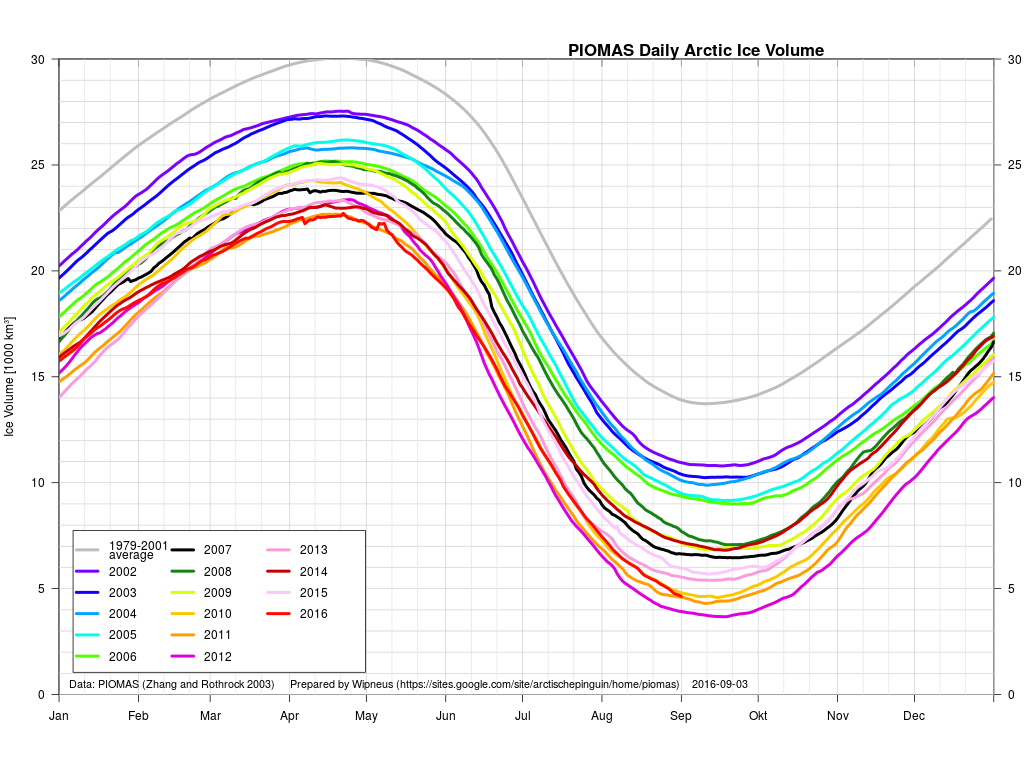
Arctic sea ice volume, as modelled by PIOMAS, has been updated to August 2016:
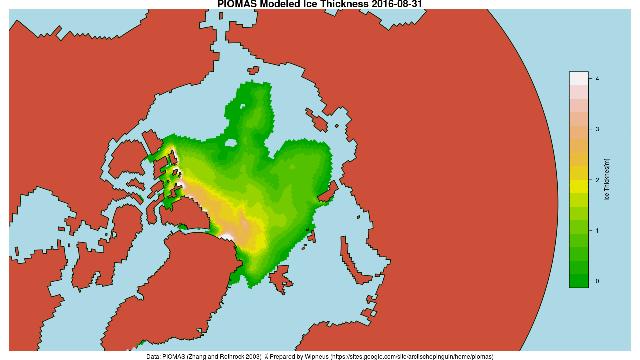
It’s currently 3rd lowest for the month, just a whisker behind 2011. Here’s the PIOMAS gridded data for August 31st 2016:
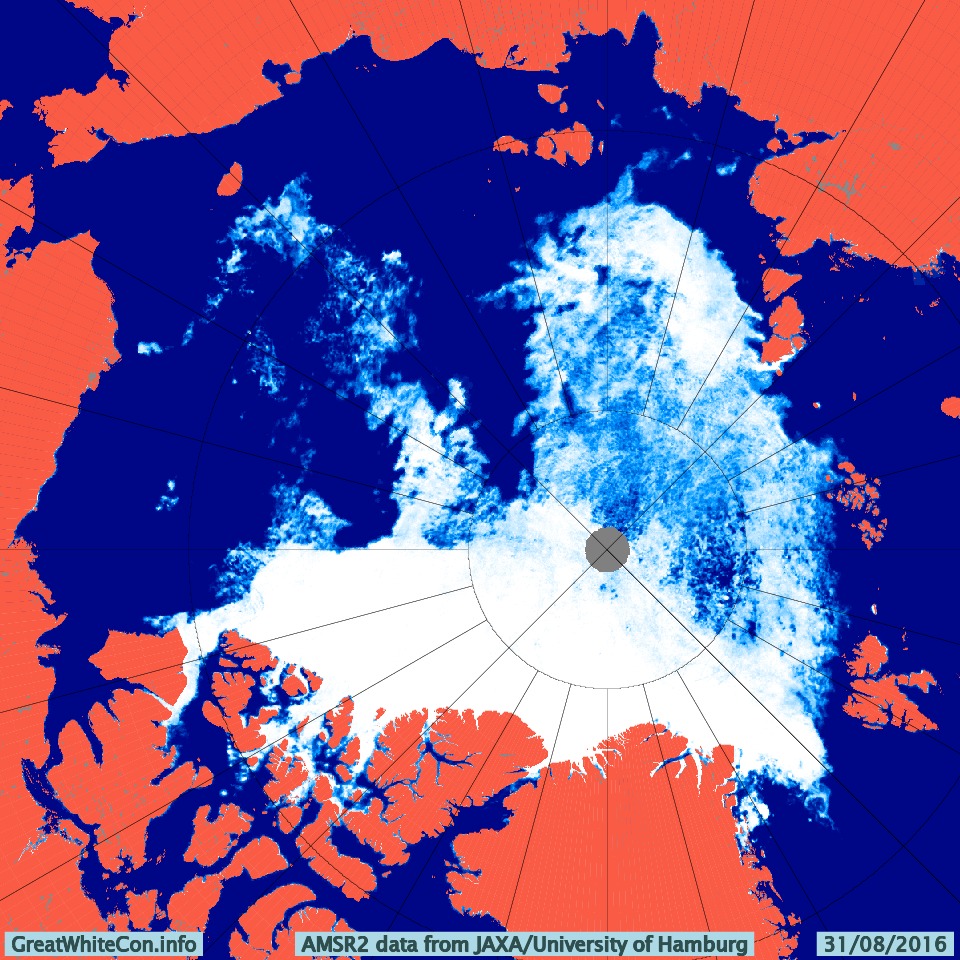
and for comparison purposes here’s the high res AMSR2 concentration map for the same date:
As suggested by Bill, here too are the Arctic Regional Ocean Observing System numbers. Much like the high res AMSR2 data they allow comparison between area and extent from the same sensor/algo combination, in this case SSMIS/NORSEX on a 25 km grid:
Both sources agree that currently the remaining ice is less compact in 2016 than it was in 2012.
[Edit – September 4th]
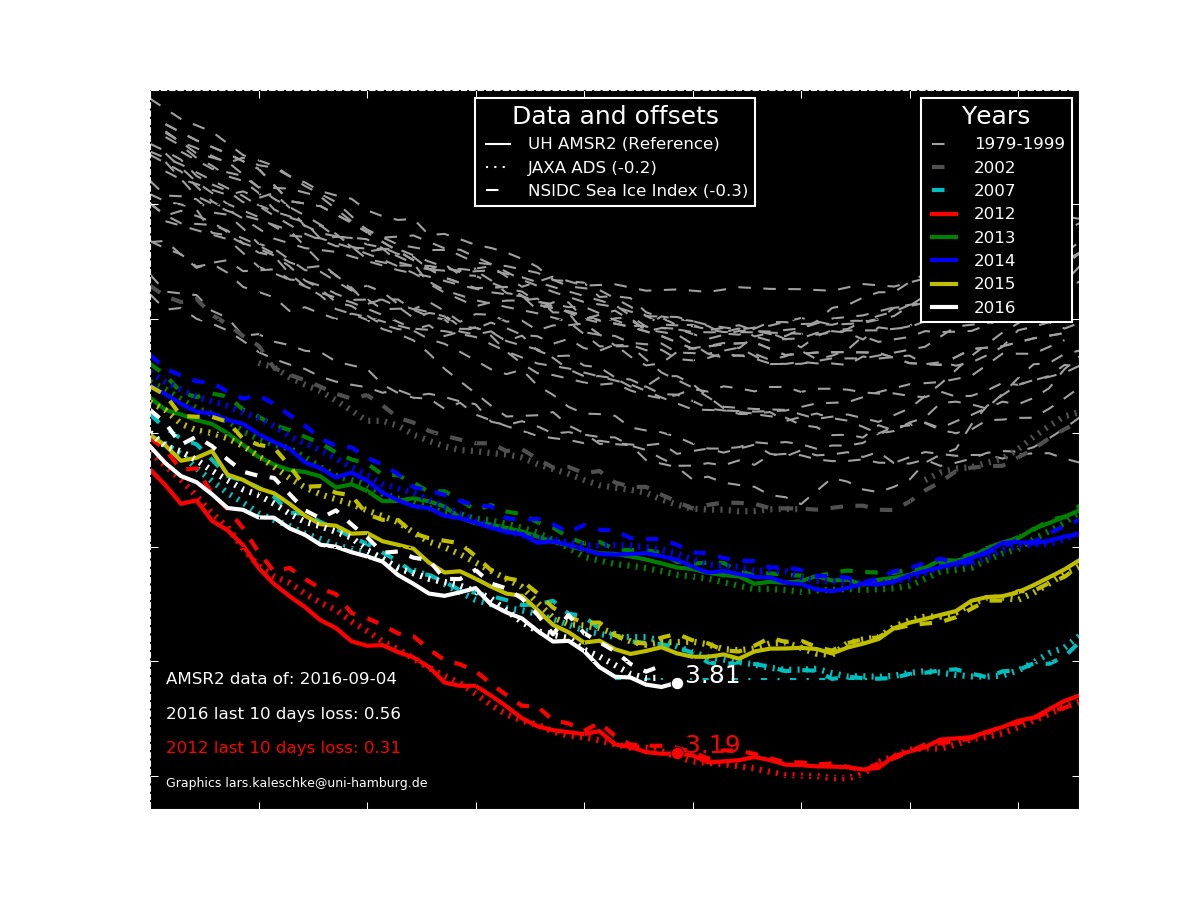
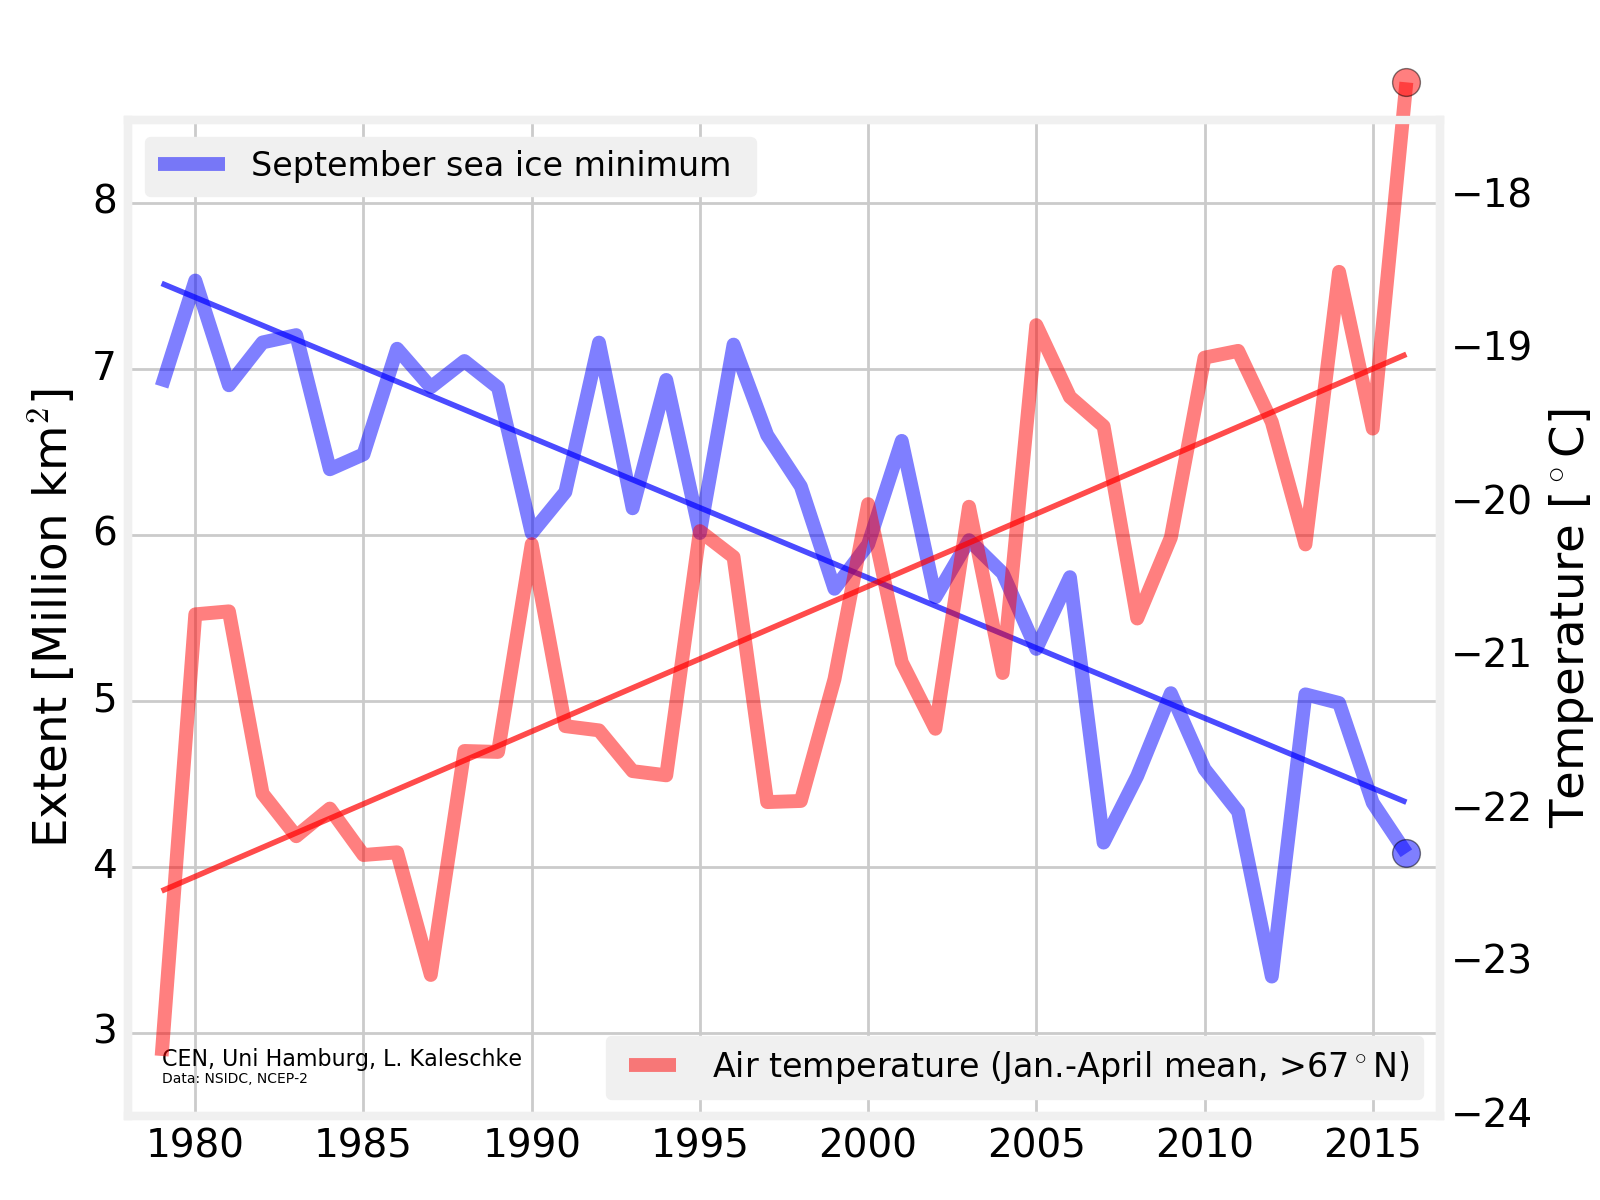
An interesting inter-metric comparison from Lars Kaleschke of the University of Hamburg:
Here’s another twist on the University of Hamburg’s AMSR2 extent, courtesy of Lars Kaleschke:
[Edit – September 11th]
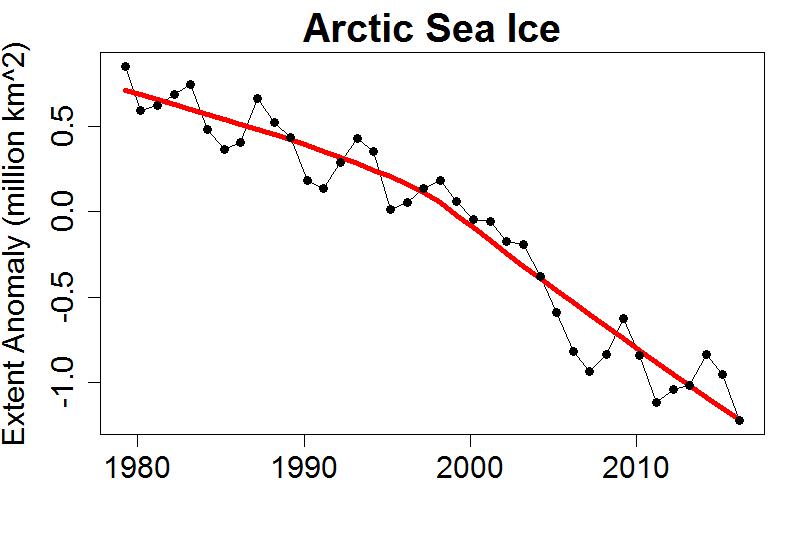
Several of the metrics displayed above have increased over the last day or two. The 2016 minimum may be upon us, but another few days will have to go by before that’s finally confirmed. Whilst we wait here’s another metric to consider, as described on “Tamino’s” Open Mind blog:
A plot of annual average extent also clearly shows the decline, and includes data from throughout the year rather than just the annual minimum. The figure for 2016 is the lowest on record, but the year isn’t done yet. If instead of averaging January-through-December we do September-through-August (to make the final year complete), we find that the most recent year is still the lowest on record:
Any way you look at it, Arctic sea ice is in decline. If you look at the entire year rather than just the annual minimum, the record year is this one.
[Edit – September 14th]
The refreeze has certainly started now. A quick look through the metrics. First of all the Hamburg University high resolution AMSR2 matched set:
Area just squeezed under 3 million km². Next up is JAXA extent:
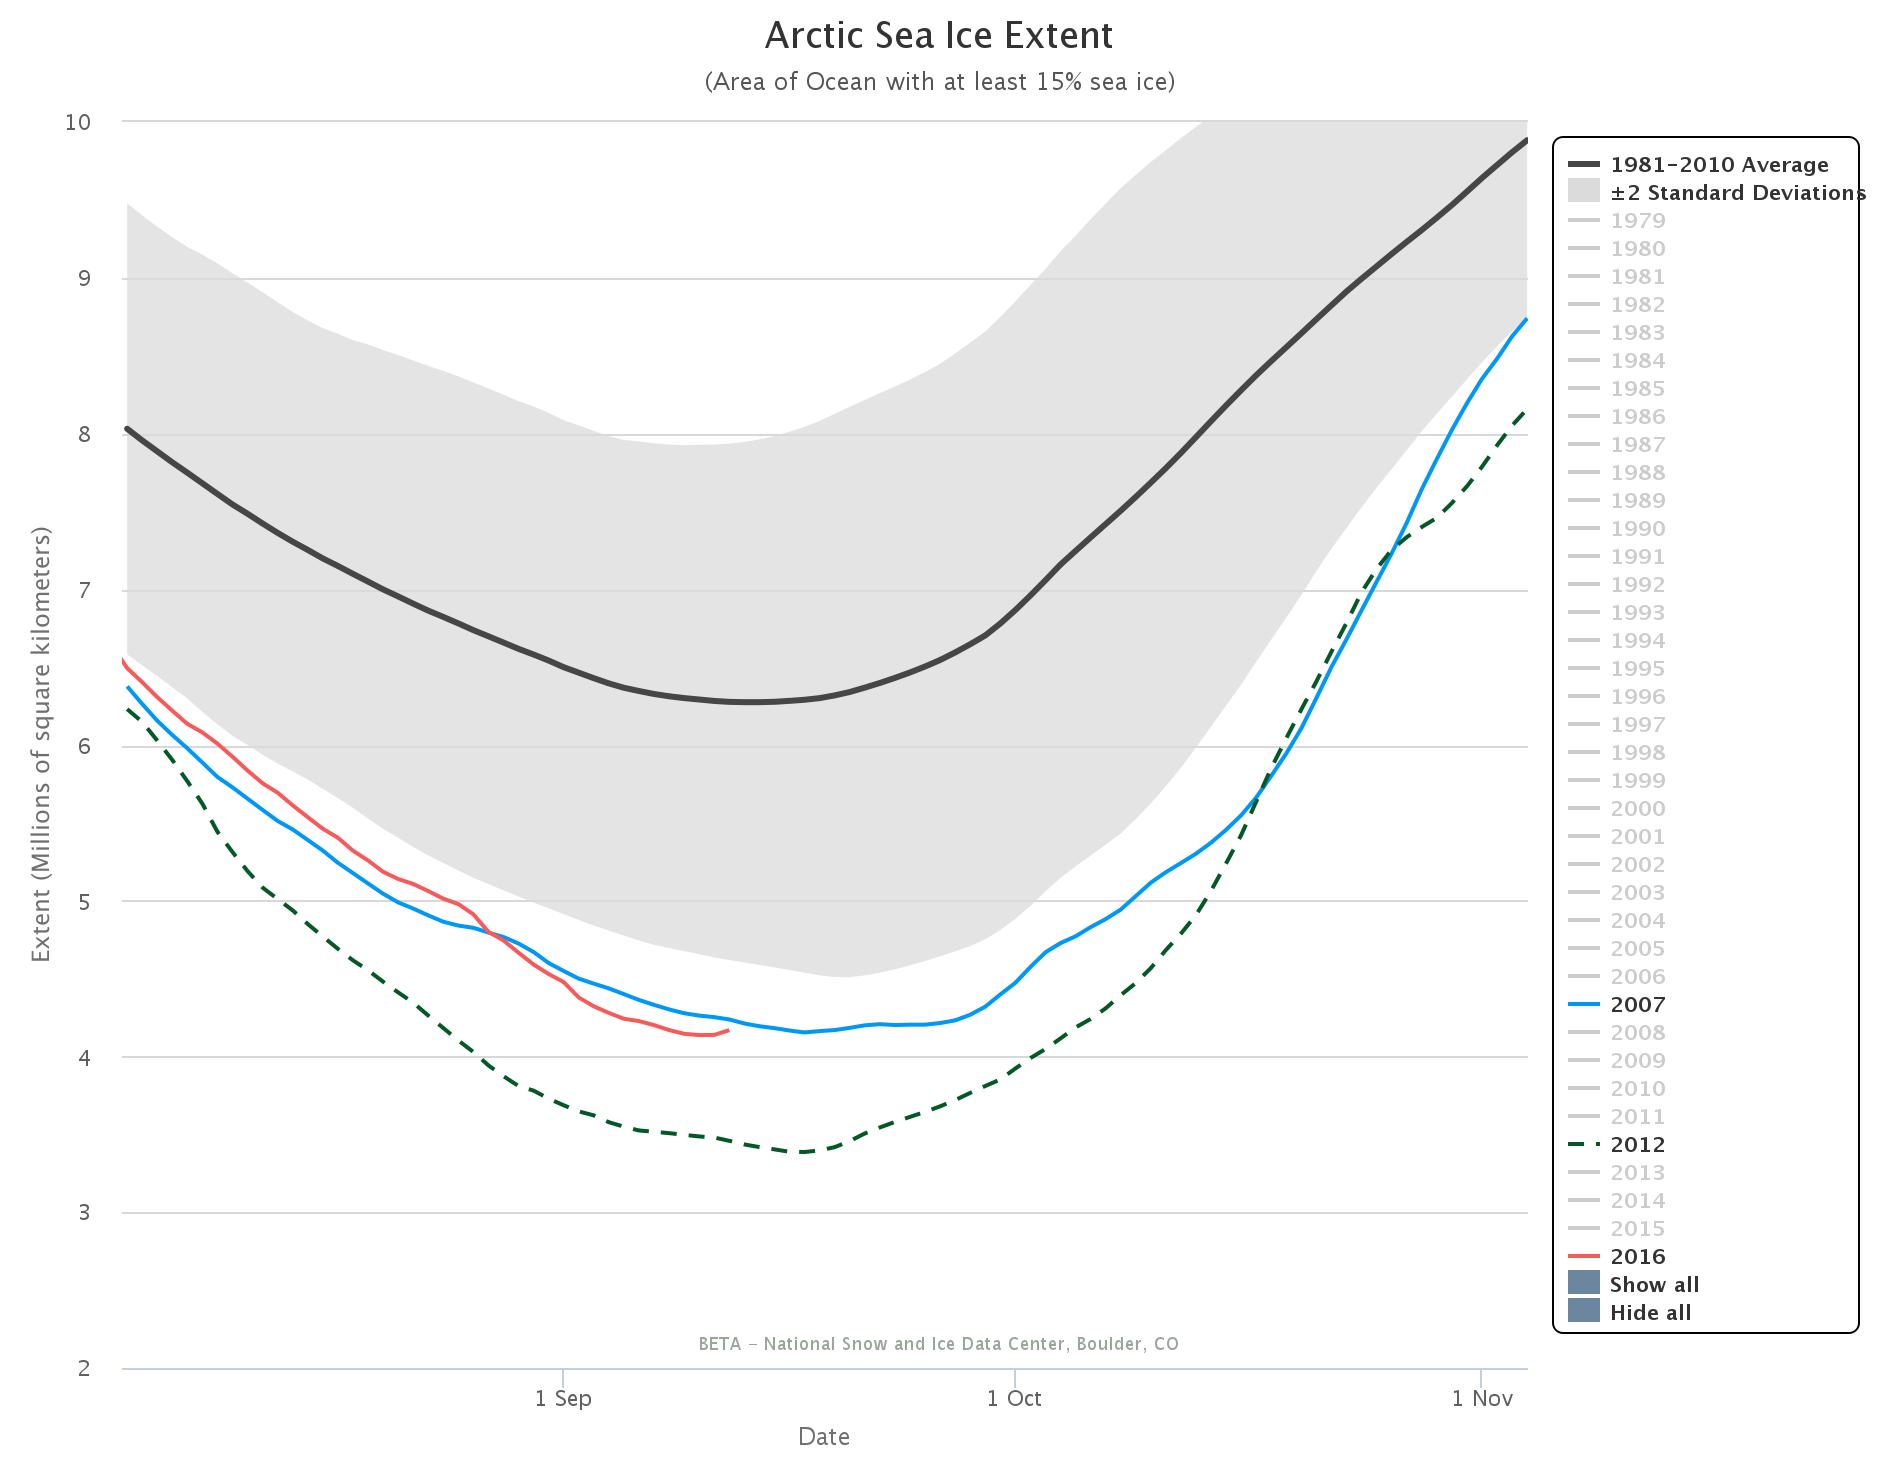
which just failed to fall below 4 million km². Last but not least, just for the moment, is the NSIDC 5 day trailing averaged extent:
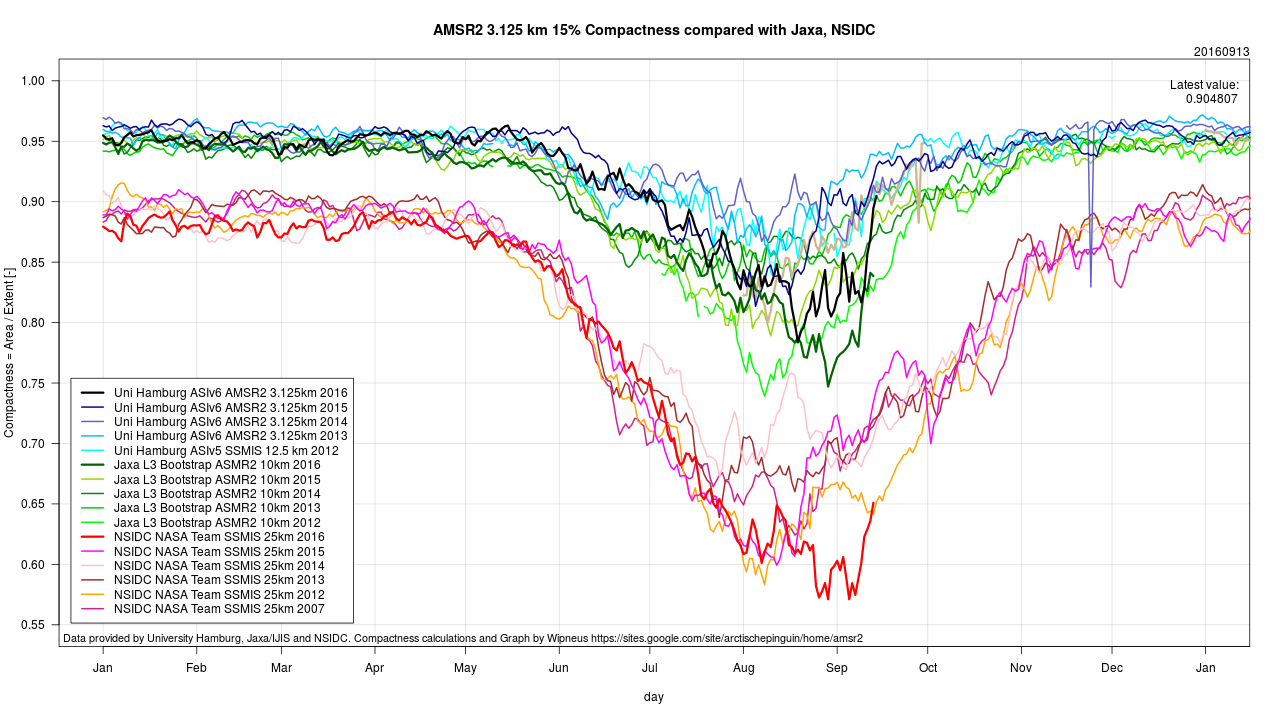
The most striking this year is the unusually large gap between area and extent for this time of year, illustrated by this “compactness” graph from Arctische Pinguin:
Note too the striking difference between different sensor/algo combinations for this metric!
[Edit – September 15th]
With the minimum now beyond doubt, here’s a new graphic from Lars Kaleschke of the University of Hamburg:
Need I say more?
[Edit – September 20th]
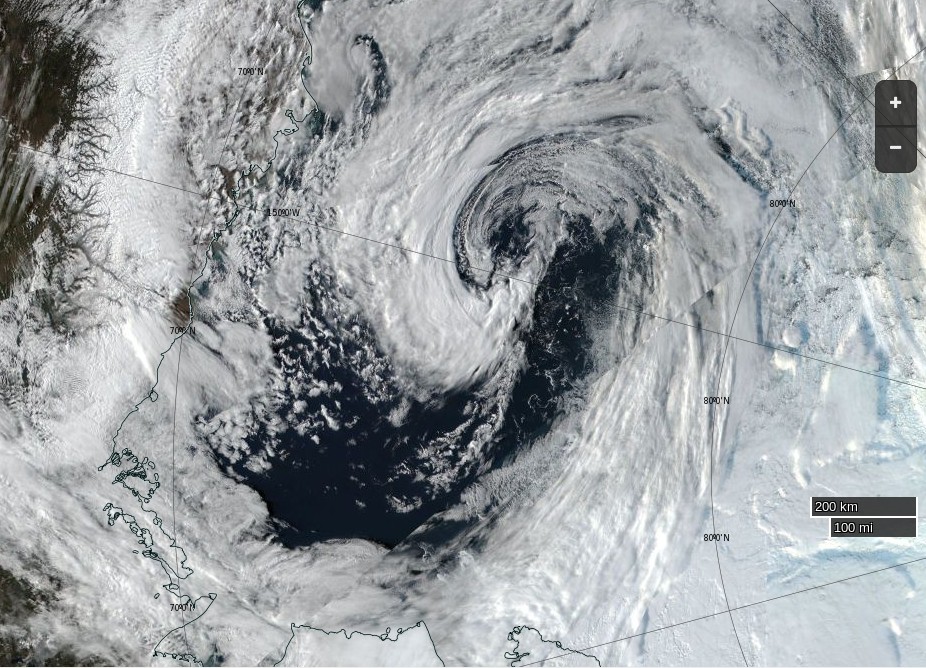
The September cyclone has now done its worst:
NASA Worldview “true-color” image of the Beaufort Sea on September 18th 2016, derived from the VIIRS sensor on the Suomi satellite
Leaving the area and extent metrics with an intriguing “double dip”:
2016 Minimum Milestones
September 3rd – JAXA extent dropped to 2nd place below the 2007 minimum at 4.05 million km²
September 7th – JAXA extent minimum of 4.02 million km²
September 8th – NSIDC single day extent dropped to 2nd place below the 2007 minimum at 4.083 million km². This proved to the minimum value for the year as a whole.
September 9th – NSIDC 5 day trailing averaged extent dropped to 2nd place below the 2007 minimum at 4.146 million km²
September 10th – NSIDC 5 day trailing averaged extent minimum of 4.137 million km²
People keep on posing that question just at the moment. Here’s a typical example from the Arctic Sea Ice Blog this morning:
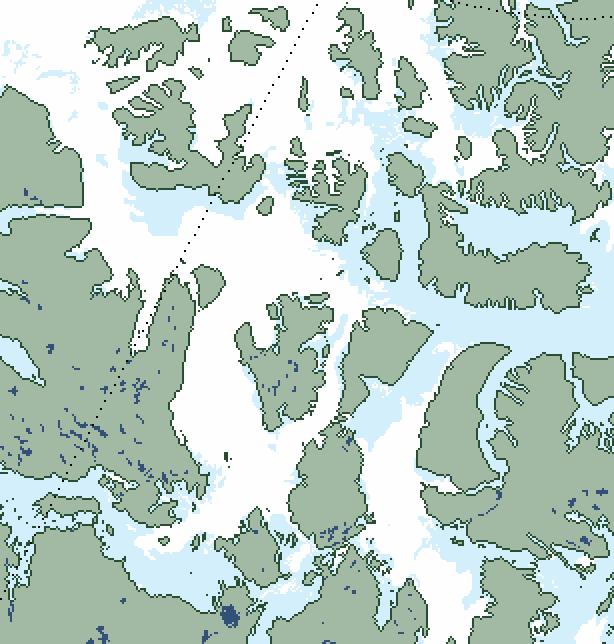
Albeit not ‘officially’ declared as such, the daily Uni-Bremen chart shows Amundsen’s route is cleared and free now.
Here’s an extract from the “Daily Uni-Bremen chart” referred to, with an apparently “ice free” section of the southern route through the Northwest Passage highlighted:
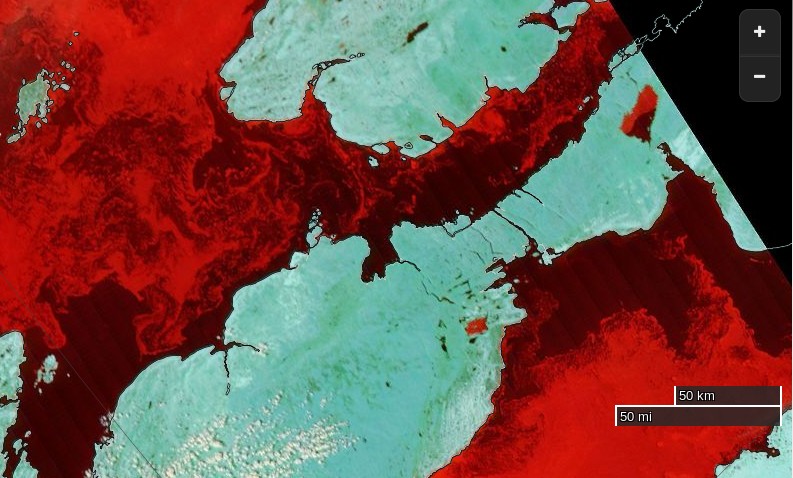
As we’ve been discussing here recently, the automated passive microwave based satellite Arctic sea ice concentration products can miss ice that’s visible to the naked human eye. Here’s some pictures from the Great White Con Northwest Passage page:
NASA Worldview “false-color” image of the Northwest Passage on August 13th 2015, derived from bands 7, 2 and 1 of the MODIS sensor on the Terra satellite
The Canadian Ice Service sea ice concentration chart for the Queen Maud Gulf on August 13th 2015
Here’s an extract from the NSIDC’s Multisensor Analyzed Sea Ice Extent (MASIE) product (currently for August 12th 2015):
and here’s an extract from an answer I gave to a similar question on the Arctic Sea Ice Forum earlier this morning:
The Canadian Ice Service still have 4-6/10 ice within a whisker of the coast. Would you fancy your chances in amongst that and a bit of a breeze?
The CIS definition of “navigable” is “a criteria of less than 60% ice cover over all sections of the Northwest Passage”. See:
The answer to the question posed in the title to this article is therefore currently NO, the Northwest Passage is not open yet, both officially from the CIS and unofficially from any mariner with a sense of self preservation in charge of any vessel that isn’t “ice hardened”. In all the circumstances that answer might change quite quickly though!
[Edit 18/09/15]
The Canadian Ice Service have finally published a close up map of the Parry Channel that doesn’t say “No Analysis”. Here it is:
There’s still a (narrow!) green path into McClure Strait, so I reckon we can at long last confidently declare the main Northwest Passage to be OPEN!
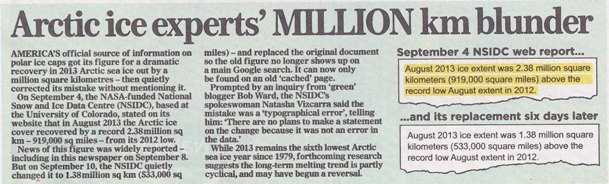
This weekend the Mail on Sunday admitted that the headline numbers in David Rose’s “And now it’s global COOLING!” article published on September 8th were inflated by a factor of approximately two. This is how they explained that discrepancy to their faithful readers:
The bottom of page 31 in the September 29th 2013 edition of the Mail on Sunday
Can you spot the MILLION square km blunder by the Mail on Sunday? For the benefit of the scientifically illiterate amongst you I’ll explain, as I did yesterday in an email to the Mail on Sunday’s Managing Editor:
It appears that whoever writes your headlines is unaware of the difference between “A MILLION km” and “a million square km”. The former is a distance, and hence has no area. The latter IS an area.
Them:
As you can clearly see, the Mail reported yesterday that:
On September 4, NSIDC, based at the University of Colorado, stated on its website that in August 2013 the Arctic ice cover recovered by a record 2.38 million sq km – 919,000 sq miles – from its 2012 low.
News of this figure was widely reported – including by MailOnline – on September 8.
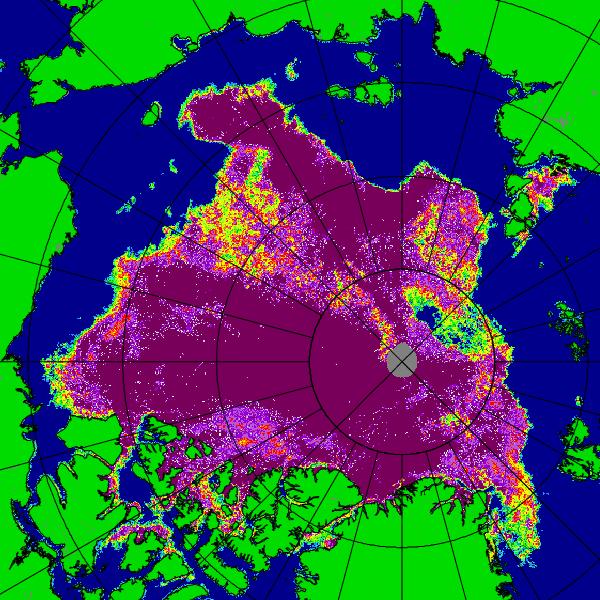
A large hole (roughly 150 square kilometers or 58 square miles) of near-zero ice concentration appears to have opened up at about 87 degrees North latitude. Small areas of open water are common within the ice pack, even at the North Pole, as the ice pack shifts in response to winds and currents, resulting in cracks (called leads) in the ice. The current opening seen in our satellite imagery is much larger.
and the relevant area of the accompanying satellite imagery looks like this:
University of Bremen AMSR2 colour visualisation of Arctic sea ice concentration for September 2nd 2013
Them:
Since the Mail’s intrepid reporter evidently read those words and looked at that picture, why on Earth do you suppose that the Mail on Sunday printed these words four days later?
Days before the annual autumn re-freeze is due to begin, an unbroken ice sheet more than half the size of Europe already stretches from the Canadian islands to Russia’s northern shores.
Even more to the point, why on Earth do you suppose that the Mail on Sunday left those words unaltered following their September 28th edit of the online version of that article?
Us:
Here’s our latest video update on the 2013 Arctic sea ice refreeze. The “Polar Polynya” is prominent by its presence, as is the broad band of open water between the “broken ice sheet” and “Russia’s northern shores”:
This website uses cookies to improve your experience. We'll assume you're ok with this, but you can opt-out if you wish. Cookie settingsACCEPT
Privacy & Cookies Policy
Privacy Overview
This website uses cookies to improve your experience while you navigate through the website. Out of these, the cookies that are categorized as necessary are stored on your browser as they are essential for the working of basic functionalities of the website. We also use third-party cookies that help us analyze and understand how you use this website. These cookies will be stored in your browser only with your consent. You also have the option to opt-out of these cookies. But opting out of some of these cookies may affect your browsing experience.
Necessary cookies are absolutely essential for the website to function properly. This category only includes cookies that ensures basic functionalities and security features of the website. These cookies do not store any personal information.
Any cookies that may not be particularly necessary for the website to function and is used specifically to collect user personal data via analytics, ads, other embedded contents are termed as non-necessary cookies. It is mandatory to procure user consent prior to running these cookies on your website.


