Tag Archives: Waves

Facts About the Arctic in February 2025

This isn’t exactly “shock news”, since we (slightly hesitantly!) predicted this 5 days ago.

A GFS 2 meter temperature chart revealing greater than zero degrees Celsius at the North Pole later today:

The 2 meter temperature anomaly at the Pole is almost off the charts:

Plus the cause of these unusual numbers, a cyclone with central pressure of 959 hPa spinning north of Ellesmere Island at 18:00 UTC this evening:

All of which has led to the JAXA/Vishop Arctic sea ice extent being the lowest for the date since 1979 at least by a significant margin:

Continue reading Facts About the Arctic in February 2025

Facts About the Arctic in February 2024

A change is perhaps even better than a rest? Let’s start February with a reminder that following close behind another recent Arctic cyclone, Storm Ingunn caused red weather warnings for high winds and avalanches in Norway two days ago:

By yesterday evening another long period, storm driven swell was arriving at the sea ice edge in the Fram Strait, and to a lesser extent in the Barents Sea:

By this morning Ingunn had merged with the remnants of the prior cyclone, as revealed in Climate Reanalyzer’s visualisation of the latest GFS model run::

Continue reading Facts About the Arctic in February 2024

Facts About the Arctic in December 2022

A new month is upon us and Christmas is coming! Here’s another look at Lars Kaleschke’s high resolution AMSR2 area and extent graphs for the Arctic as a whole:

Extent increase stalled for the last few days of November, and as a result extent is now in a “statistical tie” with 2017 for 4th lowest extent for the date in the AMSR2 record.

Continue reading Facts About the Arctic in December 2022

Facts About the Arctic in October 2022

The 2022/23 freezing season has begun, so to begin with here are Arctic sea ice area and extent during its early stages:

Both metrics are currently tracking 2021 quite closely.

Here too is an AMSR2 animation of the transition from melting to freezing in the Central Arctic. Click to animate, and be warned that the file size is almost 10 Mb:

[Edit – October 4th]

Another big storm is heading for the Chukchi Sea. The GFS forecast currently shows a sub 960 hPa low developing on Thursday:

Continue reading Facts About the Arctic in October 2022

Facts About the Arctic in September 2022

As in previous years there is already a thread devoted to this year’s minimum extent. By way of a summary here are the end of August numbers for our favourite “high resolution” AMSR2 area and extent metrics:

Extent is currently near the top of the range of the last 10 years.

We have now reached the stage of the “melting season” when “refreezing” has started in the Central Arctic but melting at the periphery is outpacing it. However the Canadian Ice Service stage of development charts now show the arrival of new ice in the high latitudes of the Canadian Arctic Archipelago:

Continue reading Facts About the Arctic in September 2022

Jim Thomson Waves in Ice Webinar

I only found out about this webinar after it had already started. My Arctic alter ego somewhat cheekily suggested to the Arctic Research Consortium of the United States (ARCUS for short) that our research into waves in the Arctic was ahead of theirs, and was rather surprised when they agreed with “her”!

Fortunately the “Ocean Waves in the New Arctic” webinar was recorded, and here it is in its entirety:

See if you can spot the question “Snow White” asked?

Amongst other things, Jim mentioned in his talk coastal erosion due to increased wave action.  That included a flooding event at Utqiaġvik (Barrow) in 2017. Here’s what happened during a similar event there in 2015:

Photograph by Brittni Driver via Alaska Dispatch News

Barrow Battered By Big Waves

Jim also mentioned the erosion of the permafrost bluff at Drew Point, exacerbated by increasing wave action. According to a recent article on that topic:

Eroding permafrost coasts are likely indicators and integrators of changes in the Arctic System as they are susceptible to the combined effects of declining sea ice extent, increases in open water duration, more frequent and impactful storms, sea-level rise, and warming permafrost.

Our results show that mean annual erosion for the 2007–2016 decade was 17.2 m yr−1, which is 2.5 times faster than historic rates, indicating that bluff erosion at this site is likely responding to changes in the Arctic System.

Here’s a video of permafrost disappearing into the Beaufort Sea in 2008:

[Edit – March 1st]

A slightly less technical video from the University of Washington featuring Jim Thomson and some big waves in the New Arctic:

Facts About the Arctic in March 2019

Wipneus has recently updated the mid month PIOMAS gridded thickness map, which looks like this:

The accompanying PIOMAS volume graph currently shows 2019 in seventh place:

We now have a new thickness metric to peruse each month. Here’s the gridded merged CryoSat-2/SMOS thickness data from the Finnish Meteorological Institute:

Since the FMI make the gridded data available as well as that visualisation, here’s a closer look at the Bering/Chukchi area:

There’s an awful lot of thin ice in the region ripe for rapid melting now that the sun is shining down for a rapidly increasing number of hours per day. Over on the other side of the North Pole there’s also some significant swell forecast to hit the Atlantic edge of the Arctic ice pack. Here’s the current WaveWatch III forecast for 09:00 UTC tomorrow morning:

Finally, for the moment at least, here are the current Arctic wide high resolution AMSR2 sea ice area and extent graphs:


[Edit – March 22nd]

This Sentinel 1 SAR image of the Lincoln Sea from PolarView suggests that the northern arch of the Nares Strait is breaking up once again:

It is therefore conceivable that sea ice in the Lincoln Sea will continue to break up and flow south through the Nares Strait for the entire 2018/2019 winter.


[Edit – March 23rd]

Bering Sea ice area has “rebounded” over the last few days:

and taken the Arctic wide metrics with it:

Here’s the latest Sentinel 1 SAR image of the Lincoln Sea and northern Nares Strait:


[Edit – March 24th]

The “rebound” has reversed:

With temperatures above freezing point across the Bering and Chukchi Sea forecast for tomorrow morning expect the decline in Arctic sea ice extent to accelerate:


[Edit – March 25th]

There was a 162k decline in high resolution extent yesterday:

Here also is the current state of the thick sea ice exiting the Lincoln Sea via the Nares Strait:


[Edit – March 27th]

Here’s another week’s merged CryoSat-2/SMOS thickness data from the Finnish Meteorological Institute:


[Edit – March 30th]

We’re still waiting for Wipneus’ Raspberry Pi to crunch the high resolution AMSR2 numbers, but here’s the latest from JAXA:

2019 currently in 3rd place by a whisker.

P.S. The high resolution AMSR2 numbers are out:

Area is certainly lowest for the date in the AMSR2 era. Extent will almost certainly achieve that status tomorrow. Excluding the two most peripheral seas reveals perhaps an even more worrying picture?


[Edit – March 31th]

Arctic sea ice coverage is now firmly in the “lowest extent for the date in the satellite record” category, whichever metric you care to choose:

The NSIDC 5 day average is in a “statistical tie” for first place with 2017:

The Great Arctic Cyclone of 2018?

Our title for today refers back to the Great Arctic Cyclone of August 2012. There has been some speculation over on the Arctic Sea Ice Blog about whether a similar event is about to occur this year.

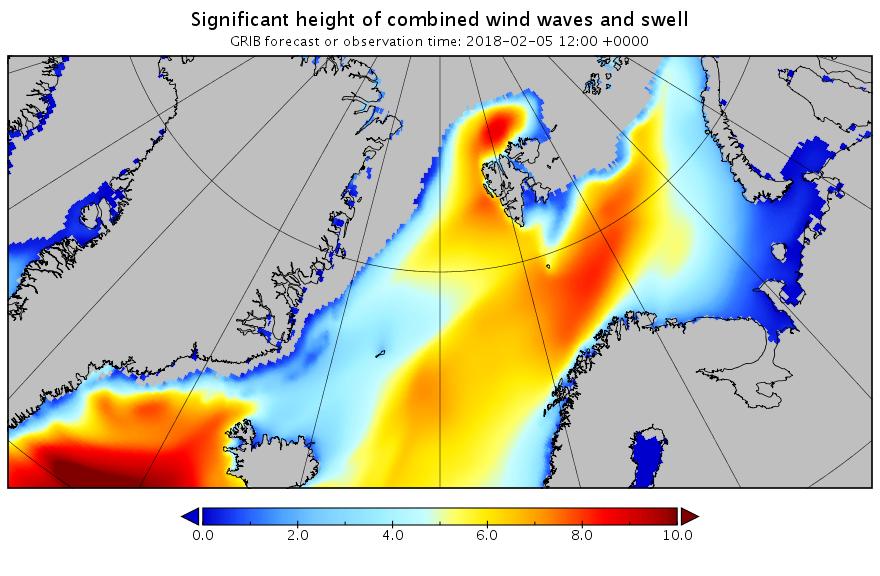
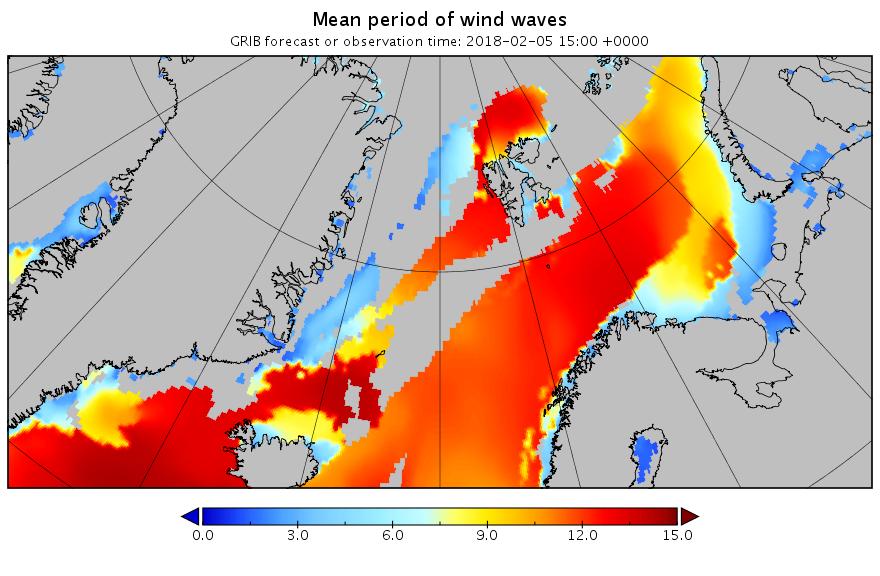
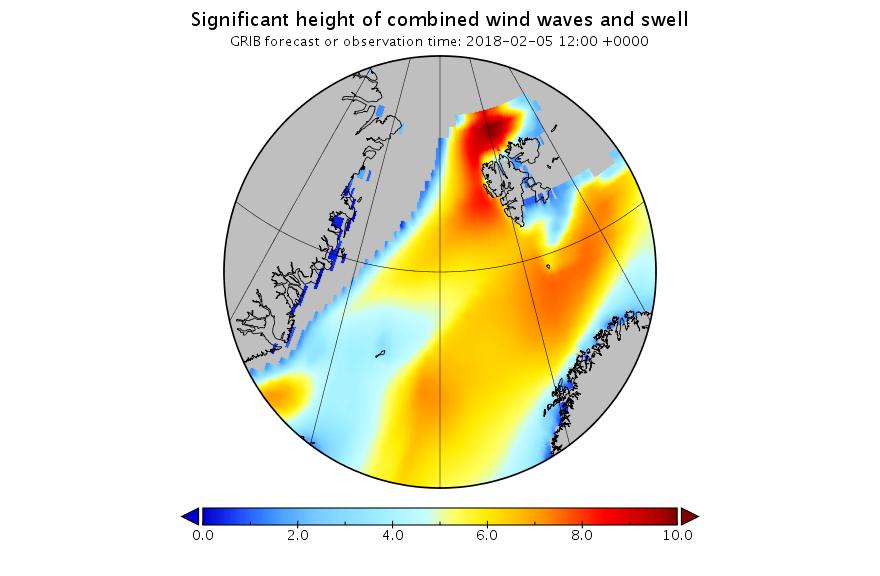
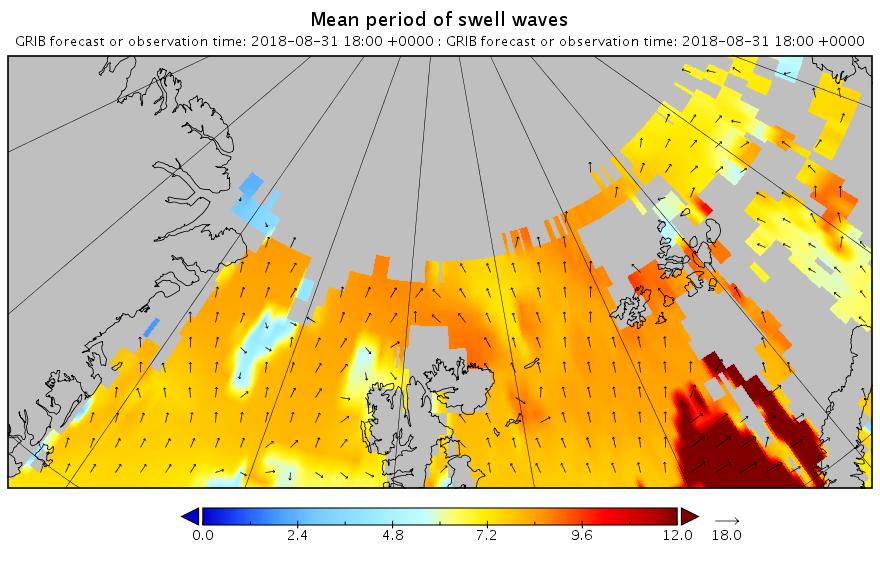
It’s later in the season of course, but as is our wont we always look at the waves first. Here is the current WaveWatch III forecast for the evening of August 31st UTC:

Significant_height_of_combined_w in multi_1.glo_30mext.20180827_00039

Mean_period_of_swell_waves_order in multi_1.glo_30mext.20180827_00039

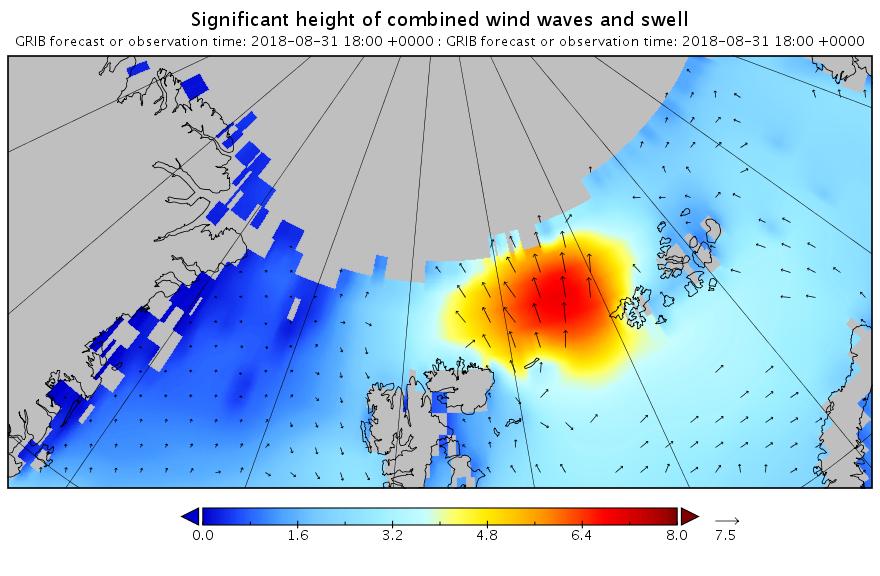
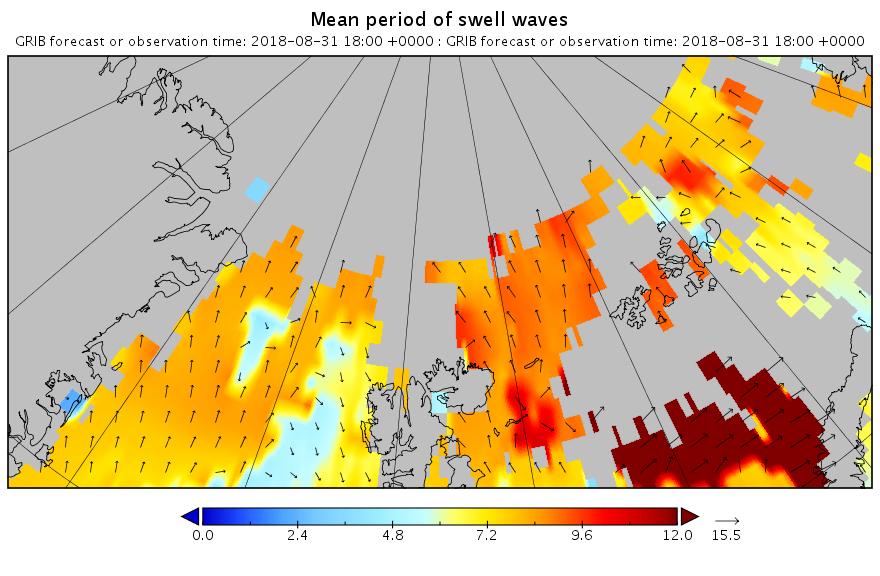
In summary the forecast shows some very large waves with a substantial period for inside the Arctic Circle directed straight at the ice edge. Let’s follow the forecast over the next few days carefully shall we?


[Edit – August 30th]

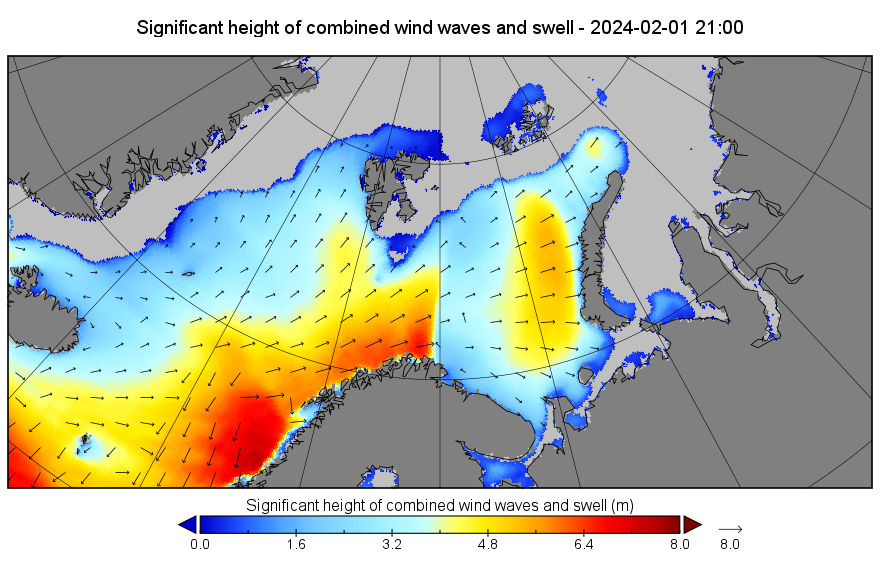
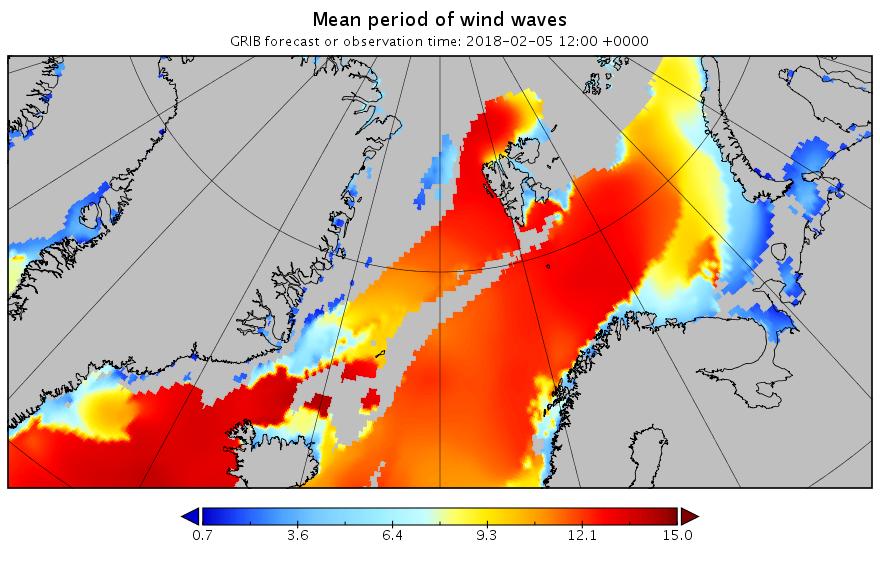
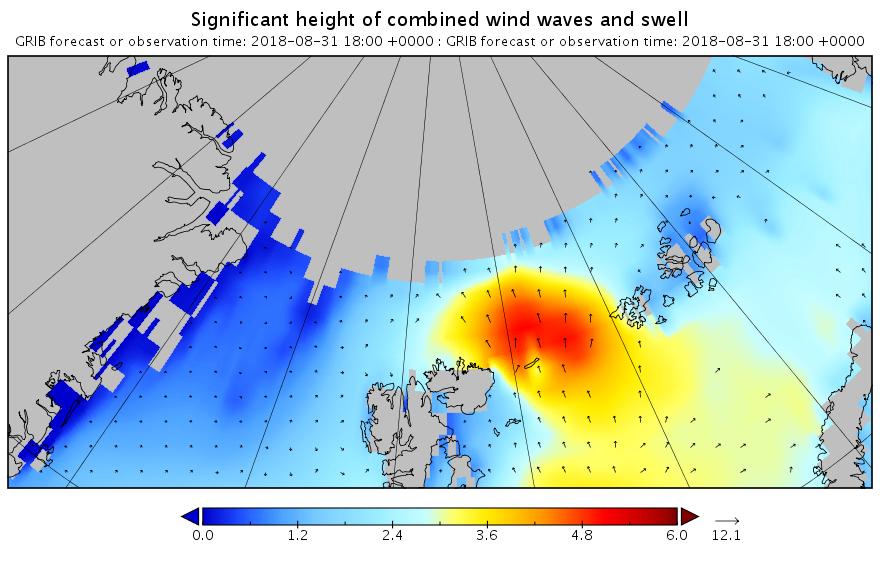
The latest wave forecast for tomorrow evening isn’t as extreme as 3 days ago. Note the change in the significant height scale:

Significant_height_of_combined_w in multi_1.glo_30mext.20180830-06Z_00013

Mean_period_of_swell_waves_order in multi_1.glo_30mext.20180830-06Z_00013

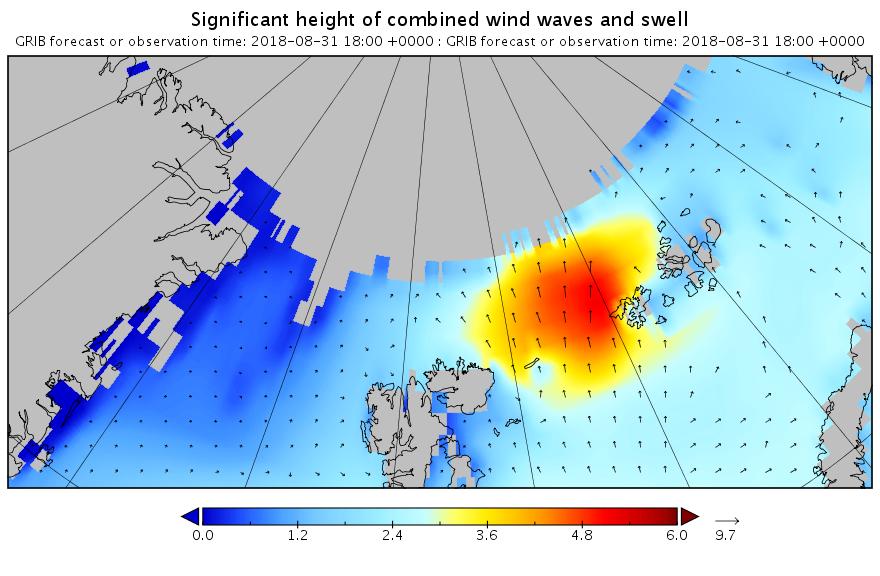
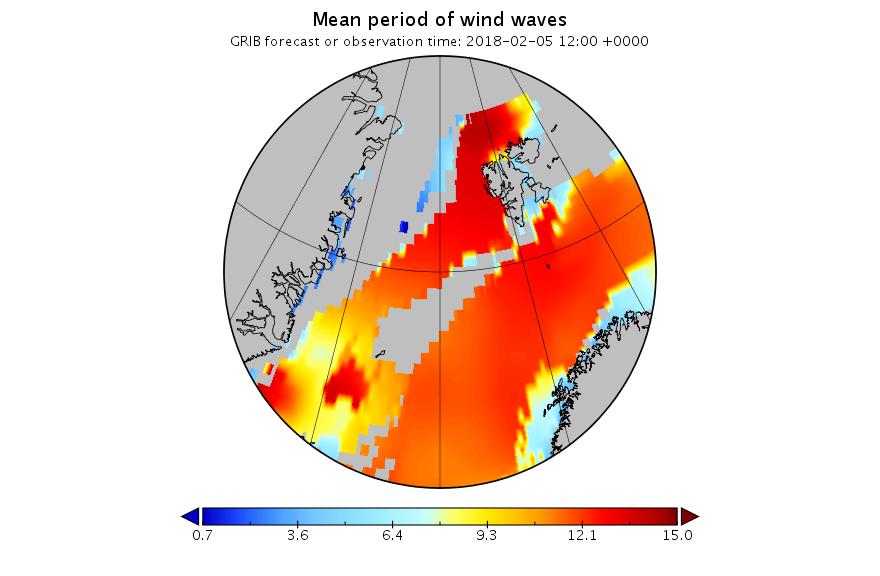
Nonetheless the height and period are still very significant!


[Edit – August 31st]

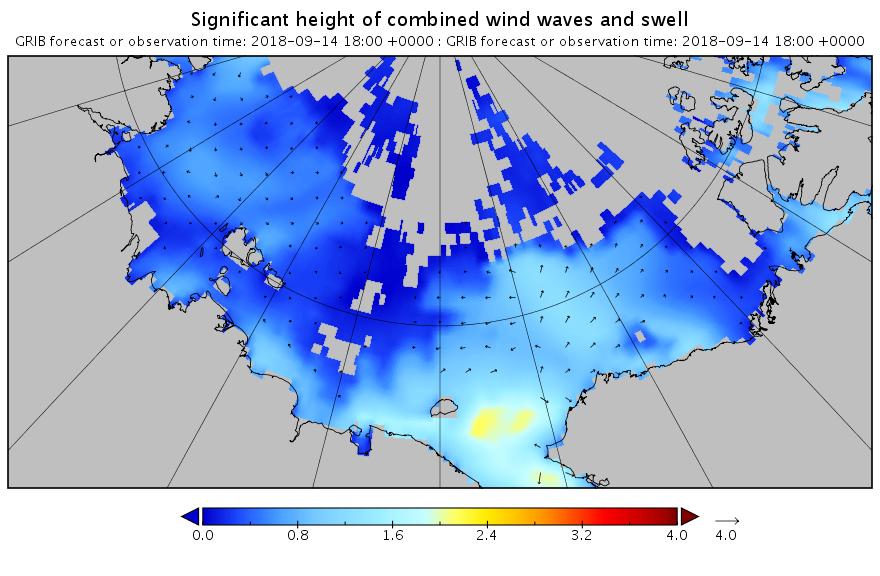
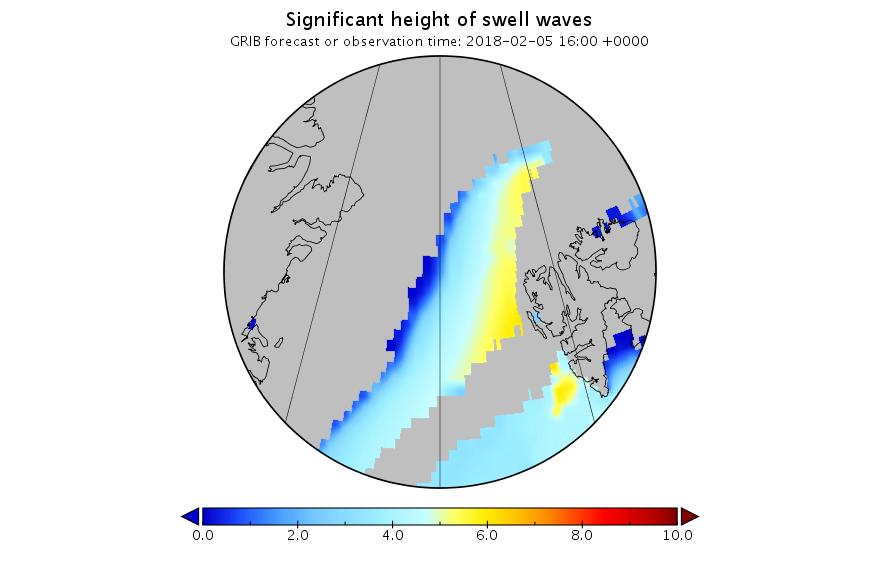
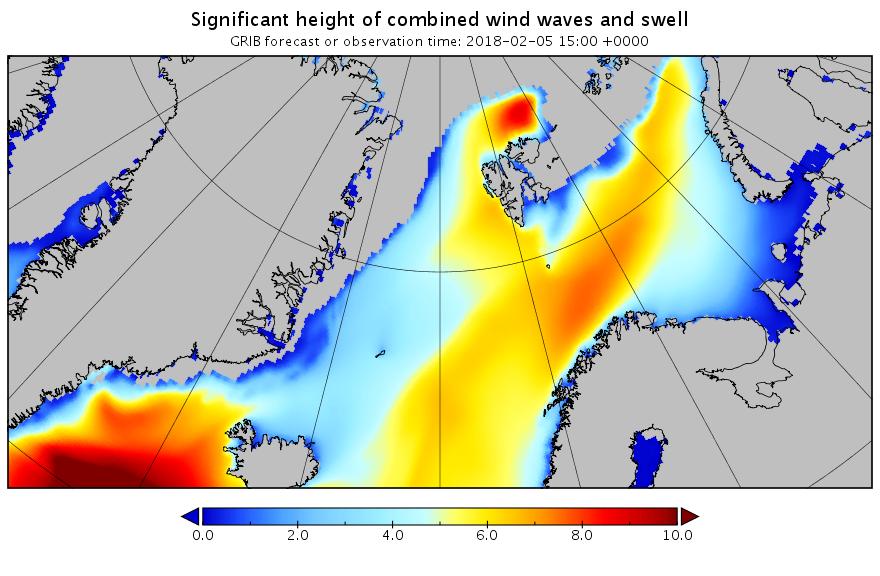
Here’s the latest forecast for 6 PM this evening (UTC):

Significant_height_of_combined_w in multi_1.glo_30mext.20180831_00007

Mean_period_of_swell_waves_order in multi_1.glo_30mext.20180831_00007

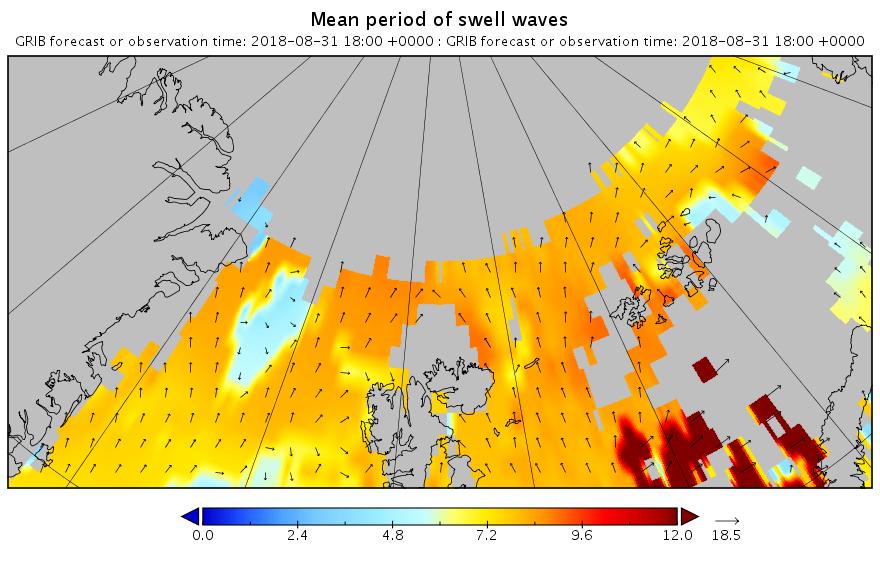
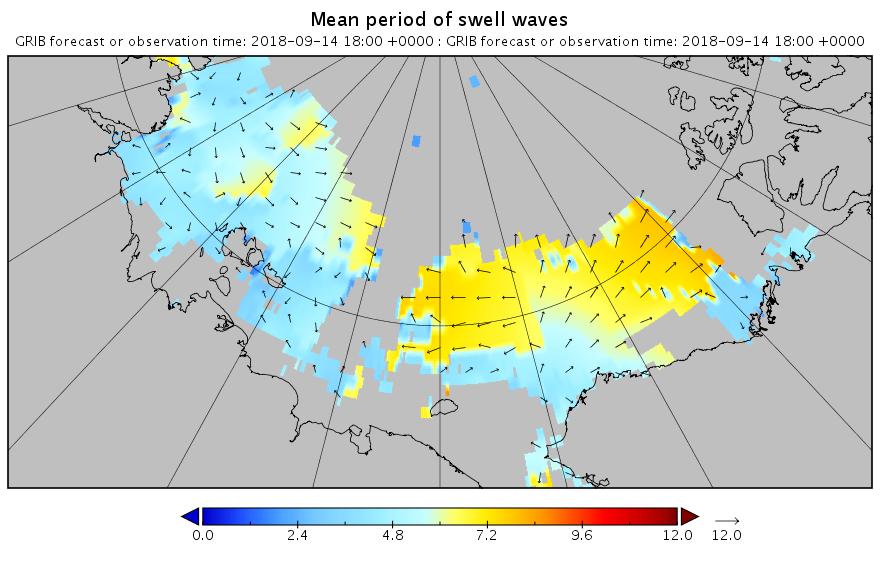
Note how the open water across almost the entire map is full of what in the Arctic counts as a long period swell. That means that the forecast for 2 days later looks like this:

Mean_period_of_swell_waves_order in multi_1.glo_30mext.20180831_00023

Significant_height_of_combined_w in multi_1.glo_30mext.20180831_00023

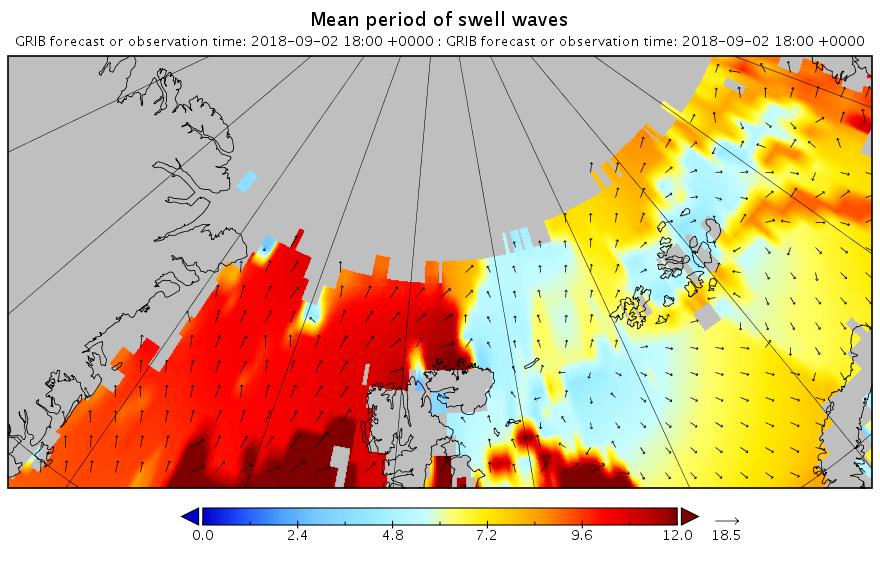
Less height but with a longer period. All of which means that the sea ice north of the Atlantic Ocean isn’t about to receive a short sharp shock. It has a sustained battering lasting several days to look forward to.


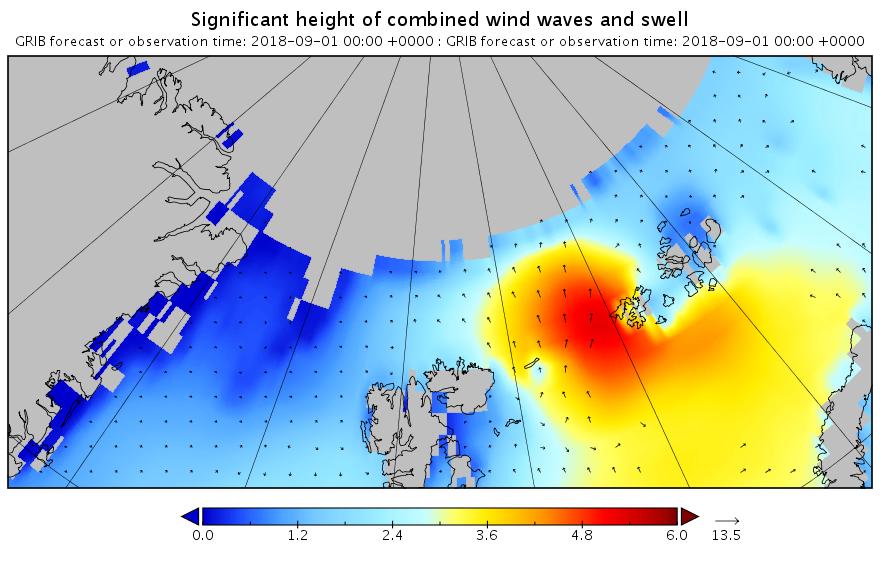
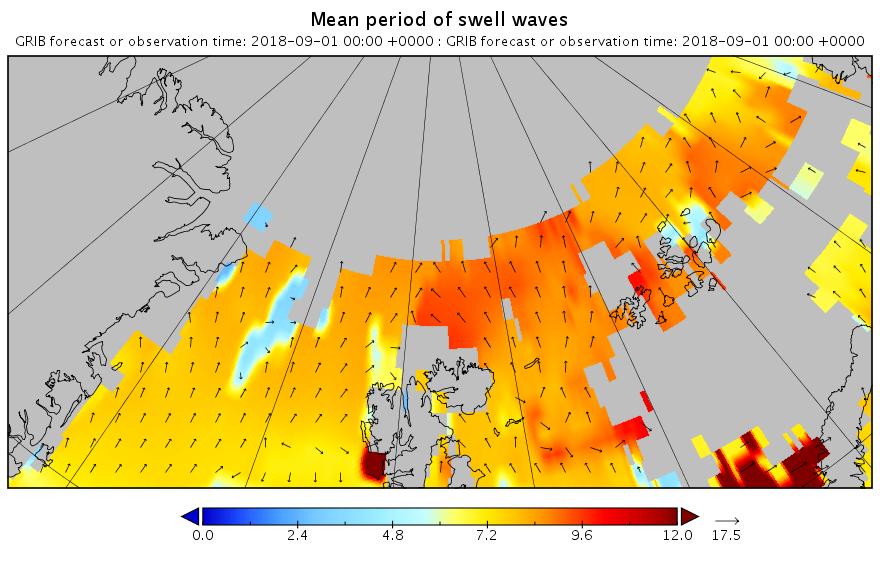
[Edit – September 1st]

The barrage of assorted swells has begun. Here’s the “hindcast” from midnight last night UTC:

Significant_height_of_combined_w in multi_1.glo_30mext.20180901_00001

Mean_period_of_swell_waves_order in multi_1.glo_30mext.20180901_00001

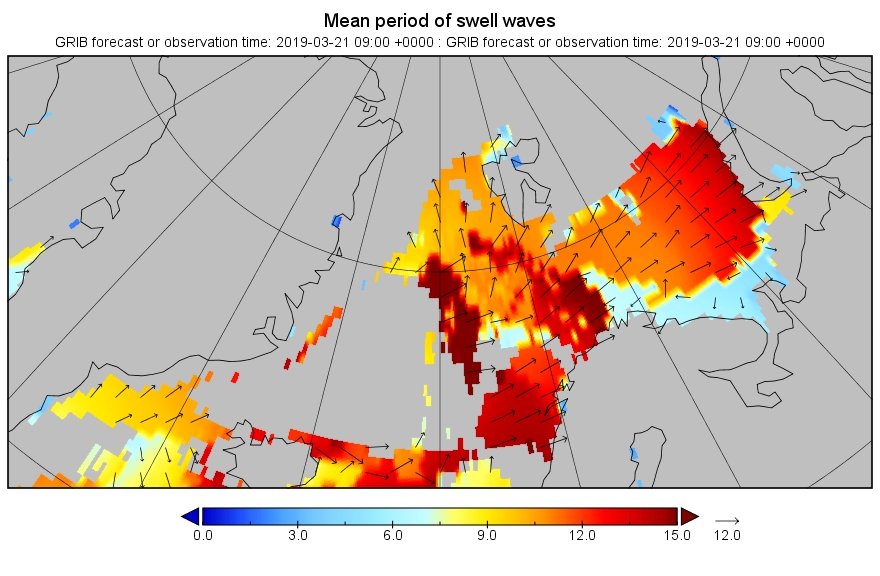
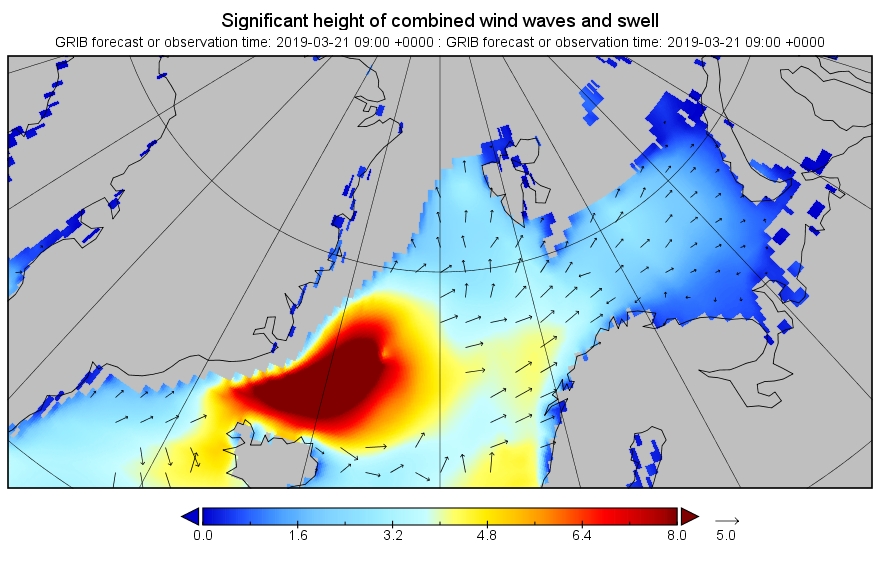
Now lets take a look at tomorrow’s forecast for the Laptev Sea. This is for 09:00 UTC:

Significant_height_of_combined_Laptev.20180901_00012

Mean_period_of_swell_waves_Laptev.20180901_00012

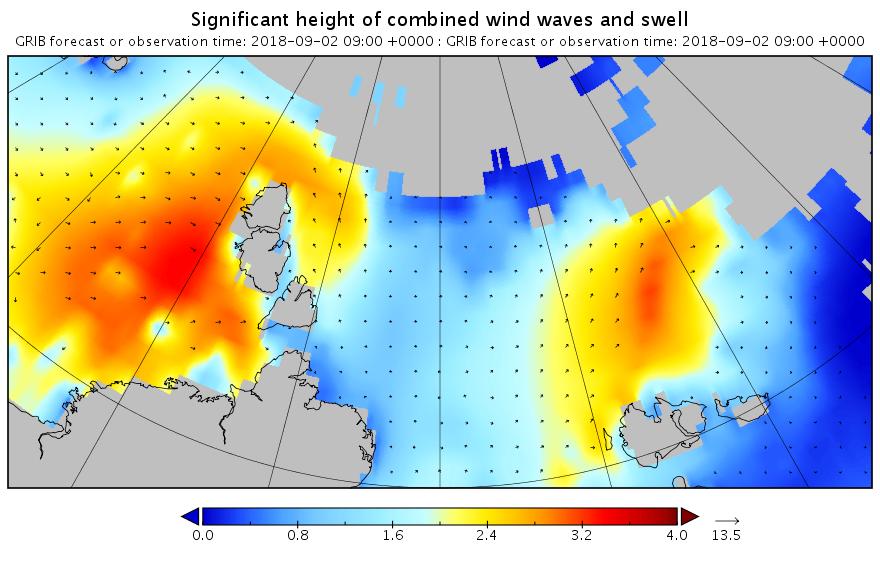
Note once again the change of scale on the wave/swell height map. Nevertheless a 3+ meter swell heading over into the East Siberian Sea isn’t something you see every day.

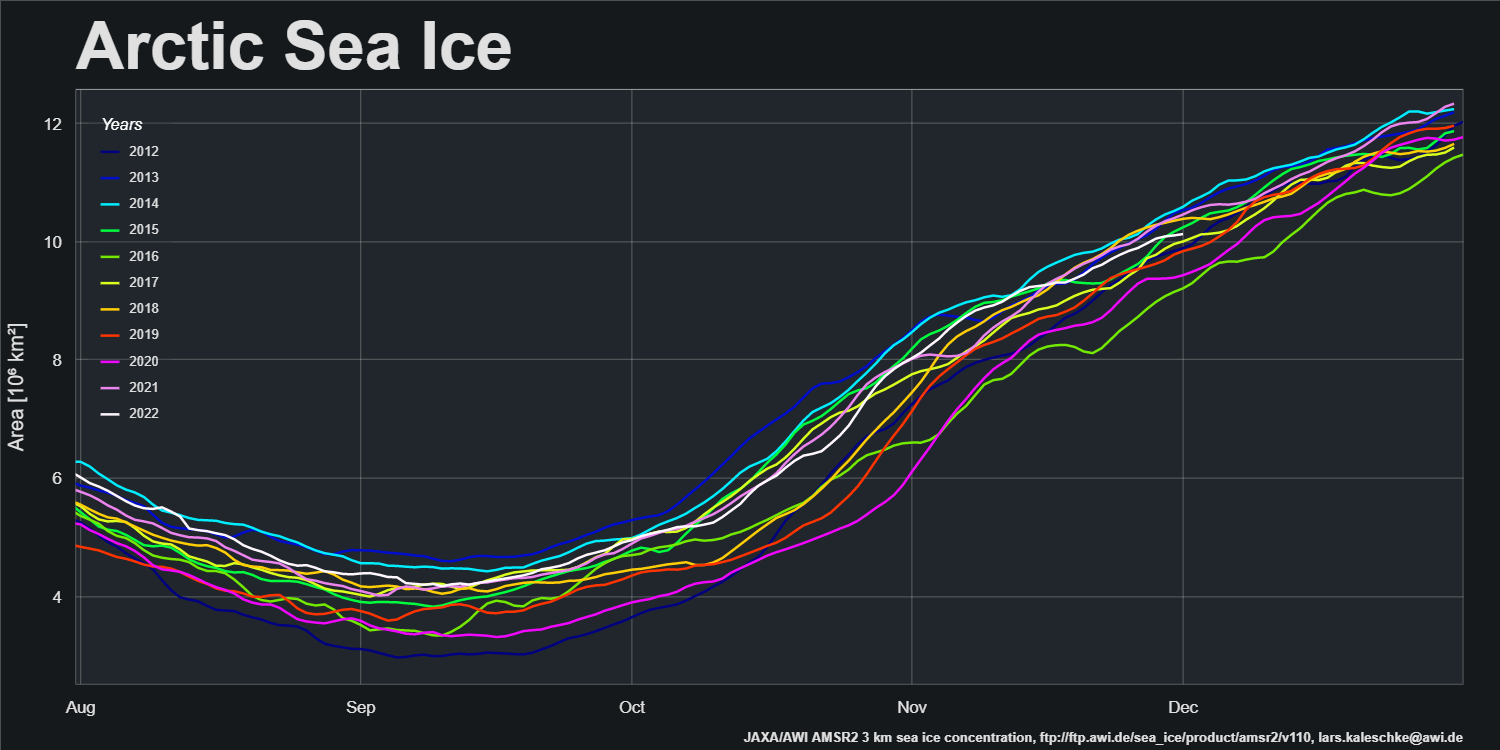
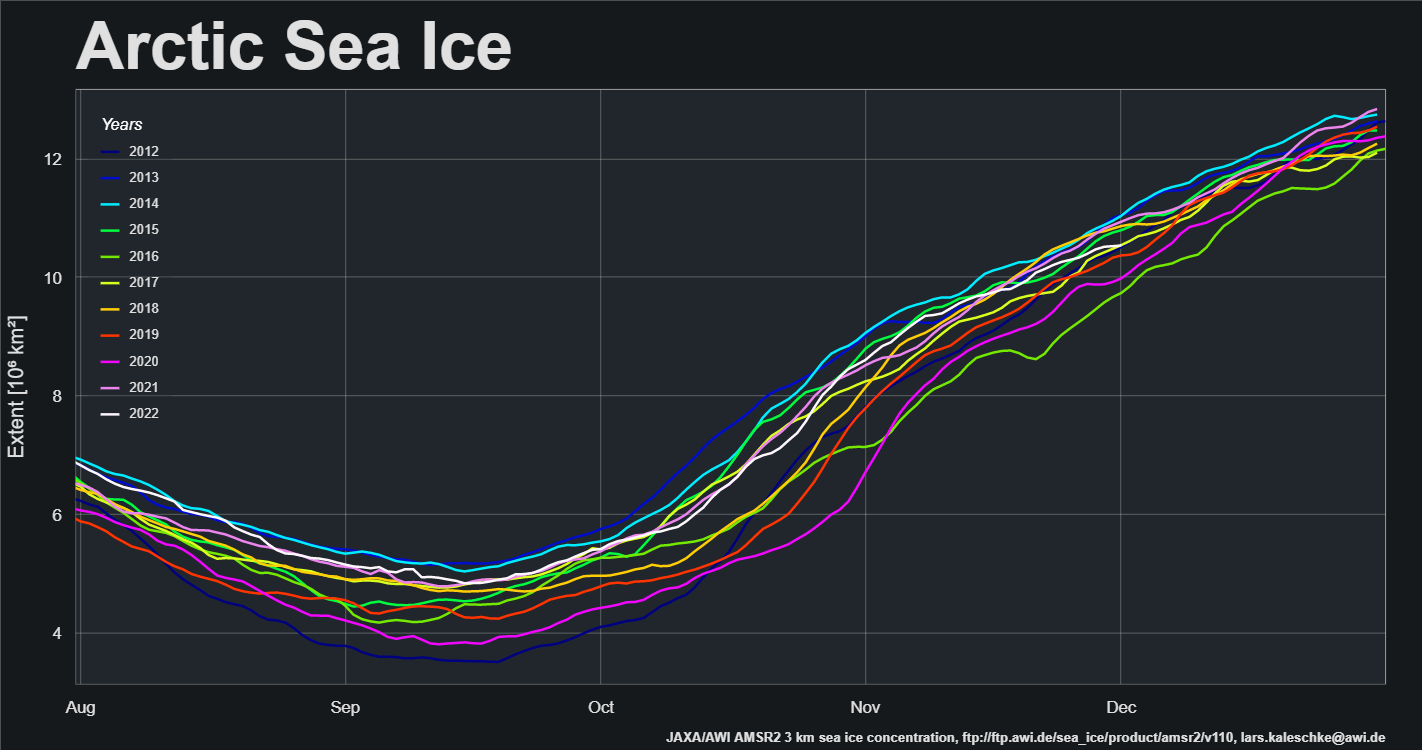
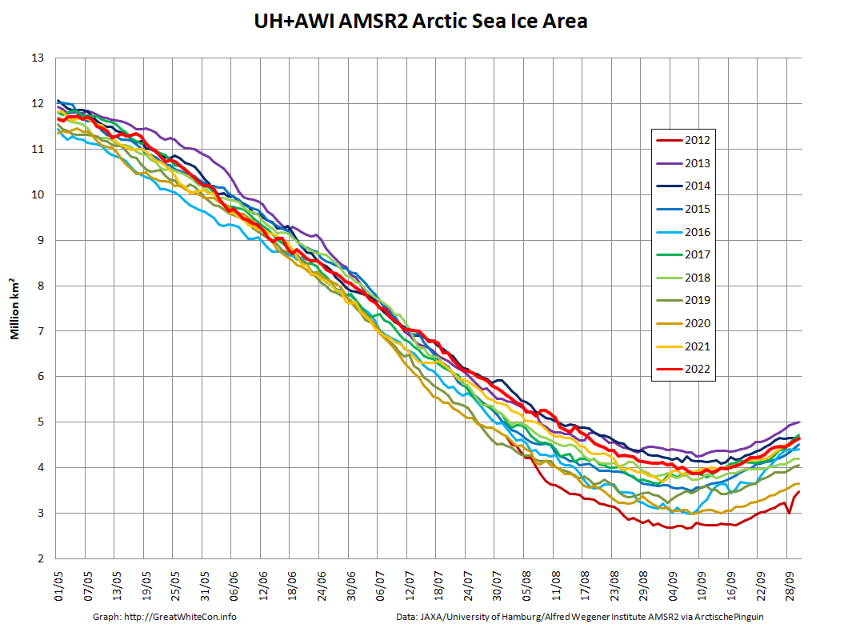
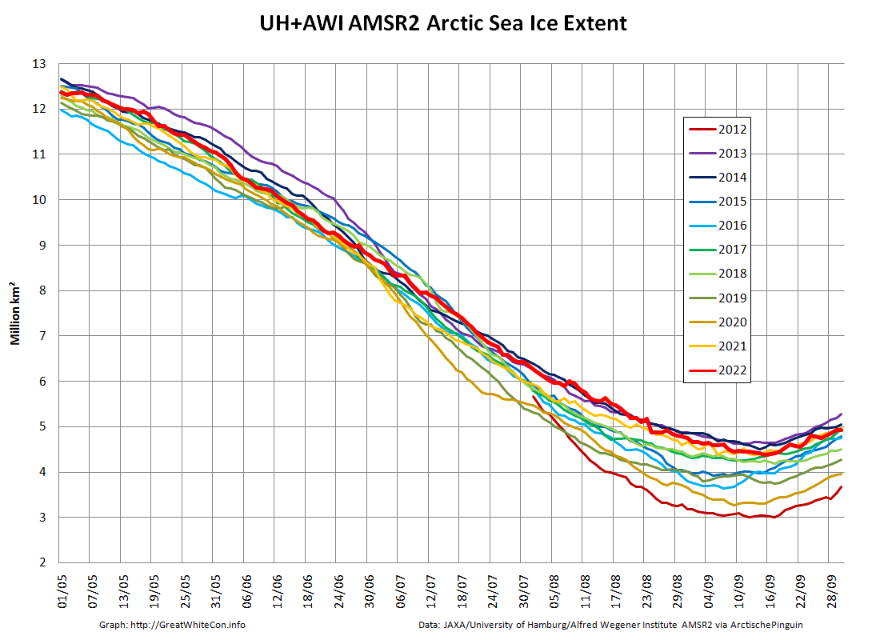
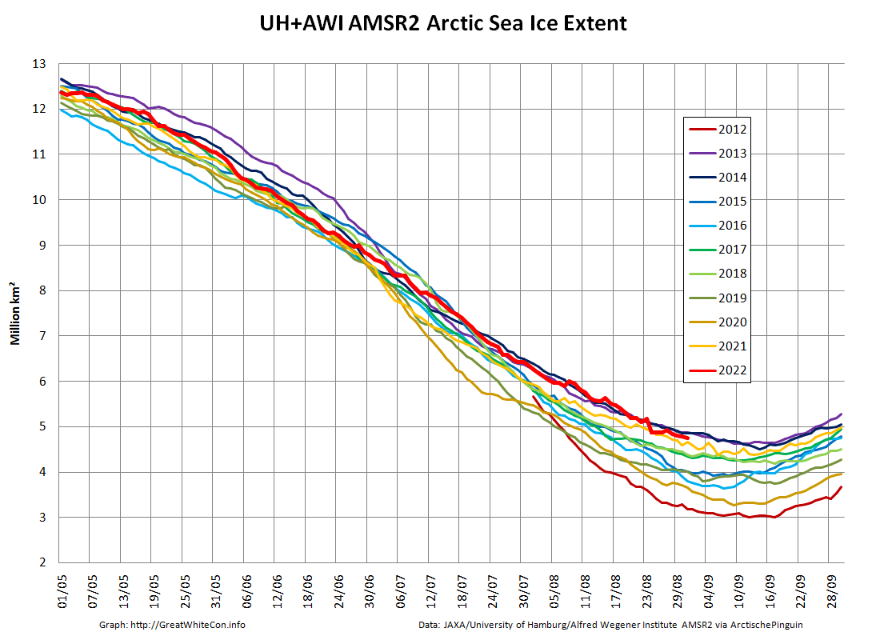
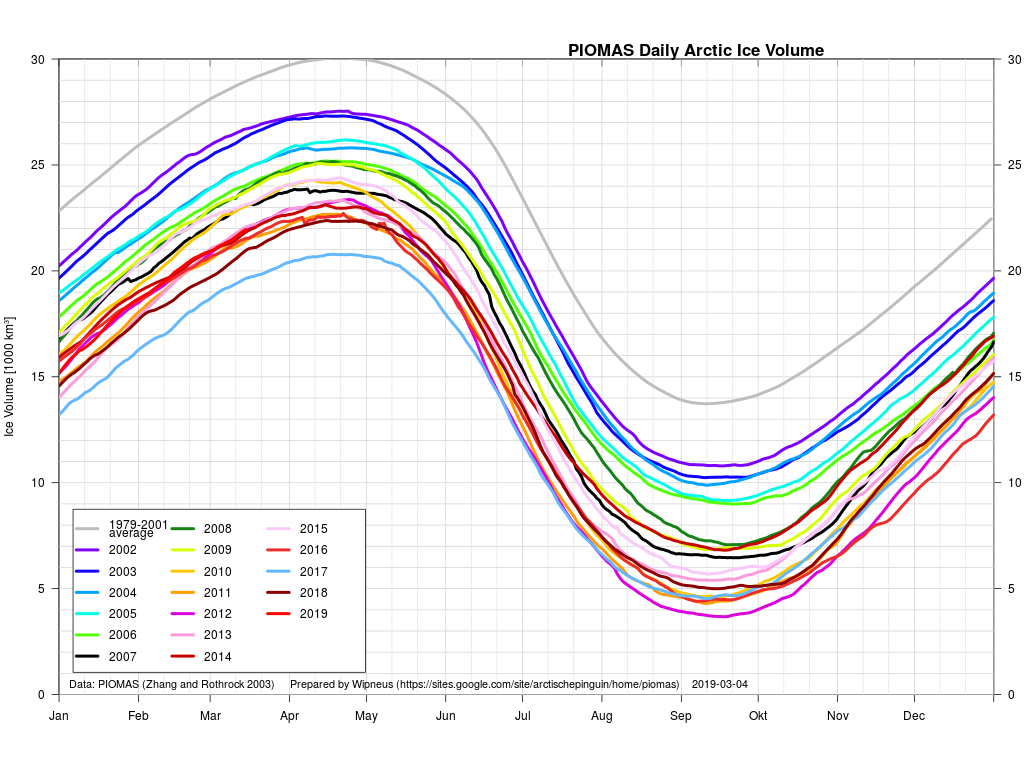
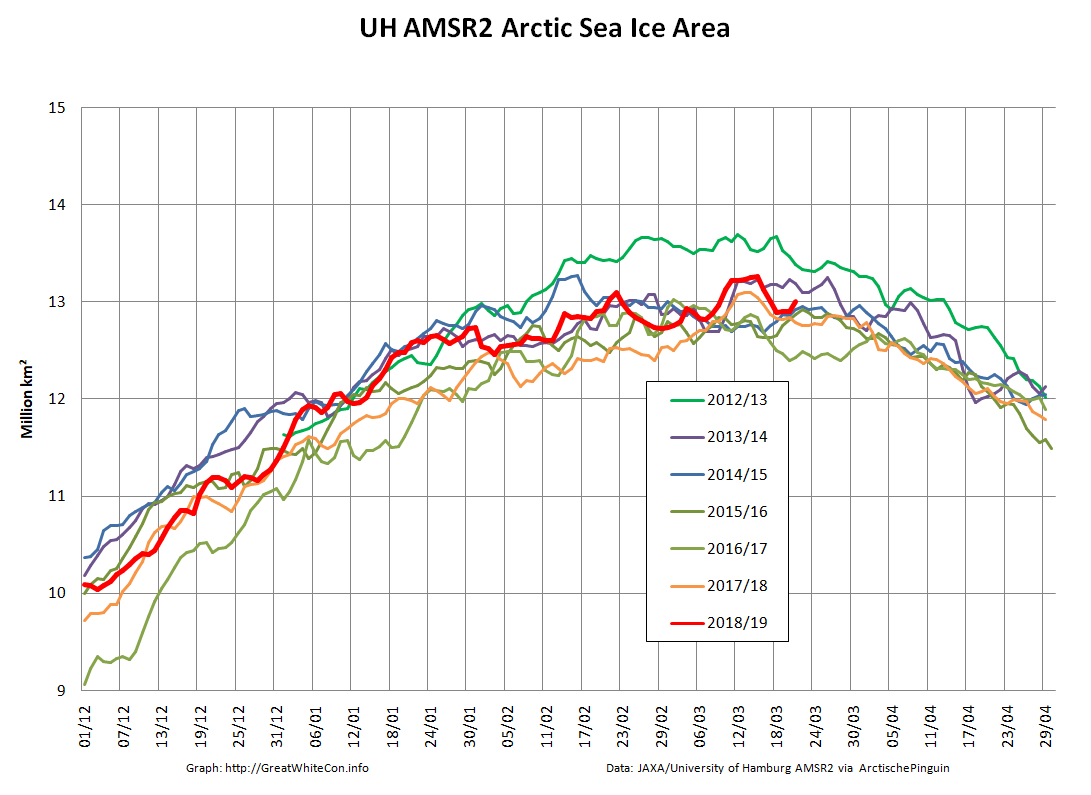
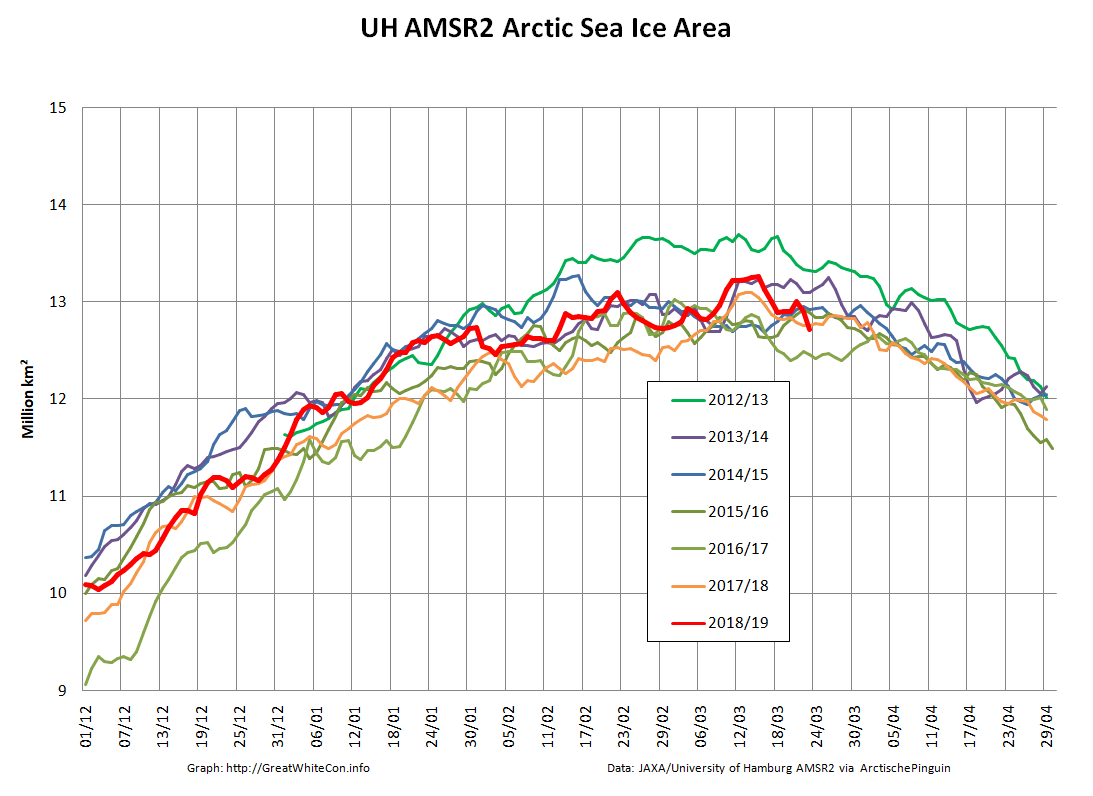
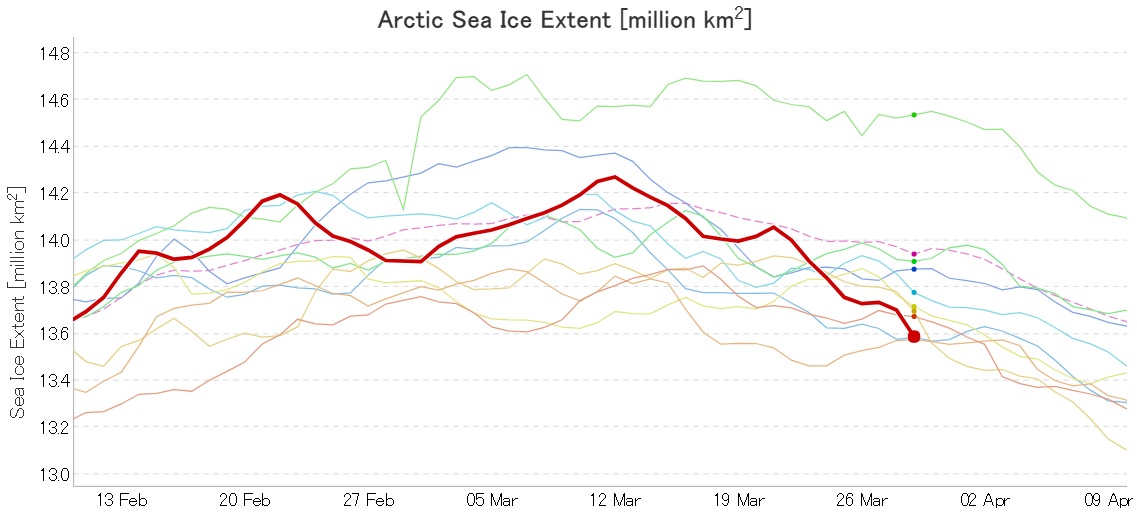
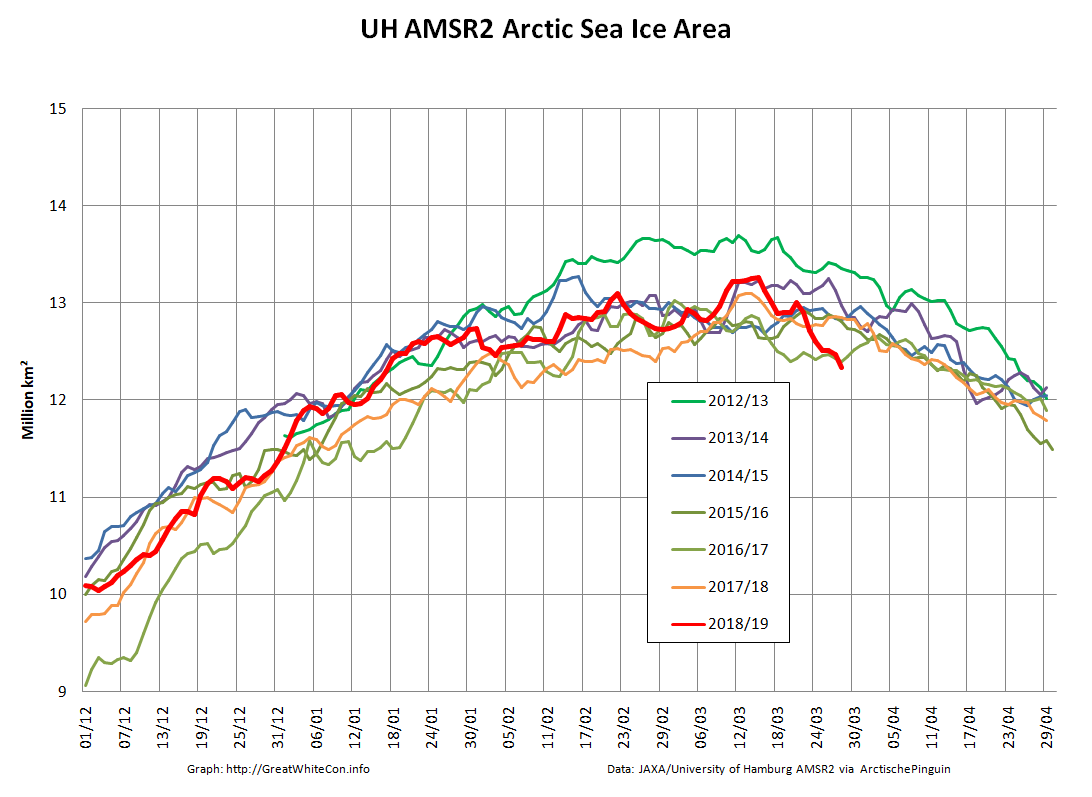
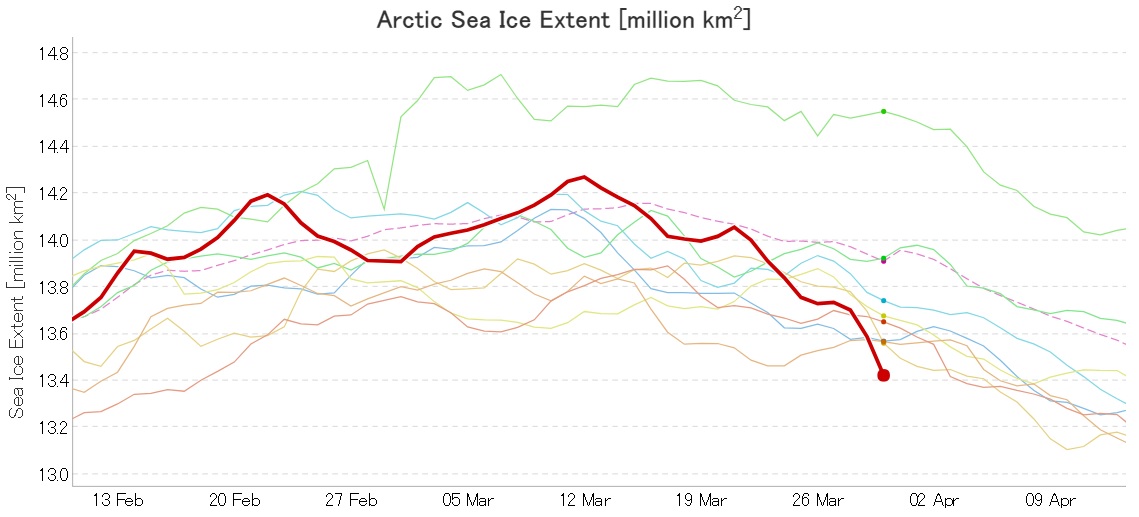
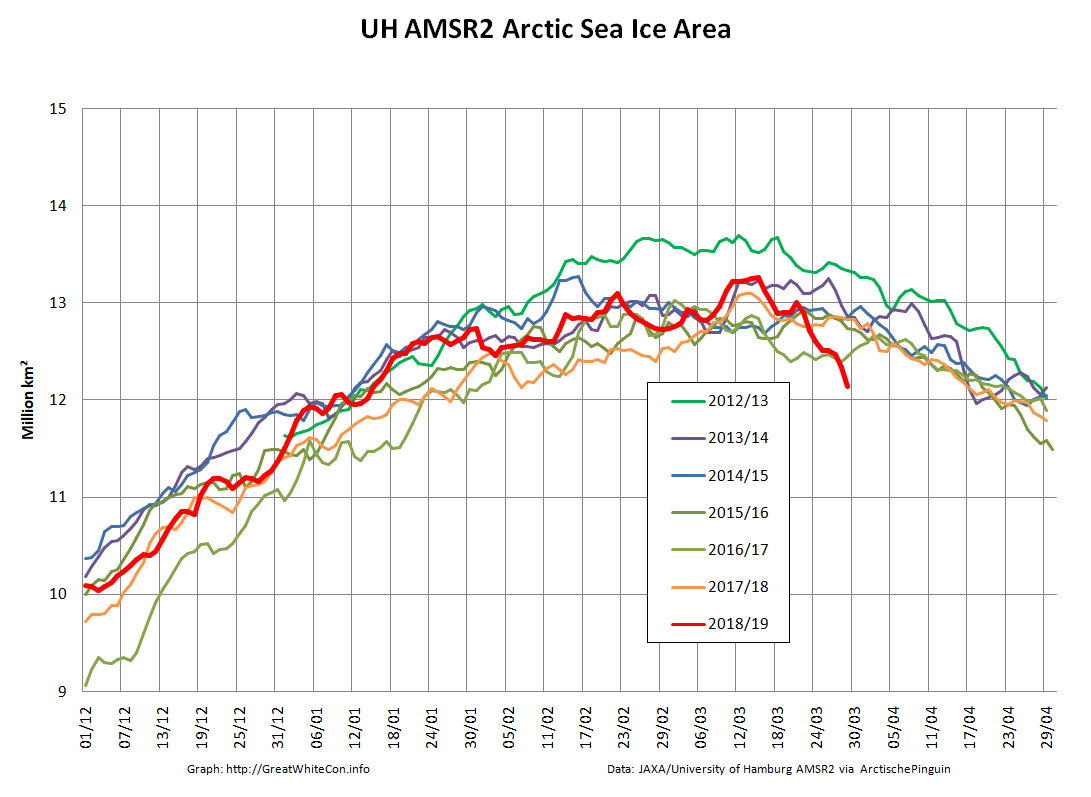
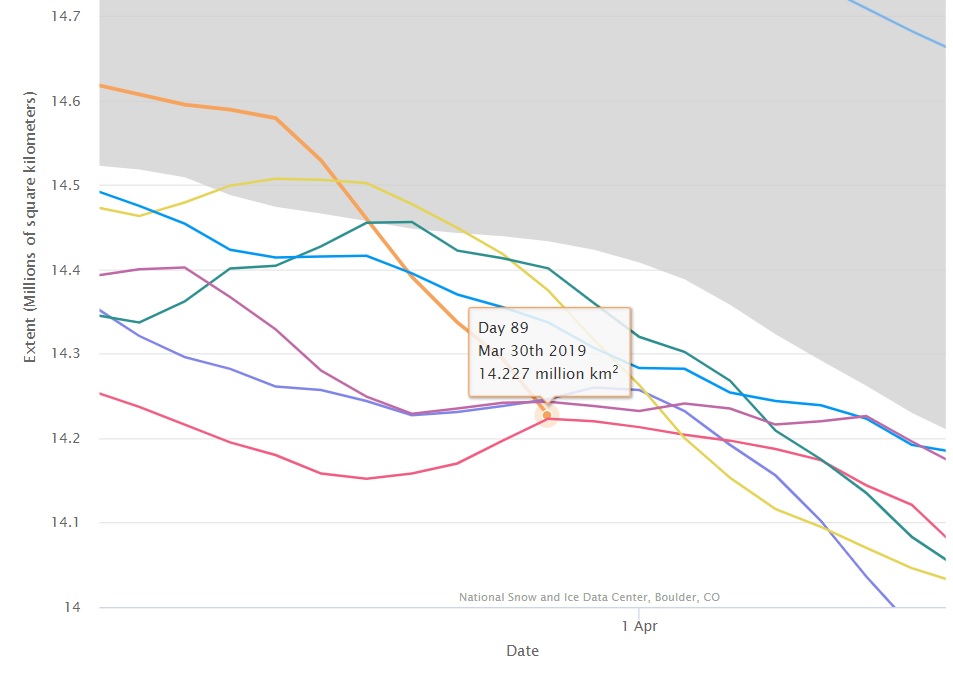
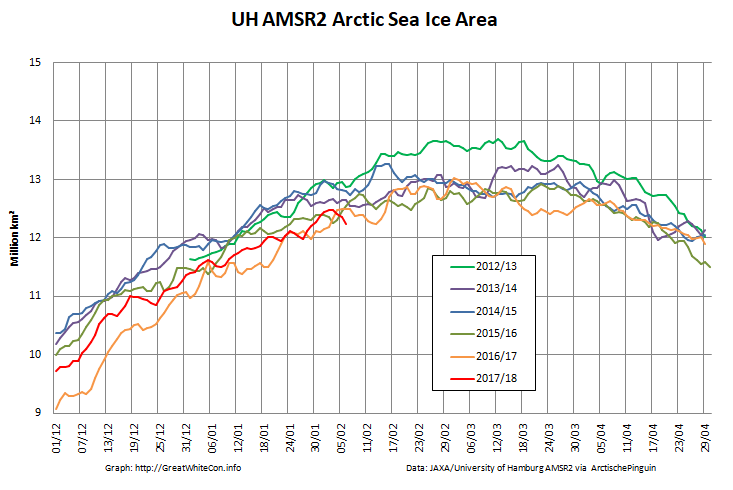
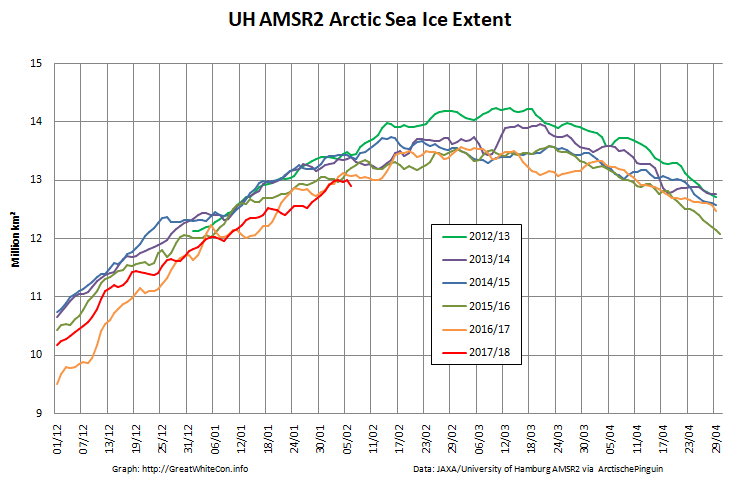
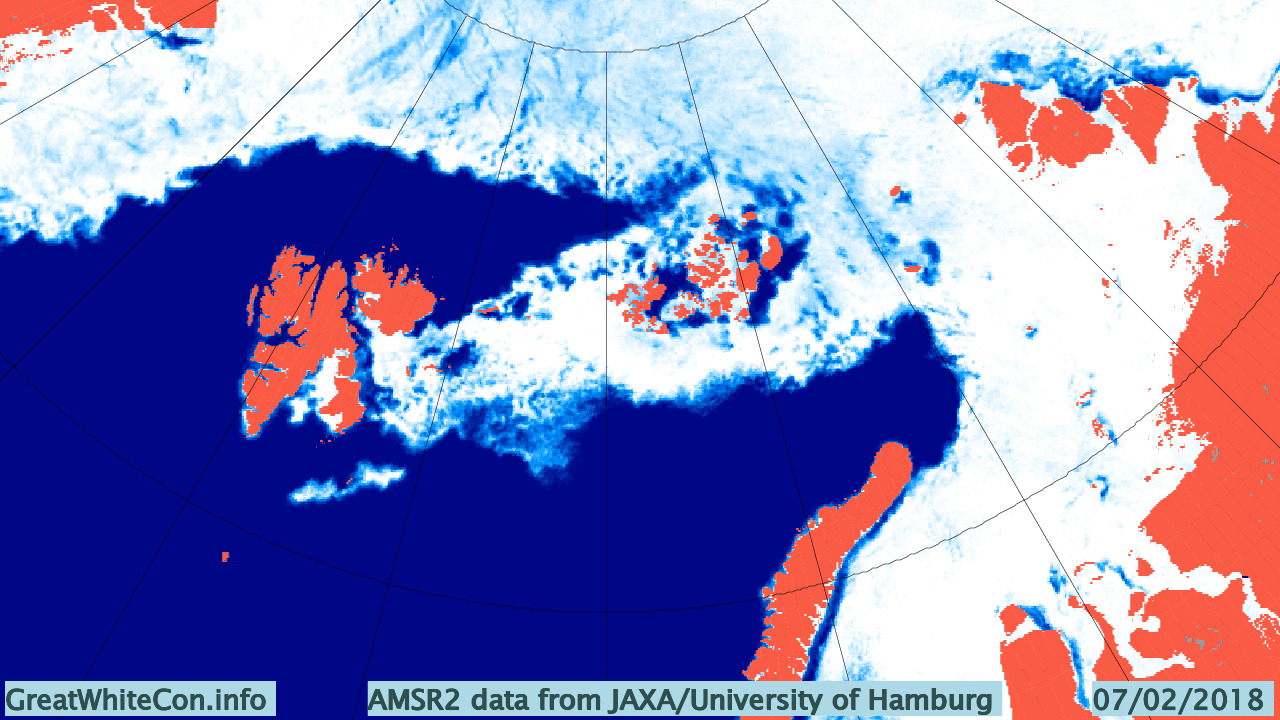
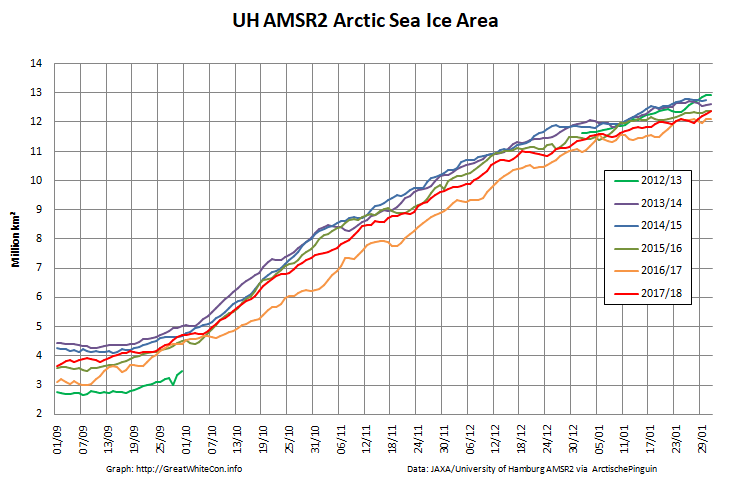
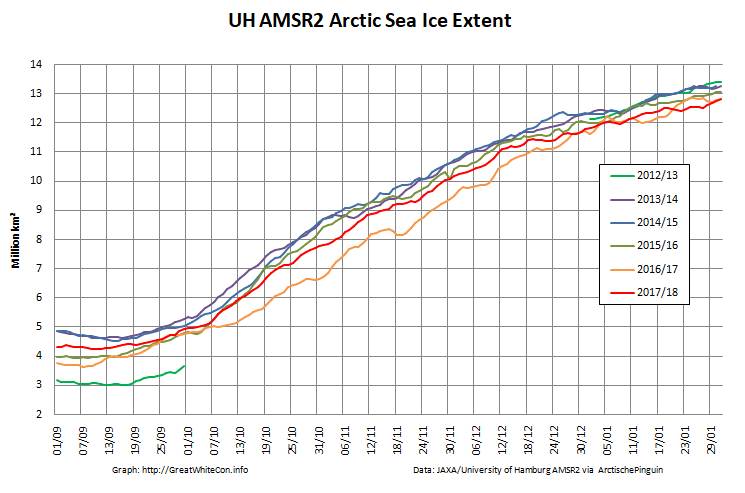
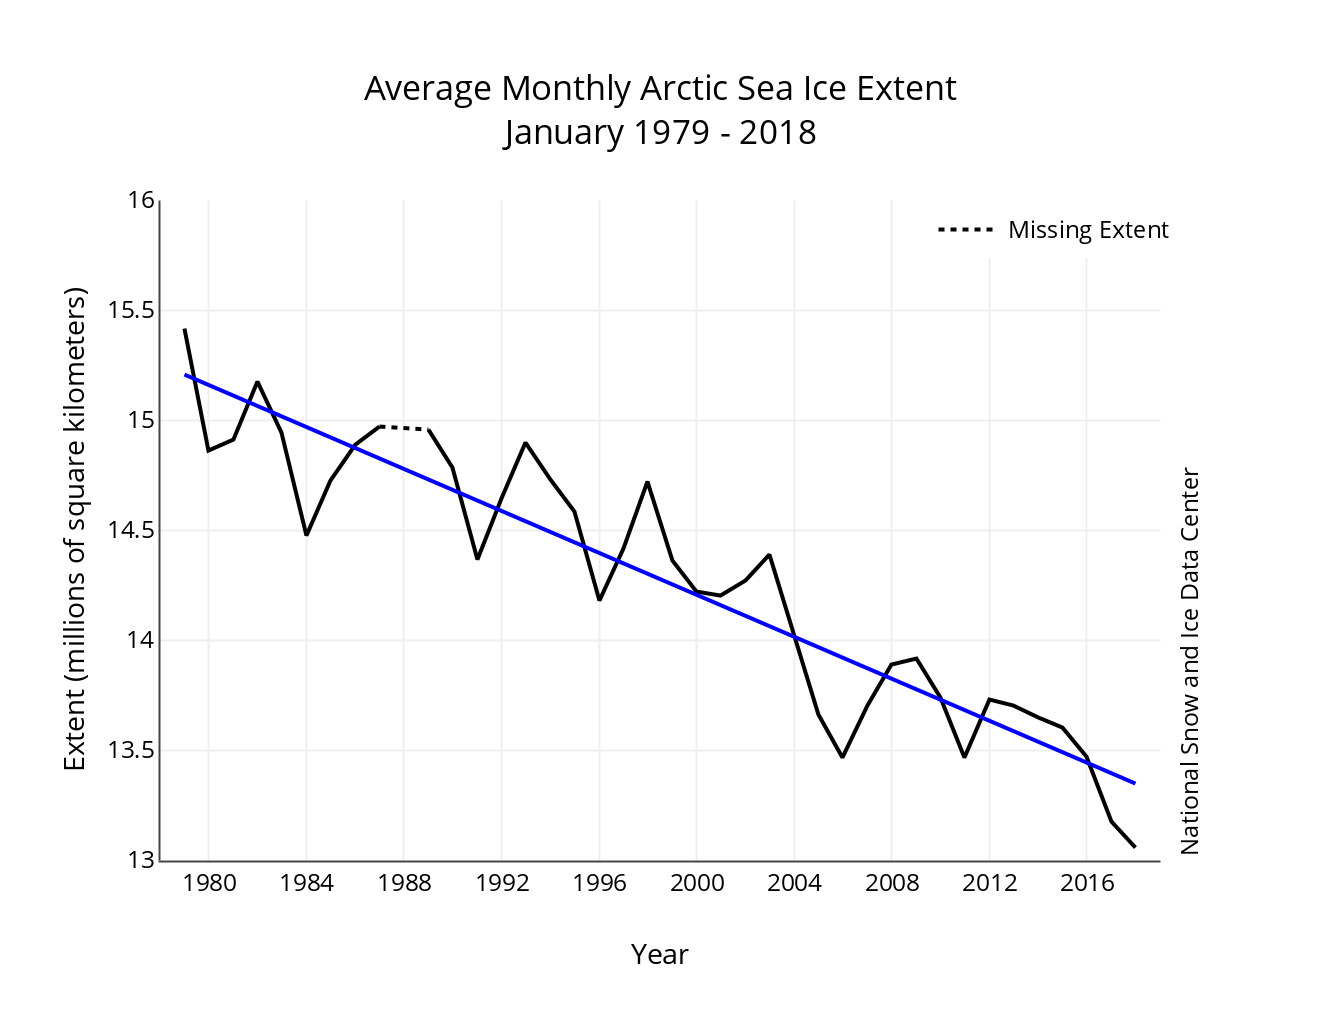
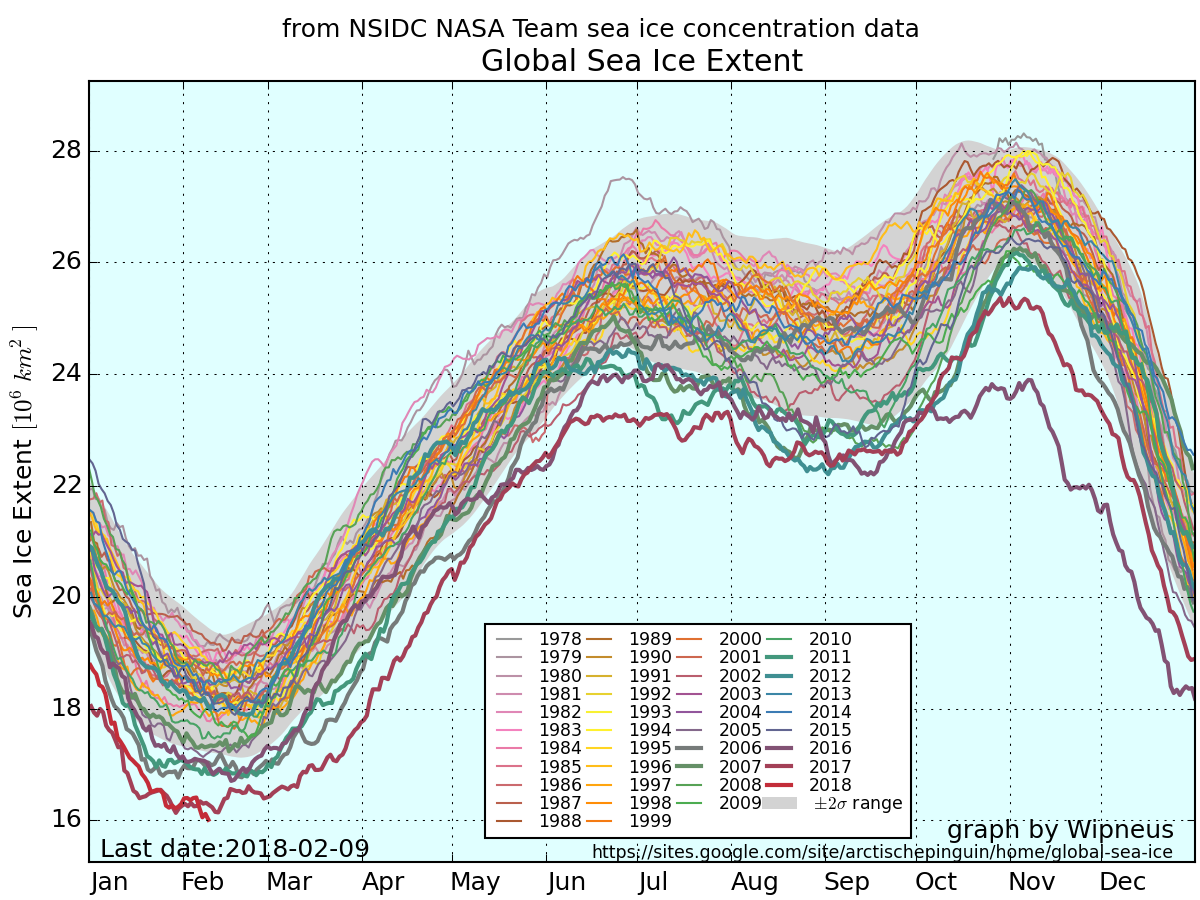
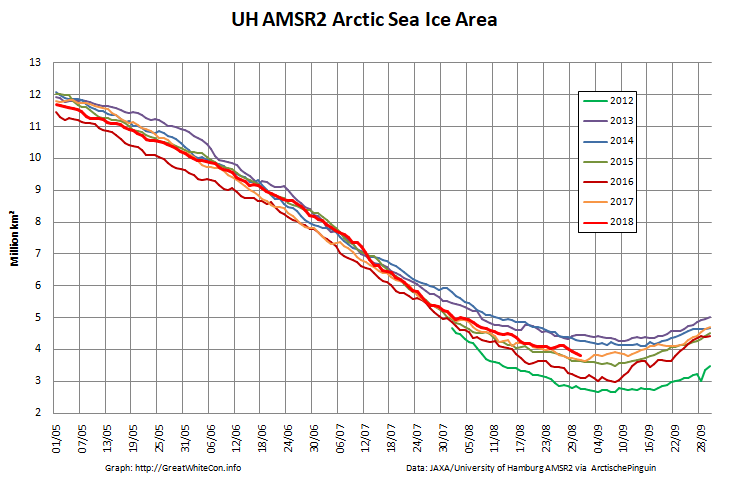
Now were into September the 2018 annual minimum extent can’t be too far away. Extent decline appears to have stalled. However “high res” AMSR2 area is currently falling fast, for the time of year at least:

Arctic-Area-2018-08-31


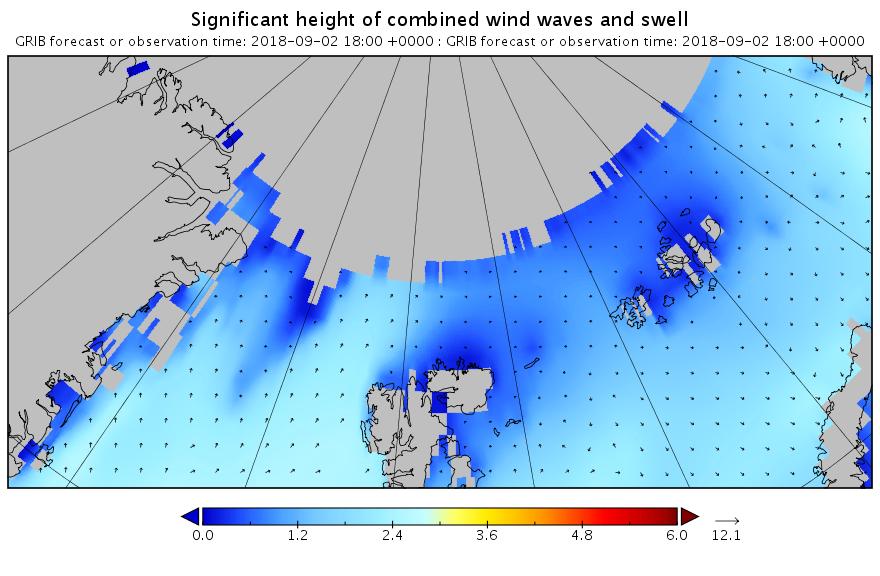
[Edit – September 2nd]

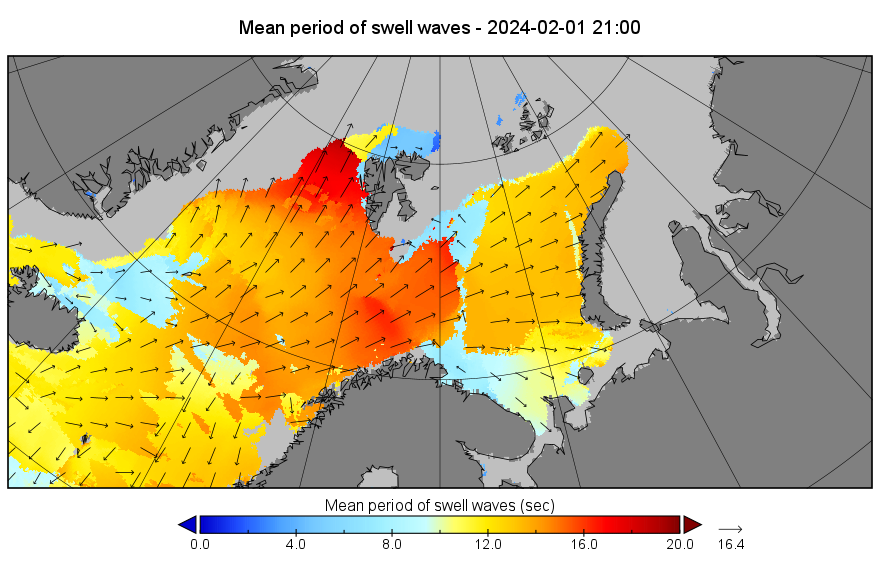
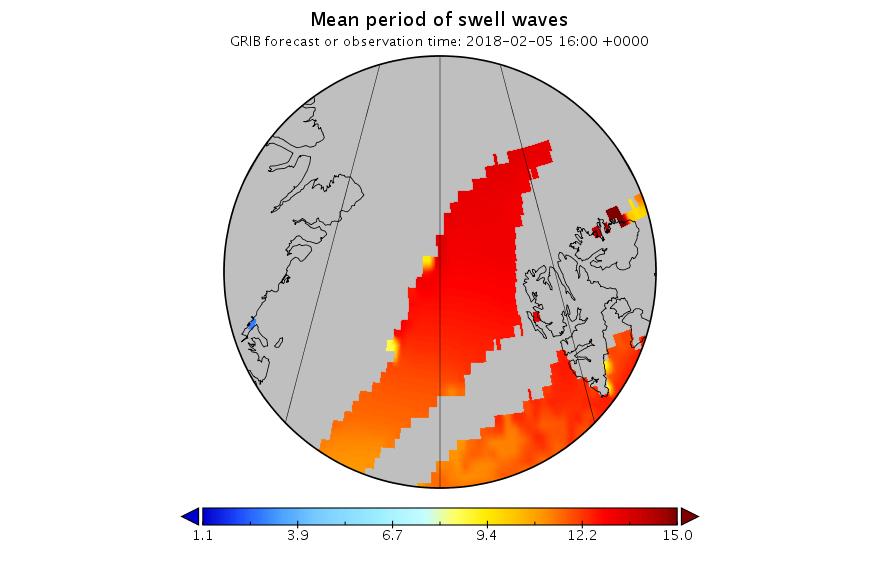
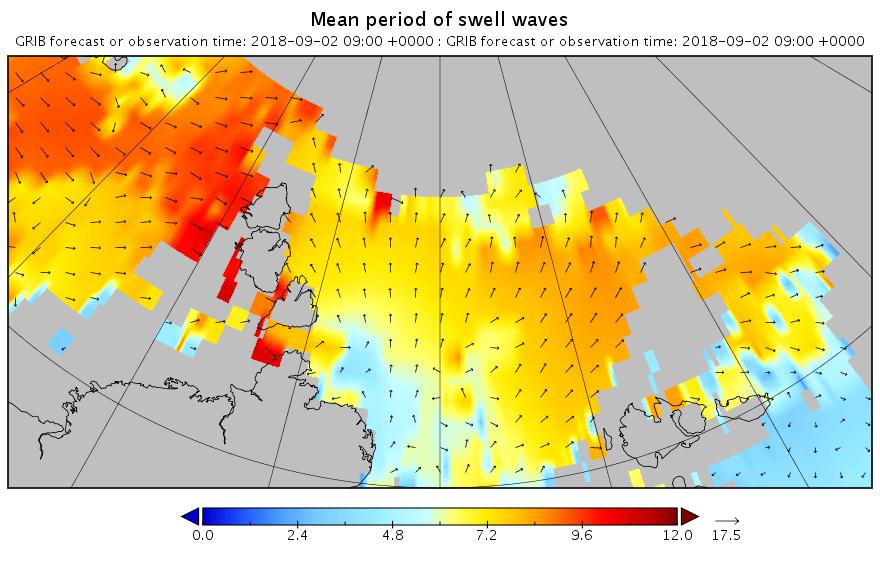
Here are the swell and period forecasts at midnight for round about now, 09:00 UTC:

Significant_height_of_combined_Laptev.20180902_00004

Mean_period_of_swell_waves_Laptev.20180902_00004

Significant_height_of_combined_Barents.20180902_00004

Mean_period_of_swell_waves_Barents.20180902_00004

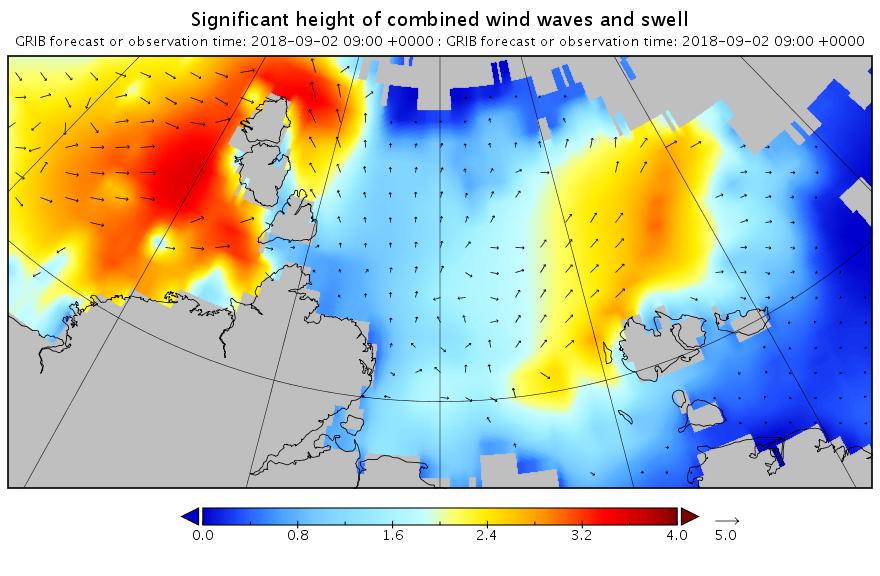
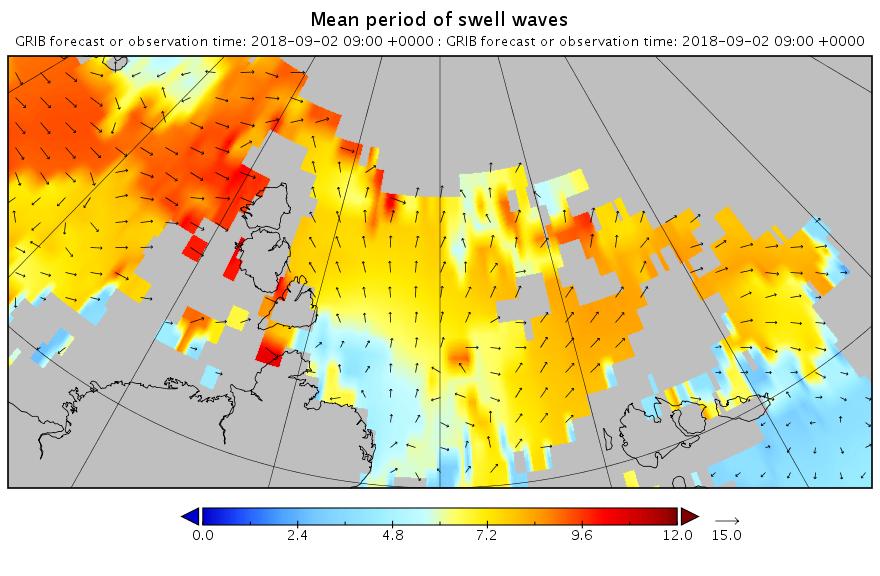
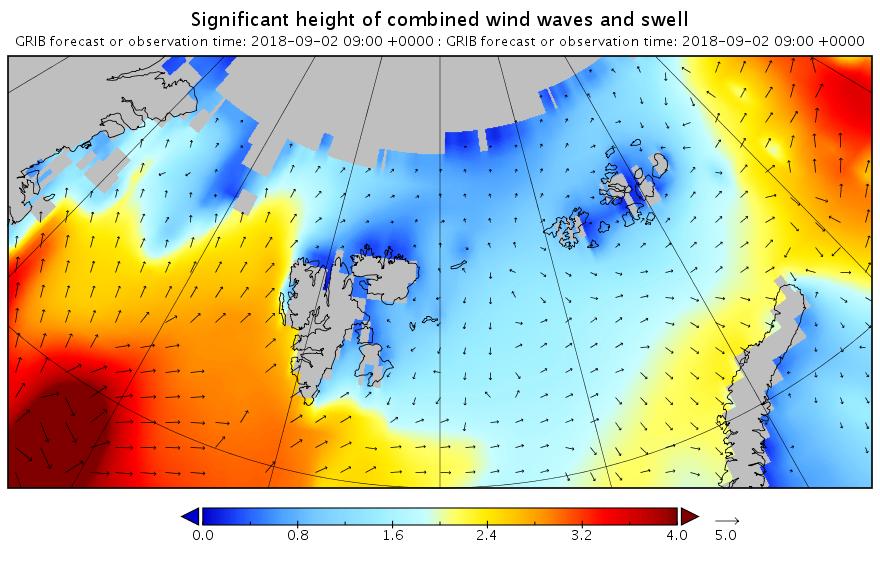
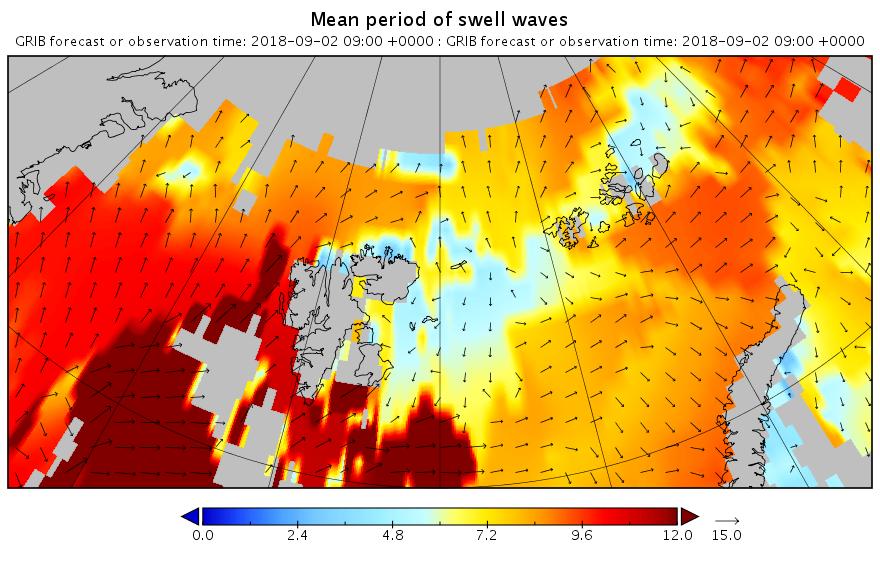
All the seas between Greenland and the New Siberian Islands are awash with swells with a period of 8 second or greater. This is most unusual, to put it mildly!


[Edit – September 3rd]

Here’s the WaveWatch III “hindcast” from midnight last night UTC for the Russian side of the Arctic Ocean:

Significant_height_of_combined_NSR.20180903_00001

Mean_period_of_swell_waves_NSR.20180903_00001

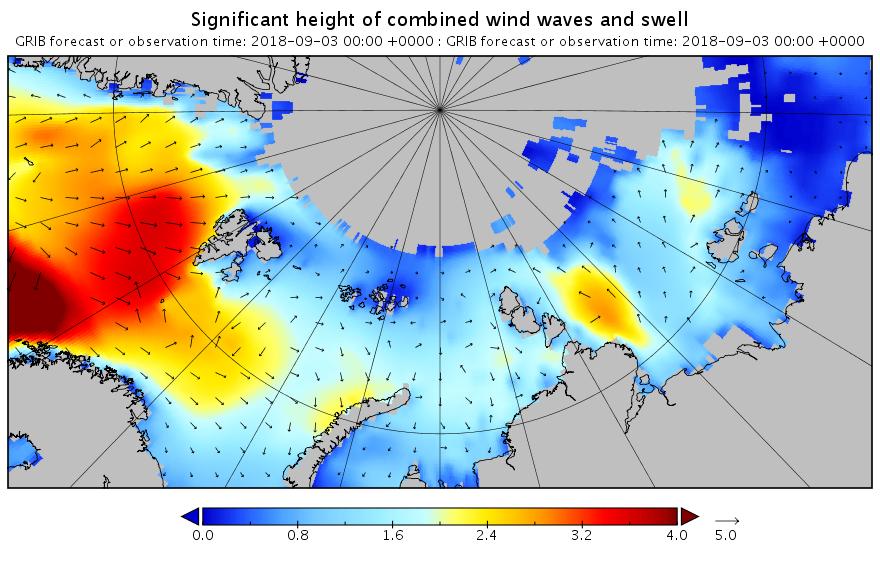
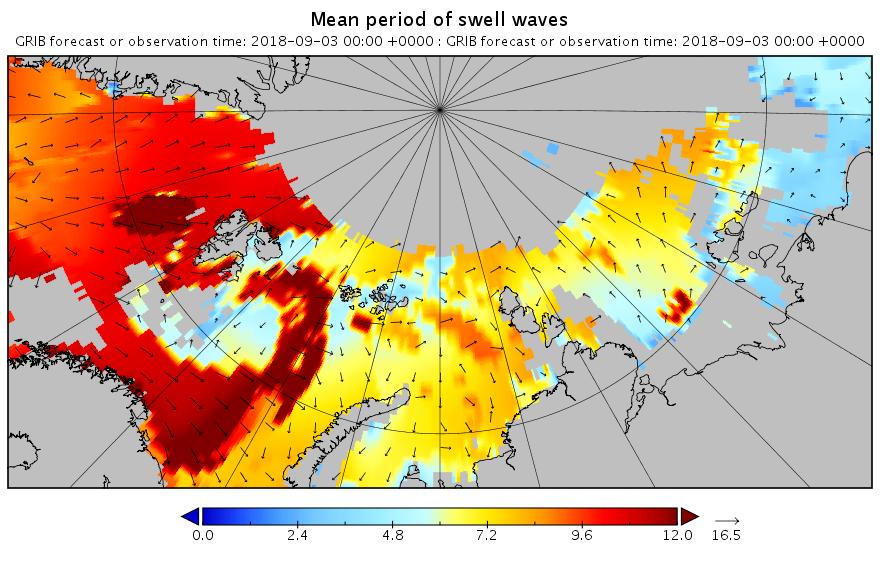
There are still significant swells almost everywhere you look.


[Edit – September 4th]

Using the same scales as yesterday, here’s today’s hindcast from midnight:

Significant_height_of_combined_w in multi_1.glo_30mext.20180904_00001

Mean_period_of_swell_waves_order in multi_1.glo_30mext.20180904_00001

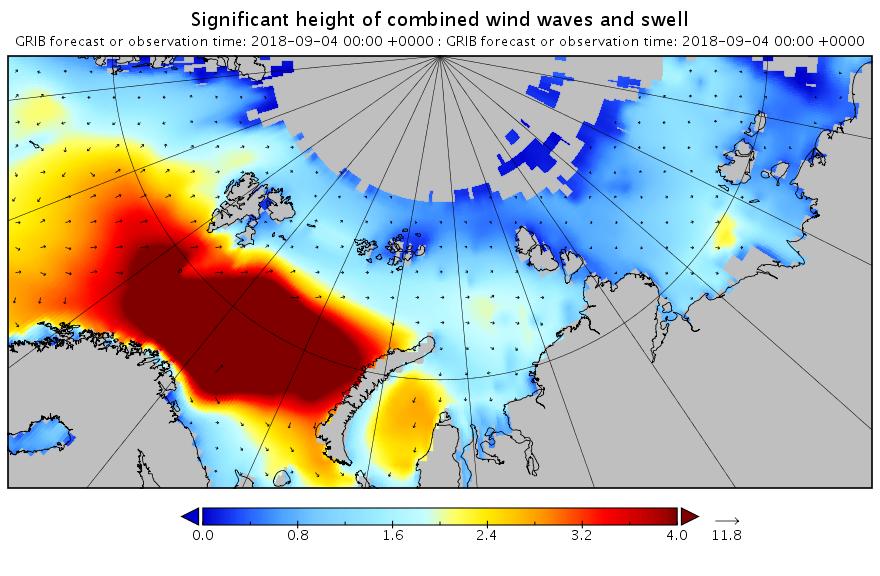
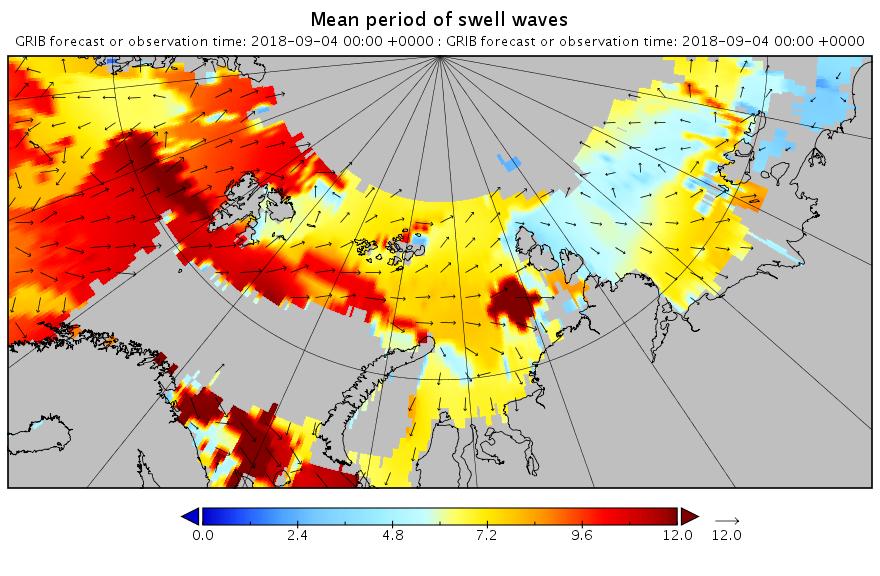
There’s still plenty of action in the Arctic Ocean!


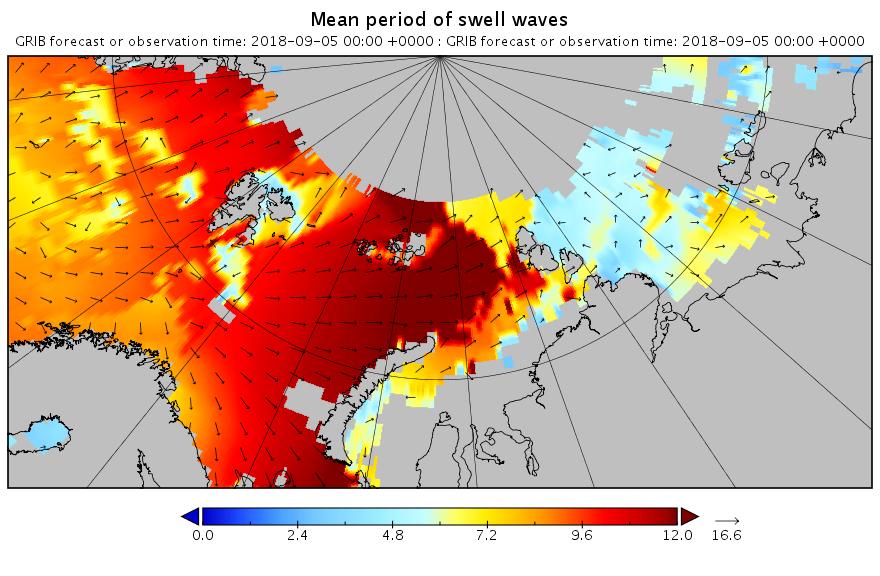
[Edit – September 5th]

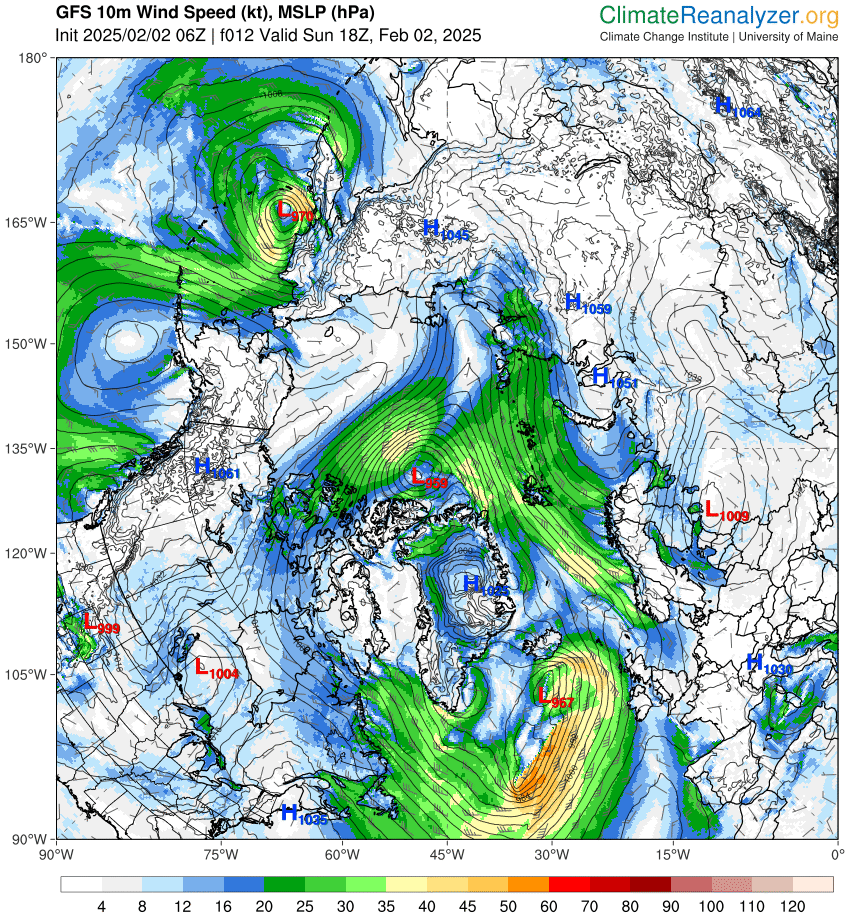
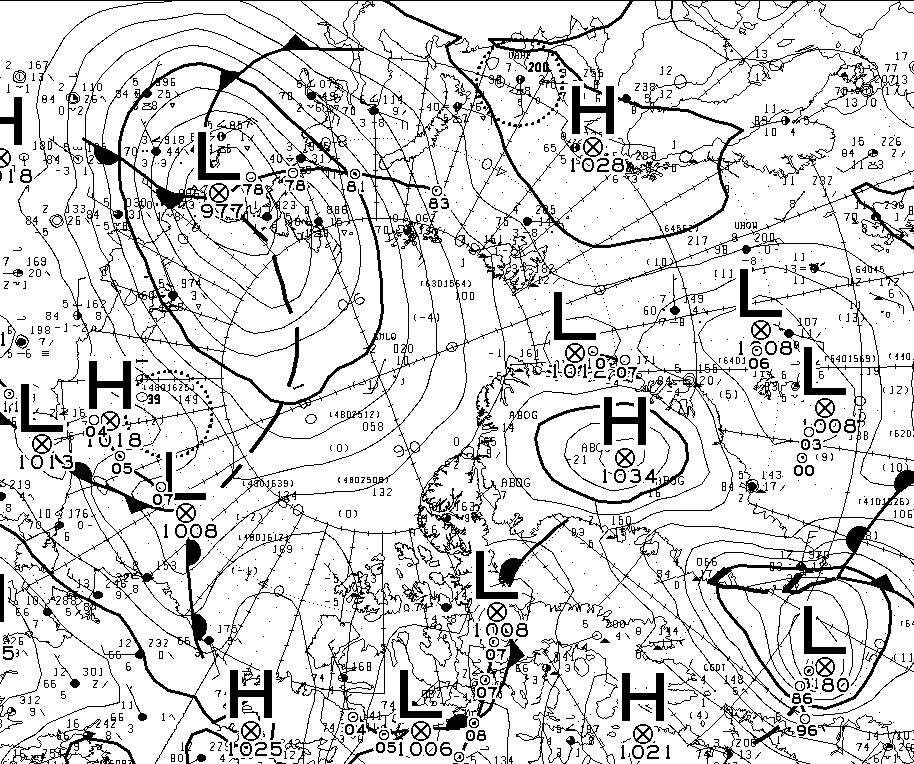
Feel free to debate whether it merits the “Great” prefix, but this is how the early September 2018 Arctic cyclone has panned out. According to this morning’s Environment Canada synopsis the cyclone is centred near the coast of the Laptev Sea and is down to a MSLP of 977 hPa:

CMC_SLP-20180905-00Z

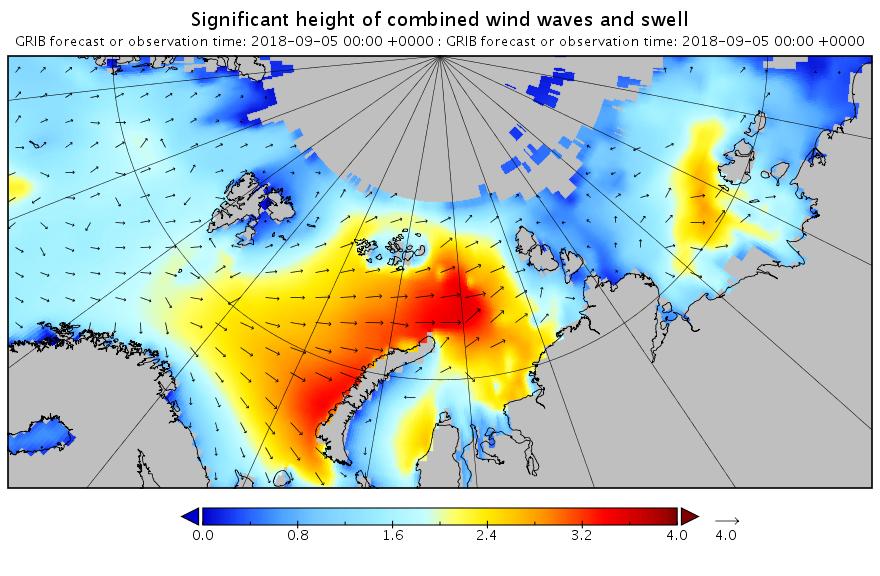
Here’s another WaveWatch III hindcast from midnight UTC:

Significant_height_of_combined_w in multi_1.glo_30mext.20180905_00001

Mean_period_of_swell_waves_order in multi_1.glo_30mext.20180905_00001


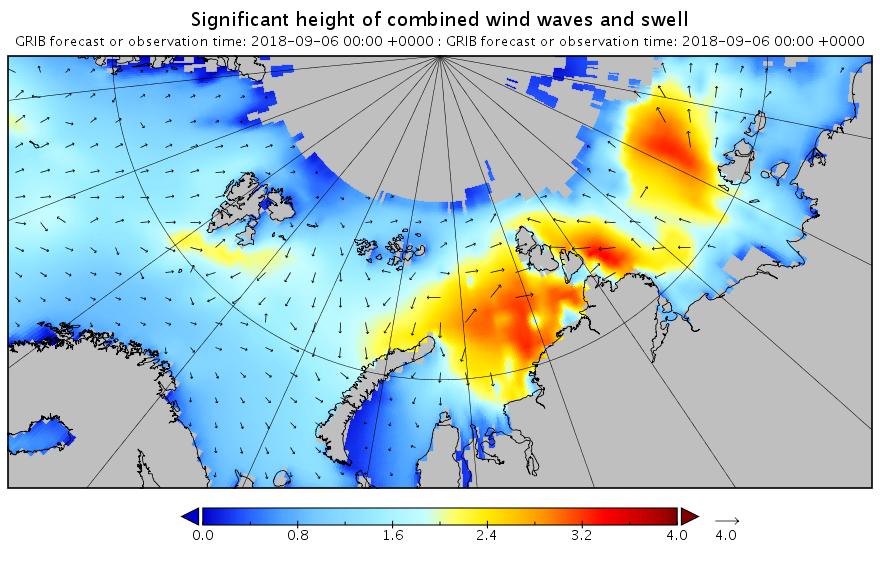
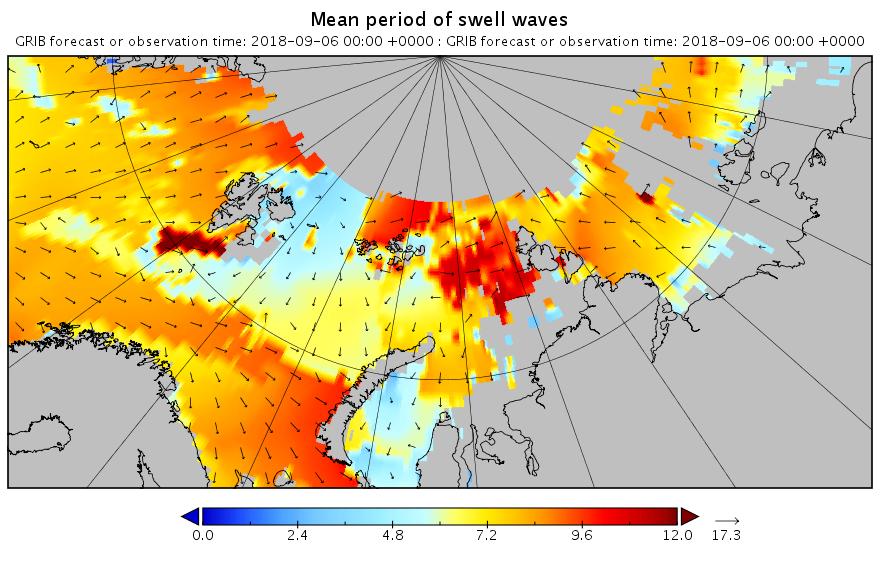
[Edit – September 6th]

Need I say more?

Significant_height_of_combined_NSR.20180906_00001

Mean_period_of_swell_waves_NSR.20180906_00001


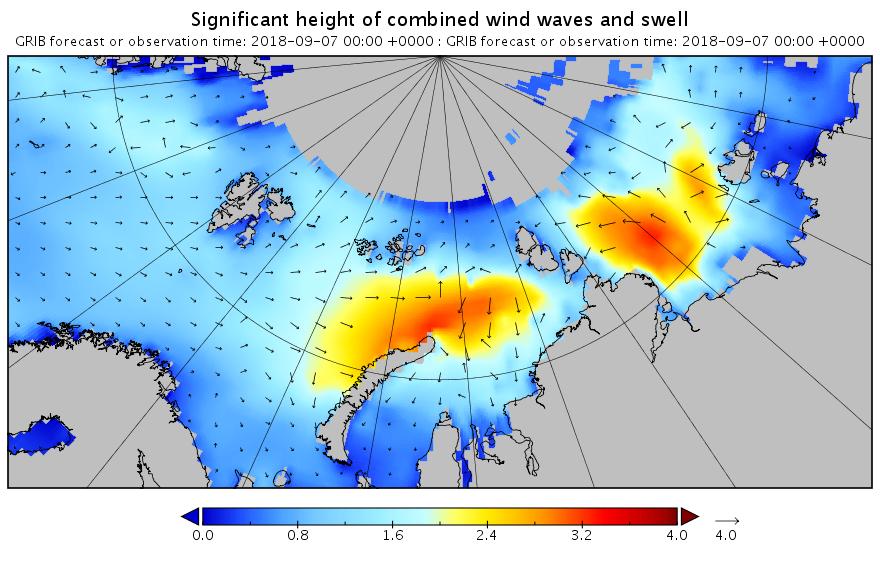
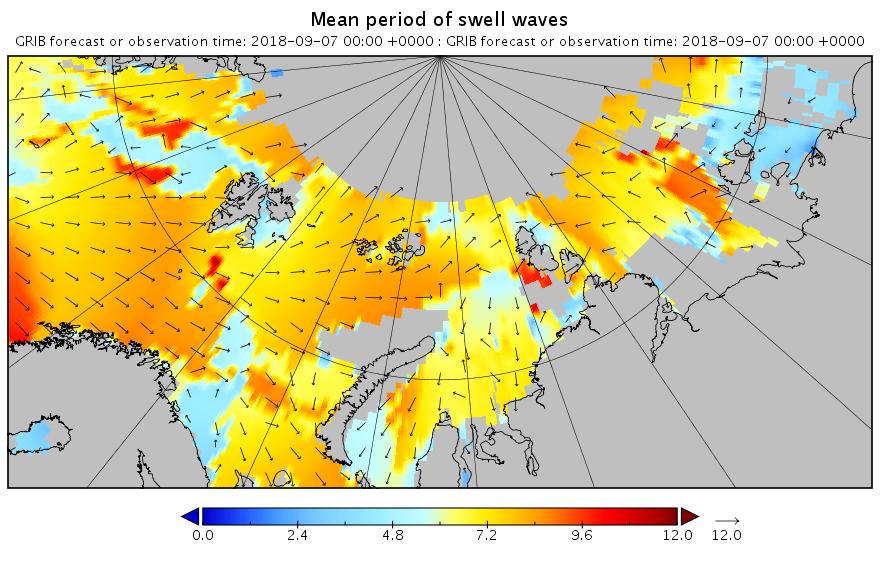
[Edit – September 7th]

The swell in the Fram Strait an Barents Sea is diminishing, but the period in the Laptev Sea is increasing now:

Significant_height_of_combined_NSR.20180907_00001

Mean_period_of_swell_waves_NSR.20180907_00001


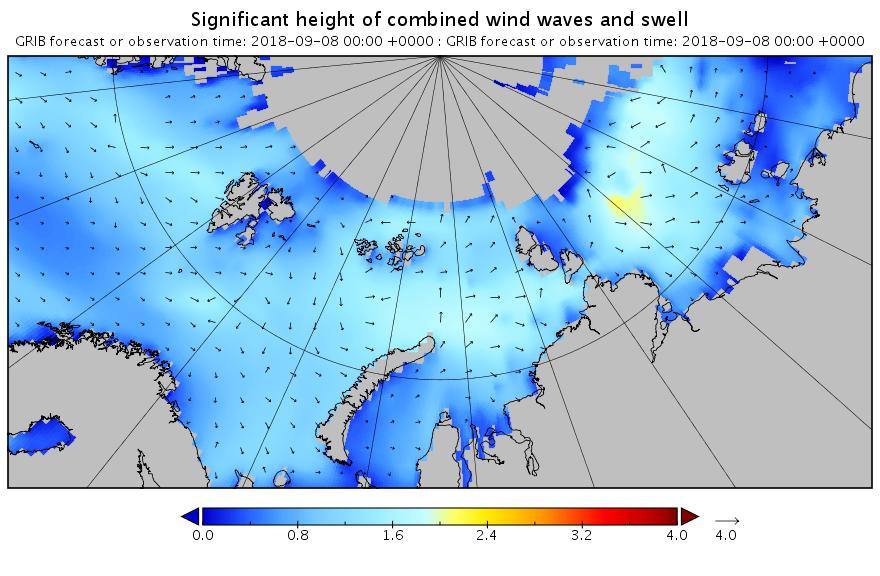
[Edit – September 8th]

All the wave activity in the Laptev Sea is diminishing. Here’s the hindcast from midnight:

Significant_height_of_combined_NSR.20180908_00001

Mean_period_of_swell_waves_NSR.20180908_00001

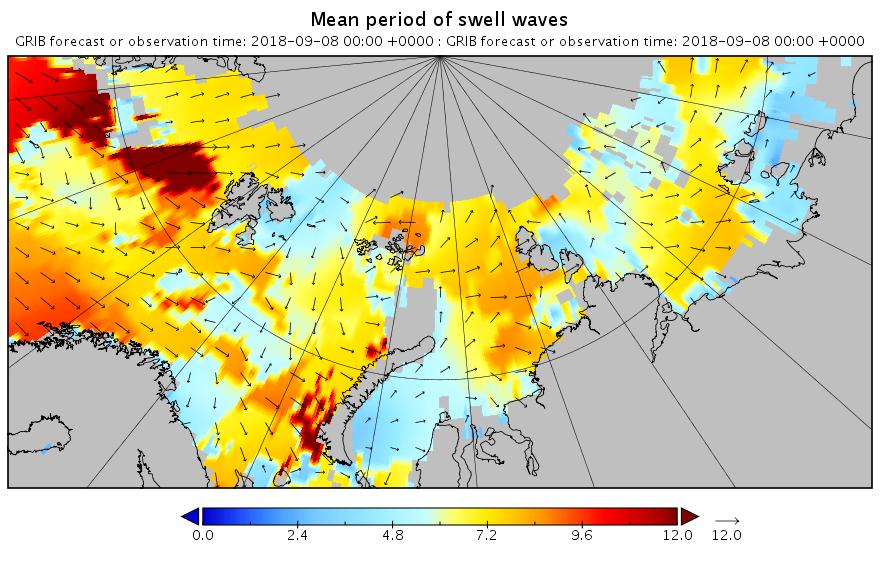
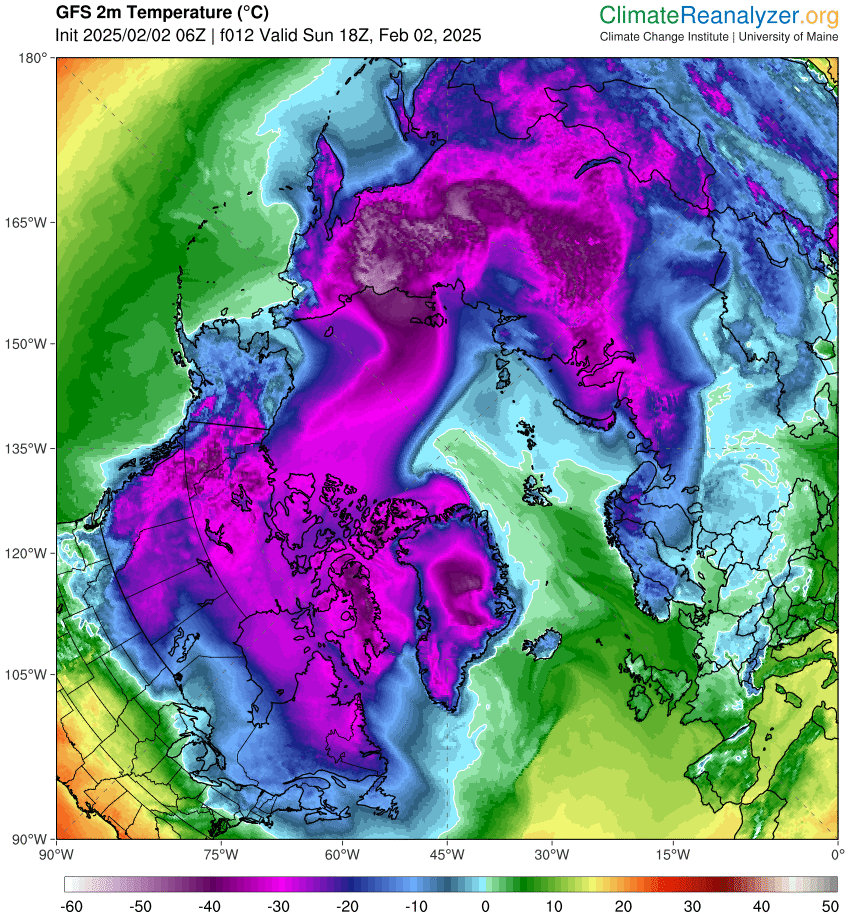
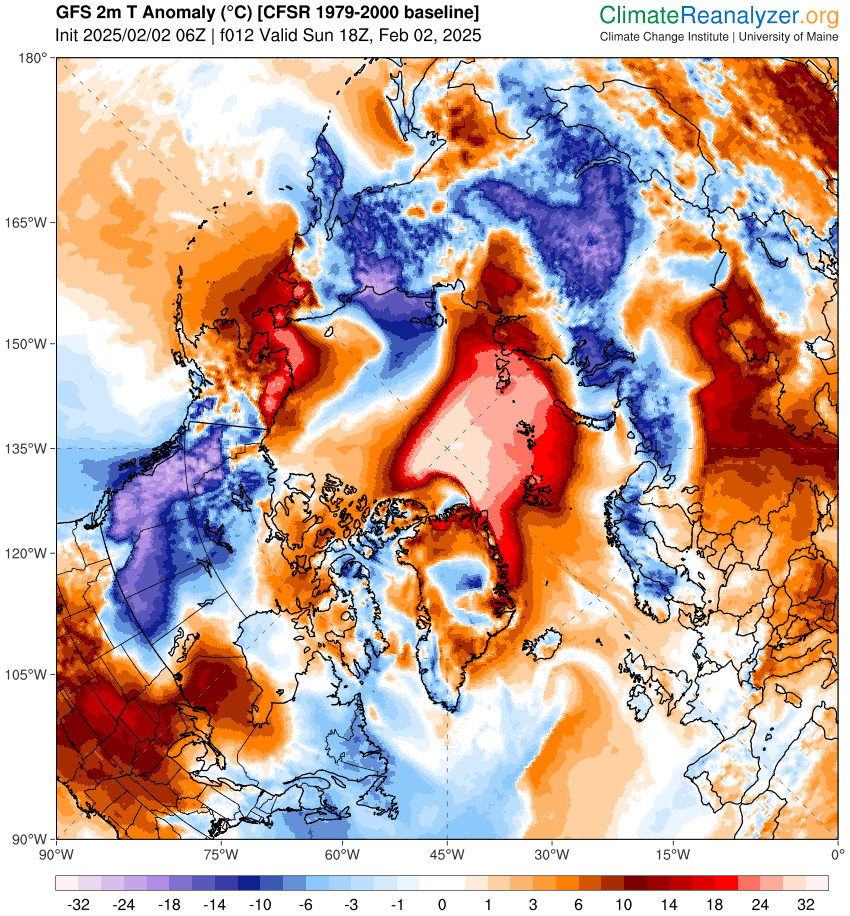
Meanwhile things are warming up in the Chukchi and Beaufort Seas. Here’s the forecast for midnight tonight:

Significant_height_of_combined_Pacific.20180908_00009

Mean_period_of_swell_waves_Pacific.20180908_00009


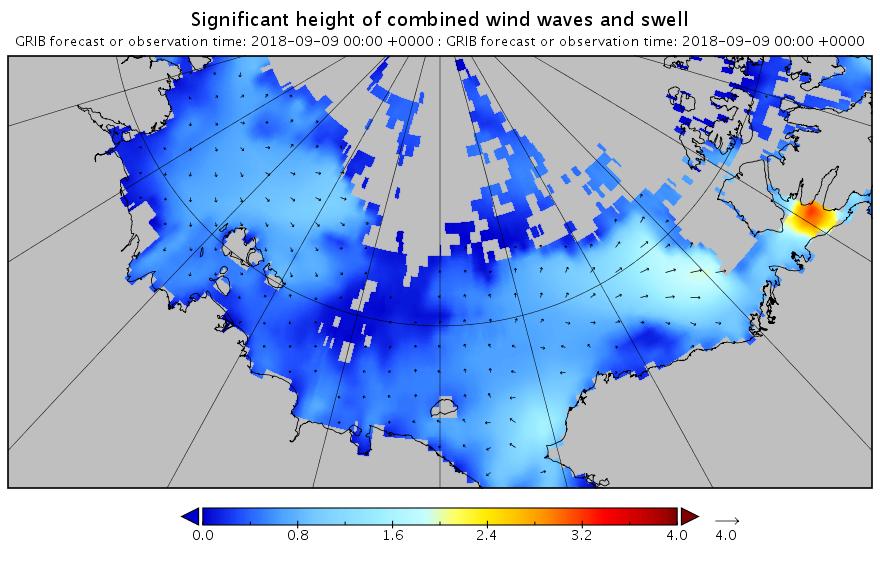
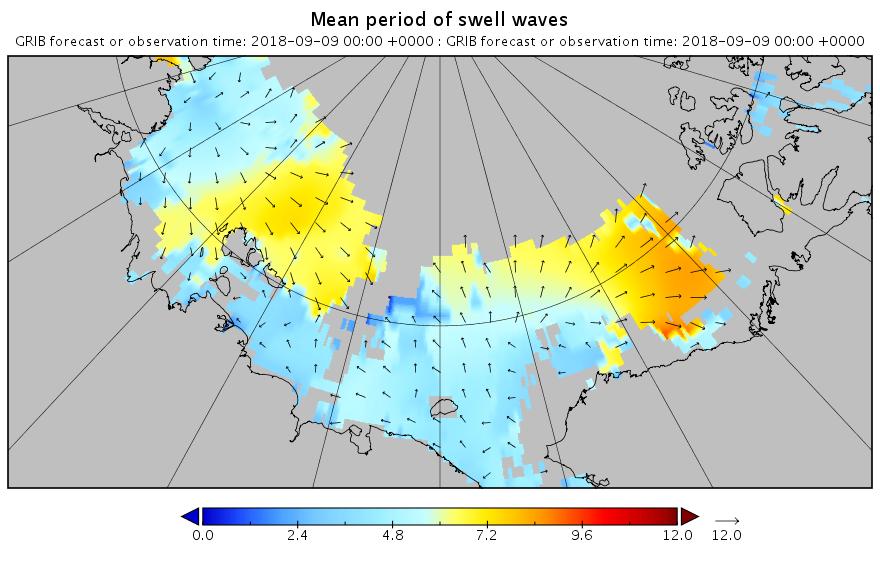
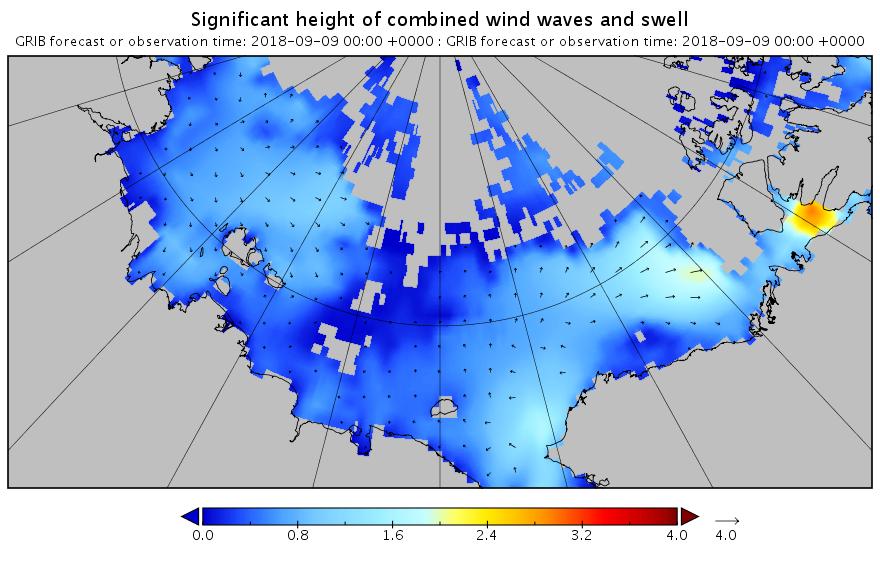
[Edit – September 9th]

Here’s the hindcast for this morning’s swell in the Beaufort Sea:

Significant_height_of_combined_Atlantic.20180909_00001

Mean_period_of_swell_waves_Pacific.20180909_00001

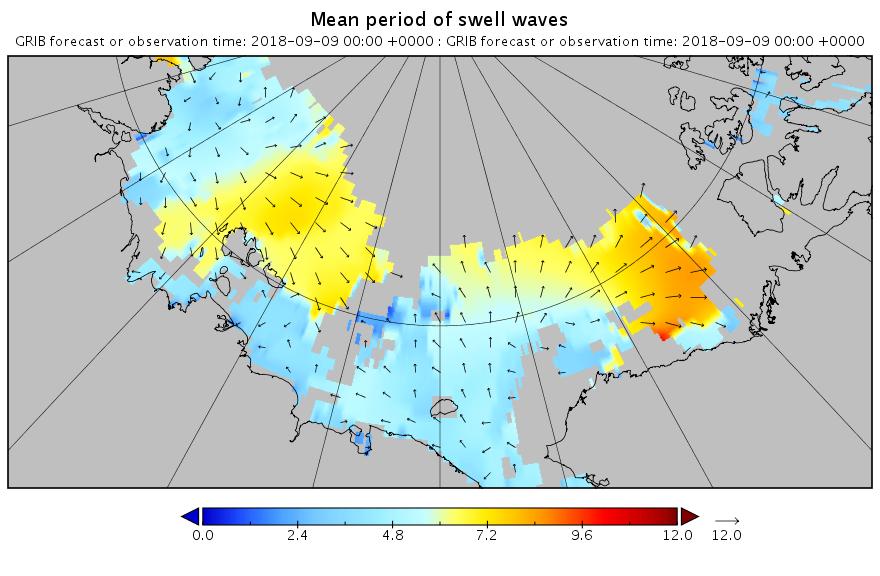
This is currently a long way into the future and hence may not verify in practice. However any pulse of swell is currently forecast for September 13th:

Significant_height_of_combined_Atlantic.20180909_00047

Mean_period_of_swell_waves_Pacific.20180909_00047

The February 2018 Fram Strait Cyclones

As already mentioned in our February Arctic overview, another storm is brewing. Here is this morning’s weather forecast for Longyearbyen, the capital of Svalbard:

svalbard_forecast_20180204

Much like last month, temperatures are above zero and rain is forecast. That’s because once again the current synoptic chart from Environment Canada shows a warm wet flow from way down south over Svalbard and on into the Central Arctic:

Synopsis-20180204-06Z-Crop

Next here’s the current combined wave and swell height forecast for the Svalbard area:

Significant_height_of_combined_w in multi_1.glo_15mext.20180204_00037

and here’s the associated wave period forecast:

Mean_period_of_wind_waves_surfac in multi_1.glo_15mext.20180204_00037

It’s still showing 10 meter waves with a 15 second period north of Svalbard tomorrow lunchtime. Somewhat unusually for the Arctic these aren’t merely giant wind waves. Zooming in on the Fram Strait and breaking out the underlying primary swell reveals:

Significant_height_of_swell_wave in multi_1.glo_15mext.20180204_00041

Mean_period_of_swell_waves_order in multi_1.glo_15mext.20180204_00041

A long distance swell of that magnitude is going to cause some damage.


[Edit – February 5th]

The current ECMWF forecast for a split polar vortex, courtesy of Ice Shieldz on the Arctic Sea Ice Forum:

Polar View Wind Speed 10 hPa 20180204

This is suggestive of more cyclones to come, but sticking with the current one for now, here is the MSLP chart at 00:00 UTC this morning showing the cyclone’s central pressure has dropped to 952 hPa:

Synopsis-20180205-00Z-Crop

Here too is the current WaveWatch III forecast for 15:00 UTC today:

Significant_height_of_combined_w in multi_1.glo_15mext.20180205_00016

Mean_period_of_wind_waves_surfac in multi_1.glo_15mext.20180205_00016

The peak of the swell north of Svalbard is now slightly later than originally forecast, but it’s still enormous!

Here’s a single Sentinel 1B synthetic aperture radar image that captures the position of the ice edge north of Svalbard yesterday quite nicely:

S1B_Svalbard_20180204T0654


[Edit – February 7th]

A brief overview of the effect of the recent cyclone on the sea ice in the Arctic via AMSR2:

UH-Arctic-Area-2018-02-06

UH-Arctic-Extent-2018-02-06

atlantic-201802-1280

Click the image to animate it.


[Edit – February 8th]

An Arctic wide take via Thomas Lavergne on Twitter:

plus the latest AMSR2 concentration map:

Arc_20180207_res3.125_LARGE


[Edit – February 9th]

An interesting insight into CryoSat-2 sea ice thickness measurements from Stefan Hendricks on Twitter:

Plus Judah Cohen on the split polar vortex:

Facts About the Arctic in February 2018

Whilst the official PIOMAS volume figures for January have yet to be released Wipneus has worked his usual magic on the gridded thickness numbers to reveal:

PIOMAS-thkness-20180131

not to mention the calculated volume:

PIOMAS-volume-20180131

and the volume anomaly:

PIOMAS-anomaly-20180131

As Wipneus puts it:

Estimated from the thickness data, the latest value is from 31st of January: 17.57 [1000 km3], which is the second lowest value for that day, 2017 is lowest by a rather large margin at 16.16 [1000 km3].

Here are the “measured” thickness maps from SMOS:

SMOS-20180131

and CryoSat-2:

CS2-thk_28-2018-01-29

Here are the end of January Arctic wide high resolution AMSR2 graphs based on University of Hamburg data:

UH-Arctic-Area-2018-01-31

UH-Arctic-Extent-2018-01-31

In addition, since it’s that time of year, here too is Wipneus’ NSIDC global sea ice extent:

nsidc_global_extent_20180202

The minimum thus far is very slightly above last year’s value, but perhaps like last year there will be a “double dip”?

Getting back to the Arctic, here is the DMI >80N temperature plot for January:

DMI-meanT_20180201

together with the associated freezing degree days graph:

2018-02-01-DMI-FDD

Here’s a video showing the effect of the mid January cyclones on the sea ice in the Fram Strait and north of Svalbard:

Finally, for the moment at least, here is the current Fram Strait surf forecast for 12:00 UTC on February 5th:

Significant_height_of_combined_w in multi_1.glo_30mext.20180203_00021

Mean_period_of_wind_waves_surfac in multi_1.glo_30mext.20180203_00021

Those maps shows 10 meter high, 15 second period waves heading straight for the ice edge north of Svalbard.


[Edit – February 7th]

The latest edition of Arctic Sea Ice News has been published. As the NSIDC put it:

January of 2018 began and ended with satellite-era record lows in Arctic sea ice extent, resulting in a new record low for the month. Combined with low ice extent in the Antarctic, global sea ice extent is also at a record low.

monthly_ice_01_NH_v3.0

Air temperatures at the 925 hPa level (about 2,500 feet above sea level) remained unusually high over the Arctic Ocean. Nearly all of the region was at least 3 degrees Celsius (5 degrees Fahrenheit) or more above average. The largest departures from average of more than 9 degrees Celsius (16 degrees Fahrenheit) were over the Kara and Barents Seas, centered near Svalbard. On the Pacific side, air temperatures were about 5 degrees Celsius (9 degrees Fahrenheit) above average. By contrast, 925 hPa temperatures over Siberia were up to 4 degrees Celsius (7 degrees Fahrenheit) below average. The warmth over the Arctic Ocean appears to result partly from a pattern of atmospheric circulation bringing in southerly air, and partly from the release of heat into the atmosphere from open water areas.

airtemp-201801


[Edit – February 10th]

The University of Hamburg’s high resolution AMSR2 derived area is bouncing back after the recent cyclone, but extent is currently still declining:

UH-Arctic-Area-2018-02-09

UH-Arctic-Extent-2018-02-09

The recent drop in Arctic sea ice extent has pushed the NSIDC global extent to a new all time (satellite era!) low:

nsidc_global_extent_20180209