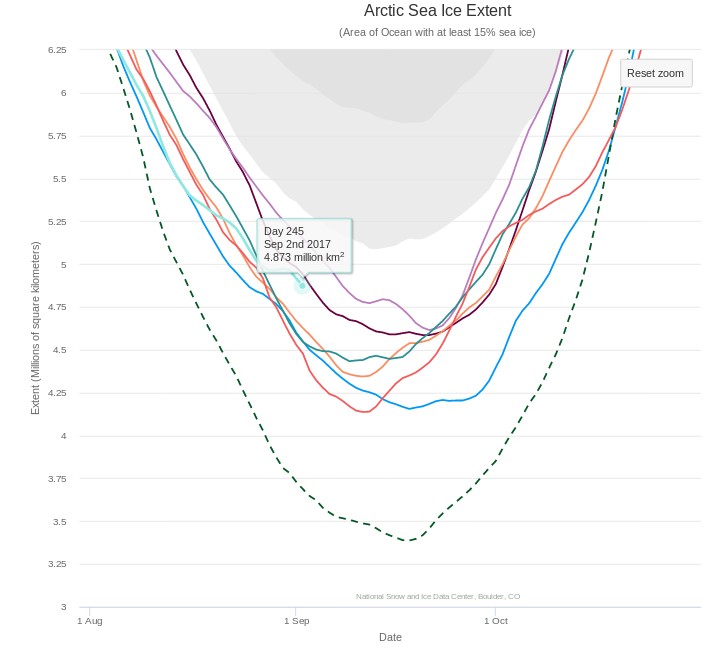
September has arrived once again, the month in which the assorted Arctic area and extent metrics (almost) always reach their respective annual minima. Now we can start to speculate about what the assorted minima will be, and on what date.
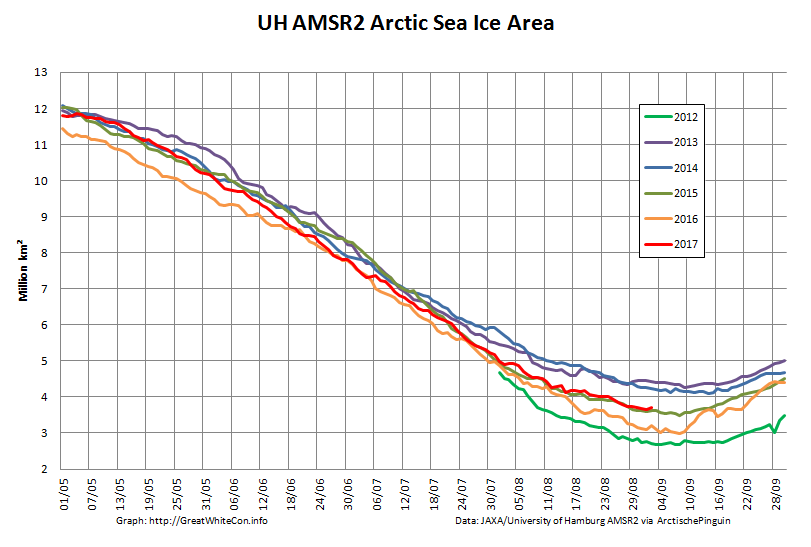
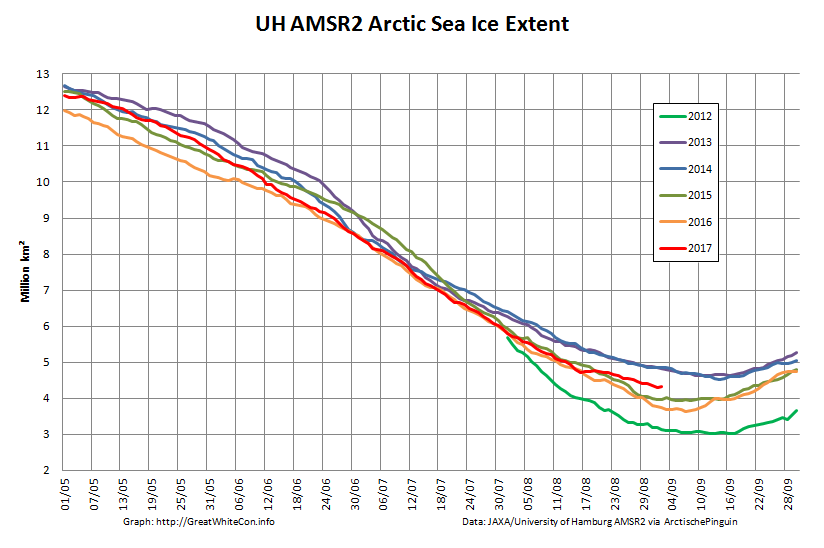
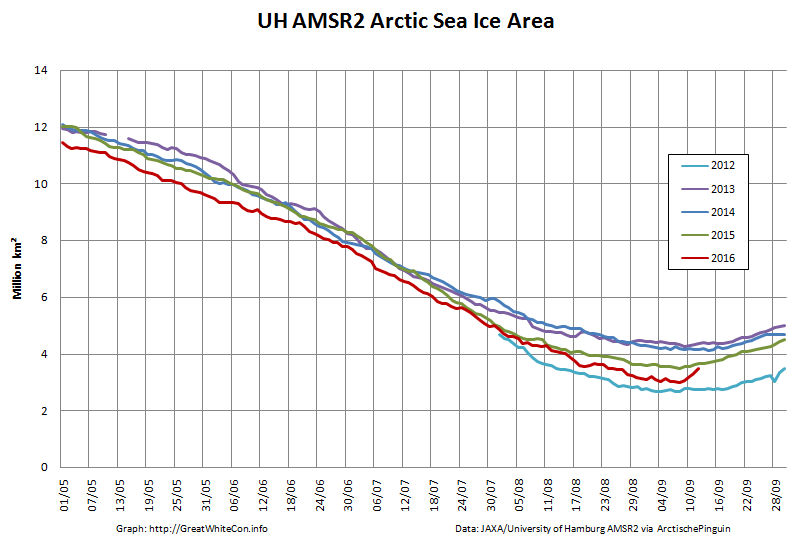
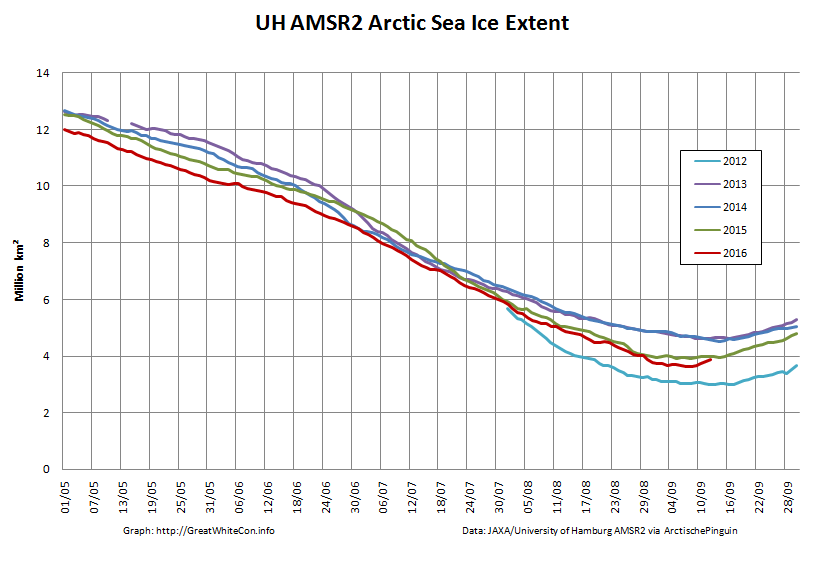
First of all let’s take a look at “Snow White’s” favourite high resolution AMSR2 metrics derived by “Wipneus” from University of Hamburg AMSR2 concentration data:
As you can see, today’s values are both higher than yesterday’s. Hence we already have potential minima to consider! In this case:
UH AMSR2 Area – 3.65 million km² on September 1st
UH AMSR2 Extent – 4.30 million km² on September 1st
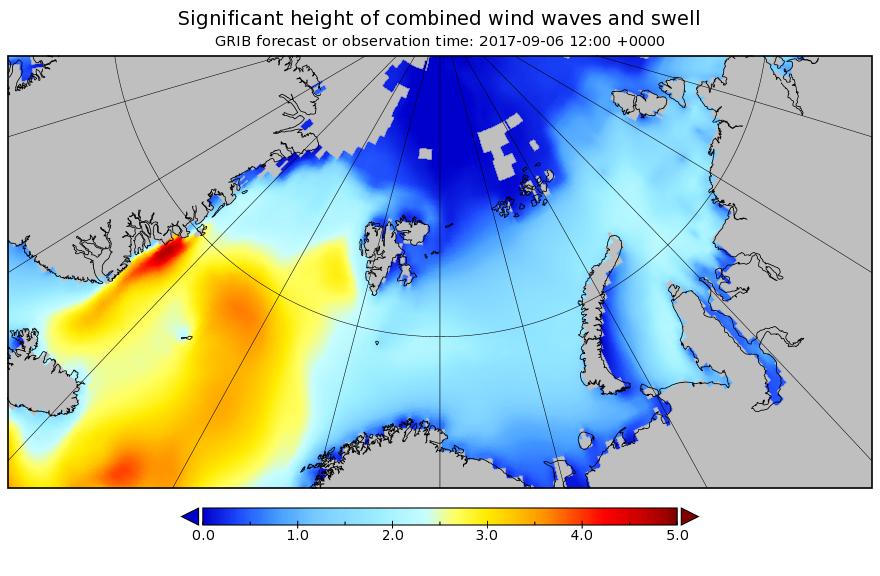
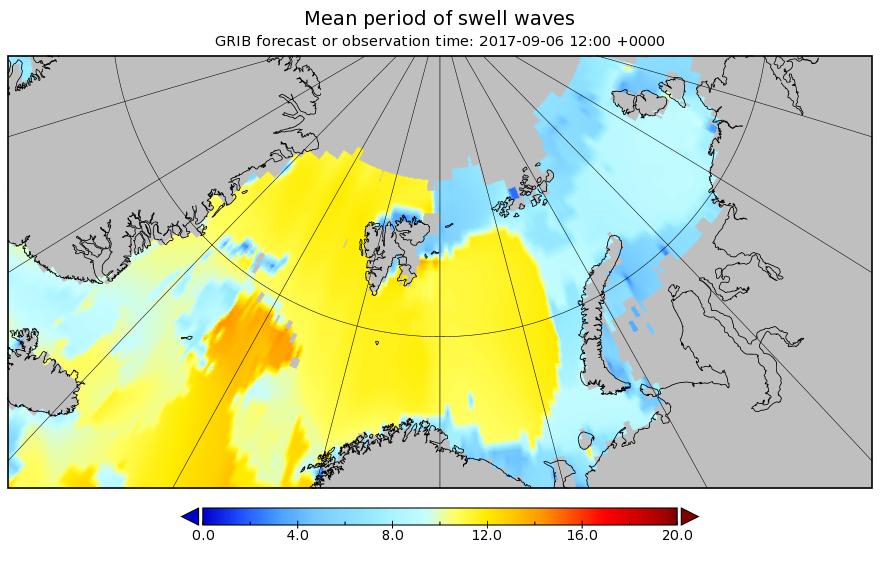
Personally I don’t think those numbers will last long, and here’s one reason why. The “surf forecast” for the far North Atlantic for midday on September 6th:
Some significant swells are currently forecast to batter the ice edge on the Atlantic side of the Arctic over the next few days.
[Edit – September 3rd PM]
Shock news! Tony Heller has made a prediction about this year’s minimum!! Unlike last year, this year the NSIDC 5 day average extent seems to be his Arctic metric of choice:
Tony tells his faithful flock:
The Arctic sea ice minimum this year is very likely going to be be larger than 2016, 2015, 2012, 2011 and 2007.
It is also likely that the minimum extent will be higher than 2010 and 2008.
Instead of reporting the huge gain in ice and massive failure of their forecasts, climate alarmists will report that extent was “8th lowest on record.”
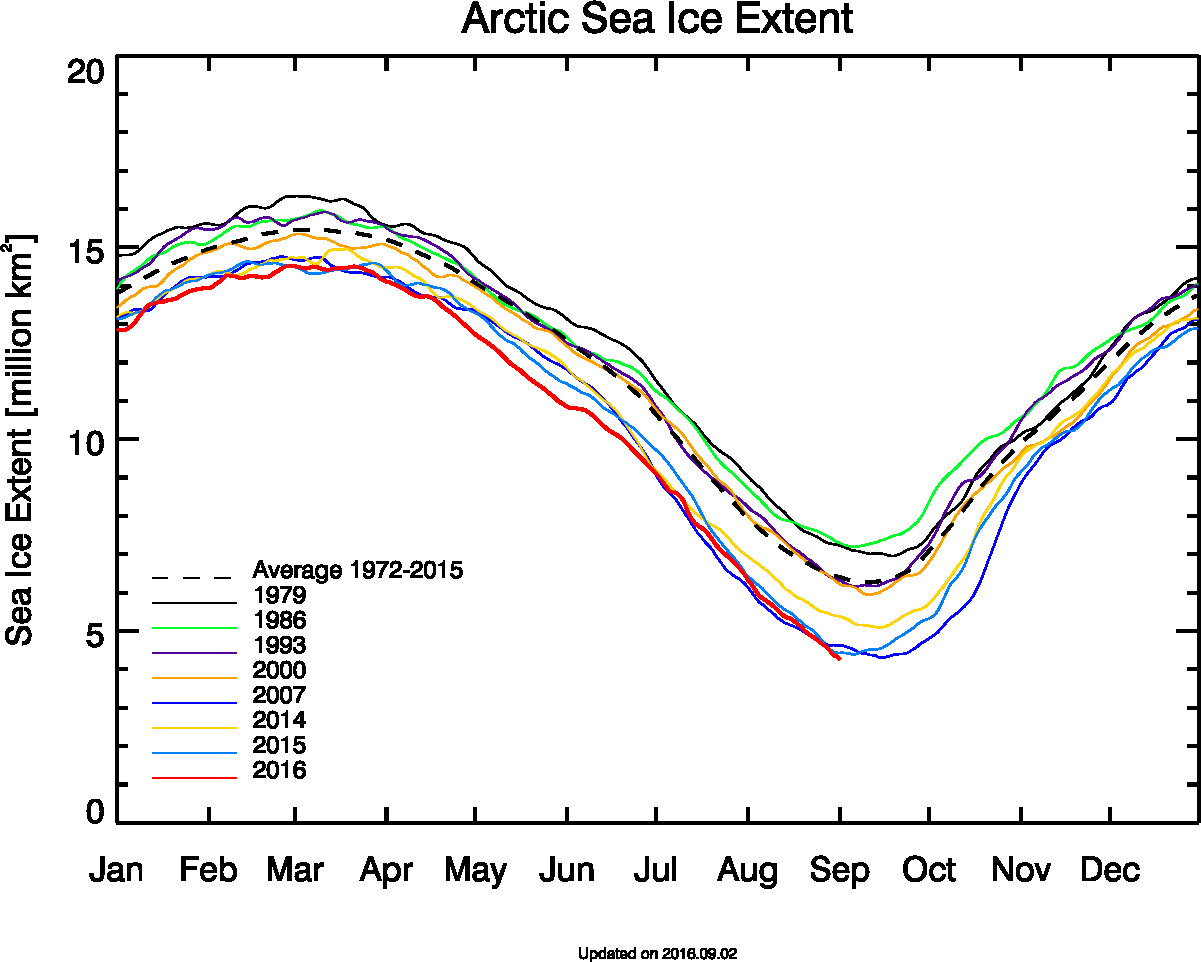
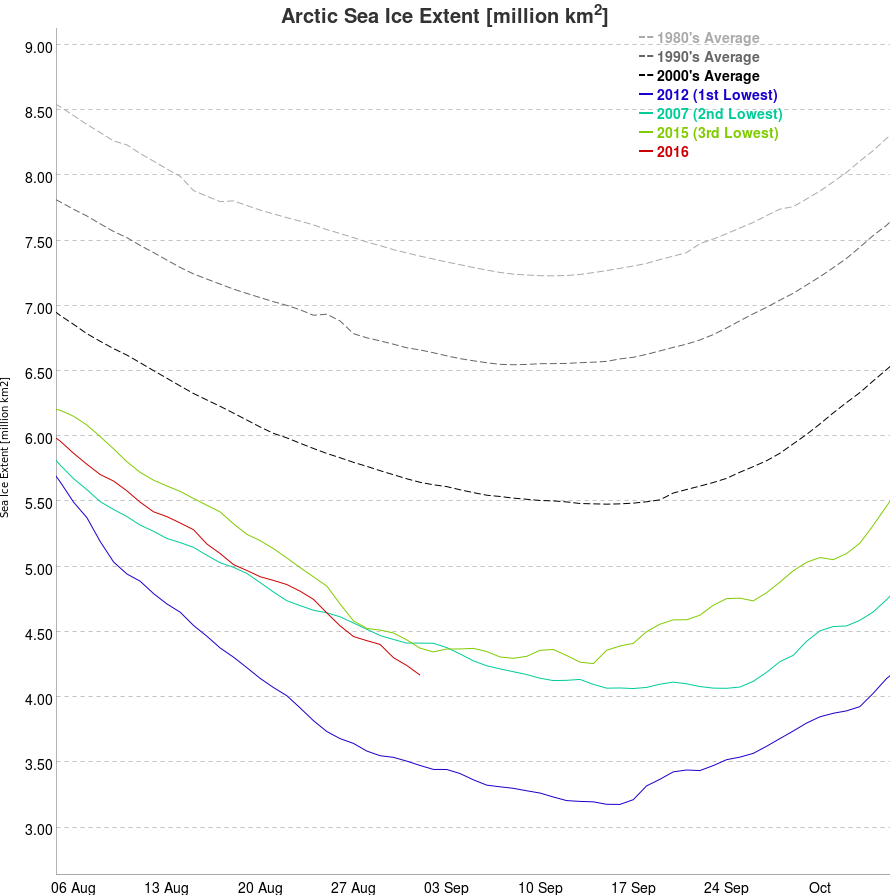
All those years are on the graph above. We shall see.
[Edit – September 15th]
Our normal Arctic sea ice extent 2017 minimum service will be restored as soon as possible. Meanwhile here is the test card:
On the way the cruise’s resident naturalist and Smithsonian lecturer, Michael Scott, risked the wrath of Trump supporters by pointing to some of the changes Greenland is undergoing.
A Nasa map based on data between 2004 and 2014 revealed that the ice is melting across most of Greenland – an area nine times the size of the UK.
Pulling together several papers, Michael said Greenland’s summer melt season now lasts 70 days longer than in the early 1970s.
This melting is unfreezing the fringes of the permafrost, which may explain why Nasa satellites are picking up fires raging where the ice has retreated.
[Edit – September 16th]
It is of course still to early to be 100% certain about this. However:
It certainly looks as though the bottom is in for the University of Hamburg AMSR2 extent: 4.25 million km² on September 11th.
It’s much the same story for JAXA extent:
4.47 million km² on September 9th and 10th.
[Edit – September 19th]
The NSIDC have followed in Snow White’s glass slippered footsteps and tentatively called the minimum:
On September 13, Arctic sea ice appears to have reached its seasonal minimum extent of 4.64 million square kilometers (1.79 million square miles), the eighth lowest in the 38-year satellite record. The overall rate of ice loss this summer was slowed by a persistent pattern of low sea level pressure focused over the central Arctic Ocean.
Please note that this is a preliminary announcement. Changing winds or late-season melt could still reduce the Arctic ice extent, as happened in 2005 and 2010. NSIDC scientists will release a full analysis of the Arctic melt season, and discuss the Antarctic winter sea ice growth, in early October.
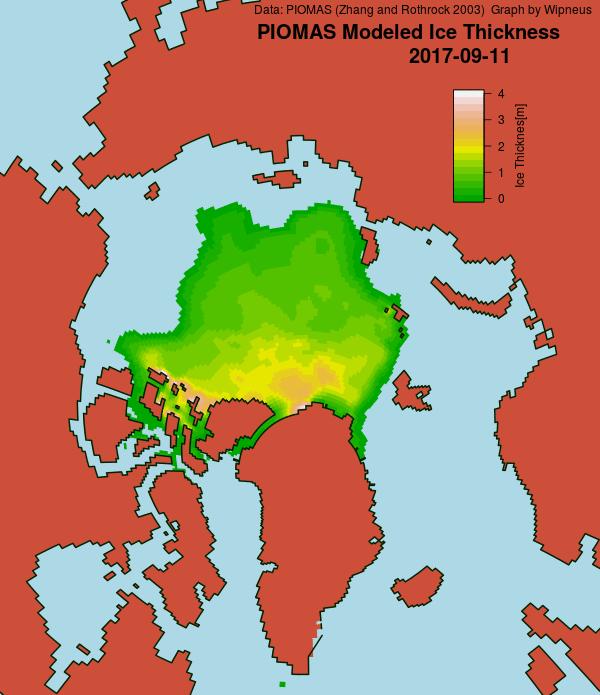
Minimum volume was reached at 11th September: 4.542 103km3, which is fourth lowest after 2012, 2011 and 2016 (resp 3.673, 4.302, 4.402) and just below 2010 (4.582).
[Edit – September 23rd]
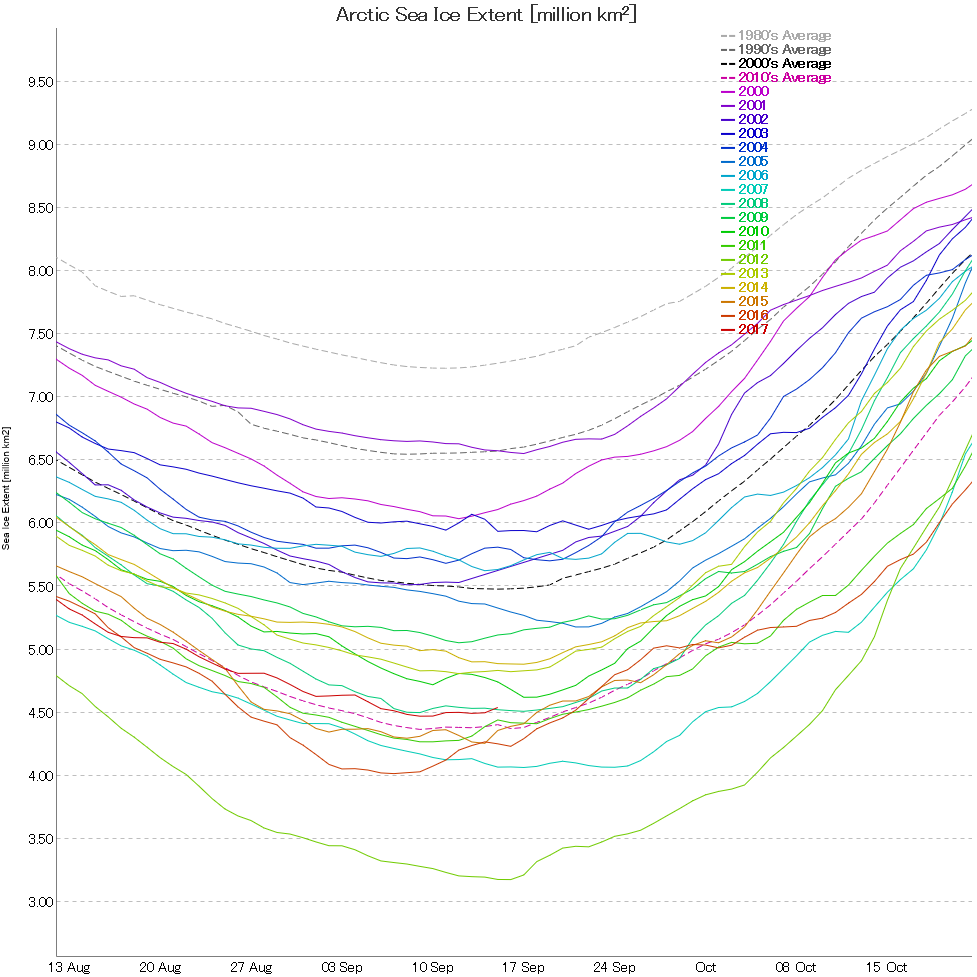
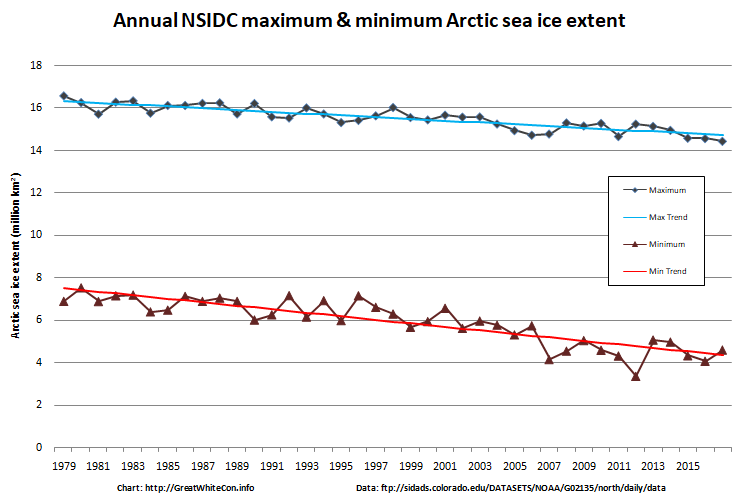
Here’s the 2017 edition of our annual NSIDC daily max/min extent graph:
The maximum extent was the lowest in the satellite record, and the minimum was just fractionally above the trend line. For those that concern themselves with “statistical significance”, the PIOMAS minimum volume was a “statistical tie” for second place:
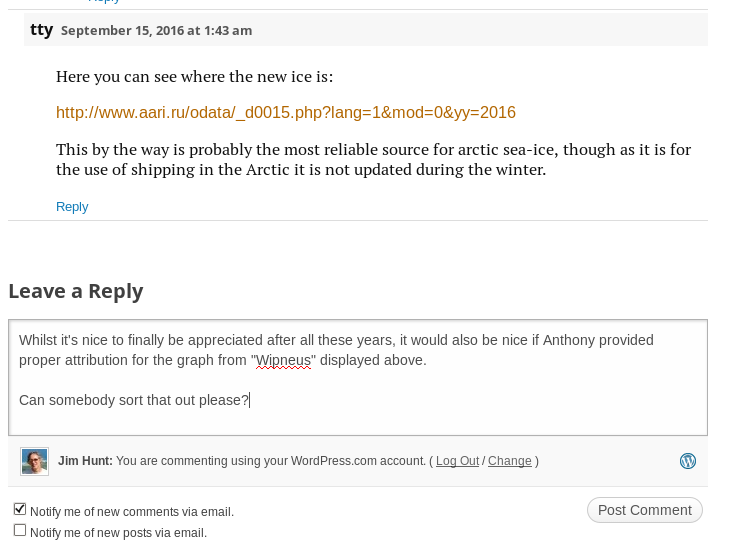
Regular readers will be aware that Snow White and I have long been banished from the hallowed halls of Watts Up With That. What is one to do, then, when Anthony Watts publishes these scurrilous allegations about one’s character by the pseudonymous “Sunsettommy” under an article by David Middleton on a topic under much discussion here?
Your ice obsession is destroying you and Jim Hunt,who was exposed as a dishonest person over his absurd cherry picking of a small area while Tony was covering the ENTIRE Arctic region. Tony just today exposed Hunts dishonesty, by showing that his small Canadian region is actually thicker than last year.
The two of you are gaining a stellar reputation as wild eyed warmist morons,who will lie or distort the topic presented, Tony has effectively destroyed your low Arctic ice baloney, to the point that you now get derision there, since your replies are free of any science information,meaning you have no effective counterpoint to offer,just brainless opinions, nothing more.
With the usual channels of communication solidly blocked our very good friend Alice F. helpfully leapt into the breach:
SST – It seems as though you’ve been unable to confirm Aphan’s conjecture with evidence of an accurate prediction [from Tony Heller]? Meanwhile your aforementioned “Mr. Hunt” posted this “data based presentation” earlier:
“You don’t even need to be familiar with the satellite products to understand that the sea ice edge to the north of the Barents Sea doesn’t currently consist of multi-year ice.”
Any comment?
Much witty banter about Arctic sea ice maps and metrics ensued! Here is one of the more inventive comments, from the pseudonymous “2hotel9”:
Every time leftarded c*nts like you get caught being leftarded c*nts all you do is cry. Wahwahwahwahwahwahwah. Too f*cking funny.
That sort of thing apparently does not violate any of the carefully crafted house rules at WUWT, whereas this comment of Alice’s does:
Unabashed by her love letter being so swiftly trampled underfoot on the WUWT cutting room floor Alice valiantly pursued the matter with Anthony on Twitter, where in his habitual fashion he gleefully unfrocked her in public view of the whole of cyberspace:
Anthony Watts has finally [snip]ped the four letter words uttered by “2hotel9”.
However there’s still no sign of him allowing yours truly a right of reply to SST’s libellous attacks upon my unblemished (outside the cryodenialosphere) character:
Our old friend Tony Heller has been publishing a glorious Gish gallop of articles showing OSI-SAF Arctic sea ice type maps and claiming amongst other things:
A decade after declaring the end of Arctic multi-year sea ice, it has increased 116% and now covers nearly half of the Arctic.
That is of course not true. In actual fact it’s an “alternative fact” par excellence!
I have been endeavouring to point out to Tony the error of his ways for weeks now, but my words have wisdom have fallen on deaf ears. My graphic graphics have been viewed only by “snow blind” eyes. My incontrovertible arguments have been misapprehended by purpose built dumb and dumberer wetware illogic. By way of example, here’s a refreshingly ad hom free riposte from a typical commenter:
Jimmy Boy actually thinks his honesty and integrity are equally to that of Anthony Watts???
No doubt we’ll get around to discussing Anthony Watts “honesty and integrity” again soon, but for now let’s see if we can finally set this particular badly warped record straight shall we?
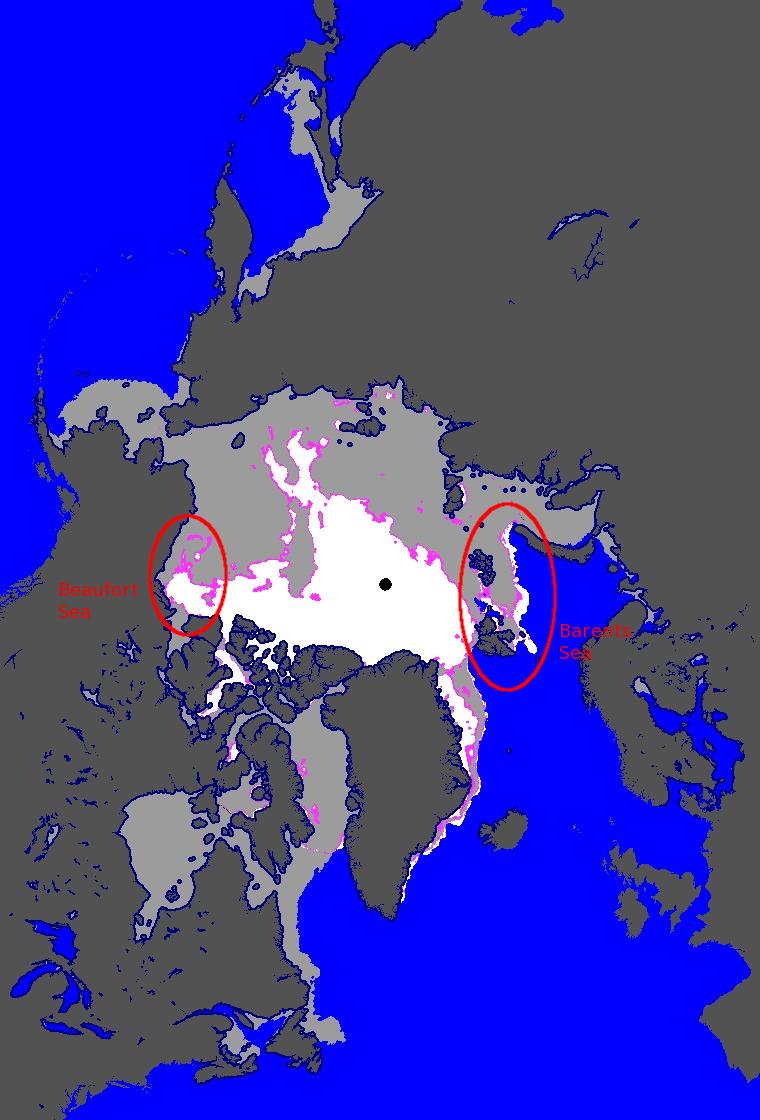
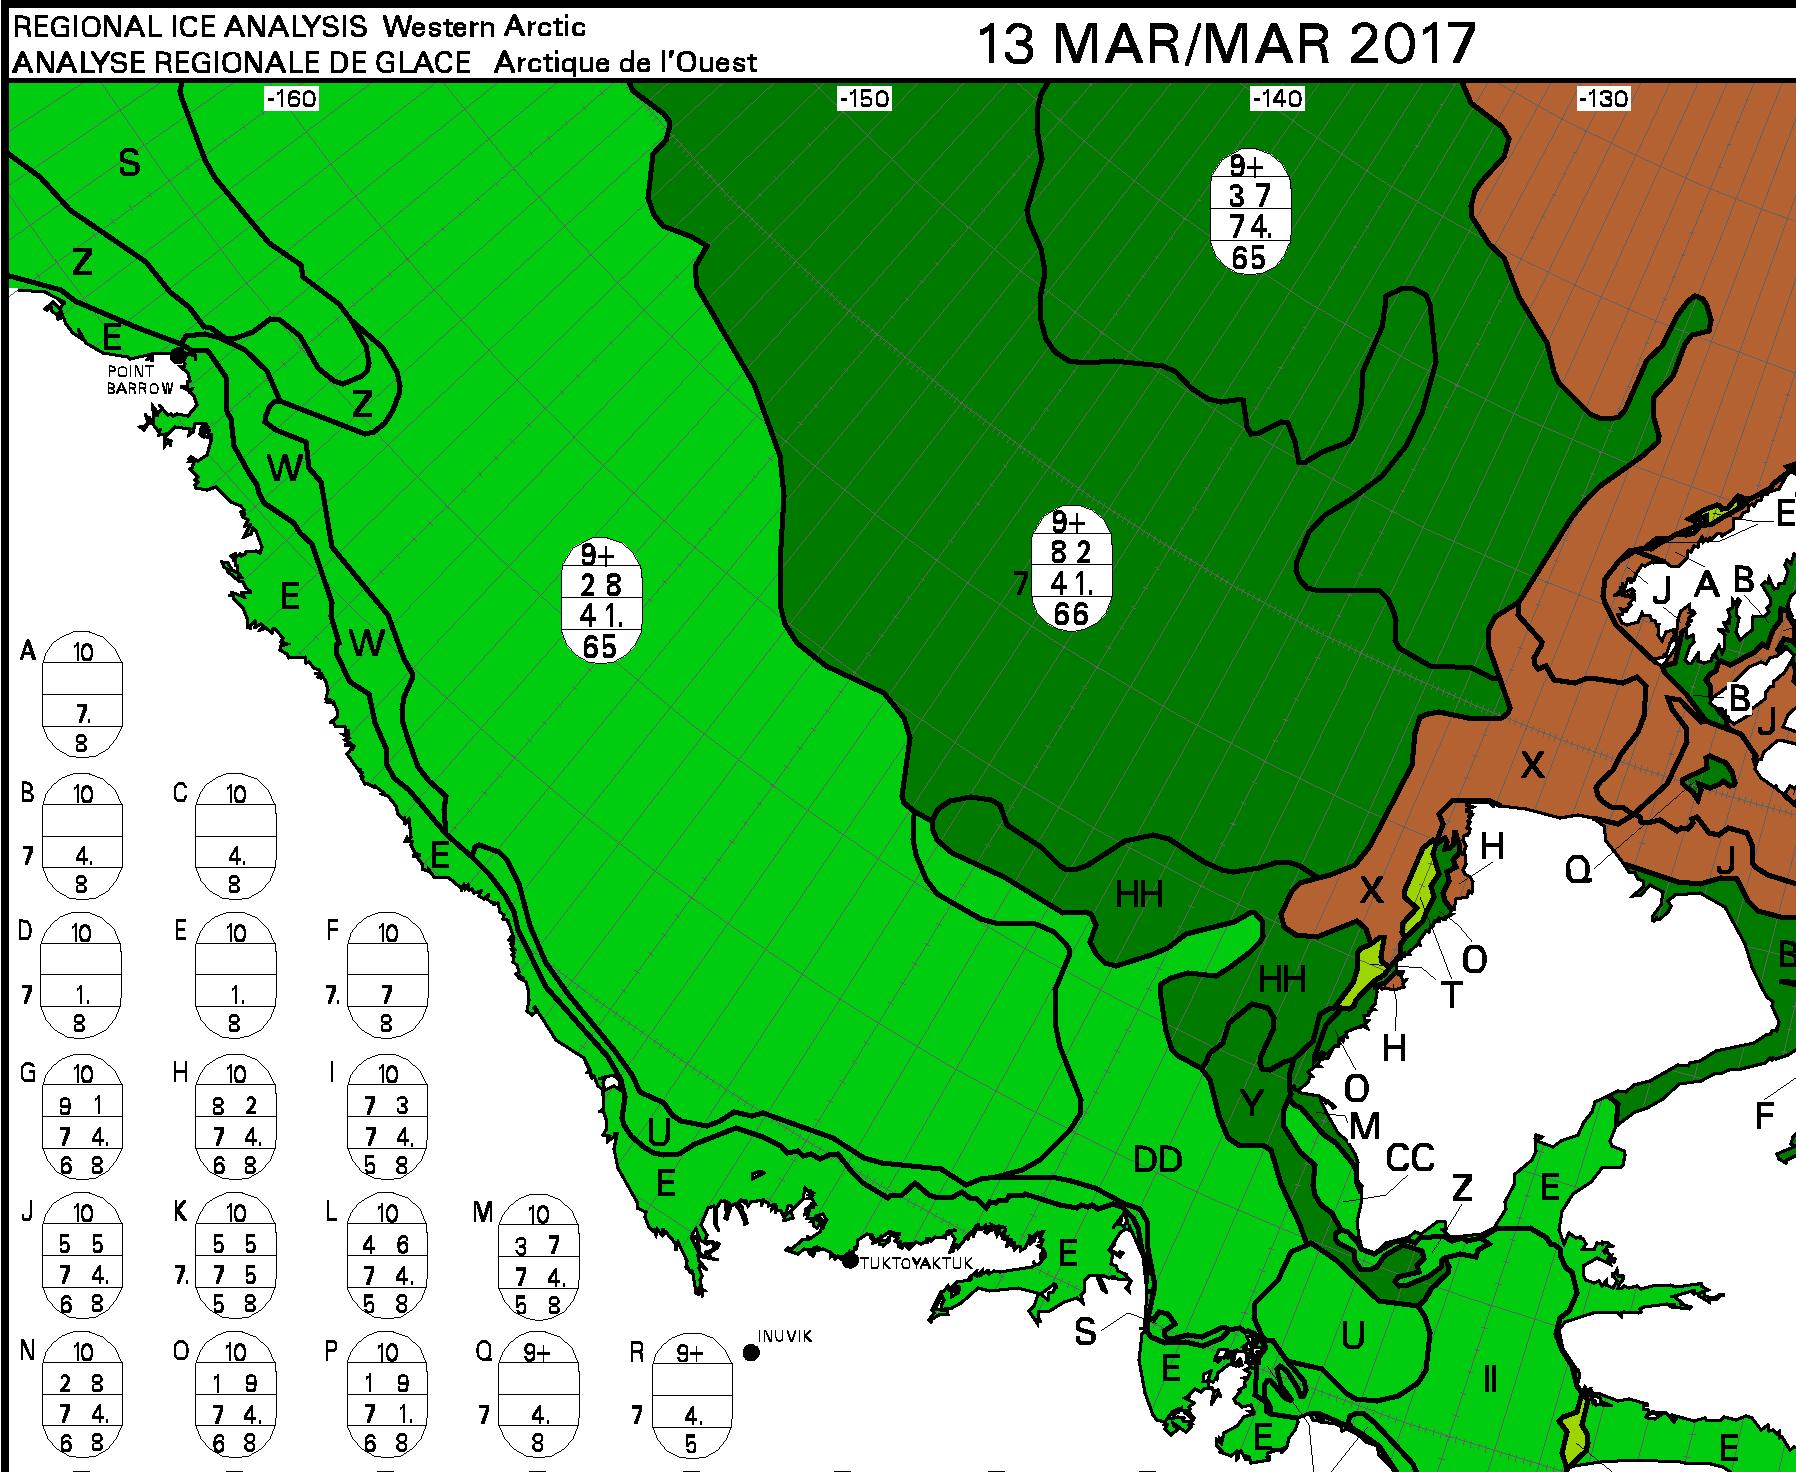
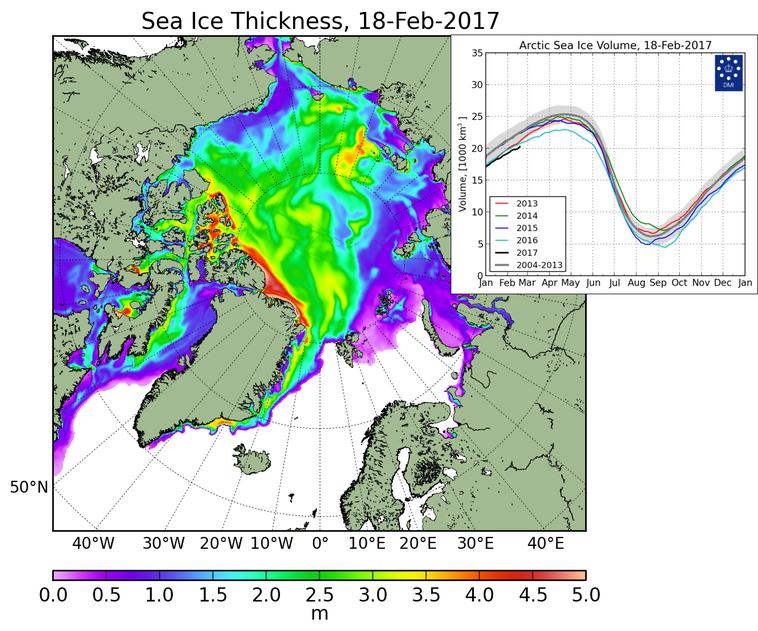
Here is the latest OSI-SAF ice type map, for March 16th 2017:
The highlighted area on the left is the Beaufort Sea to the north of Canada. If you’re not “snow blind” you can no doubt readily perceive a large area of allegedly “multi-year sea ice” coloured white. Let’s now take a look at the most recent Canadian Ice Service map of the same area, for March 13th 2017:
Canadian Ice Service sea ice stage of development on March 13th 2017
Can you see a large area of brown “old ice” covering most of the surface of the Beaufort Sea?
Now let’s take a look on the other side of the Arctic at the area north of the Barents Sea. Can you see a large area of allegedly “multi-year sea ice” coloured white inside the red ellipse on the OSI-SAF map? Next let’s take a look at the most recent University of Bremen SMOS map of the Arctic, for March 15th 2017:
On this map the brightly coloured areas show sea ice that’s less than 50 cm thick. Even when two people explain this point slowly to them the “deplorable denizens” at Mr. Heller’s blog do not manage to get the message! So now let’s look at a closeup comparison between the OSI-SAF ice type map and the University of Bremen SMOS sea ice thickness map:
As I popped the question to the deplorable denizens over on Tony Heller’s Deplorable Climate Science blog:
For anybody else here who isn’t deaf, dumb and blind, please note all the young, thin sea ice around Svalbard identified by SMOS that OSI-SAF currently classifies as “multi-year” ice.
At the risk of (repeating myself)^n, n → ∞:
Why do Tony, Tommy and Andy persist with this nonsense?
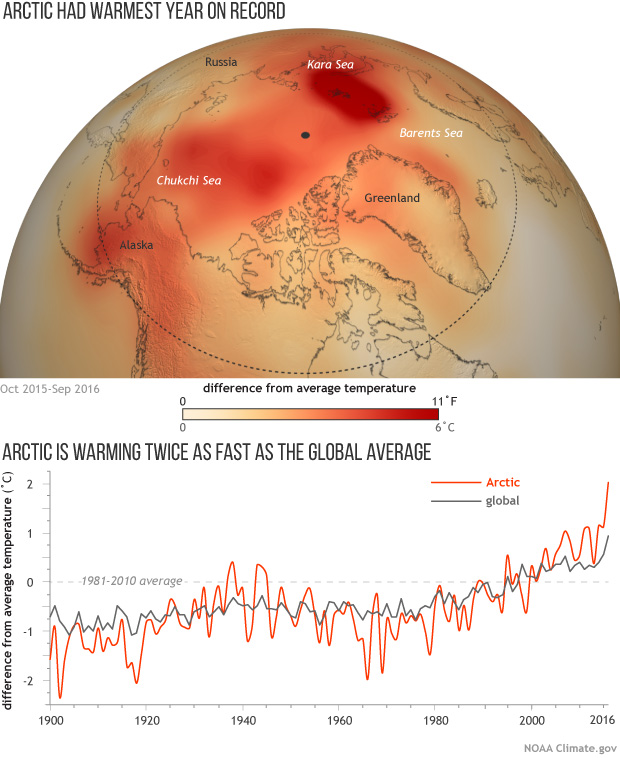
David Rose is mercifully quiet this weekend, but there’s no rest for the wicked! Christopher Booker in the Sunday Telegraph leads a bunch of the usual Alt-facts suspects in a barrage of fake news about our dearly beloved Arctic sea ice. According to Mr. Booker in the “Arctic Myths” section of his column today:
As the fake science of global warming continues to crumble, one scare story the zealots are determined to hold on to at all costs is their claim that ice in the Arctic is dangerously vanishing. Yet again lately we have been treated to a barrage of such headlines as “Hottest Arctic on record triggers massive ice melt”.
The nearest we got to such a headline here at the Great White Con was “Arctic Sea Ice News from AGU” in which article we showed images which said things like:
That’s because last year was the *hottest year on record in the Arctic! Undeterred by mere facts Mr. Booker continues:
But that ever-diligent blogger Paul Homewood has drawn on official sources such as the US National Snow and Ice Data Center to uncover what is actually happening. Under “Arctic Fake News”, on NotALotOfPeopleKnowThat, he posted a graph showing that last week the extent of sea ice was much the same as it has been at this date ever since 2001. Indeed, according to the Danish Meteorological Institute, there is even more of it today than in February 2006, and it is also significantly thicker. Back in 2008 much of the ice was only a metre thick. Today that has risen to two metres, and in some places four.
Mr. Booker appears to be more than somewhat confused, since this is what the DMI Arctic sea ice extent graph he links to reveals:
In addition the DMI thickness maps he refers to aren’t available at any of the places he mentions! Not a lot of people know that he was probably thinking of another recent article by Paul Homewood entitled “Arctic Ice Fake News“, which includes these two DMI thickness maps:
Even without considering other sources of Arctic thickness and/or volume data it is quite clear from the two volume graphs that according to the Danish Meteorological Institue Arctic sea ice volume is significantly lower this year than it was in 2008. If Arctic sea ice extent is greater this year and the volume is lower then the laws of physics (which not even the combined talents of Messrs Homewood and Booker can change) dictate that its average thickness must be LESS this year than in 2008!
Mr Booker blunders on:
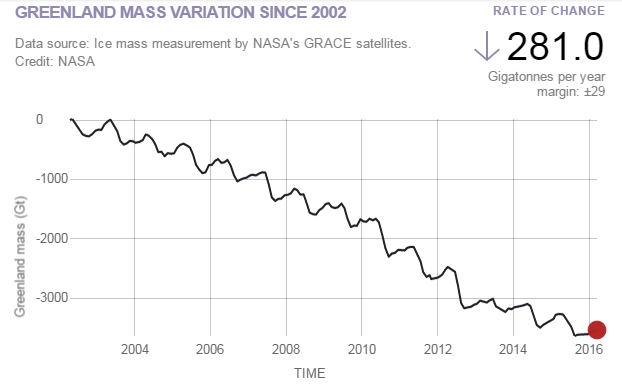
The DMI data also show that the Greenland ice sheet, which we are told is melting at horrendous speed, is actually growing this year at a record rate, to a size way above its average for the past 26 years. And the most authoritative record of Northern Hemisphere snow cover shows this year’s ranking as one of the six highest since 1967.
He seems blissfully unaware that the “DMI data” to which he refers is the output of a DMI climate model that attempts to determine the “surface mass balance” of the Greenland ice sheet. He seems to think it’s a measurement of the mass of the Greenland ice sheet, which it isn’t. However this is, courtesy of NASA:
In his bubble of astounding Arctic ignorance Mr. Booker continues:
The Deplorable Climate Science blog, run by US expert Tony Heller, gleefully reproduces a 2007 headline: “Scientists: ‘Arctic is screaming’, global warming may have passed tipping point”. As Heller comments: “The Arctic is indeed screaming at climate scientists – to shut up.”
Now as luck would have it I have been (vainly!) attempting to persuade Mr. Heller “to shut up” on the very article Mr. Booker references! Let’s take a quick look at a couple of highlights shall we?
It seems safe to assume that Mr. Booker wasn’t reading Mr Heller’s blog on or after February 22nd does it not? Otherwise he would surely have had second thoughts about writing such a ludicrous phrase as “there is even more of it today than in February 2006”?
Then of course there’s the burning question of the “Hottest Arctic on record”
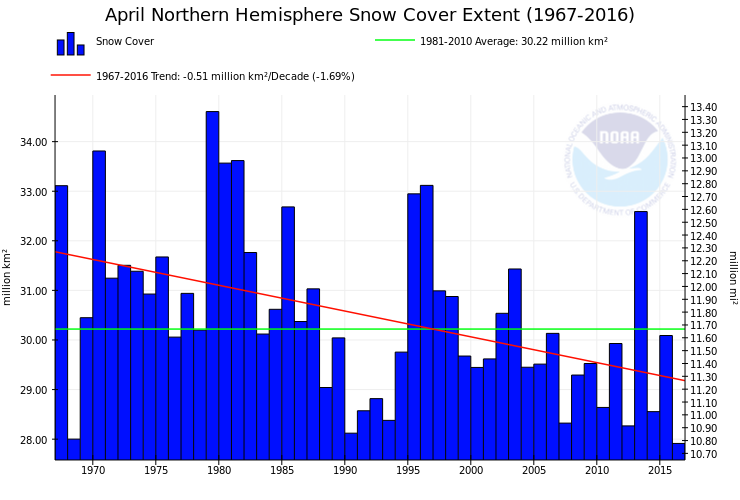
You seem to have forgotten about spring Gail? Here’s April:
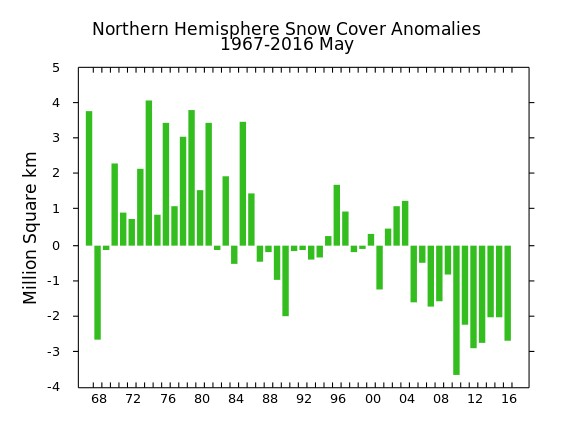
Here’s the May graph from “the most authoritative record of Northern Hemisphere snow cover” for good measure:
To summarise, Messrs Booker and Homewood could have confined their due diligence on their assorted Arctic articles to reading my comments on Mr. Heller’s blog. Having done so it would quickly have become apparent to them that every single point they made was in actual fact a “fake fact”.
The inevitable conclusion is that they have no interest whatsoever in establishing the actual facts about the Arctic. All they are interested in is propagating “fake news” about the Arctic as far and as wide as possible in pursuit of a common “agenda”. As is David Rose.
Our regular reader(s) will be all too familiar with the 2015 and 2016 editions of our annual Great White Con “New Einstein” Award. The jury has now finished its deliberations on the 2016 award in a smoke filled igloo just outside the Great White Con Ivory Towers, not far from Santa’s swimming pool. I am pleased to be able to announce that the first prize of the loan of a polar bear suit kindly donated by the Daily Telegraph plus a battered big board from Cotty’s quiver has been awarded to none other than Ben Pile (AKA @clim8resistance) with this extremely witty remark way back when in March 2016:
Here are the initial entrants for the 2017 competition:
1) Mike Haseler, whose Twitter profile tells us that his heart’s greatest desire is a “Scotland free from the EU”. We’ll forgive Mike his minor typo and give him lots of credit for his imaginative use of a cryptic computer programming language to impart a similar message to Ben Pile’s award winning entry last year:
Go forth and multiple or is that Forth> : go multiple And ;
— Mike MPE (Planetary Engineer) #Endlockup #NoMuzzle (@scotpolitik) February 17, 2017
2) AndyG55, who is another expert emitter of ad homs in a long line of such creatures on the blog of Tony Heller (AKA “Steve Goddard”).
Over at “Steve’s” recently renamed “Deplorable Climate Science” blog I had the temerity to point out that the deplorable emperor was somewhat scantily clad, having claimed “Over the past nine years, there has been a huge increase in the area of thick Arctic sea ice”:
Balderdash Tony!
Need I say more?
To which Andy wittily responded:
2017 extent above 2016 for this day.
Need I say more.!
You are starting to look even more STUPID and IGNORANT than usual Jimbo.
Off you trot and get some info on long term Arctic sea ice history from your Exeter bum-chums.
Or are you going to continue to be CLIMATE CHANGE DENIER #1.
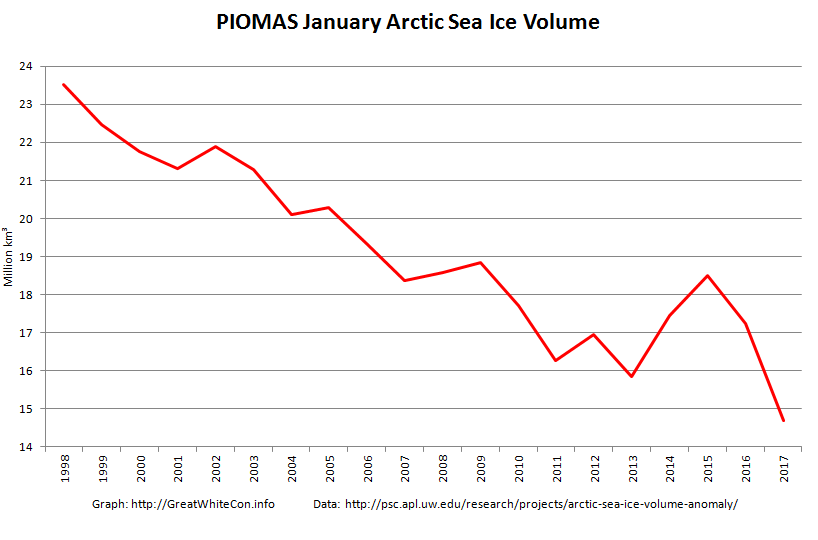
3) Gator69, who is another denizen of “Deplorable Climate Science” and a regular entrant in our “New Einstein” contests. In response to my PIOMAS post above, Gator fired back with a by now familiar theme:
Starvation Jim! How many times must I rub your nose in your genocide before you get it?
Please feel free to provide feedback to our 2017 jury in the space provided below.
Shock News! The David and Judy Show took to the road once again last night, aided and abetted by all the usual suspects. We’ll skip the Breitbarts, Hellers and Watts of this world and head straight for the now ex Prof. Judith Curry‘s “Climate Etc.” blog. There we will discover “Climate scientists versus climate data“, a guest post by ex NOAA scientist John Bates. According to John:
The most serious example of a climate scientist not archiving or documenting a critical climate dataset was the study of Tom Karl et al. 2015 (hereafter referred to as the Karl study or K15), purporting to show no ‘hiatus’ in global warming in the 2000s (Federal scientists say there never was any global warming “pause”). The study drew criticism from other climate scientists, who disagreed with K15’s conclusion about the ‘hiatus.’ (Making sense of the early-2000s warming slowdown). The paper also drew the attention of the Chairman of the House Science Committee, Representative Lamar Smith, who questioned the timing of the report, which was issued just prior to the Obama Administration’s Clean Power Plan submission to the Paris Climate Conference in 2015.
Regular readers of our humble scribblings will be well aware that here in Great White Con Ivory Towers we are firmly of the opinion that there never was a ‘hiatus’. Exhibit 1:
Animation by izen
What’s all the fuss about then? Perhaps our old friend David Rose can explain in layperson’s terms? In his latest article for the Mail on Sunday, catchily entitled “Exposed: How world leaders were duped into investing billions over manipulated global warming data”, he assures us that amongst many other things:
The [K15] report claimed that the ‘pause’ or ‘slowdown’ in global warming in the period since 1998 – revealed by UN scientists in 2013 – never existed, and that world temperatures had been rising faster than scientists expected. Launched by NOAA with a public relations fanfare, it was splashed across the world’s media, and cited repeatedly by politicians and policy makers.
But the whistleblower, Dr John Bates, a top NOAA scientist with an impeccable reputation, has shown The Mail on Sunday irrefutable evidence that the paper was based on misleading, ‘unverified’ data.
It was never subjected to NOAA’s rigorous internal evaluation process – which Dr Bates devised.
Now “never subjected to NOAA’s rigorous internal evaluation process” isn’t quite the same thing as “manipulated global warming data”, but Mr. Rose has more!
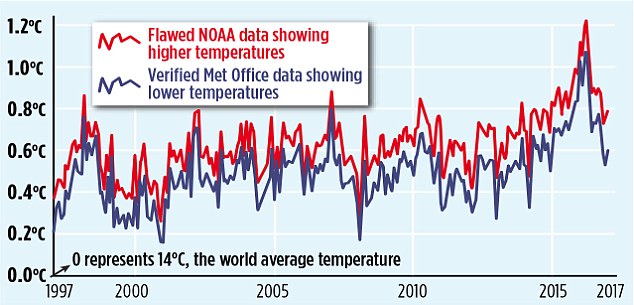
The misleading ‘pausebuster chart’: The red line shows the current NOAA world temperature graph – which relies on the ‘adjusted’ and unreliable sea data cited in the flawed ‘Pausebuster’ paper. The blue line is the UK Met Office’s independently tested and verified ‘HadCRUT4’ record – showing lower monthly readings and a shallower recent warming trend
That graph looks convincing enough, doesn’t it? However there is a teensy weensy little upward adjustment in there that Mr. Rose is apparently unaware of, as NASA’s Gavin Schmidt pointed out late last night:
This morning Carbon Brief has published a much longer takedown of the aforementioned purple prose by Zeke Hausfather, who points out amongst other things that:
What [David Rose] fails to mention is that the new NOAA results have been validated by independent data from satellites, buoys and Argo floats and that many other independent groups, including Berkeley Earth and the UK’s Met Office Hadley Centre, get effectively the same results.
As per usual Mr. Rose doesn’t stick to science, however dubious. He also dabbles in politics. On that front we are assured:
Karl’s ‘Pausebuster’ paper was hugely influential in dictating the world agreement in Paris and sweeping US emissions cuts. President Trump, above right, has pledged to scrap both policies – triggering furious claims by Democrats he is a climate ‘denier’ and ‘anti-science’.
Thanks to today’s MoS story, NOAA is set to face an inquiry by the Republican-led House science committee.
We’ll have much more to say on this controversy in the context of our “Alternative Facts” investigation in due course, but for the moment at least it looks to us as though the nth iteration of “Climategate 2” barely made it out of the starting gate. However Mr. Rose’s loyal army of “rebloggers, retweeters, plagiarisers and other assorted acolytes” and that “Republican-led House science committee” may of course have other ideas?
[Edit – February 5th PM]
Commentary on Judith Curry’s blog brought to light an article by Peter Thorne. He says, amongst many other things:
I worked for three and a bit years in the NOAA group responsible in the build-up to the Karl et al. paper (although I had left prior to that paper’s preparation and publication). I have been involved in and am a co-author upon all relevant underlying papers to Karl et al., 2015.
The ‘whistle blower’ is John Bates who was not involved in any aspect of the work. NOAA’s process is very stove-piped such that beyond seminars there is little dissemination of information across groups. John Bates never participated in any of the numerous technical meetings on the land or marine data I have participated in at NOAA NCEI either in person or remotely. This shows in his reputed (I am taking the journalist at their word that these are directly attributable quotes) mis-representation of the processes that actually occured. In some cases these mis-representations are publically verifiable.
See if you can spot where Dan & Dan mention the term #Climategate.
[Edit – February 6th]
It’s been a busy day! Several of my carefully crafted comments have ended up on Judy’s cutting room floor, but this one has eluded the red pencil thus far. I bring you this warming and educational nightcap created by an ad hoc team of celebrity international chefs for “warmists” around the planet:
You have to keep clicking through to the very bottom of the virtual mug in order to experience the full benefit of the beverage.
Thank you and good night from May or May Not Land. I’ll see you all in the morning (UTC).
[Edit – February 7th]
Lot’s of pertinent papers just in from Great White Con guest author Kevin Cowtan of York University. Kevin is part of the by now world famous team of Cowtan & Way, who have long championed the cause of accurate Arctic temperature measurements. Kevin tells us:
The paper by Karl and colleagues corrected two known problems with the temperature observations: poor coverage of the Arctic, and a change from ships to buoys. Both had been known about since 2008:
It took NOAA seven years to produce a paper correcting their temperature data, and even now their monthly updates still omit much of the Arctic. The UKMO temperature record is also missing much of the Arctic and only partially corrects the ship problem. Both lead to an underestimation of recent warming.
The agencies face an impossible dilemma – on one hand they have to slowly and carefully evaluate new results, and on the other they have to provide an up-to-date temperature record. Rather than rushing out corrections, they appear to have been extremely conservative.
So there you have it. For more accurate Arctic temperature metrics turn to Cowtan & Way and/or the Berkeley Earth Surface Temperature study! The long delay in improving the quality of the data published by NOAA and the UK Met Office has led to confusion amongst the public, politicans, and even other scientists. All three groups have been trying to understand a supposed “pause” in warming, which in our (humble?) opinion never actually happened. If you disagree with that assessment please feel free to take a good long look at izen’s animation at the top and then explain to us very slowly where you see a “hiatus”.
You may also wish to take a good long look at another guest post on the topic of “the pause”, this time authored by our very good friend Bill the Frog.
[Edit – February 8th]
Watch this video to discover how “The Land of the Free” has morphed into “TrumpLand” in a matter of weeks. The “interrogation” of Rush Holt of the AAAS:
A show trial of the American Association for the Advancement of Science? Congressman Lamar Smith presiding!
[Edit – February 9th]
We like the UK Met Office’s new style. They have taken off the kid gloves, rolled up their sleeves, and they’re extracting the Michael from David Rose on Twitter with great glee:
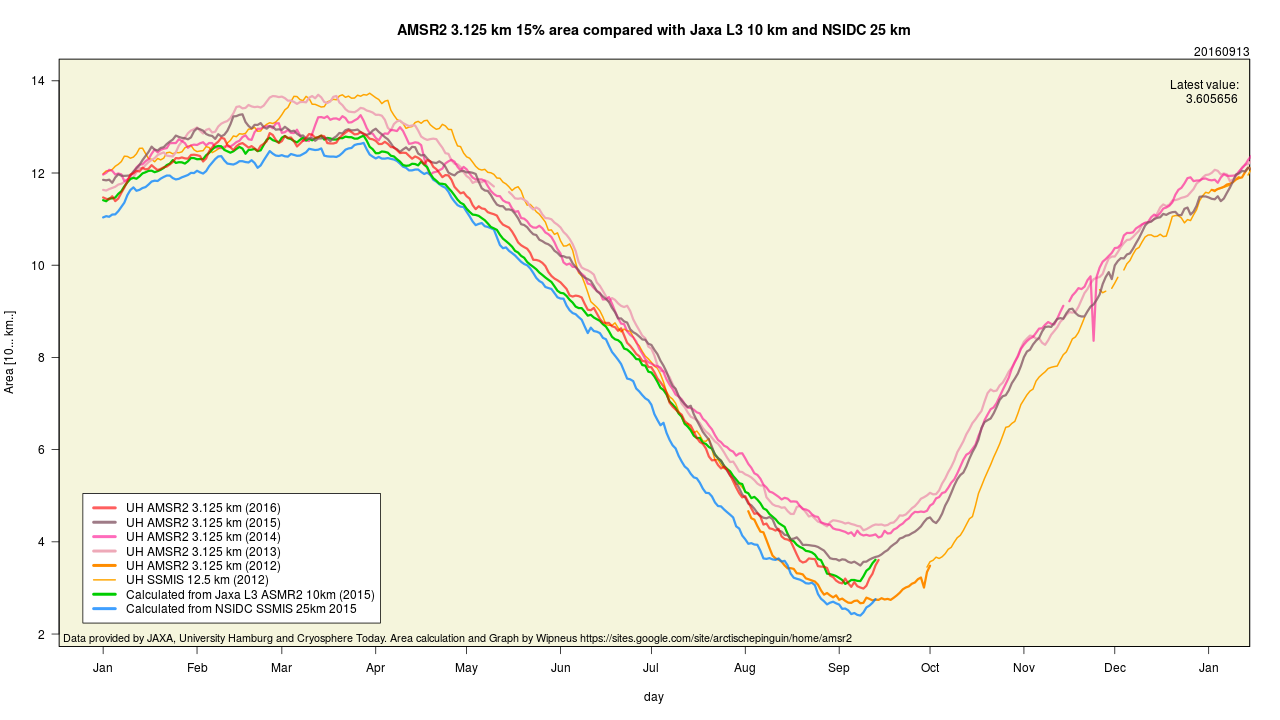
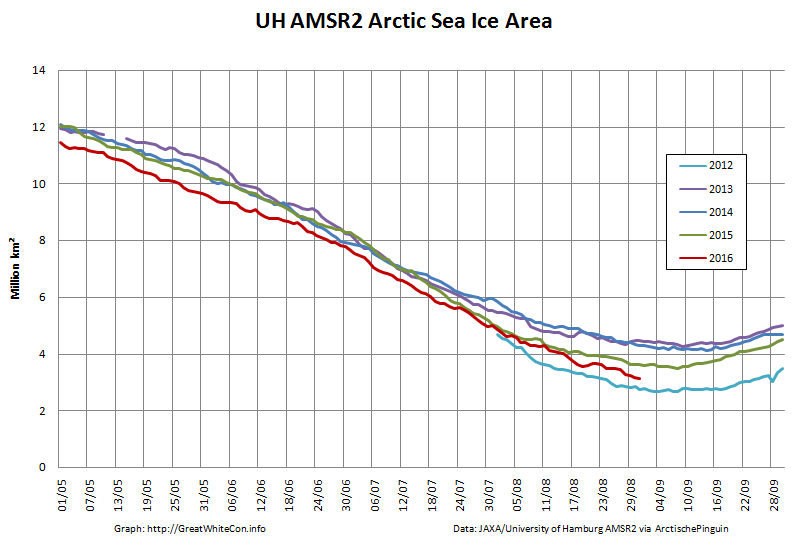
Today we bring a positive plethora of “Shock News!”. Starting with sea ice, yesterday Anthony Watts published an article on WUWT about the 2016 Arctic minimum extent. That’s not too surprising perhaps, but what’s shocking is that included one of Wipneus’ graphs of Arctic sea ice AREA that has been gracing our very own Arctic Sea Ice Graphs page since Anthony mocked us for not having such a thing. His take on this momentous event?
All of the data I’ve looked at agrees, Arctic sea ice is now on the upswing, and in a big way.
This graph from Wipneus shows the abruptness of the change.
Here it is, in all its glory:
What’s not in the least surprising is that Anthony failed to provide a link to the source of the graph, and that our polite request for that to be corrected remains invisible took a long time to be approved over at Watts Up With That. Here it is, in all its ignominy:
As if that isn’t enough to cope with for one day, there was even bigger shock yesterday. Tony Heller stated:
which is accompanied by a screenshot from an Independent article which reads as follows:
One of Britain’s leading climate change sceptics – former Chancellor Nigel Lawson – has admitted that humans are causing global warming.
Speaking to the House of Lords’ Economic Affairs Committee, Lord Lawson said he did not “question for a moment” that carbon dioxide was a greenhouse gas.
And he accepted there was “huge agreement” among scientists that it was having “some effect” on the atmosphere.
But the former Conservative Cabinet minister argued it would be “crazy” for the UK to try to stop burning the fossil fuels that produce carbon dioxide, claiming countries like China were simply carrying on doing so.
Lord Lawson founded the Global Warming Policy Foundation in 2009 to oppose attempts to reduce the rise in temperatures and has emerged as one of Britain’s leading sceptics.
Here’s a recording of Nigel Lawson versus Adair Turner yesterday, testifying before the Economic Affairs Committee:
It seems as if the “97% consensus” on “anthropogenic global warming” is now at least 97.1%. I cannot help but wonder when Anthony Watts will reveal the news to his faithful followers? Meanwhile most of Tony’s many merry minions are unhappy bunnies this morning. 2015 “New Einstein” award winner Gail Combs complains:
The biggest problem is with that statement he just betrayed every skeptic and agreed that we are all tinfoil hat Den1ers.
It does not matter what else he added. That ‘sound bite’ is a HUGE WIN for the other side. Add the Ship of Fools ‘win’ and they will bash us into the ground.
I am sorry Tony, but it is a complete PR disaster especially right before the US elections.
As you well know this has never been about science. Our side plays by the Marquess of Queensberry Rules, their side are dirty street fighters using Alinsky’s Rules for Radicals and lie and cheat and browbeat at every turn. So their side wins EVERY D@MN TIME!
Mr. Heller comments:
I completely agree with [Nigel Lawson]. Do you consider me to be a “real skeptic” ?
Answers on a virtual postcard please, in the space provided below.
Looking at the latest Eastern Arctic ice charts from the Canadian Ice Service, I don’t think the crew [of Northabout] will exactly be shitting themselves.
I’m more interested in what a certain Tony Heller will be coming out with next.
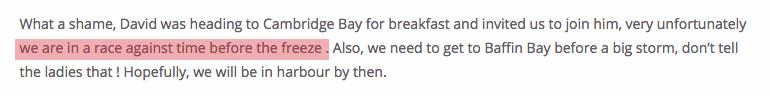
It seems as though a certain Tony Heller and his many merry minions are already shitting themselves at the prospect of the plucky little yacht Northabout NOT getting “trapped in ice”. Hence we can provide this preliminary report on the astonishing ignorance of Tony and his faithful flock concerning all things Arctic. For the present we will confine ourselves to Mr. Heller’s latest missive on the Polar Ocean Challenge expedition, wittily entitled but strangely capitalised:
“we are in a race against time before the freeze”
I blogged the same thing yesterday, and the usual hysterical alarmists showed up complaining.
As luck would have it I blogged the same thing recently, and in actual fact it’s the usual hysterical denialists who have showed up both here and there to pen over a hundred comments and counting. Let’s take a look at a select few of them shall we?
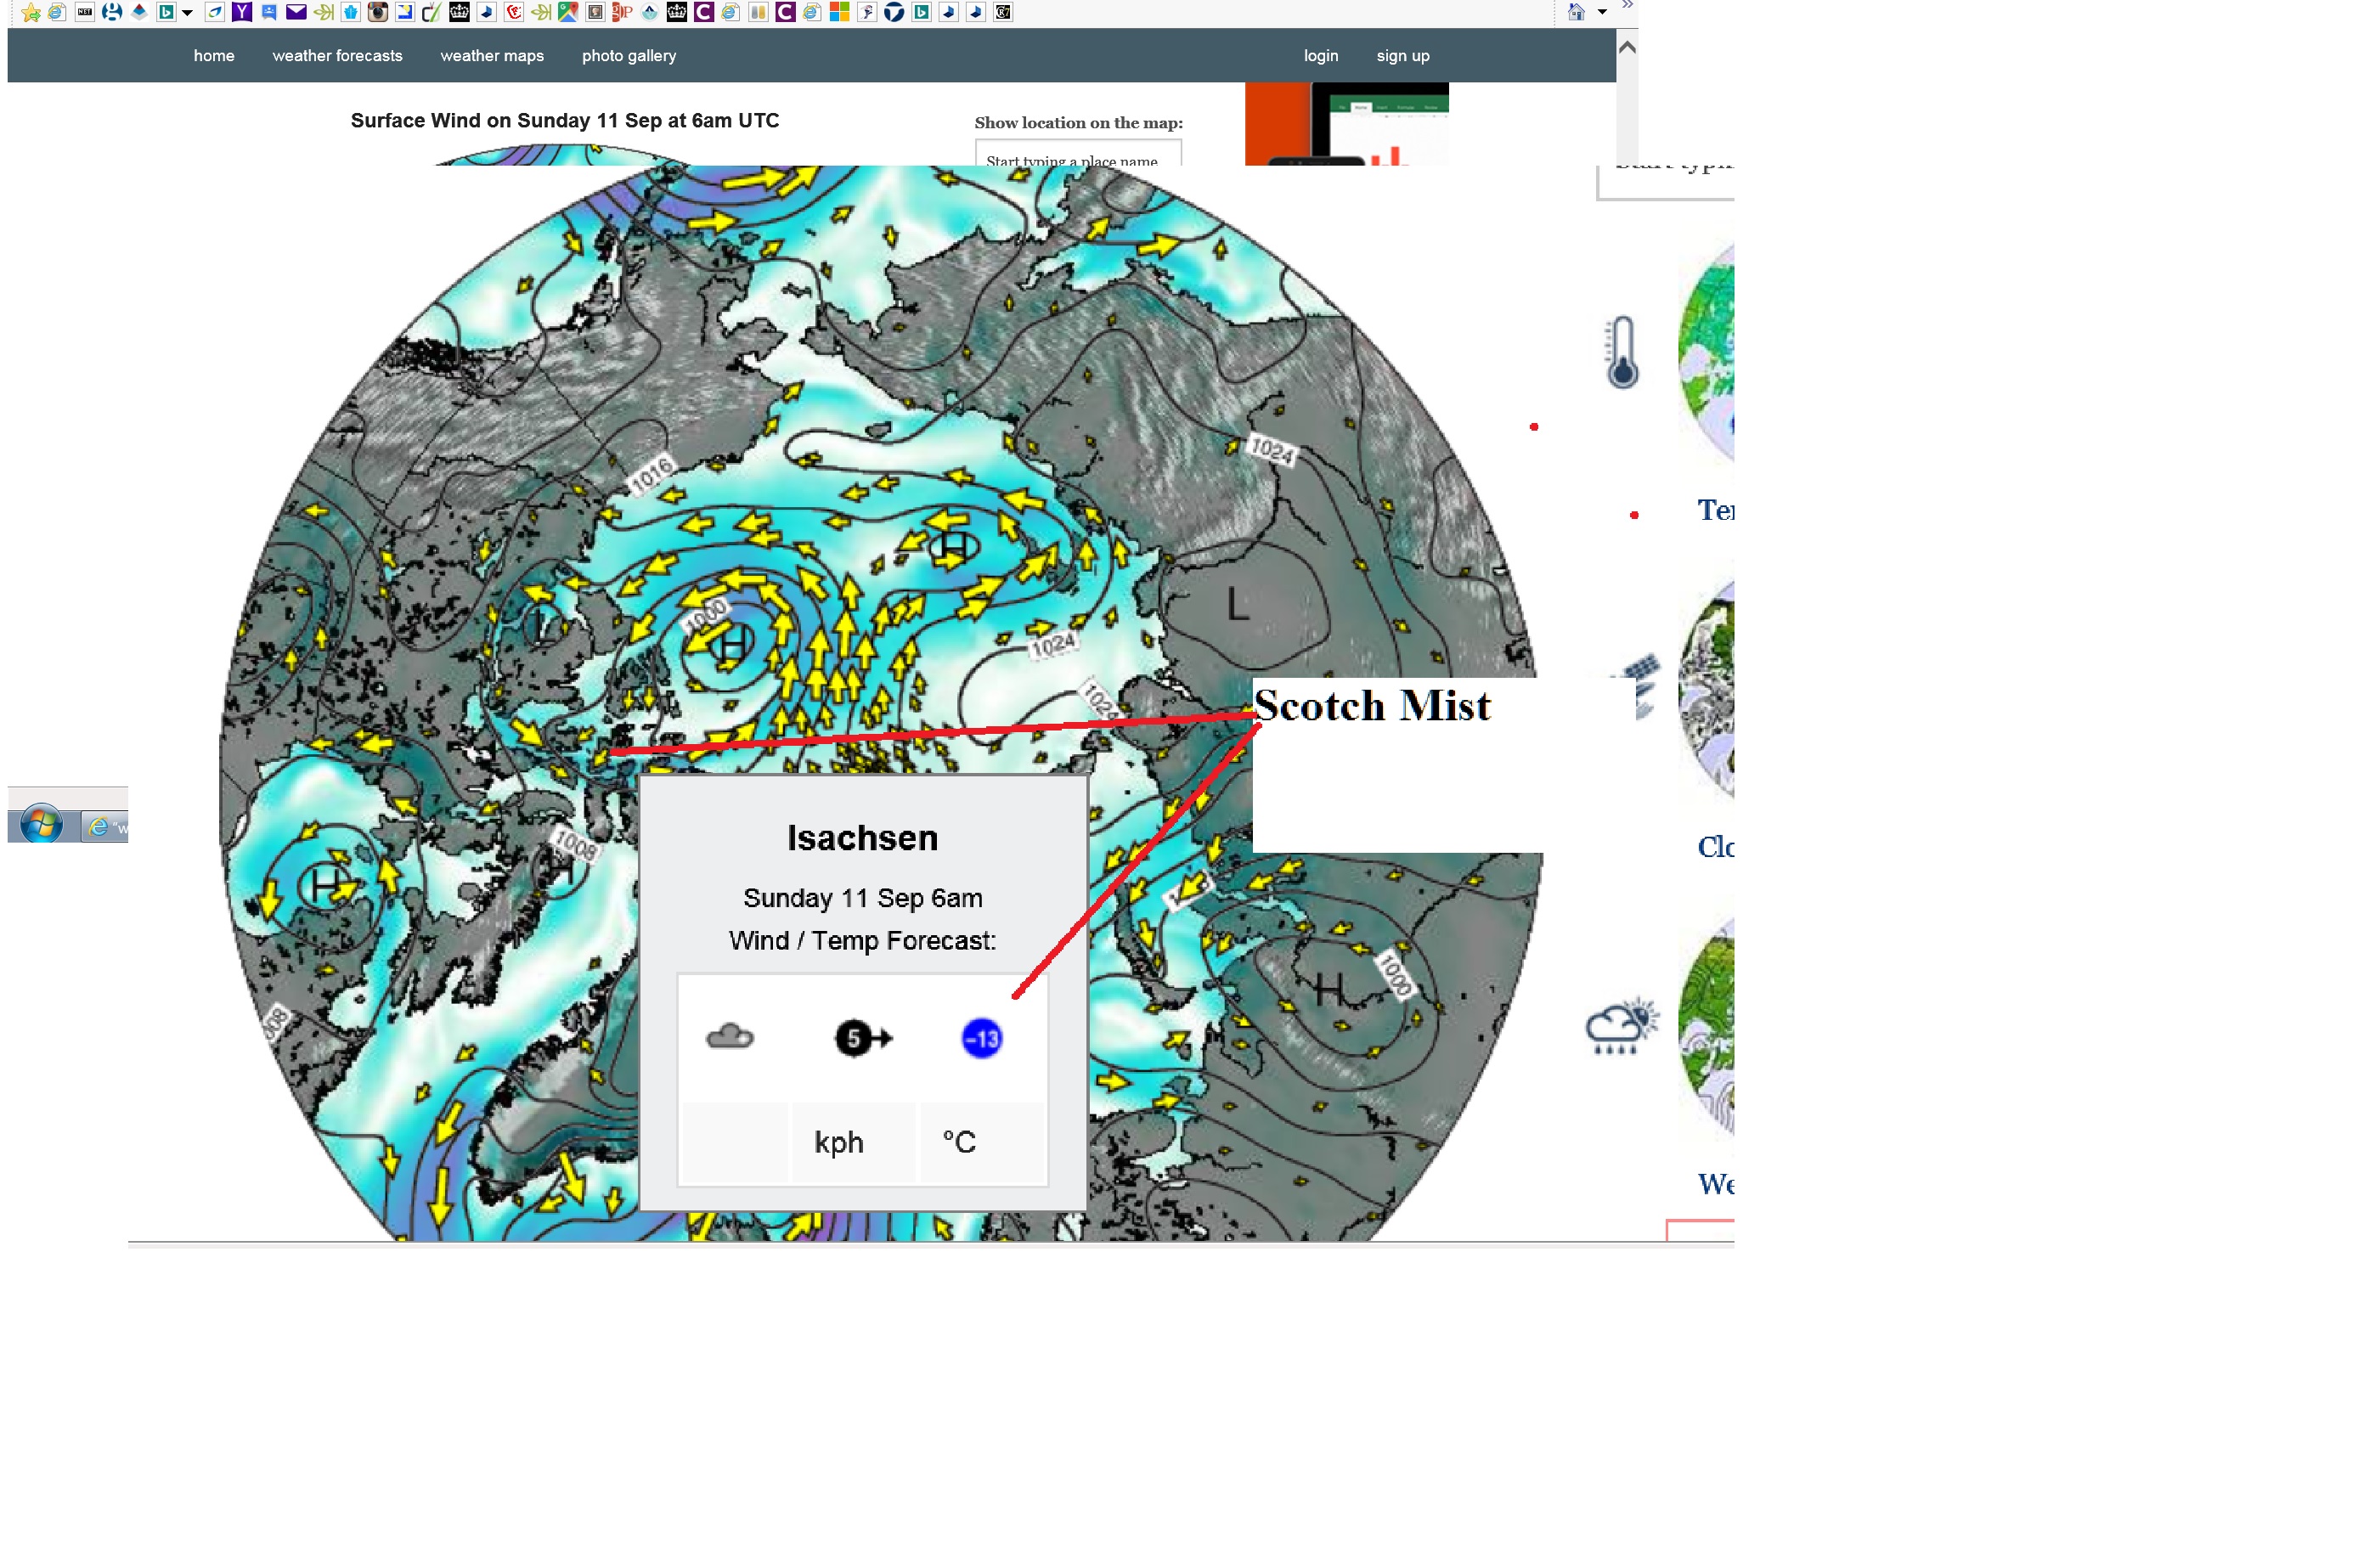
For a reason known only to herself our old friend (and “New Einstein” award winner!) Gail Combsposted the weather forecast for Resolute yesterday, but without any link to her source(s):
TONIGHT: Saturday Night 09/10 80% / 1-3 in of snow
Snow showers early will become steadier snow overnight. Low 28 °F. Winds S at 15 to 25 mph. Chance of snow 80%. Snow accumulating 1 to 3 inches.
Then today Lawrence13 posts what purports to be the weather forecast for Isachsen whilst simultaneously suggesting that Isachsen is just around the corner from Resolute, which of course it is not:
Thing to note though, is that the northern part of the Northwest Passage was blocked by multi-year ice – foremost the western exit – FOR THE ENTIRE SUMMER, and was even not passable by ice breakers.
Needless to say Andy didn’t trouble to provide a link to his source. I therefore took the liberty of revealing to him the latest and greatest Great White Con Northwest Passage video:
He appears to be convinced that Isachsen is somewhere on the “main” route through the Northwest Passage. I took the trouble to inform him that:
According to the Environment Canada Climate Severity Index, Isachsen and the surrounding area has the worst weather in Canada with a CSI severity value of 99 out of a possible 100.
For some strange reason the Polar Ocean Challenge team are not planning on sailing past Isachsen any time soon!
His reply?
Nothing strange about it at all, Jimbo.
The Satellite Sea Ice charts told them they had NO CHANCE through the main North West Passage, so they snuck around through Cambridge Bay.
Andy then doubled down by throwing down all his gauntlets and issuing this challenge to Snow White’s manhood:
FFs, Jimbo, you have GOT to be joking !!!
Come on, coward, take my challenge.
Next year, WITHOUT sea ice charts, FOSSIL FUELS, or satellite navigation..
Do you fancy your chances surfing calving glaciers against GMac?
It’s hard to be sure, but I don’t think he does:
So, refusing to take up the challenge.
Coward.
There’s no answer to that! Or is there?
Please feel free to let me know when you want to be fitted for your polar bear suit Andy.
As you may be able to imagine, there’s plenty more dumbness to be discovered where that lot came from. As the day wears on and as time allows expect more amusing anecdotes from the depths of the cryodenialosphere.
[Edit – September 13th]
Not content with the dumbness quotient displayed by his faithful follows at the Blog of Fools, “Steven Goddard” has taken to Twitter to harangue poor defenceless Snow White. Here is a brief extract from his Gish gallop around the North Pole:
[Edit – September 14th]
Not content with haranguing Snow White about the Arctic “Steve”/Tony and merry Mendy fulminate about flash flooding in Cornwall & Manchester. Allegedly it’s all the media’s fault.
[Edit – September 19th]
Tony Heller has blocked poor defenceless Snow White on Twitter, so she cannot include his Tweets in her Storifys. Please feel free to try and work out where this one fits in the grand scheme of things:
Only a complete moron would conflate a wave with "rising sea levels" https://t.co/QeeYOJHLZr
It seems self evident that Americans have no sense of humour. They can’t even spell the word correctly. What’s more they also seem not to have the slightest clue about flash floods on this side of the Atlantic, preferring instead to rant about (the lack of) sea level rise on the shores of the “Land of the Free”:
Believe it or not, there’s plenty more where that lot came from.
No is the obvious answer just at the moment, since the plucky little yacht is currently parked at a pontoon in Tuktoyaktuk. However actual facts aren’t sufficient to stop Tony Heller suggesting that Andrew Freedman suggested on Mashable that Mark Serreze of the NSIDC said that such a feat is feasible:
Mark “Arctic Is Screaming” Serreze says the Ship of Fools could sail to the North Pole.
In an interview with Mashable, Serreze said sea ice coverage across the different regions of the Arctic has fallen dramatically in association with a series of unusually powerful summertime Arctic storms during August.
That much is certainly true, as we here at Great White Con have documented in detail. Mr. Heller however highlights this section of Mr. Freedman’s article:
In fact, if they want to, the Hempleman-Adams and the rest of the ship’s crew could actually sail nearly all the way to the North Pole, since sea ice cover is largely absent to about 86 degrees north, according to Mark Serreze, director of the National Snow and Ice Data Center (NSIDC) in Boulder, Colorado.
It’s not out of the question that the North Pole will become a geographical marker in open water, rather than ice cover, sometime in the next few weeks.
Serreze called this situation “pretty darned unusual.”
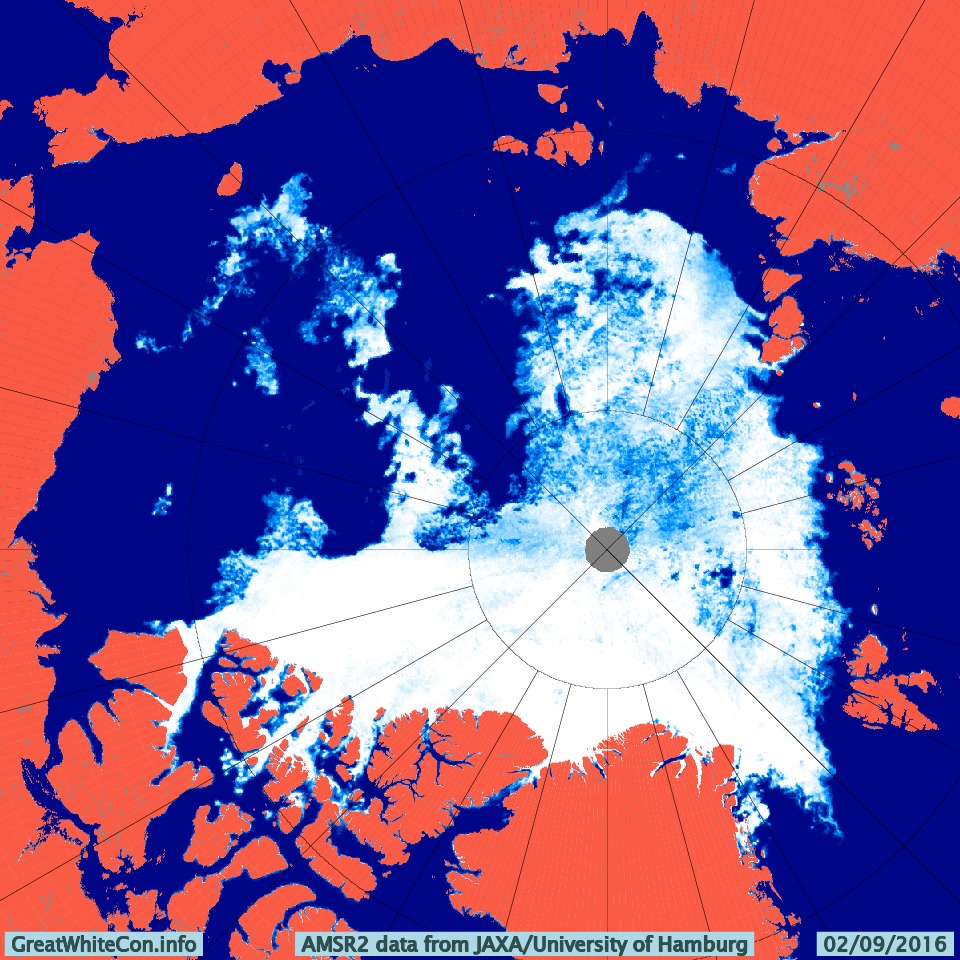
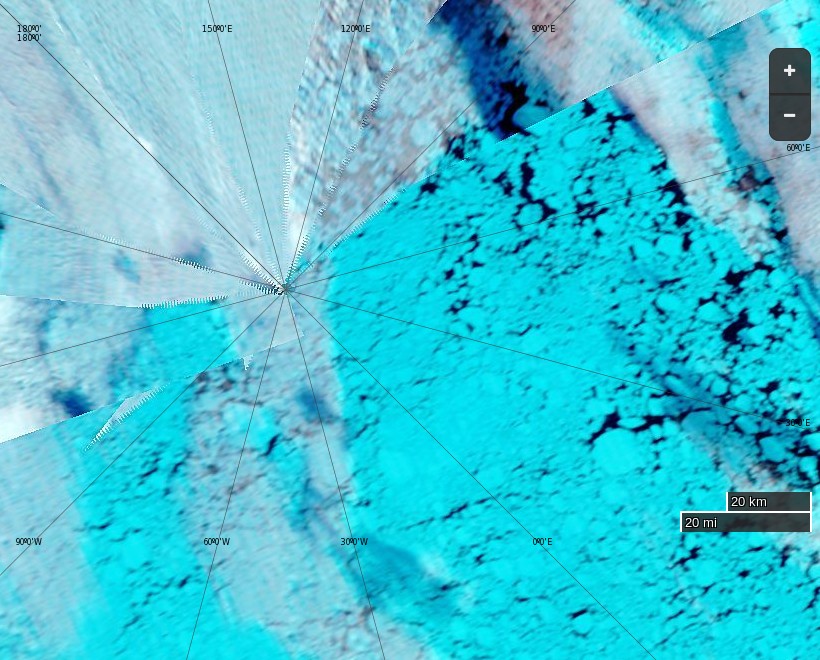
Let’s examine the facts about this “pretty darned unusual” situation shall we? Here is the latest high resolution AMSR2 visualisation of Arctic sea ice concentration:
Can you see the stretch of open water leading all the way from the East Siberian Sea, where Northabout was a couple of weeks ago, to 86 degrees north? Apparently Tony Heller and his faithful followers cannot! Not only that, but also supposedly:
A NASA image [shows that] the North Pole is indeed encased in Thick ice right now.
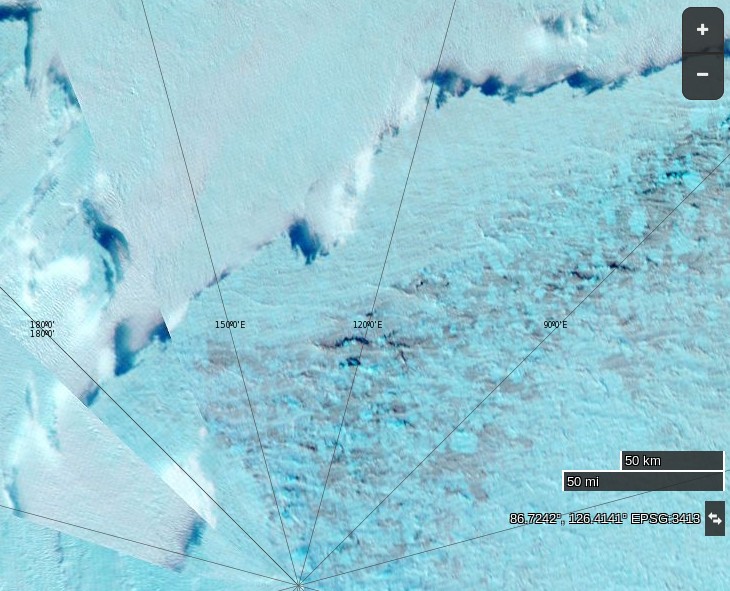
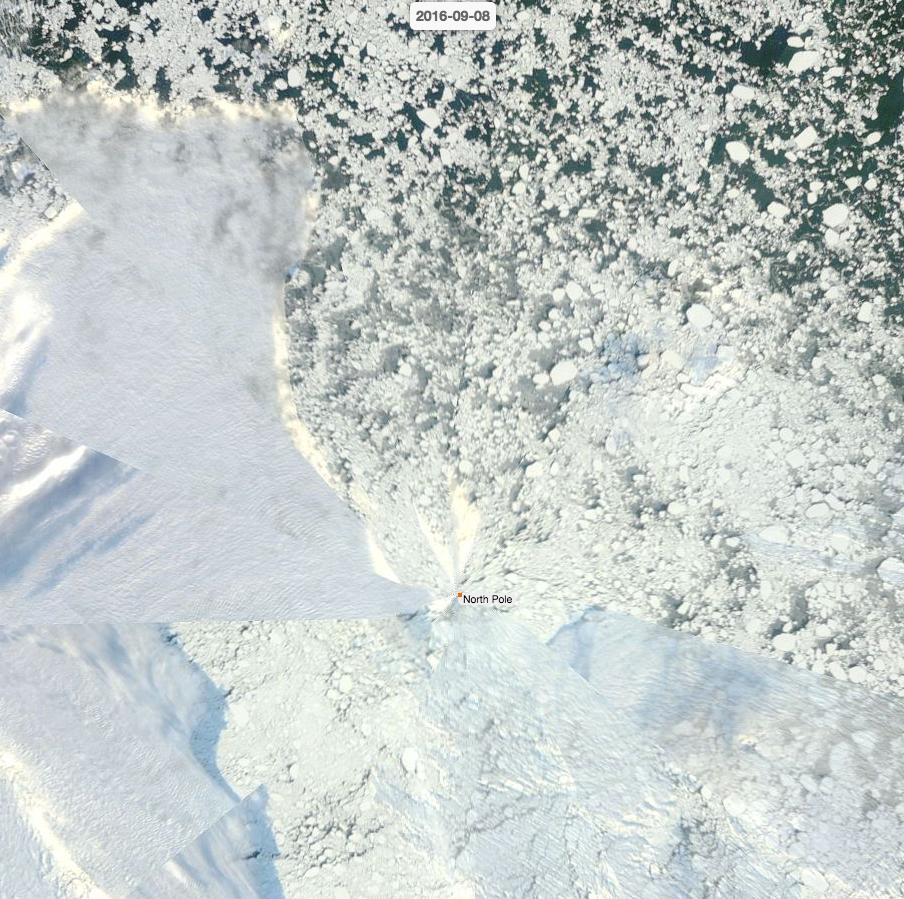
Here’s a (somewhat foggy) NASA image of the North Pole right now:
NASA Worldview “false-color” image of the North Pole on September 3rd 2016, derived from the MODIS sensor on the Terra satellite
and for good measure here’s a (somewhat foggy) NASA image from 86 degrees north in the Central Arctic Basin right now:
NASA Worldview “false-color” image of the Central Arctic on September 3rd 2016, derived from the VIIRS sensor on the Suomi satellite
Need I say more?
[Edit – September 4th]
Today Terra offers a glimpse of the Greenland side of the North Pole:
NASA Worldview “false-color” image of the North Pole on September 4th 2016, derived from the MODIS sensor on the Terra satellite
[Edit – September 5th]
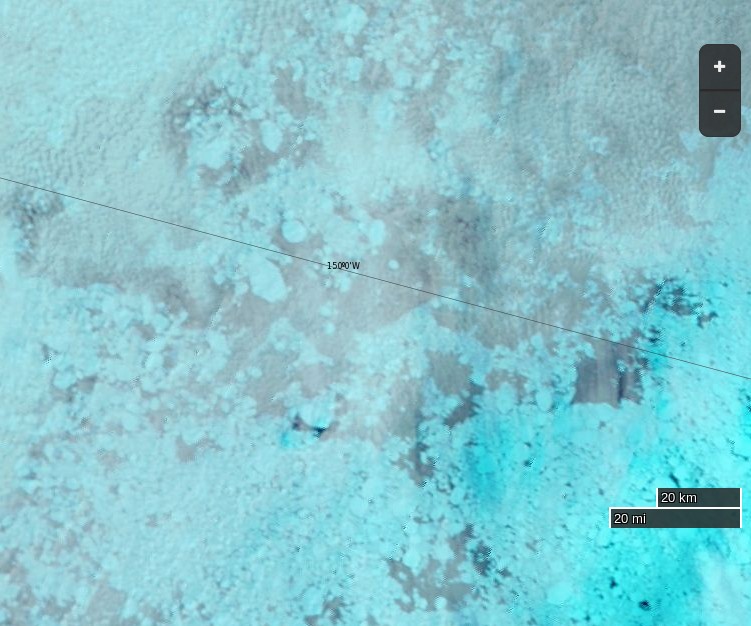
Today Aqua offers us a view of what’s left of the sea ice on the Siberian side of the North Pole:
NASA Worldview “true-color” image of the North Pole on September 5th 2016, derived from the MODIS sensor on the Aqua satellite
[Edit – September 9th]
SHOCK NEWS!!!
Tony Heller has just posted an accurate image of the state of the sea ice near the North Pole! Here it is:
The accompanying text is nonsense of course:
The Ship Of Fools is facing a -10C weather forecast in five days, which would be impassable. They better put their fossil fuel powered pedal to the metal and get out of there fast, so that they can go back to Bristol and lie about the ice.
Meanwhile, professional fraudster Mark Serreze said last week they could sail to the North Pole
Needless to say Tony doesn’t provide a link to his source. Try this one and then have a good look around on NASA Worldview.
September 2016 is here at last! I posed this question at the start of the recent “Great Arctic Cyclone“:
I wonder what the minimum for 2016 will be, and on what date?
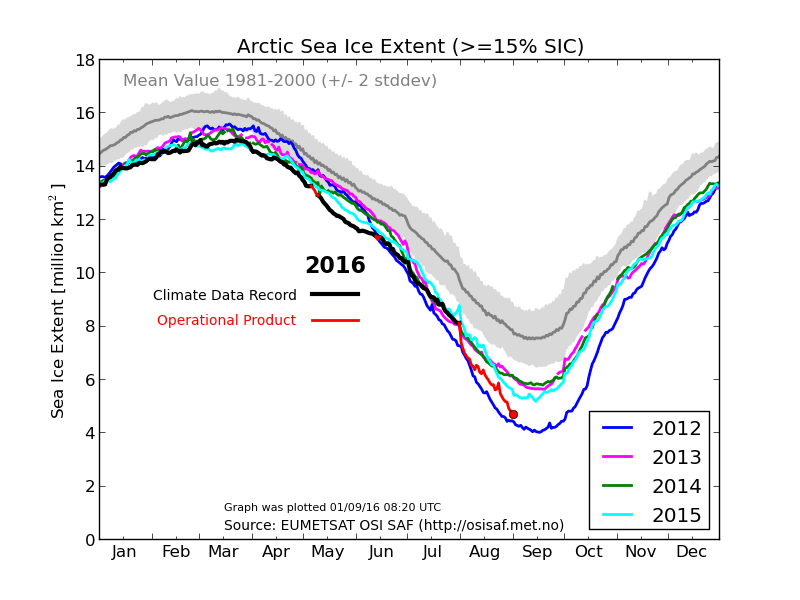
I’m still wondering, and the answer does of course depend on which Arctic sea ice metric you happen to be looking at. Here’s a few examples to be going on with. Firstly there’s Tony Heller’s extent metric du jour, from the University of Bremen:
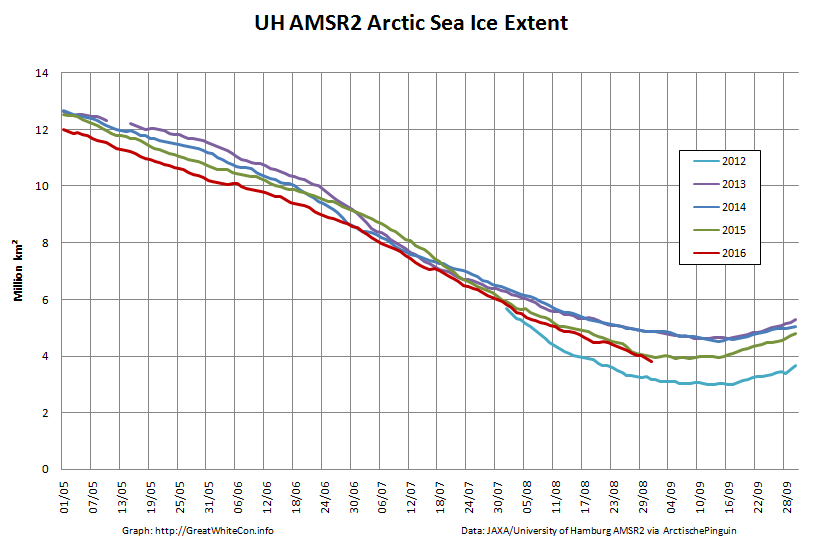
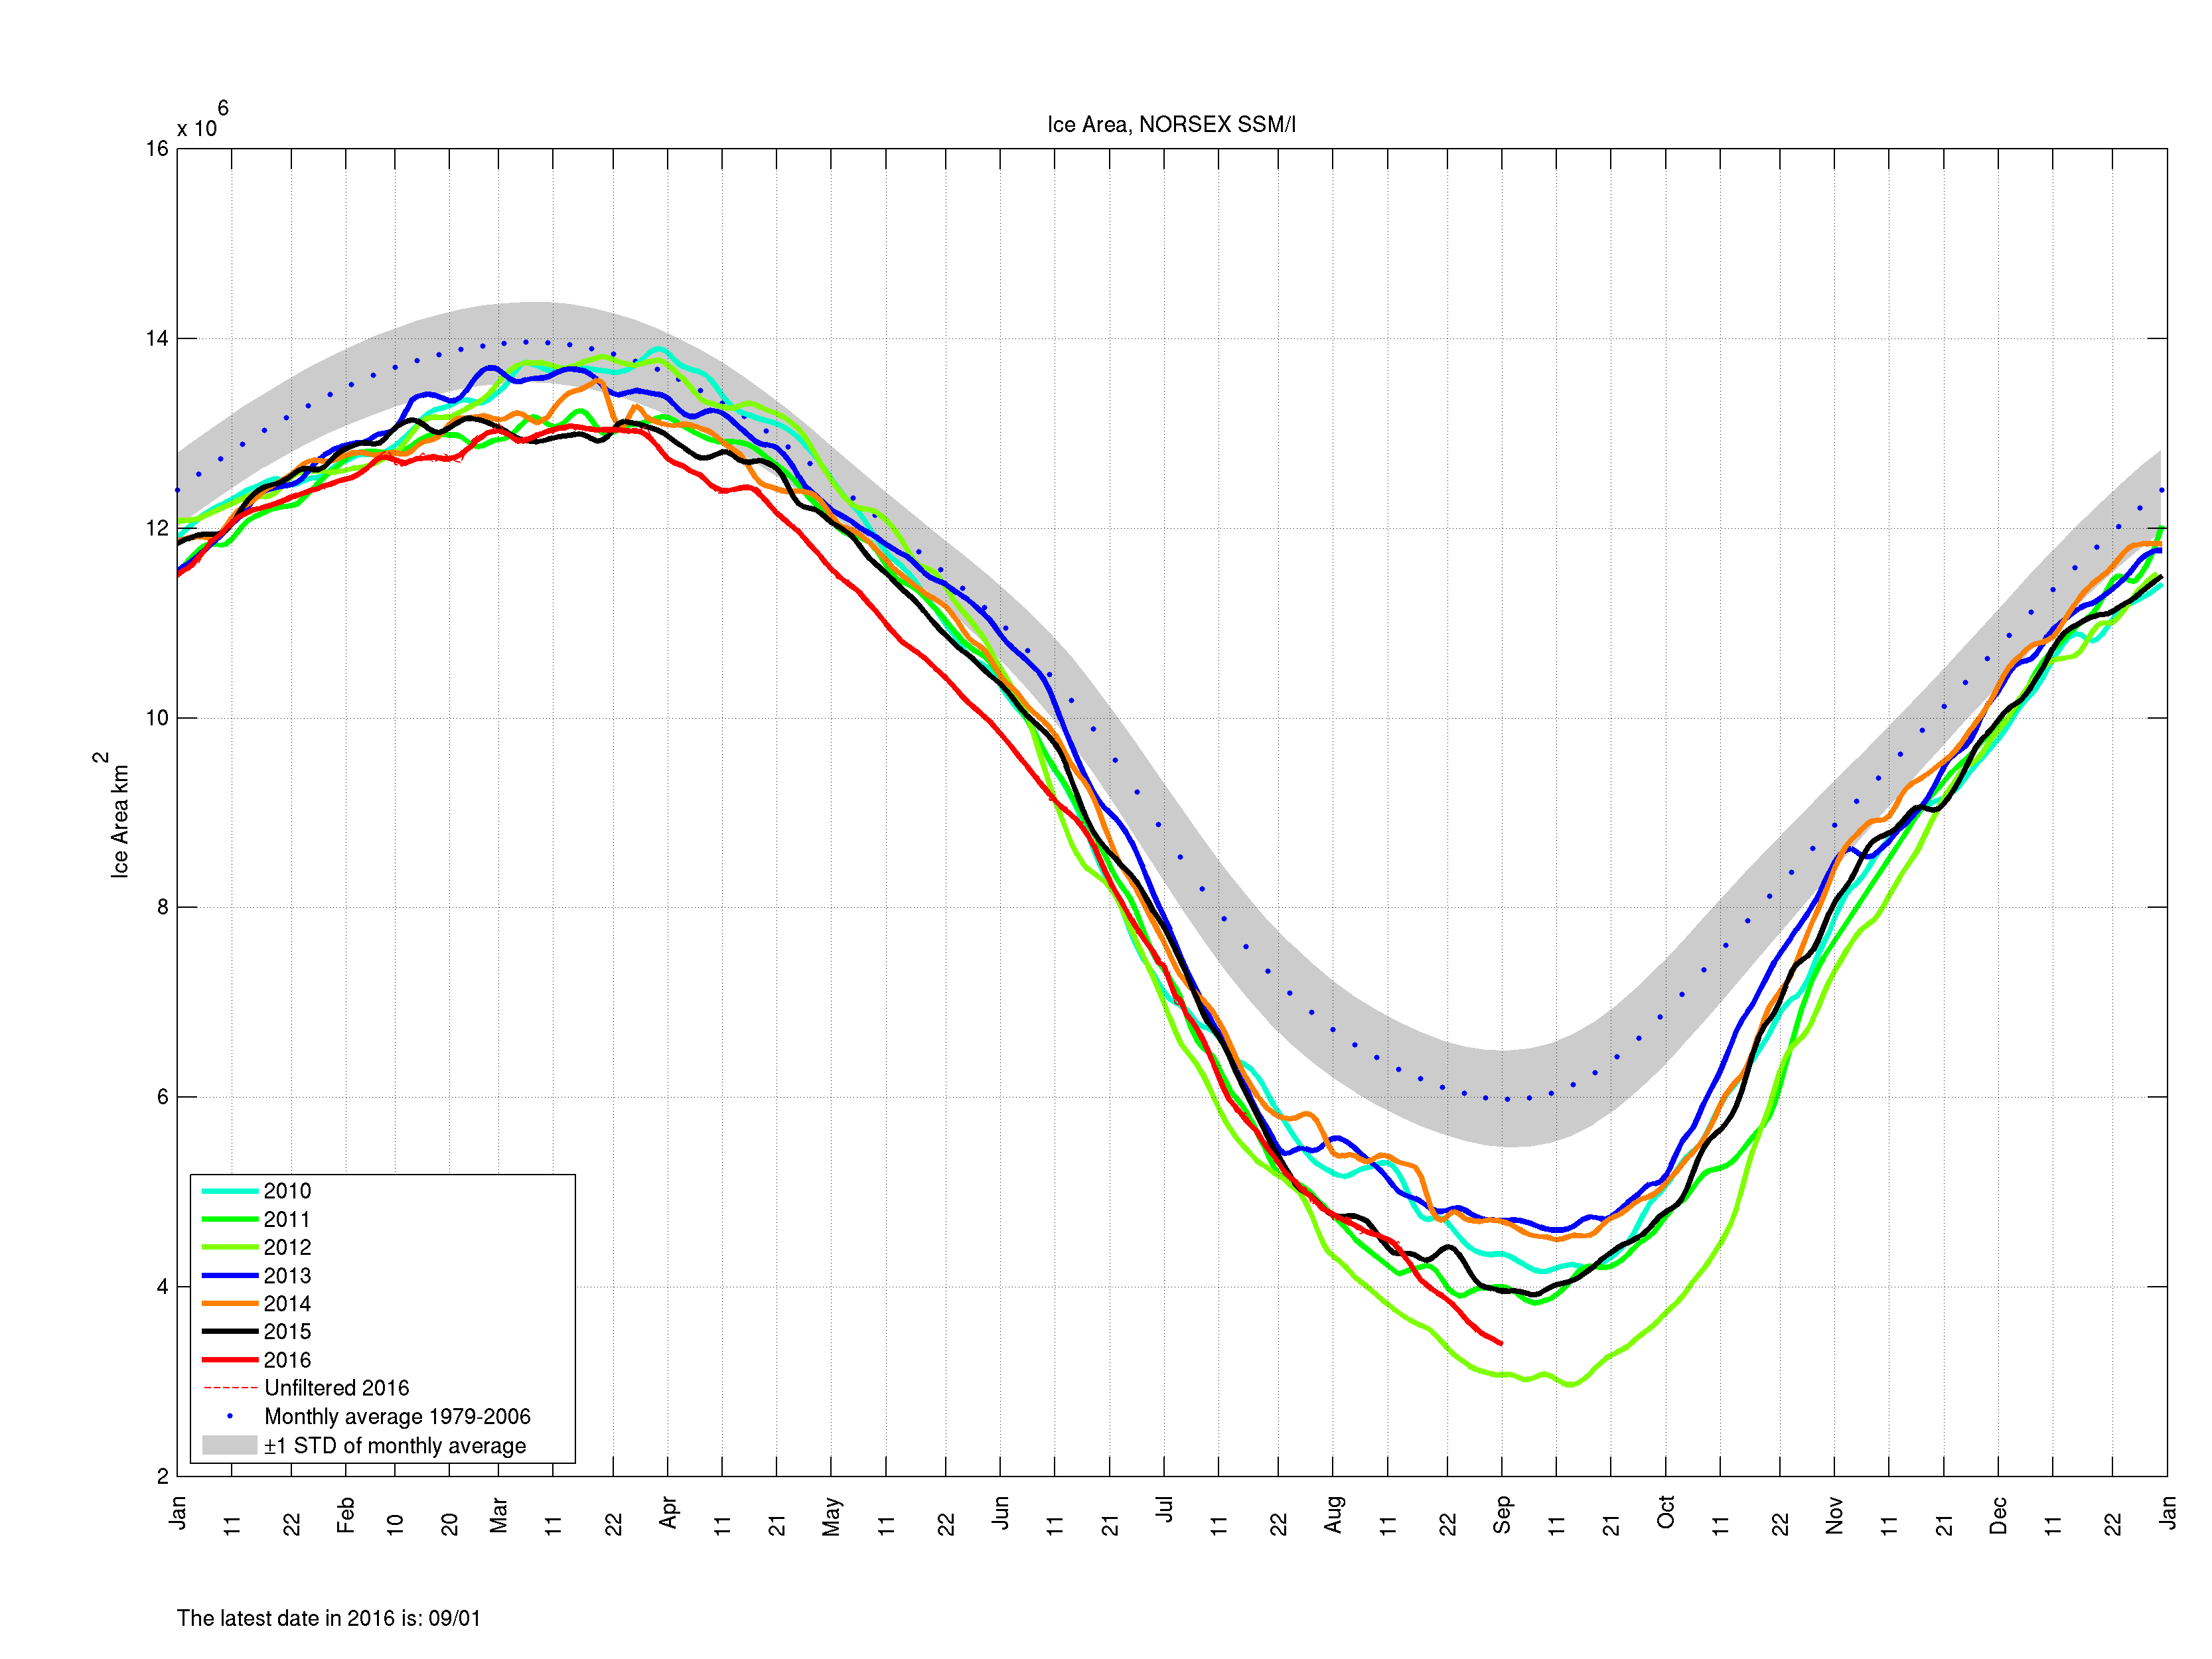
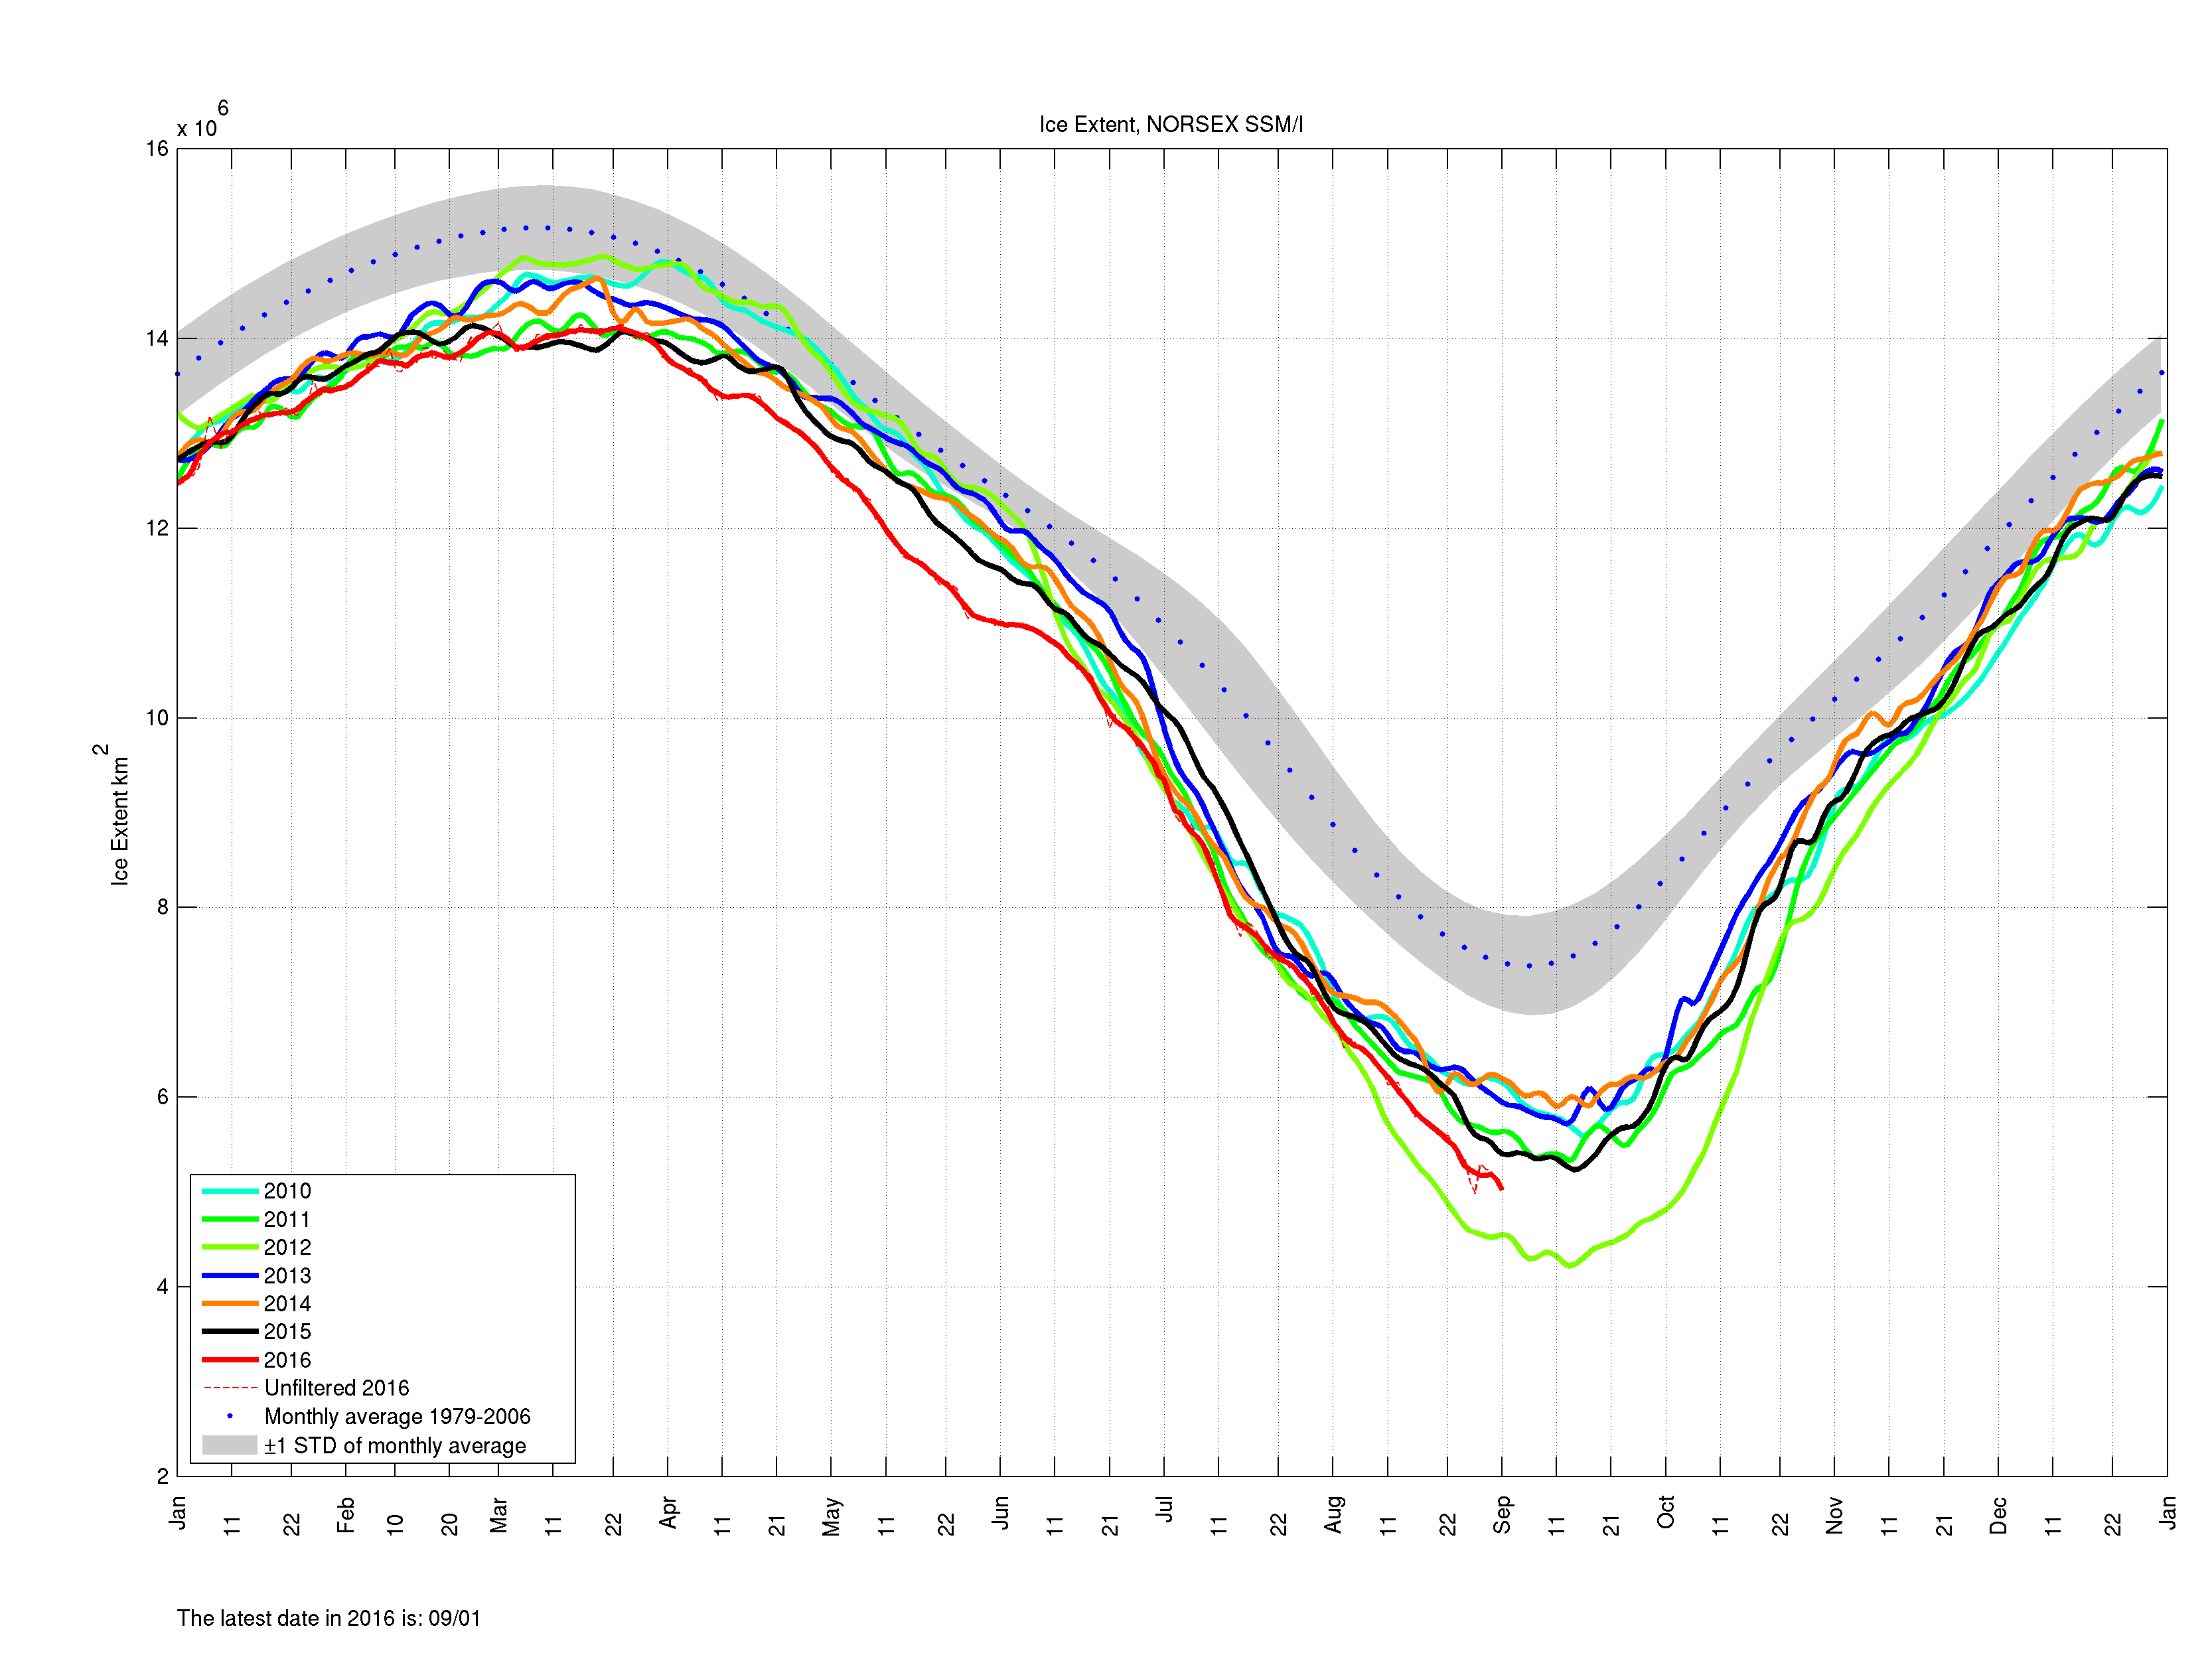
Finally here are “Snow White’s” favourite high resolution AMSR2 metrics derived by “Wipneus” from University of Hamburg AMSR2 concentration data:
Are there any other suggestions for numbers to keep a close eye on over the next few weeks?
[Edit – September 3rd]
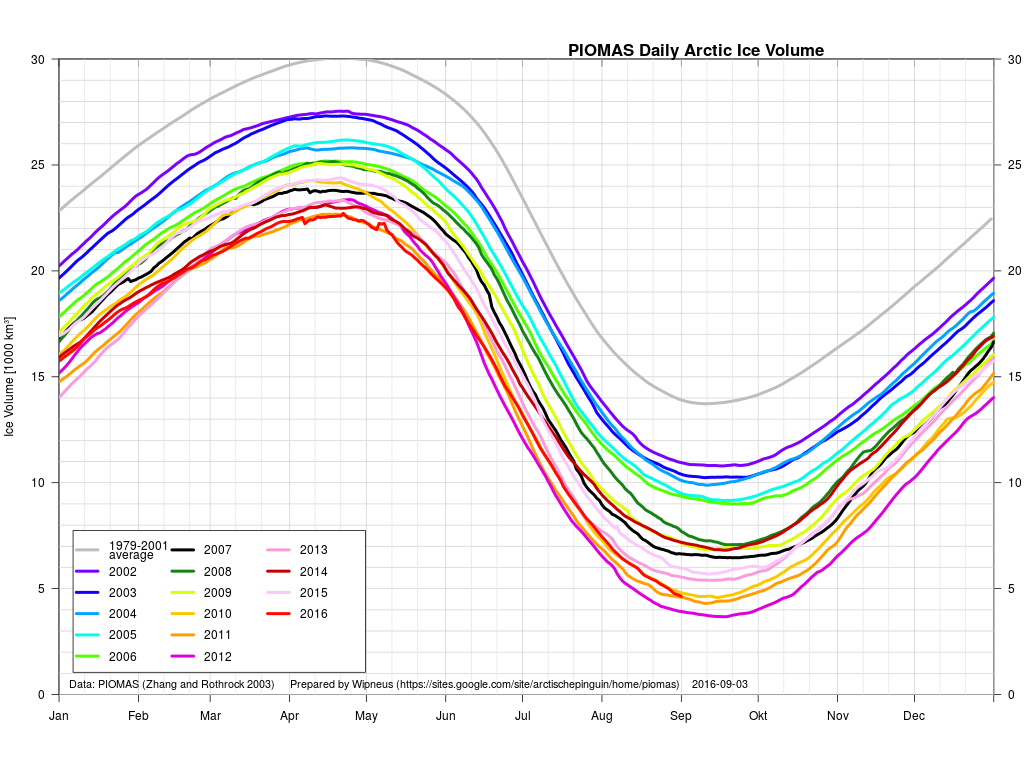
Arctic sea ice volume, as modelled by PIOMAS, has been updated to August 2016:
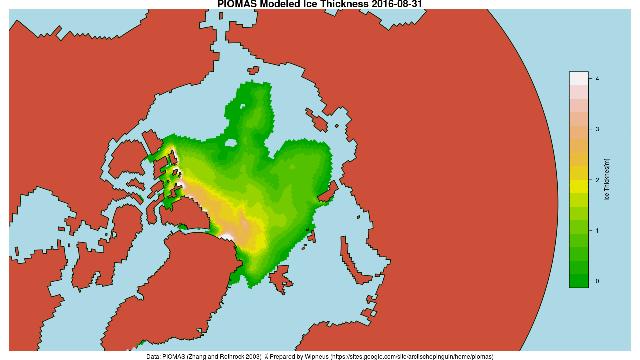
It’s currently 3rd lowest for the month, just a whisker behind 2011. Here’s the PIOMAS gridded data for August 31st 2016:
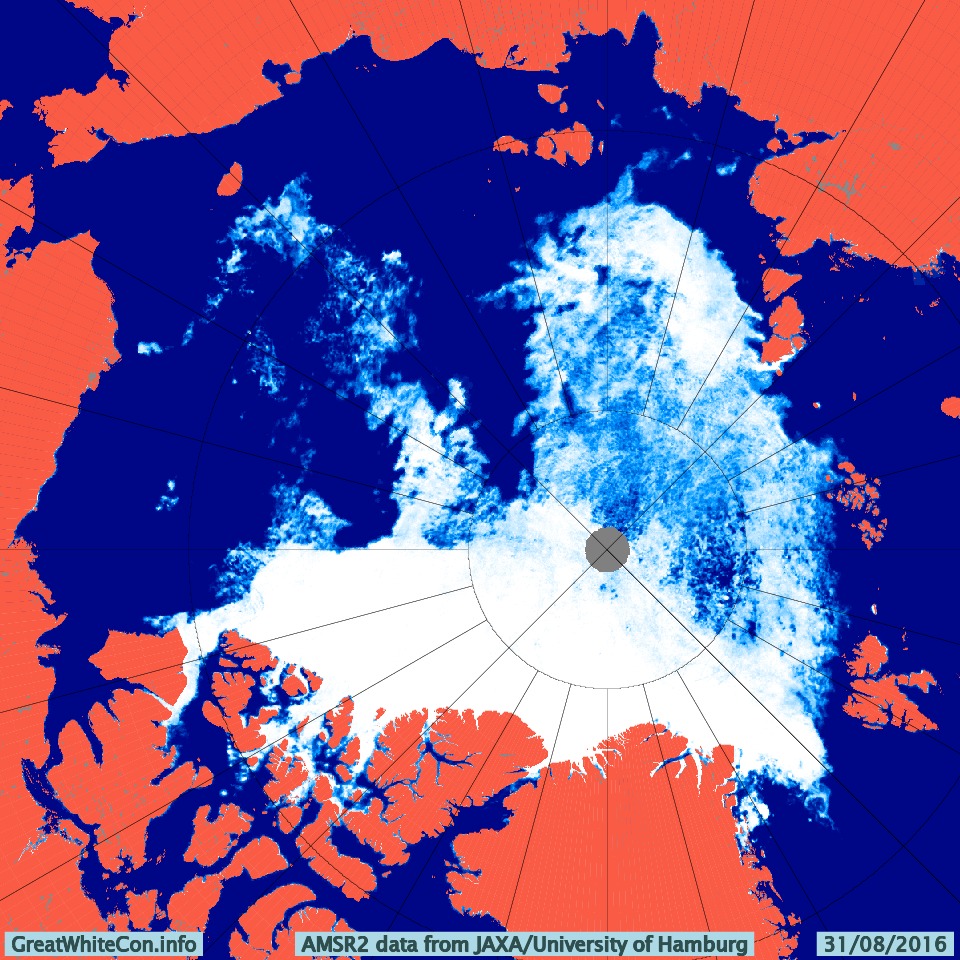
and for comparison purposes here’s the high res AMSR2 concentration map for the same date:
As suggested by Bill, here too are the Arctic Regional Ocean Observing System numbers. Much like the high res AMSR2 data they allow comparison between area and extent from the same sensor/algo combination, in this case SSMIS/NORSEX on a 25 km grid:
Both sources agree that currently the remaining ice is less compact in 2016 than it was in 2012.
[Edit – September 4th]
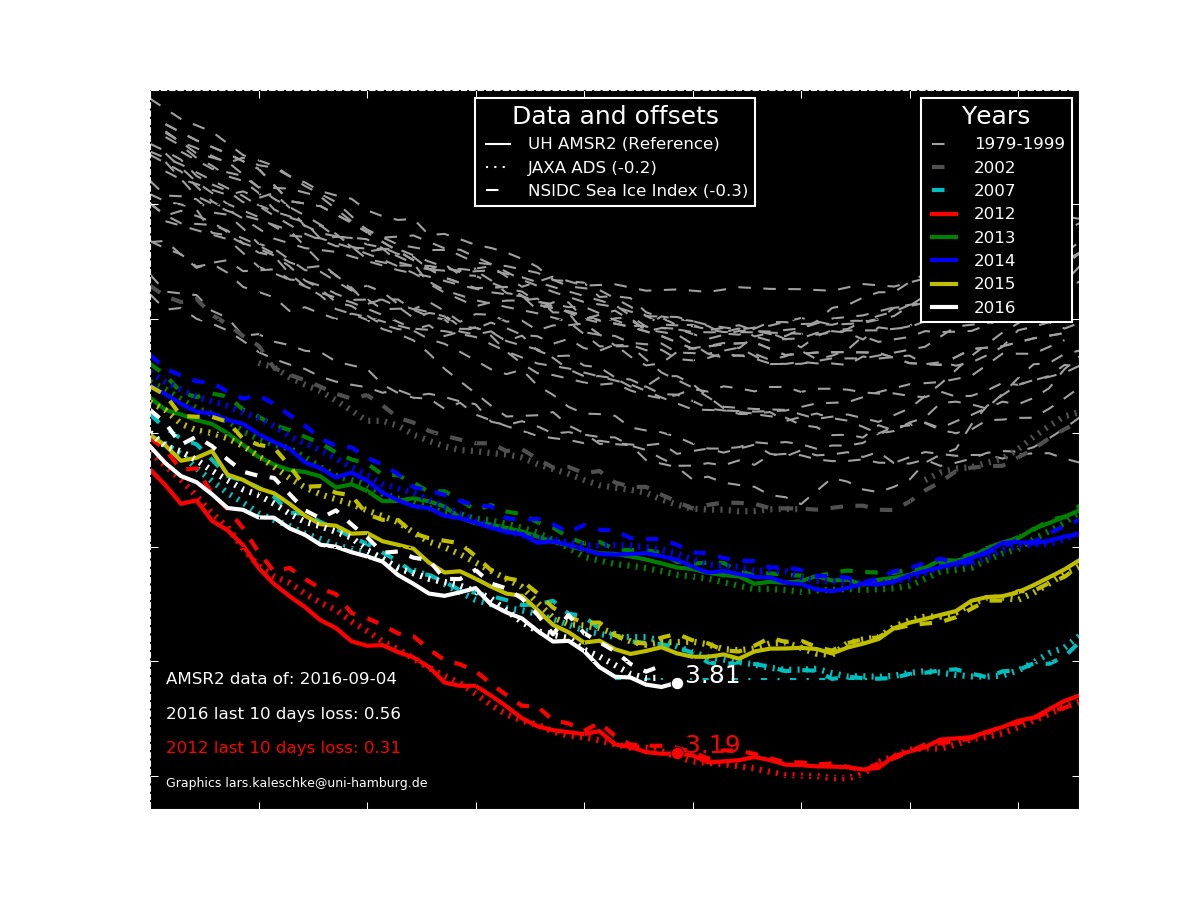
An interesting inter-metric comparison from Lars Kaleschke of the University of Hamburg:
Here’s another twist on the University of Hamburg’s AMSR2 extent, courtesy of Lars Kaleschke:
[Edit – September 11th]
Several of the metrics displayed above have increased over the last day or two. The 2016 minimum may be upon us, but another few days will have to go by before that’s finally confirmed. Whilst we wait here’s another metric to consider, as described on “Tamino’s” Open Mind blog:
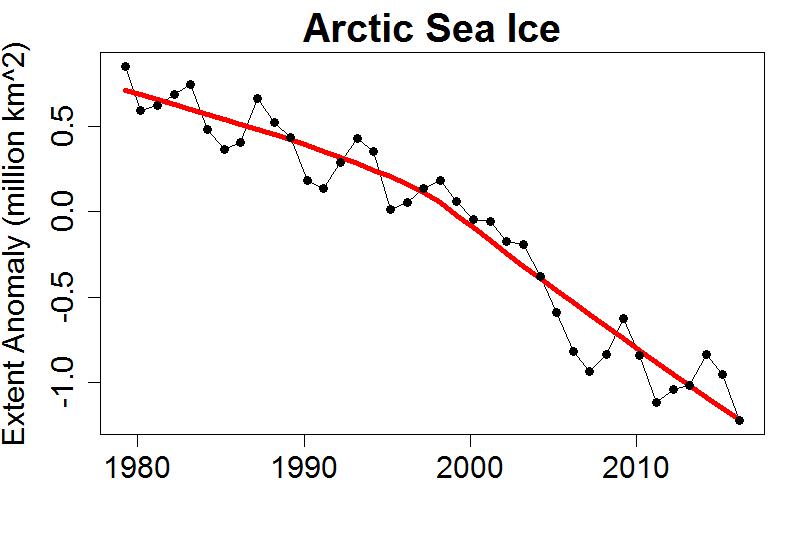
A plot of annual average extent also clearly shows the decline, and includes data from throughout the year rather than just the annual minimum. The figure for 2016 is the lowest on record, but the year isn’t done yet. If instead of averaging January-through-December we do September-through-August (to make the final year complete), we find that the most recent year is still the lowest on record:
Any way you look at it, Arctic sea ice is in decline. If you look at the entire year rather than just the annual minimum, the record year is this one.
[Edit – September 14th]
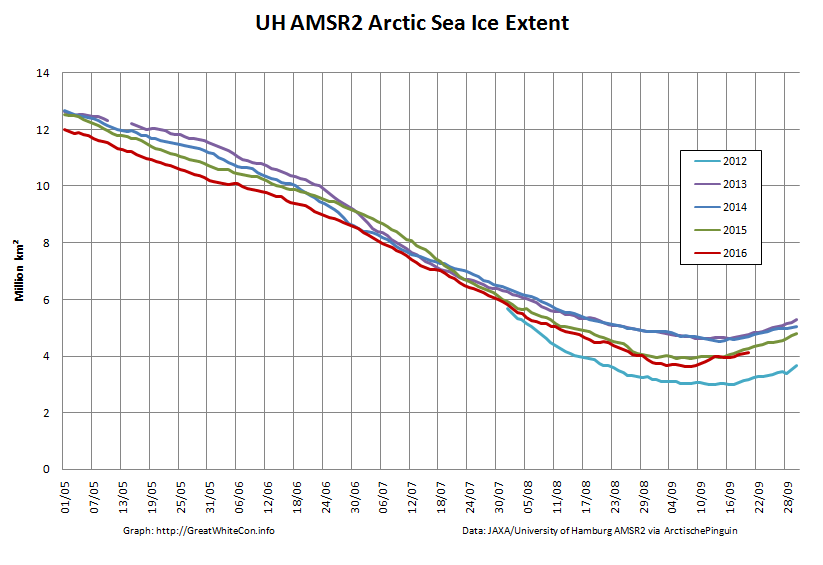
The refreeze has certainly started now. A quick look through the metrics. First of all the Hamburg University high resolution AMSR2 matched set:
Area just squeezed under 3 million km². Next up is JAXA extent:
which just failed to fall below 4 million km². Last but not least, just for the moment, is the NSIDC 5 day trailing averaged extent:
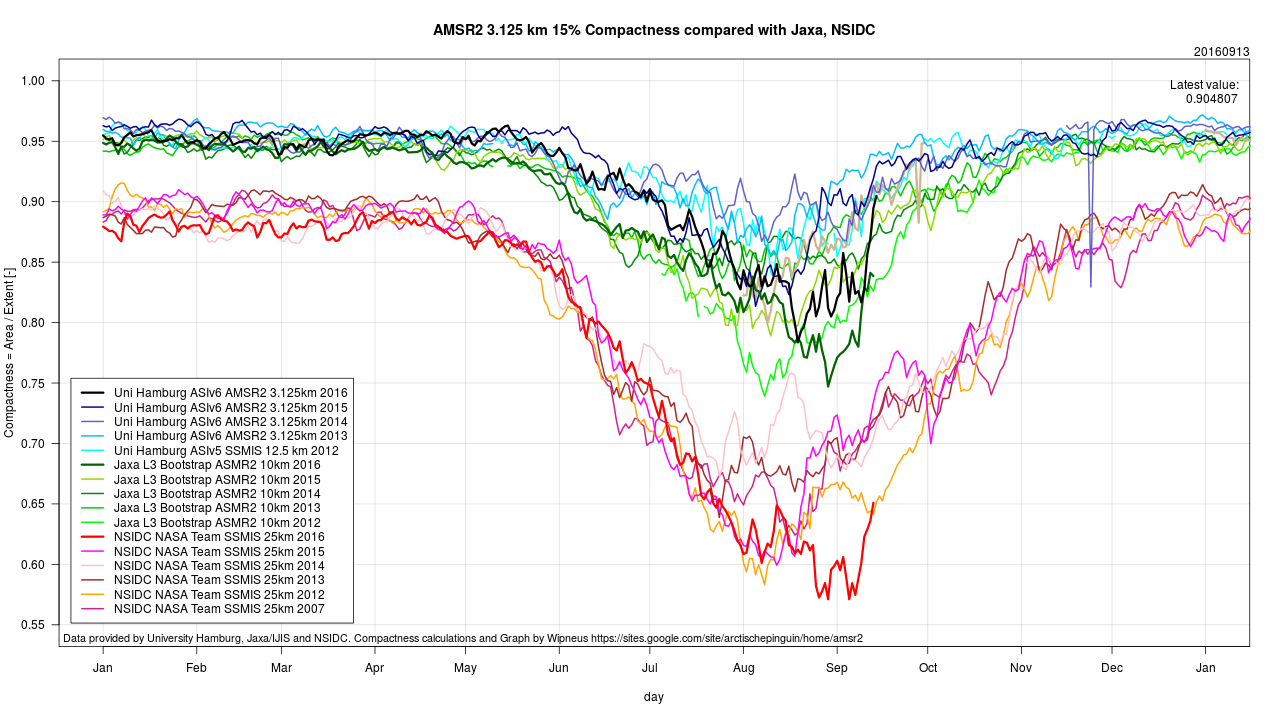
The most striking this year is the unusually large gap between area and extent for this time of year, illustrated by this “compactness” graph from Arctische Pinguin:
Note too the striking difference between different sensor/algo combinations for this metric!
[Edit – September 15th]
With the minimum now beyond doubt, here’s a new graphic from Lars Kaleschke of the University of Hamburg:
Need I say more?
[Edit – September 20th]
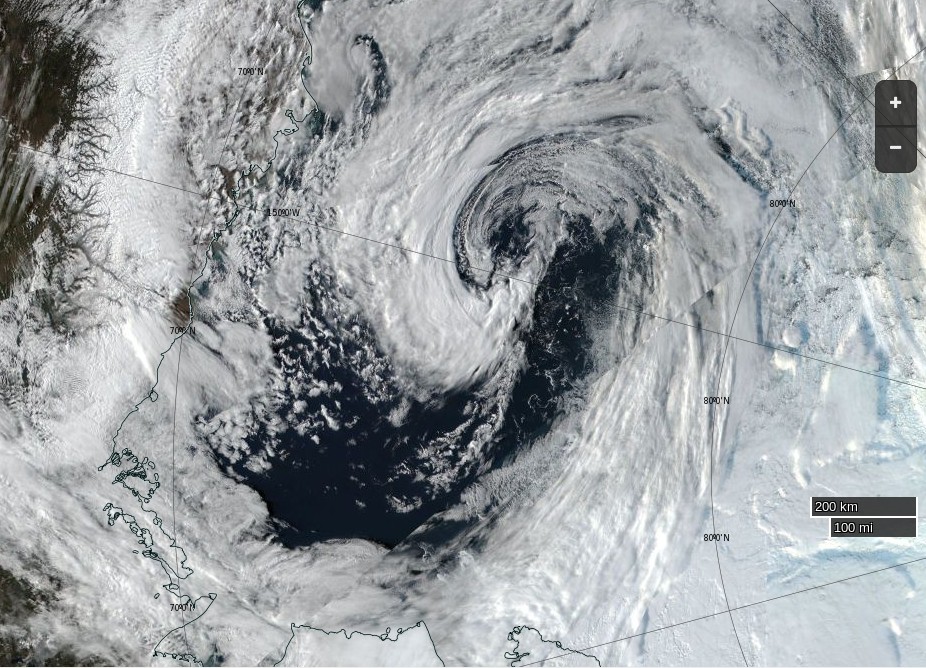
The September cyclone has now done its worst:
NASA Worldview “true-color” image of the Beaufort Sea on September 18th 2016, derived from the VIIRS sensor on the Suomi satellite
Leaving the area and extent metrics with an intriguing “double dip”:
2016 Minimum Milestones
September 3rd – JAXA extent dropped to 2nd place below the 2007 minimum at 4.05 million km²
September 7th – JAXA extent minimum of 4.02 million km²
September 8th – NSIDC single day extent dropped to 2nd place below the 2007 minimum at 4.083 million km². This proved to the minimum value for the year as a whole.
September 9th – NSIDC 5 day trailing averaged extent dropped to 2nd place below the 2007 minimum at 4.146 million km²
September 10th – NSIDC 5 day trailing averaged extent minimum of 4.137 million km²
This website uses cookies to improve your experience. We'll assume you're ok with this, but you can opt-out if you wish. Cookie settingsACCEPT
Privacy & Cookies Policy
Privacy Overview
This website uses cookies to improve your experience while you navigate through the website. Out of these, the cookies that are categorized as necessary are stored on your browser as they are essential for the working of basic functionalities of the website. We also use third-party cookies that help us analyze and understand how you use this website. These cookies will be stored in your browser only with your consent. You also have the option to opt-out of these cookies. But opting out of some of these cookies may affect your browsing experience.
Necessary cookies are absolutely essential for the website to function properly. This category only includes cookies that ensures basic functionalities and security features of the website. These cookies do not store any personal information.
Any cookies that may not be particularly necessary for the website to function and is used specifically to collect user personal data via analytics, ads, other embedded contents are termed as non-necessary cookies. It is mandatory to procure user consent prior to running these cookies on your website.