Tag Archives: Svalbard

Facts About the Arctic in June 2025

I’ve been away on a “road trip” during the first part of June, so this month’s initial update is a trifle tardy.

After a 100k “break” yesterday JAXA/ViSHOP extent is currently in a tie with 2024 for 4th lowest for the date, and still slightly below 2012.

The PIOMAS sea ice thickness map for May 31st continues to show plenty of thick ice in the Beaufort and Chukchi Seas:

However, the associated volume graph shows the 2025 curve only slightly above the previous low for the date in 2017:

I have recently received a disturbing email from the NSIDC, which reads as follows:

Continue reading Facts About the Arctic in June 2025

Facts About the Arctic in February 2025

This isn’t exactly “shock news”, since we (slightly hesitantly!) predicted this 5 days ago.

A GFS 2 meter temperature chart revealing greater than zero degrees Celsius at the North Pole later today:

The 2 meter temperature anomaly at the Pole is almost off the charts:

Plus the cause of these unusual numbers, a cyclone with central pressure of 959 hPa spinning north of Ellesmere Island at 18:00 UTC this evening:

All of which has led to the JAXA/Vishop Arctic sea ice extent being the lowest for the date since 1979 at least by a significant margin:

Continue reading Facts About the Arctic in February 2025

Facts About the Arctic in May 2023

At the beginning of May AWI’s high resolution AMSR2 extent metric is at the top of the historical range:

After a period of melt in the East Greenland Sea, export of sea ice from the Central Arctic via the Fram Strait has increased recently:

Sea ice area in the Barents Sea peaked in the first week of April and has declined steadily since then:

SMOS data is flowing again, and the gaps have been filled. Here’s the final pre melt ponding map of the spring:

It reveals large areas of thin ice that have recently developed in the Kara Sea. Here’s a pseudo colour glimpse of the region through the clouds:

Continue reading Facts About the Arctic in May 2023

Polarstern in the Svalbard Marginal Ice Zone

In a press release last week the Alfred Wegener Institute announced that:

From her home port in Bremerhaven, the Polarstern will set course for Fram Strait and the marginal ice zone north of Svalbard, where warm, nutrient-rich Atlantic Water flows into the Arctic Ocean.

The Polarstern starts its voyage to the Arctic from its home port of Bremerhaven. Photo: Nina Machner

Closely monitoring energy and material flows in the marginal ice zone from the ship and from on ice floes is the goal of the team led by Prof Torsten Kanzow, expedition leader and a physical oceanographer at the Alfred Wegener Institute, Helmholtz Centre for Polar and Marine Research (AWI). “We will make transects from the open water into the dense sea ice and back. Along the way, we will gather a variety of physical, chemical and biological measurements in the marginal ice zone, which is especially productive and therefore especially interesting,” explains Kanzow.

“The team will also venture onto the ice to take a closer look at the thickness and characteristics of the sea ice and measure ocean currents and eddies away from the ship. We’ll also deploy so-called gliders in the ocean, buoys on the ice and moorings on the seafloor, all of which will record valuable data for the next several years. Lastly, we’ll extend our research radius with helicopter flights, during which we’ll observe, for instance, the melt ponds on the ice.”

Following the work in the MIZ north of Svalbard Polarstern will be heading for Northeast Greenland:

The two glaciers there (79 N Glacier and Zachariae Isstrom) are both characterised by ocean-driven ice loss and accelerated ice flows, making them contributors to sea-level rise. “We plan to install moorings in order to gauge the sensitivity of ocean-driven glacier melting to changing environmental conditions,” says Kanzow, who’s been pursuing research in the region since 2016. Accompanying geodetic-glaciological studies will be conducted on Greenland. On the one hand, they will assess how the solid ground is rising on extremely small scales, because it is still rebounding from the past weight of ice masses that melted after the last glacial maximum. On the other, they will explore temporal variations in supraglacial lakes; their drainage out to sea can have considerable effects on glacier flow speeds and glacier melting.

The progress of Polarstern can be followed on the expedition web site, and via the University of Bremen’s Polarstern centric sea ice concentration maps:

[Edit – July 20th]

The AWI team have installed three seasonal ice mass balance buoys in the MIZ, without the usual thermistor string but with a new conductivity, temperature, depth (CTD) sensor fitted to measure salinity instead. Less colourful than usual sea ice thickness graphs can be viewed on the 2022 ice mass balance buoy page. Here’s one example:

[Edit – July 25th]

The image above updates on a daily basis, but today’s version is worth preserving for posterity:

There is currently a large area of low concentration sea ice around the North Pole, and Polarstern has left its station in the marginal ice zone and is currently heading north of Greenland rather than in the direction of the 79N/ZI glaciers.

[Edit – July 27th]

Further investigation reveals that:

Polarstern has been heading even further north to the Aurora Vent field (about 130 nautical miles northwest). As part of an extensive lithospheric study, ocean bottom seismometers will be deployed at depths of more than 4000 meters to record seismological activity as well as the physical properties of the hydrothermal plume.

Polarstern north east of Greenland – Photo: Christian R. Rohleder

Polarstern is now heading south again, where a team from the Technical University of Dresden will be deploying a modified surfboard on supra-glacial lakes! Here’s a test run in a melt pond:

Photo: Erik Loebel

[Edit – July 29th]

I discovered something rather interesting whilst browsing the Marine Traffic ship tracking web site this morning:

It appears as if the AWI have recently installed two buoys that support AIS position reporting, as indeed does Polarstern itself:

[Edit – August 6th]

Polarstern is now approaching the 79 N and Zachariae Isstrom glaciers:

Watch this space!

The February 2018 Fram Strait Cyclones

As already mentioned in our February Arctic overview, another storm is brewing. Here is this morning’s weather forecast for Longyearbyen, the capital of Svalbard:

svalbard_forecast_20180204

Much like last month, temperatures are above zero and rain is forecast. That’s because once again the current synoptic chart from Environment Canada shows a warm wet flow from way down south over Svalbard and on into the Central Arctic:

Synopsis-20180204-06Z-Crop

Next here’s the current combined wave and swell height forecast for the Svalbard area:

Significant_height_of_combined_w in multi_1.glo_15mext.20180204_00037

and here’s the associated wave period forecast:

Mean_period_of_wind_waves_surfac in multi_1.glo_15mext.20180204_00037

It’s still showing 10 meter waves with a 15 second period north of Svalbard tomorrow lunchtime. Somewhat unusually for the Arctic these aren’t merely giant wind waves. Zooming in on the Fram Strait and breaking out the underlying primary swell reveals:

Significant_height_of_swell_wave in multi_1.glo_15mext.20180204_00041

Mean_period_of_swell_waves_order in multi_1.glo_15mext.20180204_00041

A long distance swell of that magnitude is going to cause some damage.


[Edit – February 5th]

The current ECMWF forecast for a split polar vortex, courtesy of Ice Shieldz on the Arctic Sea Ice Forum:

Polar View Wind Speed 10 hPa 20180204

This is suggestive of more cyclones to come, but sticking with the current one for now, here is the MSLP chart at 00:00 UTC this morning showing the cyclone’s central pressure has dropped to 952 hPa:

Synopsis-20180205-00Z-Crop

Here too is the current WaveWatch III forecast for 15:00 UTC today:

Significant_height_of_combined_w in multi_1.glo_15mext.20180205_00016

Mean_period_of_wind_waves_surfac in multi_1.glo_15mext.20180205_00016

The peak of the swell north of Svalbard is now slightly later than originally forecast, but it’s still enormous!

Here’s a single Sentinel 1B synthetic aperture radar image that captures the position of the ice edge north of Svalbard yesterday quite nicely:

S1B_Svalbard_20180204T0654


[Edit – February 7th]

A brief overview of the effect of the recent cyclone on the sea ice in the Arctic via AMSR2:

UH-Arctic-Area-2018-02-06

UH-Arctic-Extent-2018-02-06

atlantic-201802-1280

Click the image to animate it.


[Edit – February 8th]

An Arctic wide take via Thomas Lavergne on Twitter:

plus the latest AMSR2 concentration map:

Arc_20180207_res3.125_LARGE


[Edit – February 9th]

An interesting insight into CryoSat-2 sea ice thickness measurements from Stefan Hendricks on Twitter:

Plus Judah Cohen on the split polar vortex:

The January 2018 Fram Strait Cyclones

We’ve covered similar events in the recent past, but this one looks like it will take the proverbial biscuit.

Here’s the 6 hour wave forecast for the Fram Strait from 12:00 UTC this afternoon:

Significant_height_of_combined_w in multi_1.glo_30mext-20180113-12z+6

Mean_period_of_wind_waves_surfac in multi_1.glo_30mext-20180113-12z+6

Look at the scales carefully then compare the wave height and period with previous similar events. Here’s the cause of those giant waves, two powerful cyclones off Greenland pumping heat and moisture northwards from a long way south:

Synopsis-20180113-18Z-Crop

Also bear in mind the current sea ice area around Svalbard:

osisaf_svalbard_plot_20180112

and the current weather forecast for the capital Longyearbyen:

svalbard_forecast_20180113

Note in particular the anomalously high temperatures and the severe weather warnings for both rain and avalanches. In the middle of January.

Finally, for the moment at least, here’s a Sentinel 1B image of the sea ice in the Fram Strait earlier this morning:

S1B_Fram_20180113T063817


[Edit – January 14th]

The temperature in Longyearbyen is forecast to drop below freezing point early on Tuesday and then remain there, which I guess counts as good news?

svalbard_forecast_20180114

However the southernmost of the two cyclones off Greenland is now down to a central MSLP of 942 hPa:

Synopsis-20180114-12Z-Crop


[Edit – January 15th]

The cyclone now centred near Iceland looks as though it bottomed out at a MLSP of 939 hPa earlier today:

Synopsis-20180115-00Z-Crop

Watch this space!

Facts About the Arctic in February 2017

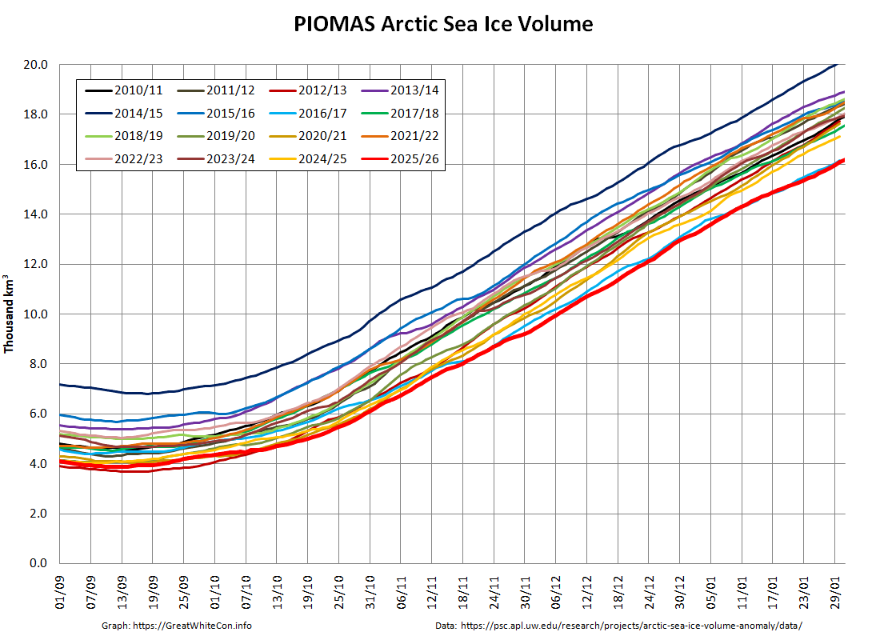
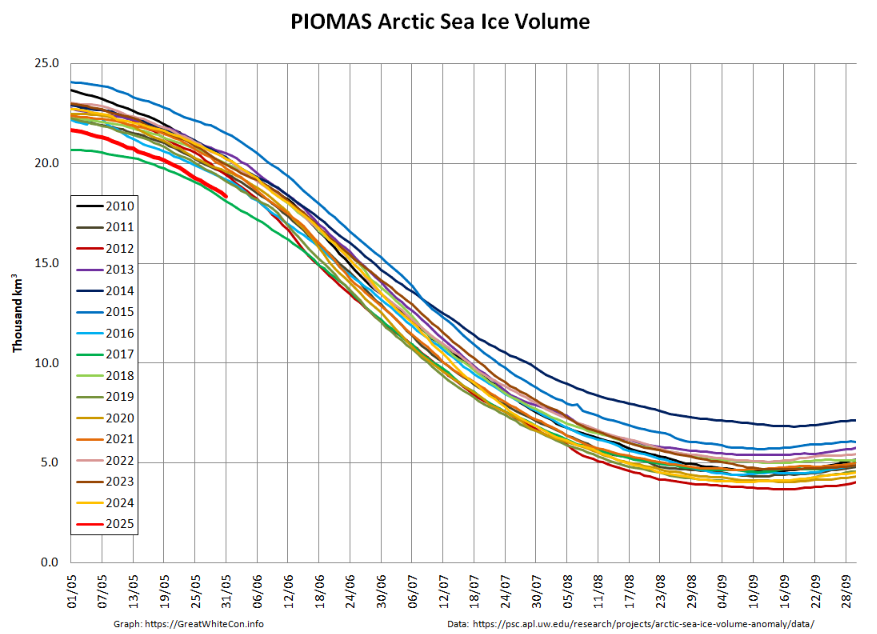
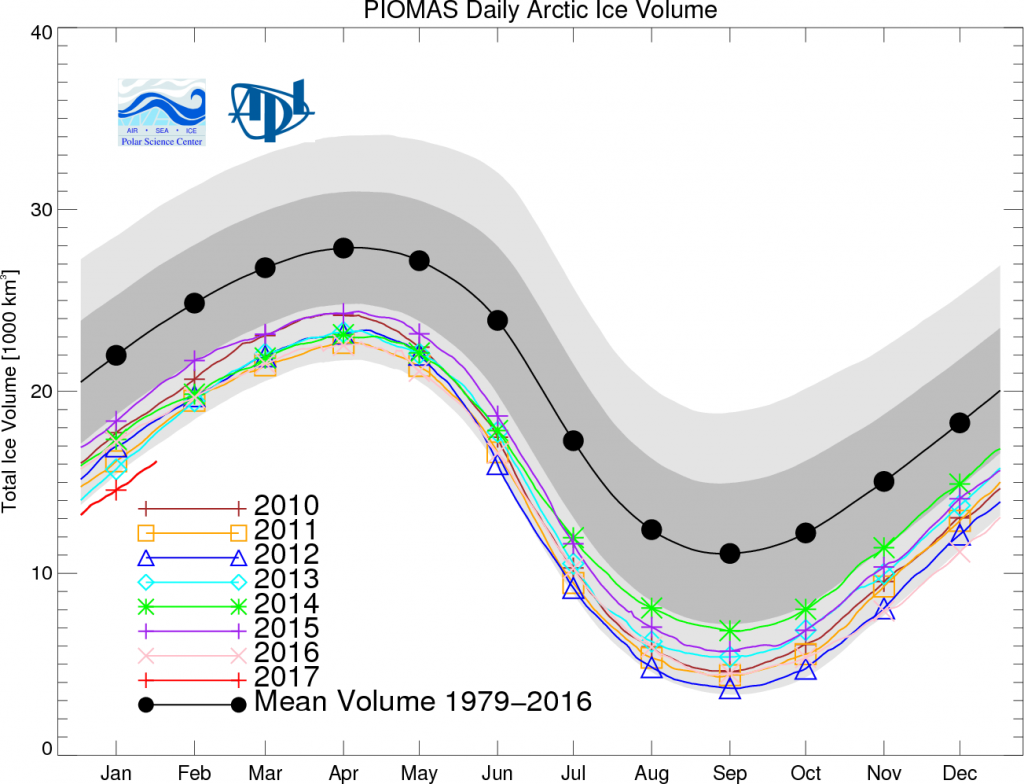
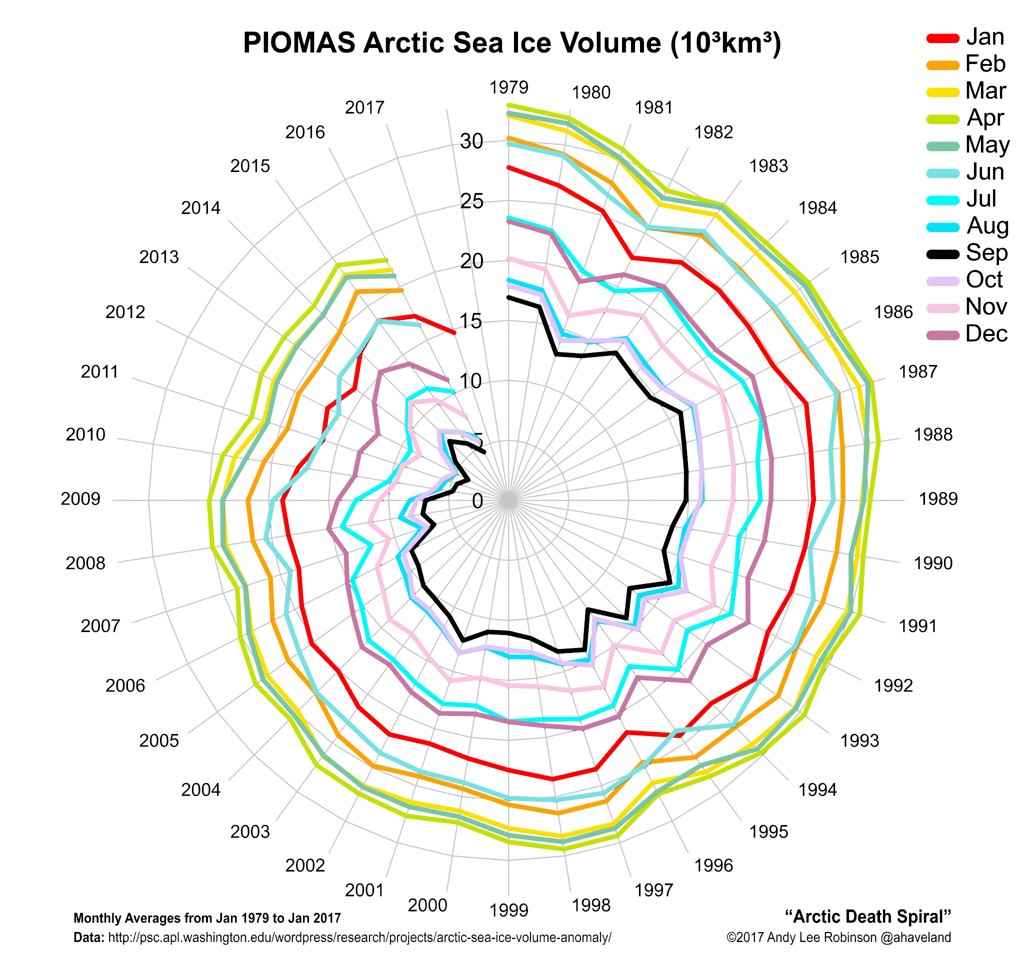
The PIOMAS Arctic sea ice volume numbers for January 2017 have just been published. Yet another new record low for the date:

PIOMASIceVolumeAnomaly-201701

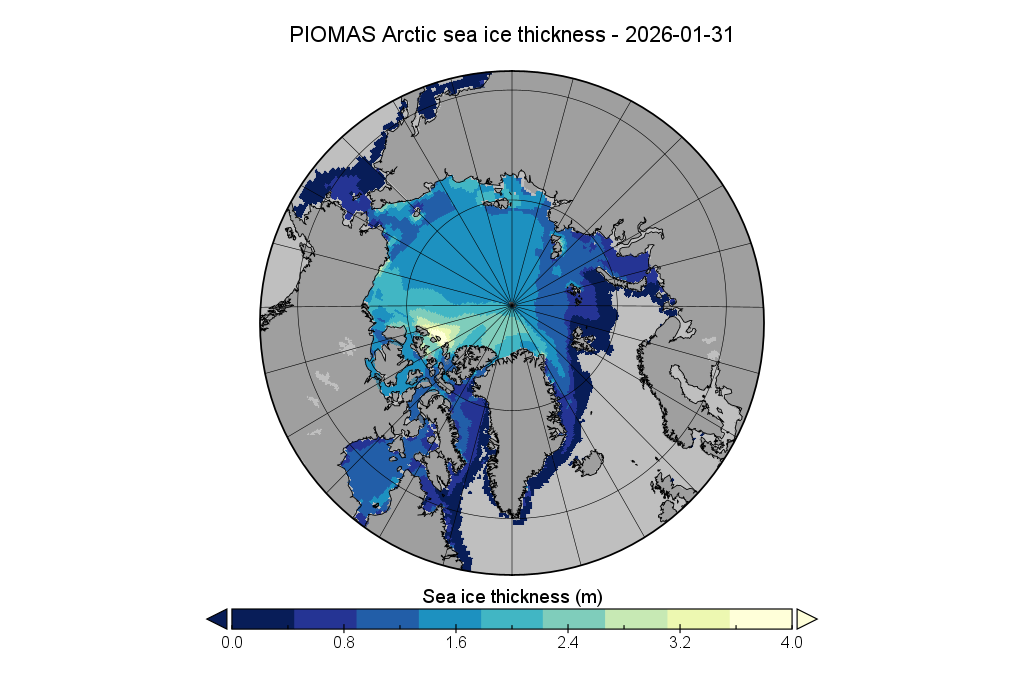
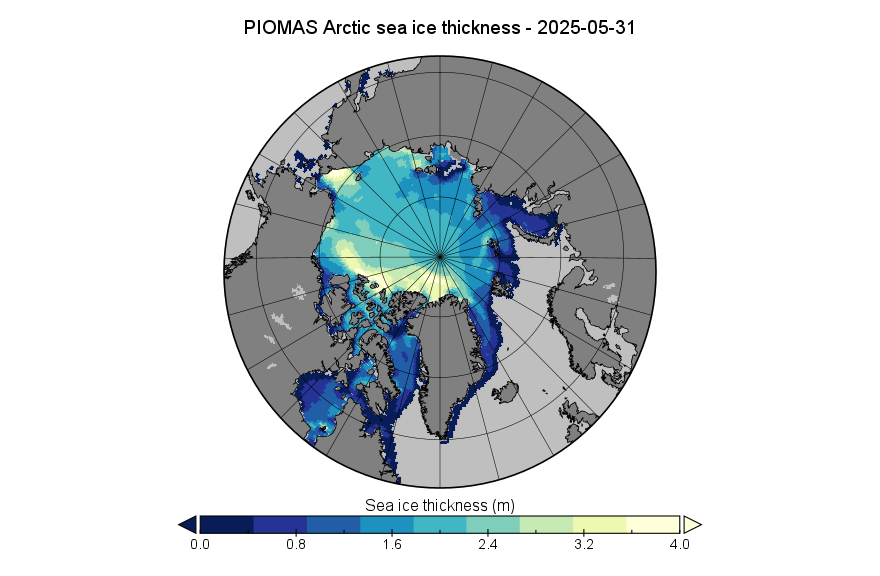
Here’s the PIOMAS gridded thickness for January 31st, courtesy of Wipneus at the Arctic Sea Ice Forum:

PIOMAS-20170131

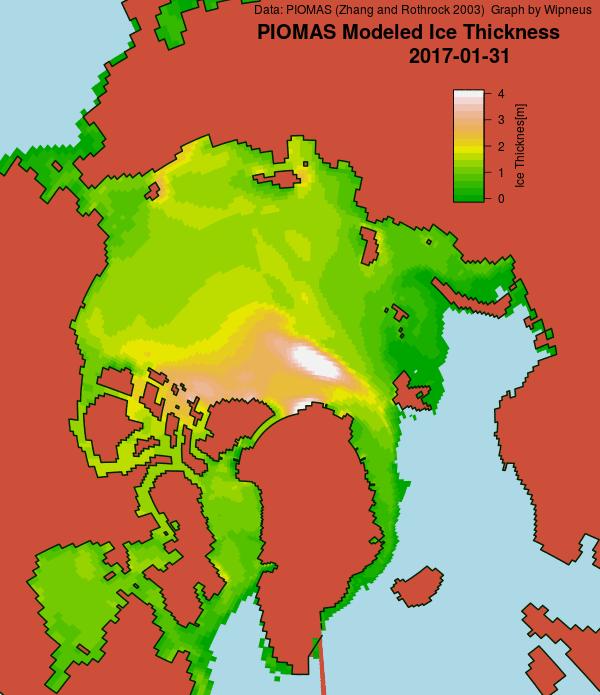
Somewhat anomalously it shows the thickest ice some distance away from the coast of Greenland and/or Ellesmere Island. Here too is Andy Lee Robinson‘s updated PIOMAS “Arctic death spiral”:

arctic-death-spiral-1979-201701

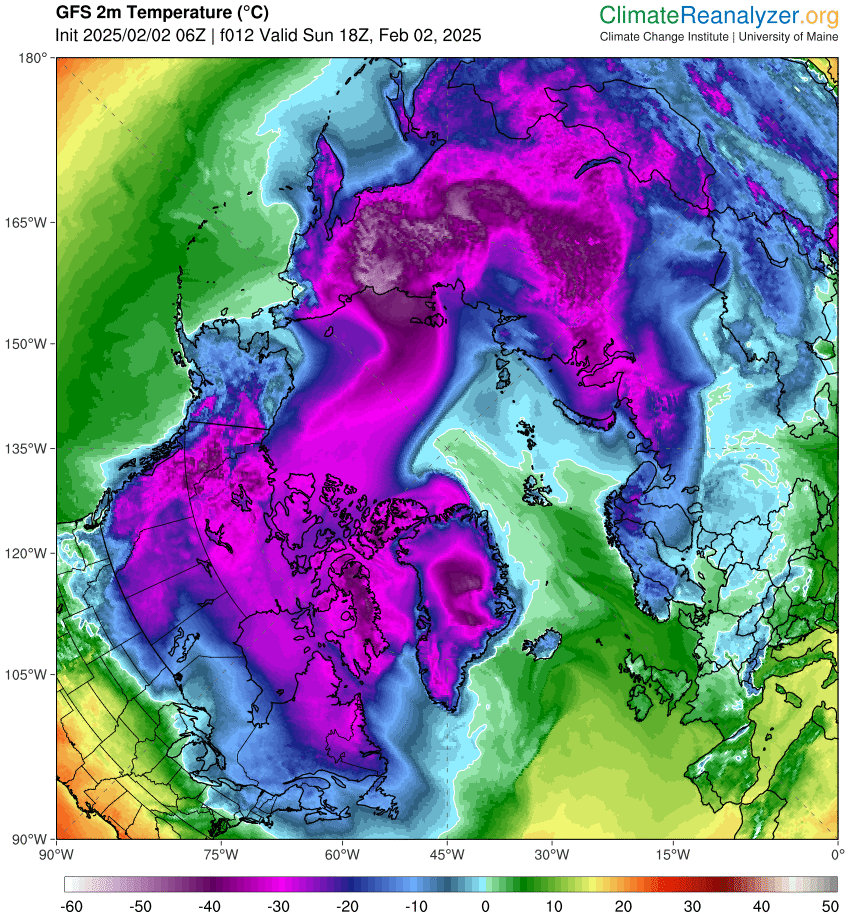
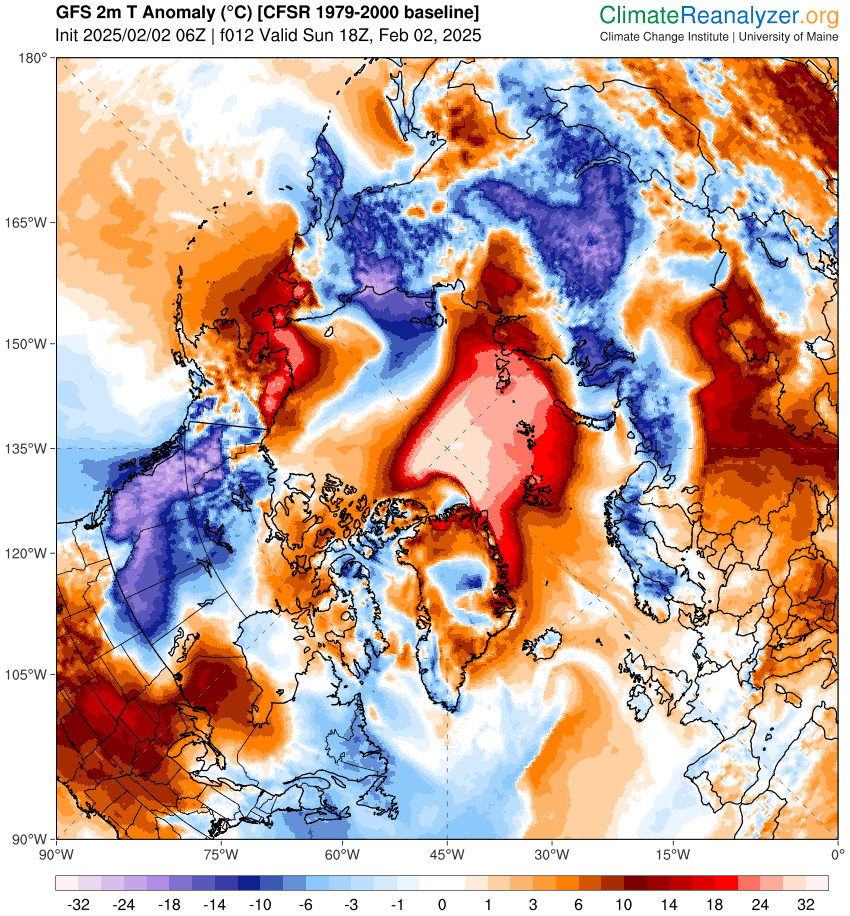
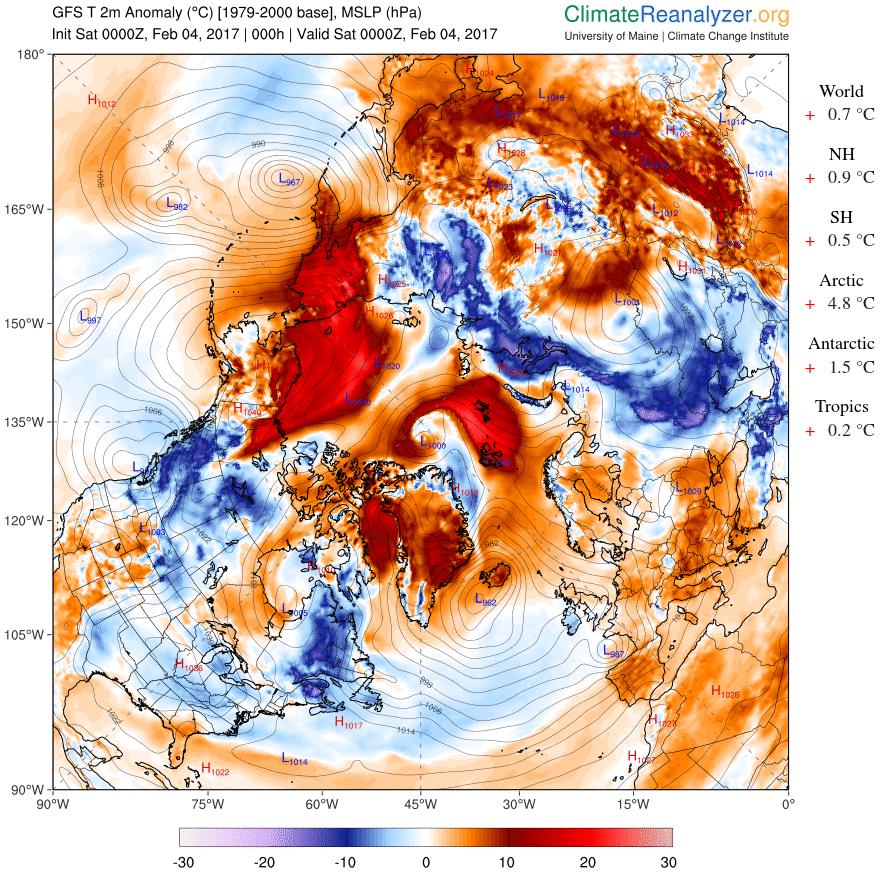
Meanwhile yet more anomalously warm air is entering the Arctic Basin from both the Pacific and Atlantic sides:

CCI-T2Anom-20170204

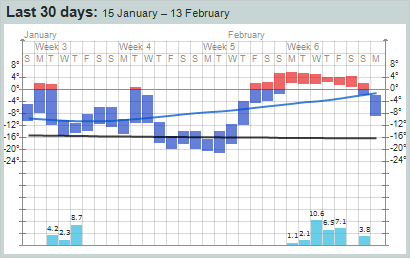
That sort of thing has happened quite a few times over the 2016/17 freezing season, as you can see from this graph of cumulative Freezing Degree Days (FDD for short):

2017-02-03-DMI-FDD

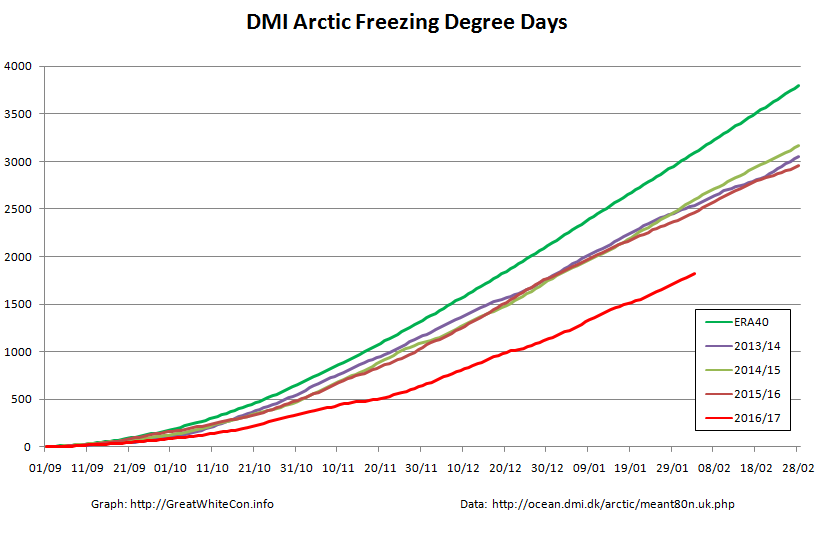
The FDD graph is based on the same data as the probably much more familiar DMI “Daily mean temperatures for the Arctic area north of the 80th northern parallel” graph:

DMI-meanT-20170203

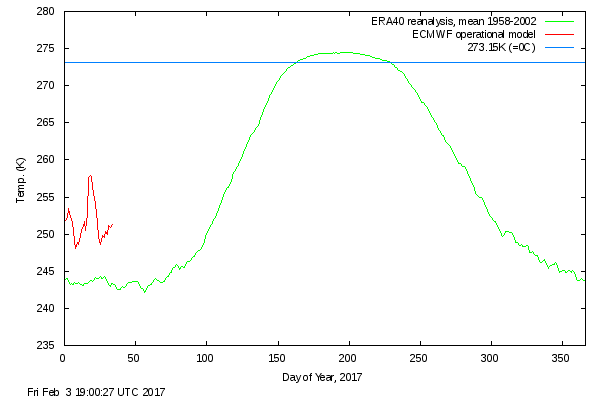
Things are warming up in the Arctic once again.


[Edit – February 5th]

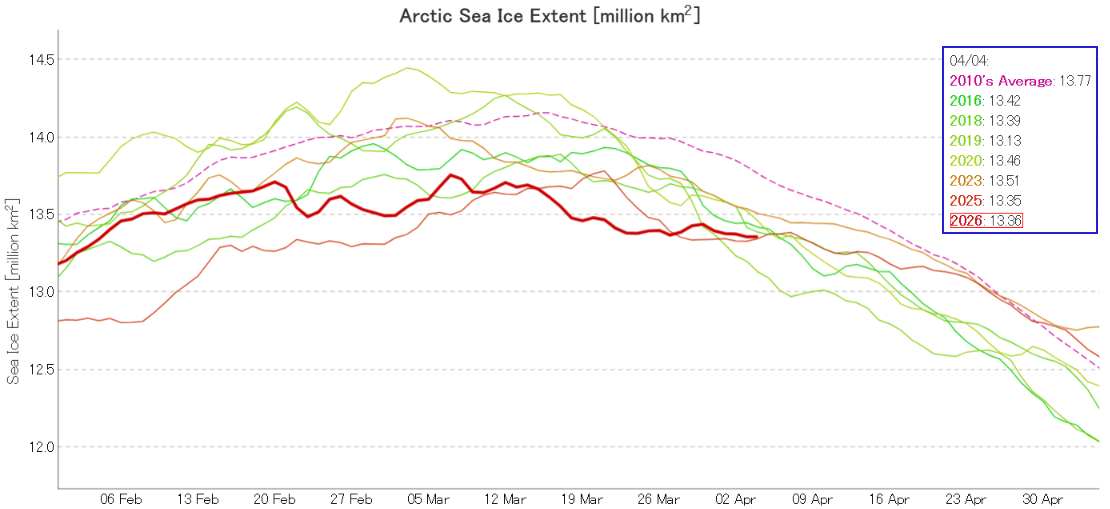
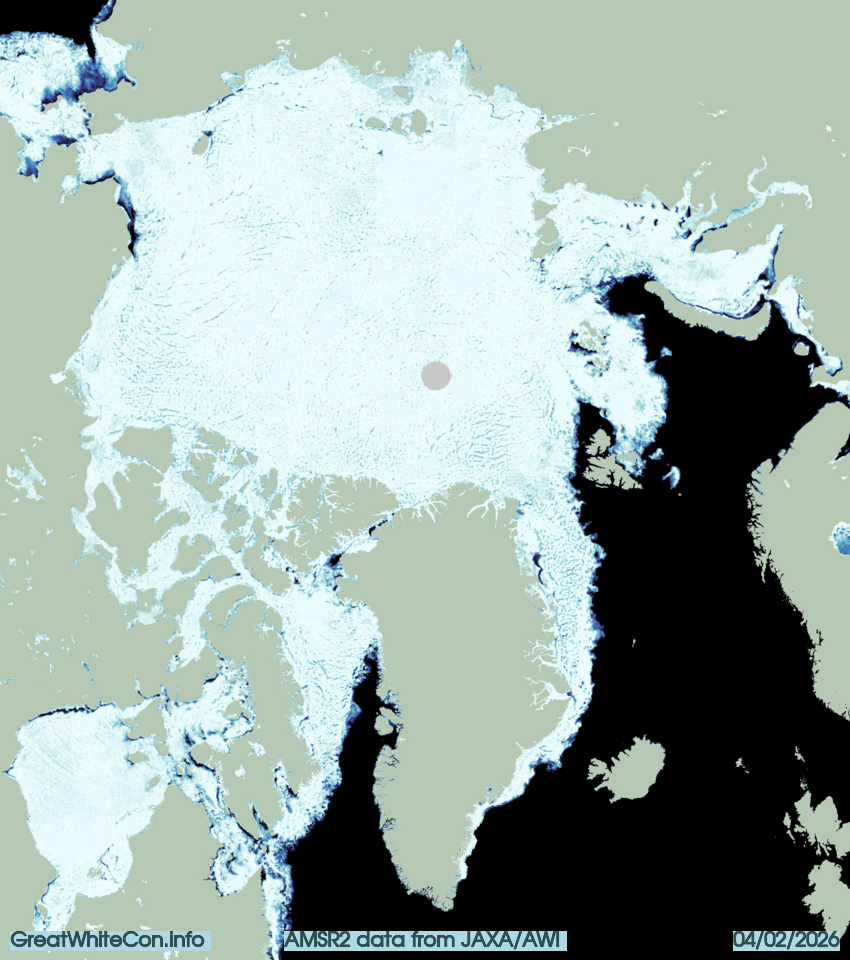
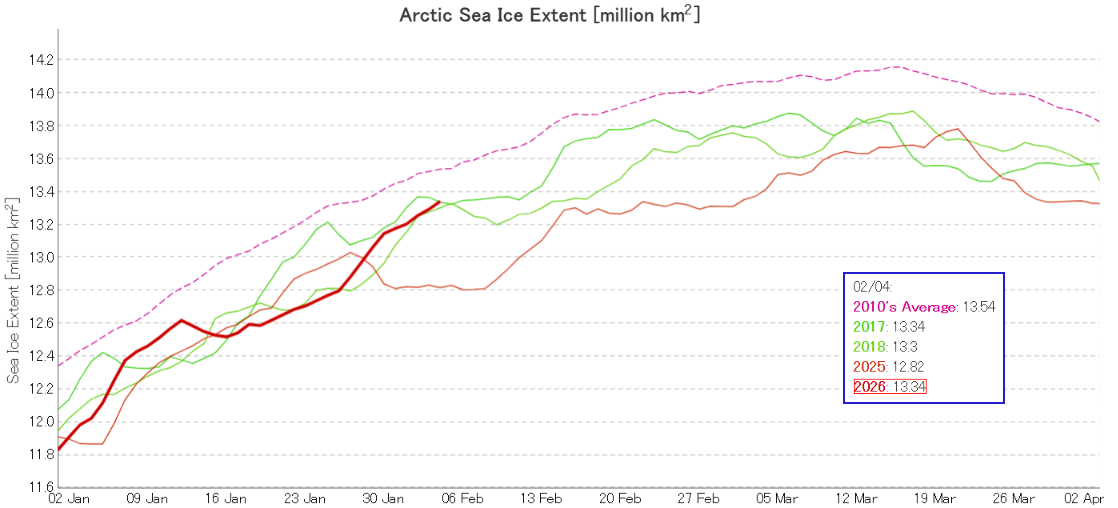
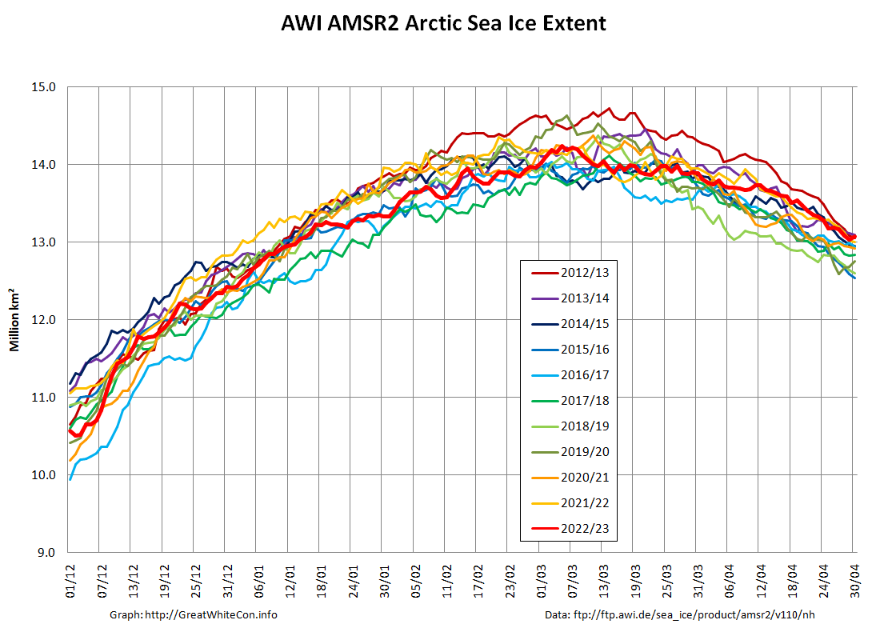
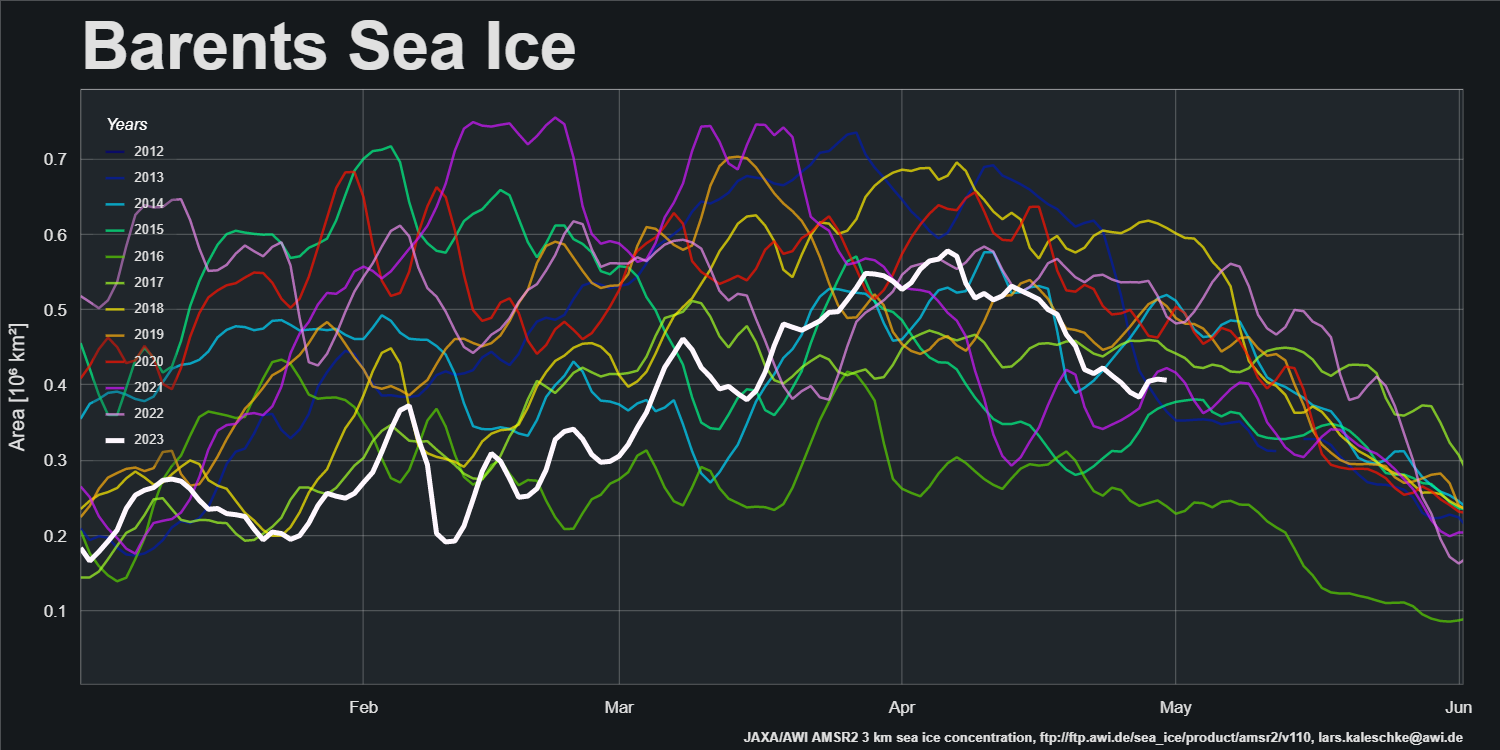
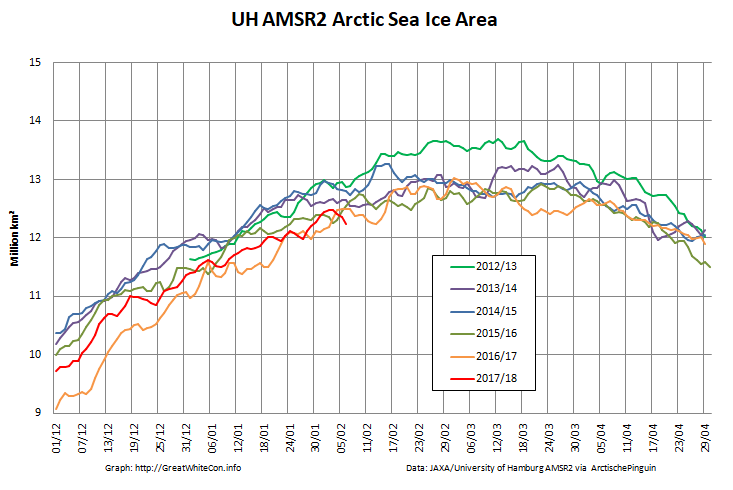
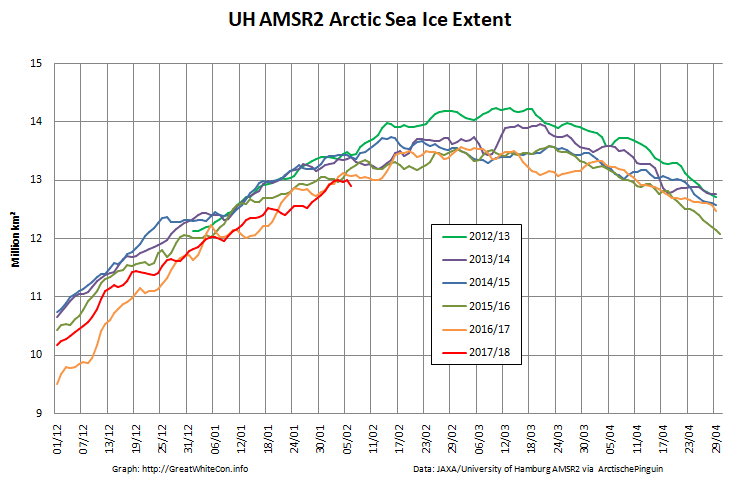
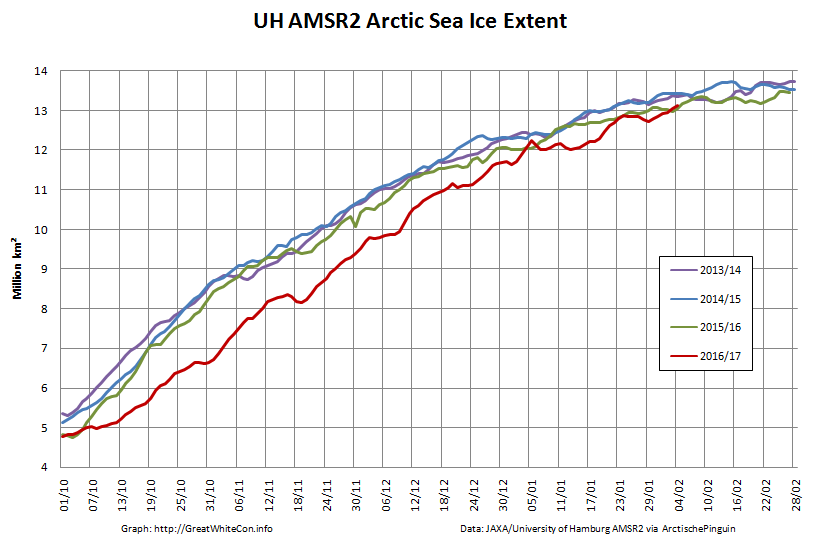
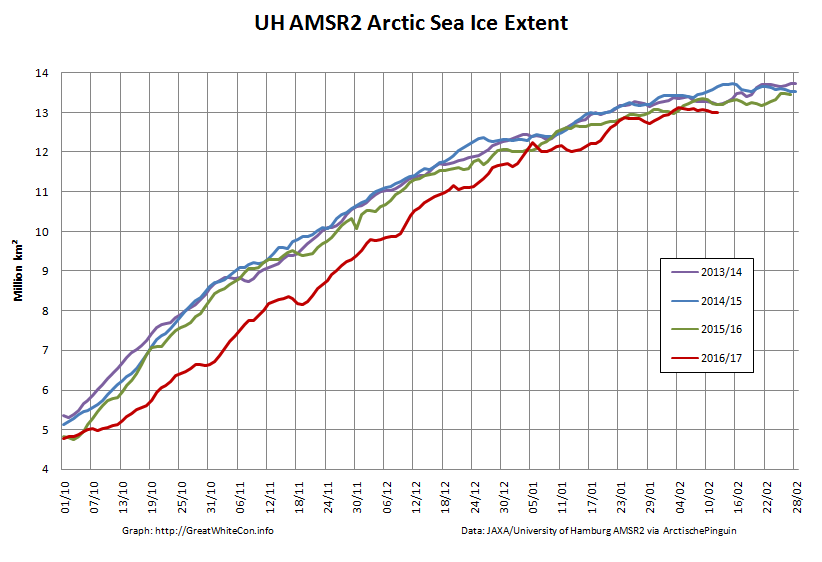
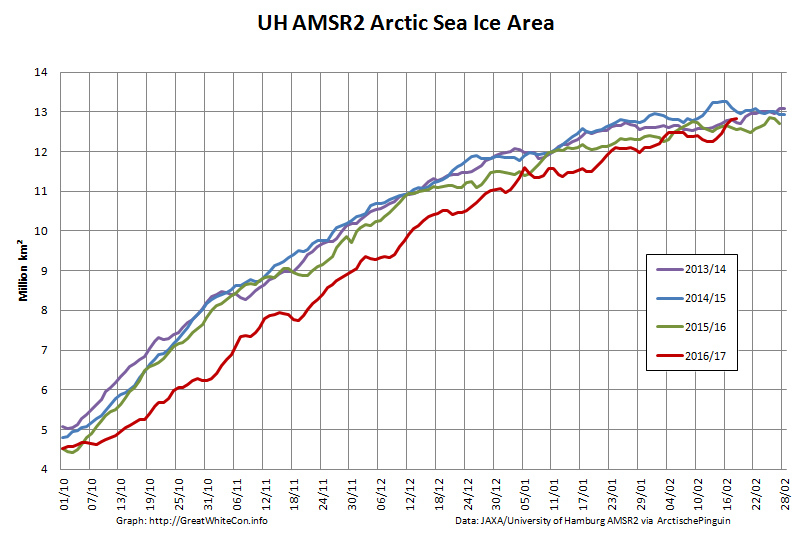
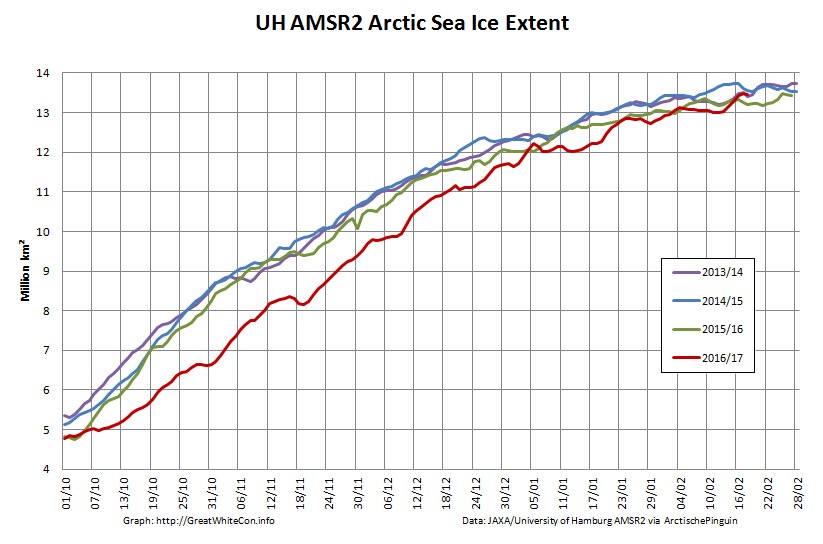
Whilst we await the arrival of the forecast anomalous warmth, how are some other metrics coming along? Here’s the high resolution AMSR2 area and extent:

UH-Arctic-Area-2017-02-04

UH-Arctic-Extent-2017-02-04

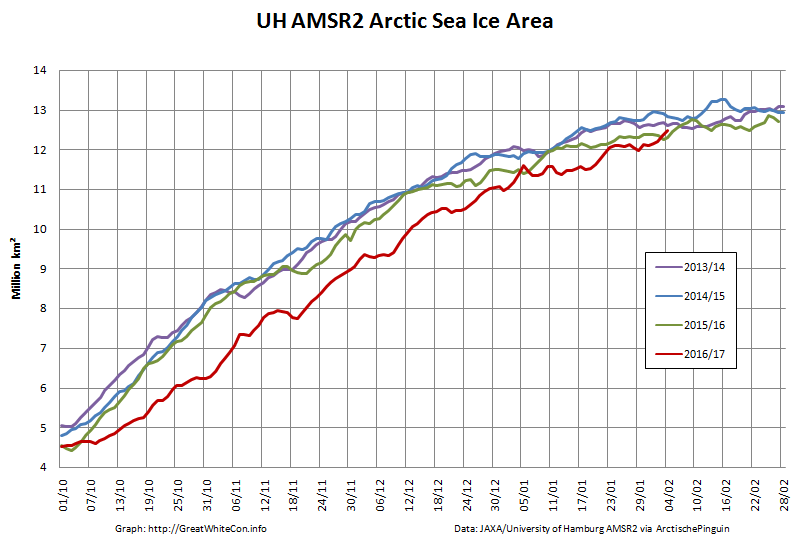
It looks like they’re back in the “normal” range for now, does it not?


[Edit – February 6th]

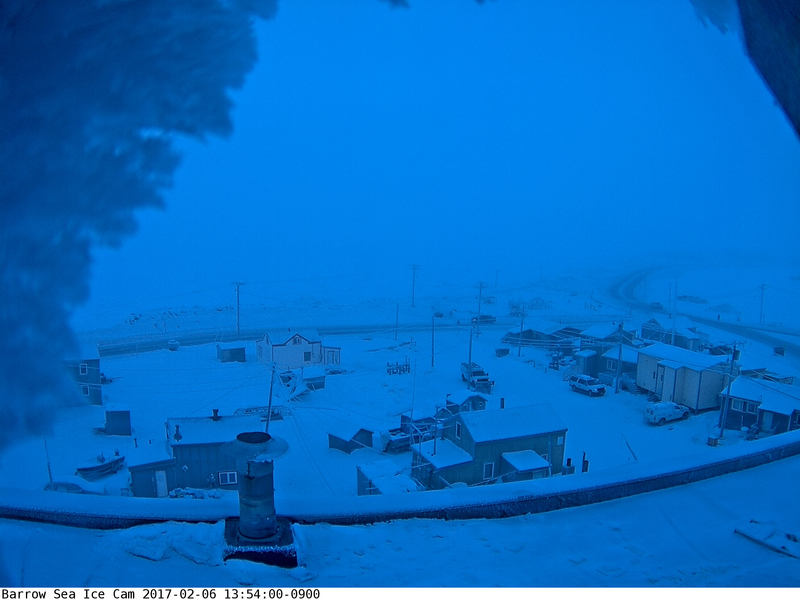
Things currently still look fairly frosty over on the Pacific side of the Arctic, as you can see from the webcam at Utqiagvik (Barrow as was):

BarrowCam_20170206_225400

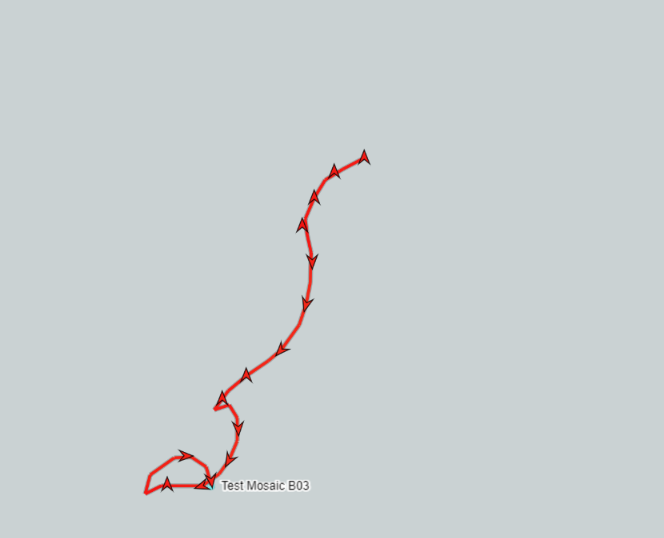
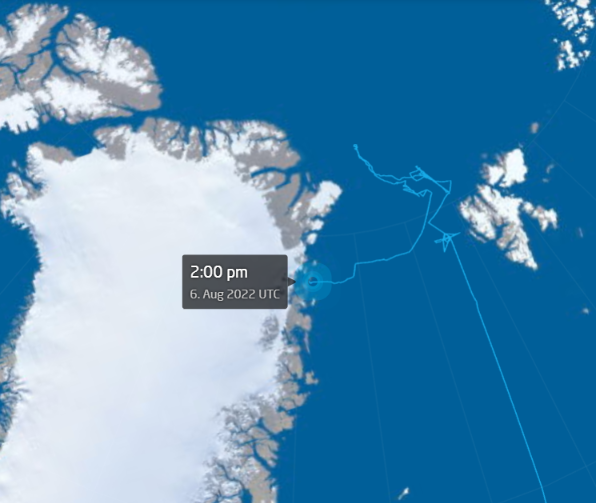
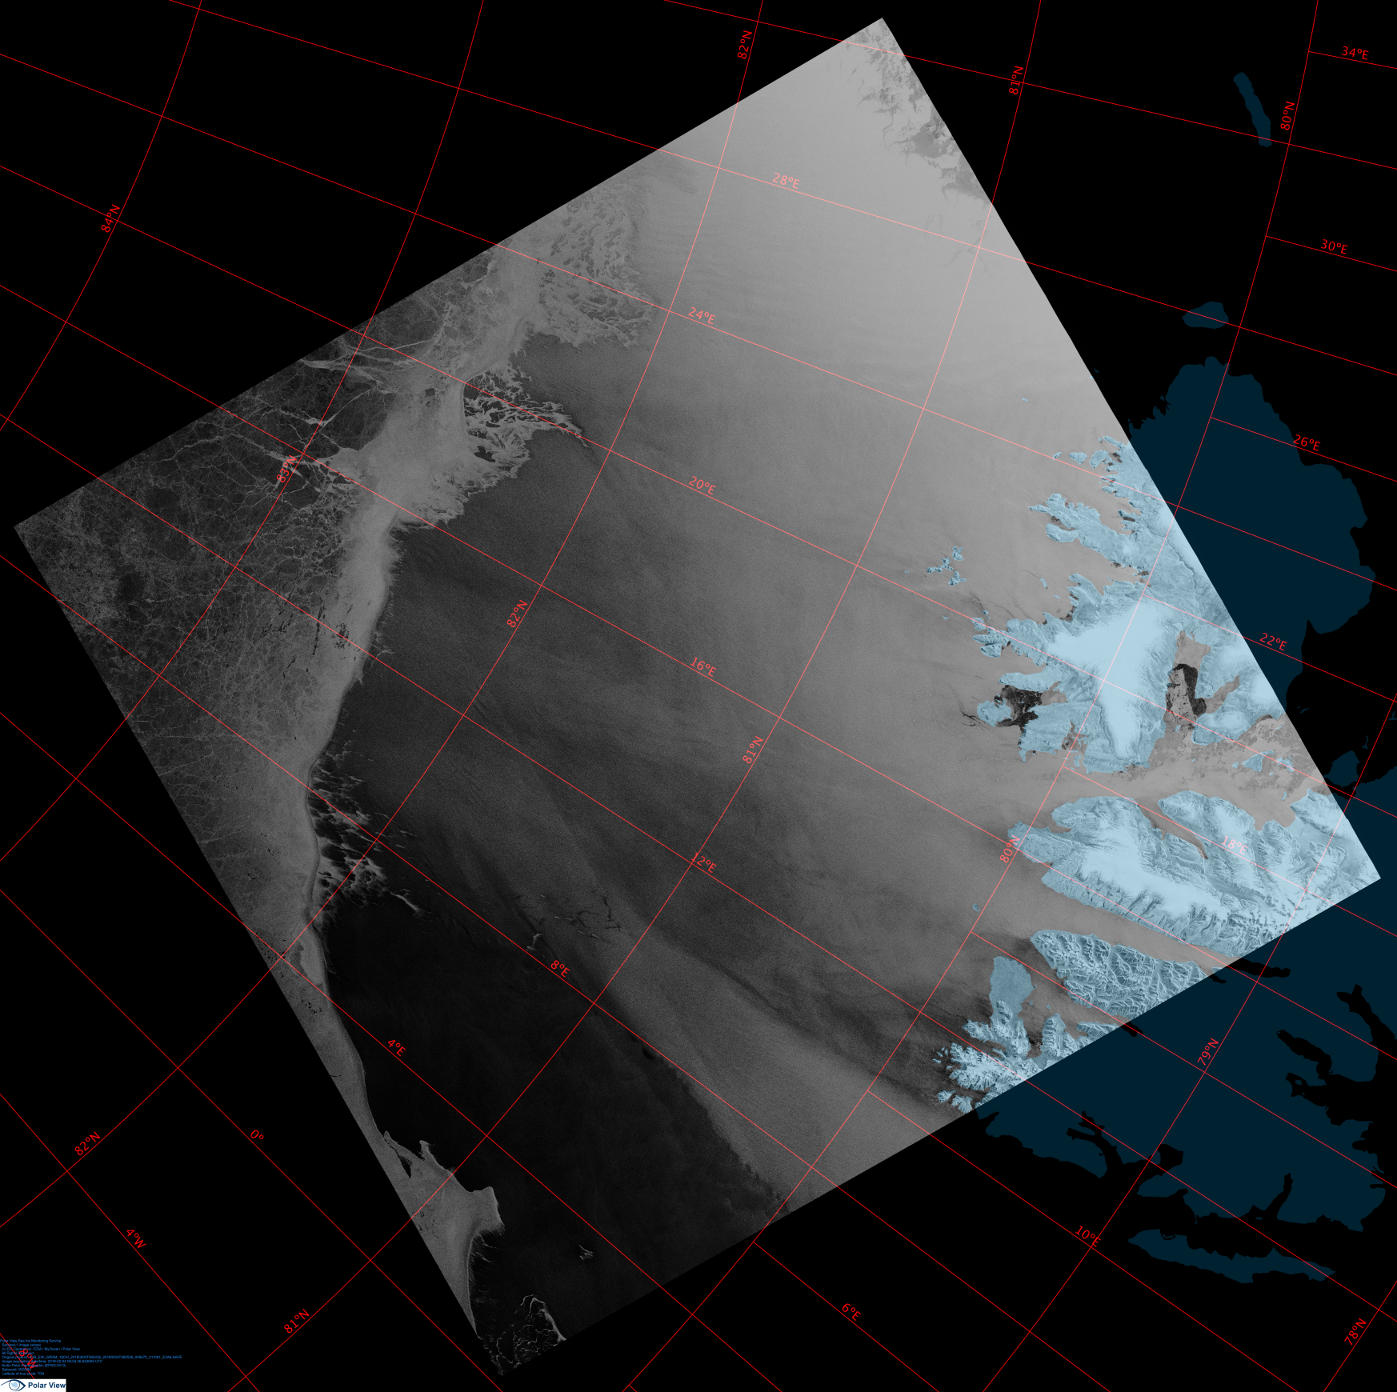
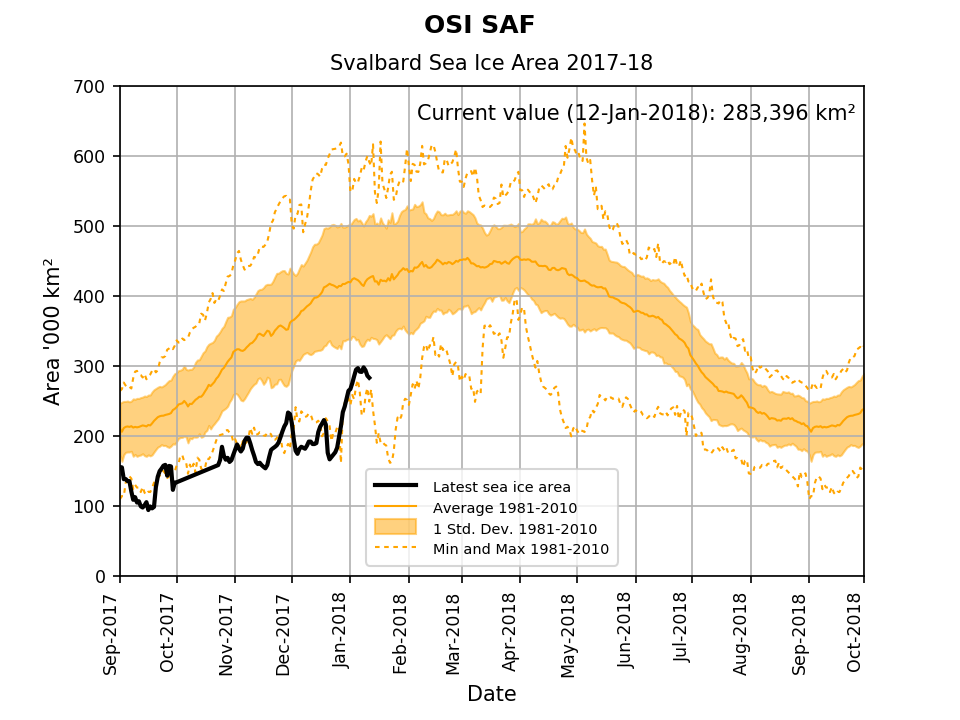
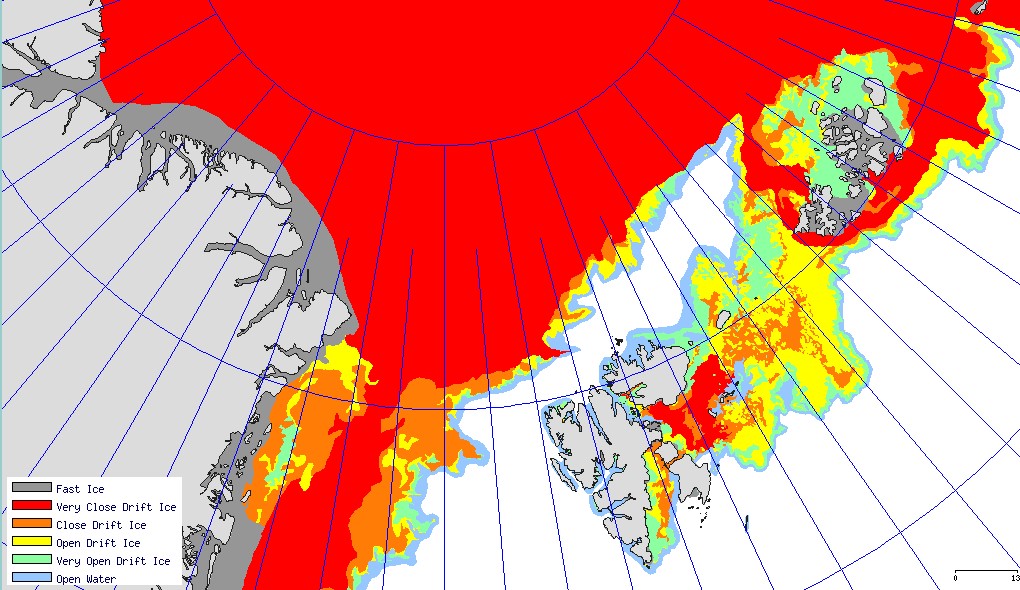
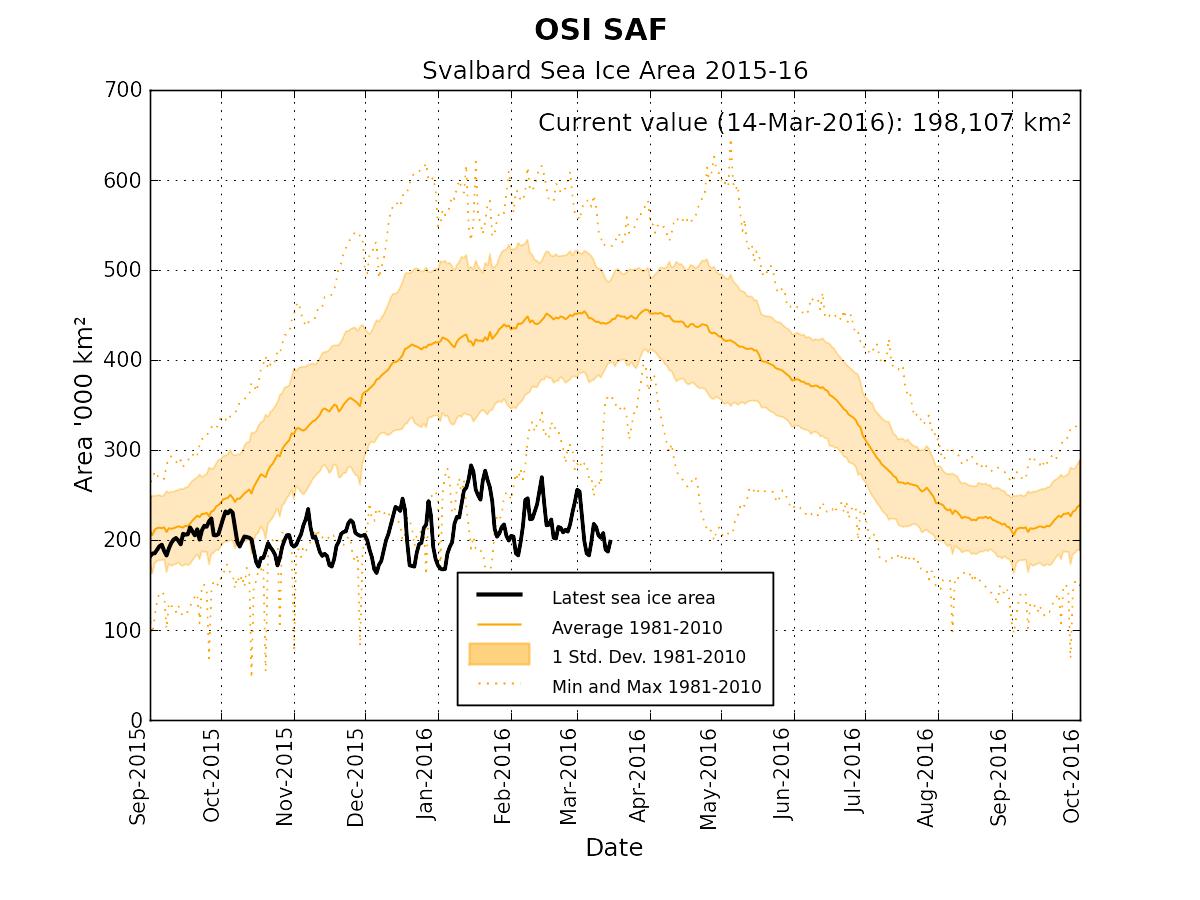
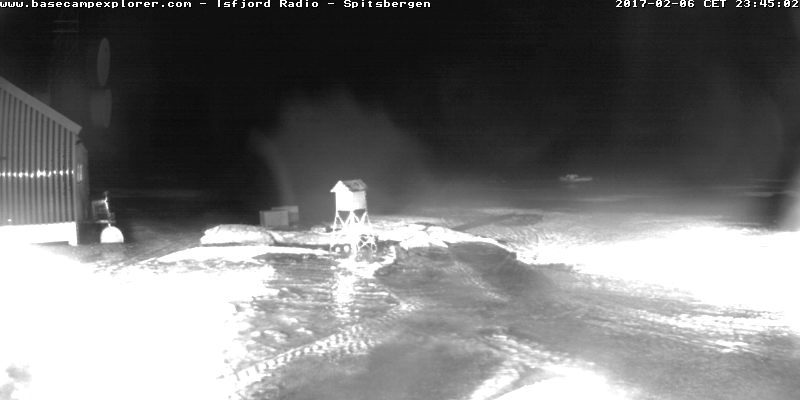
However over on the Atlantic side (and especially for “Richard”!) melting can now be observed on Svalbard:

isfjordradio-20170206

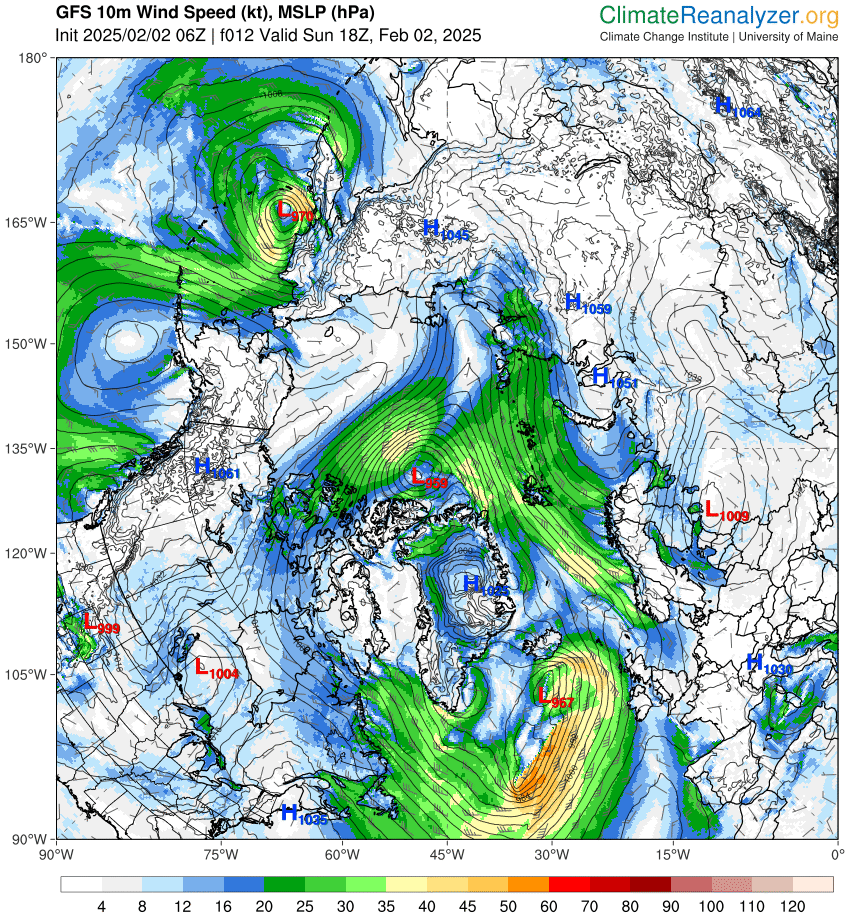
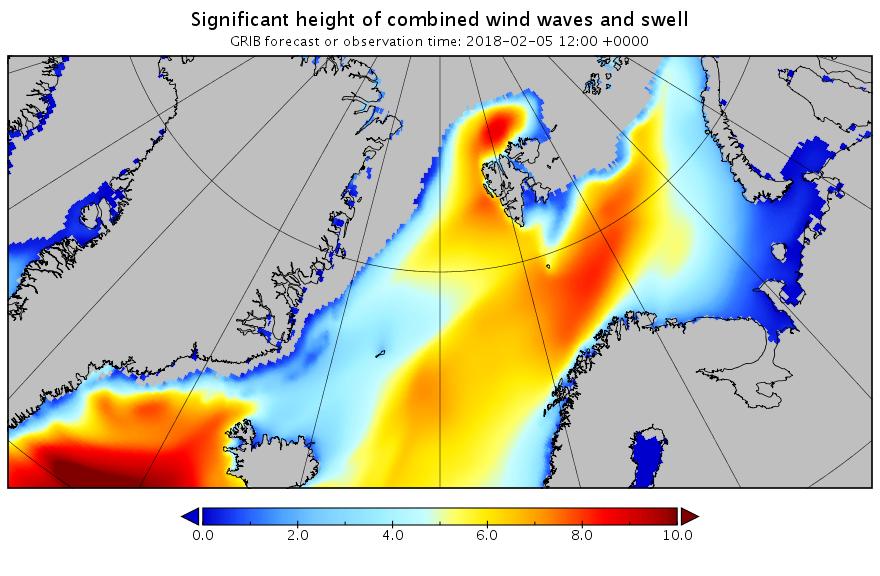
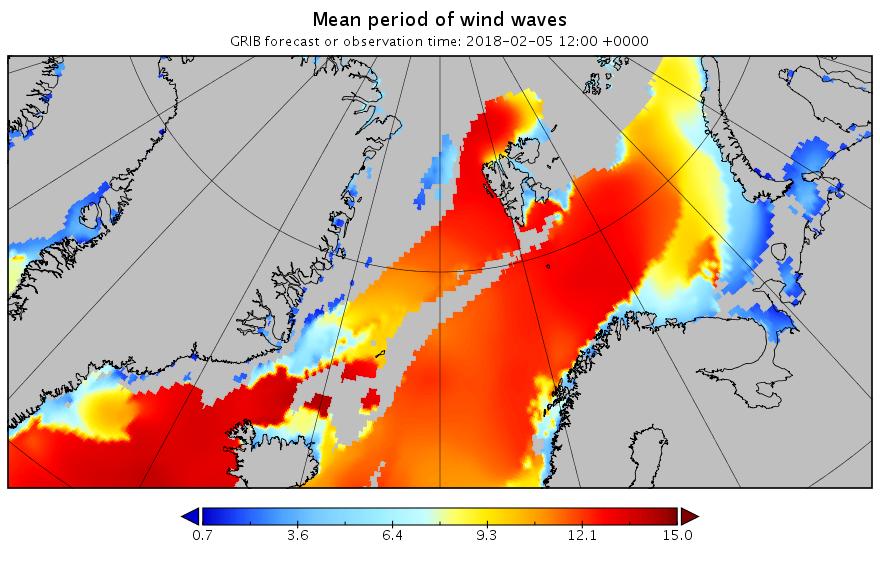
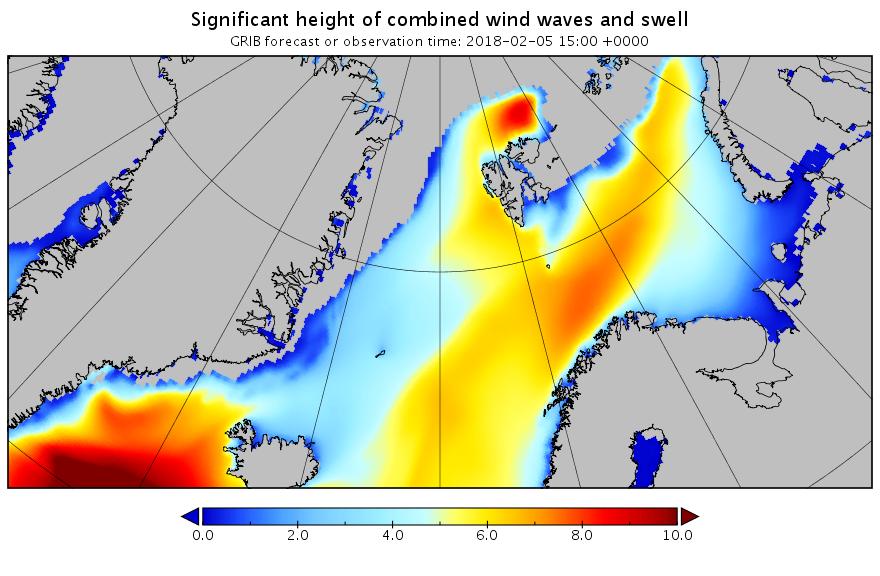
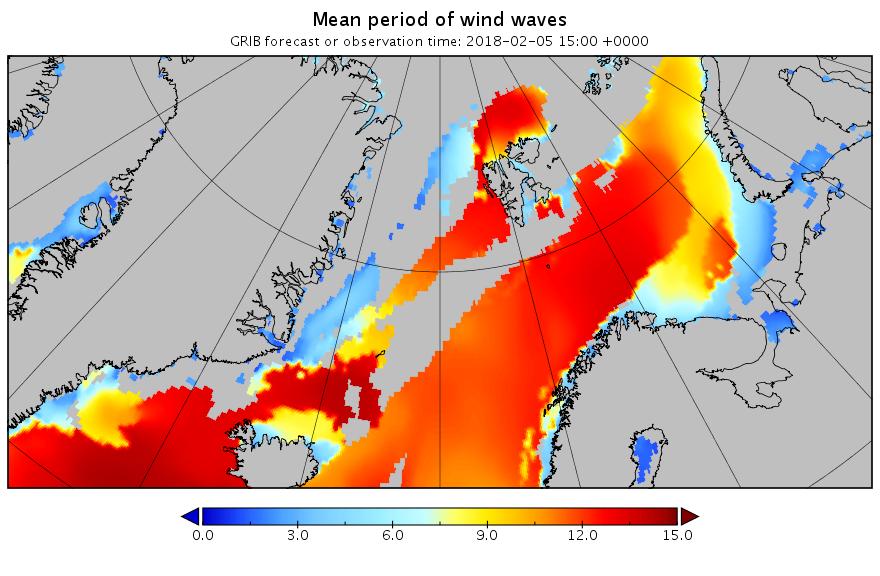
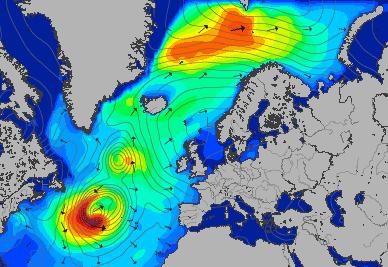
An extremely powerful cyclone off Greenland is pumping heat and moisture northwards:

Synopsis-20170206-18Z

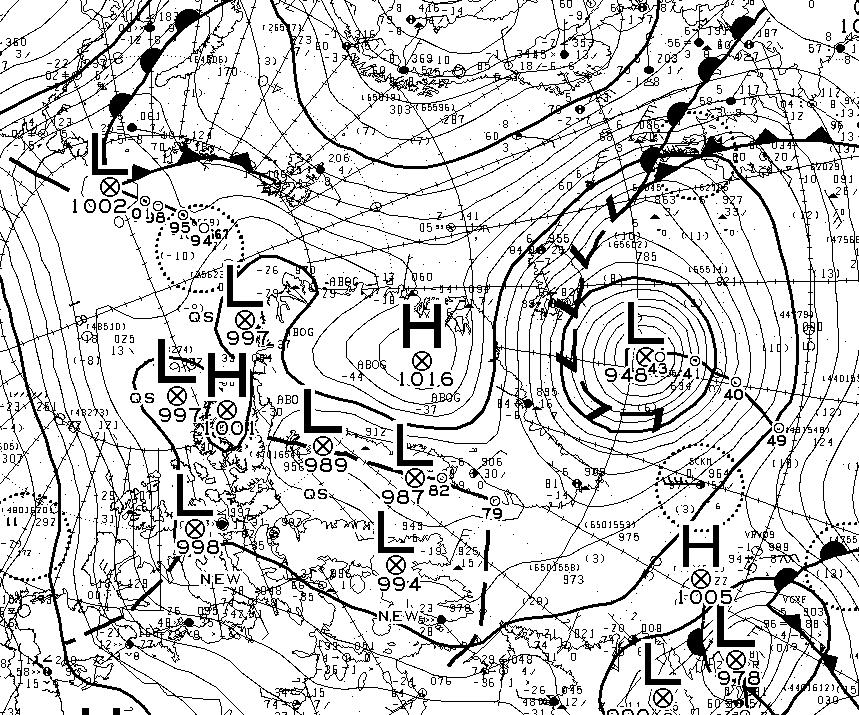
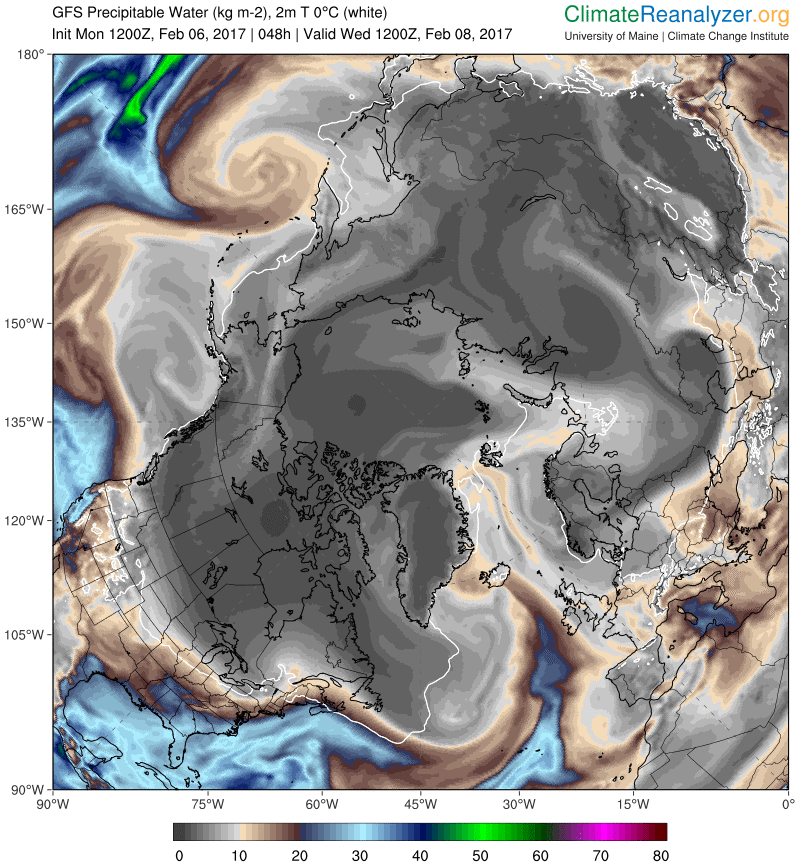
Note that the cyclone’s MSLP fell to 940 hPa earlier today. This is the GFS precipitable water forecast for Wednesday lunchtime:

CCI-PWTR-20170206-12+48h

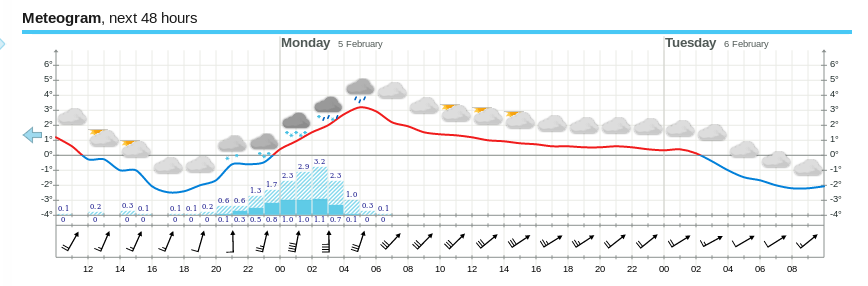
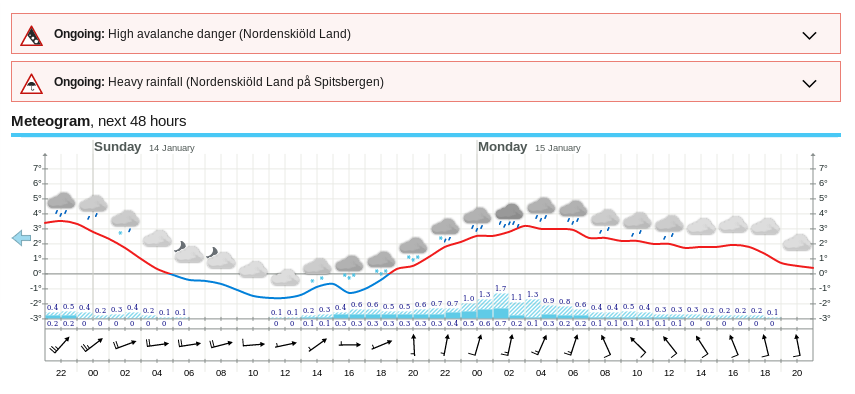
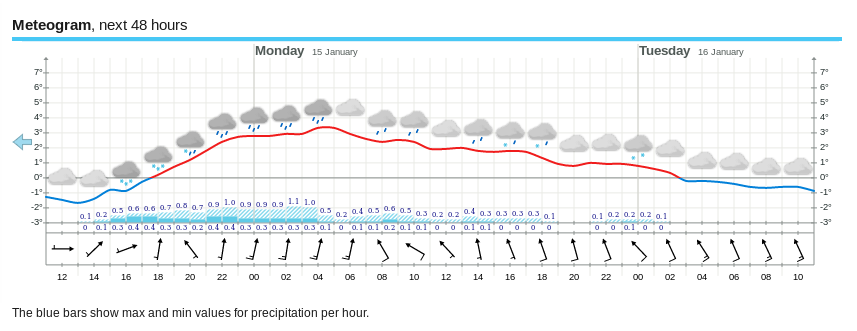
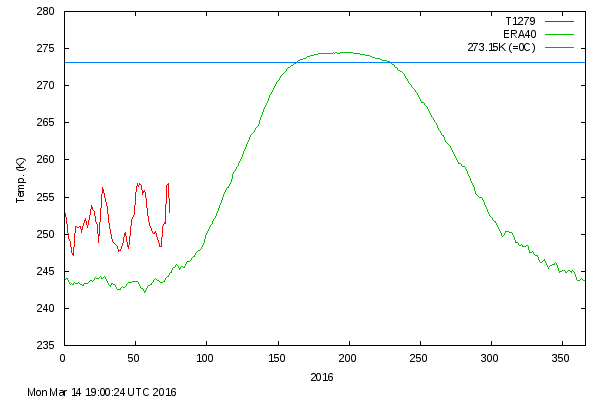
Finally, for the moment at least, here’s the current weather forecast for Longyearbyen in Svalbard:

2017-02-07-Longyearbyen-Fcst

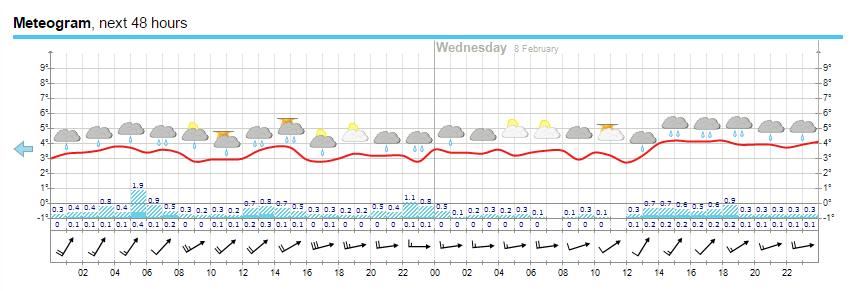
All in all there’s plenty more heat and moisture on the way.


[Edit – February 13th]

The temperatures in Svalbard have now dropped back below freezing point:

Svalbard-Temps-20170213

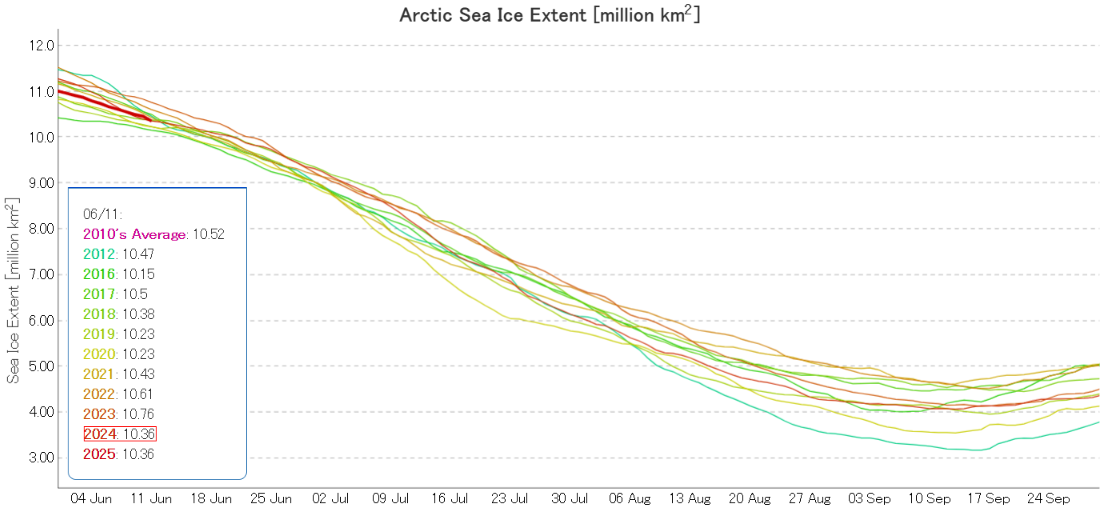
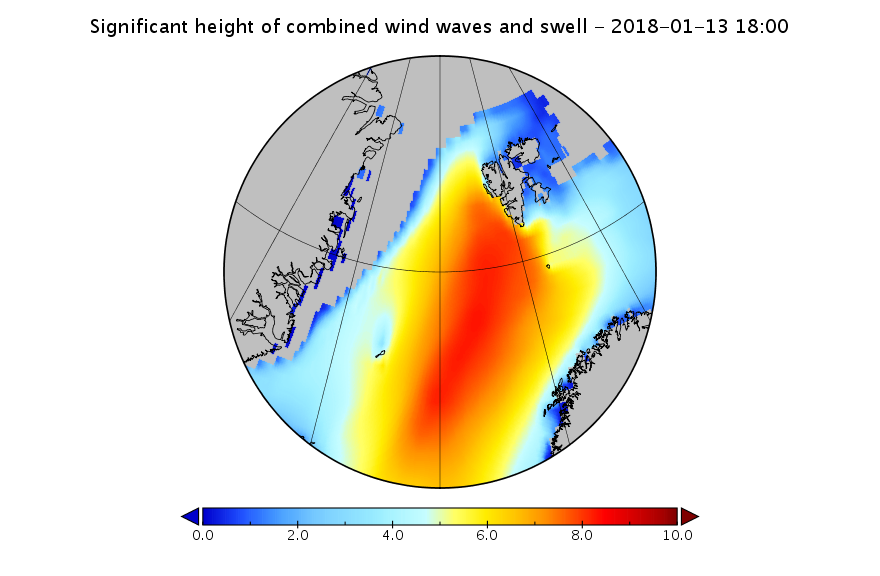
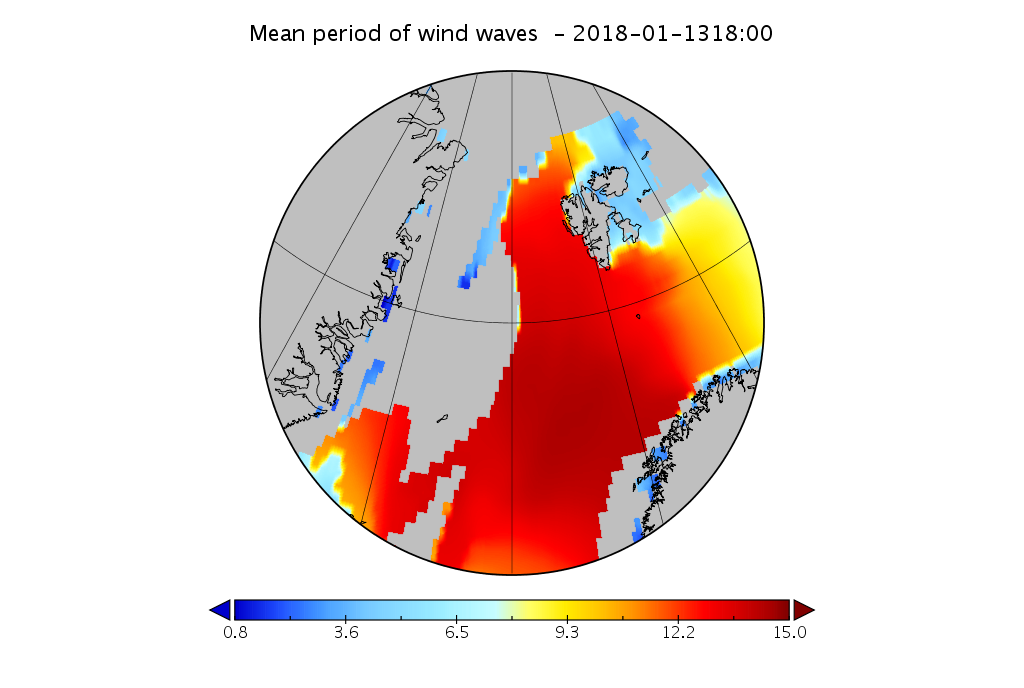
As temperatures over parts of the Arctic Basin have reached zero degrees Celsius and above, Arctic sea ice extent has been declining:

UH-Arctic-Extent-2017-02-12

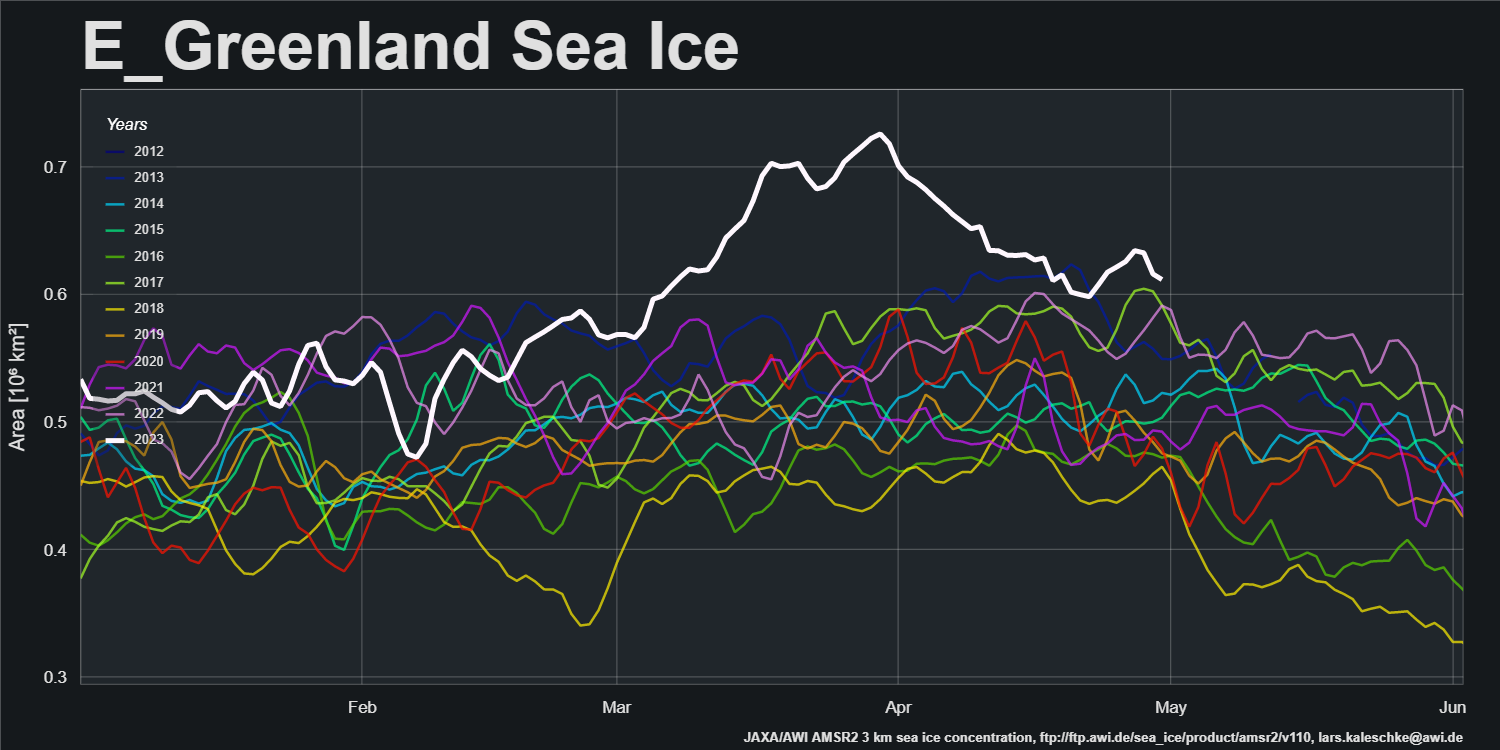
Now take a look at area:

UH-Arctic-Area-2017-02-12

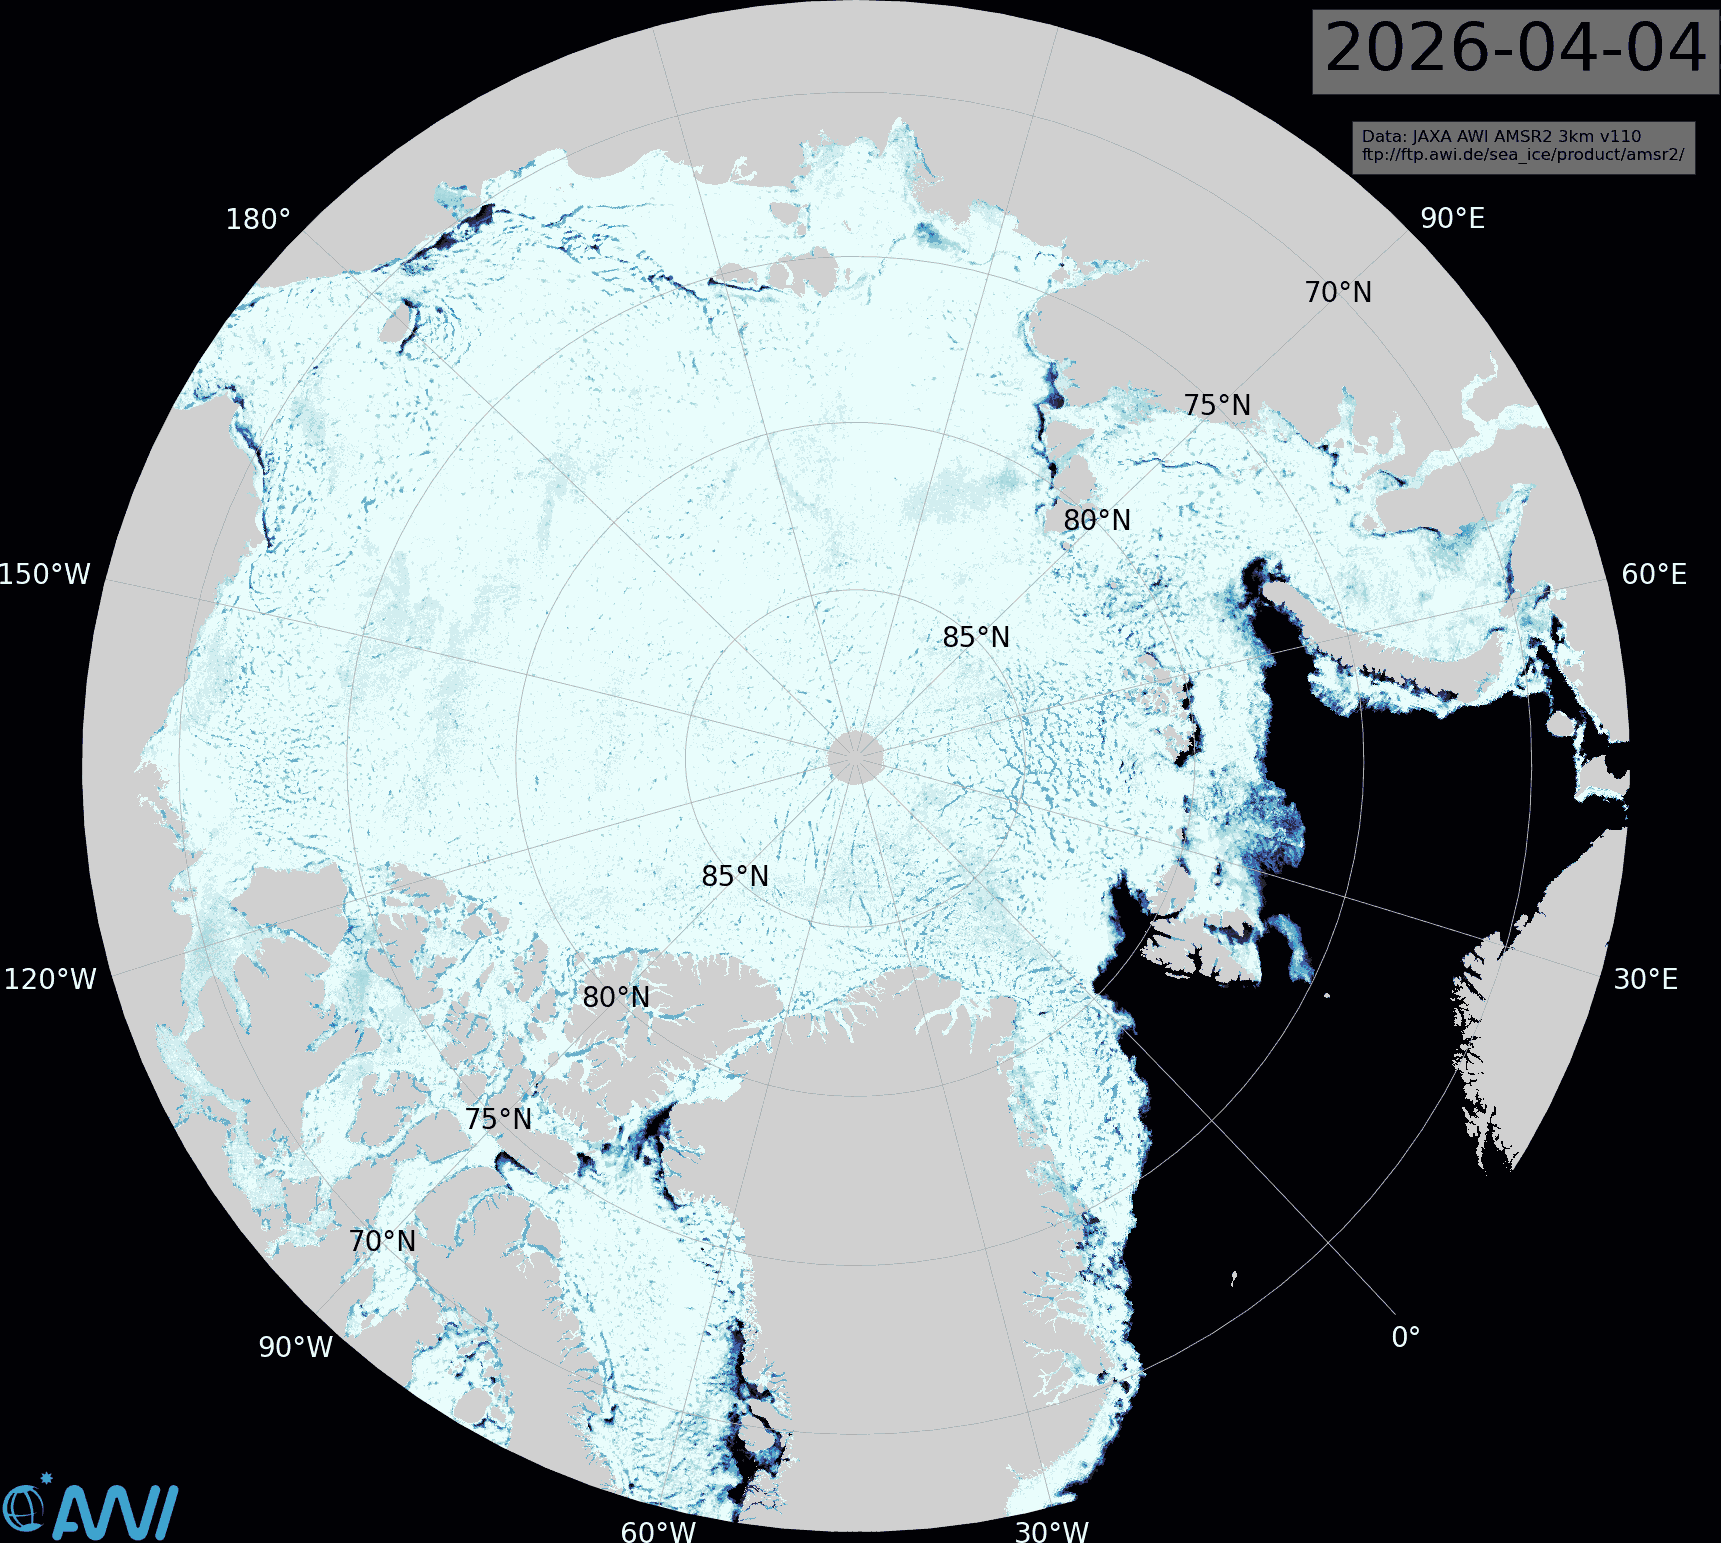
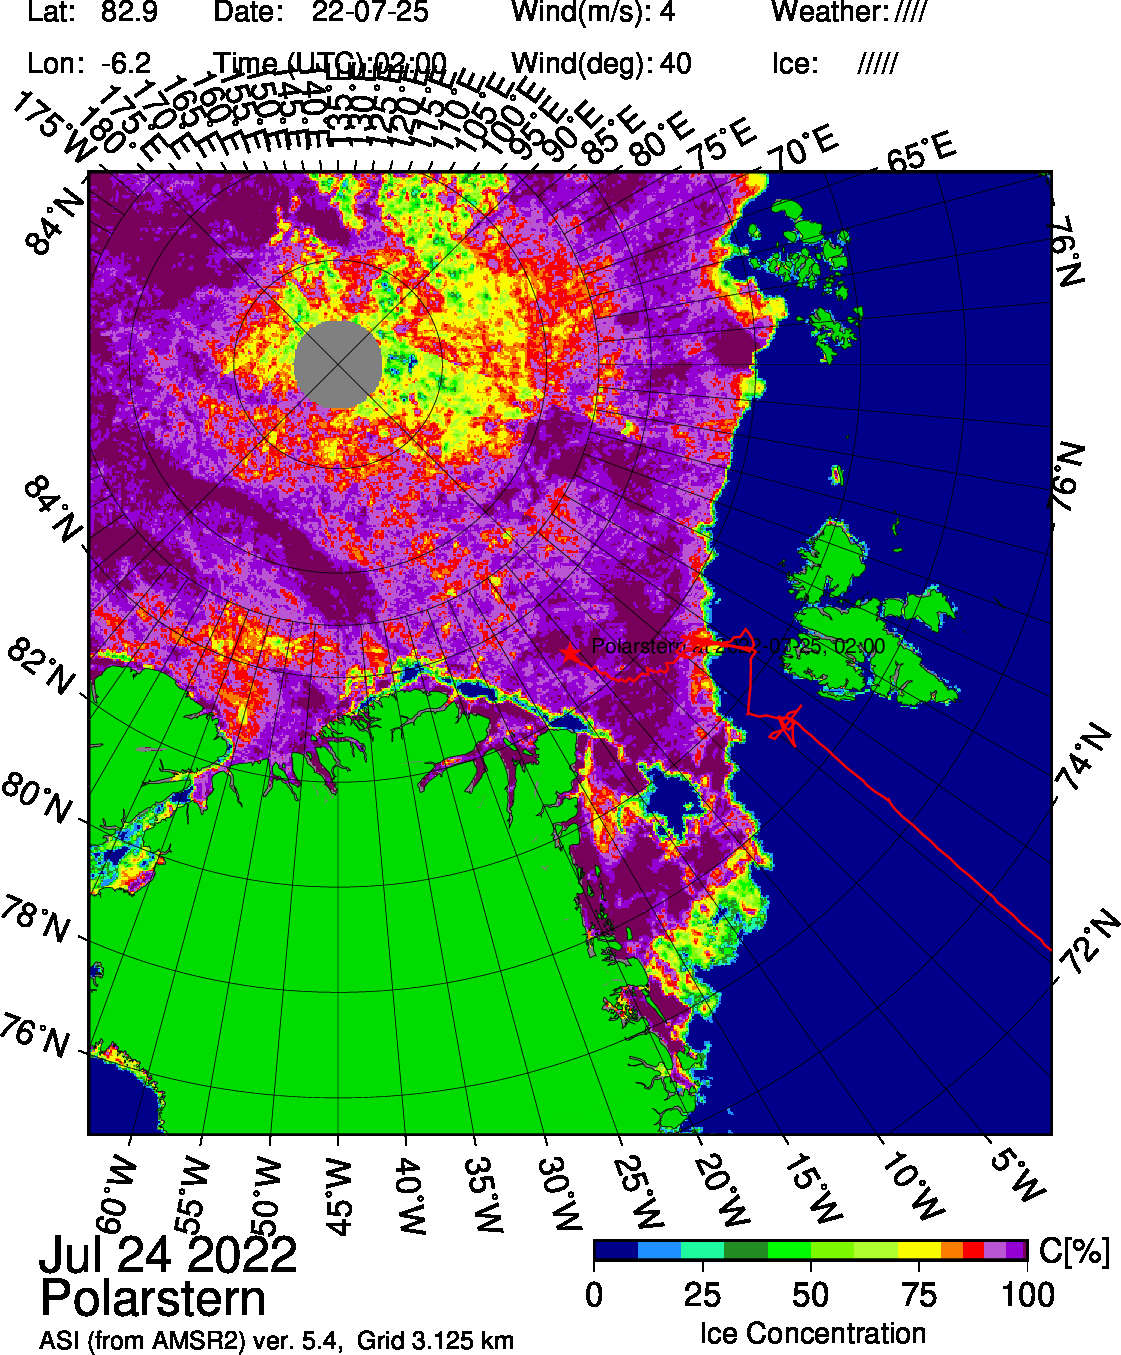
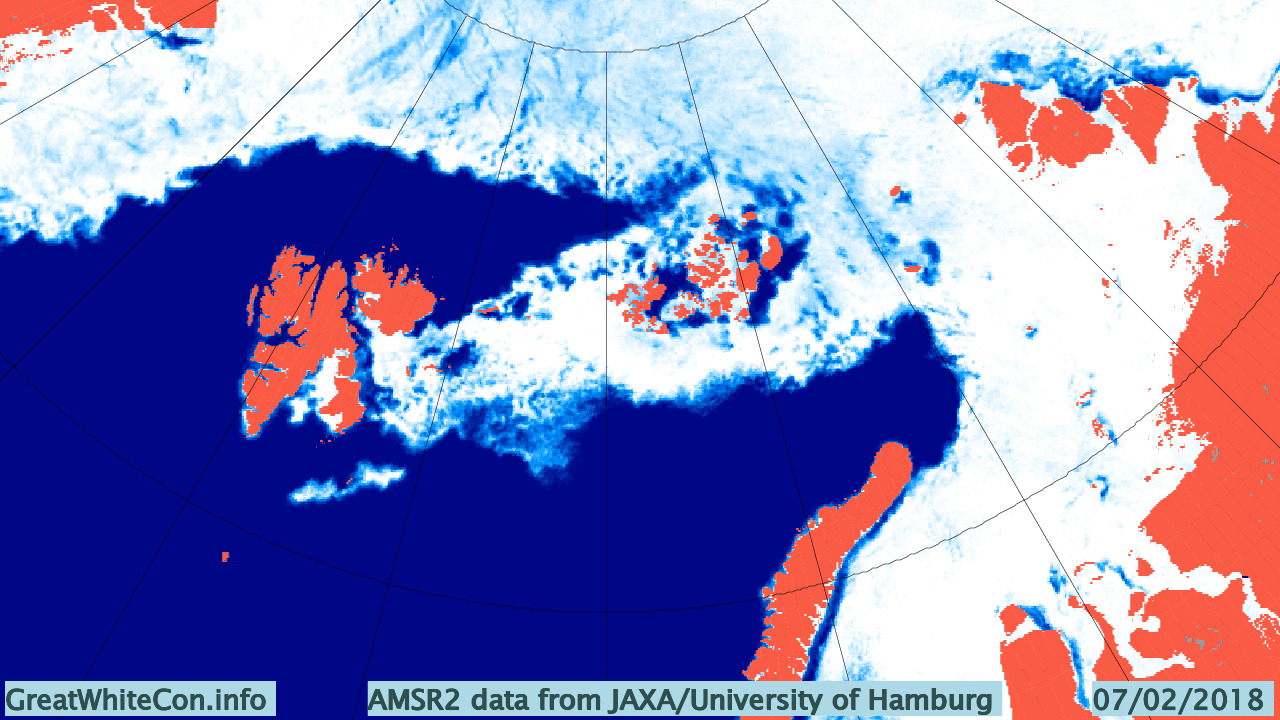
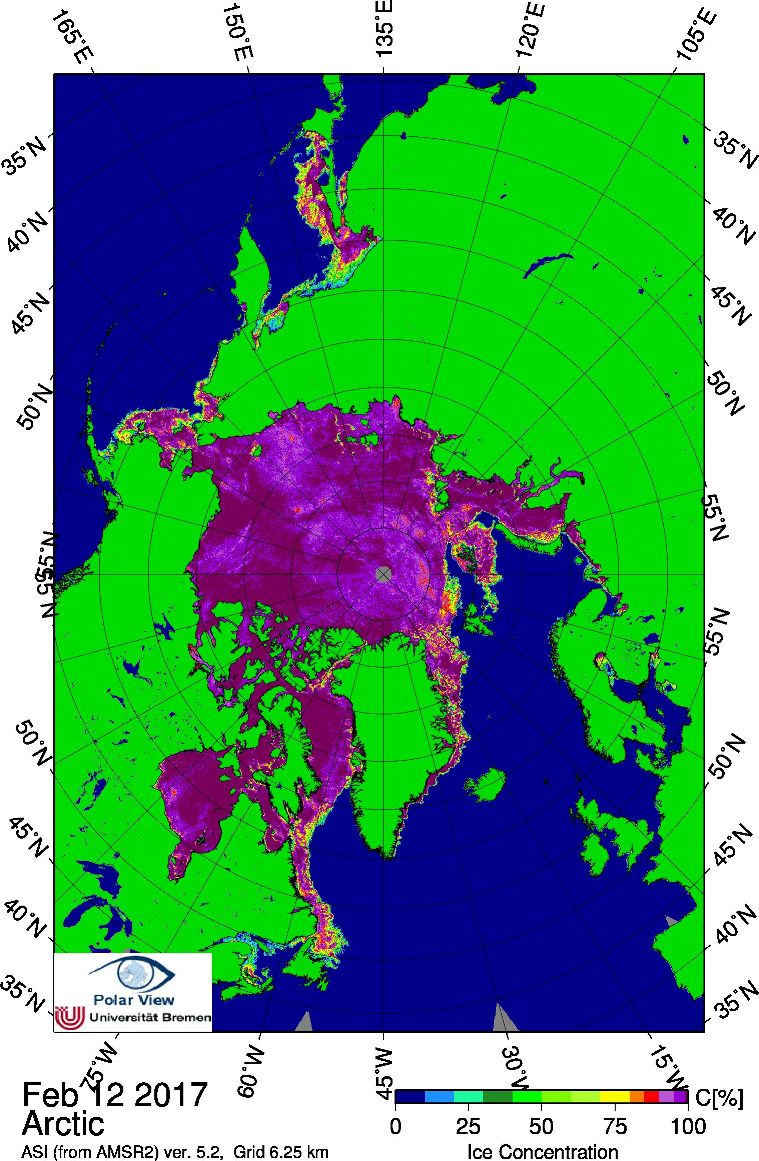
Area has declined a lot! That’s because sea ice concentration is now noticeably <100% across much of the Arctic:

Bremen-AMSR2-20170212

There’s also been a discernable change in slope of the DMI freezing degree days graph:

DMI-FDD-20170213


[Edit – February 19th]

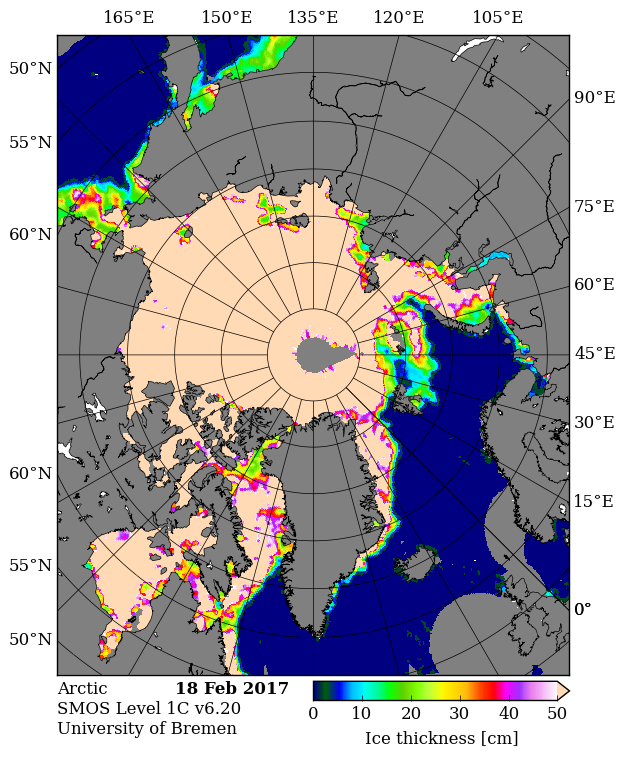
There’s been a late spurt of growth in both area and extent, which are now back in the pack of previous years:

UH-Arctic-Area-2017-02-18

UH-Arctic-Extent-2017-02-18

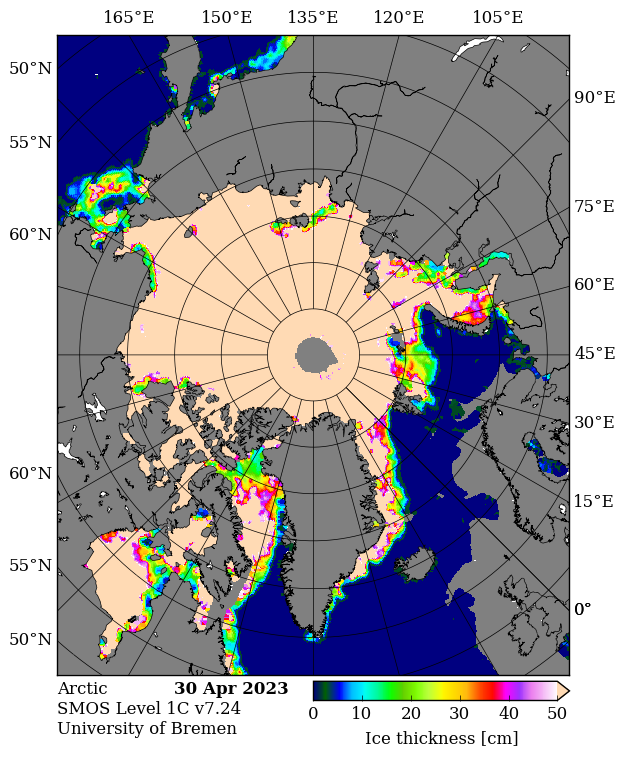
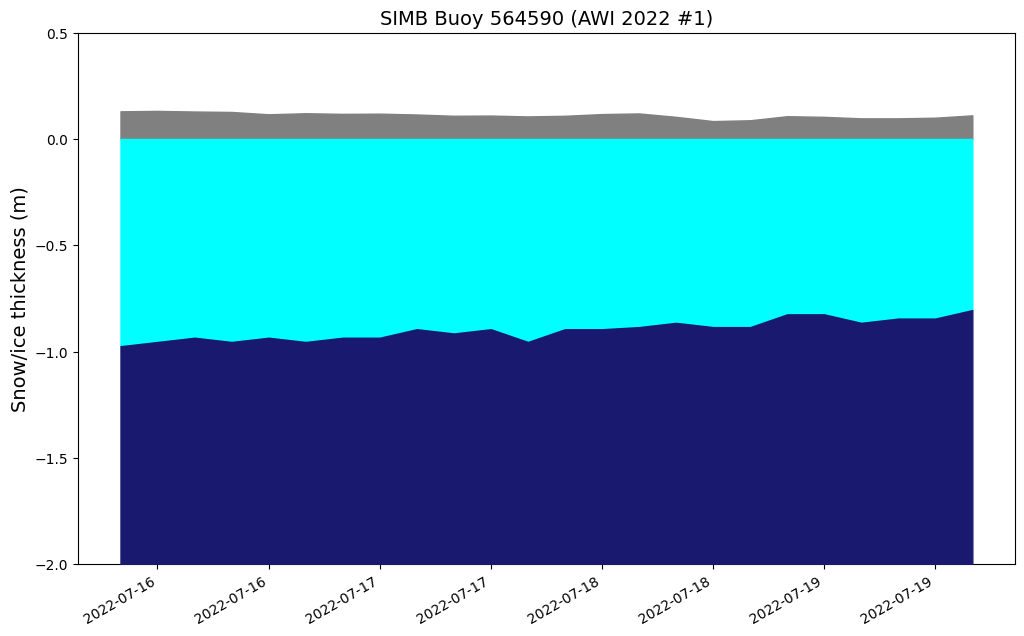
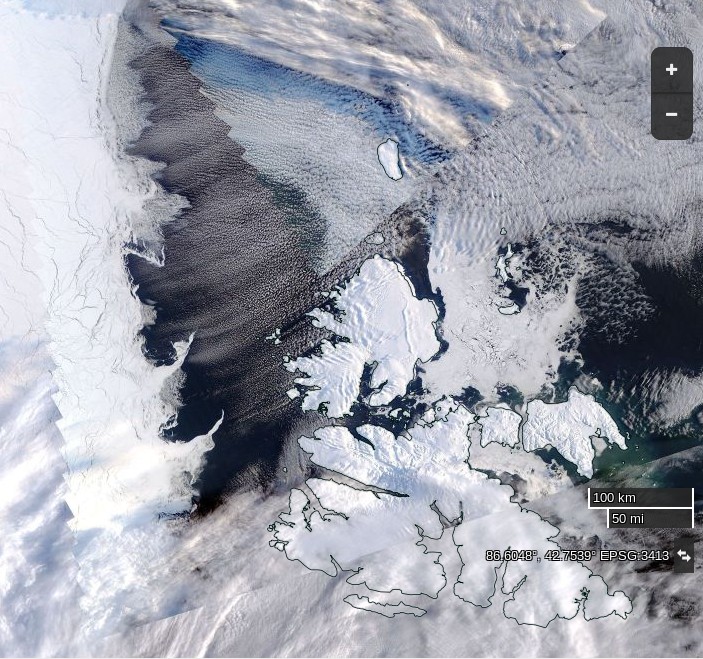
The newly frozen areas are currently still very thin:

SMOS-20170218

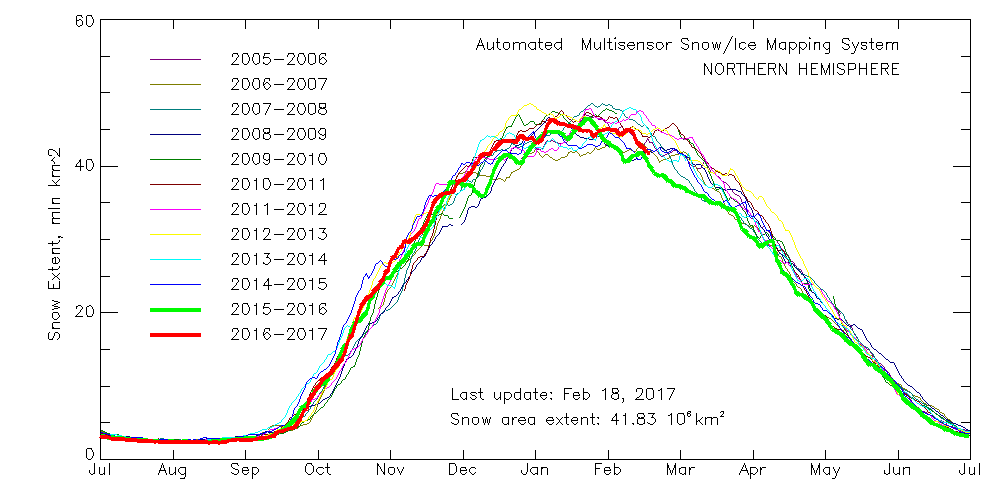
Meanwhile northern hemisphere snow cover has started to melt in earnest:

multisensor_4km_nh_snow_extent_20170218

Watch this space!

Vanishing Svalbard Sea Ice

At the turn of the year we speculated about the potential effect of high temperatures and the swells caused by strong winds on sea ice in the Fram Strait and Barents and Greenland Seas. With the vernal equinox rapidly approaching let’s take stock of the state of Svalbard sea ice. Here’s one the first “visual” satellite images of the area in 2016 recorded yesterday by the Aqua satellite:

NASA Worldview “true-color” image of the Central Arctic north of Svalbard on March 14th 2016, derived from the MODIS sensor on the Aqua satellite

and here is the equivalent sea ice map from the Norwegian Meteorological Institute:

Svalbard-Map-20160314

Both sources reveal an unseasonable lack of solid sea ice around Svalbard. In fact an intrepid Northwest Passage navigator who didn’t mind the dark might well currently be able to circumnavigate Svalbard!

The Norwegian Meteorological Institute also produce a time series of sea ice area in the Svalbard region based on data from OSI-SAF. It currently looks like this:

osisaf-svalbard_20160314

As sunlight returns to the Central Arctic north of 80 degrees there is an anomalously large area of open water ready to soak up the rays. Here is what the Danish Meteorological Institute timeseries of Central Arctic temperatures looks like at the moment:

DMI-meanT_20160314

and here is the current Svalbard surf forecast from Magic Seaweed:

MSW-20160315

Whilst we speculate on what all this might mean for the Atlantic side of the Arctic over the coming melting season, here’s our new Svalbard Sea Ice page which contains a variety of graphs and maps to help us keep track of events on that part of our planet.