In a press release last week the Alfred Wegener Institute announced that:
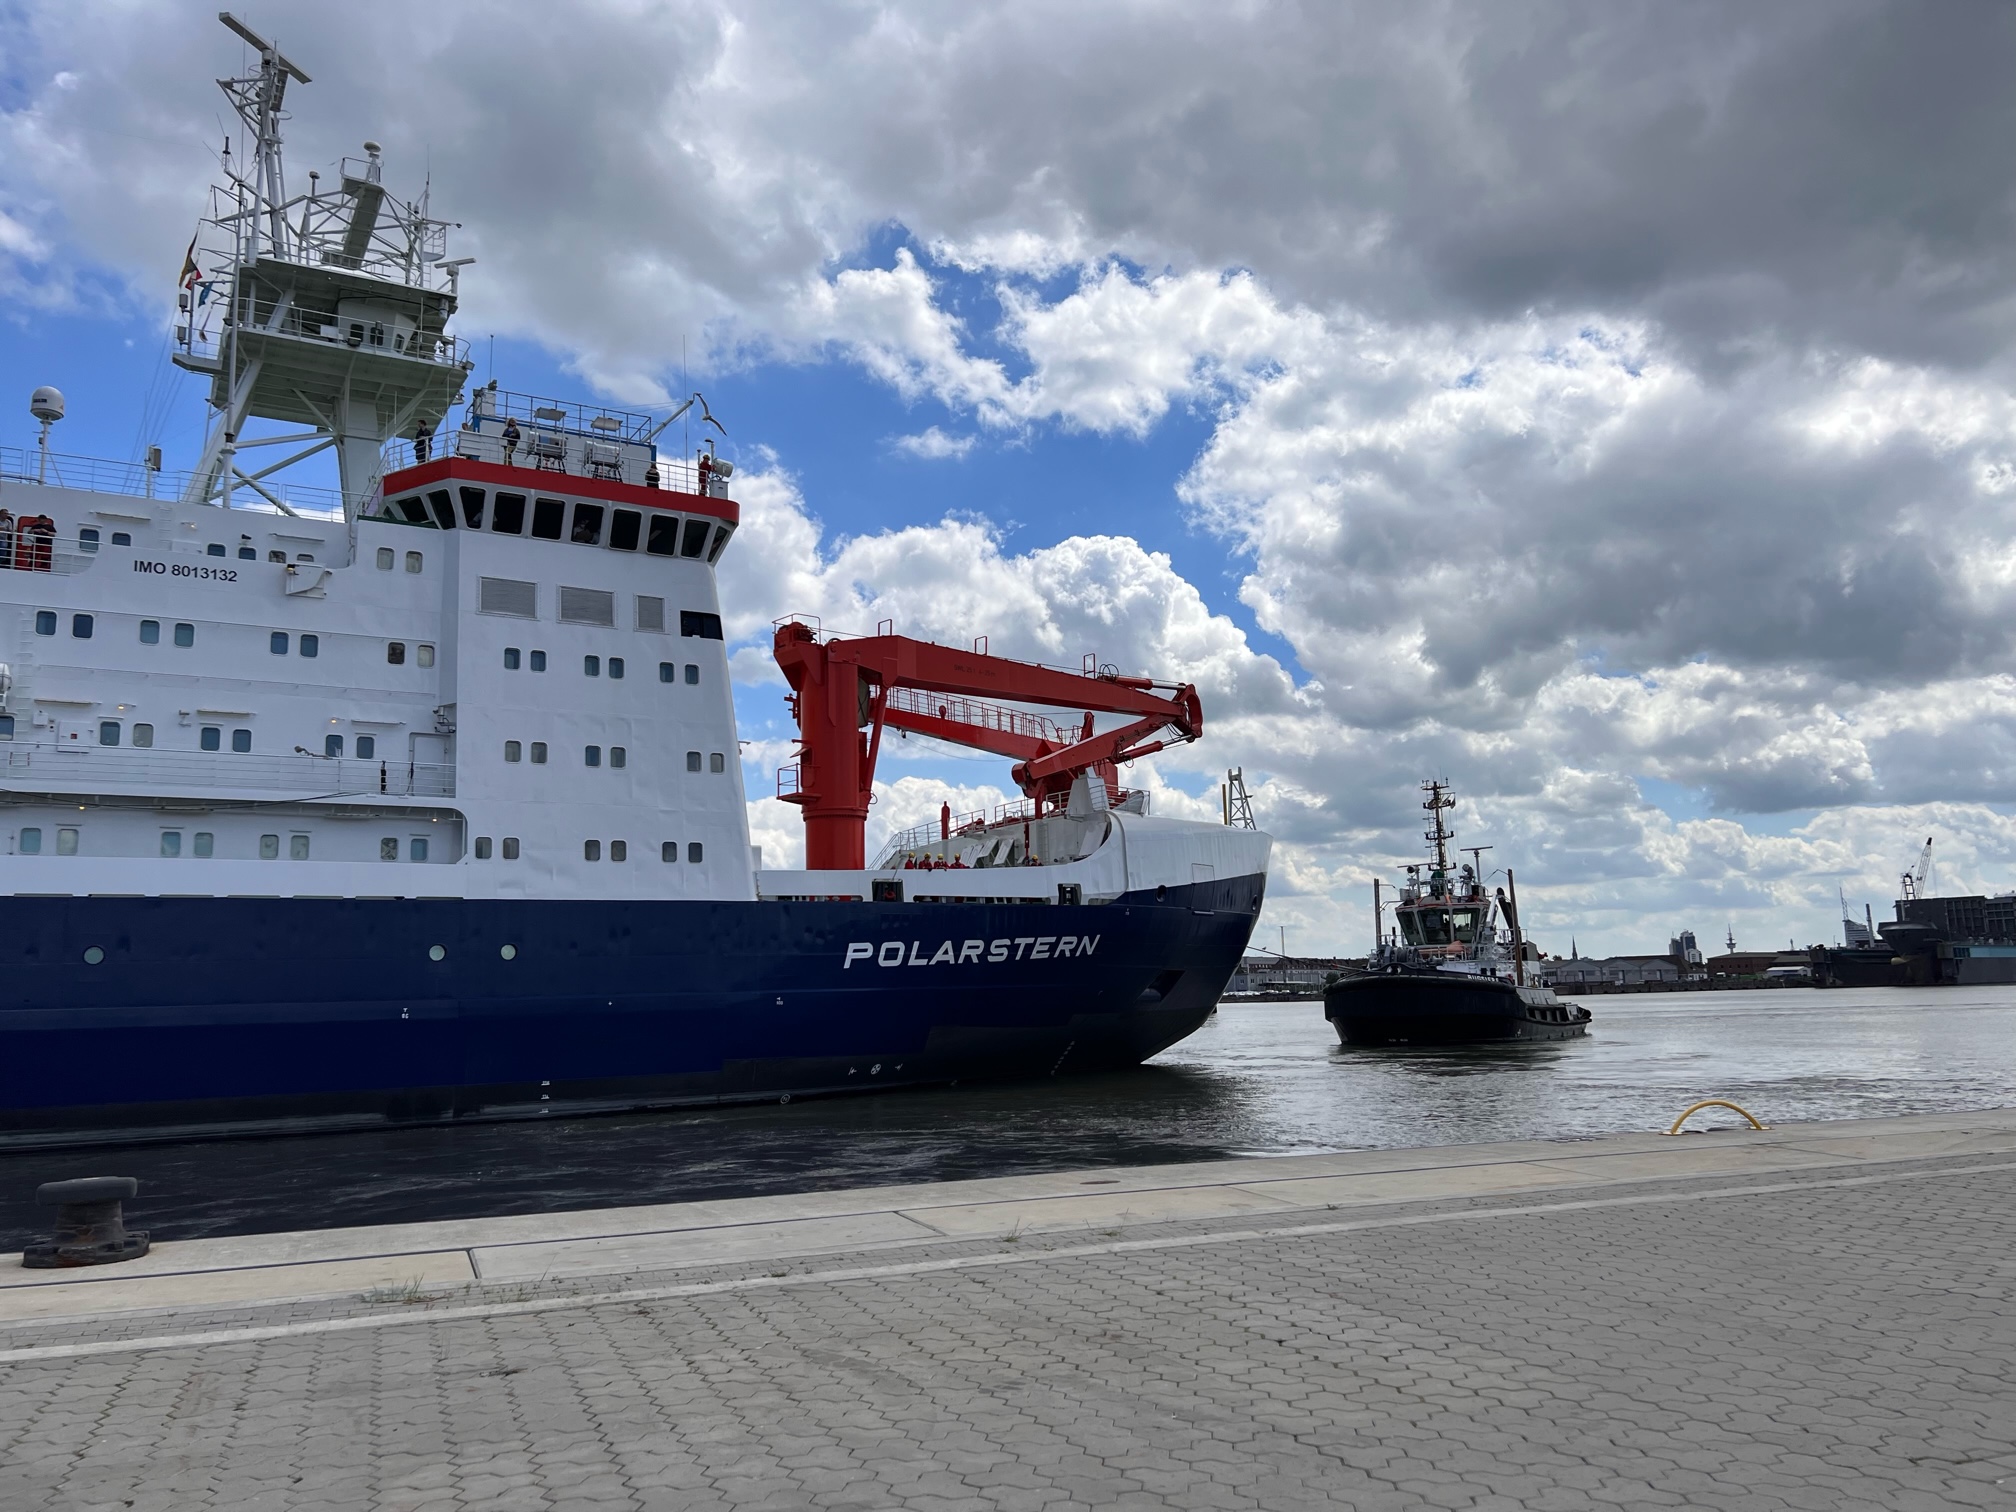
From her home port in Bremerhaven, the Polarstern will set course for Fram Strait and the marginal ice zone north of Svalbard, where warm, nutrient-rich Atlantic Water flows into the Arctic Ocean.
The Polarstern starts its voyage to the Arctic from its home port of Bremerhaven. Photo: Nina Machner
Closely monitoring energy and material flows in the marginal ice zone from the ship and from on ice floes is the goal of the team led by Prof Torsten Kanzow, expedition leader and a physical oceanographer at the Alfred Wegener Institute, Helmholtz Centre for Polar and Marine Research (AWI). “We will make transects from the open water into the dense sea ice and back. Along the way, we will gather a variety of physical, chemical and biological measurements in the marginal ice zone, which is especially productive and therefore especially interesting,” explains Kanzow.
“The team will also venture onto the ice to take a closer look at the thickness and characteristics of the sea ice and measure ocean currents and eddies away from the ship. We’ll also deploy so-called gliders in the ocean, buoys on the ice and moorings on the seafloor, all of which will record valuable data for the next several years. Lastly, we’ll extend our research radius with helicopter flights, during which we’ll observe, for instance, the melt ponds on the ice.”
Following the work in the MIZ north of Svalbard Polarstern will be heading for Northeast Greenland:
The two glaciers there (79 N Glacier and Zachariae Isstrom) are both characterised by ocean-driven ice loss and accelerated ice flows, making them contributors to sea-level rise. “We plan to install moorings in order to gauge the sensitivity of ocean-driven glacier melting to changing environmental conditions,” says Kanzow, who’s been pursuing research in the region since 2016. Accompanying geodetic-glaciological studies will be conducted on Greenland. On the one hand, they will assess how the solid ground is rising on extremely small scales, because it is still rebounding from the past weight of ice masses that melted after the last glacial maximum. On the other, they will explore temporal variations in supraglacial lakes; their drainage out to sea can have considerable effects on glacier flow speeds and glacier melting.
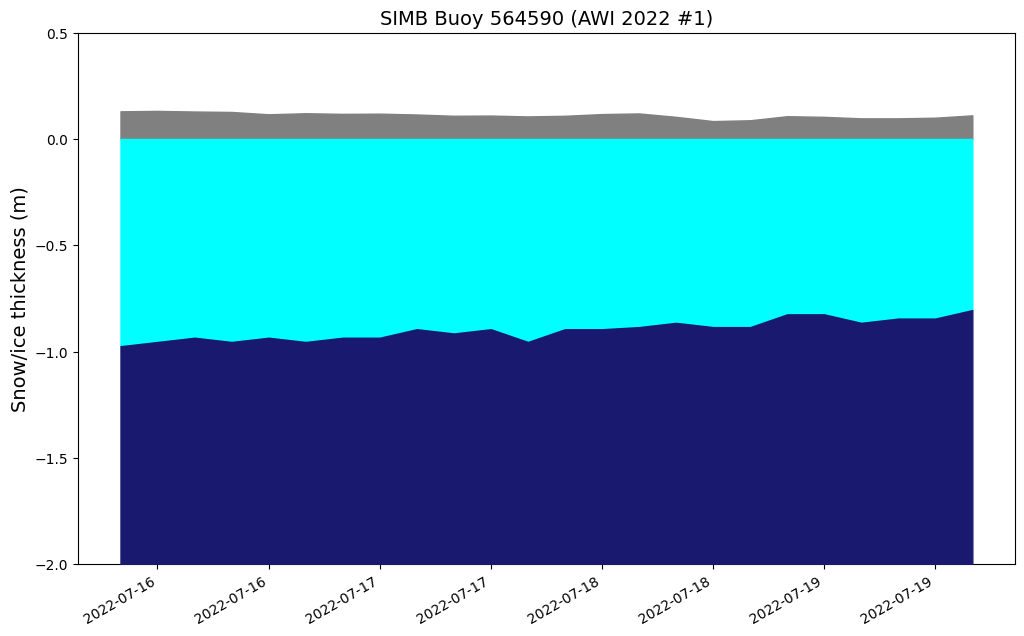
The AWI team have installed three seasonal ice mass balance buoys in the MIZ, without the usual thermistor string but with a new conductivity, temperature, depth (CTD) sensor fitted to measure salinity instead. Less colourful than usual sea ice thickness graphs can be viewed on the 2022 ice mass balance buoy page. Here’s one example:
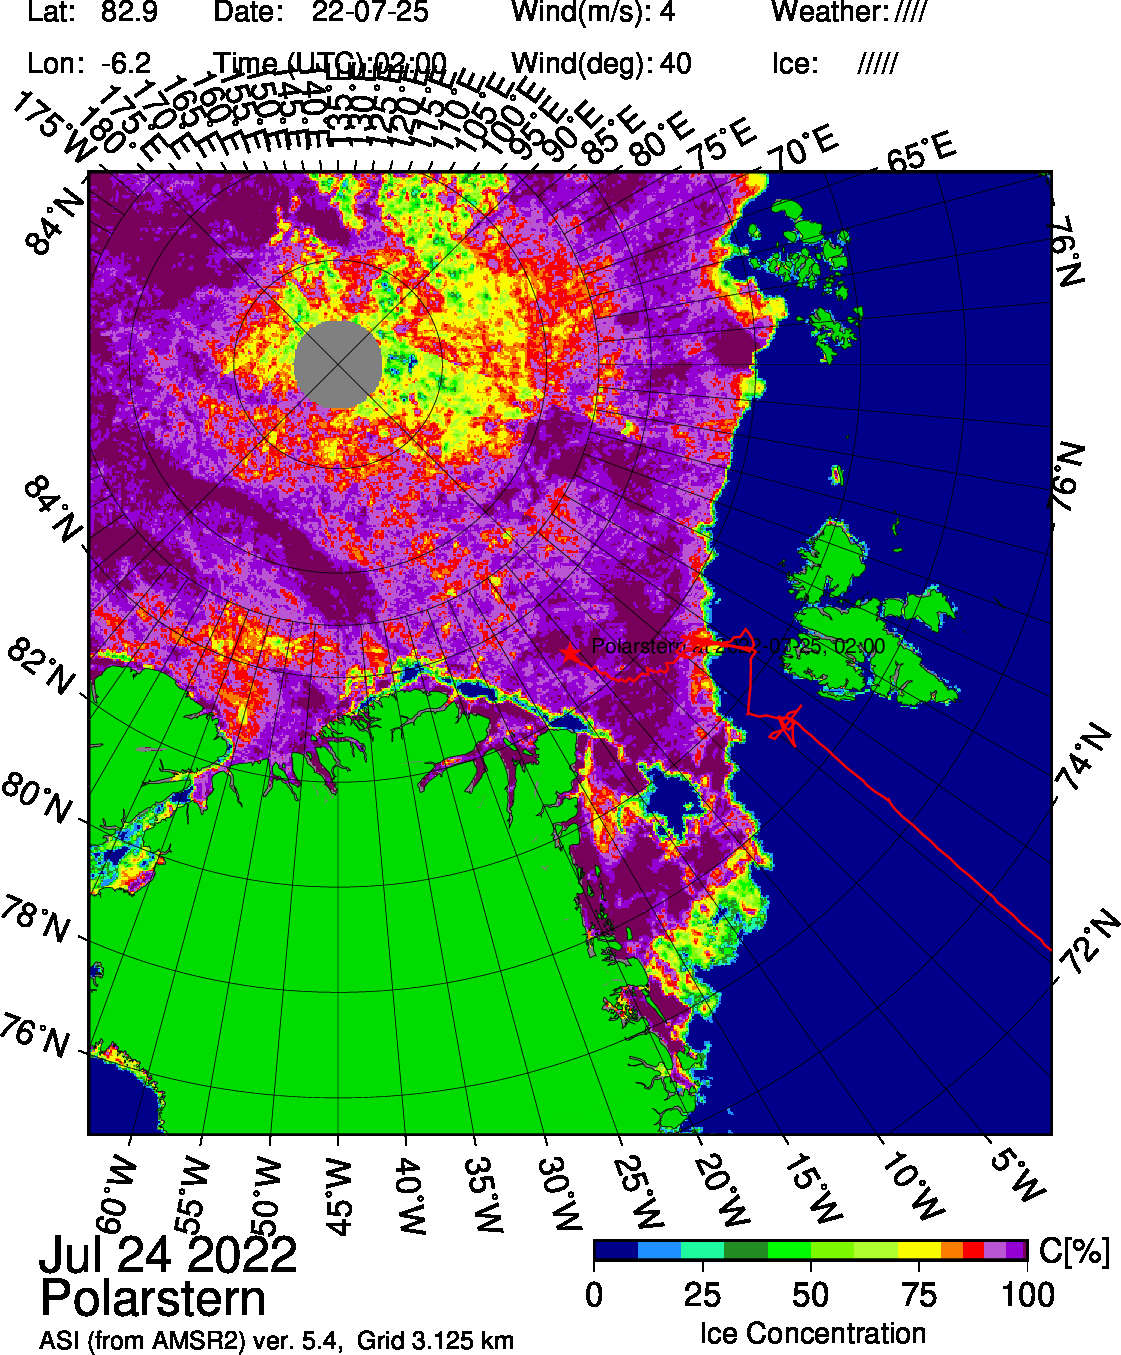
[Edit – July 25th]
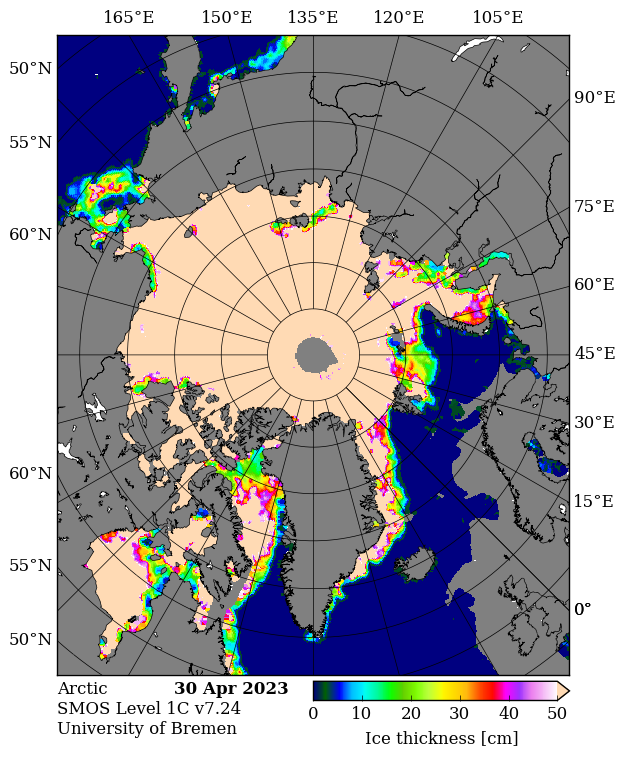
The image above updates on a daily basis, but today’s version is worth preserving for posterity:
There is currently a large area of low concentration sea ice around the North Pole, and Polarstern has left its station in the marginal ice zone and is currently heading north of Greenland rather than in the direction of the 79N/ZI glaciers.
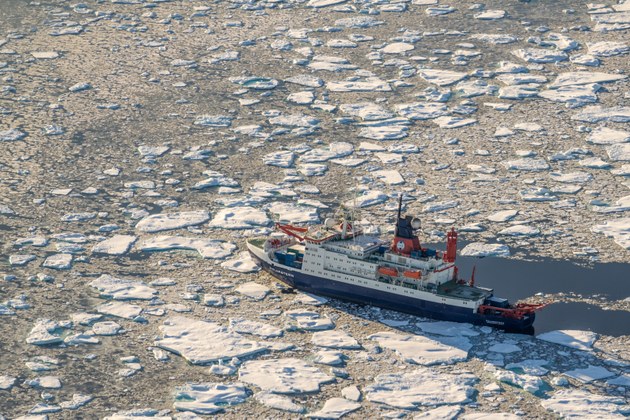
Polarstern has been heading even further north to the Aurora Vent field (about 130 nautical miles northwest). As part of an extensive lithospheric study, ocean bottom seismometers will be deployed at depths of more than 4000 meters to record seismological activity as well as the physical properties of the hydrothermal plume.
Polarstern north east of Greenland – Photo: Christian R. Rohleder
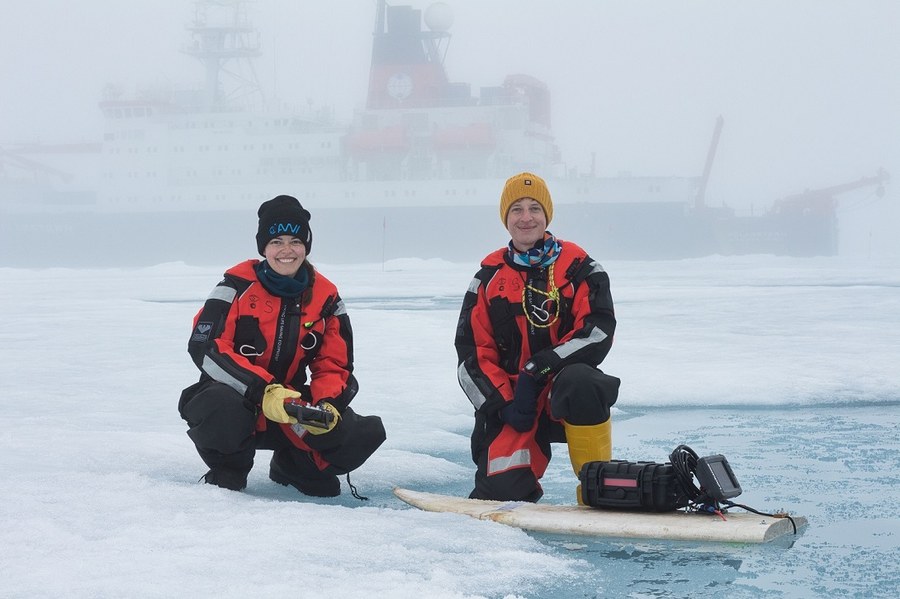
Polarstern is now heading south again, where a team from the Technical University of Dresden will be deploying a modified surfboard on supra-glacial lakes! Here’s a test run in a melt pond:
Photo: Erik Loebel[Edit – July 29th]
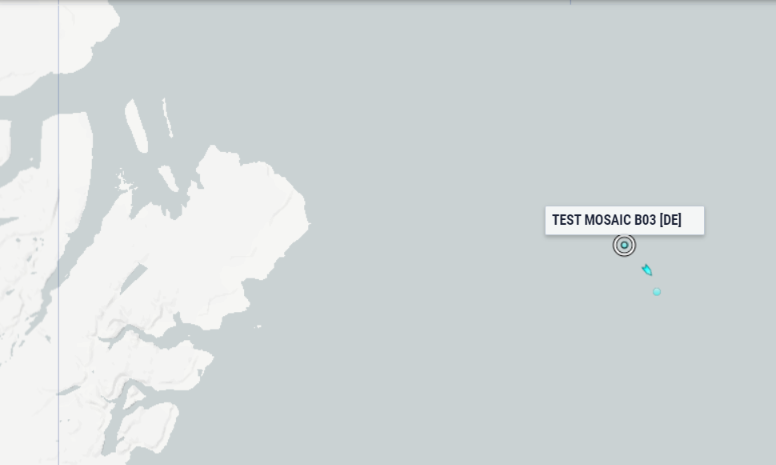
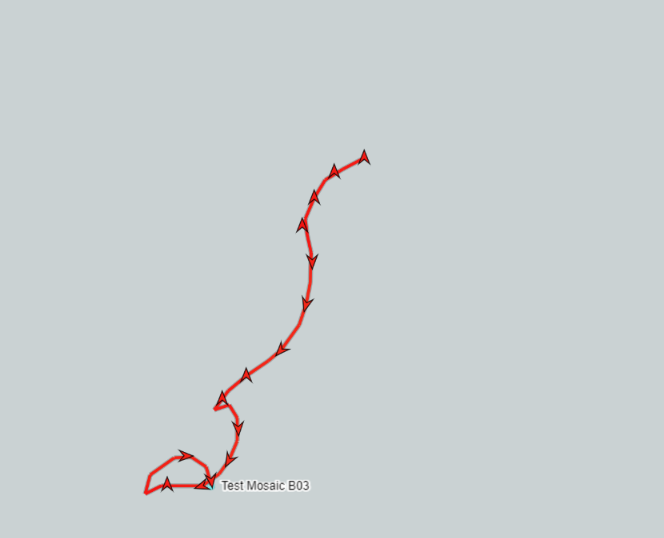
I discovered something rather interesting whilst browsing the Marine Traffic ship tracking web site this morning:
It appears as if the AWI have recently installed two buoys that support AIS position reporting, as indeed does Polarstern itself:
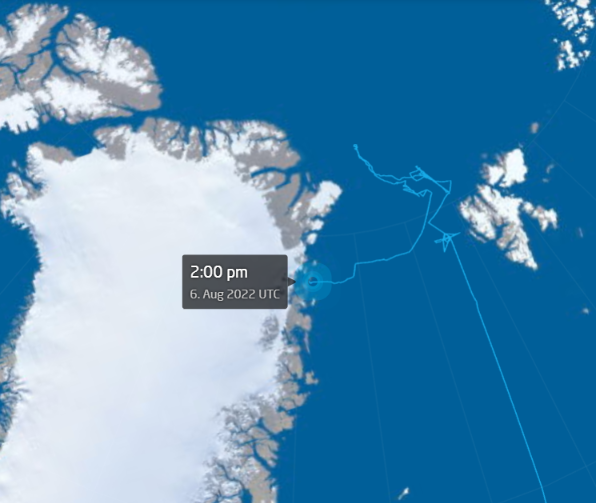
[Edit – August 6th]
Polarstern is now approaching the 79 N and Zachariae Isstrom glaciers:
Our title this morning is but a brief extract from a conversation I started on Judith Curry’s “Climate Etc.” blog about (believe it or not!) the effects of large wind driven swells on the “Marginal Ice Zone” of sea ice in the Arctic:
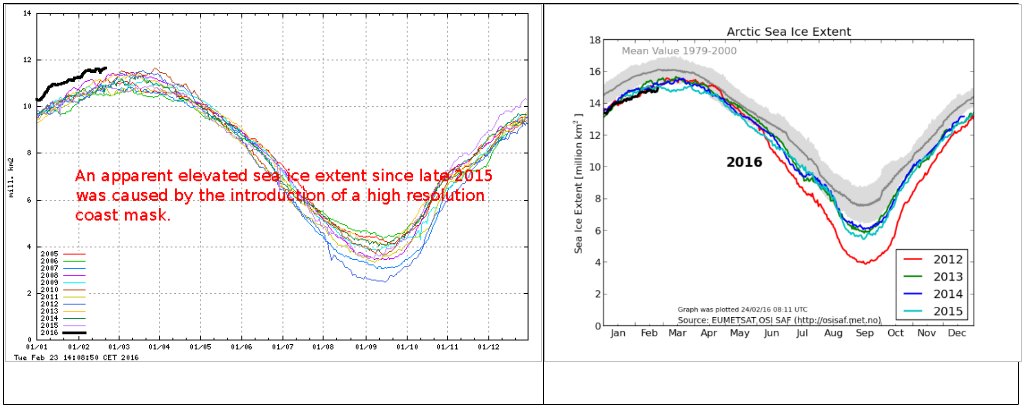
Whilst “skeptics” like Pethewin keep on flogging that particular “dead parrot” the DMI have just published an explanation of the erroneously high readings on their now deceased 30% concentration threshold Arctic sea ice extent metric. Here’s an extract, together with a pretty picture for the benefit of those amongst we Cryospheric commenters who are hard of understanding:
The apparent elevated sea ice extent in the data from the old extent algorithm was an artifact, caused by a new and higher resolution coast mask.
Surely that’s easy enough for even the dumbest of all the armchair Arctic analysts scattered across the internet to comprehend?
Going into more detail, the DMI article explains that:
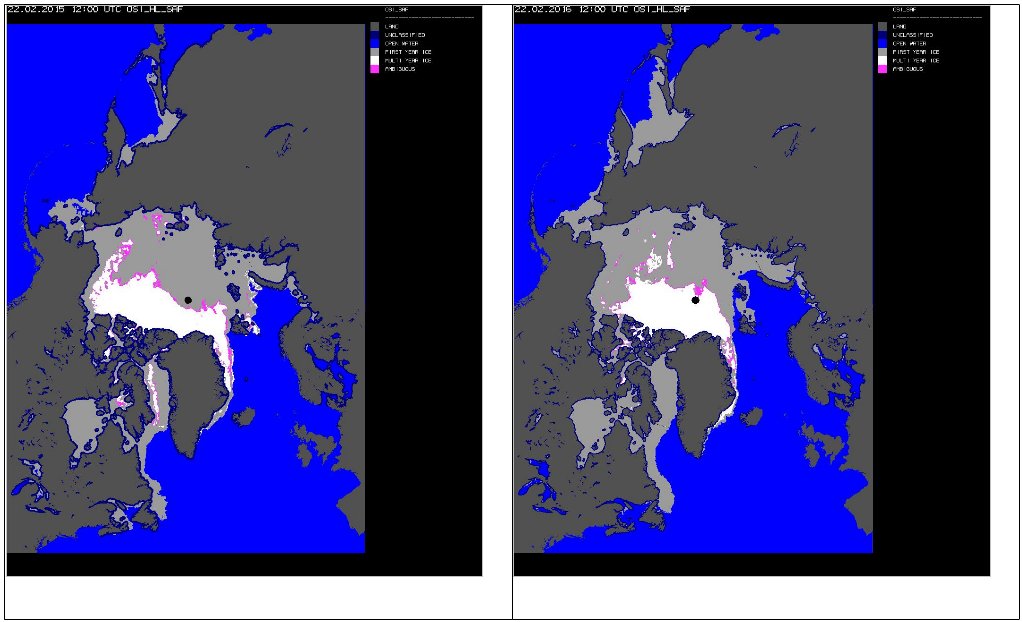
Most of our sea ice extent followers know that the old plot includes a coastal mask, inside which sea ice was is accounted for. In summer 2015 this mask was refined and the masked region was subsequently smaller, thus leaving more area for classified sea ice and open water. The difference in masked area, before and after summer 2015, is approximately 1.4 million km2. This corresponds to difference of the blue coast lines in figure 2, showing the old and new coastal masks in the left and right panels, respectively. The difference may be difficult to detect on the figure, but the area is quite significant. The increasing sea ice extent that is caused by the new coast mask is not great during summer, because sea ice has a relative short line of contact with land during summer. But the new and finer coast mask will result in increasingly more sea ice, compared to previous years during winter, as the coast line with sea ice contact is increasing. This is the reason for an increasing sea ice extent during current freeze-up period, relative to previous winters. A comparison of the 2015/2016 sea ice extent with previous years does therefore not make sense.
Note how the dark blue “coastal mask” in the left hand image from February 22nd 2015 is thicker than the one in the right hand image from the same date this year. DMI conclude with this apology:
Because of the deprecated status of the old plot in the past year, DMI has not been monitoring these irregularities. The old plot should, of cause, have been removed when the mask was replaced. DMI apologizes for the confusion and inconvenience this has caused.
Somehow I doubt that the assorted “skeptics” that have recently been making massive mountains out of this minor molehill will apologise for all “the confusion and inconvenience this has caused”. Causing confusion and inconvenience was probably the general idea.
R/V Lance serendipitously encountered an energetic wave event around 77°N, 26°E on 2 May 2010. Onboard GPS records, interpreted as the surface wave signal, show the largest waves recorded in the Arctic region with ice cover. Comparing the measurements with a spectral wave model indicated three phases of interaction:
wave blocking by ice
strong attenuation of wave energy and fracturing of ice by wave forcing, and
uninhibited propagation of the peak waves and an extension of allowed waves to higher frequencies (above the peak)
Wave properties during fracturing of ice cover indicated increased groupiness. Wave-ice interaction presented binary behavior: there was zero transmission in unbroken ice and total transmission in fractured ice. The fractured ice front traveled at some fraction of the wave group speed. Findings do not motivate new dissipation schemes for wave models, though they do indicate the need for two-way, wave-ice coupling.
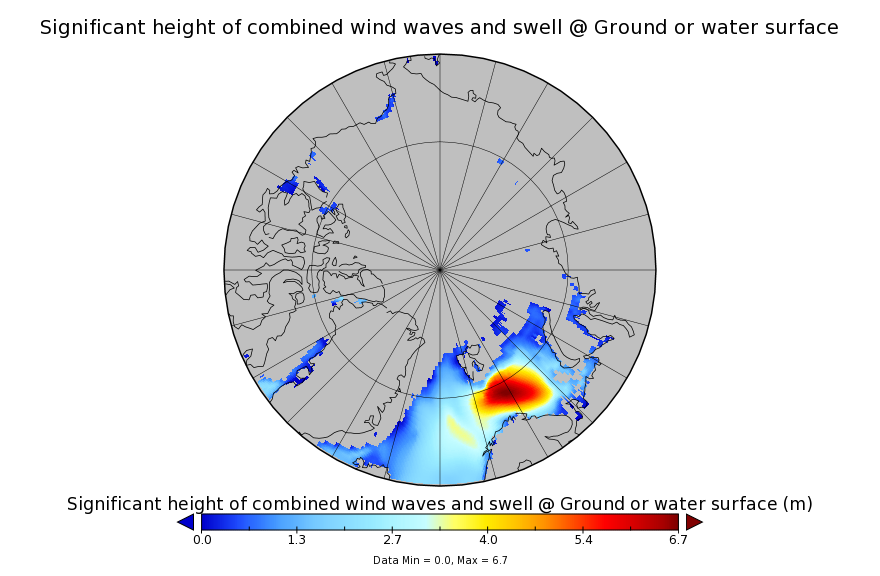
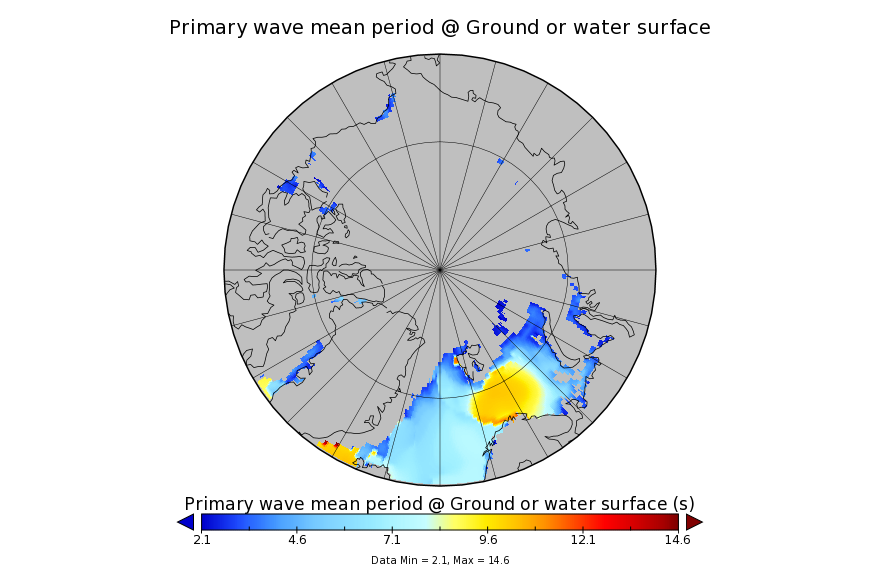
There’s a lot of equations and similarly technical stuff in the body of the paper which is nevertheless well worth a read even if you’re not a techie, as are the articles in the long list of references at the end. However, there aren’t any “swell forecasts” of the sort we like to put in our discussions of “waves-in-ice“, so firstly let’s fix that. Here’s some visualisations from NOAA’s WaveWatch III reanalysis for 18:00 on May 2nd 2010:
which reveal a swell with a significant height of 6 meters and a period of 11 seconds in the open ocean south of Hopen Island and Svalbard. Collins et al. concluded that:
Our results suggest that accurate wave prediction would have required coupling with an ice model which resolved scales of hours and kilometers. Implementation at such scales will no doubt be a future challenge. These are the largest known waves recorded in the Arctic with substantial ice cover present, and we expect the measurement of large-wave events to occur more frequently in the future due to the fetch wave-ice fetch feedback loop.
Now comes news that the R/V Lance has been subject to another “waves-in-ice” event, although this time it was north of Svalbard. First of all here’s a video showing an earlier stage of the Lance’s 2015 Arctic program:
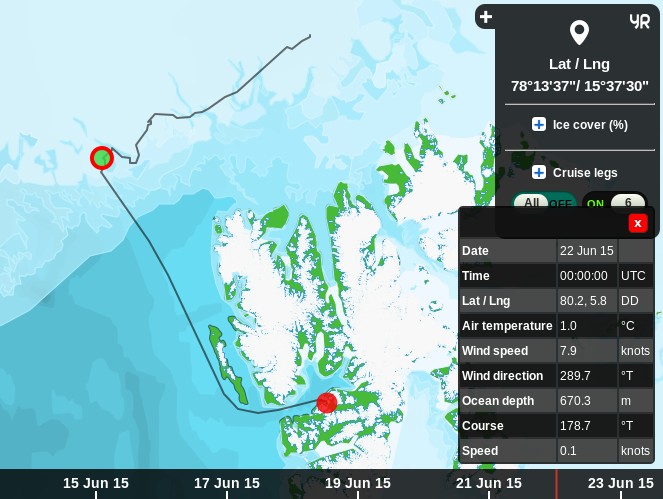
Next the latest serendipitous encounter for the Lance. According to the Twitter feed of the Oceanography & Sea Ice department of the Norwegian Polar Institute on June 22nd 2015:
The sea ice floe with the N-ICE2015 research camp broke
Now some further information (and more pictures!) has emerged via the Twitter feed of Harvey Goodwin, who says that:
When a light swell comes in the 5km sea ice floe we’d been working on broke into pieces not more than 30m [across] in an hour:
Equipment rescue[d] after sea ice breakup. Some cables cut but no equipment lost!
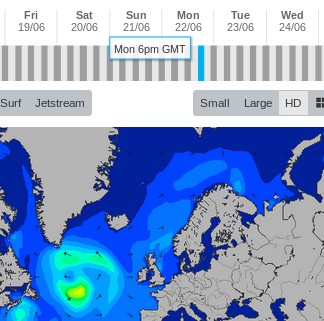
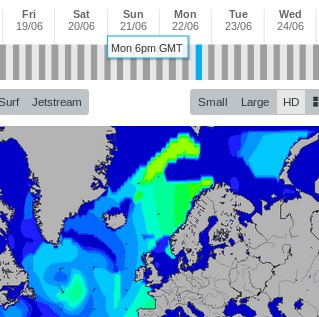
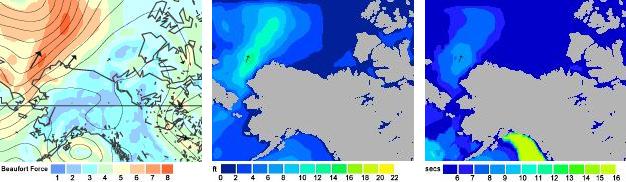
The WaveWatch III reanalysis for June 2015 isn’t available yet. We’ll bring you that information once it is, but for now here’s a couple of quick snapshots from the Magic Seaweed surf forecasting site:
They suggest that a smaller but longer period swell was responsible for the ice break up this time around, compared to 2010. I wonder if it will take another 5 years for this latest event to be more fully documented in the scientific literature?
Today we’re going to delve into the application of surf science in the Arctic. If you’re not already familiar with the basics of how the best surf is created then perhaps you might first wish to take a detour to the StormSurf “Wave Basics” article:
Wind waves, though rideable, are not the optimal type of wave one likes to ride. Swells are much better. Wind waves are only the raw material that swells are made from. But, the more energy wind waves accumulate while being driven by wind, the greater the likelihood they will transform into a swell. Enough energy and the swell can travel the entire circumference of the globe with only a slow decay in size!
During a typical open ocean winter storm, one could expect to see winds of 45-55 kts blowing over 600-1000 nautical miles for 36 hours. In such a storm, the average highest wind waves (or ‘seas’) commonly reach 30-35 ft towards the center of the fetch area and produce a swell with a period of 17-20 secs.
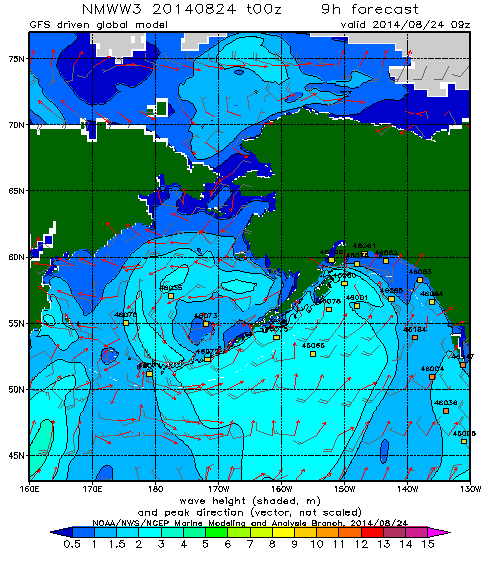
Regular readers may recall that on August 24th 2014 we revealed this WaveWatch III “surf forecast” for the Beaufort Sea, which lies off the north coast of Alaska and the Canadian Northwest Territories (i.e. top center of the map): and noted that the 2 meter waves depicted:
Have blasted past Point Barrow and are currently heading straight for the Beaufort Sea Marginal Ice Zone.
Here’s a video from the University of Washington’s Applied Physics Laboratory which explains that the Marginal Ice Zone is:
The area between declining unbroken sea ice and the expanding area of open water.
The theoretical significance of such swells has been discussed in a number of academic papers recently. Take for example these extracts from “Swell and sea in the emerging Arctic Ocean” by Jim Thomson from the University of Washington and W. Erick Rogers from the US Naval Research Laboratory. Note first of all that the authors distinguish between “wind seas” and “swells” as follows:
Pure wind seas have a wave age less than one, indicating that the wind is driving the waves, and these points cluster largely below the Pierson–Moskowitz limit. Swells have a wave age greater than one, indicating that the waves are outrunning the wind.
They then go on to use some more terms very familiar to the average surfer:
Ocean surface waves (sea and swell) are generated by winds blowing over a distance (fetch) for a duration of time. In the Arctic Ocean, fetch varies seasonally from essentially zero in winter to hundreds of kilometers in recent summers. Using in situ observations of waves in the central Beaufort Sea, combined with a numerical wave model and satellite sea ice observations, we show that wave energy scales with fetch throughout the seasonal ice cycle. Furthermore, we show that the increased open water of 2012 allowed waves to develop beyond pure wind seas and evolve into swells. The swells remain tied to the available fetch, however, because fetch is a proxy for the basin size in which the wave evolution occurs. Thus, both sea and swell depend on the open water fetch in the Arctic, because the swell is regionally driven. This suggests that further reductions in seasonal ice cover in the future will result in larger waves, which in turn provide a mechanism to break up sea ice and accelerate ice retreat.
It is possible that the increased wave activity will be the feedback mechanism which drives the Arctic system toward an ice-free summer. This would be a remarkable departure from historical conditions in the Arctic, with potentially wide-ranging implications for the air-water-ice system and the humans attempting to operate there.
In practice there were several more swells that impacted the Beaufort Sea marginal ice zone over the course of the next couple of weeks. Here’s what the charts looked like, as visualised by MagicSeaweed.com rather than NOAA:
Beaufort Sea on August 27th 2014 – Winds / Wave Height / Wave Period
Beaufort Sea on September 1st 2014 – Winds / Wave Height / Wave Period
Beaufort Sea on September 7th 2014 – Winds / Wave Height / Wave Period
Note that on the right of each set of three is a depiction of the period of the waves in question. As StormSurf points out:
Chop tends to have a period ranging from 3-8 seconds. That is, there is anywhere from 3-8 seconds between each wave crest. Wind waves range from 9-12 seconds. Ground swells range from 13-15 seconds, and strong ground swells have a period anywhere from 16-25 or more seconds.
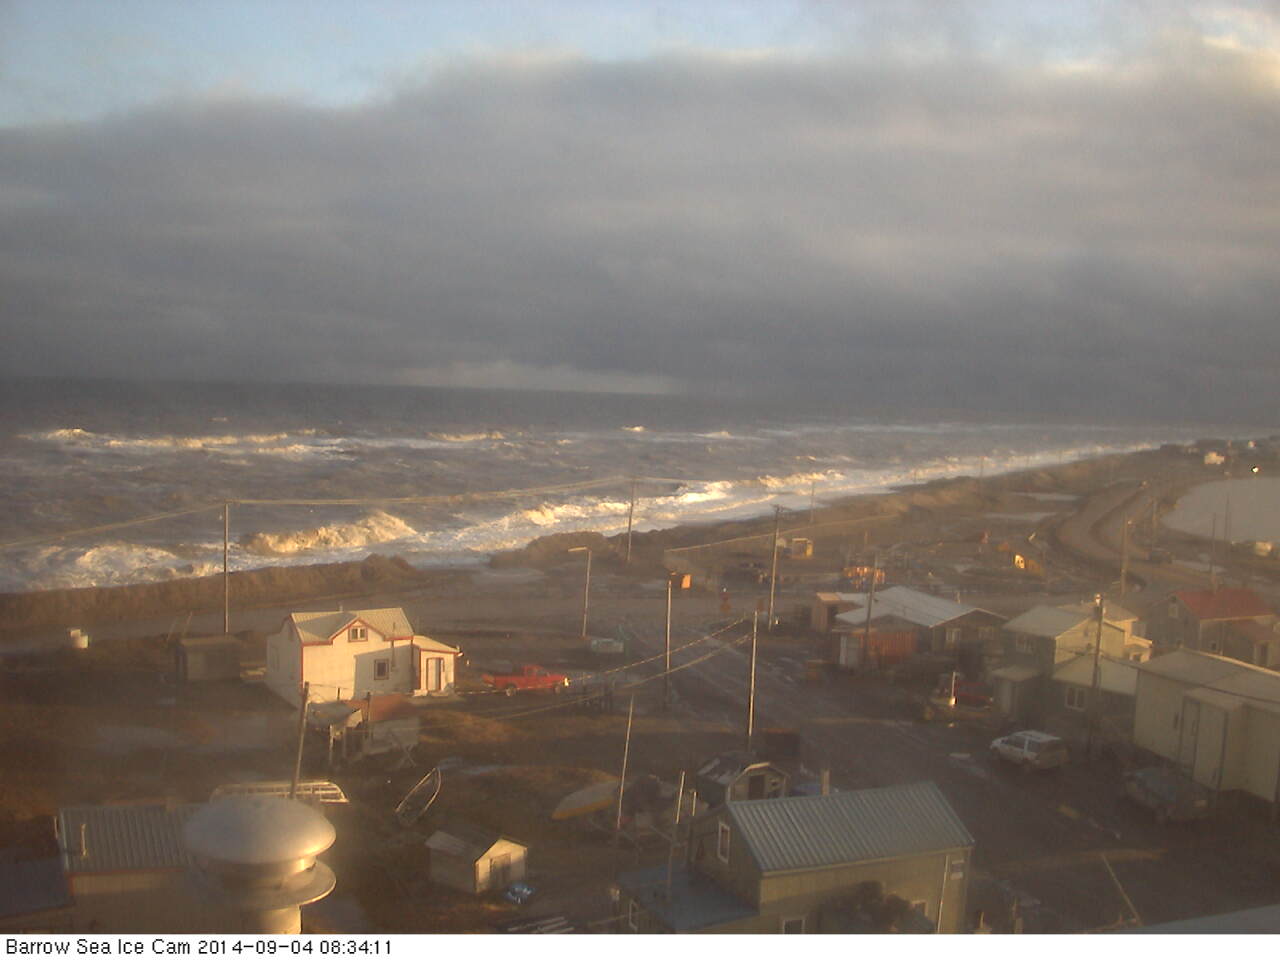
Thus the final swell on September 7th was actually the best of the bunch, with a small area of waves over 10 feet in height and with a period of over 9 seconds. According to StormSurf those are merely “wind waves” and not yet a full blown “swell”. To give you a feel for such waves here’s what some “wind waves” hitting the beach at Barrow looked like on September 4th 2014:
Next here’s another video that reveals what effect those series of waves had on the sea ice in the Beaufort Sea:
For future reference here also is the same swell described by Thomson and Rogers, but illustrated in an identical “surfer friendly” format to the 2014 swells we’ve been looking at:
Beaufort Sea on September 18th 2012 – Winds / Wave Height / Wave Period
whilst here is the swell produced by the “Great Arctic Cyclone” of early August 2012, also mentioned in passing by Thomson and Rogers:
Beaufort Sea on August 5th 2012 – Winds / Wave Height / Wave Period
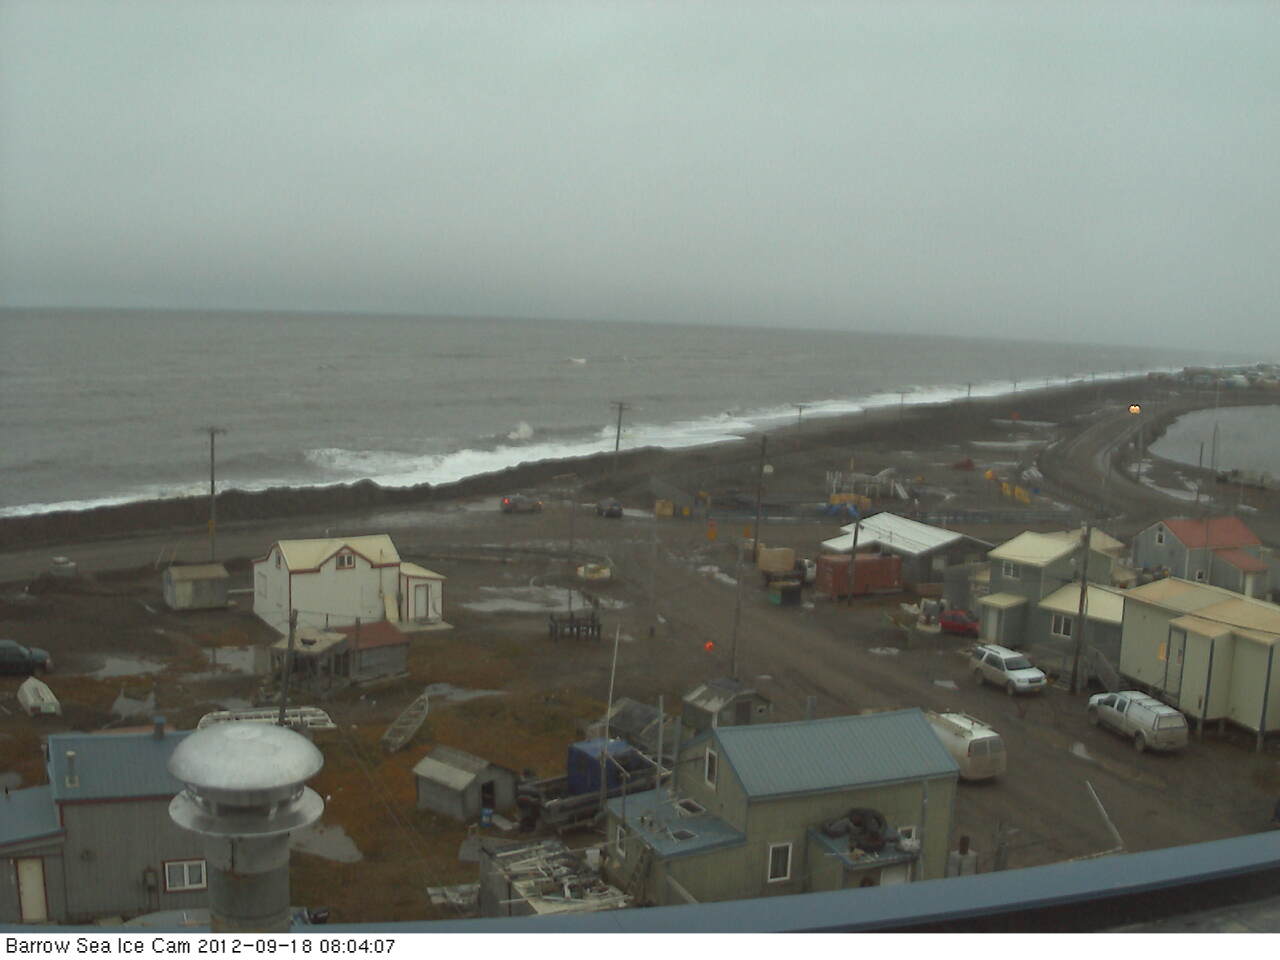
As you can see, if you’re a surfer used to tracking swells across the world’s oceans at least, whilst the September 2012 swell was indeed rather more substantial than those we have looked at in 2014, with a height in excess of 20 feet, the period was too short to qualify as a full blown swell and it was in fact directed away from the ice edge rather than towards it. Here’s what that 2012 swell looked like once it reached Barrow:
All of which does rather make one wonder what might happen if a slightly longer period swell directed at the ice edge in the Beaufort Sea were to occur at some point in the not too distant future? Whilst we all wait with bated breath to discover what that future holds for the sea ice in the Arctic, not to mention the beach at Barrow, here’s another video about the 2014 Marginal Ice Zone Program, which summarises the year’s campaign as a whole:
Note that Craig Lee says that:
We had very little wave activity. It was surprisingly calm when we were out there in the Araon, both when we were in the ice and in the open water. There just wasn’t much wind, and so there weren’t very many surface waves.
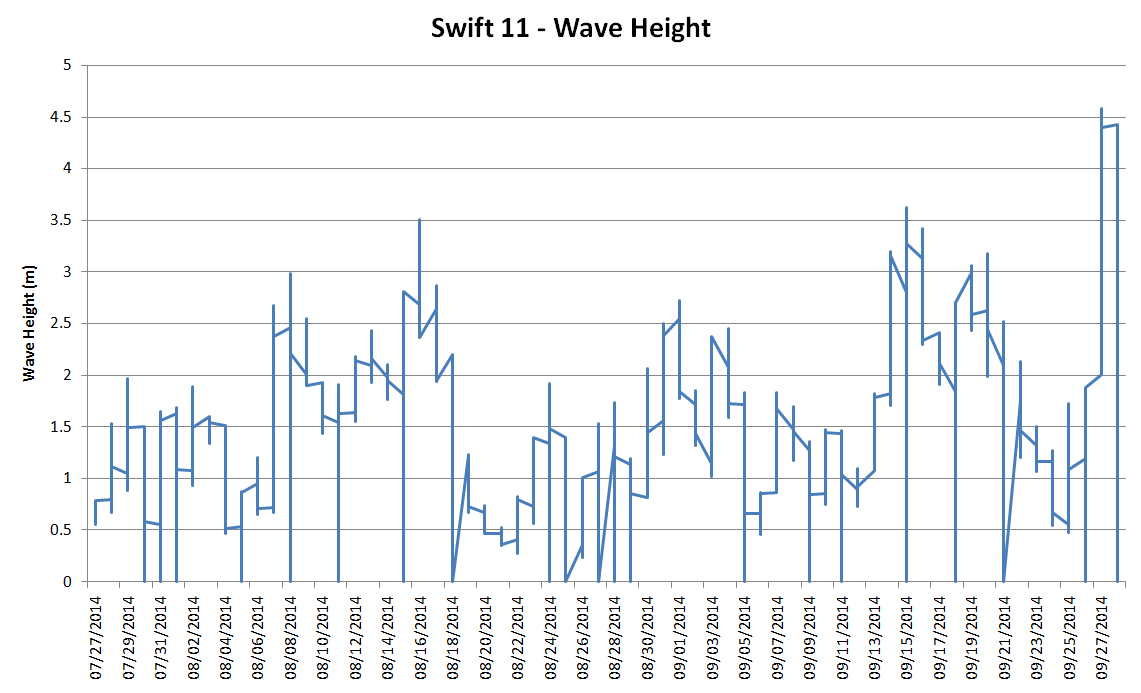
However at least one of the “robots” he refers to did discover some significant wave activity. Here’s a visualisation of SWIFT 11‘s record of significant wave height as it floated across the Beaufort Sea in the summer of 2014:
I don’t know about you, but I don’t think I would describe 4.5 meter waves as “surprisingly calm”, especially in the Arctic!
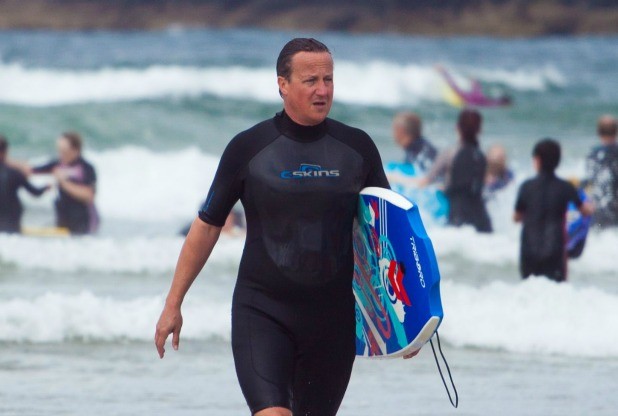
Shock News! It has recently been brought to our attention by the online version of the Western Morning News (WMN for short), our local daily newspaper, that the once Great Britain’s current Prime Minister (GBPM for short) has been secretly training for next week’s Arctic Basin big wave surfing contest just down the road from here in North Cornwall! According to the WMN:
David Cameron let criticism of his Cornish holiday wash over him today as he hit the waves. Today he spent the afternoon riding the waves on the beach at Polzeath, surrounded by ordinary holidaymakers. Mr Cameron took to the water in a three quarter-length wet suit and brightly-coloured bodyboard. He was accompanied by a detective who kept a discreet watch on him from the shallows.
Despite the discreet detective an intrepid paparazzo braved the pounding Polzeath surf and managed to grab this shot of Mr. Cameron in action:
The next obvious question, to us here in the Great White Con Ivory Towers at least, is whether Dave would prefer to wear neoprene or fur for the competition next week. Which do you think suits him best?
In the meantime the surf on Barrow beach is building:
and even as we speak a pulse of swell has blasted past Point Barrow and is currently heading straight for the Beaufort Sea Marginal Ice Zone.
This website uses cookies to improve your experience. We'll assume you're ok with this, but you can opt-out if you wish. Cookie settingsACCEPT
Privacy & Cookies Policy
Privacy Overview
This website uses cookies to improve your experience while you navigate through the website. Out of these, the cookies that are categorized as necessary are stored on your browser as they are essential for the working of basic functionalities of the website. We also use third-party cookies that help us analyze and understand how you use this website. These cookies will be stored in your browser only with your consent. You also have the option to opt-out of these cookies. But opting out of some of these cookies may affect your browsing experience.
Necessary cookies are absolutely essential for the website to function properly. This category only includes cookies that ensures basic functionalities and security features of the website. These cookies do not store any personal information.
Any cookies that may not be particularly necessary for the website to function and is used specifically to collect user personal data via analytics, ads, other embedded contents are termed as non-necessary cookies. It is mandatory to procure user consent prior to running these cookies on your website.