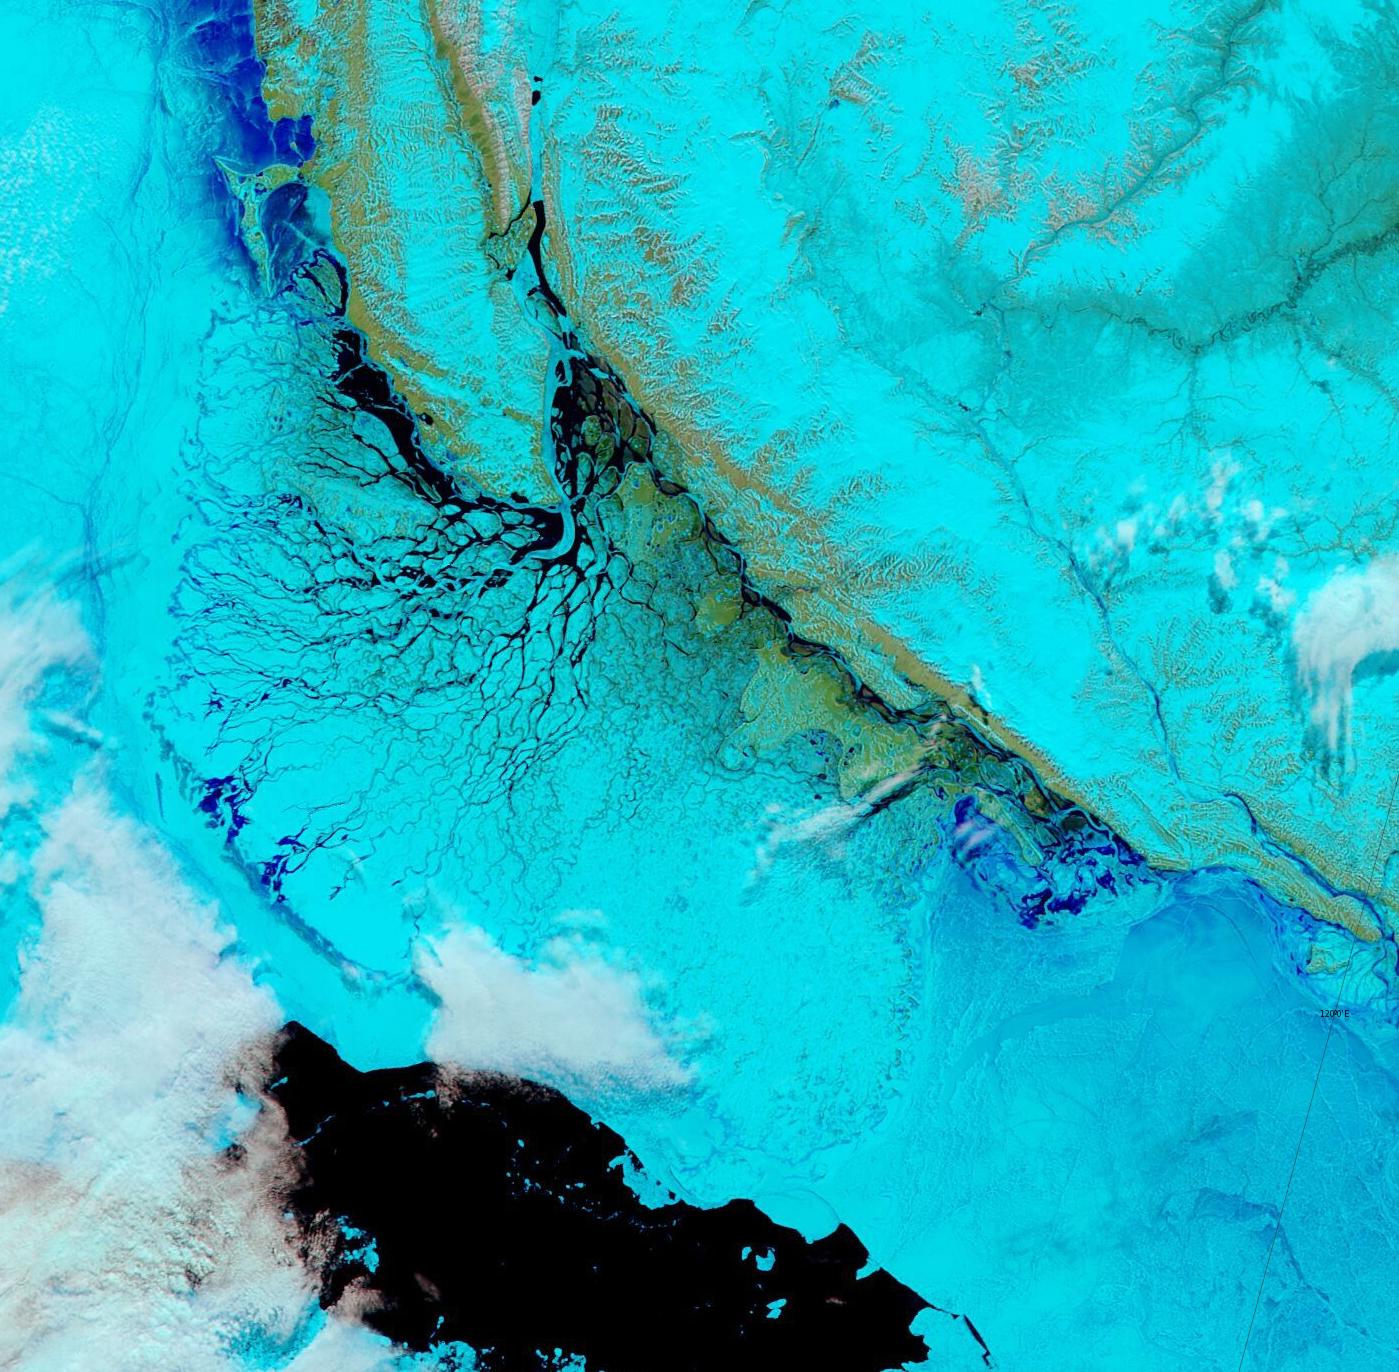
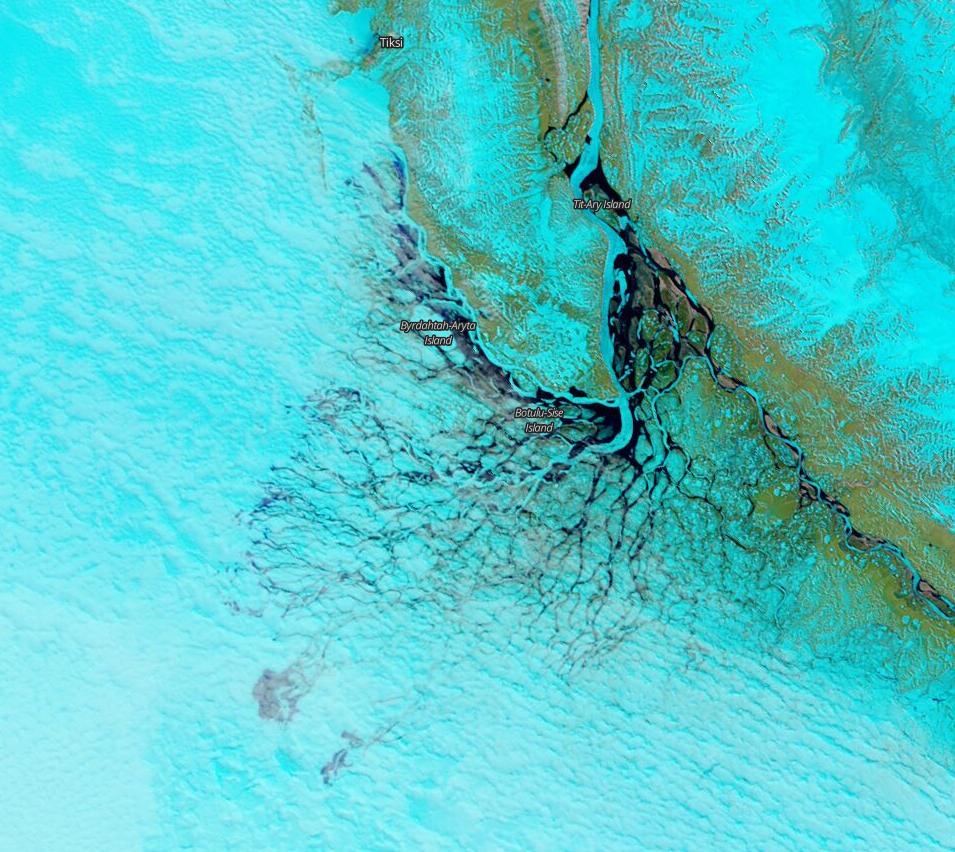
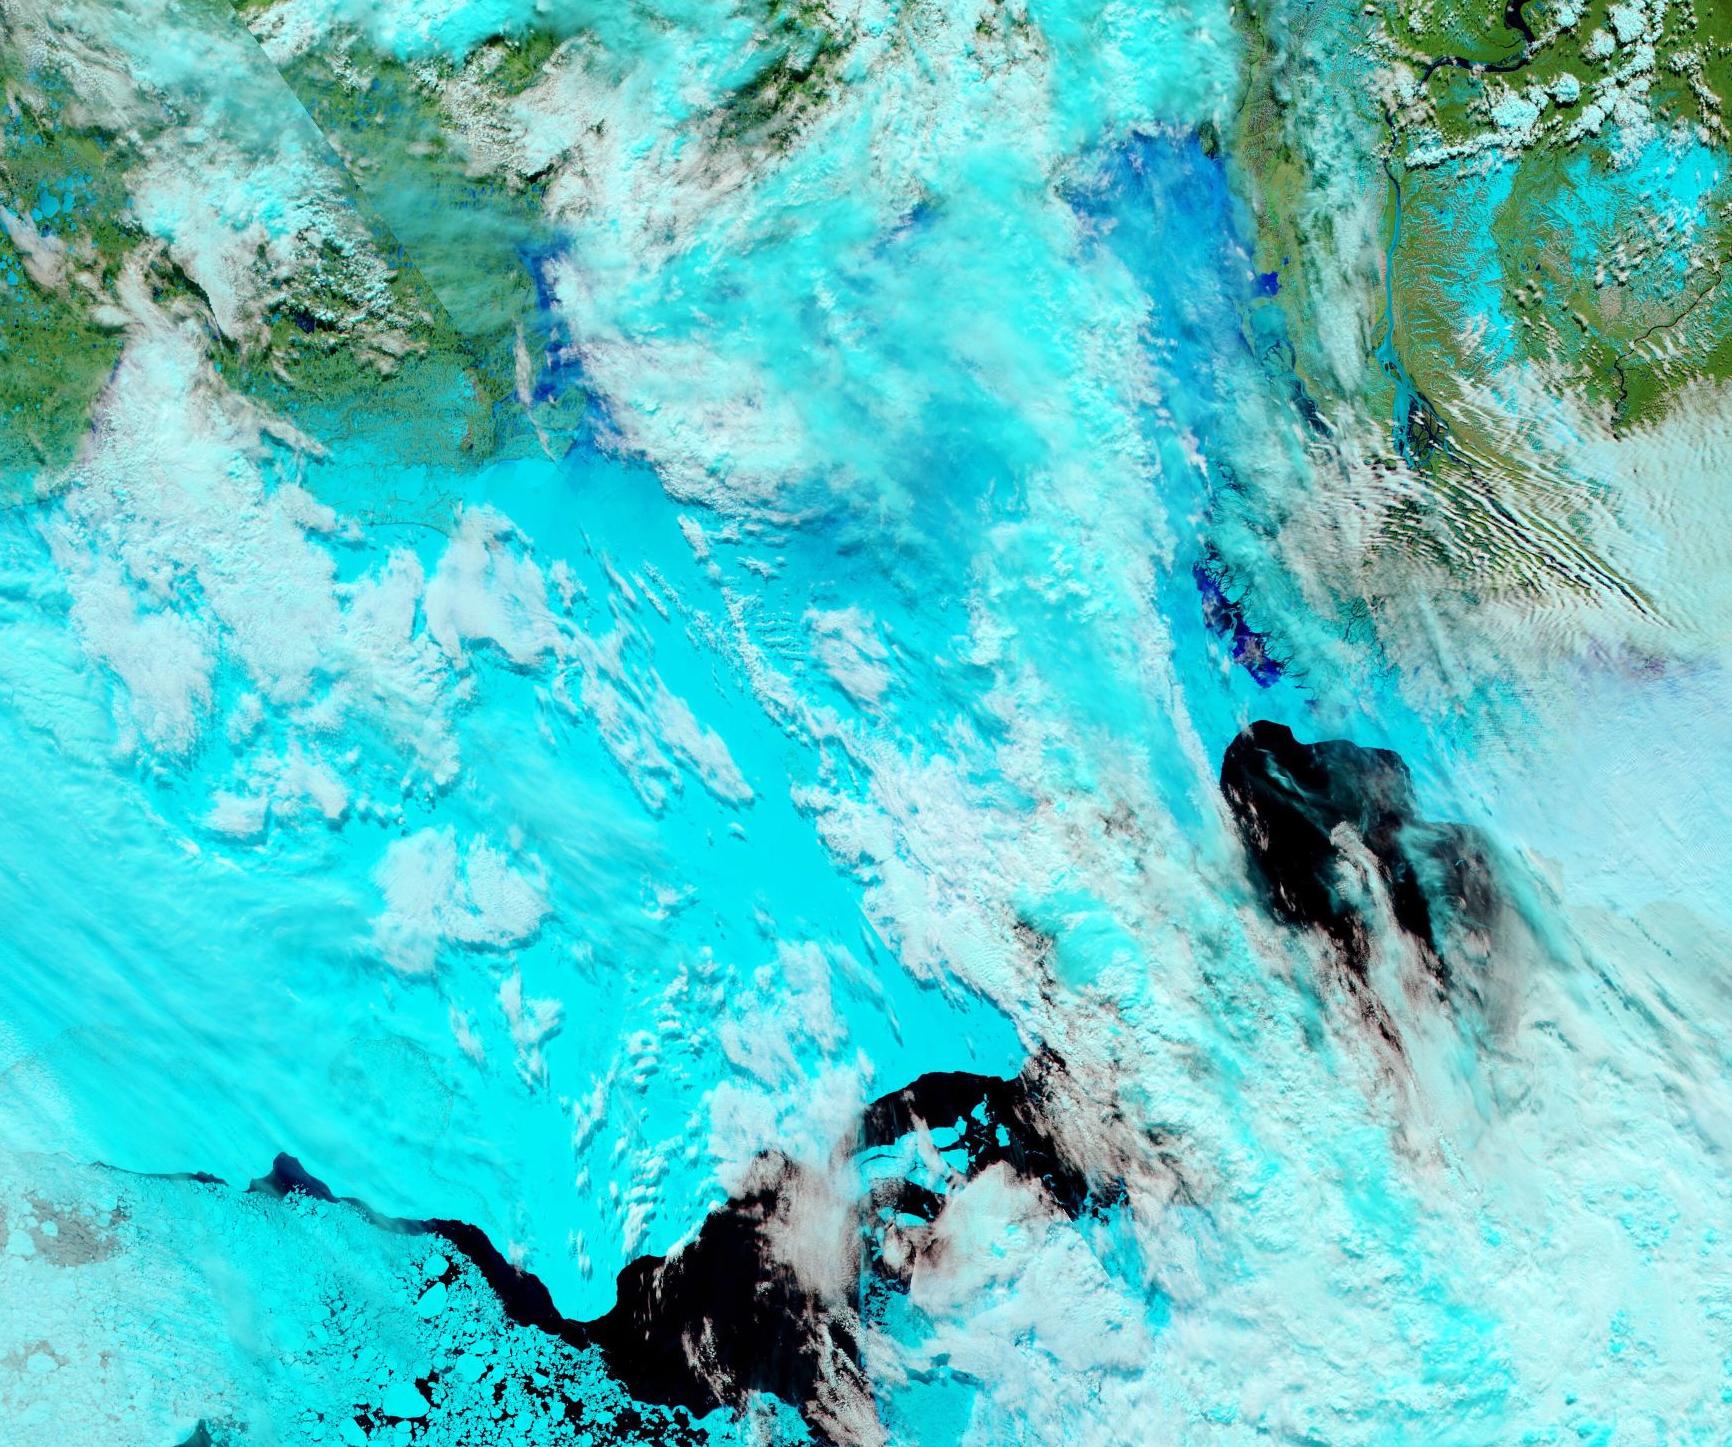
By way of a change, which is allegedly as good as a rest, let’s start the new month with a very pretty and almost cloud free “pseudo-colour” image of the Lena Delta and adjacent areas of the Laptev Sea:
“False colour” image of the Lena Delta on June 1st from the MODIS instrument on the Aqua satellite
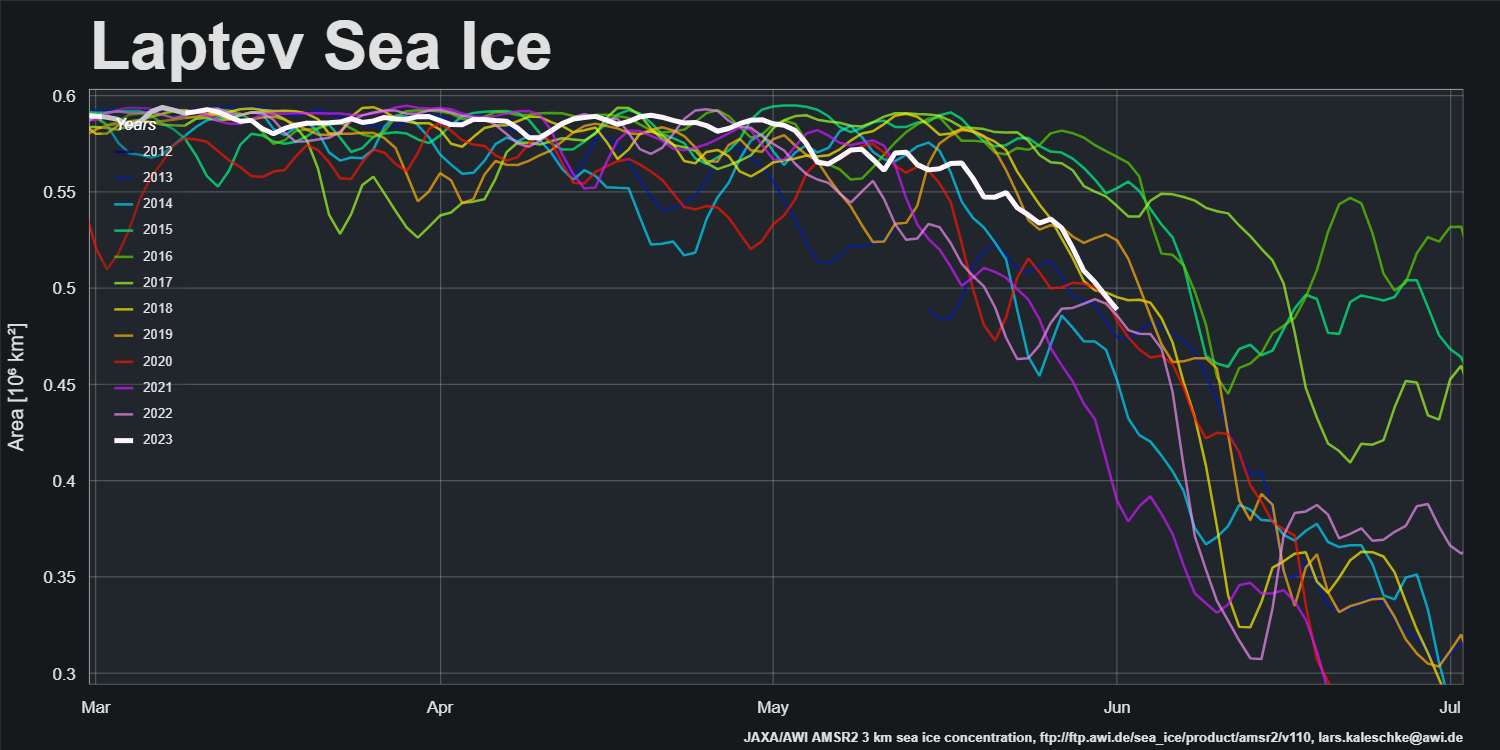
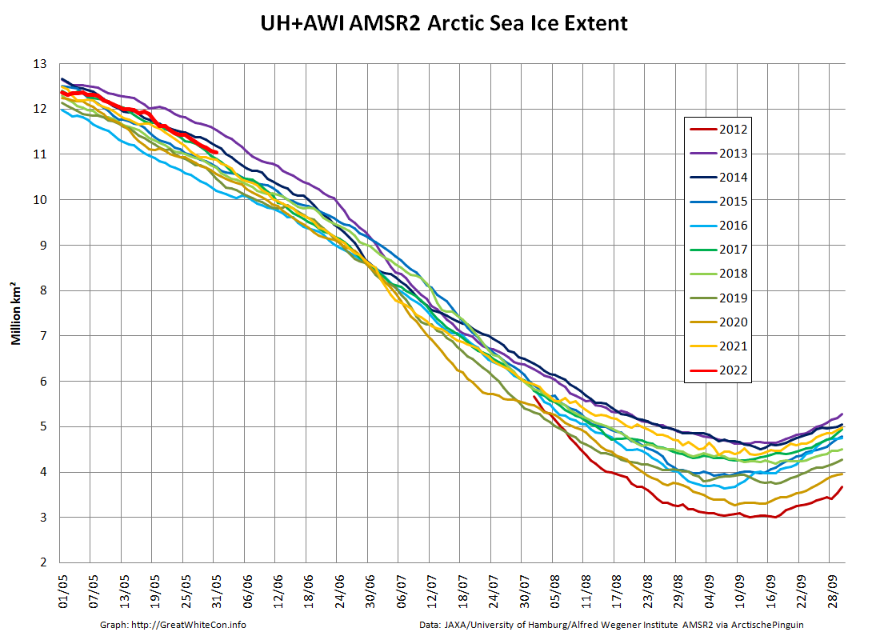
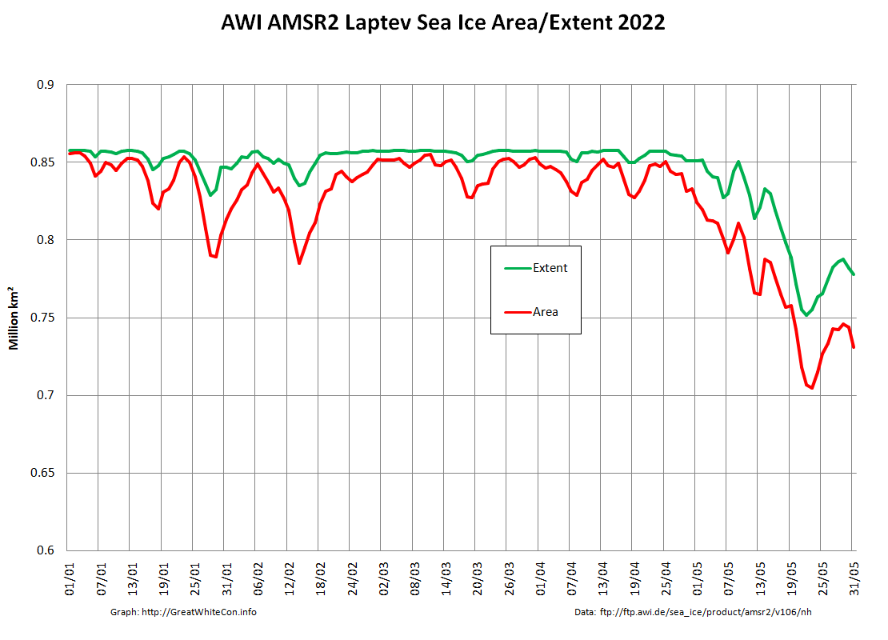
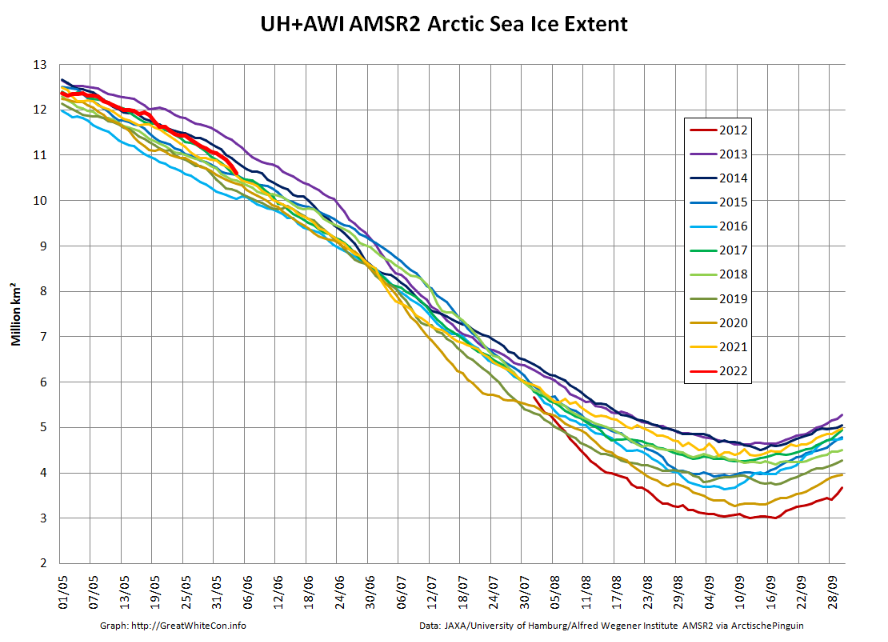
May 2022 proved to be fairly uneventful in the Arctic. High resolution AMSR2 Arctic sea ice extent has remained towards the top of the recent pack:
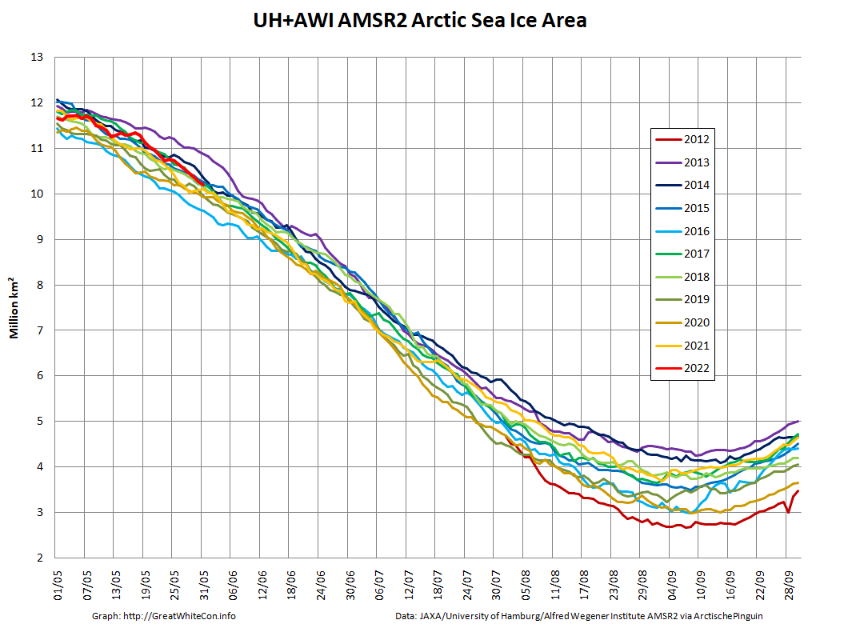
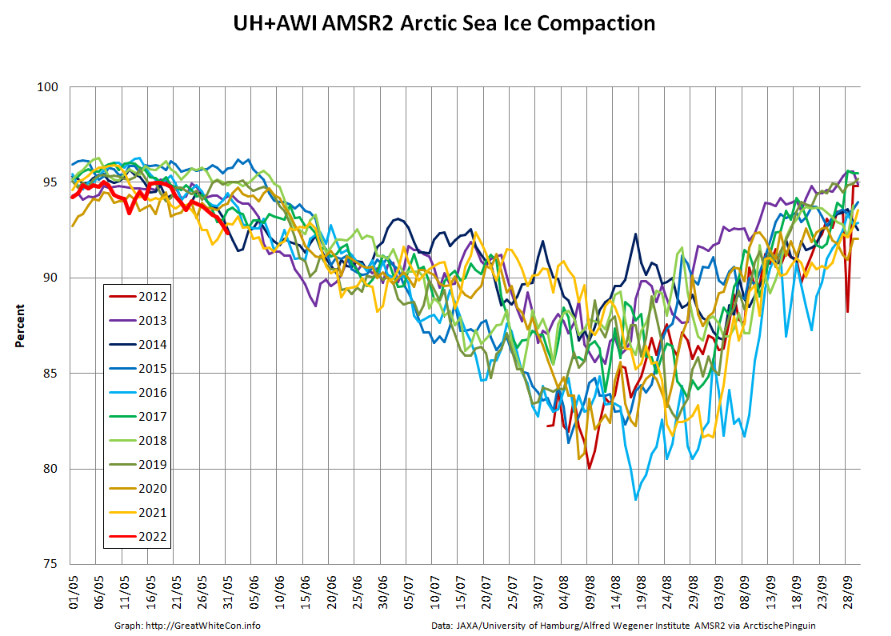
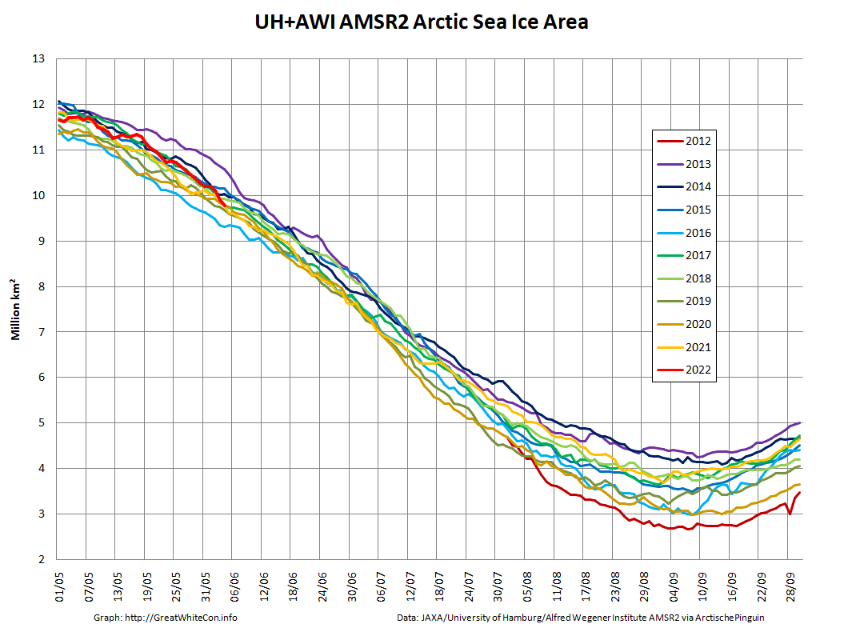
However Arctic sea ice area has been declining more quickly recently, and compaction is now lowest for the date in the AMSR2 record:
The clouds over the Lena Delta have thinned, to reveal melt water beginning to spread across the fast ice in the Laptev Sea:
“False colour” image of the Lena Delta on June 2nd from the MODIS instrument on the Terra satellite
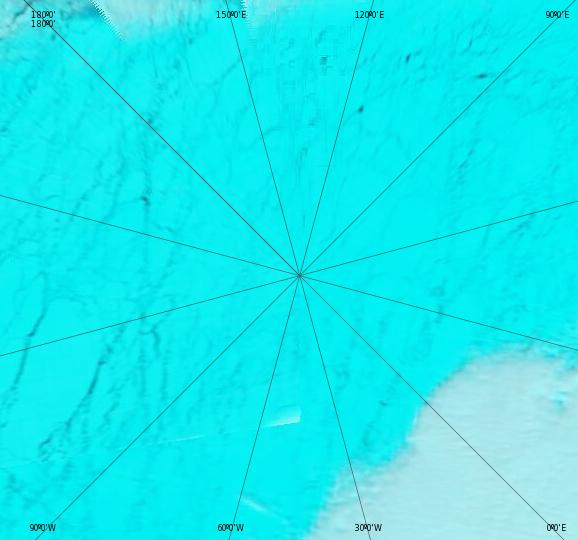
The clouds have also cleared over the North Pole, to reveal a network of leads:
“False colour” image of the North Pole on June 2nd from the MODIS instrument on the Terra satellite
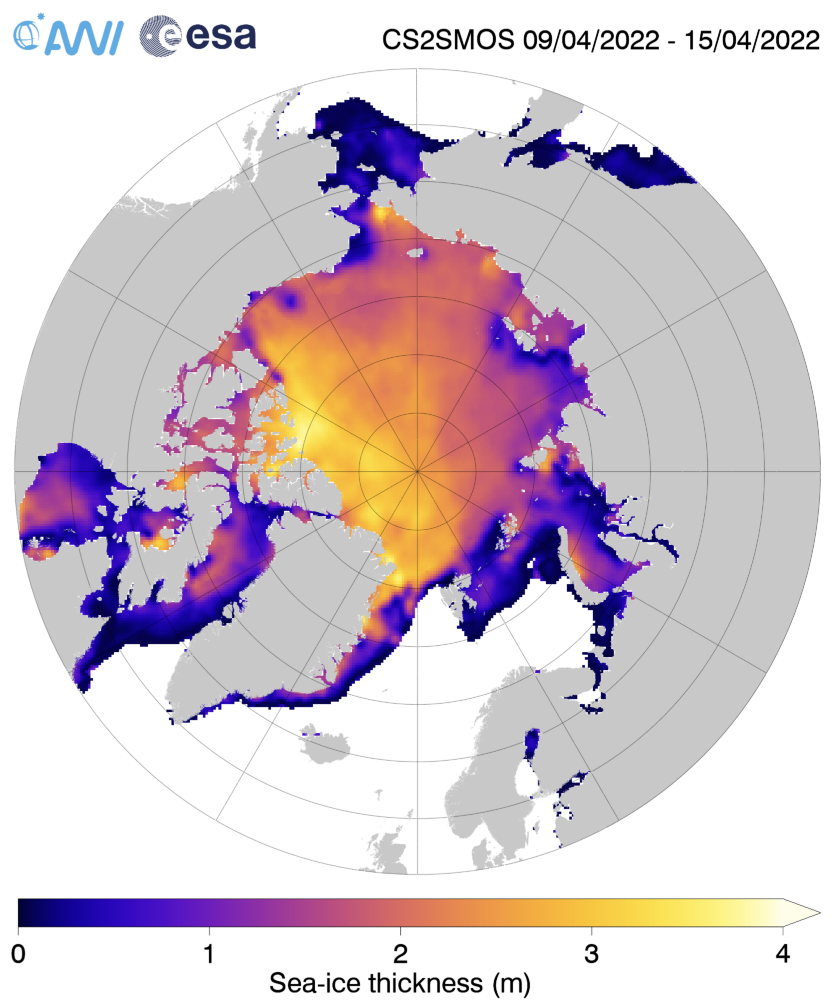
The Alfred Wegener Institute have recently released the reanalysed CryoSat-2/SMOS sea ice thickness data for mid April:
We now anxiously await the PIOMAS modelled thickness data for May. Meanwhile the AWI data suggest that the thickest ice in the Central Arctic Basin is currently to be found north of Axel Heiberg Island, with the thin ice in the Laptev Sea ripe for further extent reductions:
[Edit – June 5th]
Large areas of the fast ice in the Laptev Sea are now showing evidence of surface melt:
“False colour” image of the Laptev Sea on June 5th from the MODIS instrument on the Aqua satellite
The JAXA ViSHOP web site is still down, so here are the latest “high resolution” AMSR2 numbers for June 4th:
Extent: 10.60 million square kilometers, Area: 9.77 million square kilometers
[Edit – June 9th]
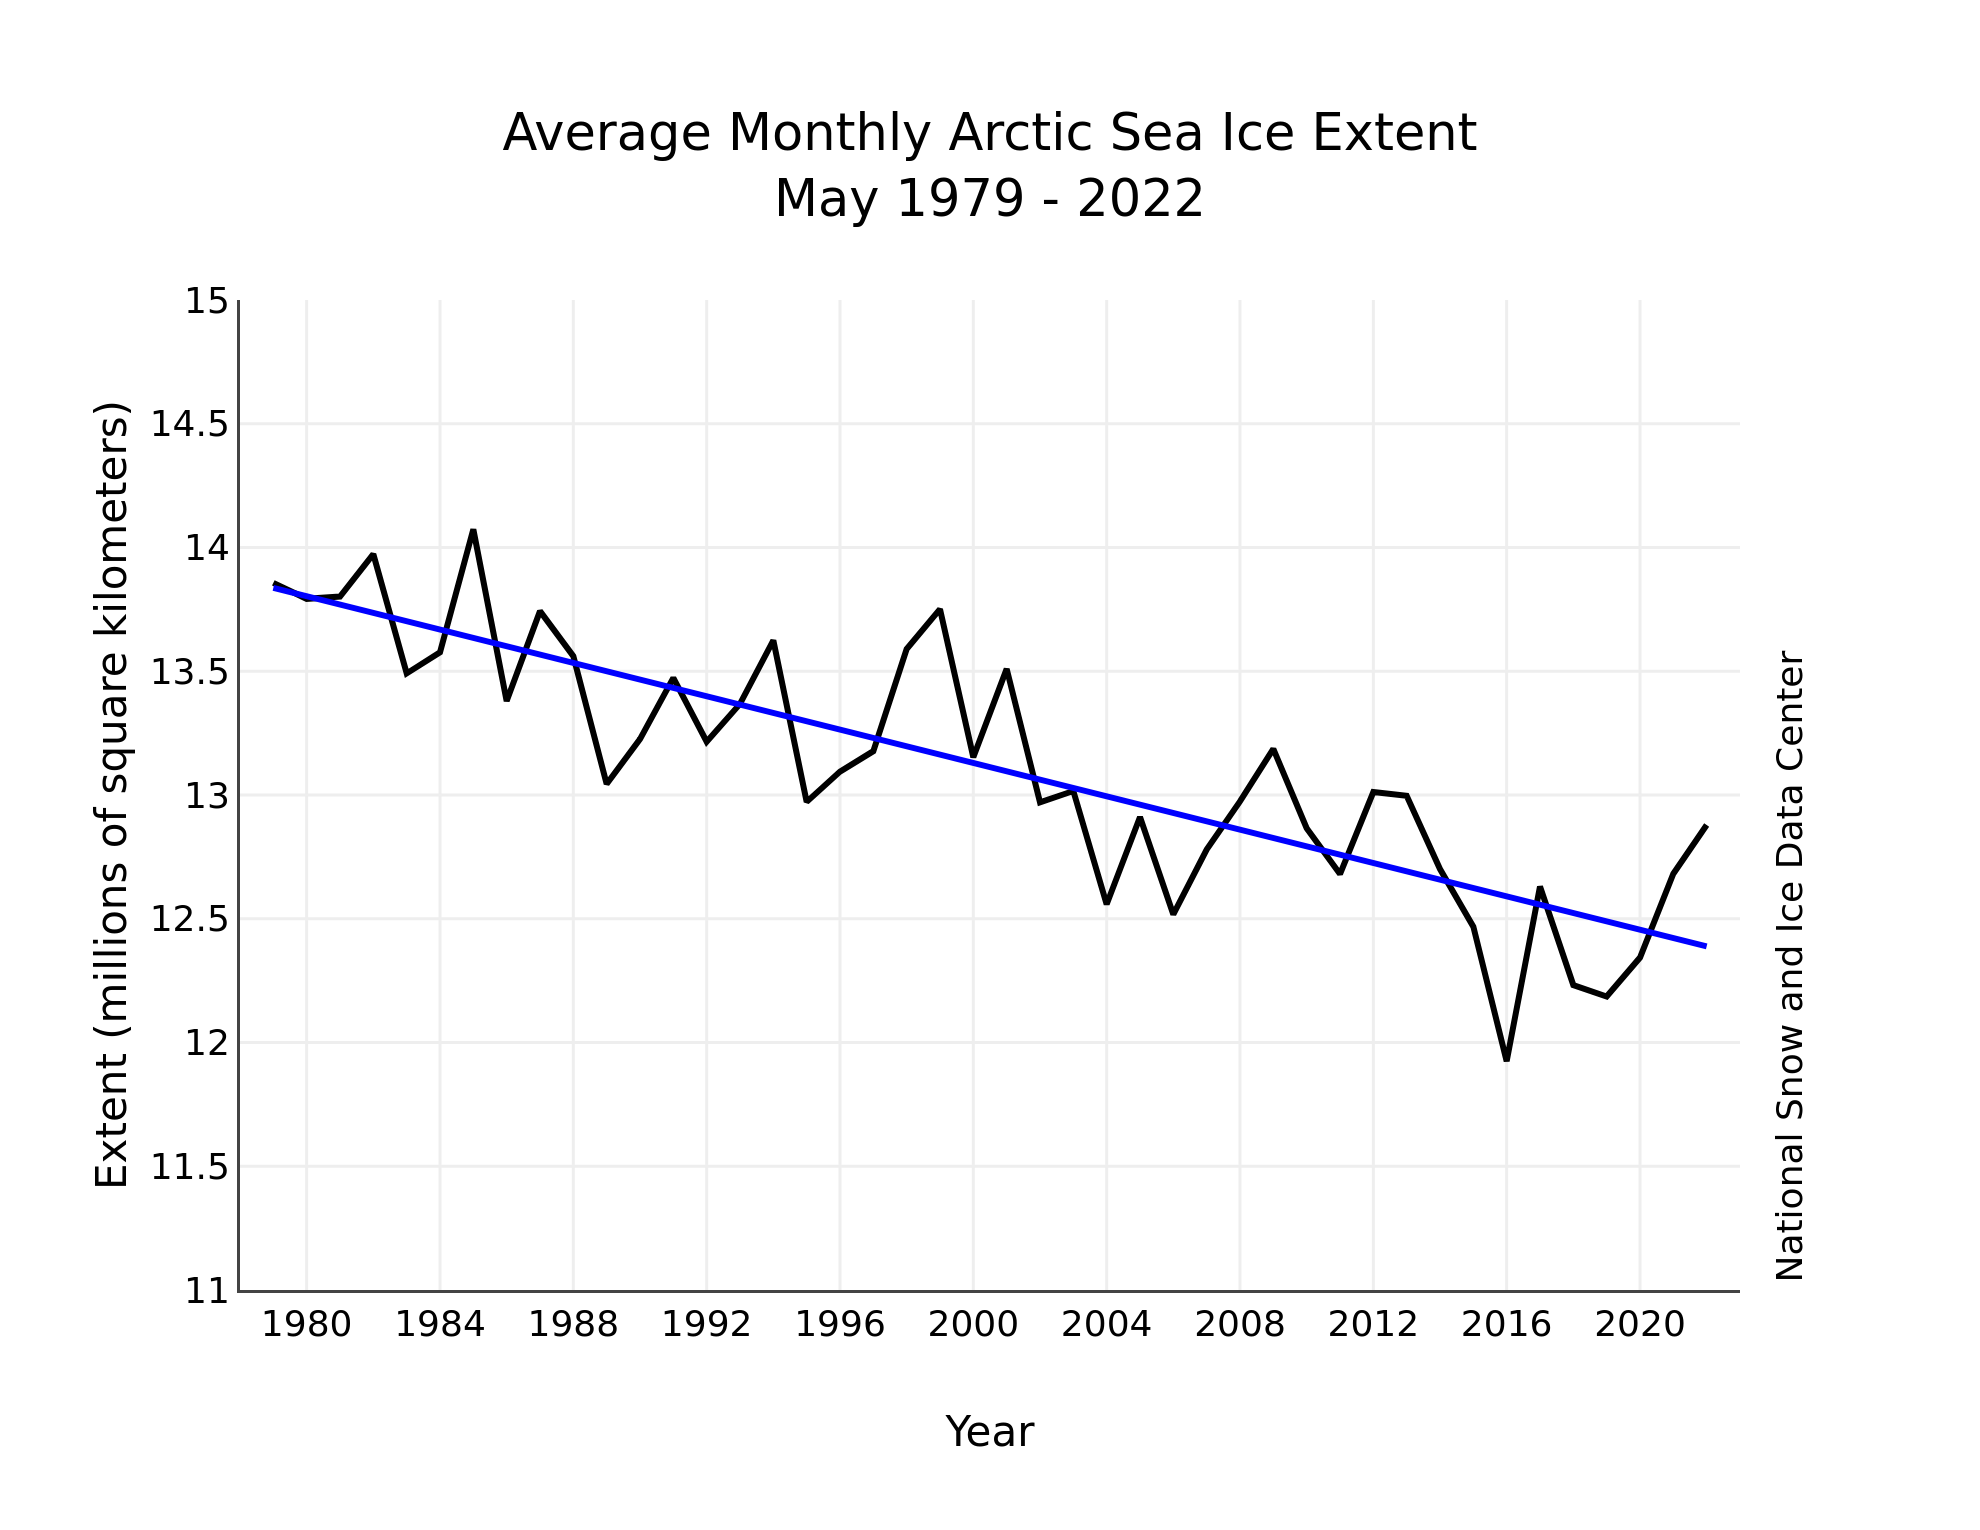
The June edition of the NSIDC’s Arctic Sea Ice News summarises May 2022 as follows:
Average Arctic sea ice extent for May 2022 was 12.88 million square kilometers (4.97 million square miles). This was 410,000 square kilometers (158,000 square miles) below the 1981 to 2010 average, yet it was the highest May extent since 2013.
As was the case for April, sea ice extent was slow to decline, losing only 1.28 million square kilometers (494,000 square miles) during the month.
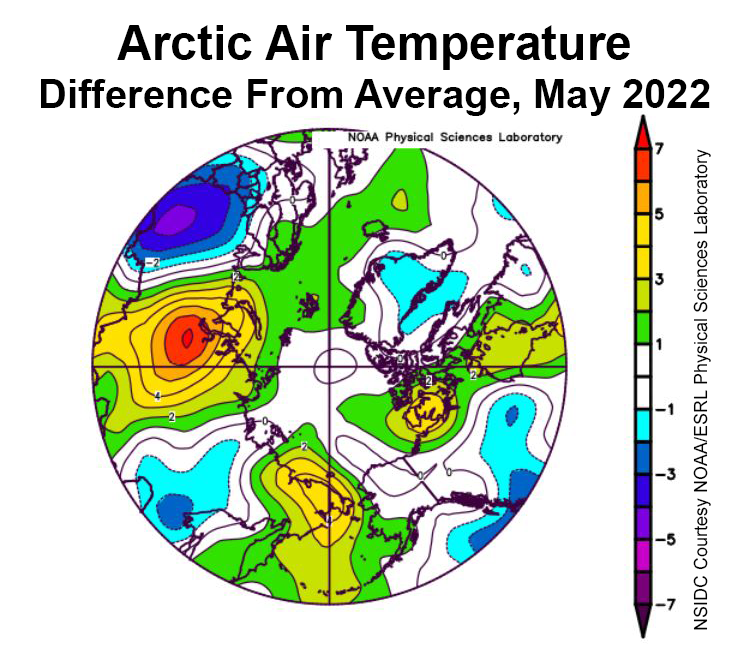
Within the Arctic Ocean, air temperatures at the 925 mb level (about 2,500 feet above the surface) were near average over most of the region in May, and 1 to 5 degrees Celsius (2 to 9 degrees Fahrenheit) above the 1981 to 2010 average along the coast of the Kara and East Siberian Seas, the East Greenland Sea, and the Canadian Archipelago:
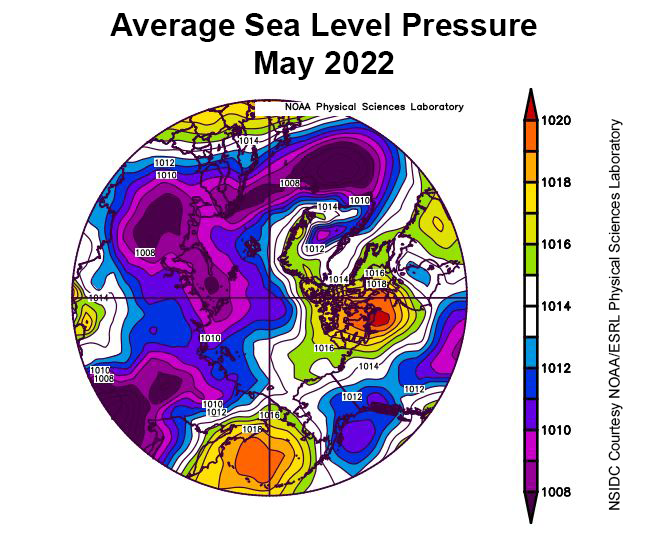
Areas where openings formed within the ice cover were dominated by off-shore ice motion, pushing ice poleward as well as toward Fram Strait. This offshore ice motion is largely driven by a pattern of low sea level pressure over Eurasia coupled with high pressure over the Pacific sector of the Arctic:
[Edit – June 12th]
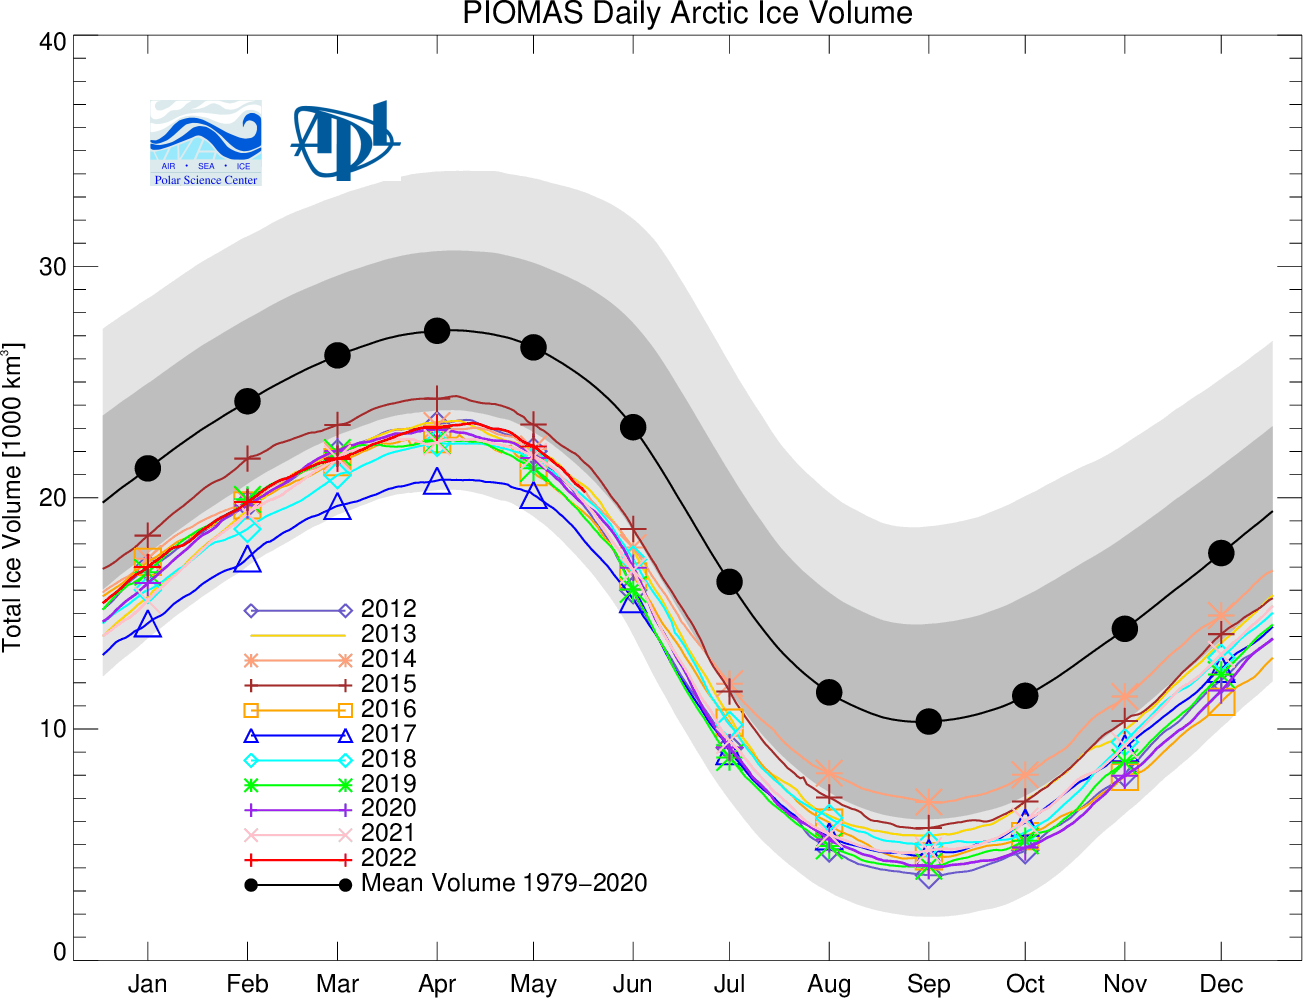
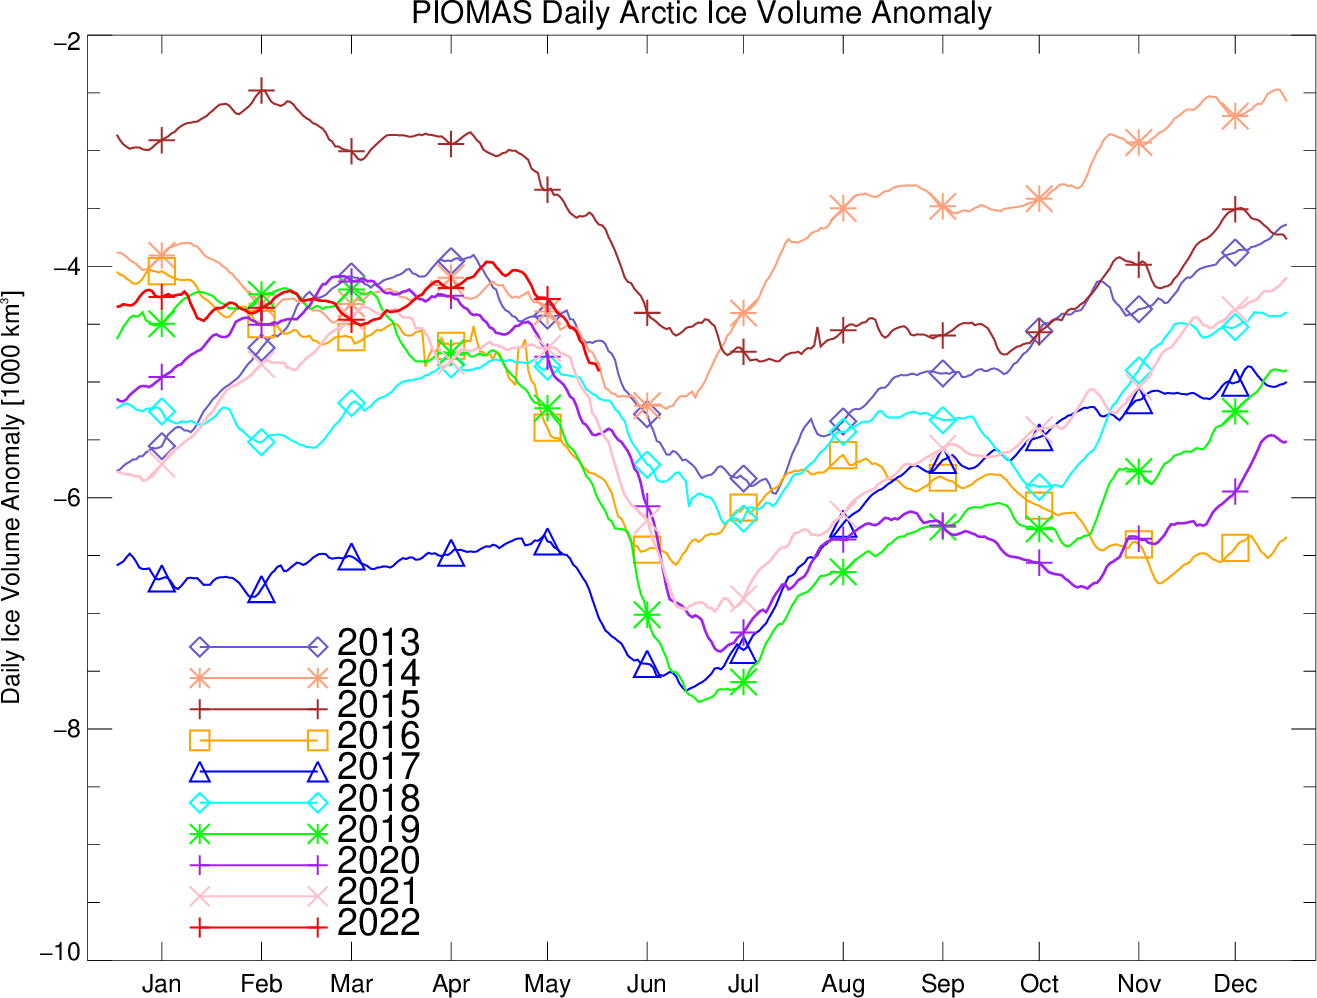
The Polar Science Center at the University of Washington has released the PIOMAS volume data for May 2022:
Average Arctic sea ice volume in May 2022 was 22,000 km3. This value is the 11th lowest on record for May, about 2,100 km3 above the record set in 2017. Monthly ice volume was 39% below the maximum in 1979 and 24% below the mean value for 1979-2021. Average May 2022 ice volume was 1.5 standard deviations above the 1979-2021 trend line.
Ice growth anomalies for May 2022 continued to be at the upper end of the most recent decade (Fig 4) with a mean ice thickness (above 15 cm thickness) at the middle of recent values.
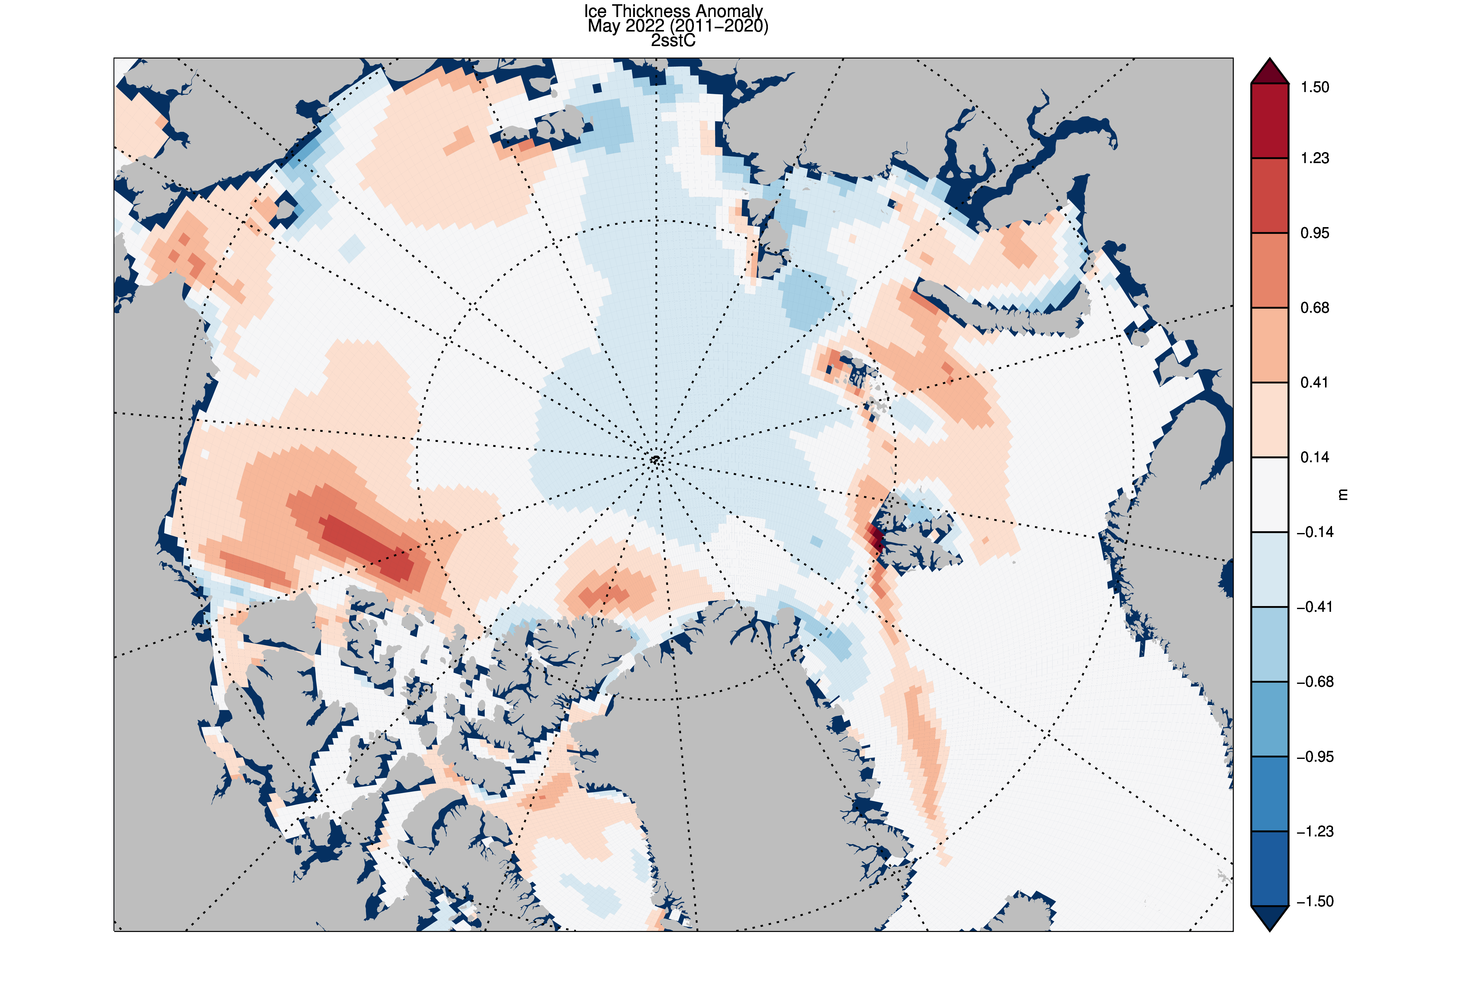
The ice thickness anomaly map for May 2022 relative to 2011-2020 continues the previous months pattern that divides the Arctic in two halves with positive anomalies in the “Western Arctic” , a strong positive anomaly in the Eastern Beaufort but negative anomalies in “Eastern Arctic”.
The development of a positive ice thickness anomaly in the Eastern Beaufort appears to be related to anomalous sea ice drift during February that transported ice along the Canadian Coast into the Beaufort. Positive anomalies in the Greenland and Barents Seas seem to be associated with higher than normal sea ice extent in those areas.
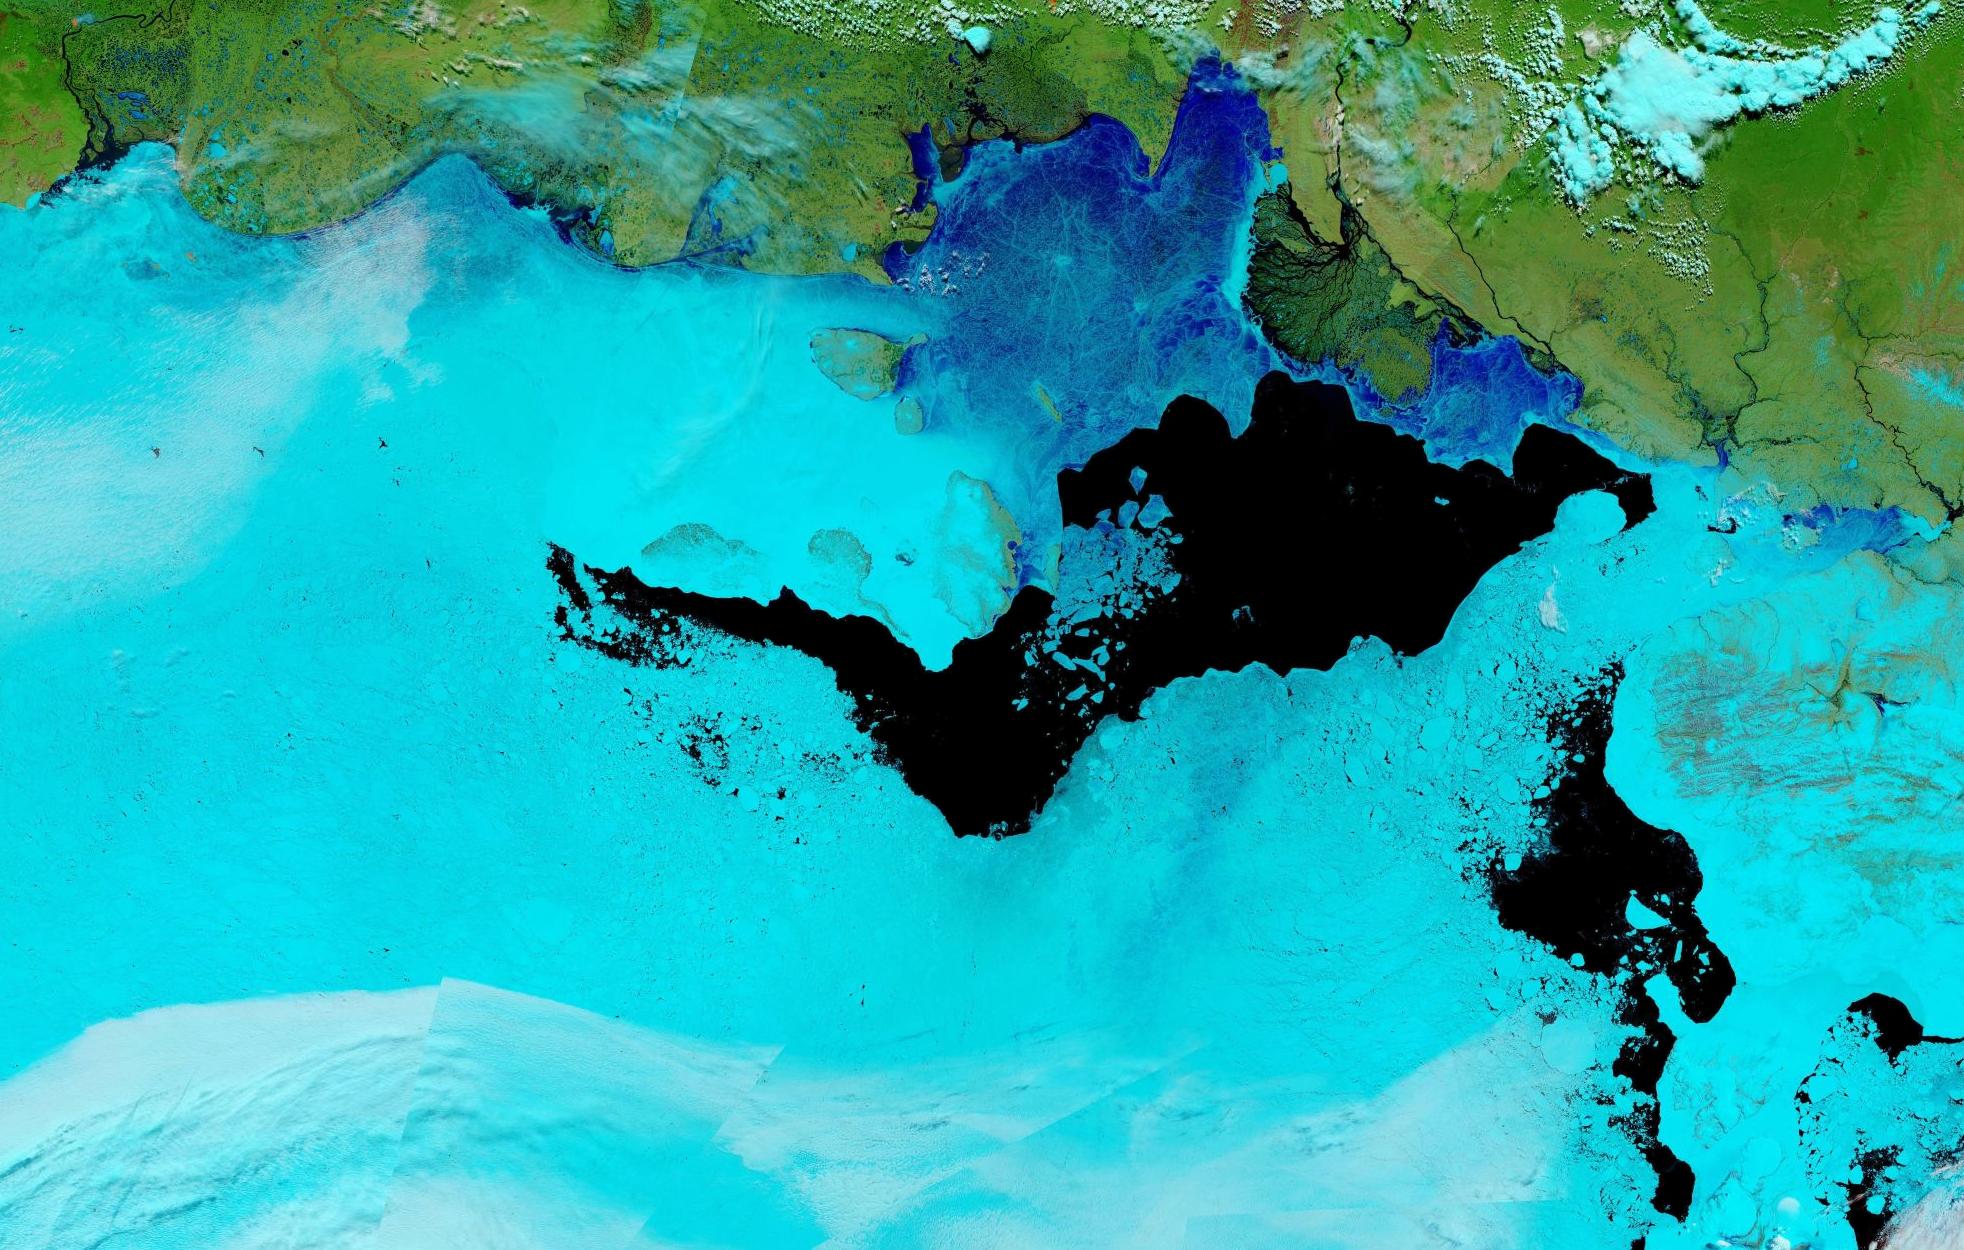
The Terra satellite has a nice clear view of the “Eastern Arctic” this morning, revealing widespread surface melt and continuing break up of the ice in the Laptev Sea:
“False colour” image of the Laptev and East Siberian Seas on June 12th from the MODIS instrument on the Terra satellite[Edit – June 16th]
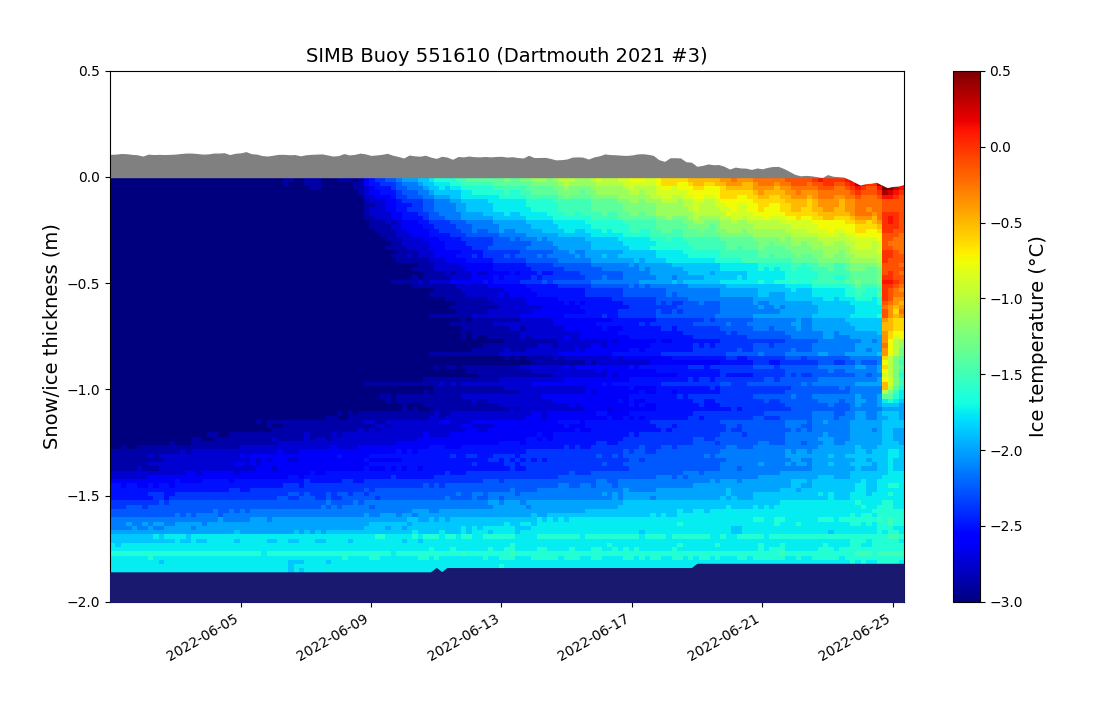
Bottom melt has begun on two ice mass balance buoys originally deployed in the Beaufort Sea last autumn.
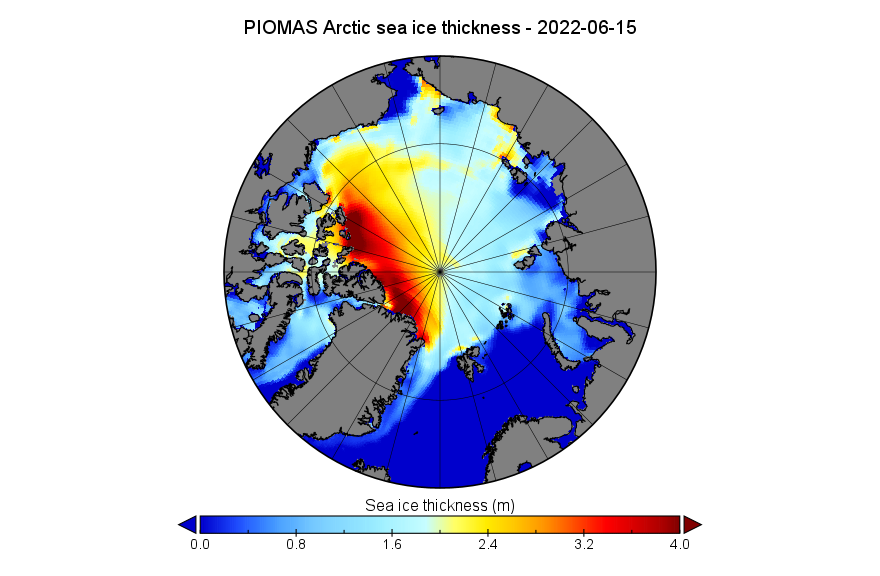
Here’s the mid June PIOMAS Arctic sea ice thickness map:
It shows hardly any ice thicker than 2 meters across the entire eastern half of the Arctic Ocean.
[Edit – June 25th]
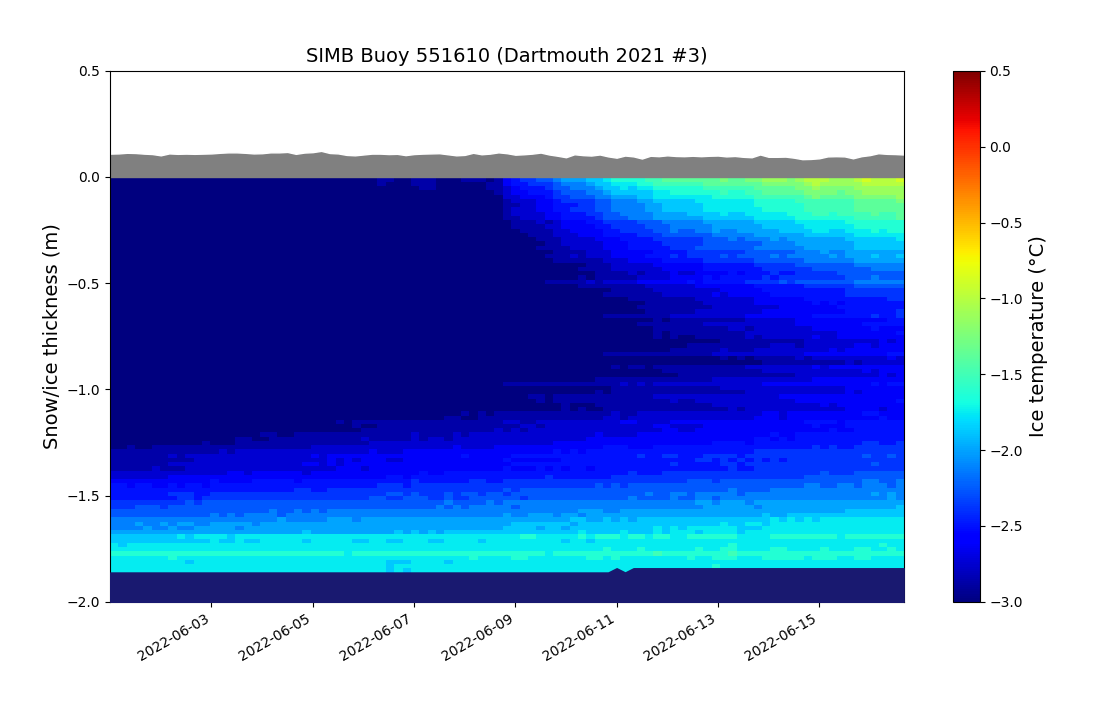
The snow cover has gone and ice surface melt has begun in the northern Beaufort Sea, where IMB buoy 551610 is currently located at 78.34 N, 130.76 W:
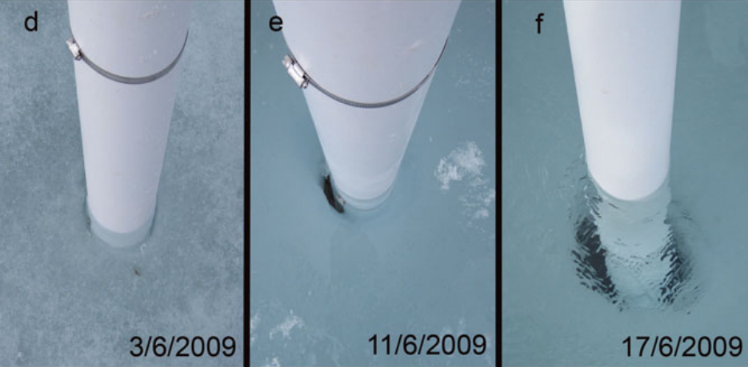
It also looks as though there has recently been preferential solar heating and hence melting around the body of the buoy, as shown in this illustration:
[Edit – June 26th]
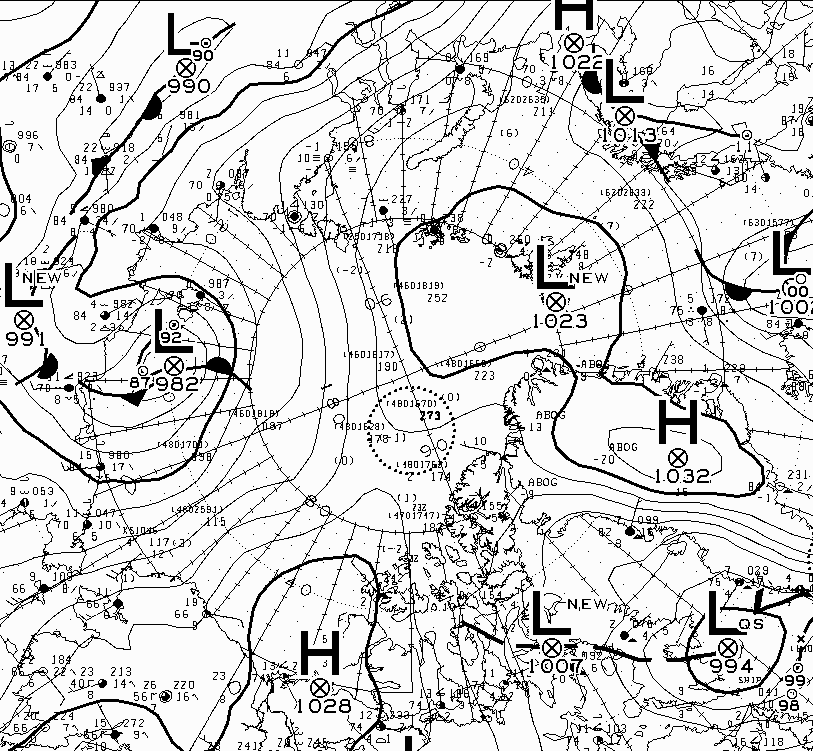
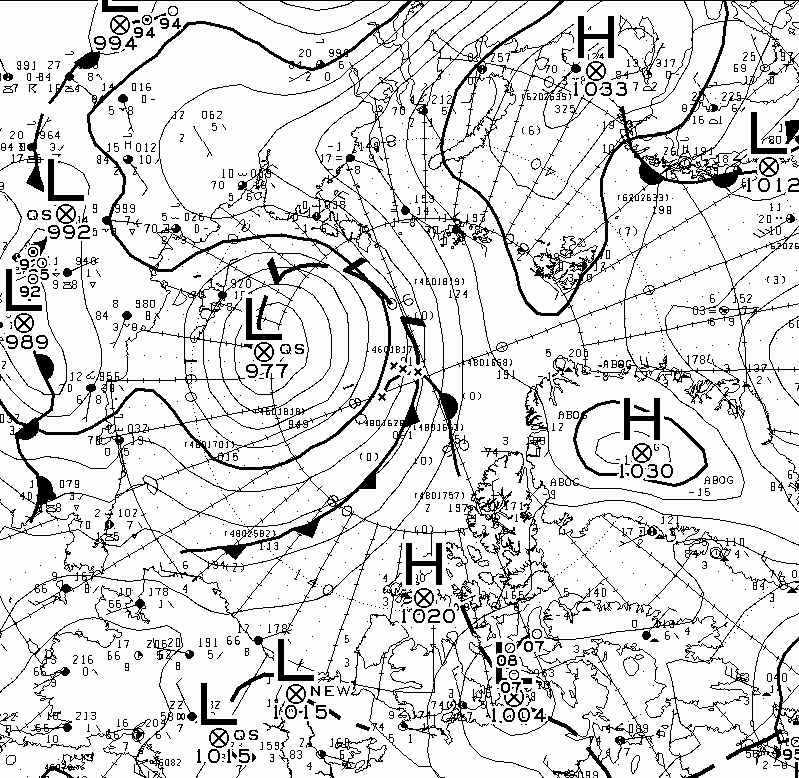
A low pressure area has formed over the East Siberian Sea. According to the Canadian Meteorological Centre‘s analysis the central mean surface level pressure had reached 982 hPa by midnight last night:
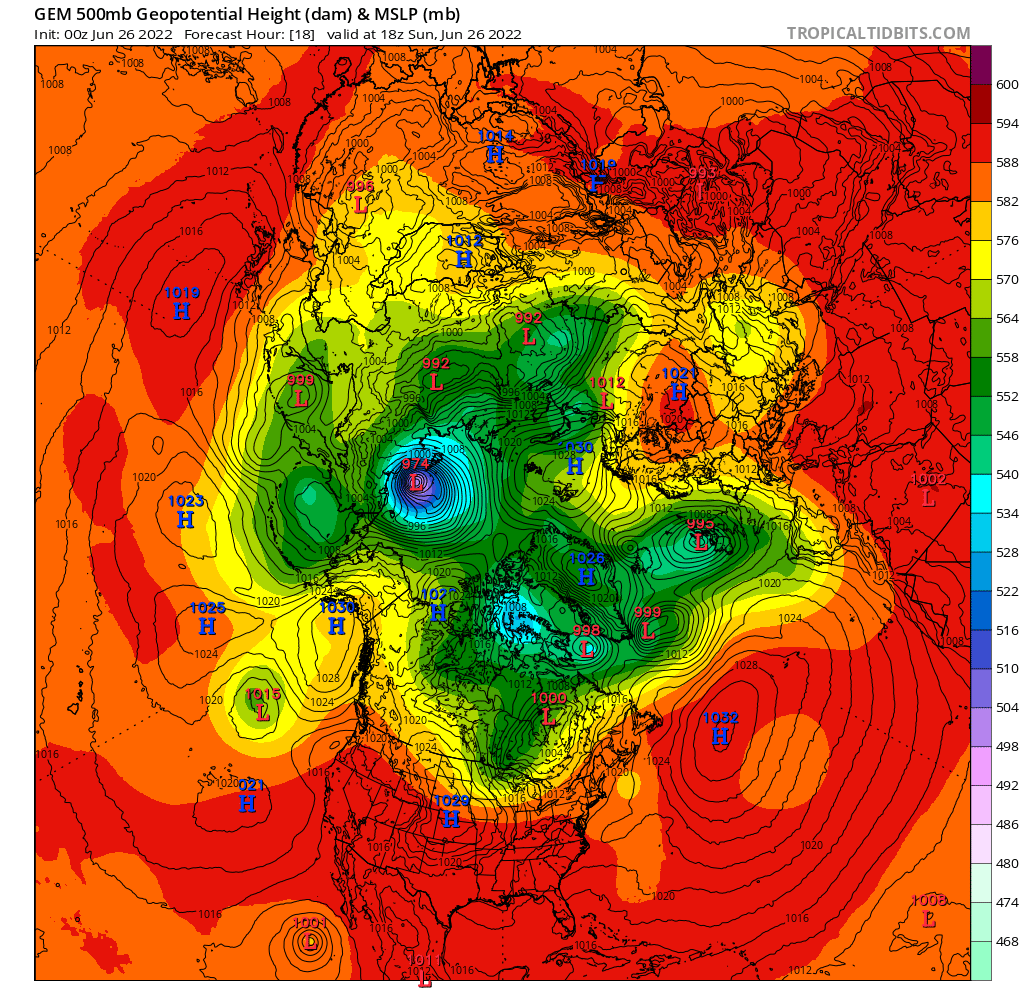
The CMC’s GEM forecast model suggests that it will bottom out at 974 hPa later this evening UTC and then persist for several days:
[Edit – June 28th]
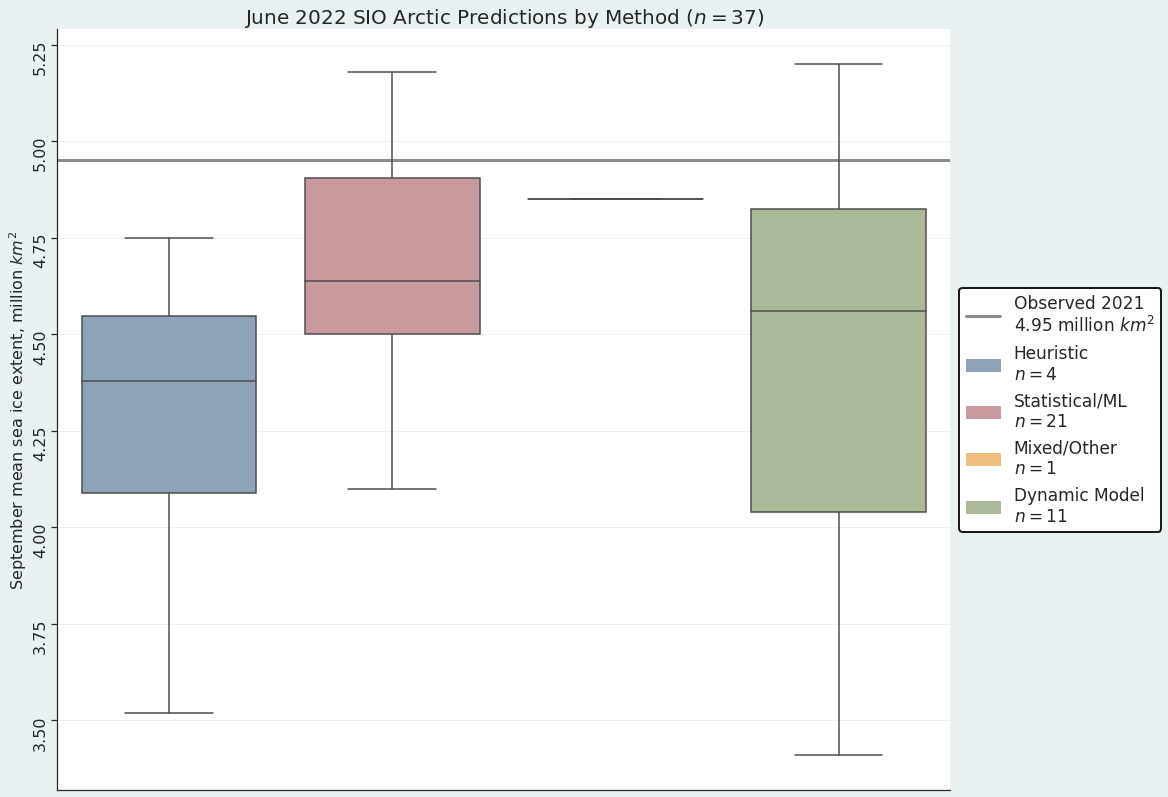
The June 2022 Sea Ice Outlook has now been published, a few days behind schedule. Neil provides a summary below, but here’s the traditional chart of predictions:
Here’s a bit more detail on the Pan-Arctic sea-ice forecast:
This year’s median forecasted value is 4.57 million square kilometers with quartiles of 4.34 and 4.90 million square kilometers. This is higher than the SIO forecasted value of September sea-ice extent for the past three years (2019–2021), but slightly below the median value of 4.60 million square cited in the 2018 SIO June report. The lowest forecast is 3.41 million square kilometers. Among the four methods that forecast September extent less than four million square kilometers, three are based on dynamical models. Two contributions forecast a record low extent (below 3.57 million square kilometers set in 2012). The highest forecast is 5.20 million square kilometers.
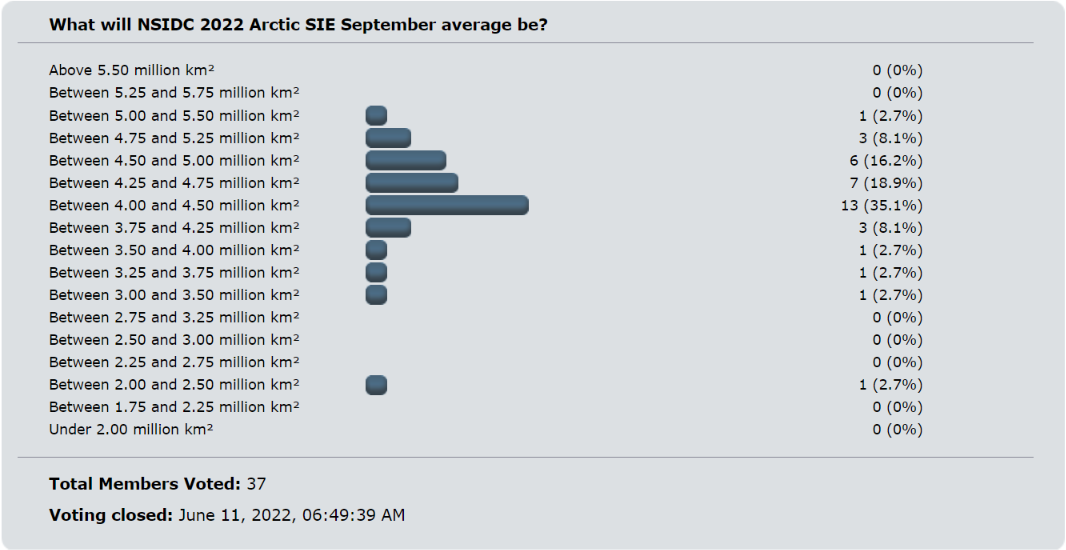
Purely coincidentally the Arctic Sea Ice Forum June poll for NSIDC average extent for September 2022 also had 37 entries. Here are the results:
Meanwhile in the actual Arctic at the end of June 2022 the low over the East Siberian Sea has found its second wind and is deepening once more:
Discussion continues on the new open thread for July 2022.
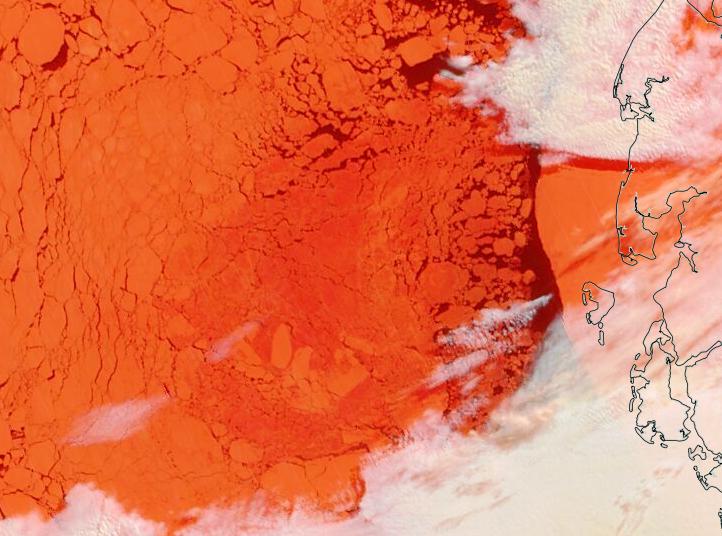
It’s May Day 2021, and just for a change we’re going to start the month off with a pretty picture!
Parts of the Laptev Sea are starting to look distinctly “warm” in the infra-red. Here’s a “false colour” image taken by the Terra satellite during a gap in the clouds:
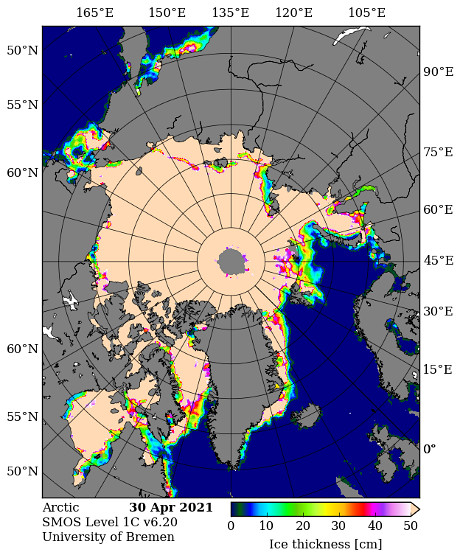
We have reached the time of year when the SMOS “thin ice thickness” readings start being affected by surface melt, but let’s take a look anyway:
That area of the Laptev certainly appears to be either thin or melting.
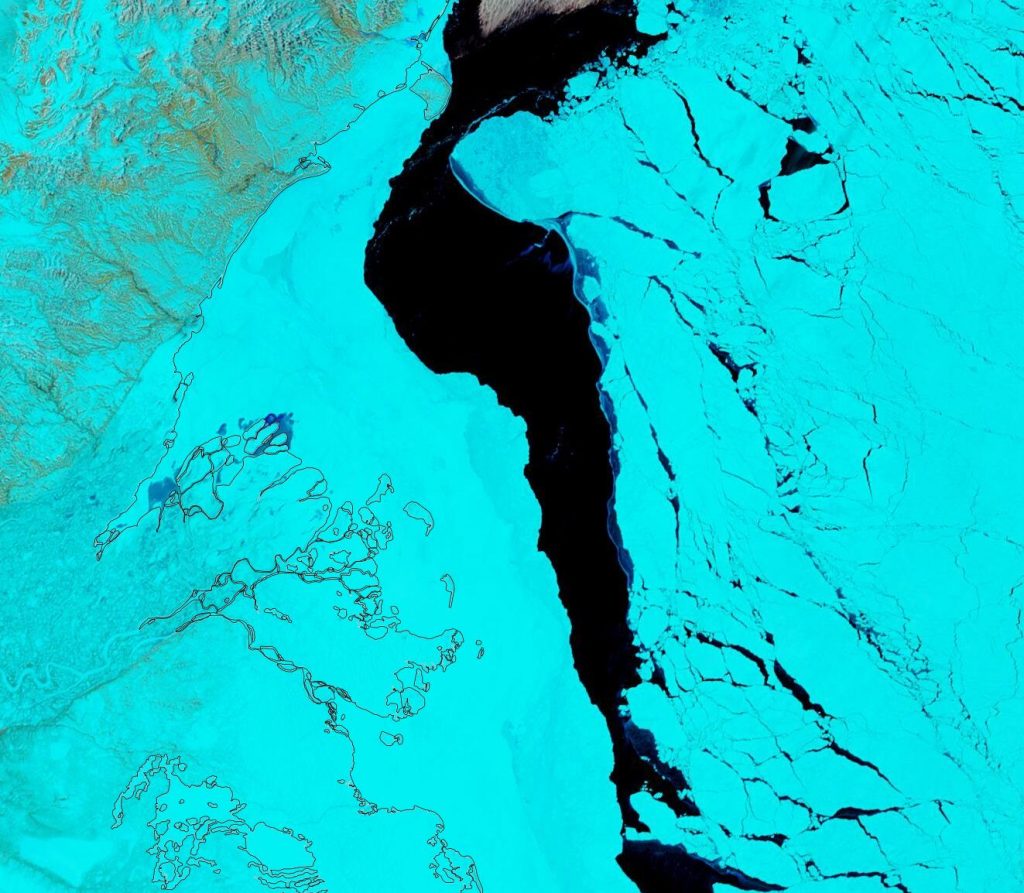
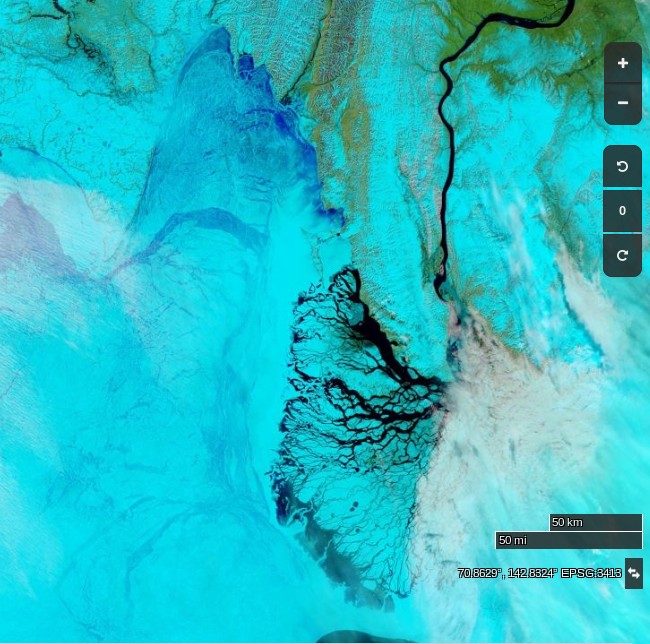
Meanwhile on the Canadian side of the Arctic the fast ice off the Mackenzie Delta is starting to get damp, even though the river itself still looks to be fairly well frozen:
It will also be interesting to follow the progress of this large floe as it heads towards oblivion through the Fram Strait:
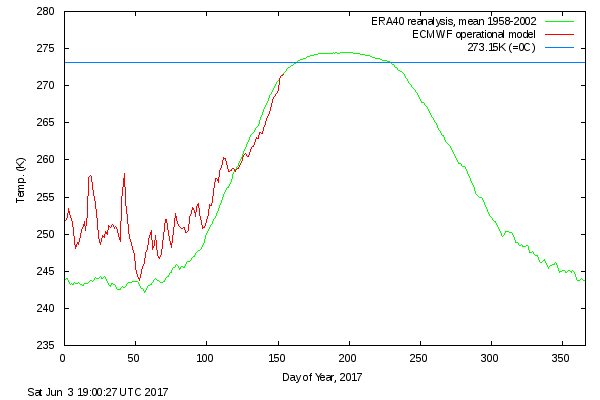
After a comparatively cool May, surface air temperatures in the high Arctic are back up to “normal”:
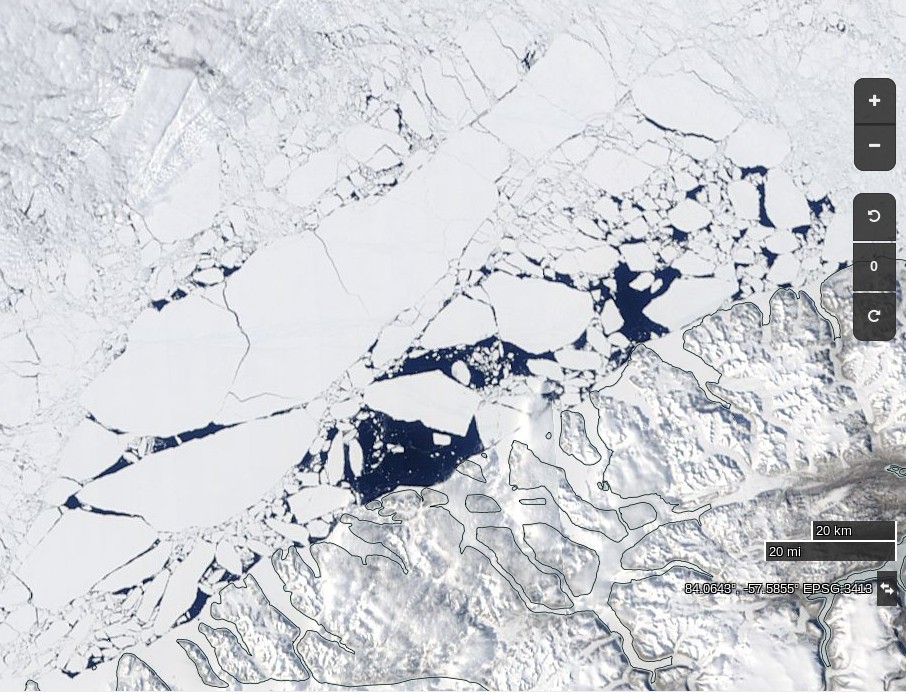
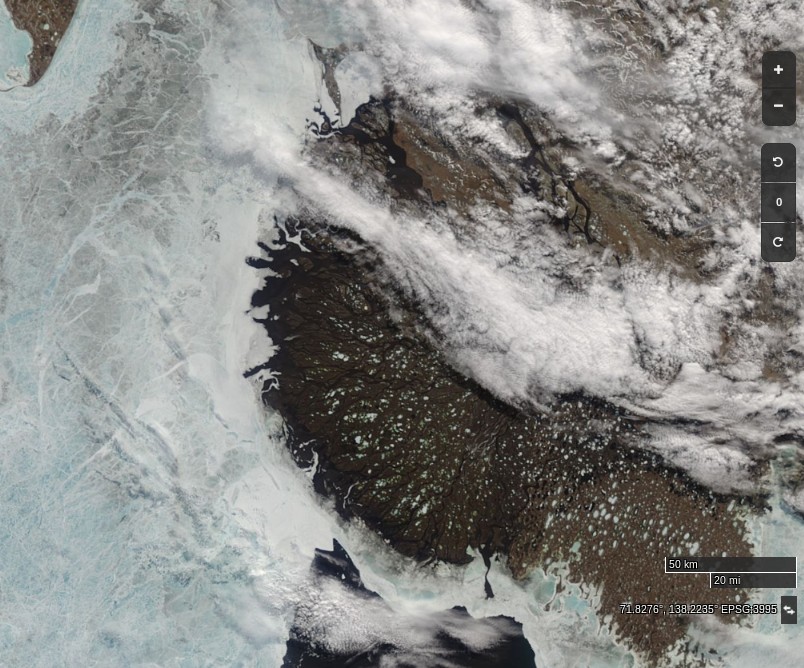
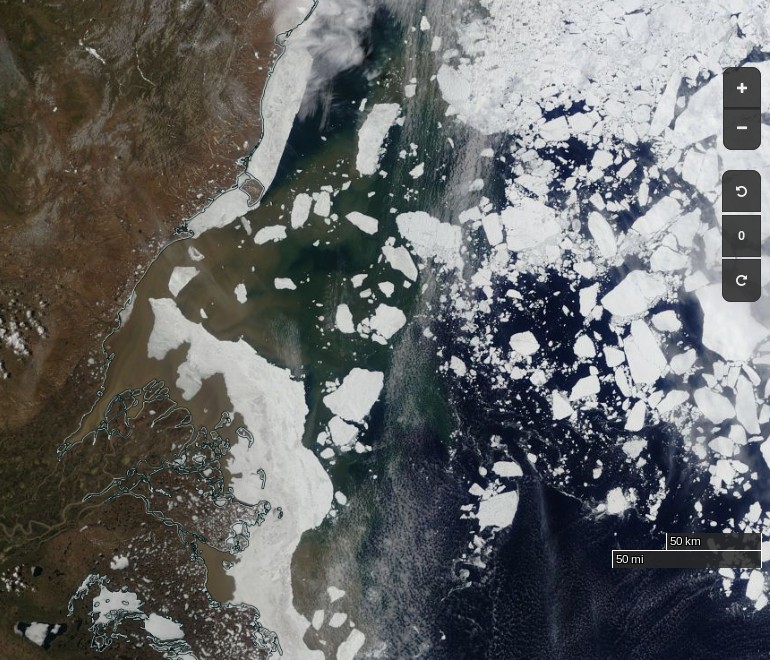
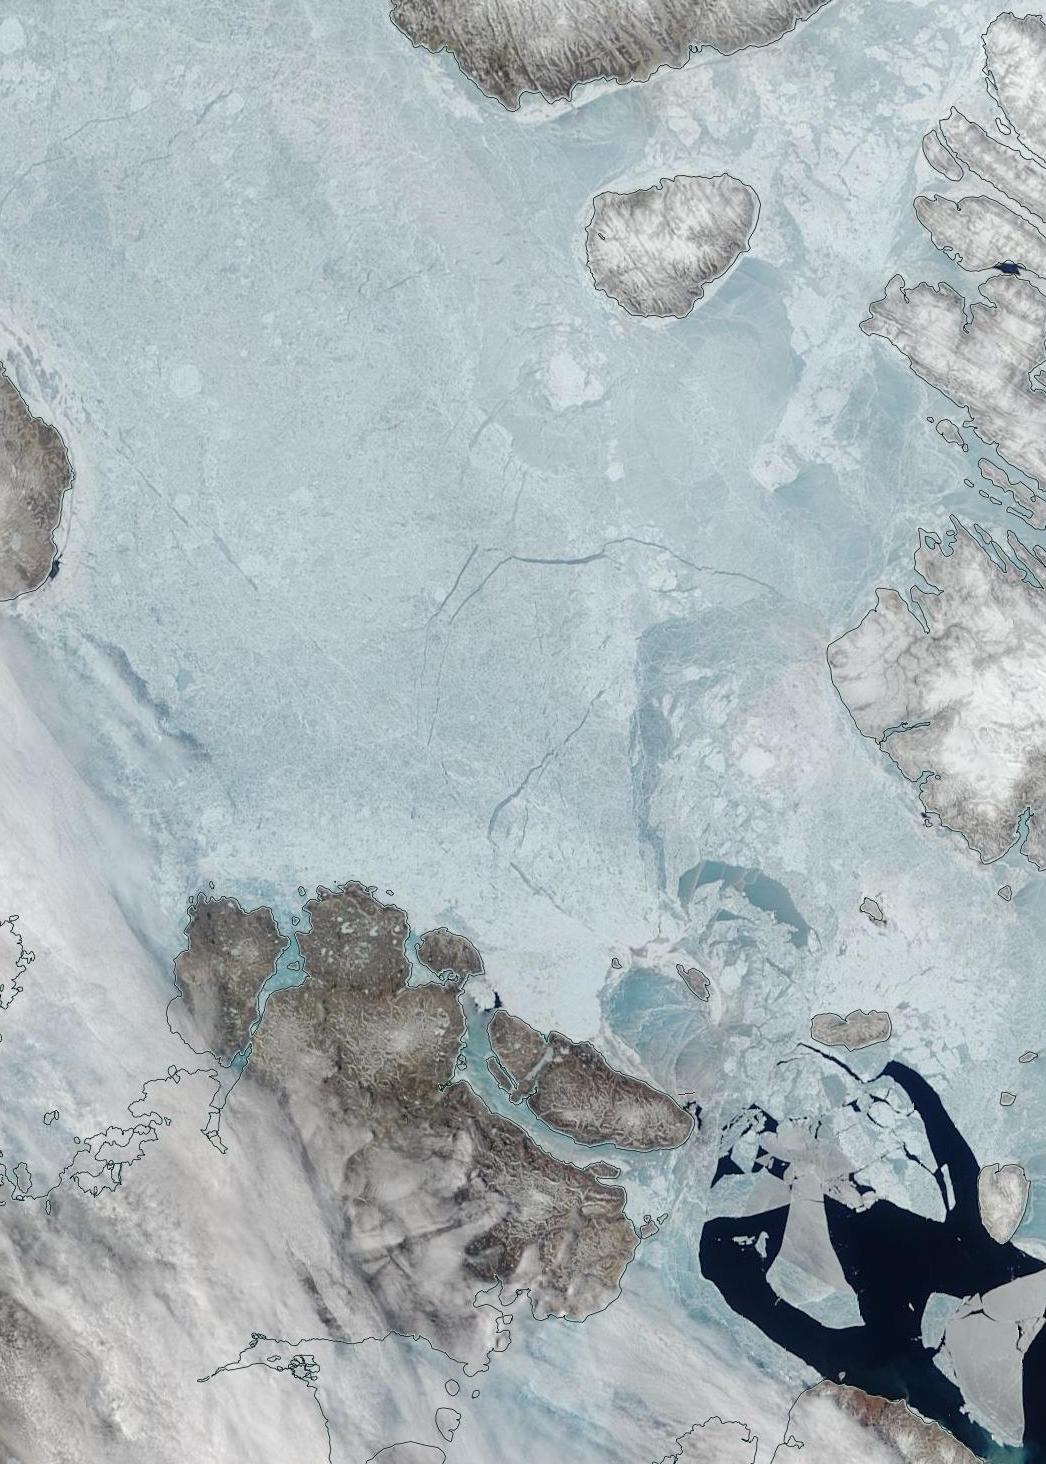
The condition of the sea ice north of 80 degrees is far from normal however. Here’s what’s been happening to the (normally) land fast ice north west of Greenland:
NASA Worldview “true-color” image of the sea ice north west of Greenland breaking up on June 2nd 2017
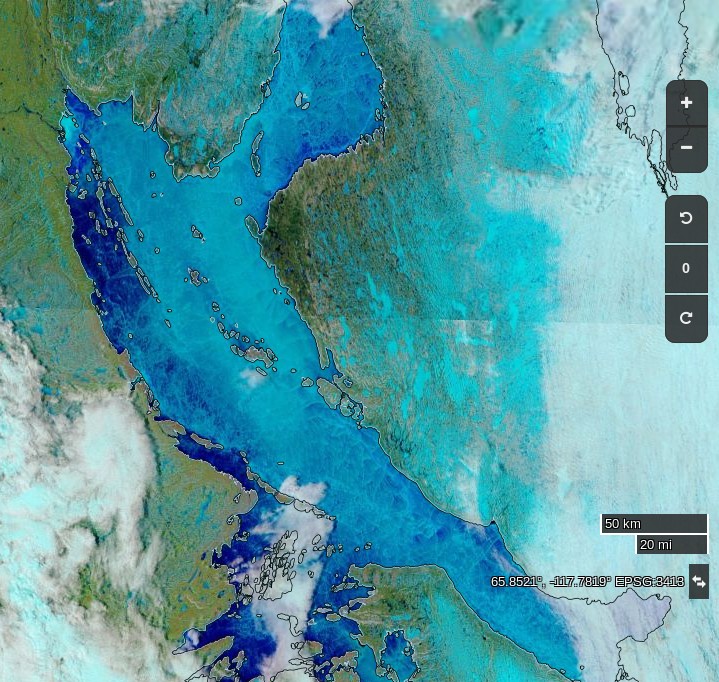
Further south surface melt has set in across the southern route through the Northwest Passage:
NASA Worldview “false-color” image of the Coronation Gulf on June 1st 2017, derived from the MODIS sensor on the Terra satellite
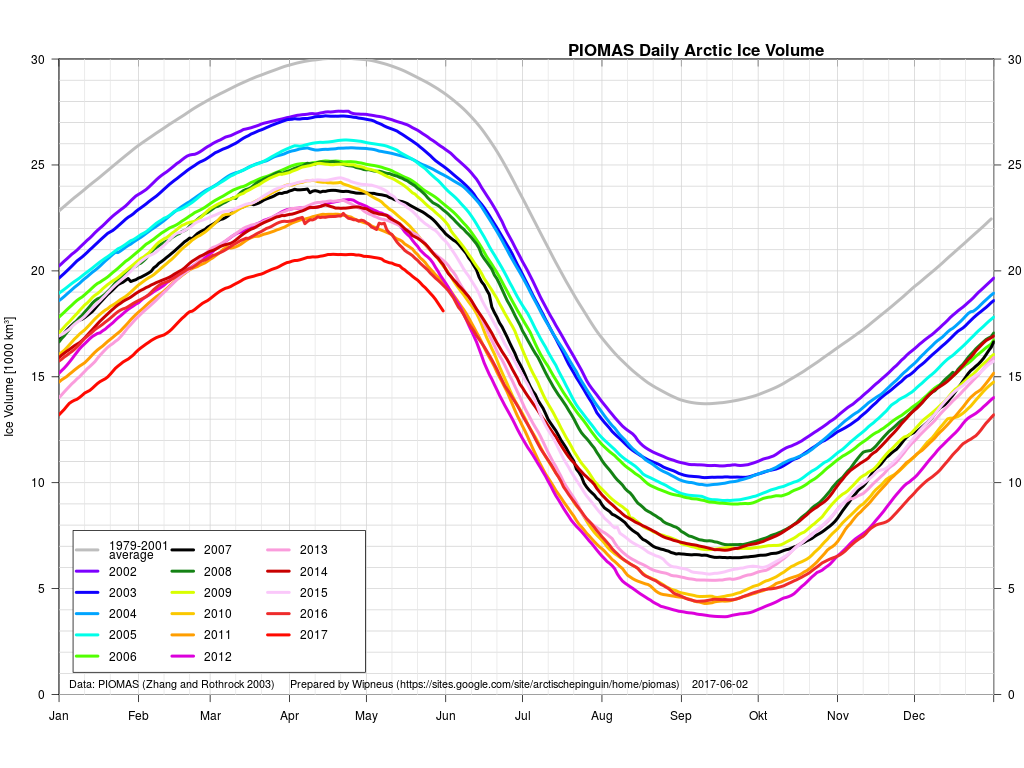
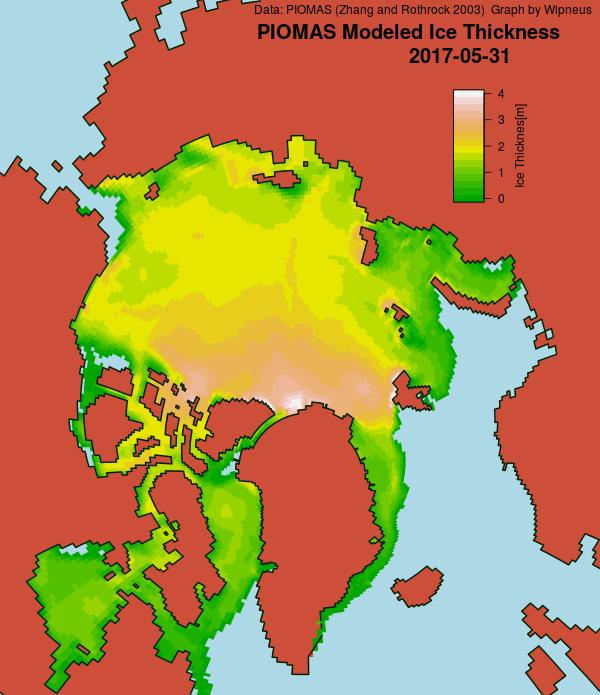
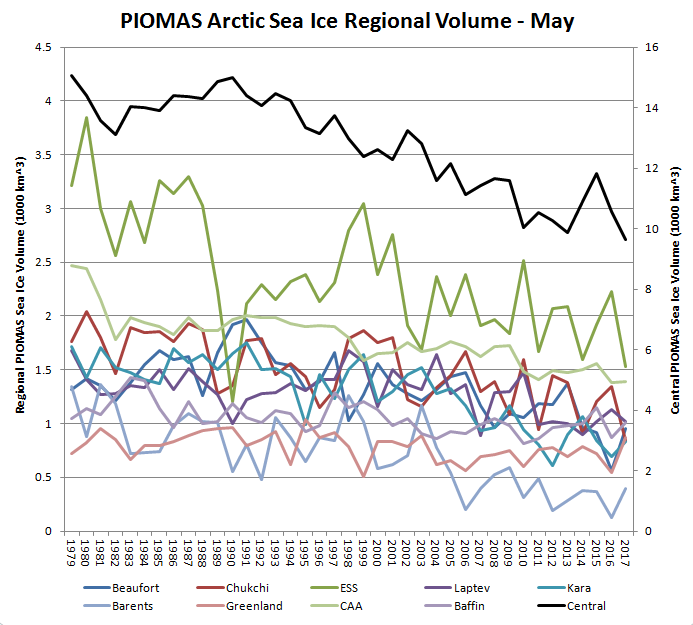
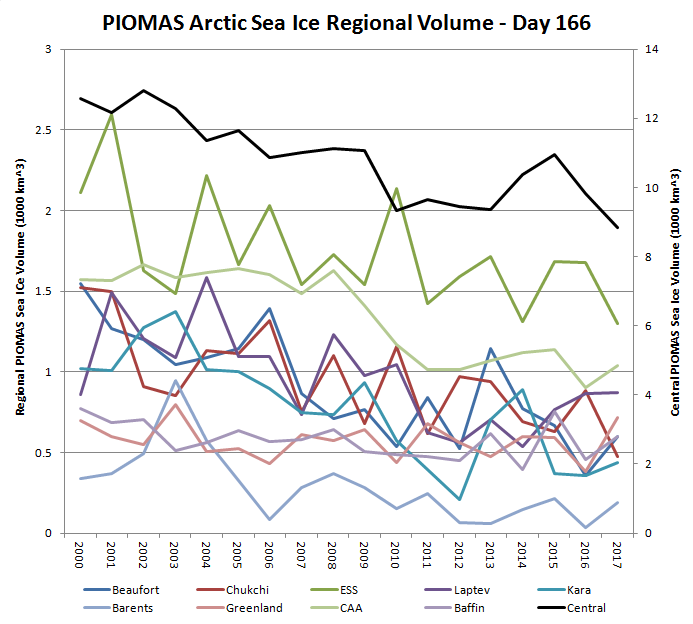
Whilst the gap with previous years has narrowed during May, PIOMAS Arctic sea ice volume is still well below all previous years in their records:
The PIOMAS gridded thickness graph suggests that a large area of thick ice is currently sailing through the Fram Strait to ultimate oblivion:
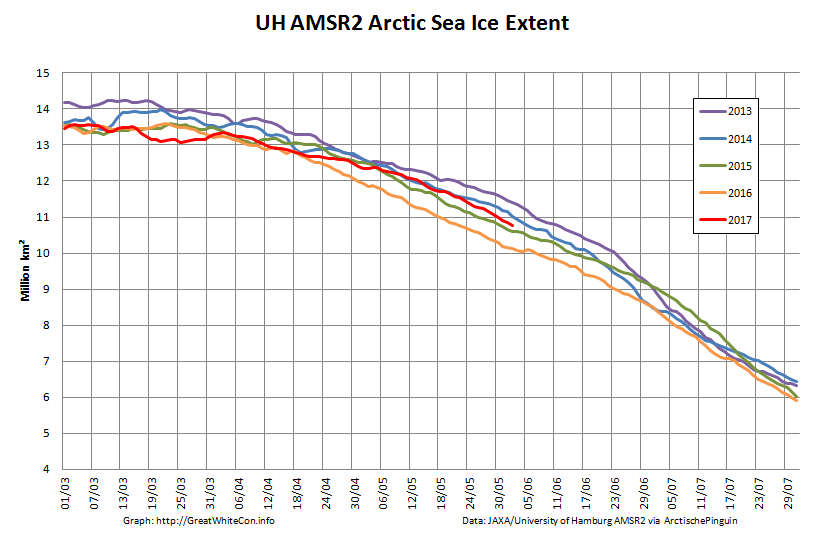
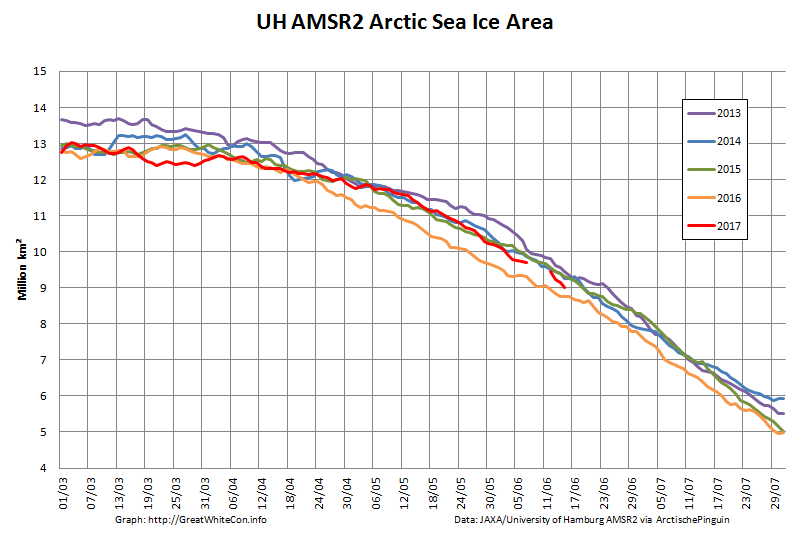
and just in case melt ponds are now affecting those numbers here is extent as well:
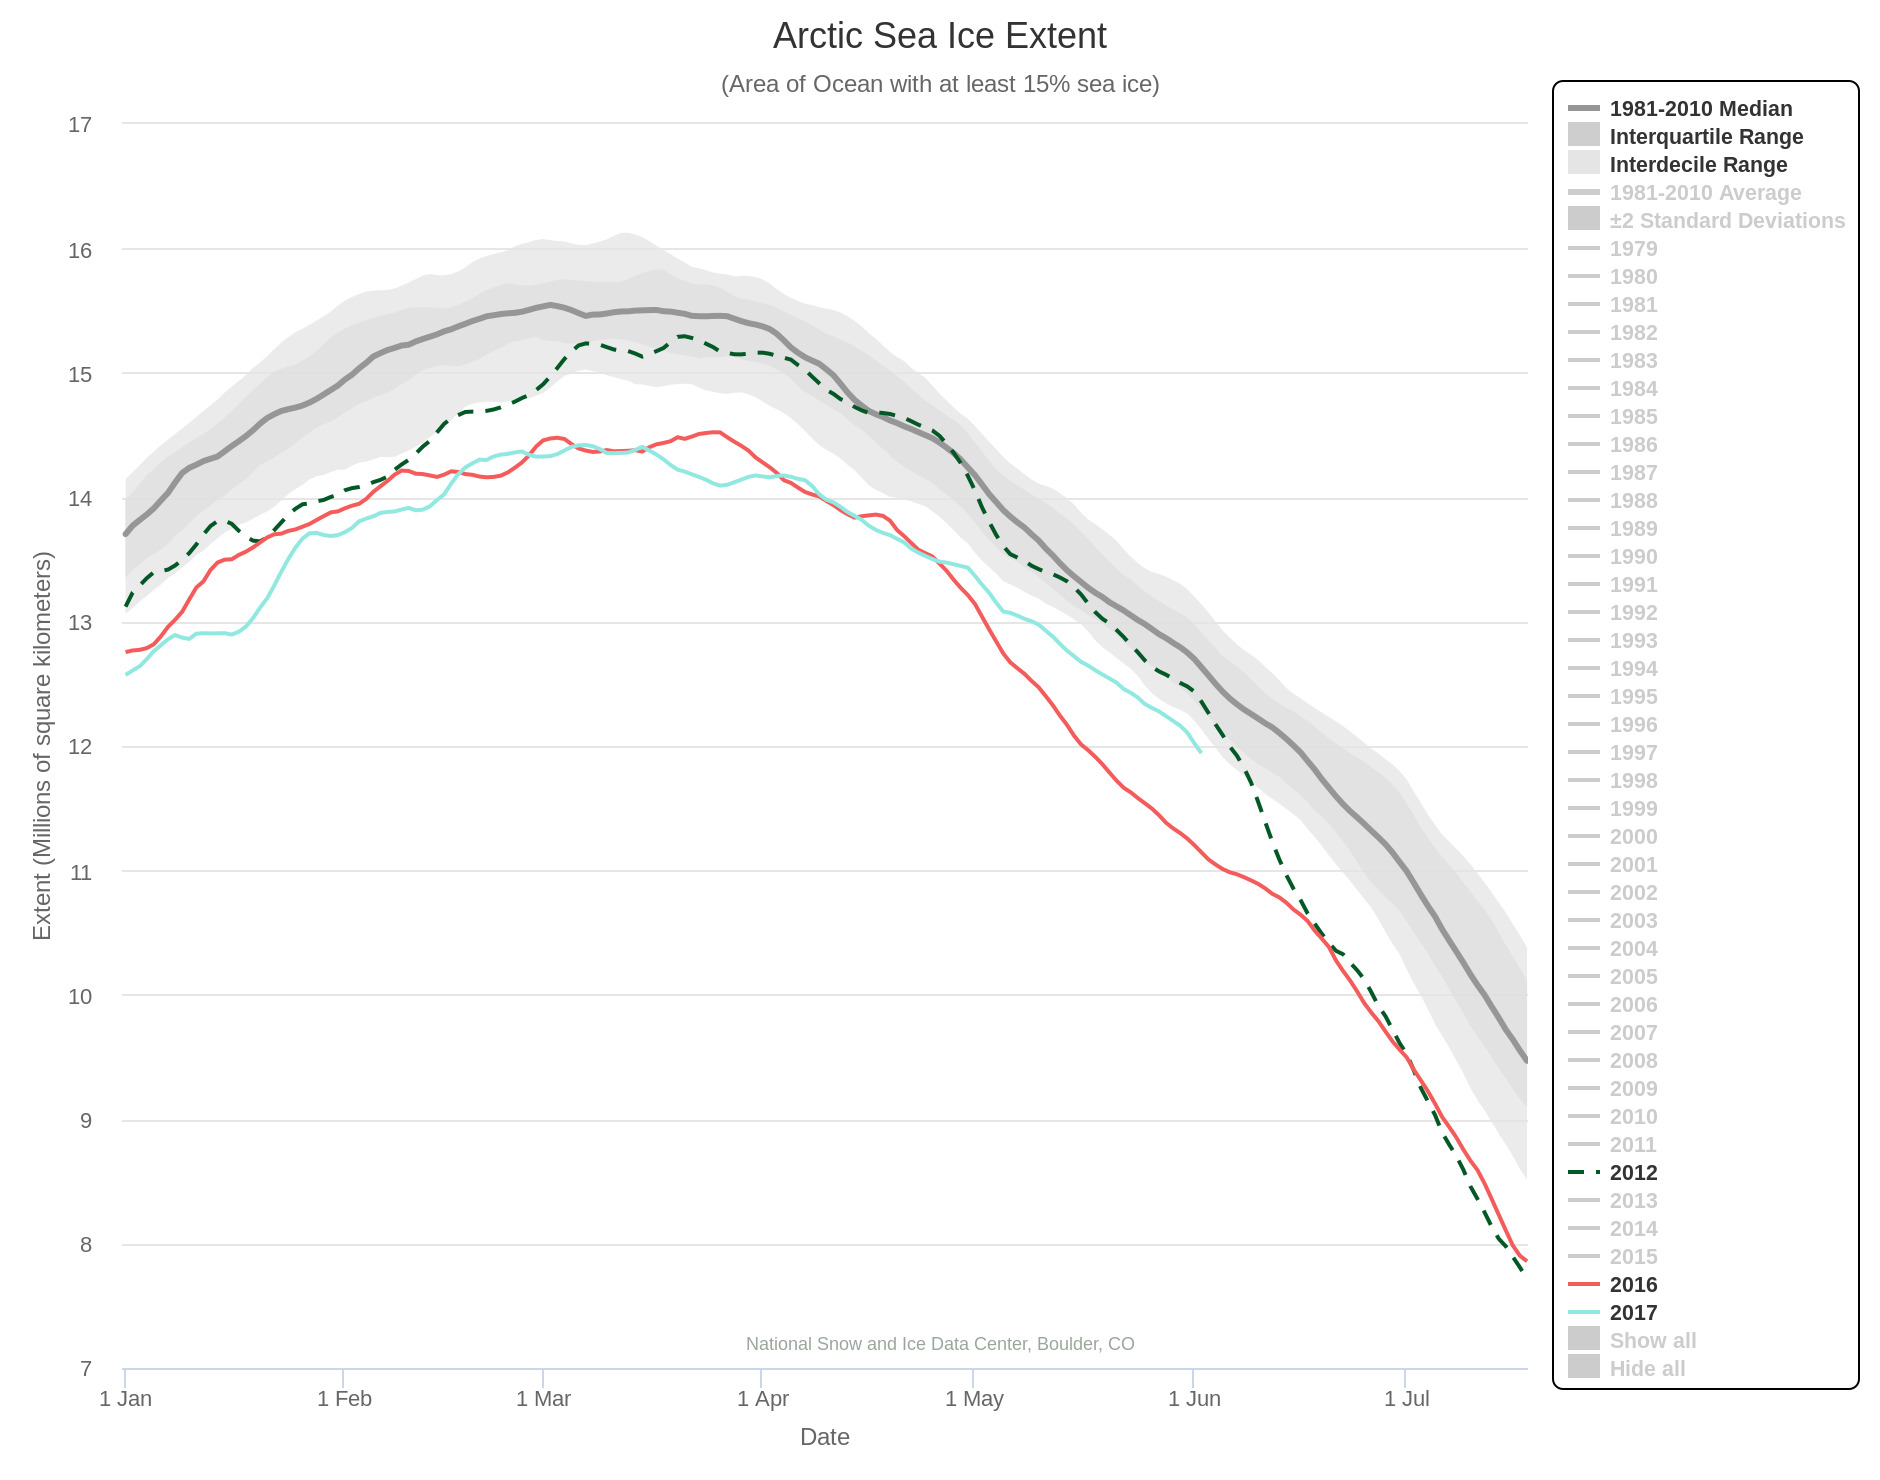
The rate of decrease is inexorably increasing! 2012 extent is currently still well above that of 2017, but those positions may well be reversed by the end of June? Here’s NSIDC’s view on the matter:
[Edit – June 8th]
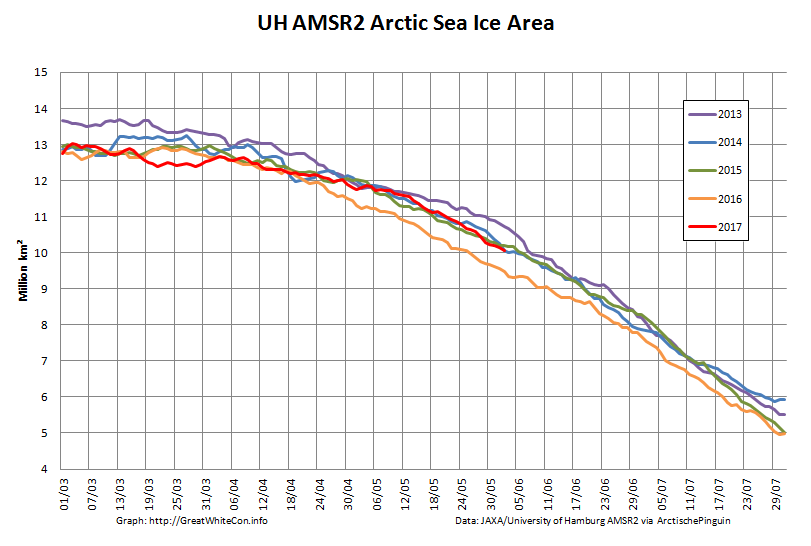
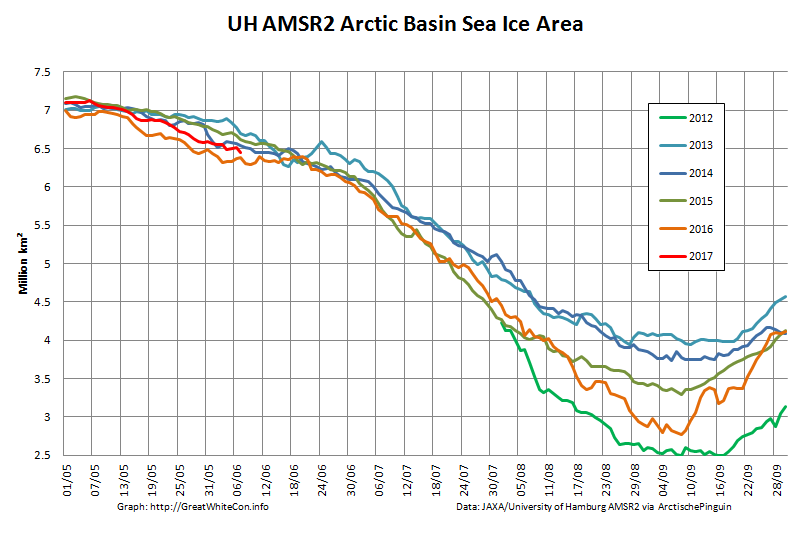
As requested by Tommy, here’s the current Arctic Basin sea ice area:
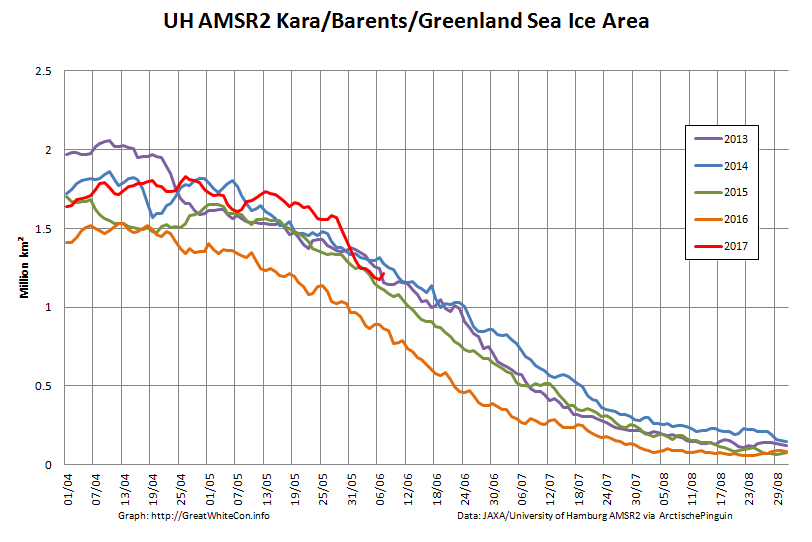
This includes the Beaufort, Chukchi, East Siberian and Laptev Seas along with the Central Arctic. It excludes the Atlantic periphery, which currently looks like this:
[Edit – June 10th]
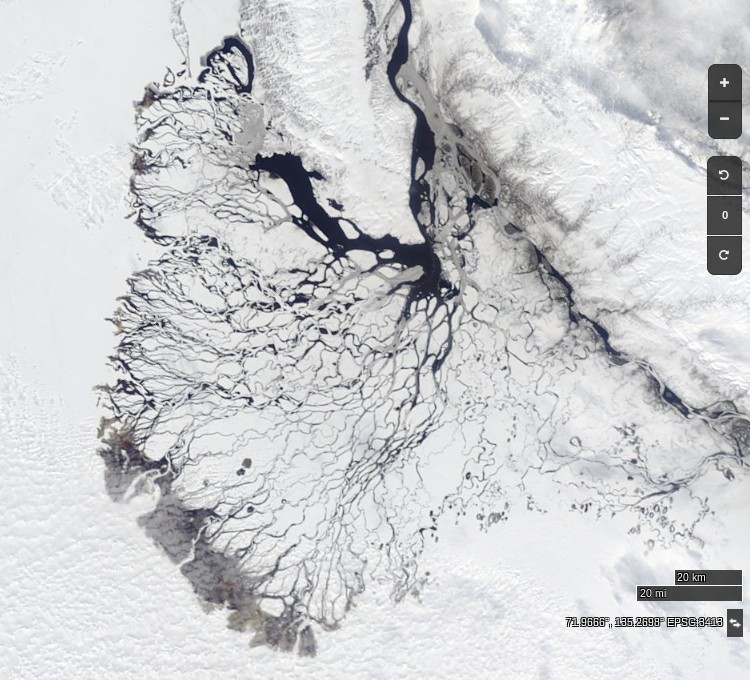
At long last a clear(ish) image of water from the Lena Delta spreading out across the fast ice in the Laptev Sea:
NASA Worldview “true-color” image of the Lena Delta on June 10th 2017, derived from the MODIS sensor on the Terra satellite
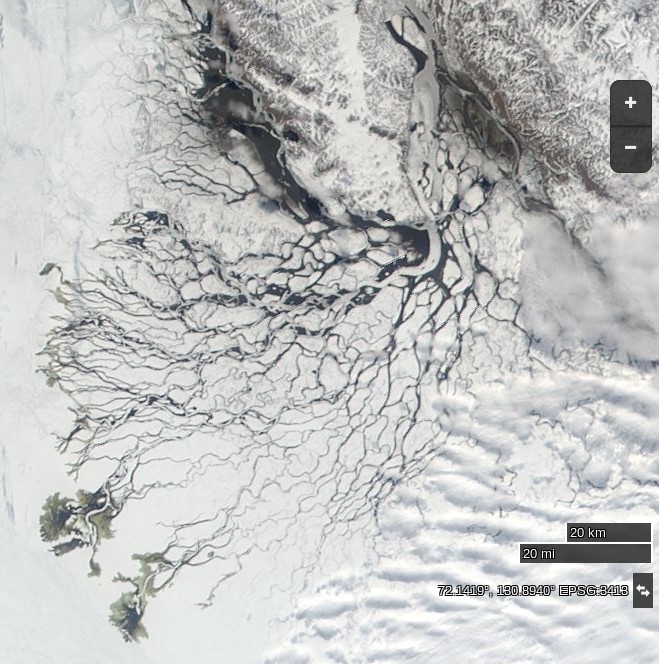
NASA Worldview “true-color” image of the Lena Delta on June 10th 2012, derived from the MODIS sensor on the Terra satellite
[Edit – June 11th]
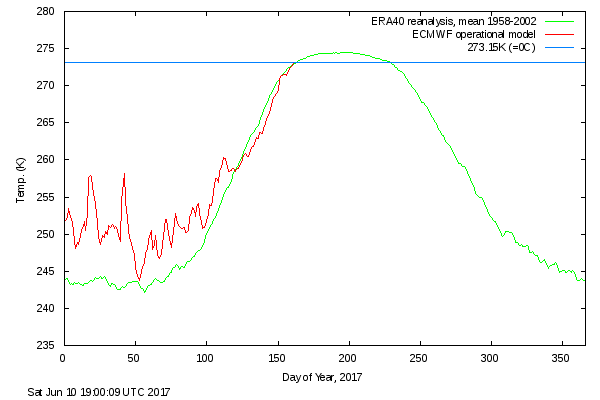
DMI’s daily mean temperature for the Arctic area north of the 80th northern parallel has reached zero degrees Celsius almost exactly on the climatological schedule:
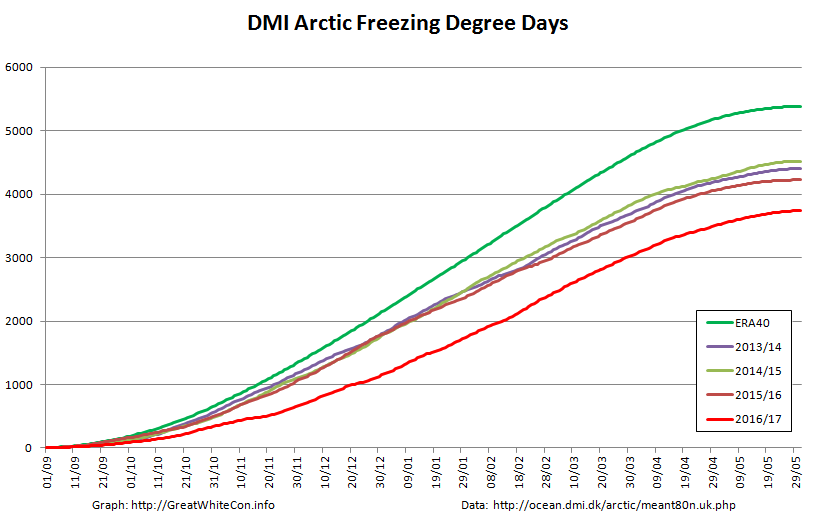
We calculate our freezing degree days on the basis of the freezing point of Arctic sea water at -1.8 degrees Celsius. On that basis this winter’s grand total of 3740 was reached on June 1st:
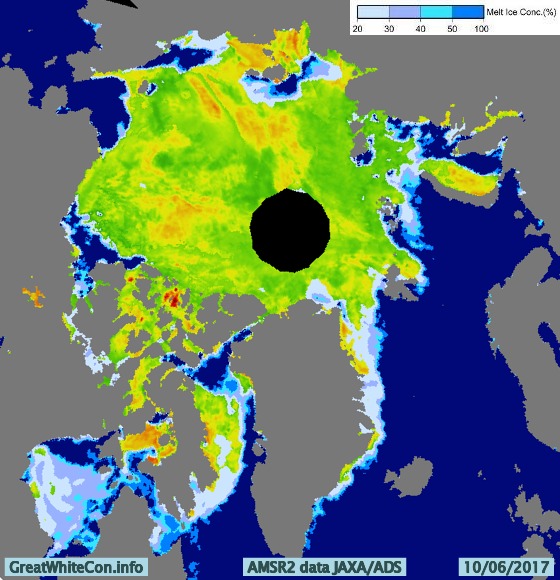
Despite the “coolish” recent weather total FDDs are way below the climatology and other recent years. Consequently there’s a lot less sea ice in the Arctic left to melt at the start of this Central Arctic melting season than in any previous year in the satellite record. However whilst there are some melt ponds visible in the Arctic Basin on MODIS, in that respect 2017 is lagging behind both last year and 2012.
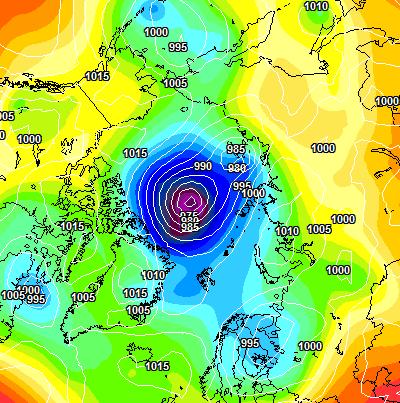
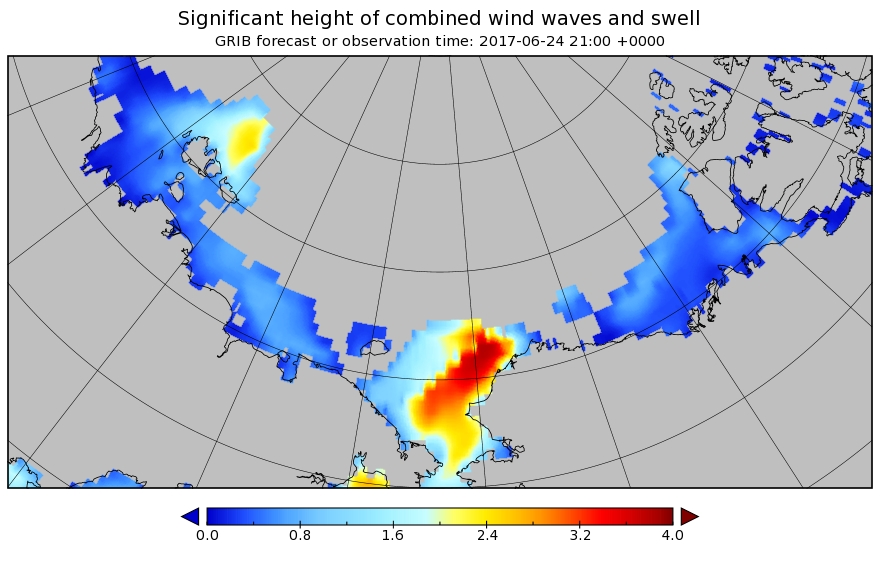
A sub 970 hPa cyclone is starting to enter the realms of realistic possibility, and also forecast are some significant waves in the Chukchi Sea and the expanding 2017 “Laptev Bite”:
[Edit – June 27th]
The forecast cyclone was nowhere near as deep as predicted. According to the analysis by Environment Canada it bottomed out at 980 hPa yesterday:
[Edit – June 29th]
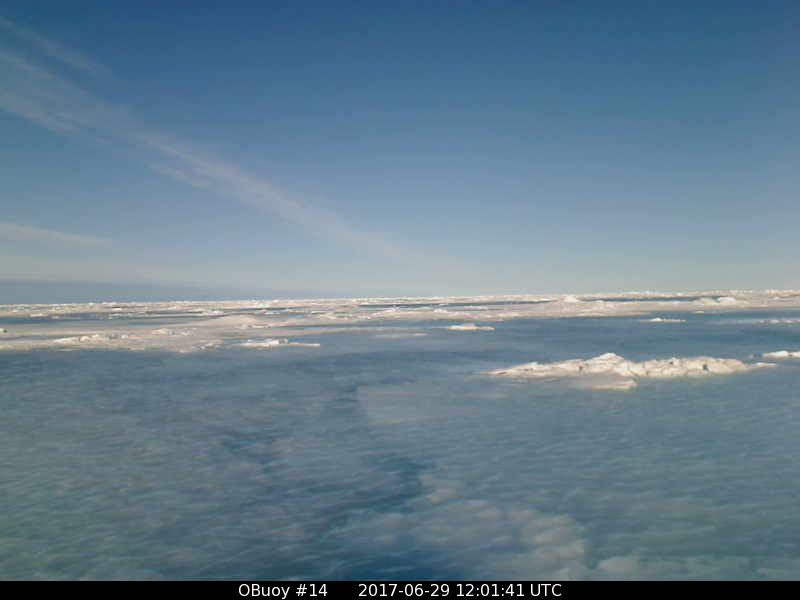
O-Buoy 14 is currently firmly embedded in the fast ice of Viscount Melville Sound, deep in the heart of the Northwest Passage. Here’s the view from the buoy’s camera:
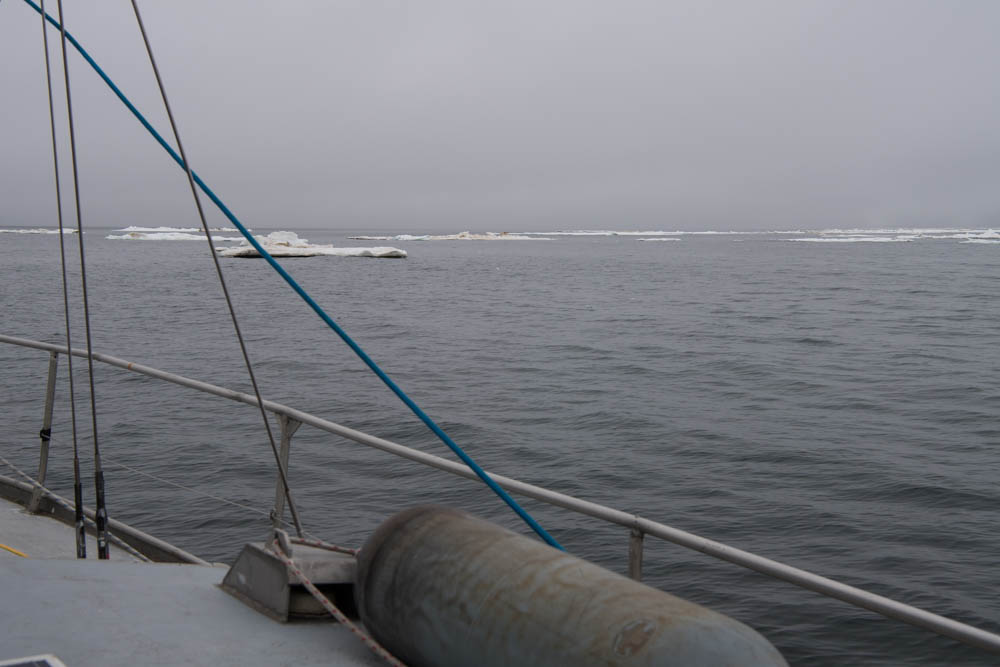
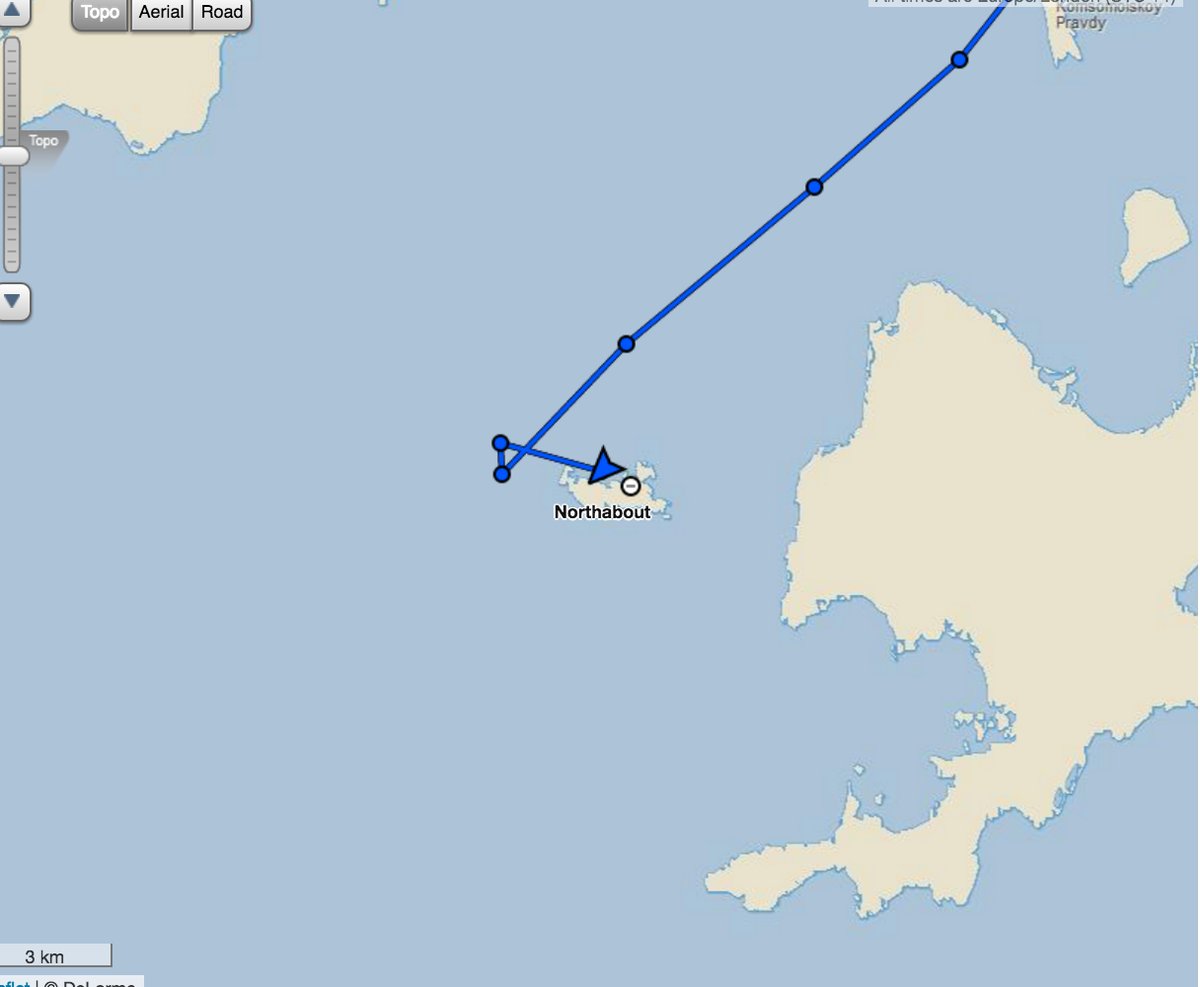
Having rounded Cape Chelyuskin yesterday Northabout has now come across some serious sea ice in the Laptev Sea. The crew are posting regular updates on conditions. Here’s a recent example:
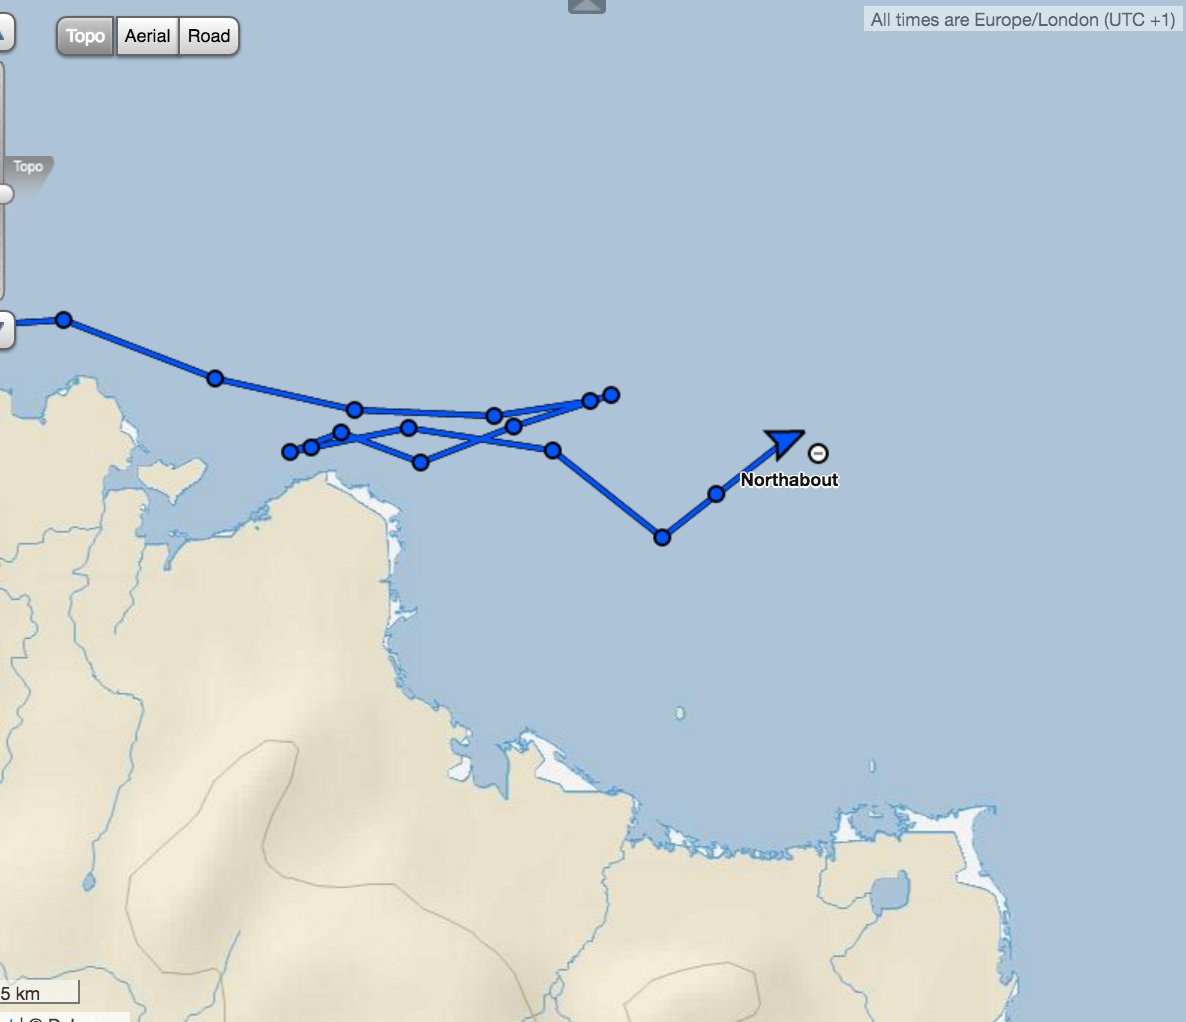
Having anchored against some land-fast ice overnight Northabout is on the move once again:
Not before indulging in some strenuous early morning exercise though!
[Edit – August 11th]
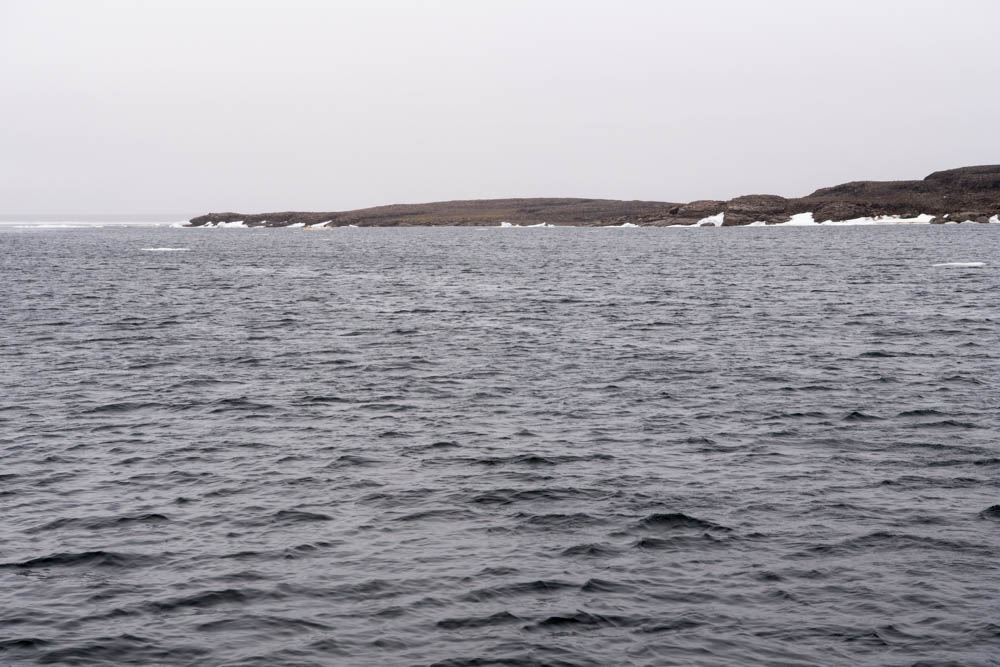
Northabout made further progress yesterday and anchored last night in the shelter of Ostrov Volodarskiy:
There seems to have been less sea ice in attendance than the night before!
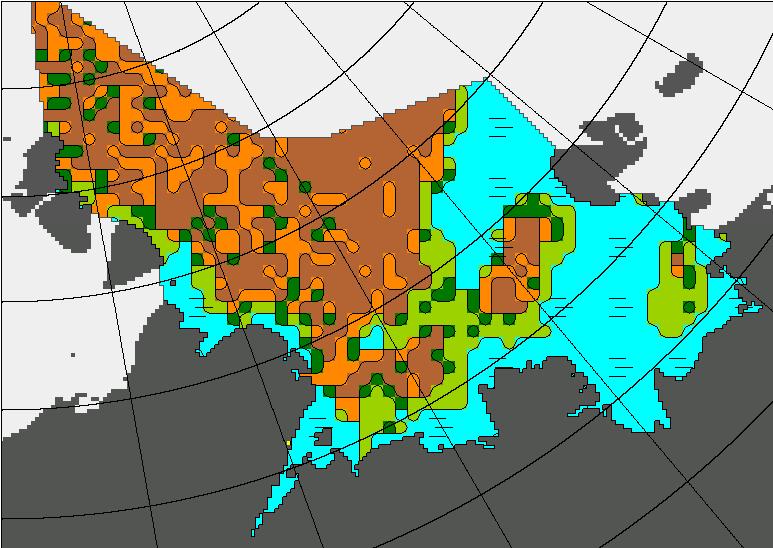
Northabout is now approaching the area in which the most recent AARI forecast suggests there will be sea ice all the way to the coast:
Will the hoped for winds have done their work by tomorrow?
[Edit – August 13th]
Northabout spent yesterday trying to find a way south. Ultimately they failed, reporting that:
The wind and sea state were really picking up. Our options were few. Wind and tide against us, really shallow water of 5m , small bergy bits in the water to miss. NO shelter whatsoever. Do we make our way back the 40 miles where we knew a good anchor spot ? At this rate it would take us 11 hours, using up precious diesel. In the end a nice large floe came into sight, so we gingerly approached, and my comrades made the boat secure. It would protect us from the sea state like a pontoon, and protect us from the mass of ice coming our way. My watch finishes at 12 and I got into my pit at 3.30am.
To our surprise, the floe was moving at 1.3 knots, so up again to move. The strong winds were driving huge belts of pack ice our way, we didn’t want to be caught up against the shore. So, off towards our anchorage, and then a nice large ‘Stamukha’ appeared. Russian for ice that has grounded on the bottom, so not moving. Another mooring. This time it felt safe, so a good couple of hours sleep,
This morning it looks like they are still anchored to that Stamukha:
Here’s a picture of their anchorage the previous night:
and moving pictures of Northabout mooring to the “stamukha”.
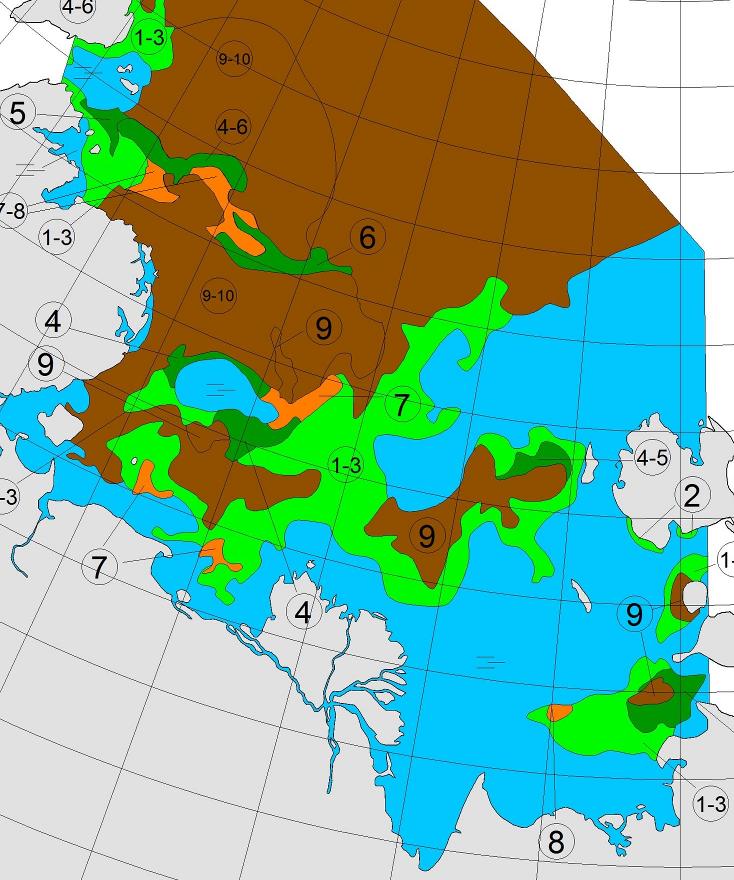
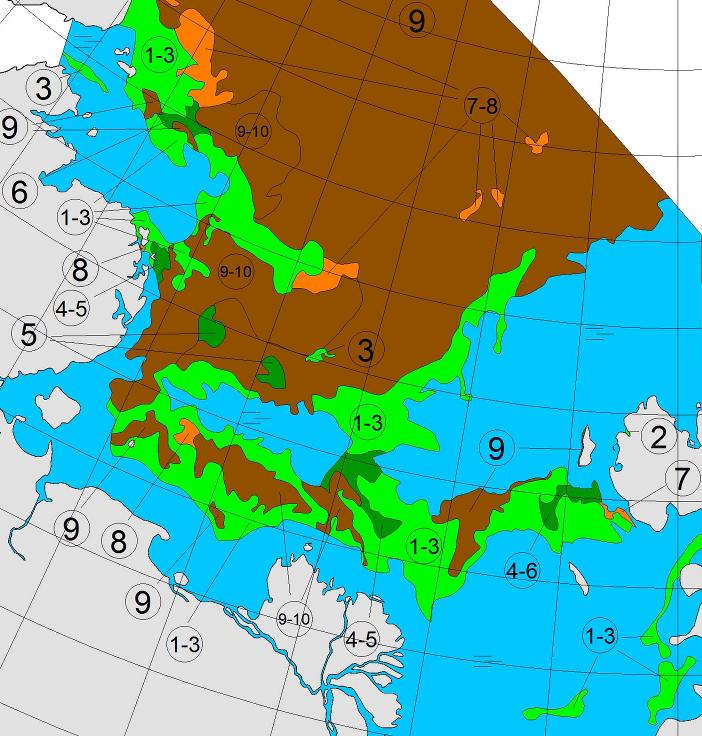
Here’s the latest AARI sea ice chart:
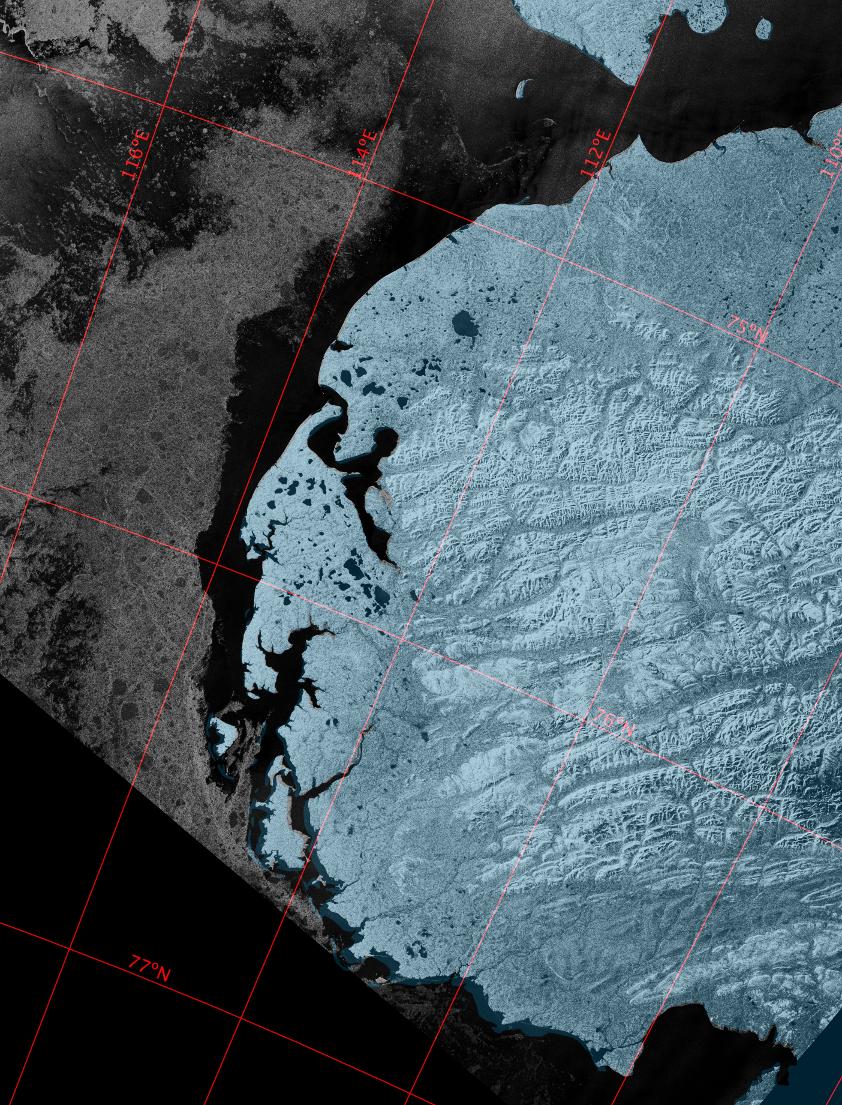
which still shows a considerable length of the coast of the Taymyr Peninsula beset by 9/10 concentration sea ice. However Sentinel 1A imaged that coast just before midnight last night. Here’s what it revealed:
So near and yet still so far for Northabout?
[Edit – August 13th PM]
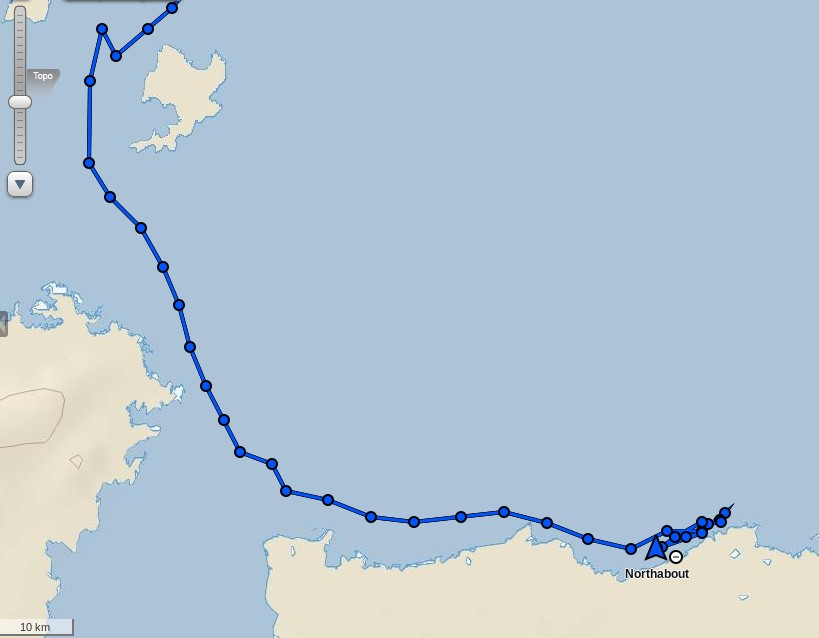
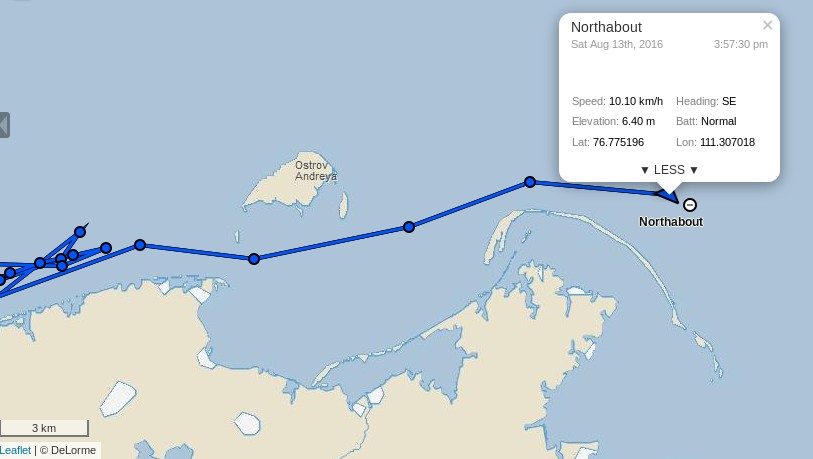
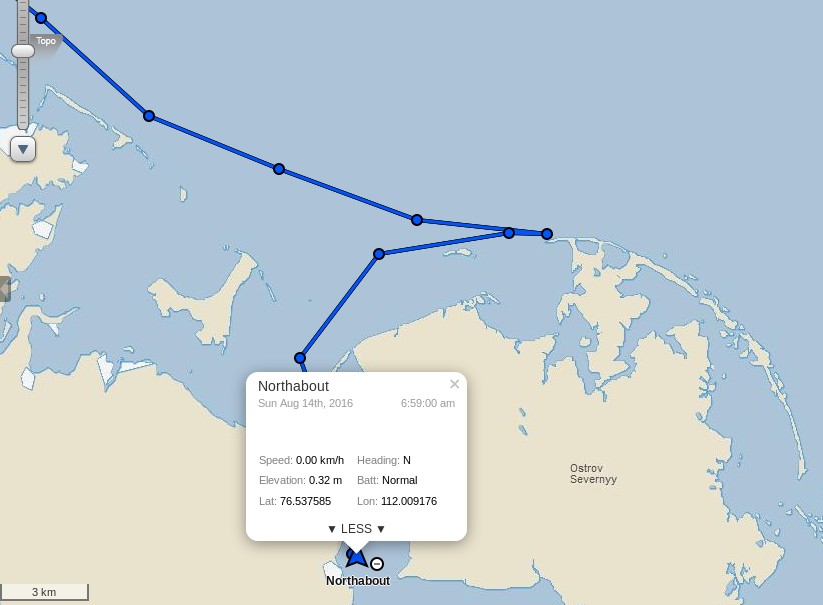
Stop Press! Northabout has now passed Ostrov Andreya and turned south:
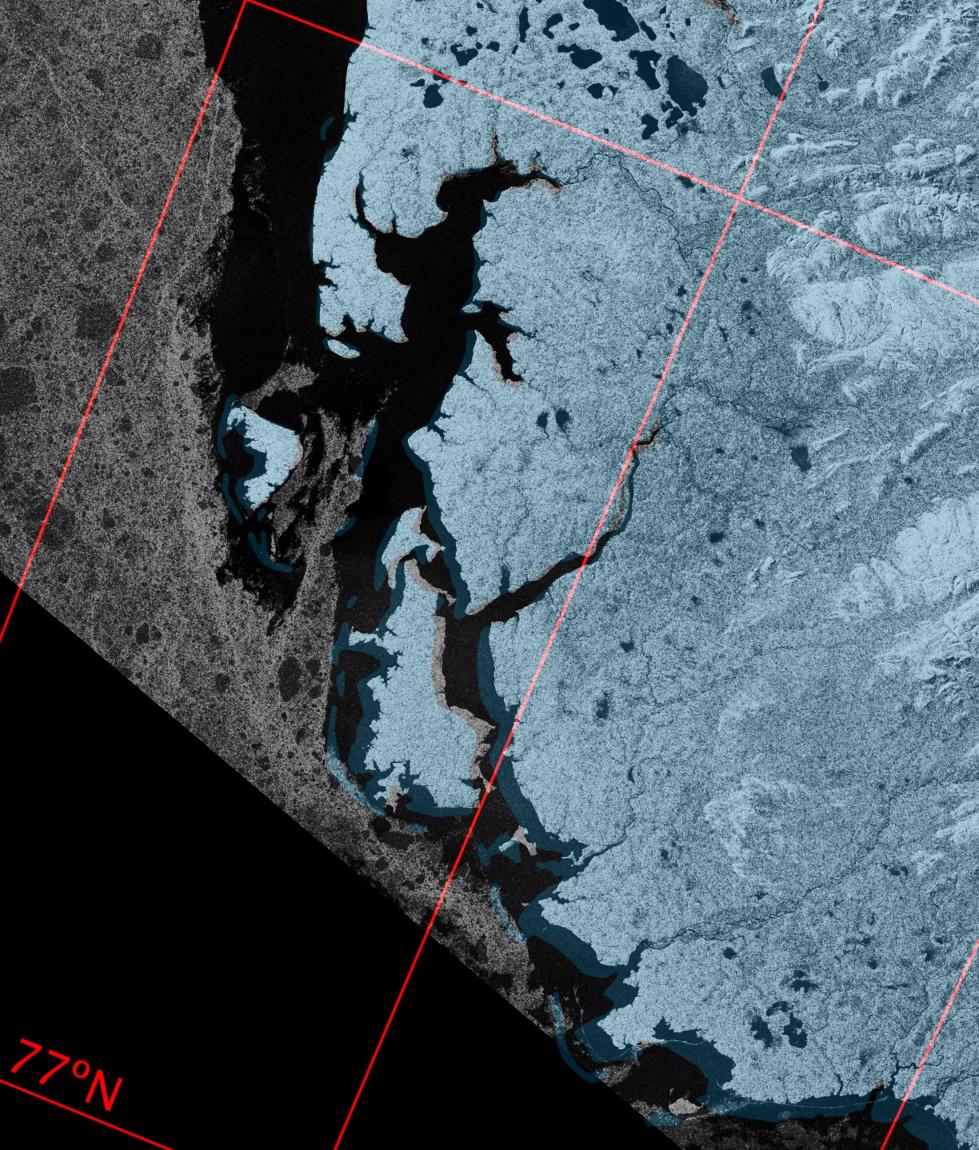
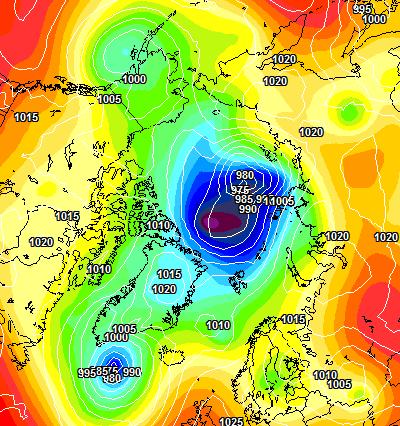
If last night’s Sentinel 1A images are to be believed the worst is now behind the Polar Ocean Challenge team, until the winds of the forthcoming “Great Arctic Cyclone” of 2016 arrive at least? Here’s the current ECMWF forecast for early Monday morning, courtesy of MeteoCiel:
[Edit – August 14th]
After inspecting a possible route to the east of Ostrov Severnyy, the crew of Northabout have decided that:
We have had to go and find shelter tonight. A huge storm on the way, and high wind, in shallow waters with masses of ice driving your way, is no place to hang around to see what might happen.
So, now at anchor, all tired, excited after today, and looking forward to the next hurdle – I think! As I write, the wind is gusting 30 knots, so clever to run for shelter.
[Edit – August 15th]
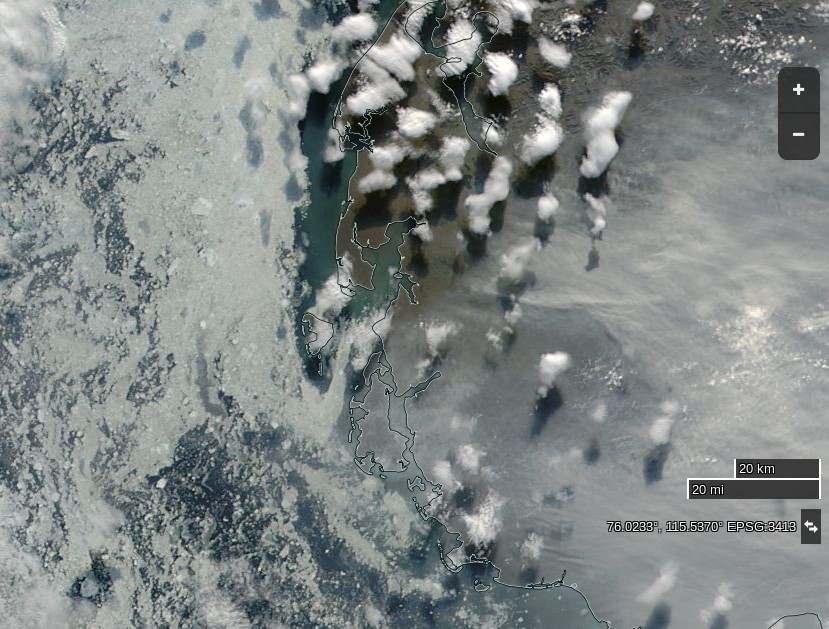
The Sentinel image from last night isn’t very clear, and today’s MODIS images are rather cloudy so here’s one from yesterday:
NASA Worldview “true-color” image of the western Laptev Sea on August 14th 2016, derived from the MODIS sensor on the Aqua satellite
It shows that the winds had already opened up a fairly ice free channel past Ostrov Severnyy, and also the smoke that Northabout’s crew reported smelling yesterday:
Staying at Anchor for another night behind Ostrov Severnyy – Air 9C water 5C 76 53N 112 E 30 knot winds from SW 15.40 UTC 22.40 local time
Well, as predicted from the Grib files, winds slowly increased throughout last night to 35 and gusting much higher. Also, as predicted, the temp rose to an amazing 17 degrees today! In the morning, I also got the distinct smell of wood smoke. Maybe a forest fire 500 miles south and the smell drifted with the wind. At one point, we slipped the anchor, so good we had an anchor watch and wise to find shelter, no ice, 7m of depth, surrounded by land but still bouncing about like a cork.
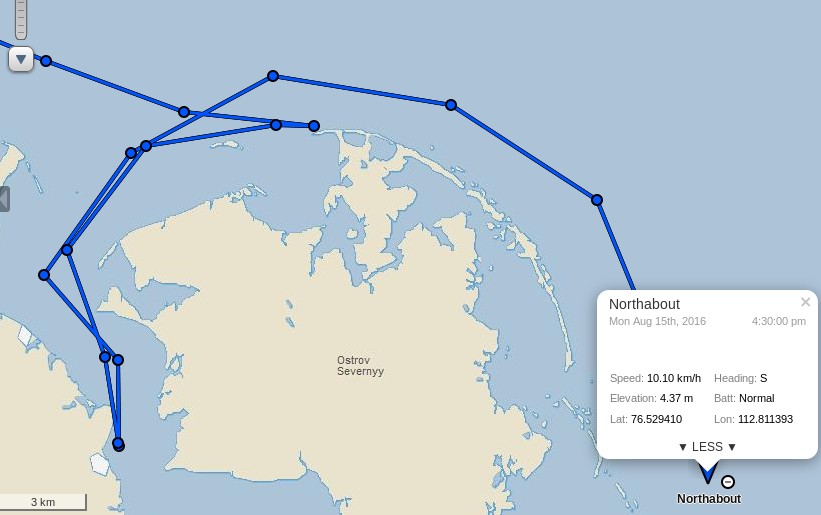
In the wake of the cyclone they are sailing south again today, apparently unhindered by sea ice:
[Edit – August 16th]
Northabout has made good progress overnight:
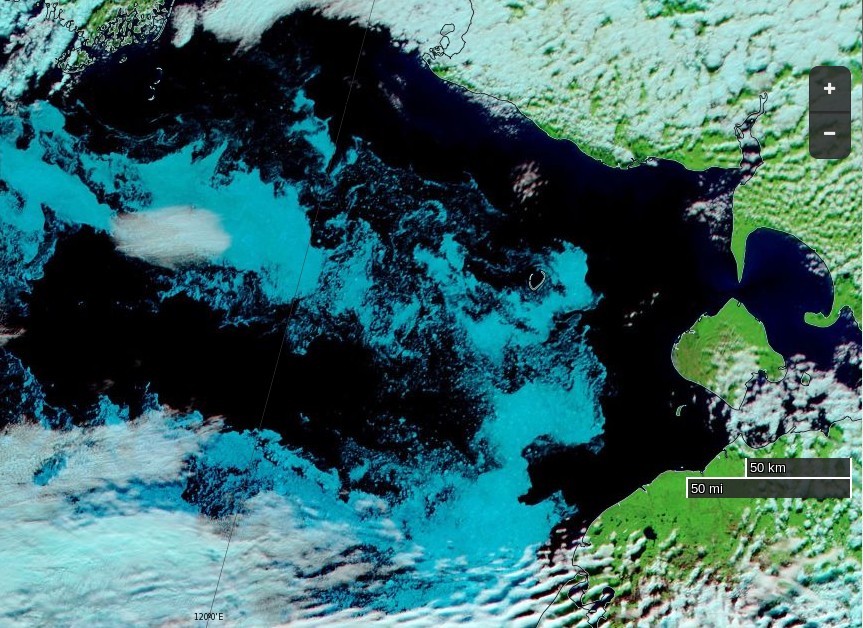
The skies are clear this morning over the south-west Laptev Sea:
NASA Worldview “false-color” image of the south-western Laptev Sea on August 16th 2016, derived from the MODIS sensor on the Terra satellite
The next question is which side of Ostrov Bol’shoy Begichev will Northabout pass? All the indications are that the answer will be to the east.
Whilst we wait for that to be confirmed, here is some video footage of Northabout passing Ostrov Andreya on August 13th:
P.S. Here’s the latest AARI ice chart for the Laptev Sea:
[Edit – August 18th]
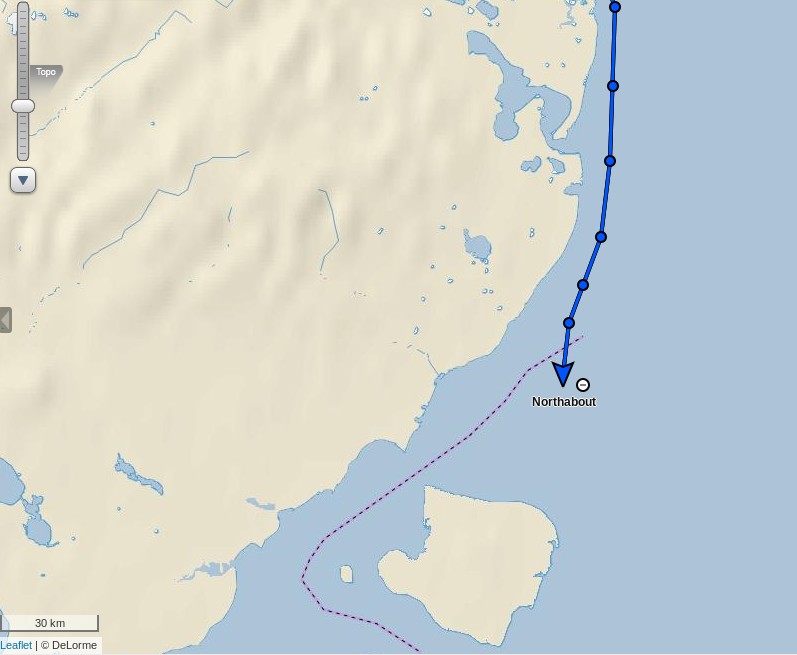
Northabout has encountered yet more sea ice. According to the “Crew Blog” of Ben Edwards:
Over night we’d sailed into ice. I know, I said we shouldn’t be troubled by ice for a bit, I was wrong. The ice on its own wasn’t too bad, the thing was we had fog as well. The fog was terrible, we could barely see five meters in front of the prow and the ice just kept on coming. After a bit the fog went, thankfully, the ice didn’t. Eight hours later when I’m back on watch we still had ice and even better, we had to divert to avoid a sandbank. Then the fog came back, typical. Luckily after another two and a half hours the ice began to clear a bit, for now.
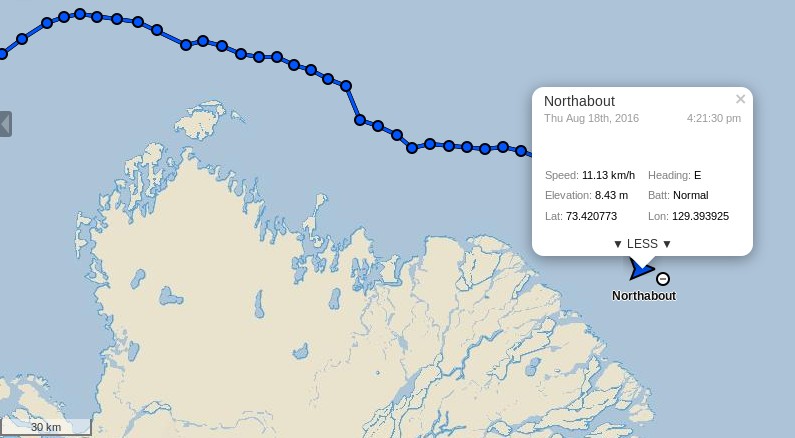
Despite the ice, fog and sandbank Northabout is still making good progress across the Laptev Sea, and is currently sailing past the delta of the Lena River:
This website uses cookies to improve your experience. We'll assume you're ok with this, but you can opt-out if you wish. Cookie settingsACCEPT
Privacy & Cookies Policy
Privacy Overview
This website uses cookies to improve your experience while you navigate through the website. Out of these, the cookies that are categorized as necessary are stored on your browser as they are essential for the working of basic functionalities of the website. We also use third-party cookies that help us analyze and understand how you use this website. These cookies will be stored in your browser only with your consent. You also have the option to opt-out of these cookies. But opting out of some of these cookies may affect your browsing experience.
Necessary cookies are absolutely essential for the website to function properly. This category only includes cookies that ensures basic functionalities and security features of the website. These cookies do not store any personal information.
Any cookies that may not be particularly necessary for the website to function and is used specifically to collect user personal data via analytics, ads, other embedded contents are termed as non-necessary cookies. It is mandatory to procure user consent prior to running these cookies on your website.