My Arctic alter ego was checking out the new “X” rated edition of Twitter when “she” couldn’t help but notice that Elon Musk had allowed Tony Heller back into the climate “debate” thereon, albeit with a new handle.
“Snow White” also noticed that for some strange reason Tony was telling lots of porky pies about Arctic sea ice again! Hence:
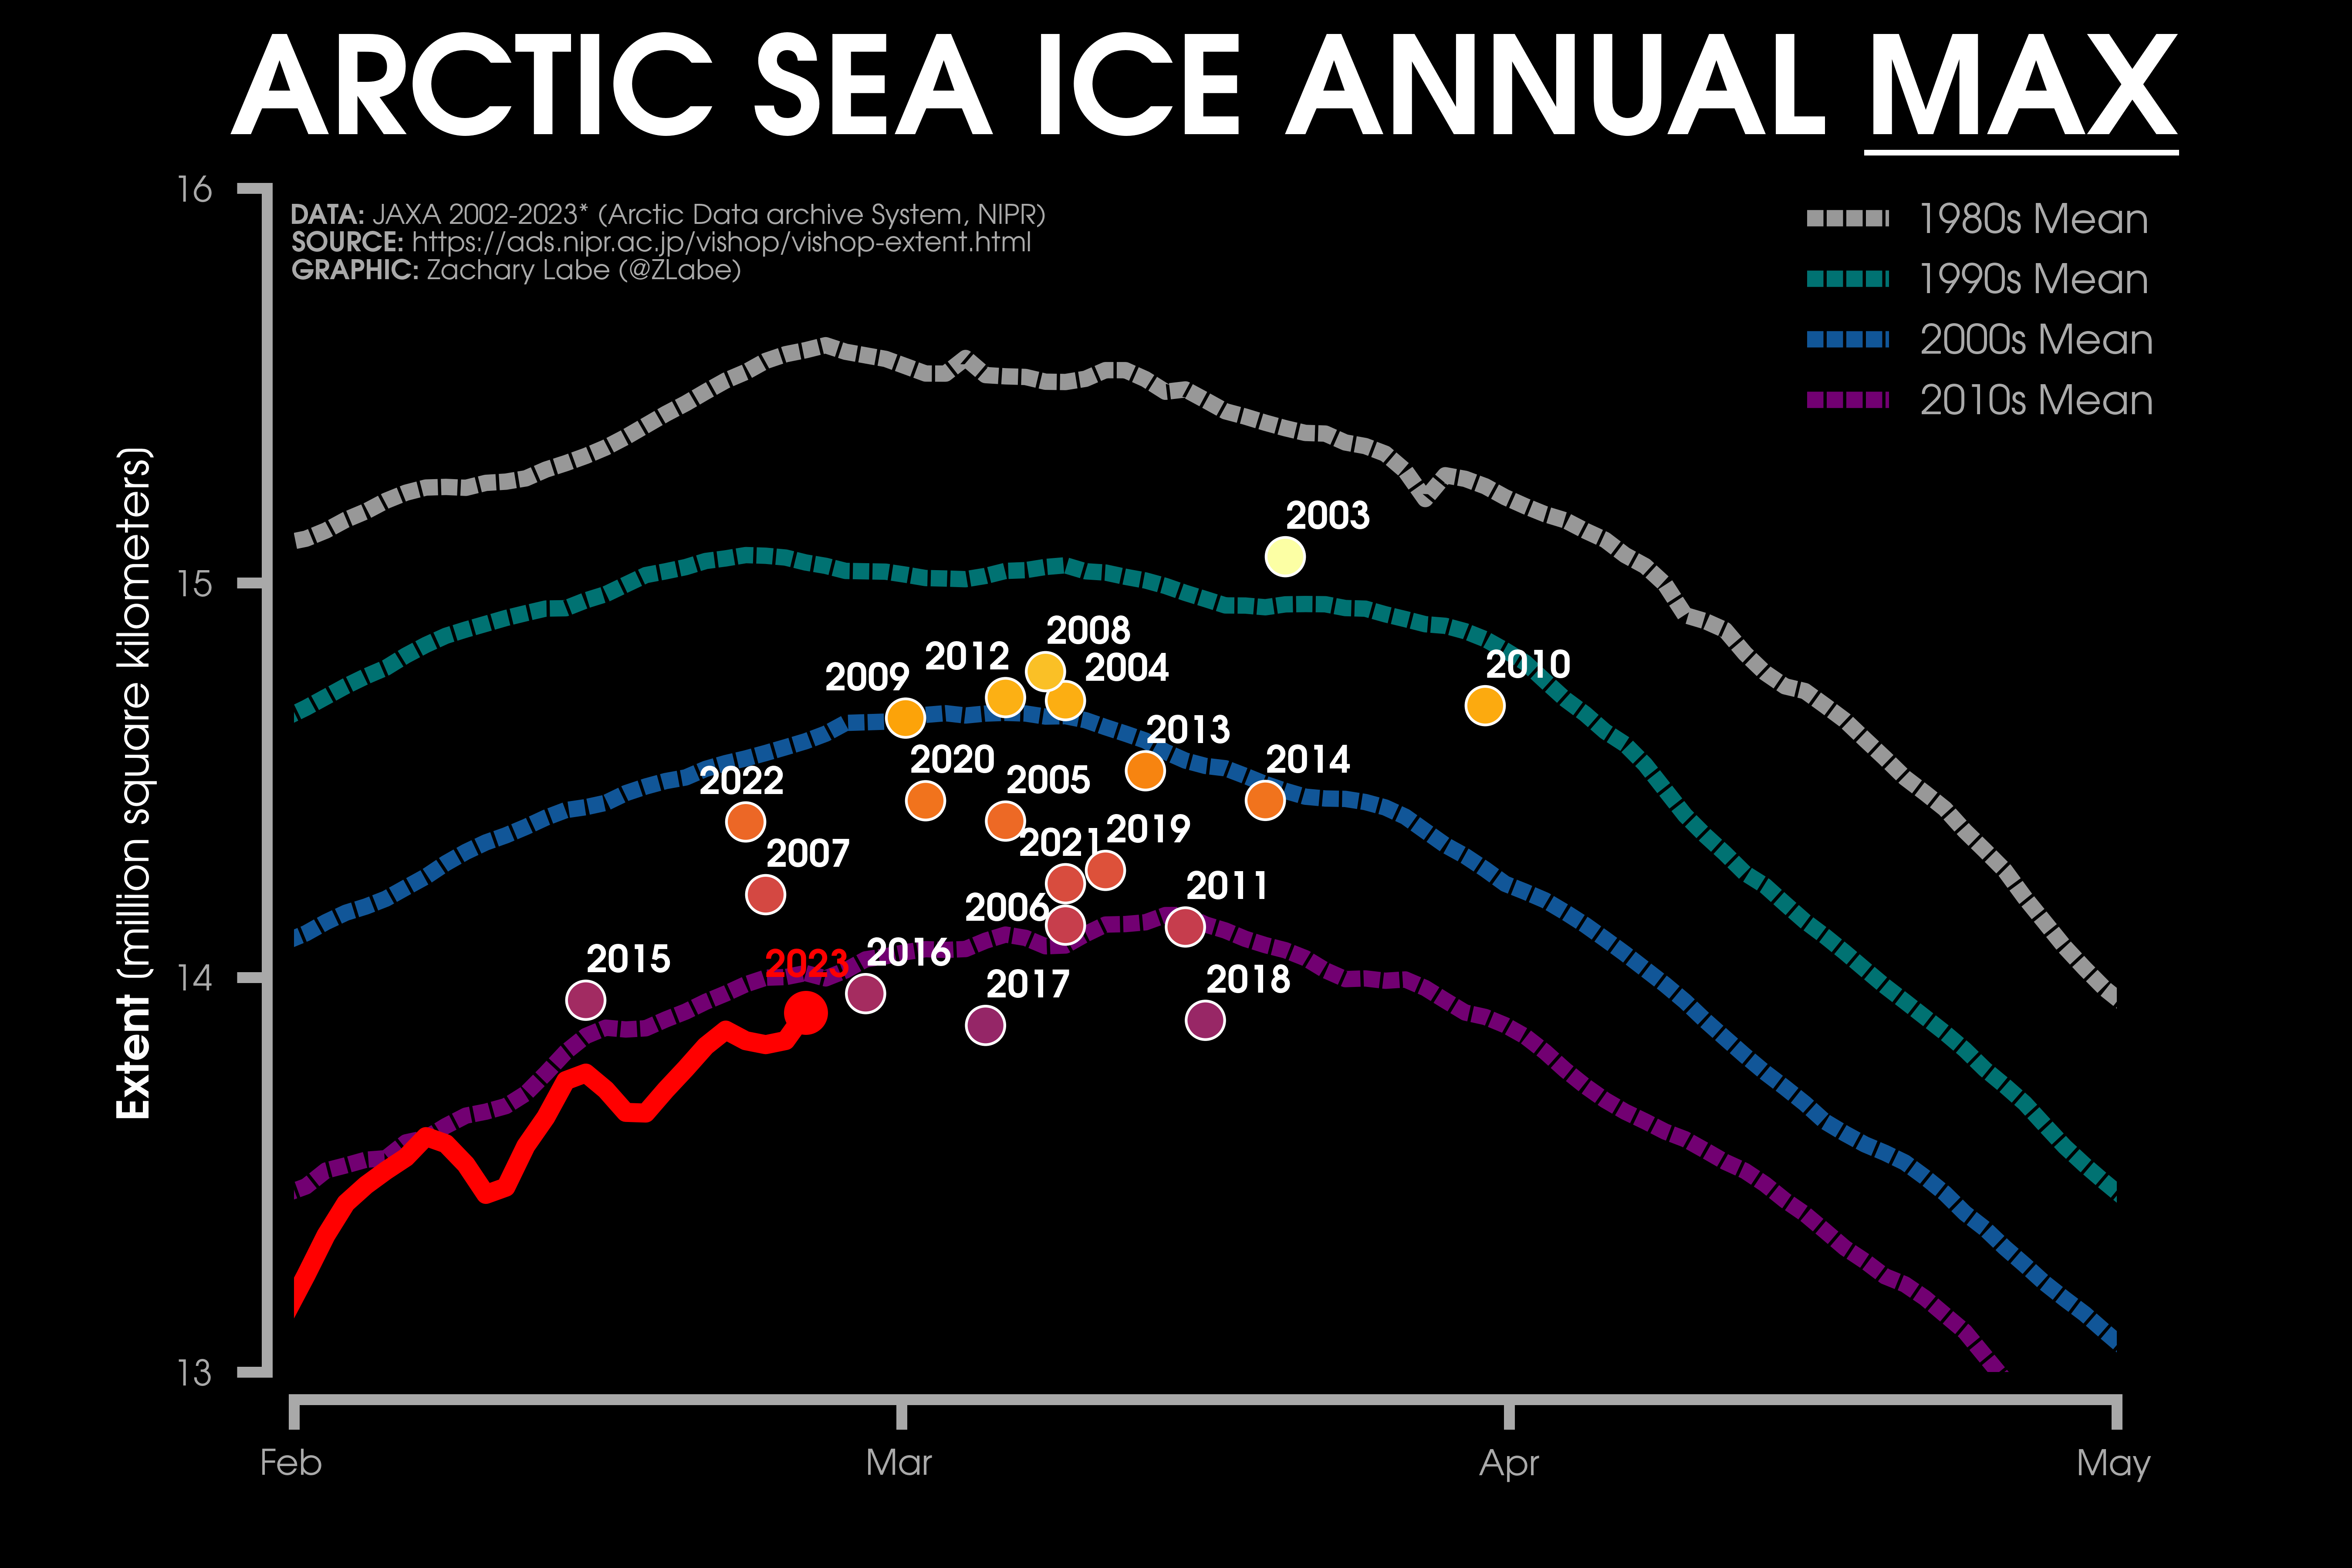
Here's @TonyClimate demonstrating yet again that either:
1) He has no understanding of all things #Arctic, or
2) He understands well enough, but he pulls the wool over the eyes of his faithful flock of followers.https://t.co/yYNhpSncLE
We’ll come on to the Arctic in a moment, but at more temperate latitudes I am proud to announce that my Cornish alter ego has been officially outed as an “environmental campaigner” by the BBC. Moving pictures of yours truly, discussing drought rather than sea ice, are available via BBC iPlayer until around 18:30 this evening, possibly to UK residents only.
[Stop Press! A shorter version of Kirk England’s report on two potential desalination plants in Cornwall (also including my 15 seconds of fame!) is available here until around 22:30 this evening ]
Alternatively we have recorded our own moving pictures of this momentous event:
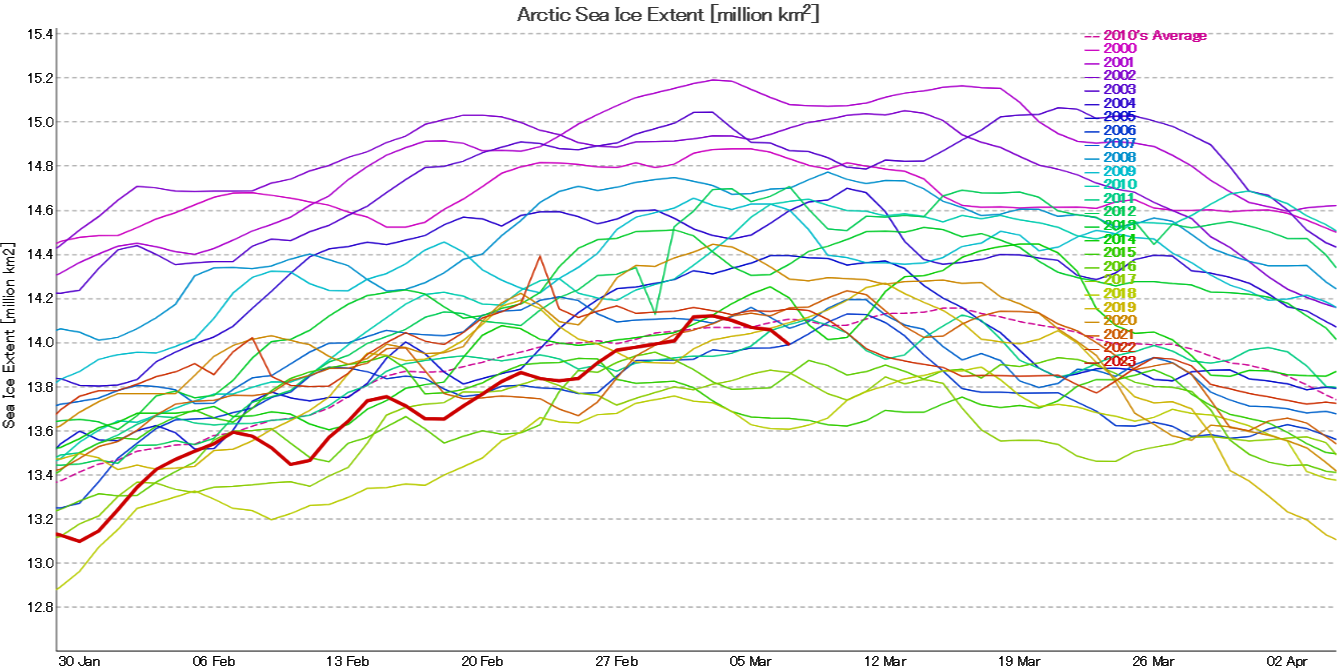
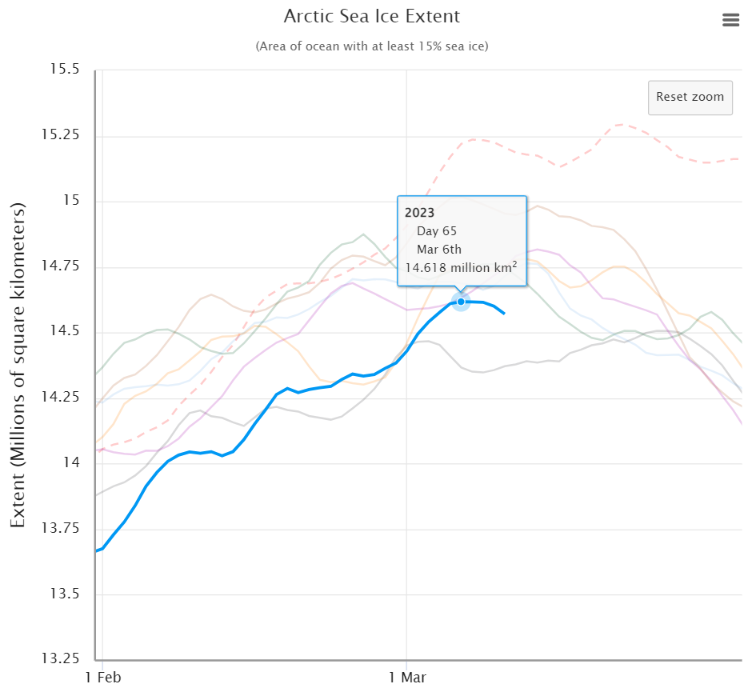
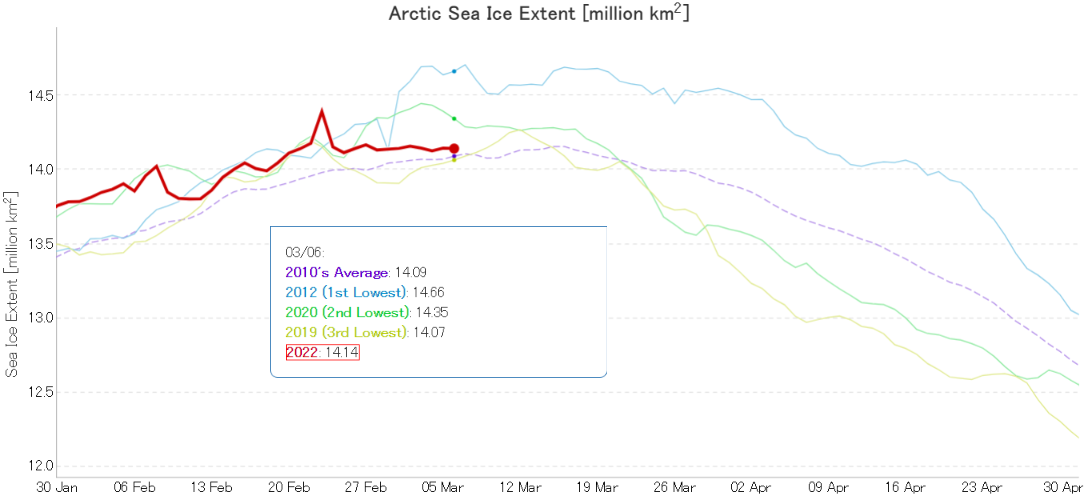
Zack’s graph displays the JAXA/ViSHOP version of Arctic extent, so here too is JAXA’s own graph of the current sea ice extent:
It doesn’t look as though the 2023 maximum has been achieved yet, but extent on March 1st was 14.01 million km². That is evidently not going to be the lowest in the satellite era!
[Edit – March 8th]
As Tom has already mentioned below, JAXA extent has declined significantly since the (so far!) peak extent of 14.12 million km² on both the 2nd and 3rd of March:
It’s too soon to be certain of course, but we certainly now have a good candidate for the 2023 maximum JAXA extent.
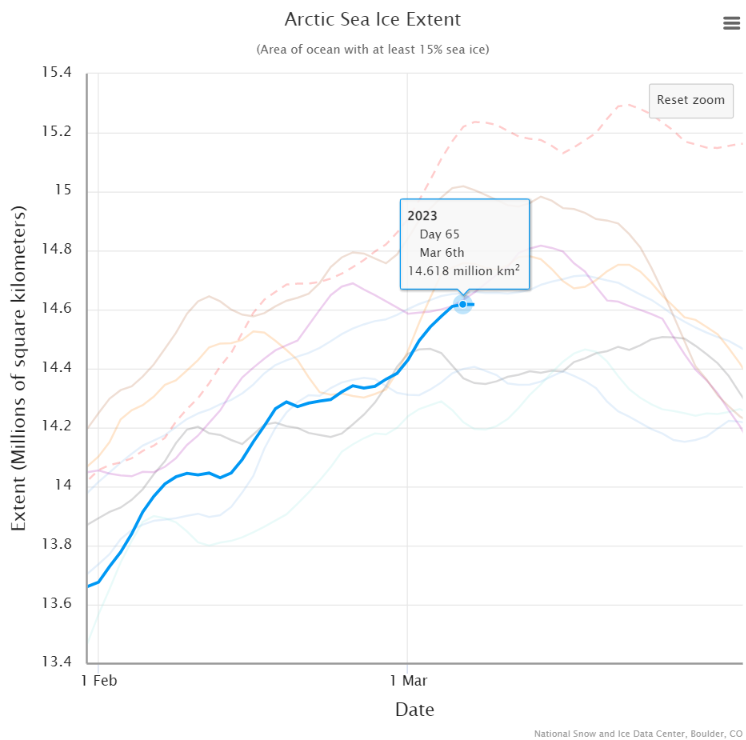
NSIDC 5 day averaged extent is still increasing, but let’s see what this afternoon’s update (UTC) reveals…
Which is a decrease of 0.001 million km² from March 6th, leaving a current NSIDC maximum extent of 14.62 million km²!
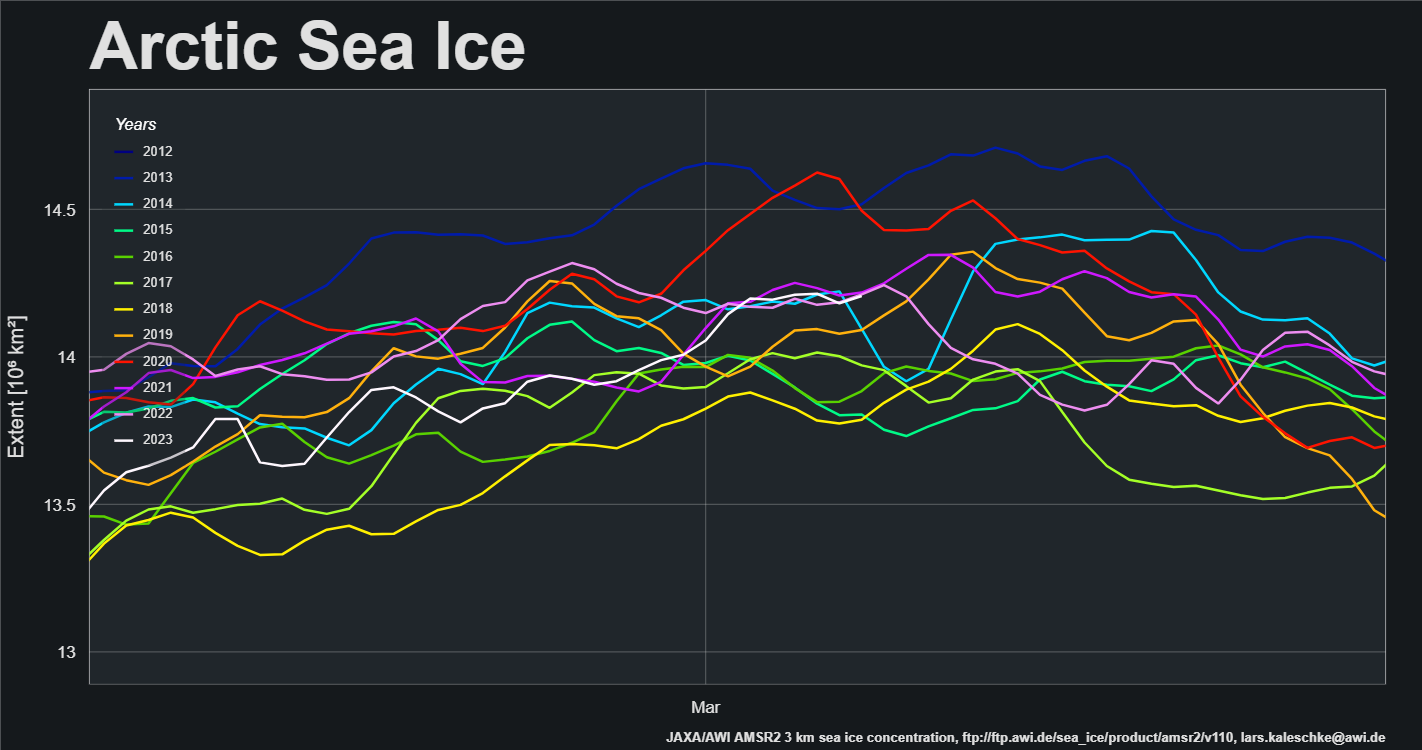
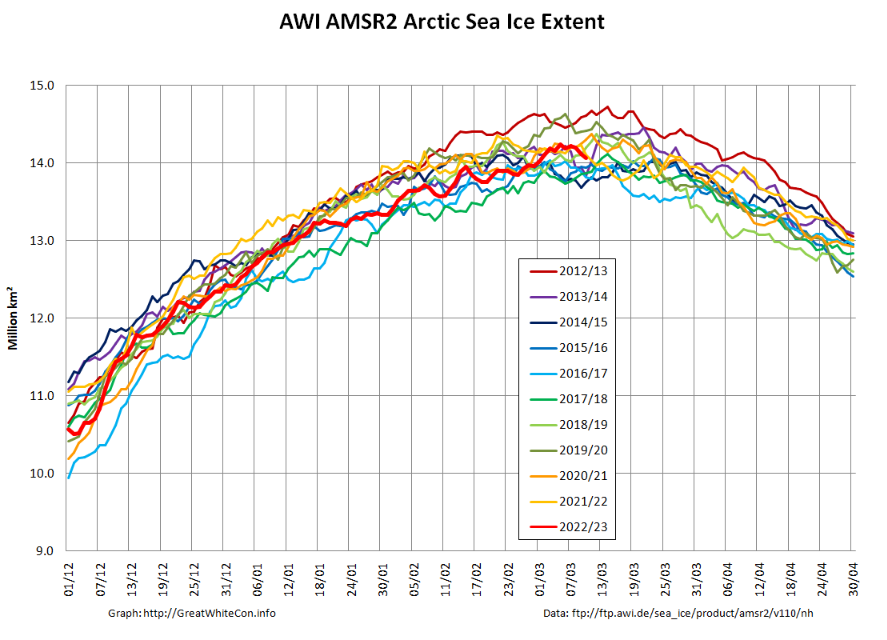
Finally, for the moment at least, AWI’s “high resolution” AMSR2 extent looks a lot less convincing than JAXA’s:
[Edit – March 11th]
NSIDC Arctic sea ice extent took a tumble yesterday, so with only mild trepidation I’m calling the 2023 maximum extent. In the case of the NSIDC’s 5 day average metric that’s still a rounded up 14.62 million km² on March 6th:
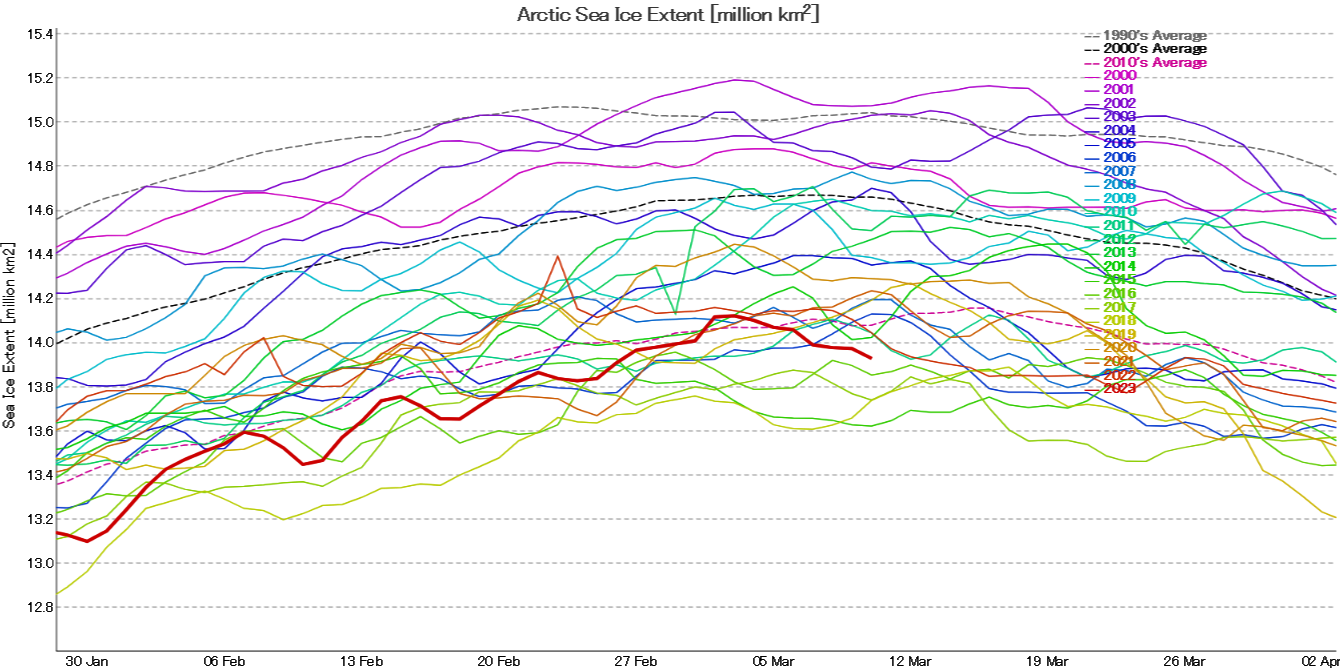
The JAXA/ViSHOP maximum extent remains at 14.12 million km² on March 2nd:
The “high resolution” AMSR2 based metric from AWI peaked at 14.24 million km² on March 5th:
[Edit – March 16th]
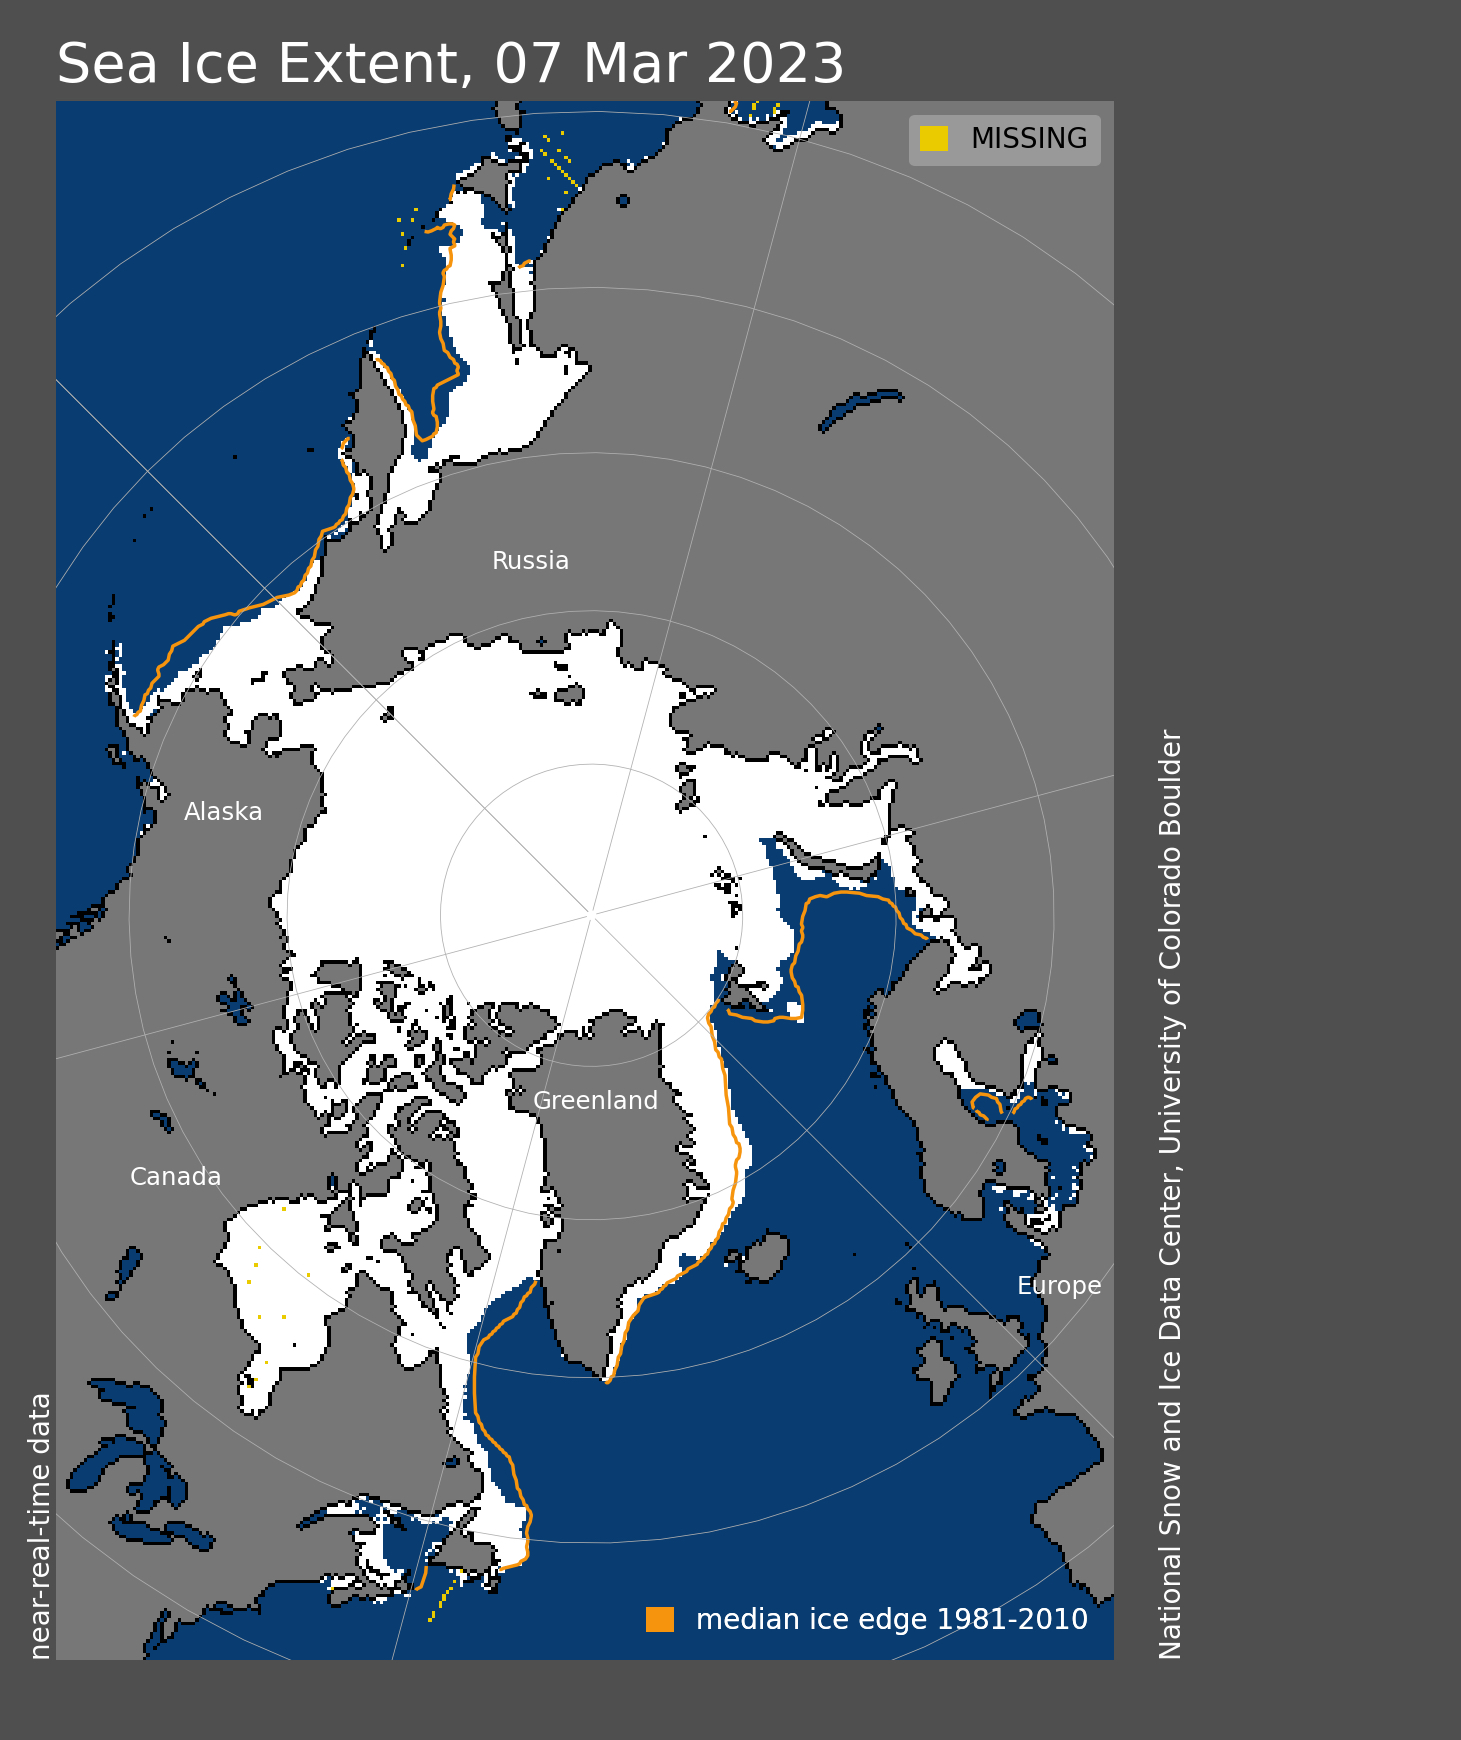
They are of course a bit late with the news, but the NSIDC have now called the 2023 maximum Arctic sea ice extent:
Arctic sea ice has likely reached its maximum extent for the year, at 14.62 million square kilometers (5.64 million square miles) on March 6. The 2023 maximum is the fifth lowest in the 45-year satellite record. NSIDC scientists will present a detailed analysis of the 2022 to 2023 winter sea ice conditions in the regular monthly post in early April:
The date of the maximum this year, March 6, was six days earlier than the 1981 to 2010 average date of March 12…
The ice growth season ended with below average sea ice extent in the Bering Sea, Sea of Okhotsk, Barents Sea, and Labrador Sea. Above average extent was in the Greenland Sea. Extent was well below average in the Gulf of St. Lawrence for a second year in row.
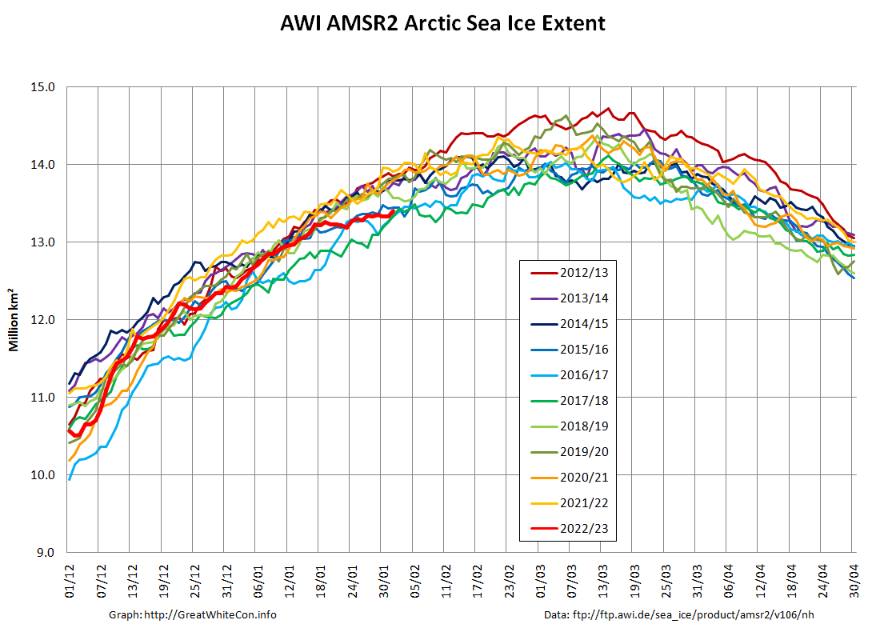
A new month has arrived, and during January several Arctic sea ice metrics have been drifting towards the bottom of their respective decadal ranges. To begin with here is AWI’s high resolution AMSR2 extent graph, which is currently very close to being lowest for the date in the AMSR2 record:
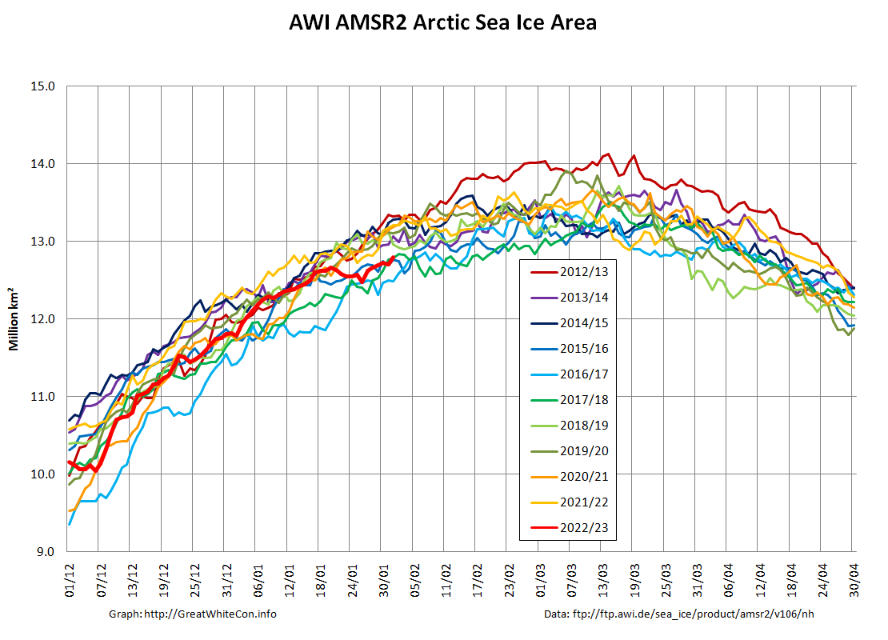
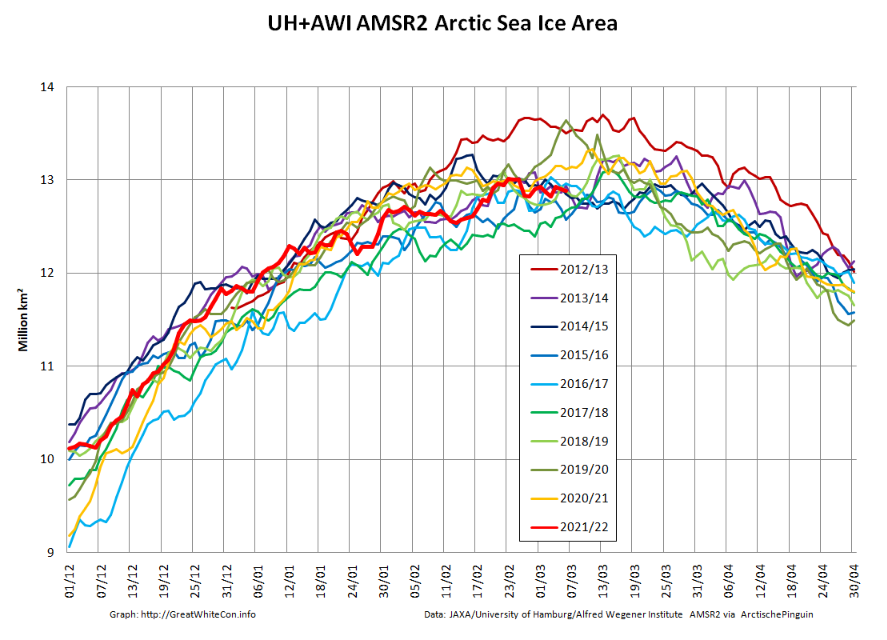
However that is less the case for area:
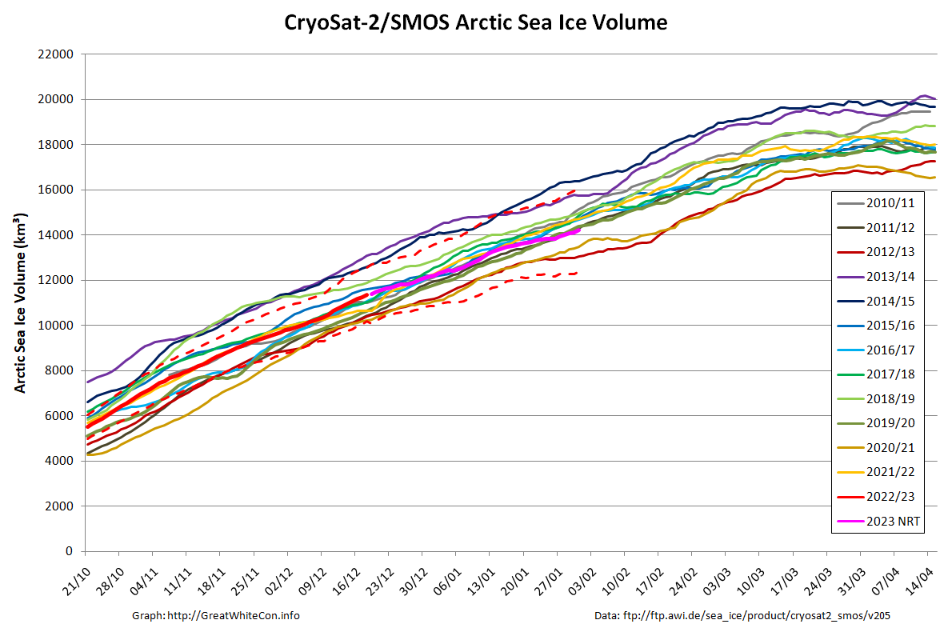
Taylor is keen to see the PIOMAS volume data for January, but whilst we wait for the latest Polar Science Center update here is the CryoSat-2/SMOS volume graph, which now includes a couple of month’s worth of reanalysed results as well as more recent near real time numbers:
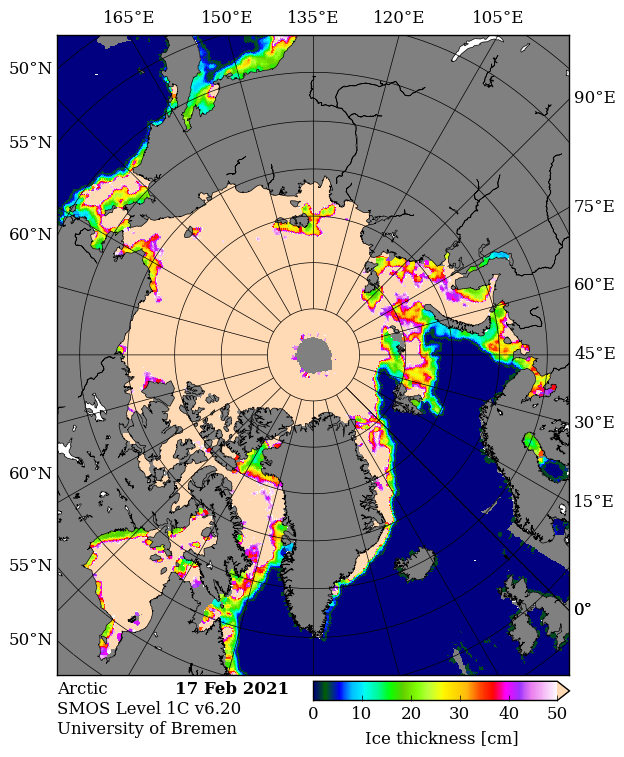
Here too is the start of month CS2/SMOS thickness map:
For detailed analysis of Arctic sea ice extent over the next few weeks please see the 2022 maximum extent thread. However to get the new open thread going here is the current JAXA/ViSHOP extent graph:
It’s looking more and more as though the real maximum for 2022 occurred close the false peak on February 23rd.
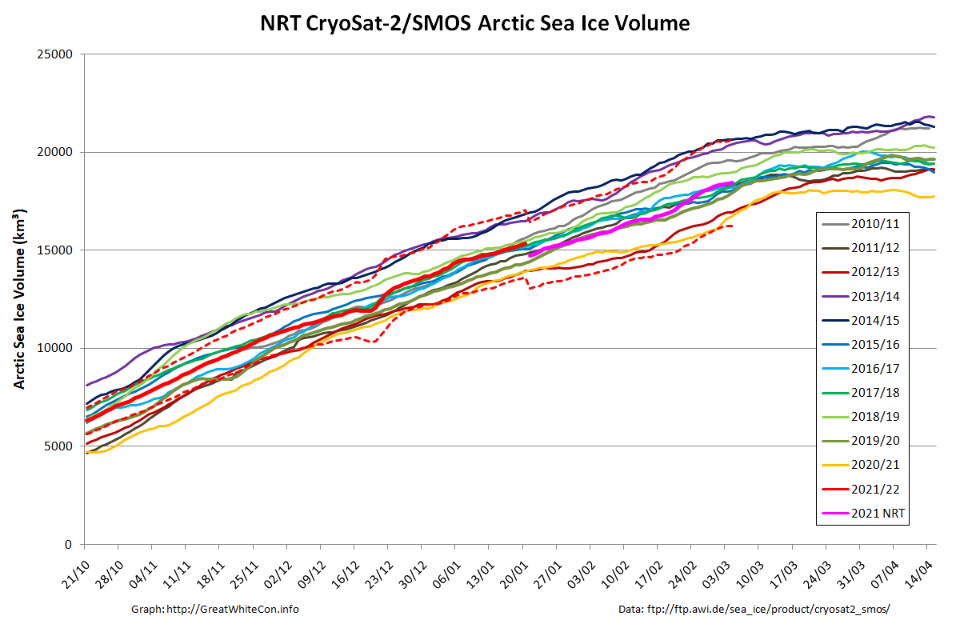
Arctic sea ice volume will keep increasing for a while longer. Here is the current AWI CryoSat-2/SMOS volume graph:
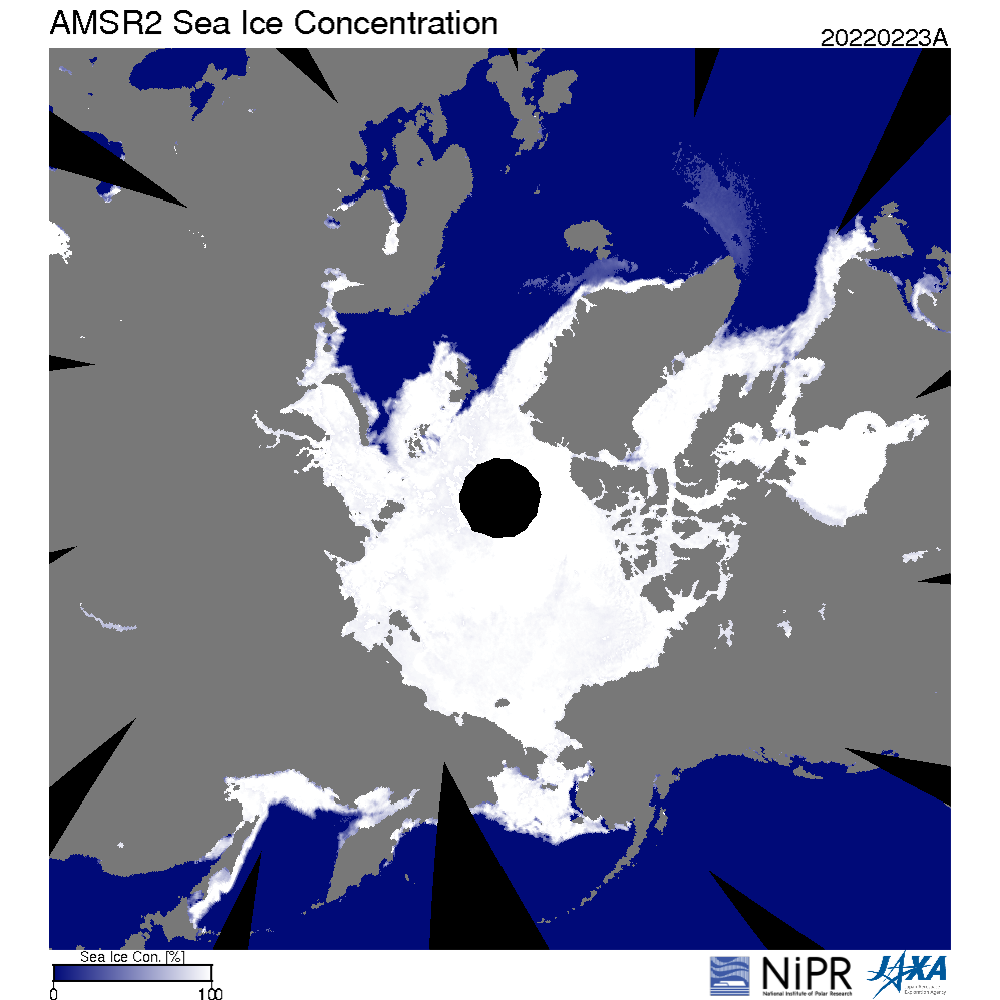
The recent “flat line” in extent is in part due to recent events on the Pacific periphery of the Arctic. Take a look at this animation of AMSR2 sea ice concentration:
The gap varies depending on how the wind blows, but there is still evidence of open water (or very thin ice) along the shore of the Beaufort and Chukchi Seas. Here’s the Mackenzie Delta and the adjacent Beaufort Sea on March 5th:
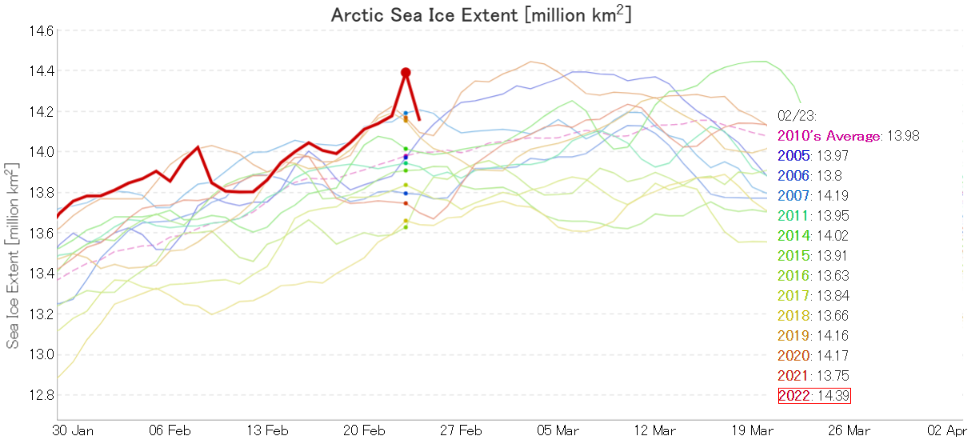
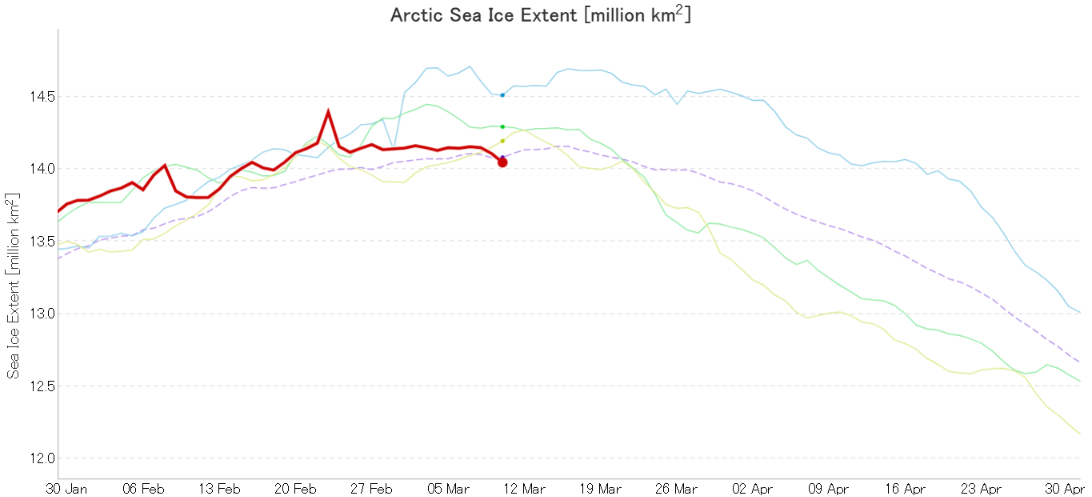
Here’s the latest graph of Arctic sea ice extent from JAXA/ViSHOP, which looks a bit unusual to say the least:
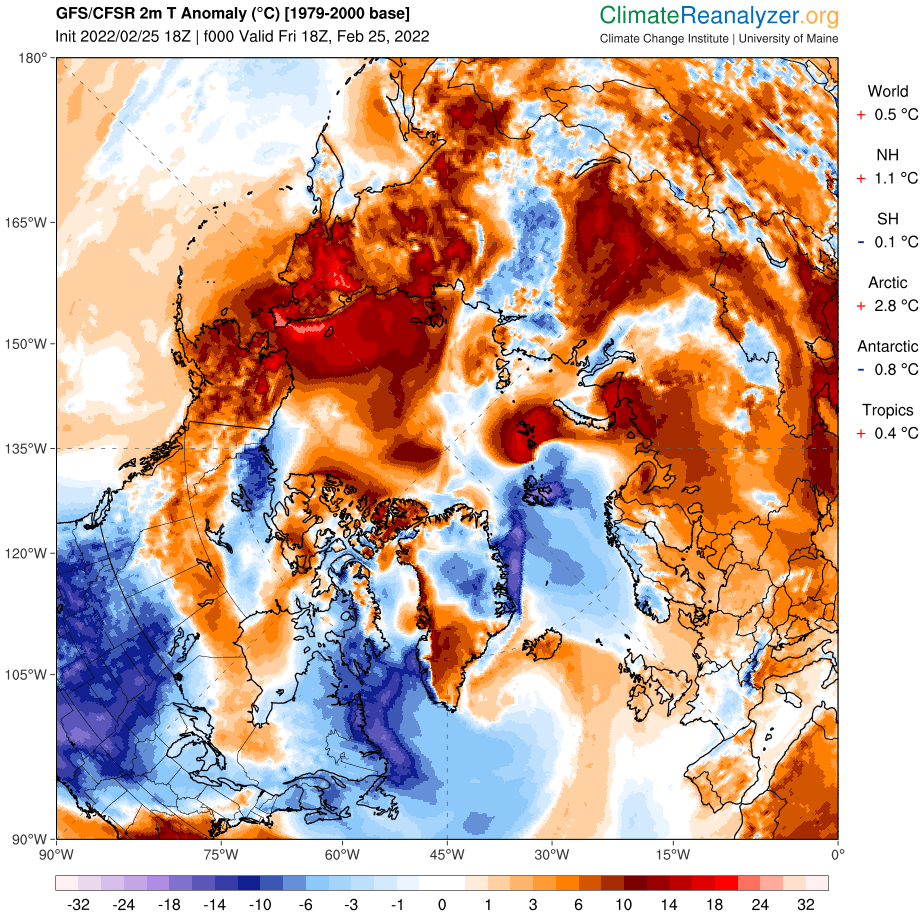
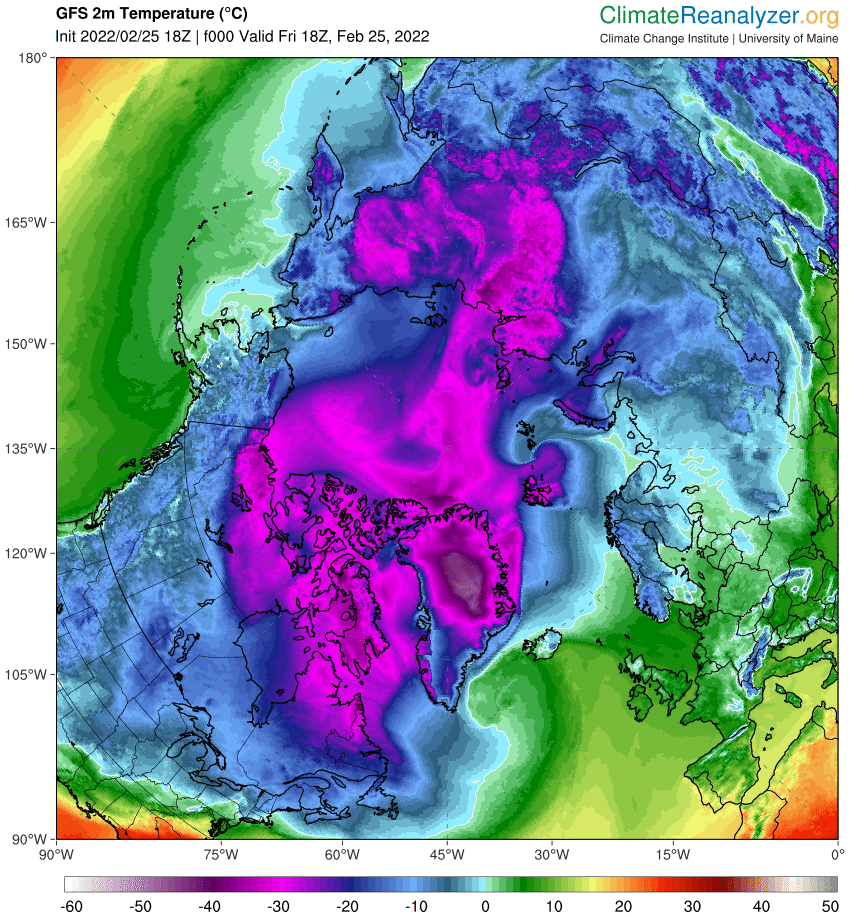
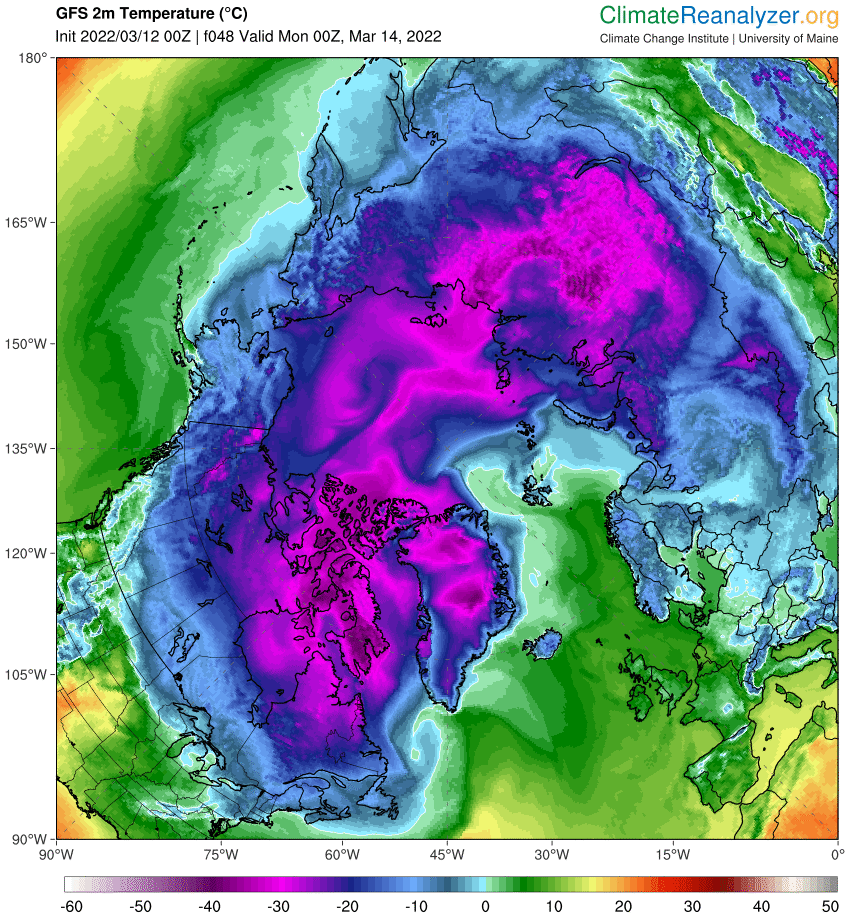
It certainly caught my eye! Could that sudden peak on February 23rd be the maximum extent for the year? To be frank it looks more like an artifact in the underlying gridded AMSR2 concentration data, but it’s not wholly beyond the bounds of possibility. The Pacific side of the Arctic is anomalously warm at the moment:
and parts of the Bering Sea are above freezing point:
For the moment then the (extremely!) provisional JAXA Arctic sea ice maximum extent for 2022 is 14.39 million km².
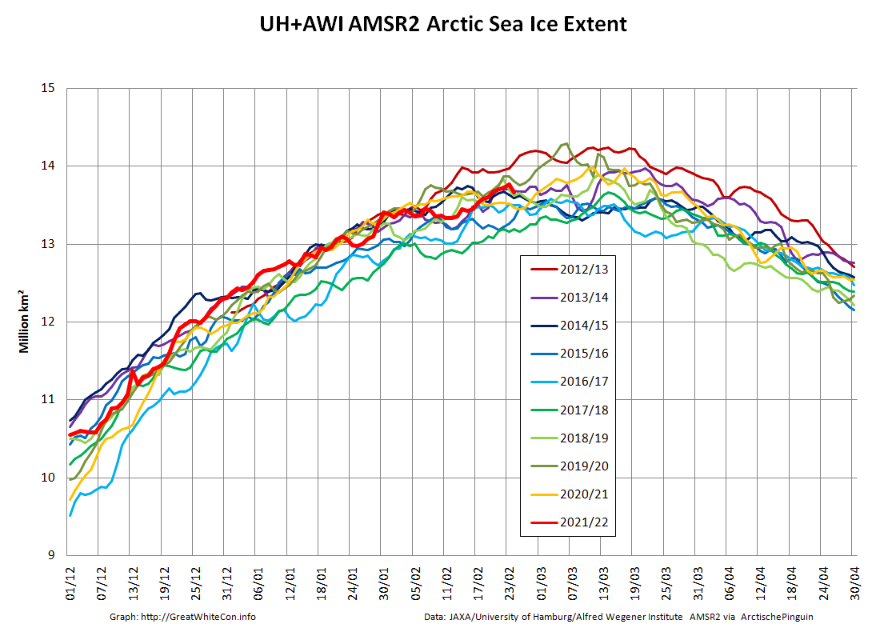
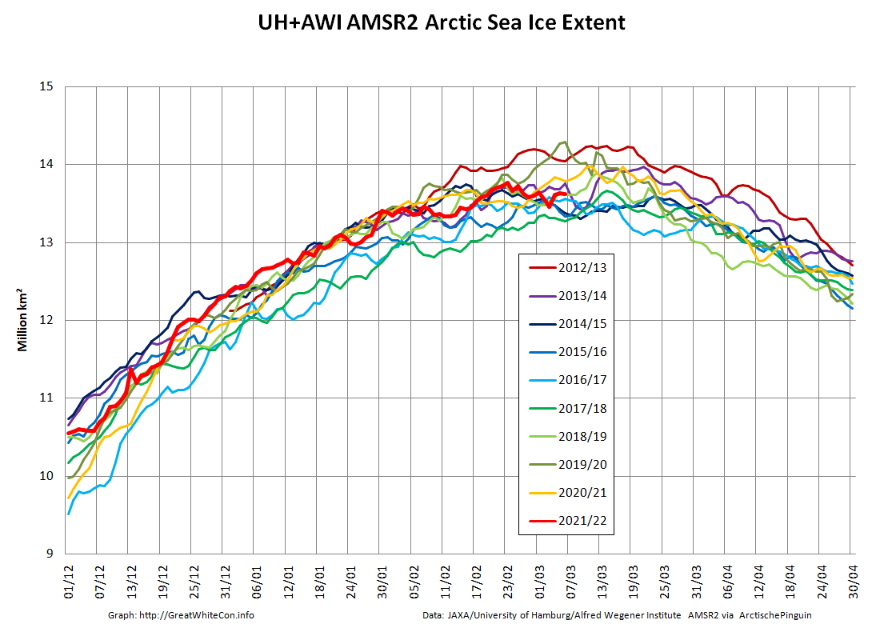
By way of an AMSR2 second opinion let’s also take a look at our favourite “high resolution” AMSR2 metrics, which combine recent data from the Alfred Wegener Institute with historical data from the University of Hamburg:
The extent peak on the 23rd is of much smaller magnitude, and it’s almost non existent on the area graph.
Curiouser and curiouser.
[Edit – March 1st]
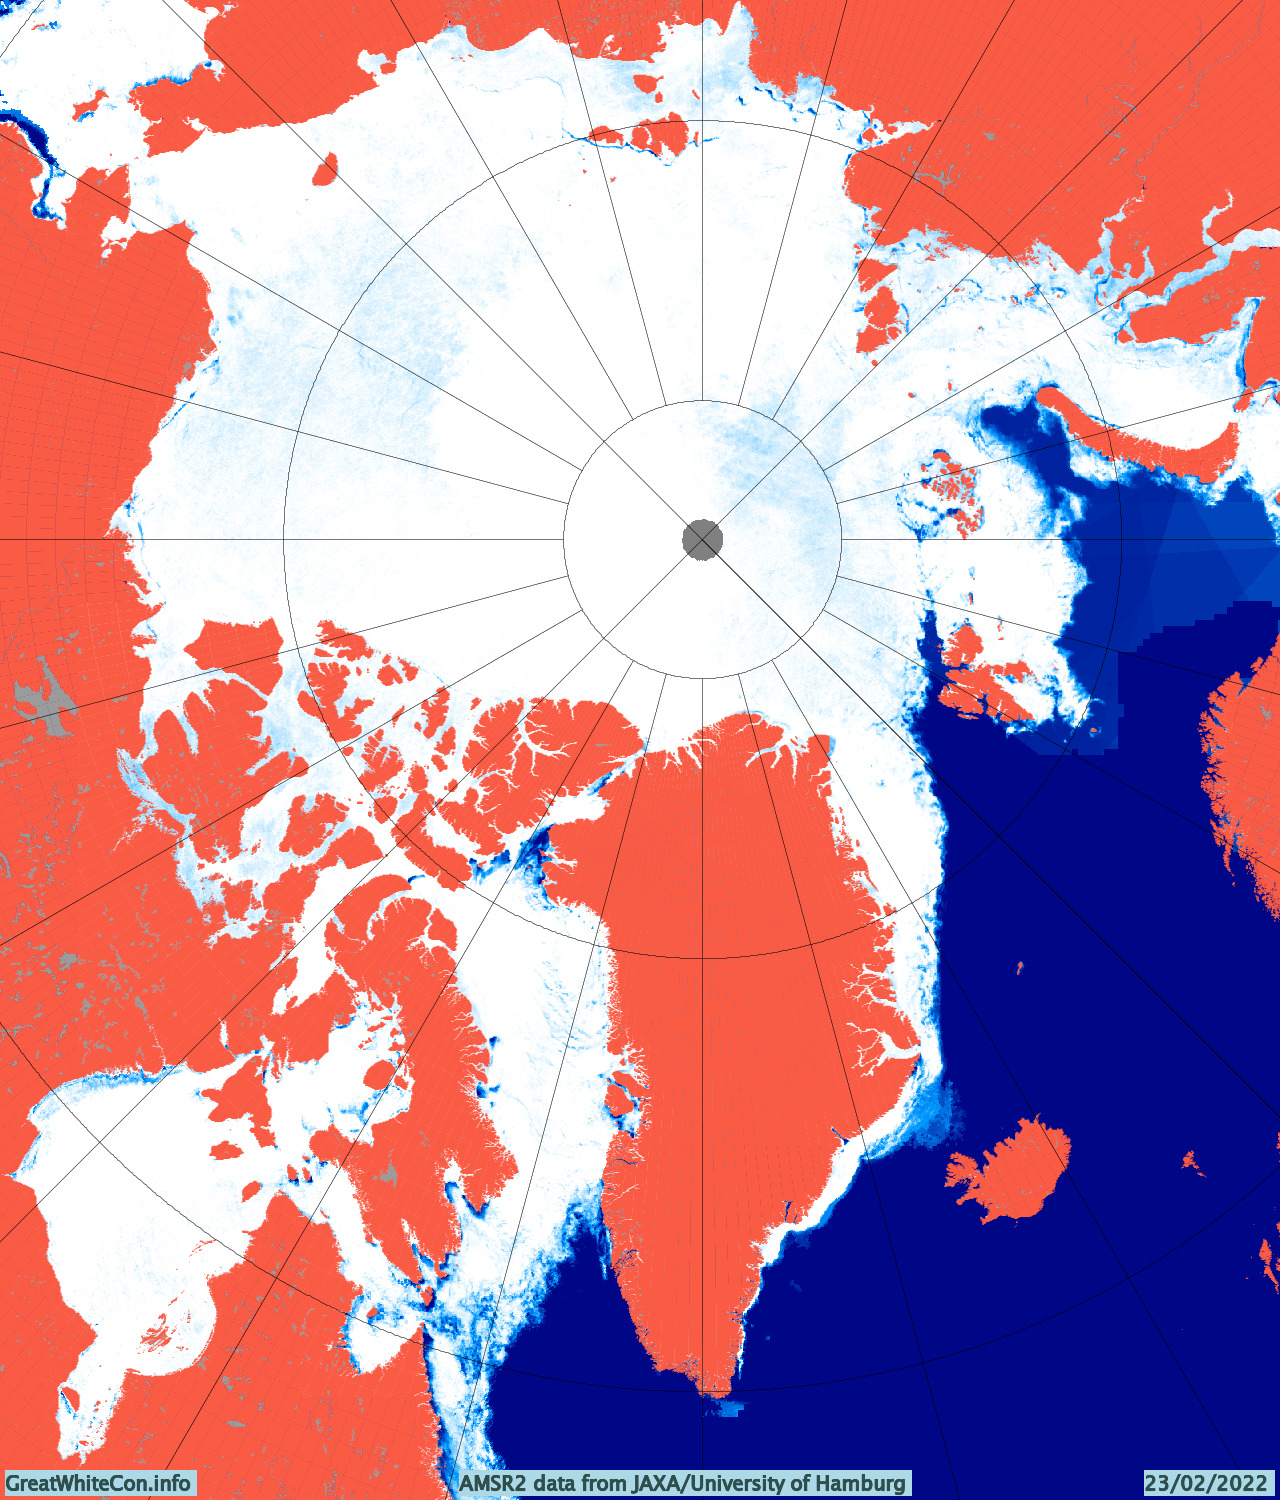
The JAXA maximum on February 23rd is definitely an artifact of dodgy AMSR2 data. Take a look at the Denmark Strait between Greenland and Iceland in particular:
The University of Hamburg version also shows an anomaly in the Barents Sea:
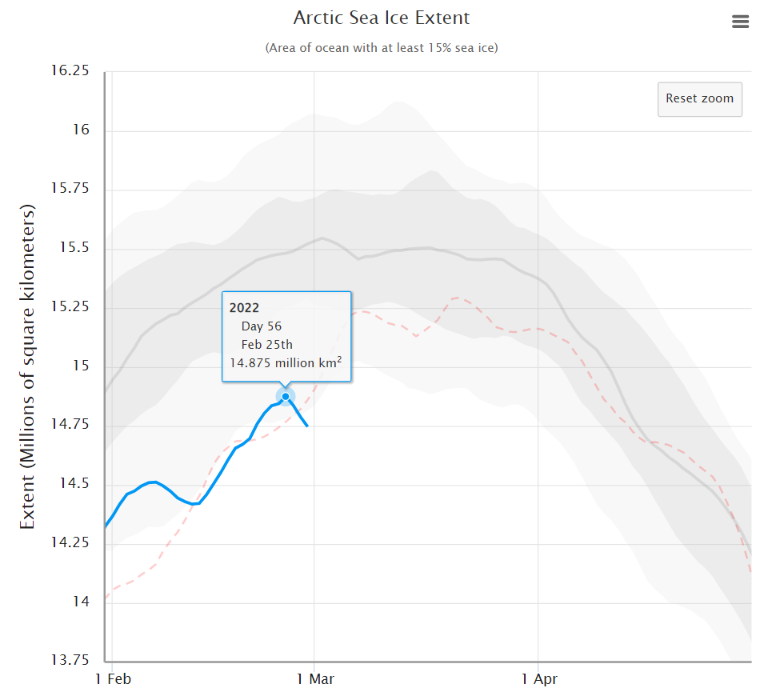
However the 5 day averaged NSIDC extent graph now shows a significant peak on February 25th:
Is anybody willing to put money on 14.875 million km² just yet?
[Edit – March 7th]
Here are the latest “high resolution” AMSR2 graphs:
The February 23rd maximum holds, for the moment at least.
[Edit – March 11th]
Here’s the latest JAXA Arctic sea ice extent graph:
A late surge is now looking exceedingly unlikely. However given that the maximum seems to have occurred during the brief period of dodgy data around February 23rd, what magnitude and date should be assigned to the 2022 maximum?
Whilst I ponder that thorny problem…
[Edit – March 12th]
Now I’ve really gone and done it! Started the “2022 melting season” thread on the Arctic Sea Ice Forum that is:
Arctic sea ice has likely reached its maximum extent for the year, at 14.88 million square kilometers (5.75 million square miles) on February 25. The 2022 maximum is the tenth lowest in the 44-year satellite record. On the same day, on the other pole, Antarctic sea ice reached a record minimum extent, at 1.92 million square kilometers (741,000 square miles).
The date of the maximum this year, February 25, was fifteen days earlier than the 1981 to 2010 average date of March 12. Only two years had an earlier maximum, 1987 and 1996, both on February 24. This year is the second earliest date on the satellite record, tying with 2015, which also reached its maximum extent on February 25.
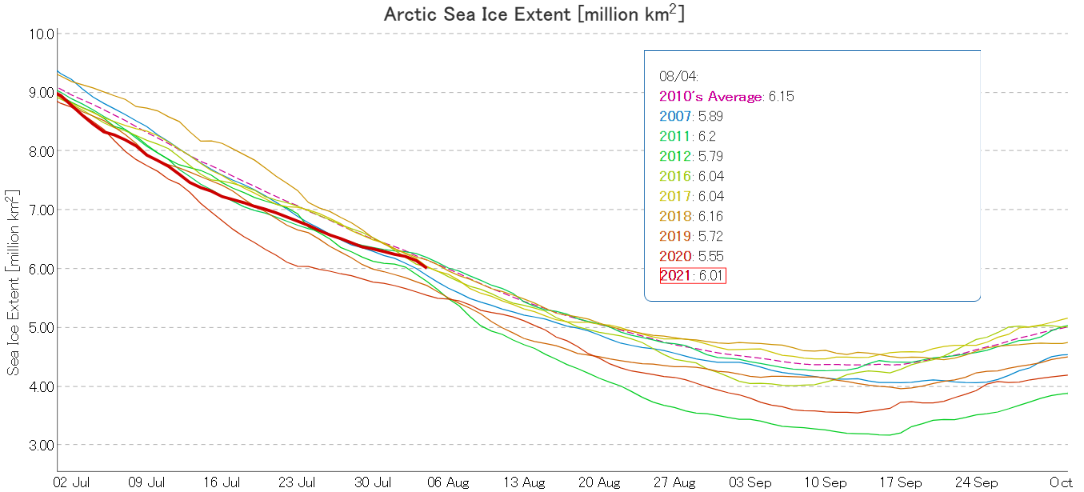
The results of the ARCUS Sea Ice Prediction Network August call have been released, and here is the outlook for the 2021 minimum September mean Arctic sea ice extent:
The median prediction for the mean sea ice extent during the month of September 2021 is 4.39 million km2. According to ARCUS:
As of 22 August 2021, the Arctic sea-ice extent was 5.58 (compared with 25 August 2020 value of 4.43) million square kilometers. Arctic sea-ice extent in 2021 remains well below the climatological median and has closely followed the 2012 values for much of the summer but has diverged to higher sea-ice extent starting in early August. The forecasts continue to support September 2021 mean sea-ice extent being well above the September 2020 value. July sea-ice retreat has been greatest in the Eurasian seas, particularly in the East Siberian Sea, making the 2021 ice edge well north of the long-term median edge in Eurasia. Sea ice retreated since the end of July along the northern coast of Alaska, although the ice edge is near its climatological position, which makes the Beaufort and Chukchi sea ice extent the largest at this time of year since 2006. A tongue of sea ice that has been present all summer continues to extend close to land in the Kara Sea, making the northeast passage likely to remain blocked for the first time in several years. Half the models which provide spatial data to the SIO predict that the tongue is likely to survive.
Now let’s take a look at a range of assorted extent measurements. Here’s the NSIDC’s 5 day average extent:
Let’s first of all take a look at JAXA’s flavour of Arctic sea ice extent:
After reaching lowest extent for the date in early July, the weather in the Arctic Basin was stormy, cloudy and cool compared to other recent years until the last few days of the month:
Here’s the same period in 2020 for comparison purposes:
Consequently the rate of extent loss in the second half of July was significantly less than last year.
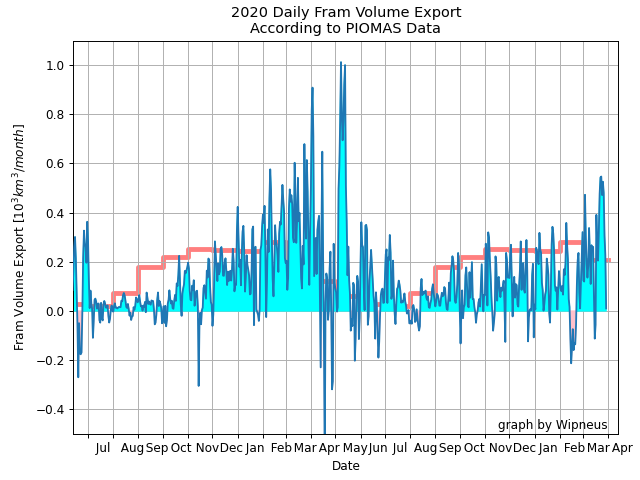
As part of his March PIOMAS gridded sea ice thickness update Wipneus also produced this graph of sea ice export from the central Arctic via the Fram Strait:
So far this winter export has been remarkably subdued, but that has now changed. A persistent dipole with high pressure over Greenland and low pressure over the Barents Sea is generating strong northerly winds in the Fram Strait, and even bringing some April snow showers to South West England:
Wondering why it's so #cold? We're still sat in Arctic air across the UK today
A change to milder #weather arrives tonight for Thursday and Friday, bringing temperatures much closer to average
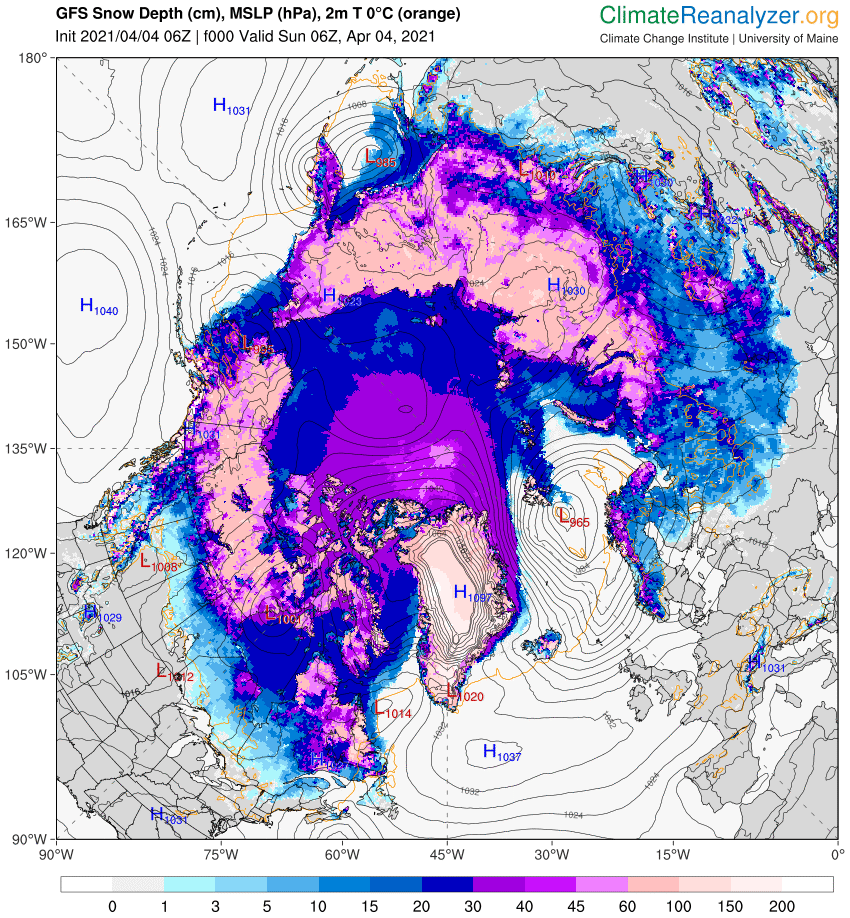
Precisely how high the pressure has been over Greenland is the subject of much debate. See for example this discussion on the Arctic Sea Ice Forum about whether a new world high pressure record has just been set. Different weather forecasting models have come to very different conclusions about the mean sea level pressure of a high pressure area situated over the Greenland ice sheet, which reaches an altitude of over 3,000 metres. Here’s GFS for example, showing 1097 hPa at 06Z on April 4th:
whereas the Canadian Meteorological Centre synopsis for the same time shows a mere 1070 hPa:
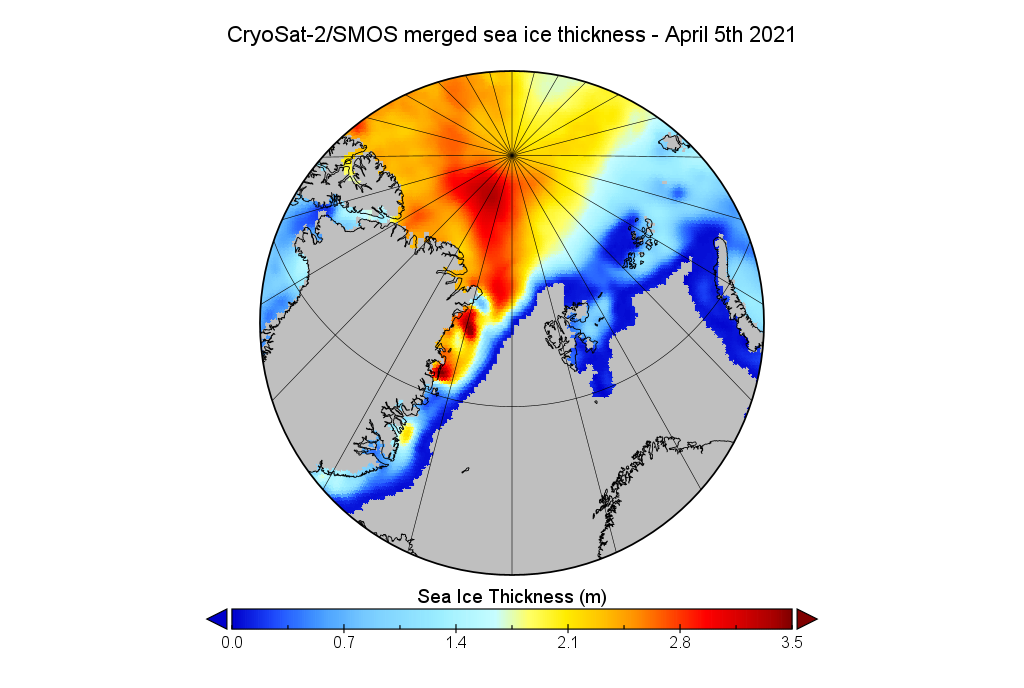
At least all the assorted models agree that the isobars are closely packed over the Fram Strait, and hence some of the thickest sea ice remaining in the Arctic is currently heading towards oblivion in the far north Atlantic Ocean:
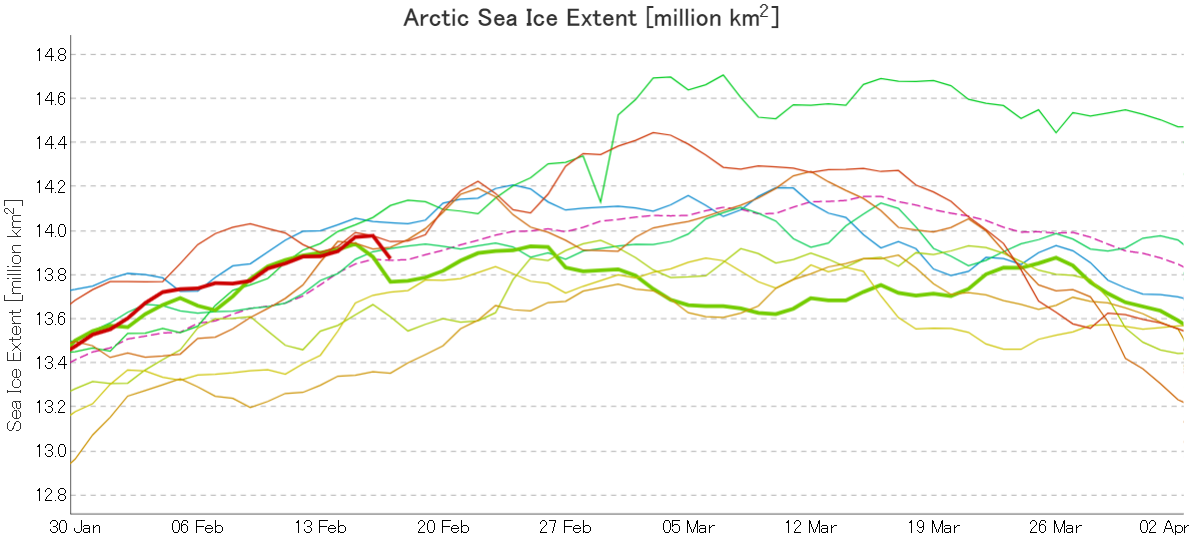
Here’s the latest graph of Arctic sea ice extent from JAXA/ViSHOP, with 2021 and 2015 highlighted:
Extent fell by over 100,000 square kilometres between February 16th and 17th! Can that steep fall continue, as it did for one more day in 2015?
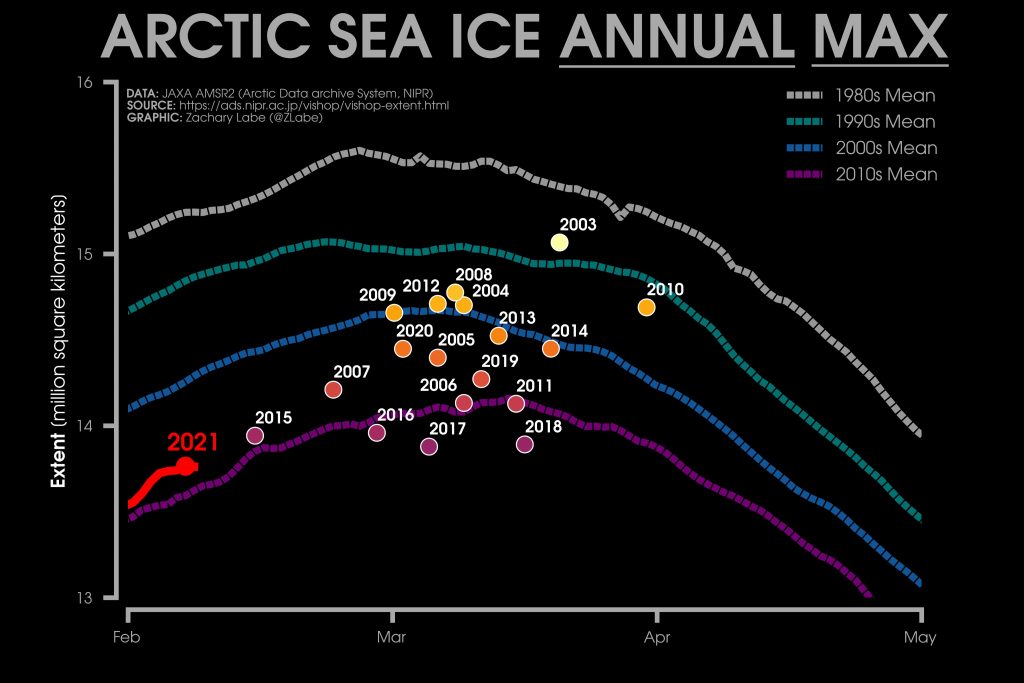
Here too is Zack Labe’s 2021 overview of JAXA maximum extent over the previous couple of decades:
2015’s maximum was very early, on February 15th. Hence the current extremely tentative 2021 maximum is already both higher and later than that. The decadal average extent graphs show the date of the maximum getting later and later, and the 2010’s peaks in the middle of March.
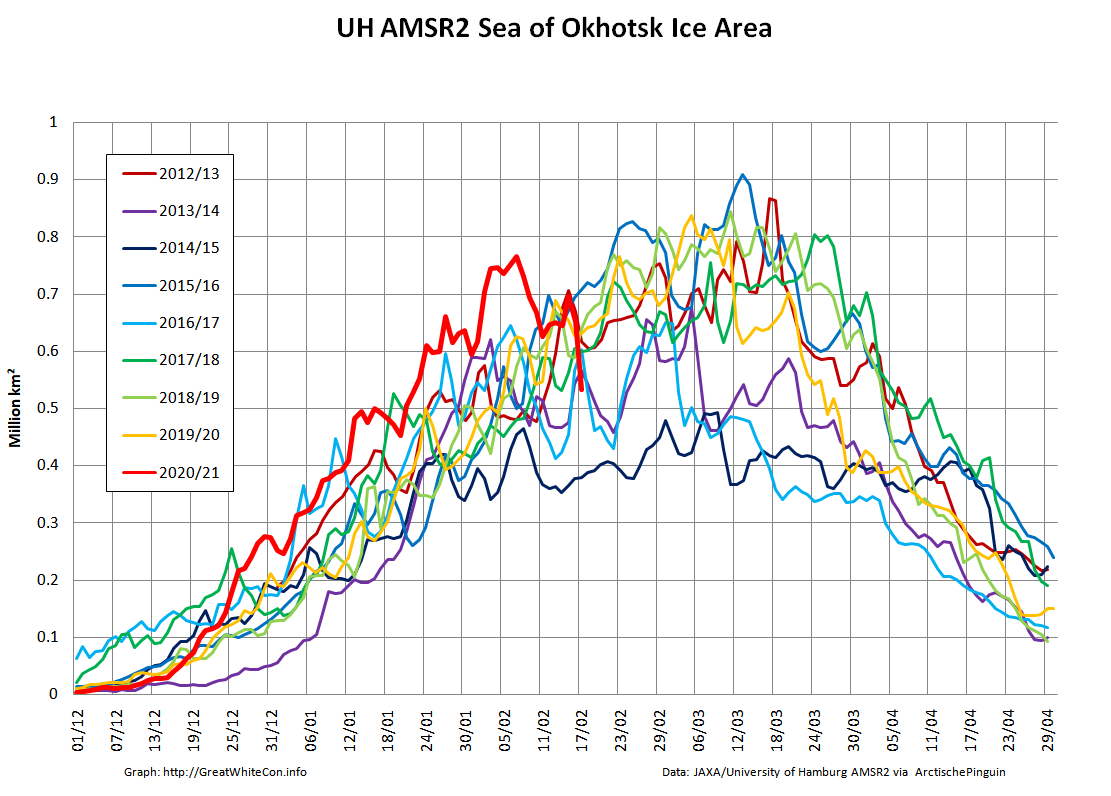
It therefore seems likely that there is more freezing still to come this year. However lets take a look at the high resolution AMSR2 sea ice area graph for the Sea Of Okhotsk:
The recent fall in Arctic wide extent has evidently been driven by the recent rapid decline in this peripheral sea, where SMOS reveals more thin ice ripe for further melting:
In conclusion, the high res AMSR2 extent metric shows the tentative 2021 peak below that of 2015!
This website uses cookies to improve your experience. We'll assume you're ok with this, but you can opt-out if you wish. Cookie settingsACCEPT
Privacy & Cookies Policy
Privacy Overview
This website uses cookies to improve your experience while you navigate through the website. Out of these, the cookies that are categorized as necessary are stored on your browser as they are essential for the working of basic functionalities of the website. We also use third-party cookies that help us analyze and understand how you use this website. These cookies will be stored in your browser only with your consent. You also have the option to opt-out of these cookies. But opting out of some of these cookies may affect your browsing experience.
Necessary cookies are absolutely essential for the website to function properly. This category only includes cookies that ensures basic functionalities and security features of the website. These cookies do not store any personal information.
Any cookies that may not be particularly necessary for the website to function and is used specifically to collect user personal data via analytics, ads, other embedded contents are termed as non-necessary cookies. It is mandatory to procure user consent prior to running these cookies on your website.