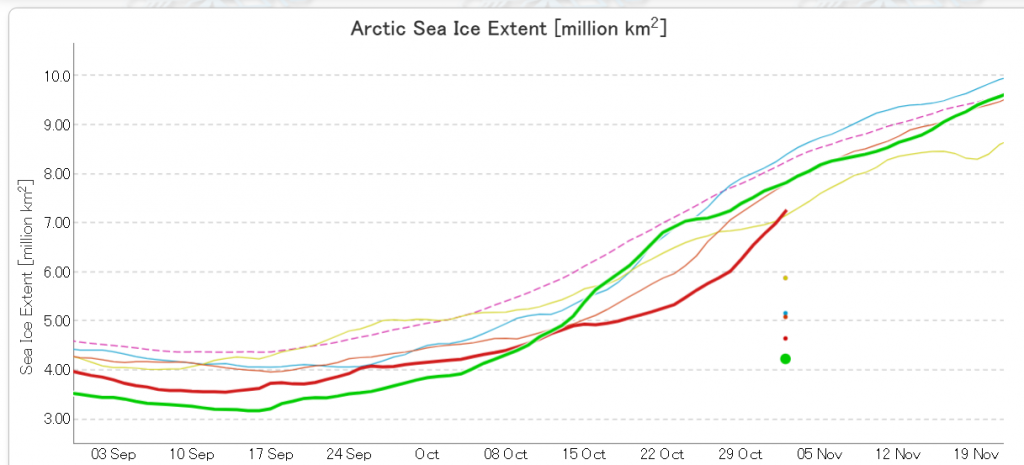
Arctic sea ice volume is of course far more important in the grand scheme of things. However sea extent is easier to measure, and the JAXA AMSR2 flavour thereof has now nudged into second place for the date above 2016:
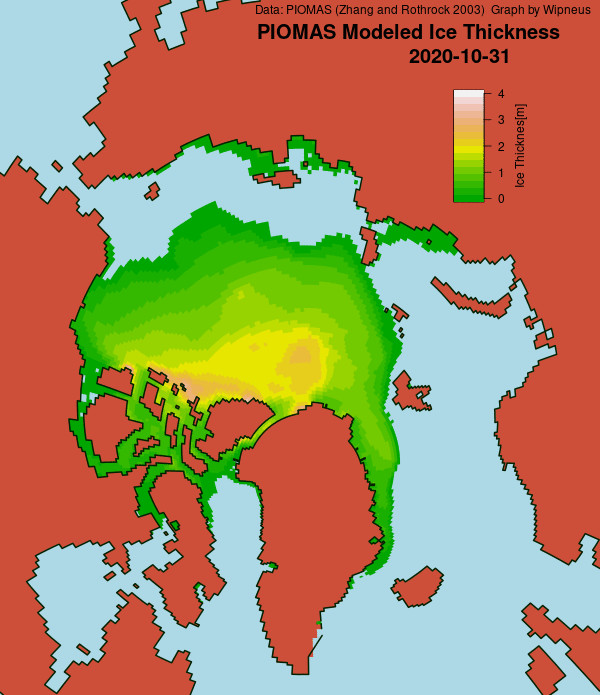
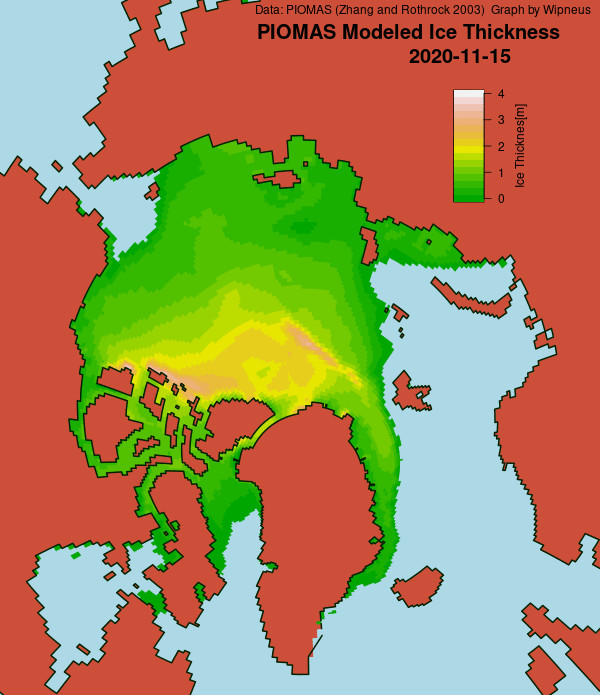
The PIOMAS gridded thickness numbers have been released, to reveal this end of October thickness map:
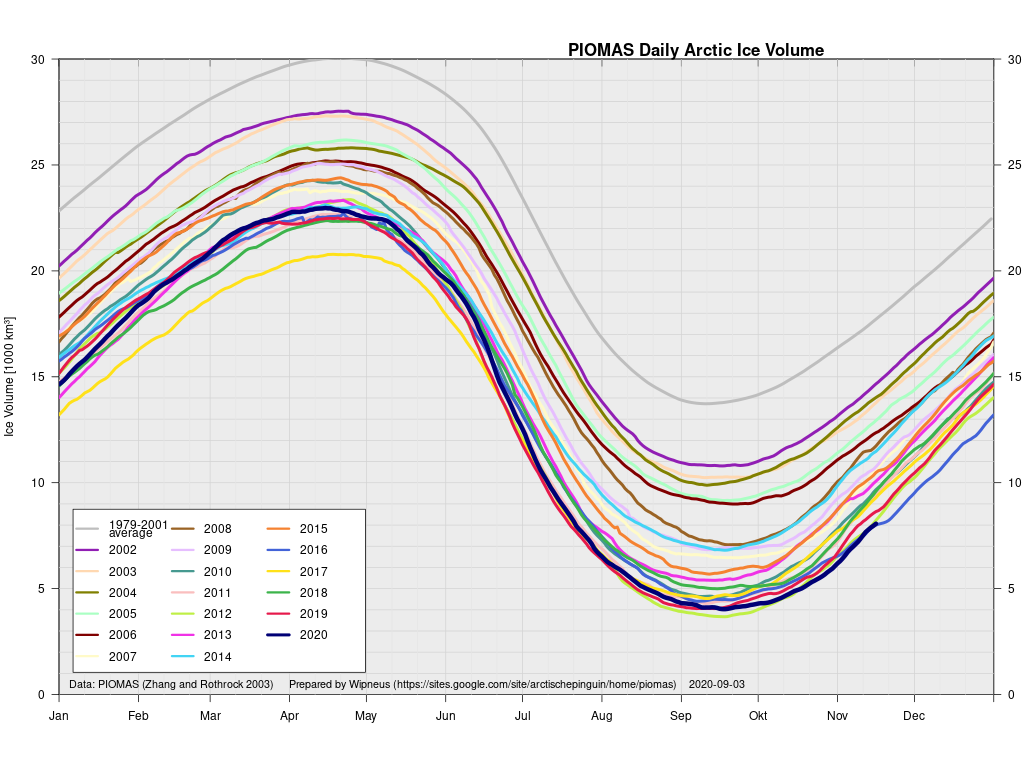
and these calculated volume graphs:
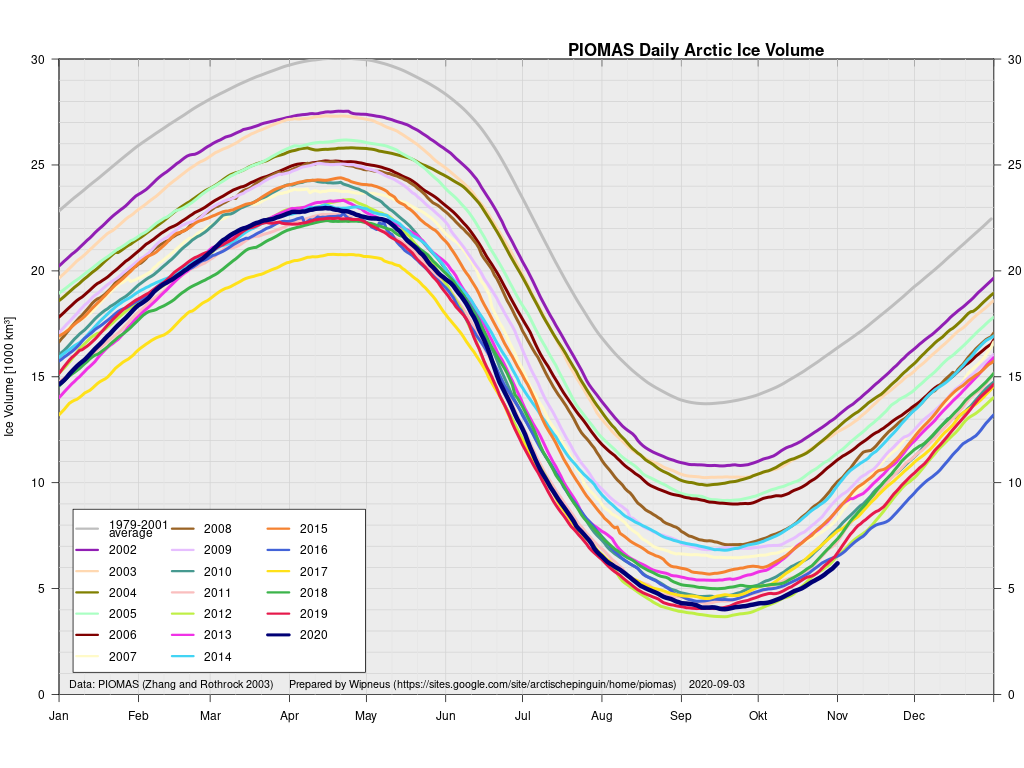
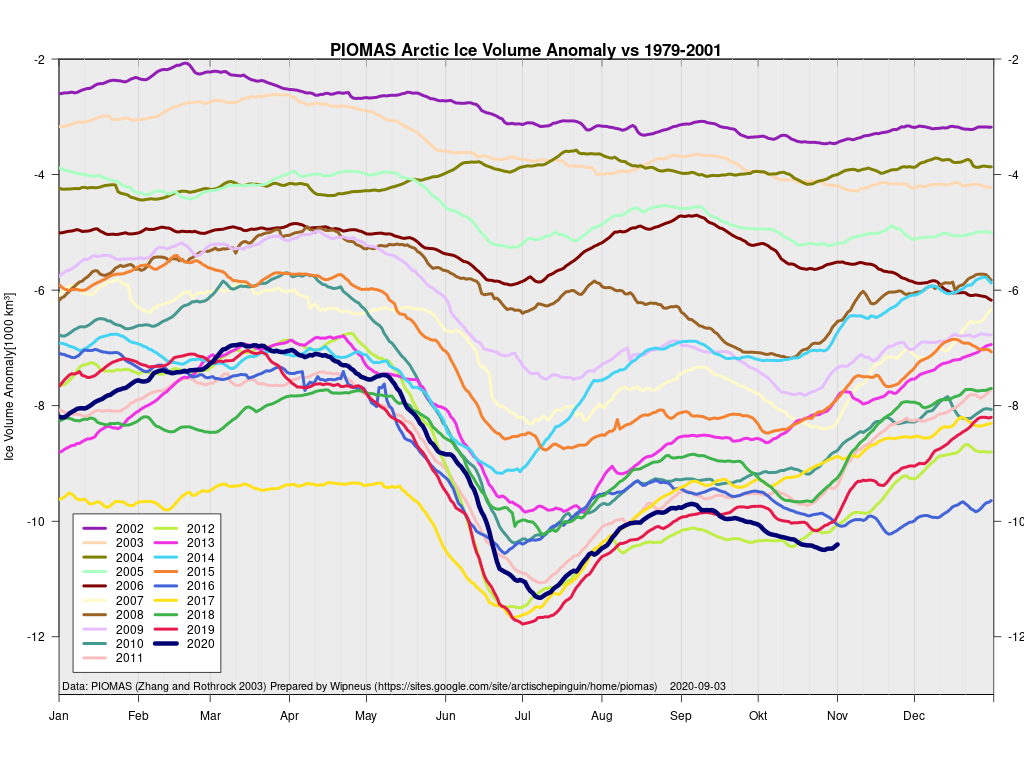
These show Arctic sea ice volume to be lowest for the date, even if extent has slipped into 2nd place.
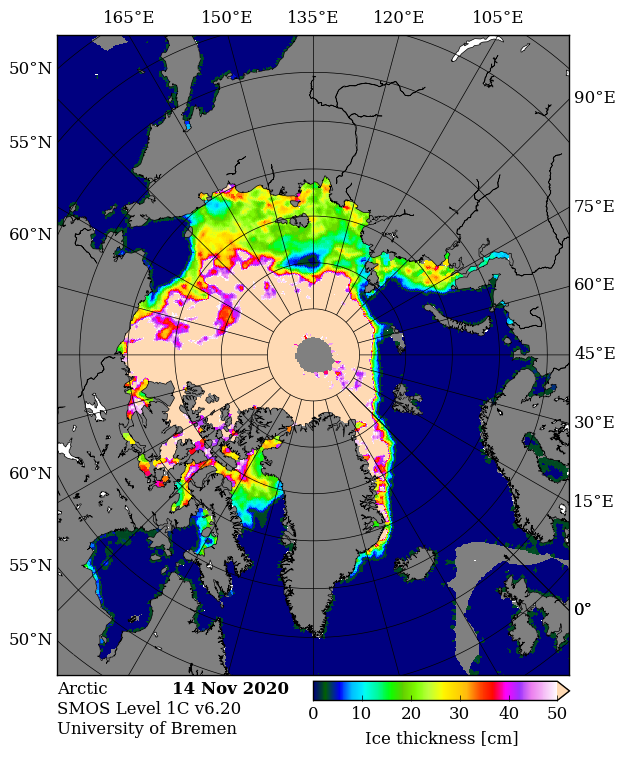
For comparison purposes here too is the latest AWI CryoSat-2/SMOS merged thickness map:
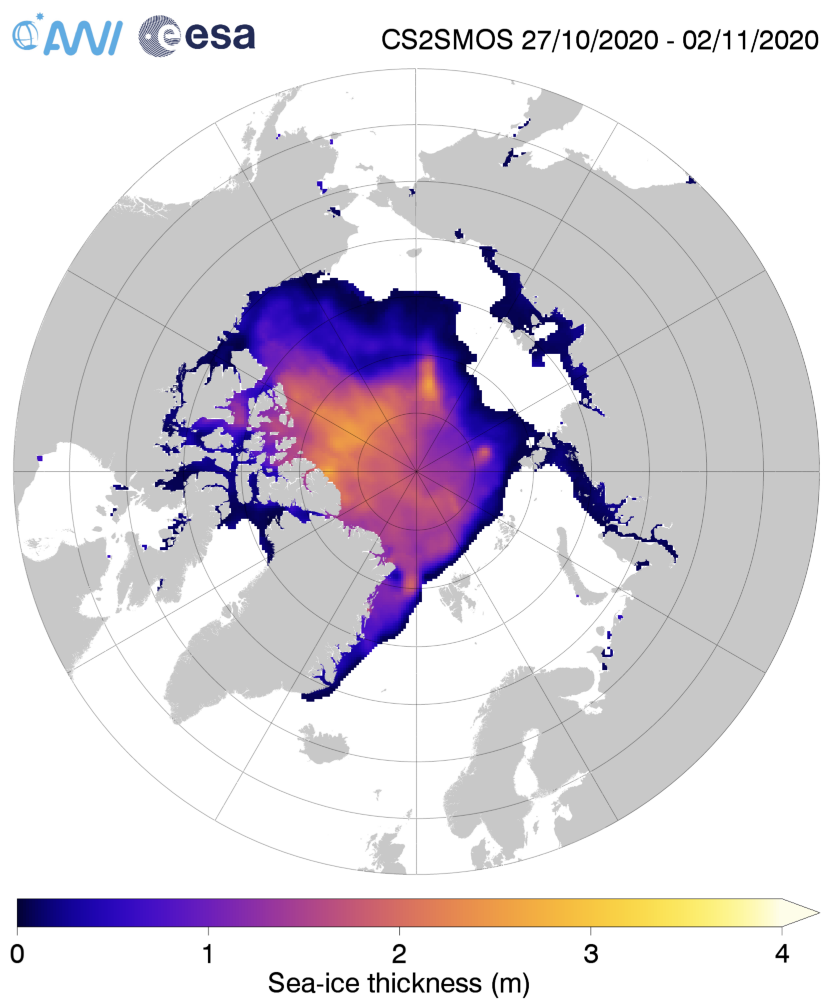
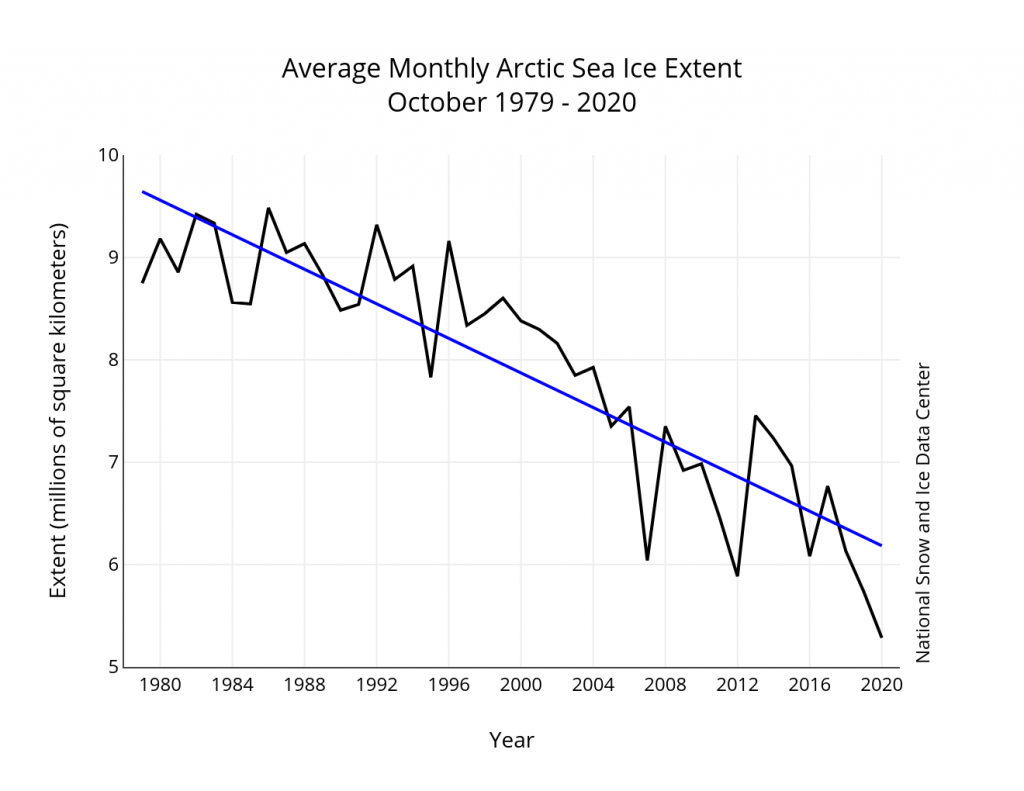
The latest edition of the NSIDC’s “Arctic Sea Ice News” has been published. Amongst other interesting information it reveals that:
Sea ice extent for October 2020 was 5.28 million square kilometers (2.04 million square miles), placing it lowest in the satellite record for the month. This was 3.07 million square kilometers (1.19 million square miles) below the 1981 to 2010 October average and 450,000 square kilometers (173,700 square miles) below the record low mark for October set in 2019. October 2020 is the largest departure from average conditions seen in any month thus far in the satellite record, falling 3.69 standard deviations below the 1981 to 2010 mean. Ice extent is far below average in all of sectors of the Eurasian side of the Arctic Ocean and in Baffin Bay.
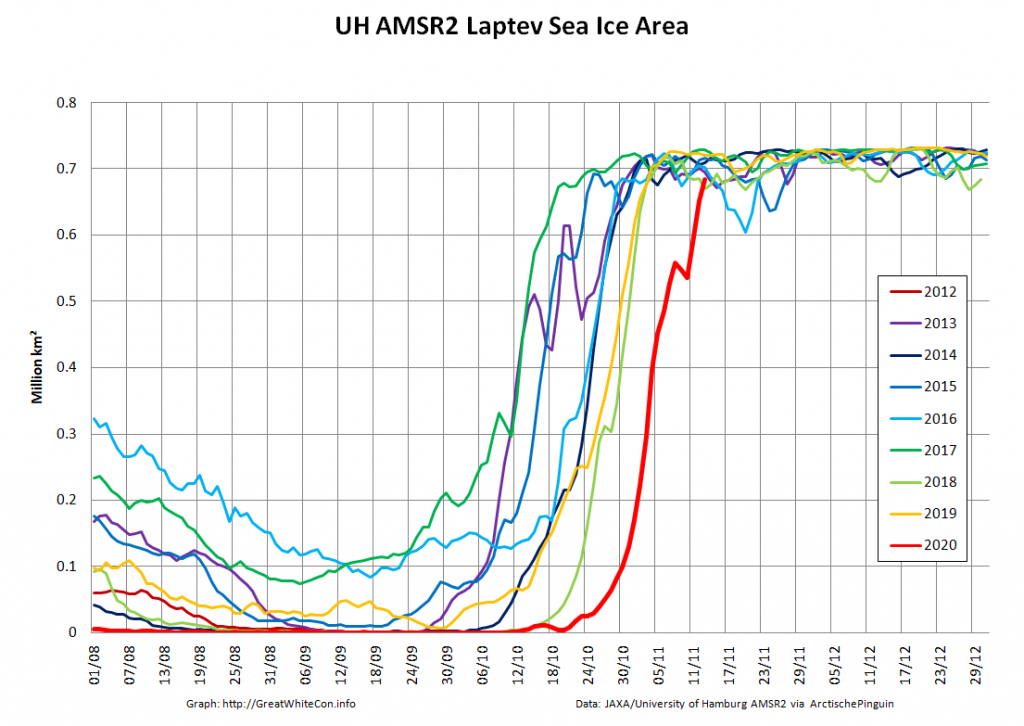
Laptev Sea ice area has finally reached a more “normal” value for the date:
However the “polynya” at ~80 N has still not yet closed:
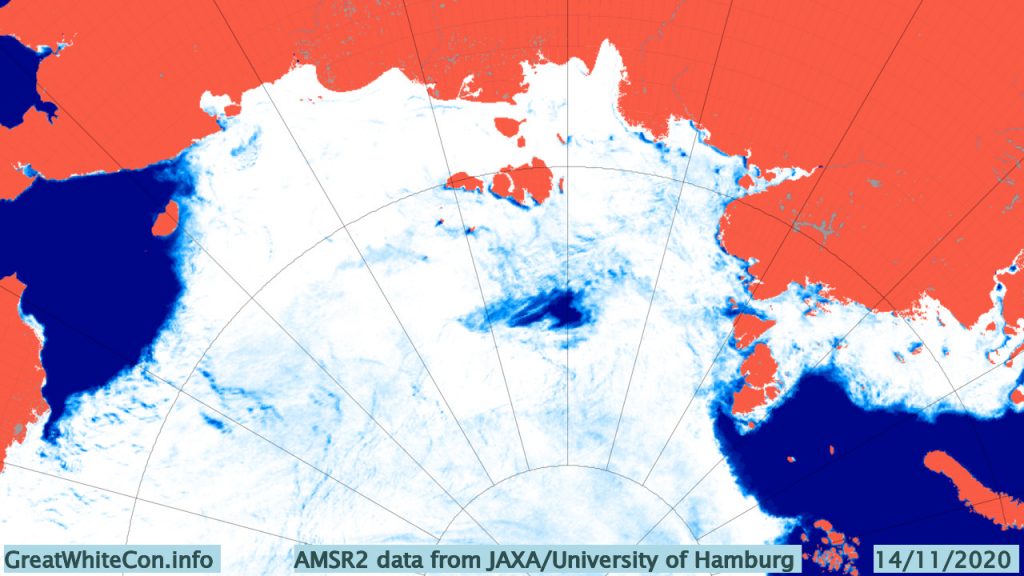
and the ice covering the entire Siberian side of the Arctic is still very thin:
The mid month PIOMAS gridded thickness numbers have been released, and Wipneus has crunched the numbers. Volume on November 15th reverted to 2nd lowest, just above 2016:
Moving on to the PIOMAS thickness map:
compare and contrast with the merged CryoSat-2/SMOS thickness data:
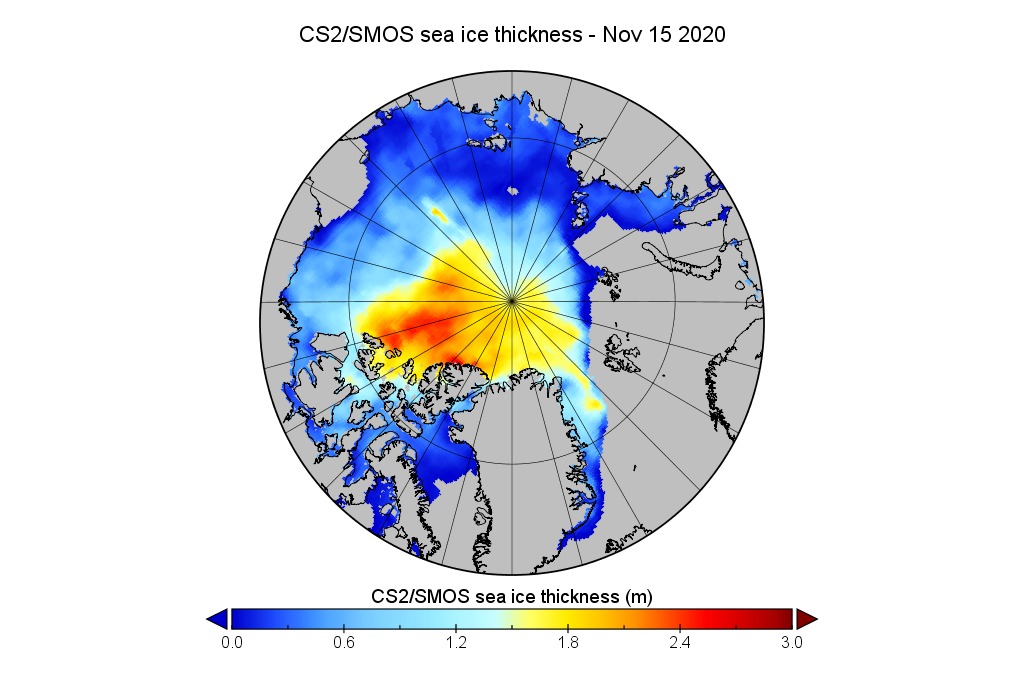
The area of thicker ice north of Greenland on the PIOMAS map seems to be absent from the CryoSat-2 data, although perhaps that’s an artifact of the CS2 “pole hole”?
October extent has been the ‘Tale of Two Halves’. Slower than usual the first half, faster than usual the second. I wonder if November will reverse the pattern. If so, maybe more than 2016 will be at risk. All that exposed water is shedding heat and volume seems to be growing rapidly as well (at least, per DMI daily graphs) but I guess we should wait for PIOMAS to speak.
Bear in mind that the Laptev Sea is the sea ice factory for the transpolar drift.
This is not normal:
Why should I bear in mind that the Laptev Sea is the sea ice factory for the transplant drift?
Transatlantic drift, obviously, lol
I mean, transpolar,… Once again: obviously
Not to speak for Jim, but I think he’s saying that normally, Laptev ice forms rapidly, gets pushed to the Pole, which increases the thickness/volume there, then more forms behind that, gets pushed, etc. If Laptev ‘factory’ is not working, then that has consequences later in the season.
However, since his comment in early November, the Laptev Sea rapidly closed in, and the pattern I suggested (rapid early, slow overall late) has occurred. DMI seems to think things are thick at the Pole, so maybe the factory is running, we’ll see when PIOMAS comes out.
Thanks, Taylor: makes sense now!
Merry Christmas to all everyone: what a DMI Temp graph to celebrate huh?!!?
Oh, let us also not forget the 1-day anomaly graph………… (Ho Ho Ho indeed!!!)
Yes, after a very cold spell with temps near -30C, DMI now shows (relatively) warmer air flooding in. There is nothing above 80N to have warmed that air, so it had to come from somewhere else. The (relative) heat will dissipate up the Arctic ‘chimney’ to outer space, with overall effect being cooling the planet more. Expect more ice to follow.
And BTW, Merry Christmas (and Boxing Day) to you as well.
“………………AND A HAPPY NEW YEAR…………….. “
Well, PIOMAS report on December is in, the net, net is more rapid ice formation during December kept volume ahead of the 2016 low, and the year 2020 came in third over all. But in a telling comment, the 11 year trend of PIOMAS and Cryostat is essentially flat (no detectable trend). This is consistent with other measures in the Arctic over the last 10 years, but as the PIOMAS folks also note, that is too short a period to be climatically significant. However, with 2021 expected to be a colder year, I don’t see much chance of the current flat trend going down, WRT ice extent or volume.
What is big CO cloud emerging over arctic last few days