September has arrived once again, the month in which the assorted Arctic area and extent metrics (almost) always reach their respective annual minima. Now we can start to speculate about what the assorted minima will be, and on what date.
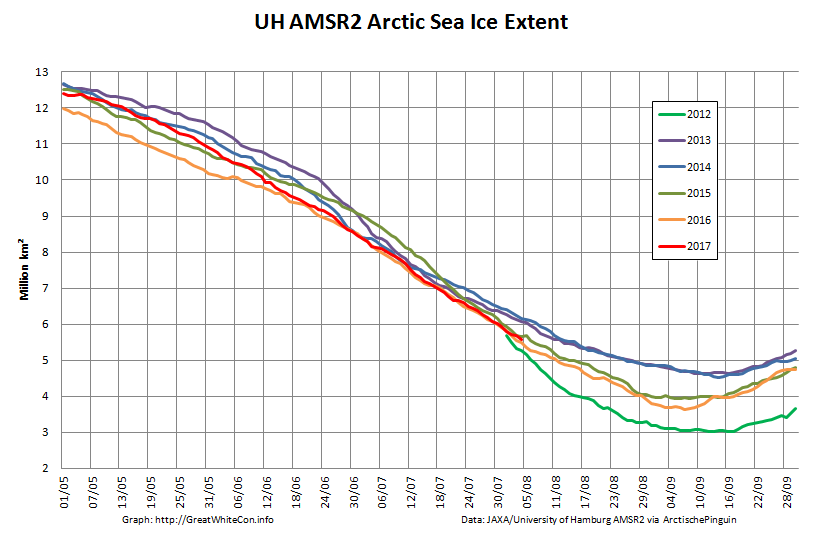
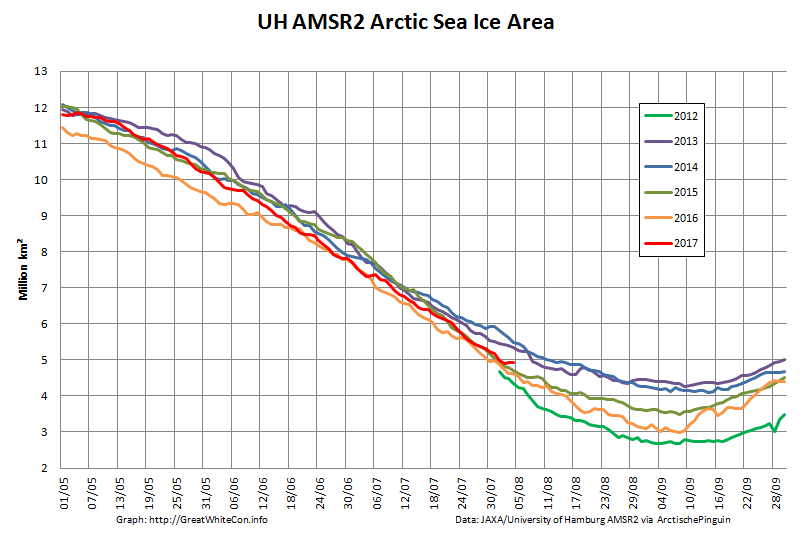
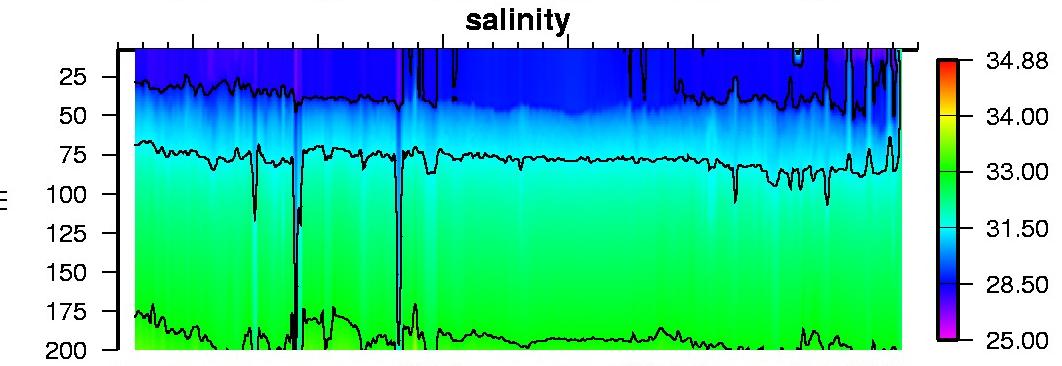
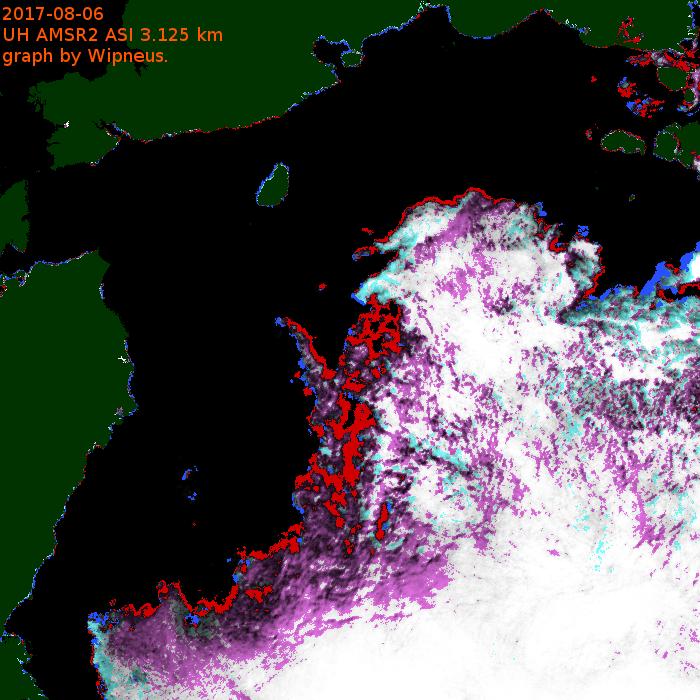
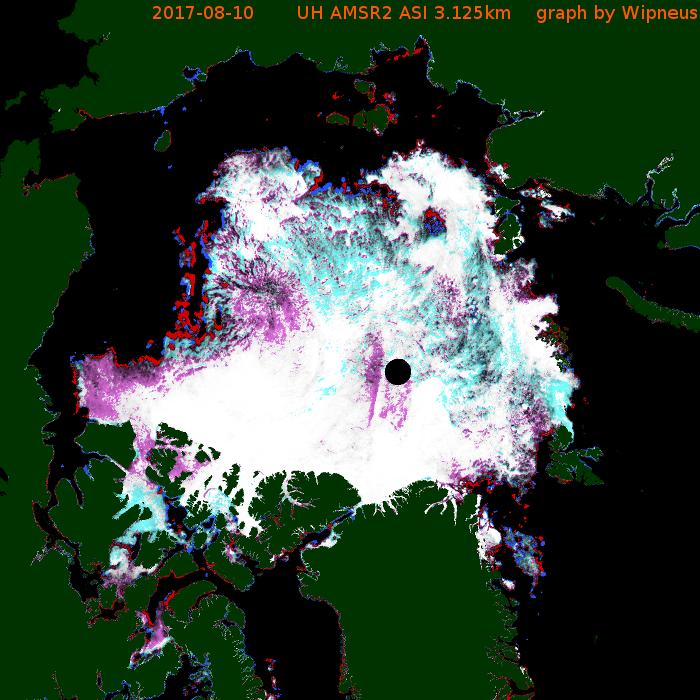
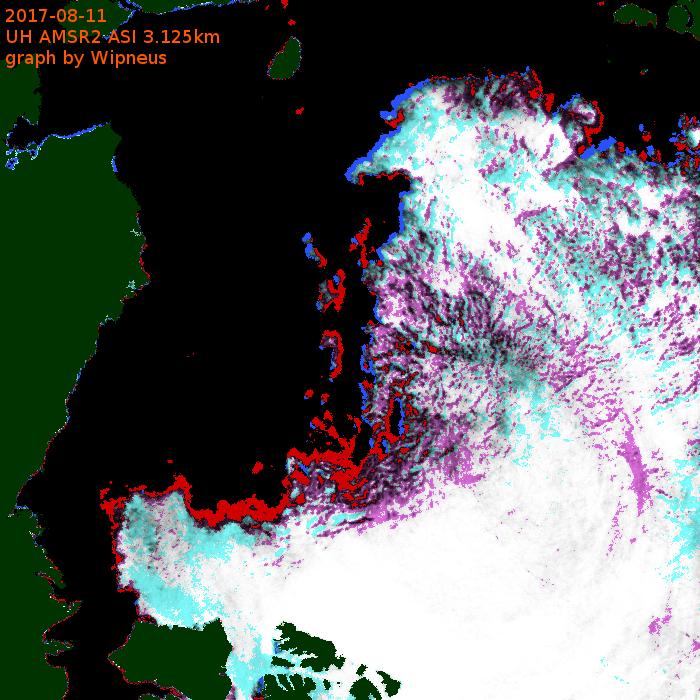
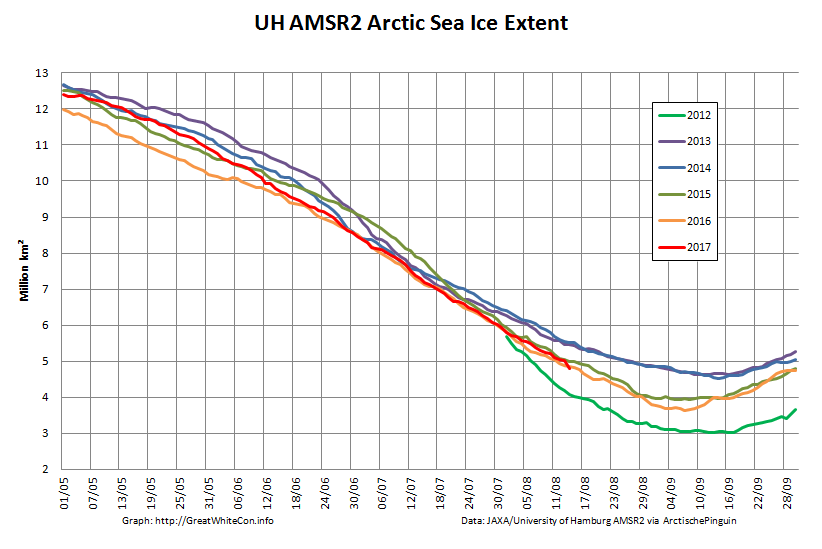
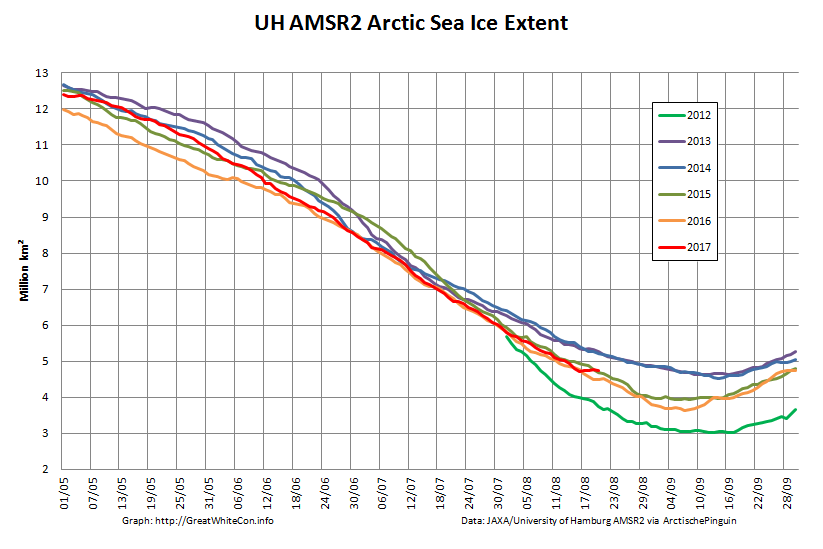
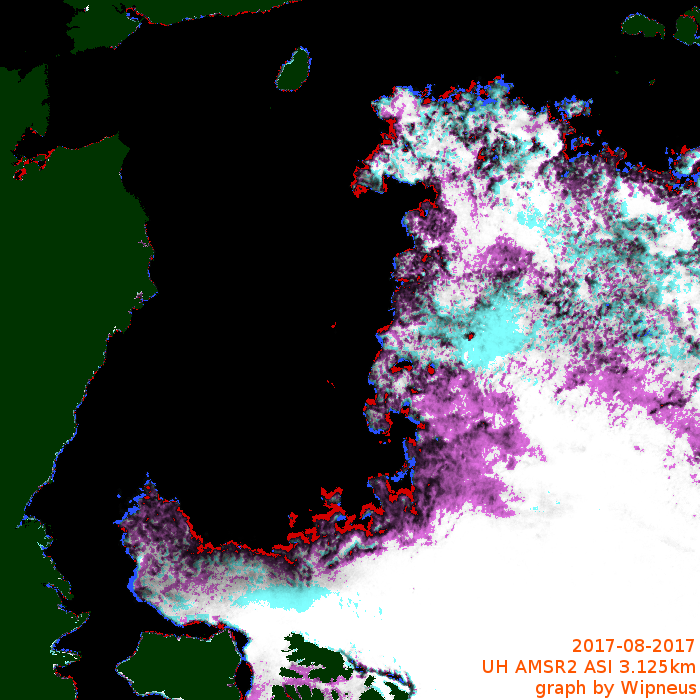
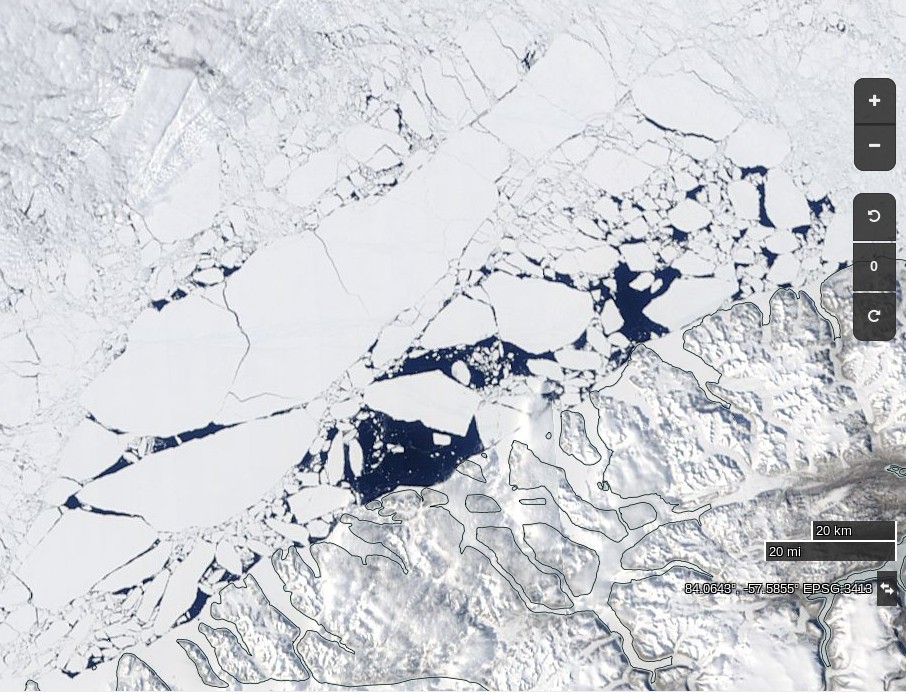
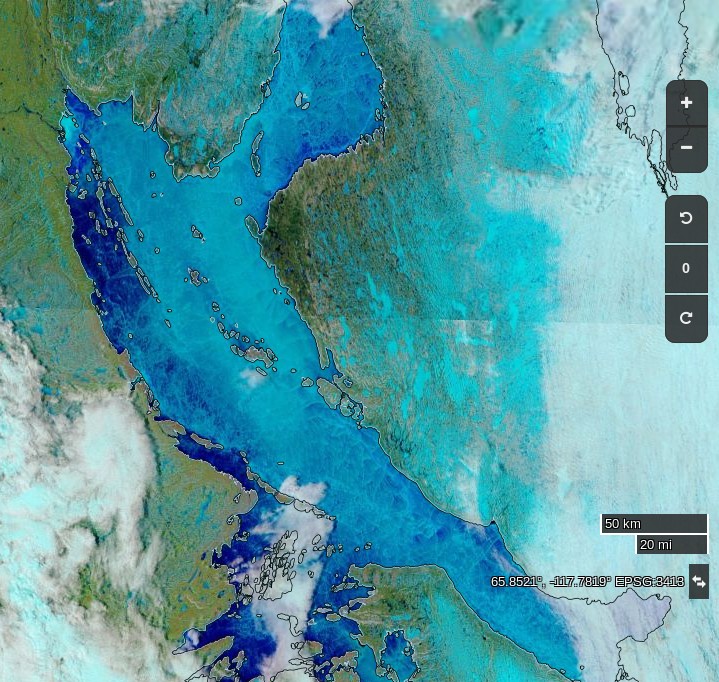
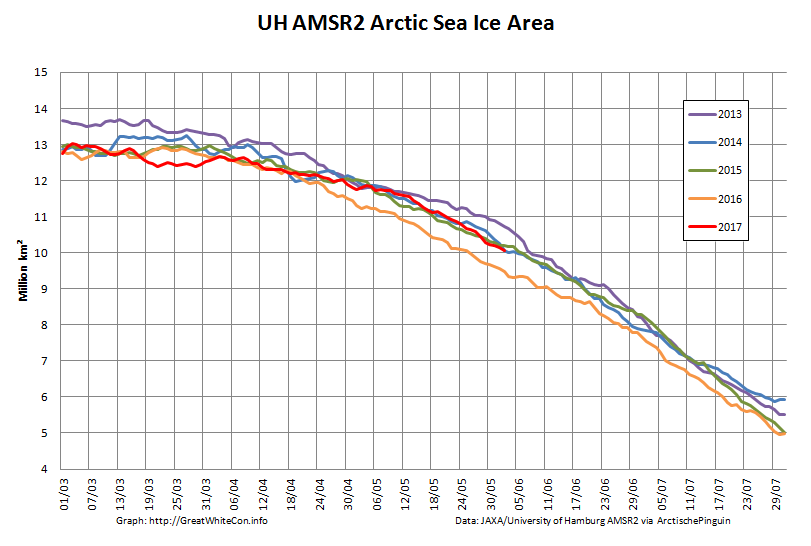
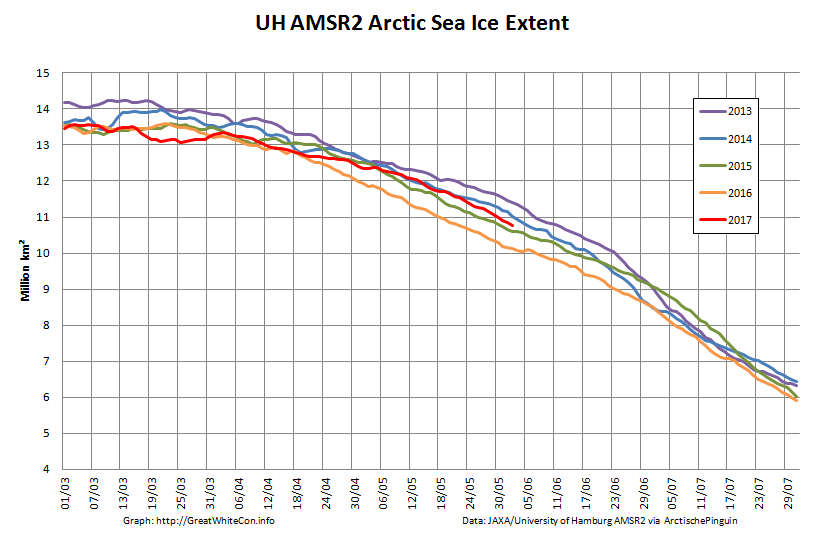
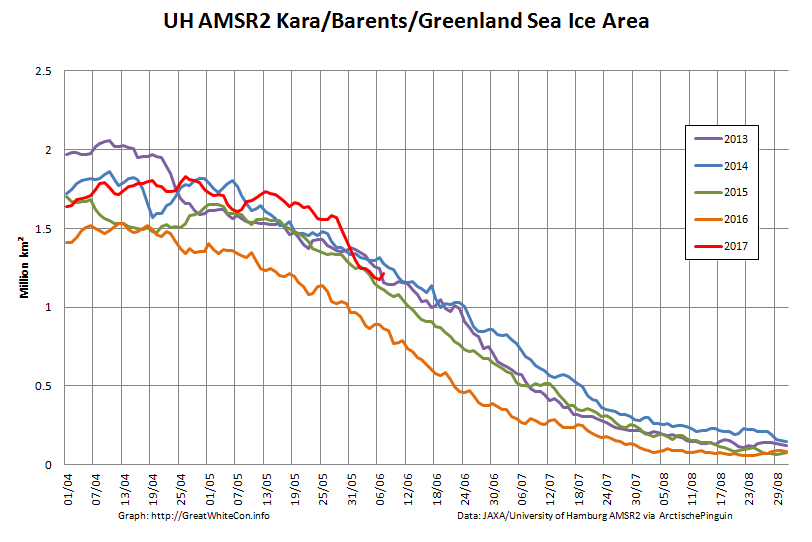
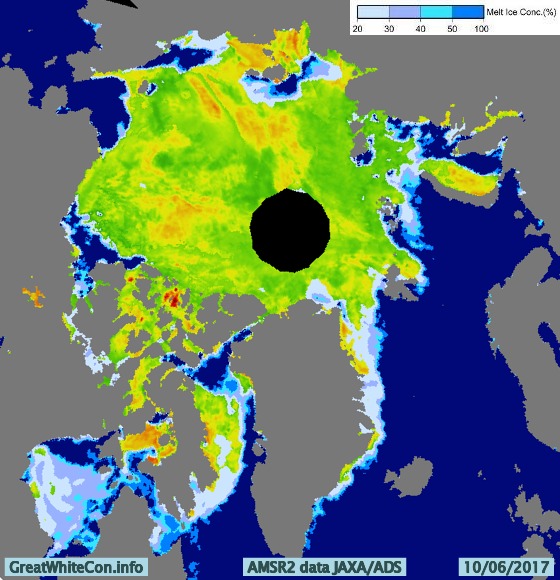
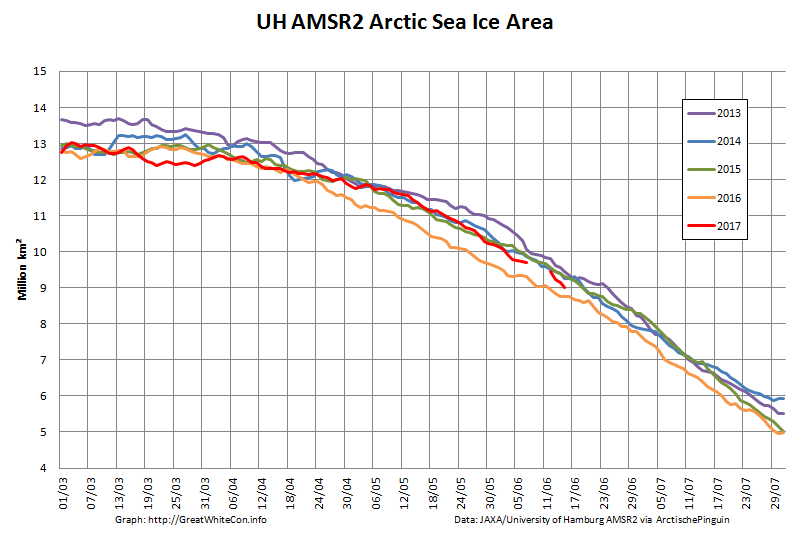
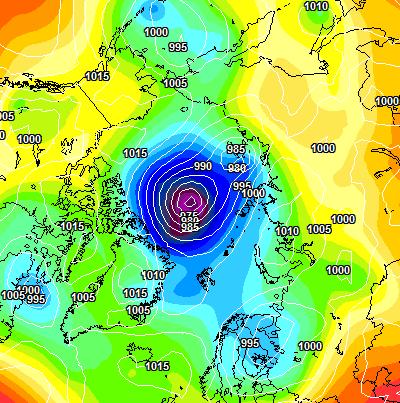
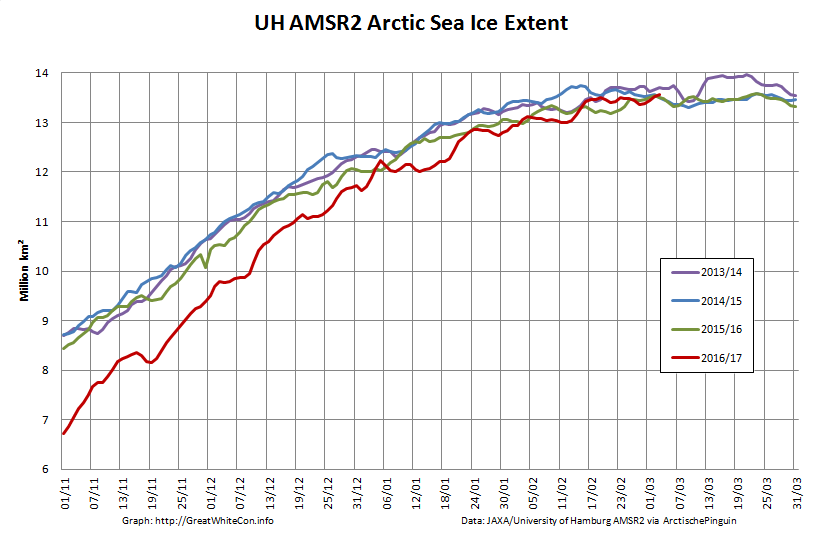
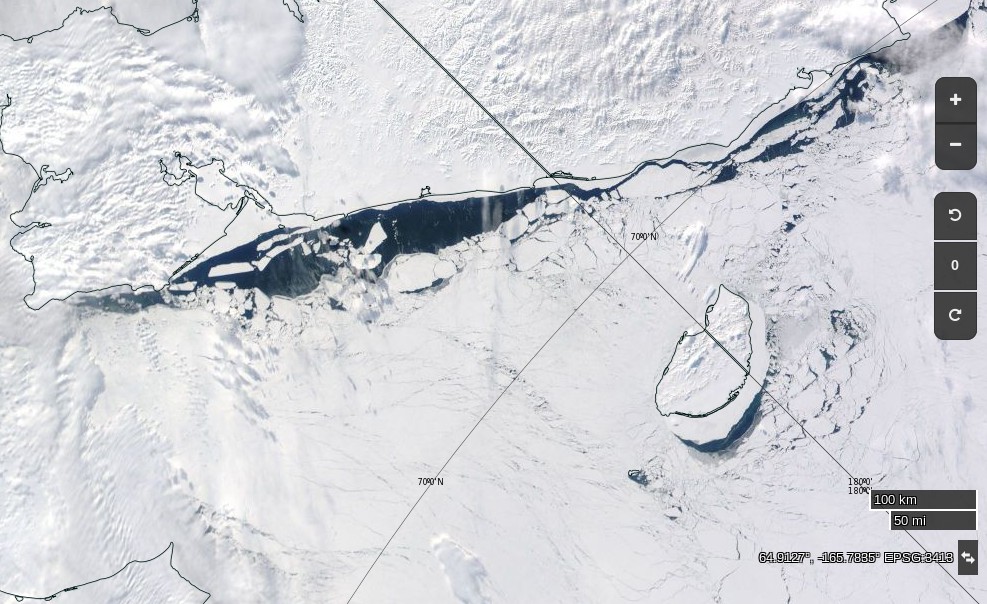
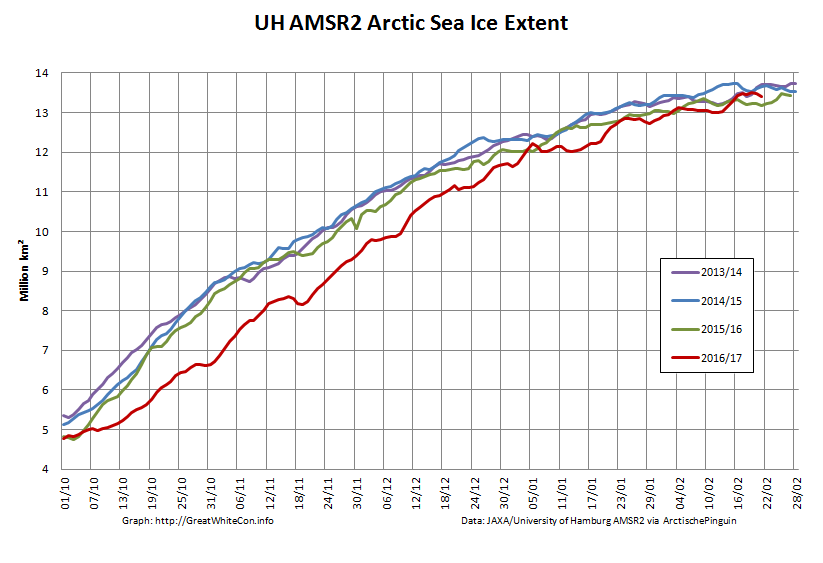
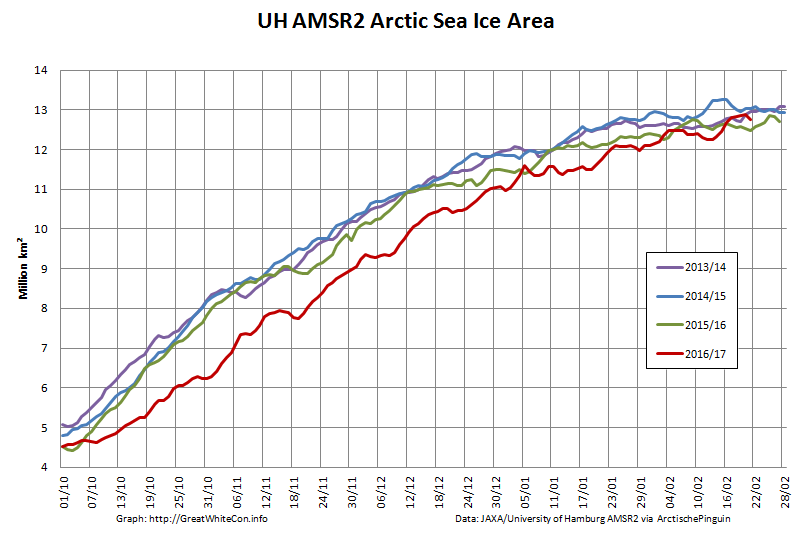
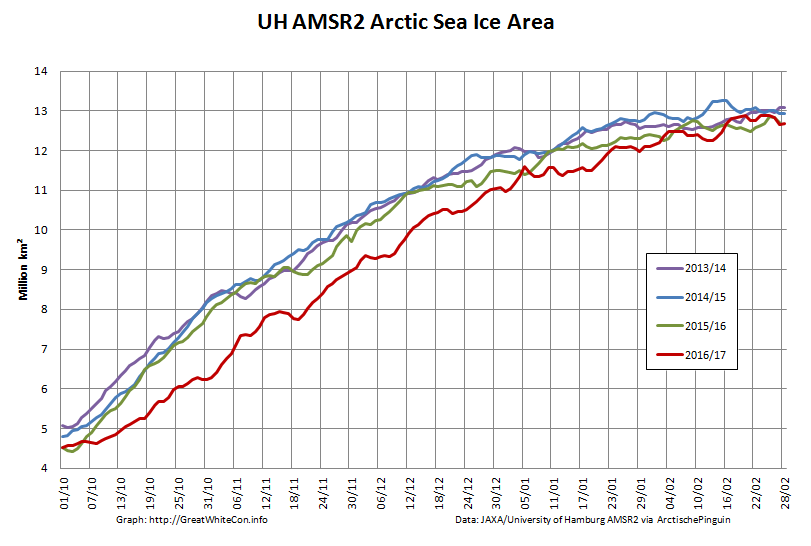
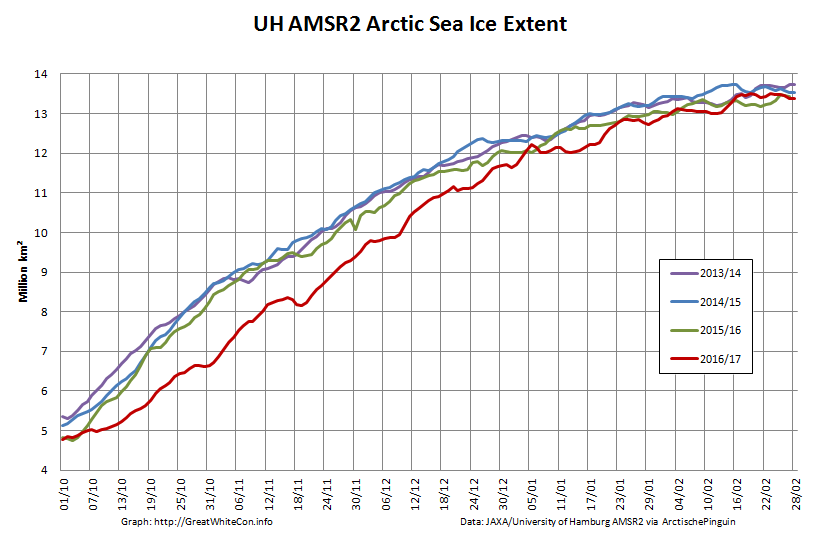
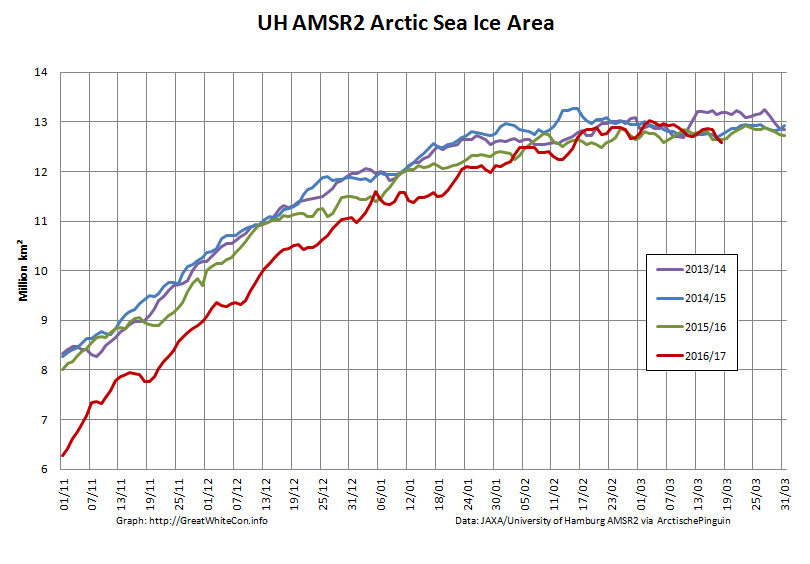
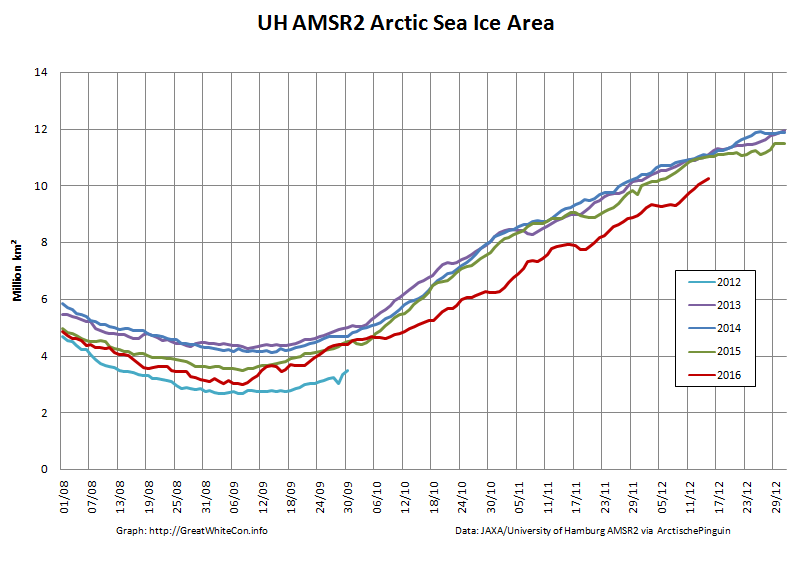
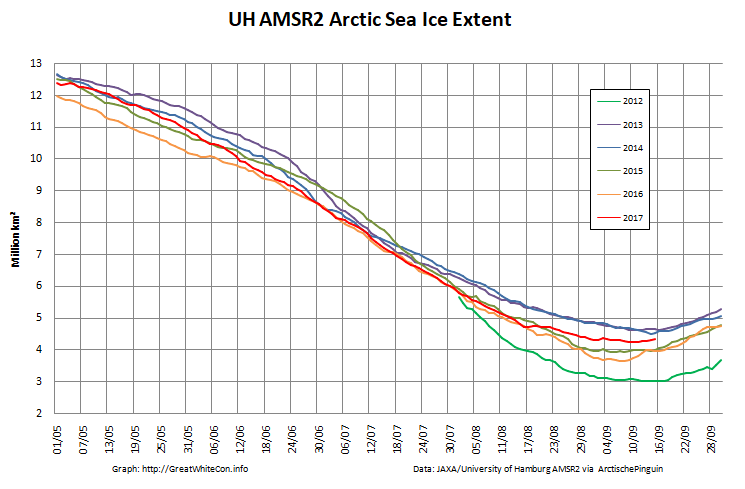
First of all let’s take a look at “Snow White’s” favourite high resolution AMSR2 metrics derived by “Wipneus” from University of Hamburg AMSR2 concentration data:
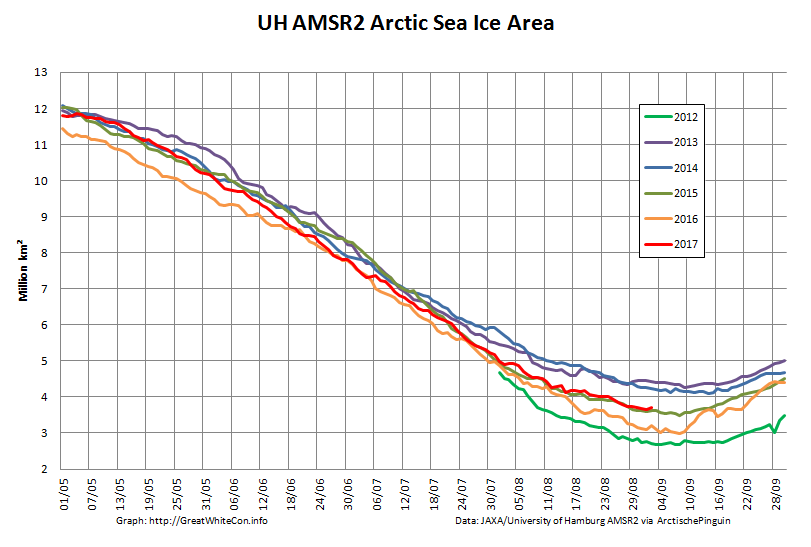
As you can see, today’s values are both higher than yesterday’s. Hence we already have potential minima to consider! In this case:
UH AMSR2 Area – 3.65 million km² on September 1st
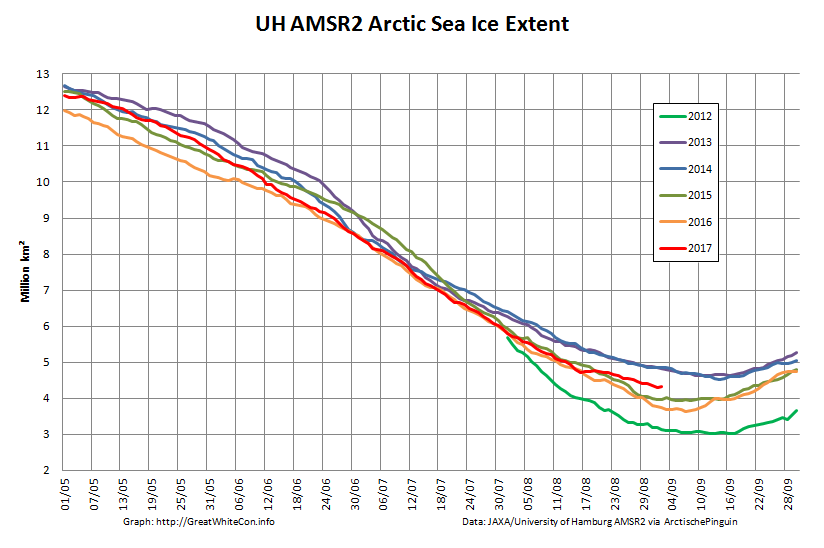
UH AMSR2 Extent – 4.30 million km² on September 1st
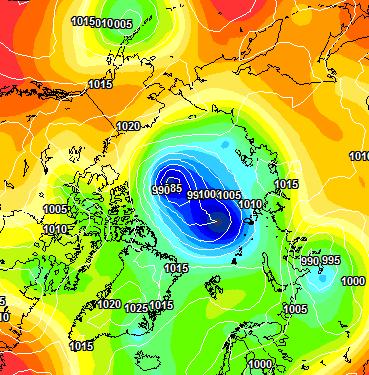
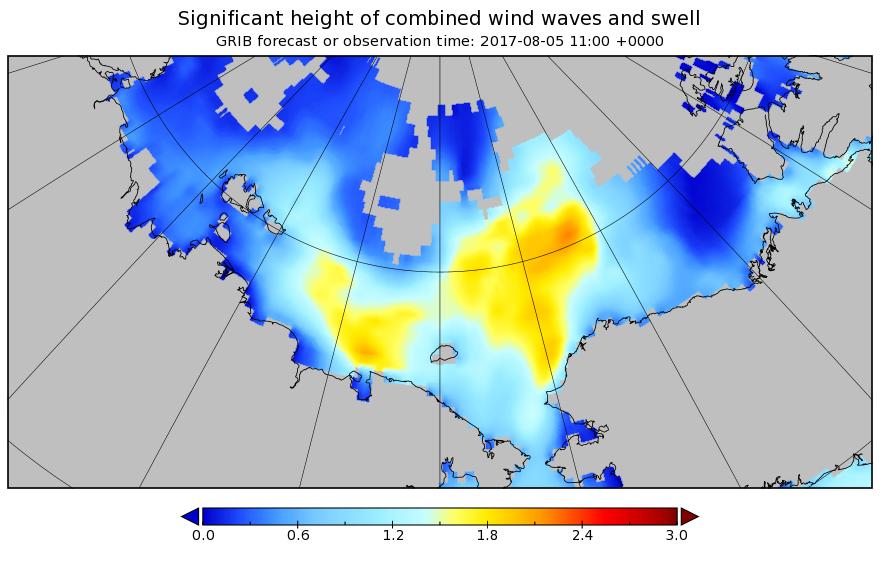
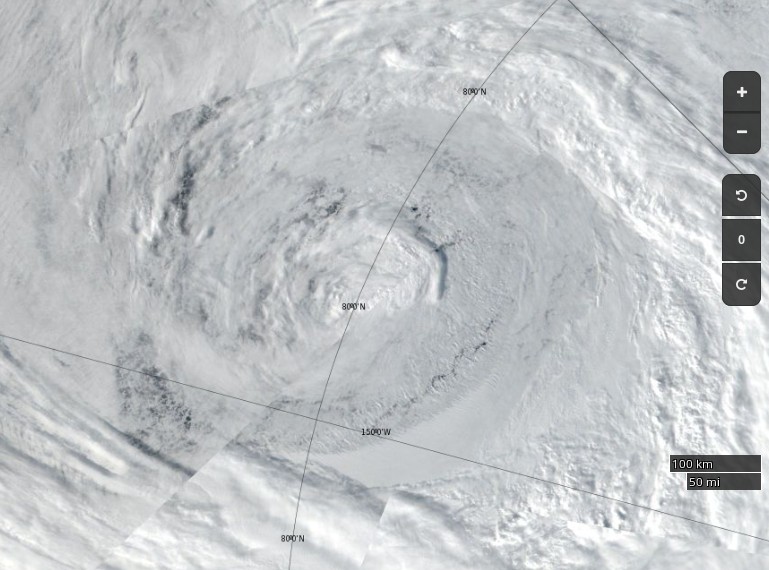
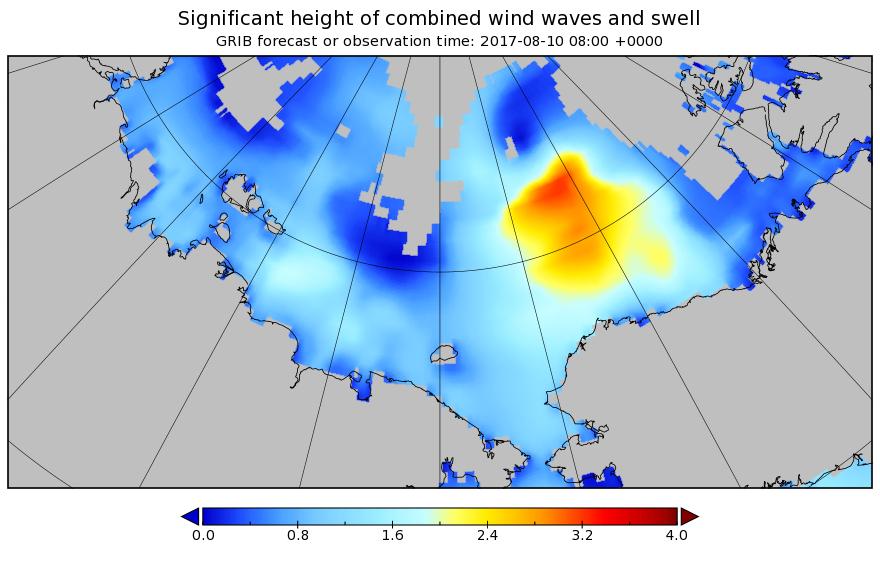
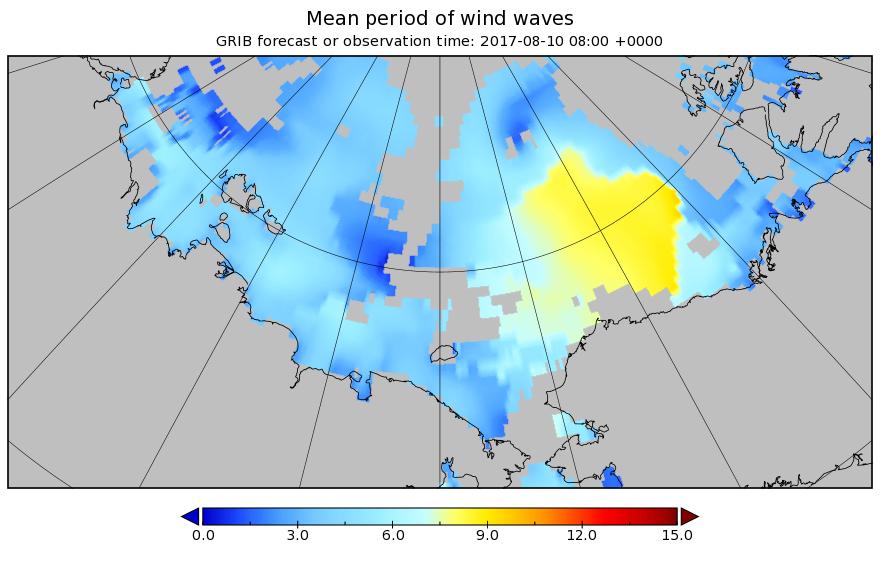
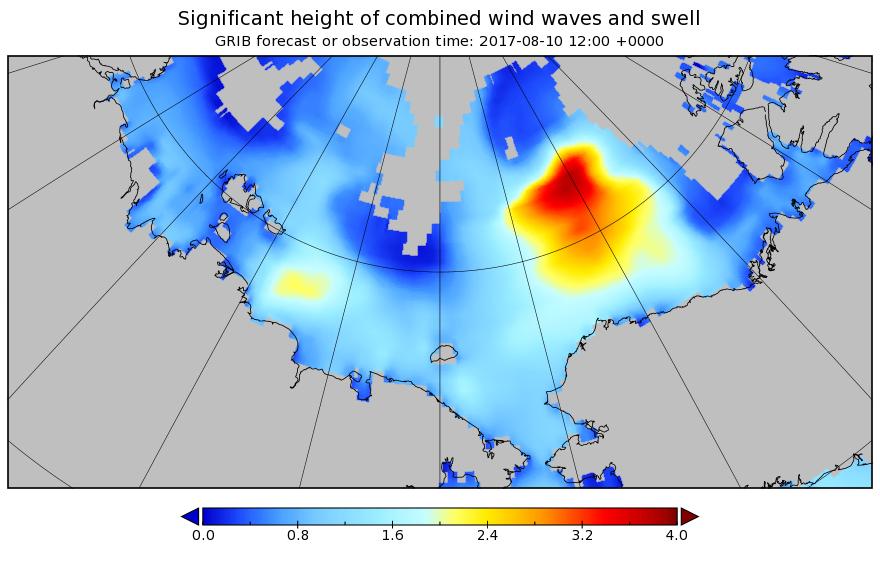
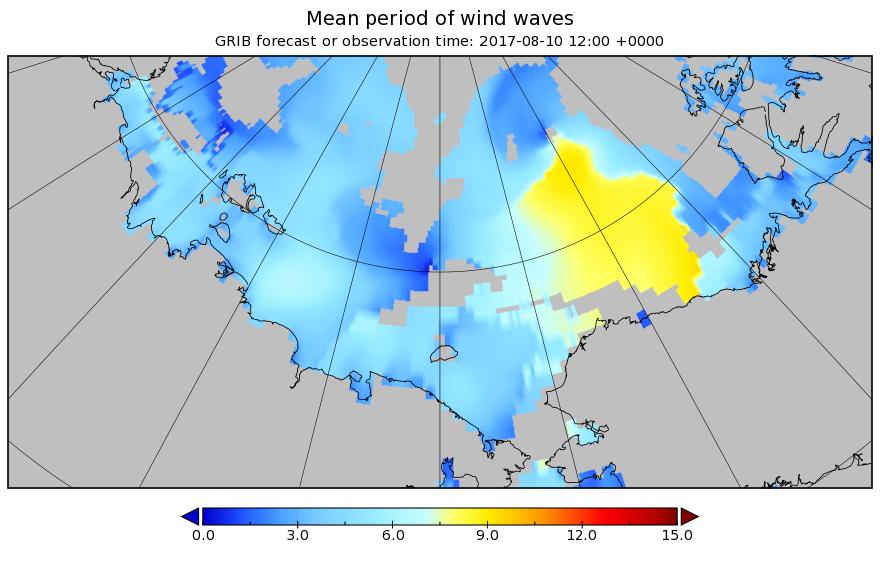
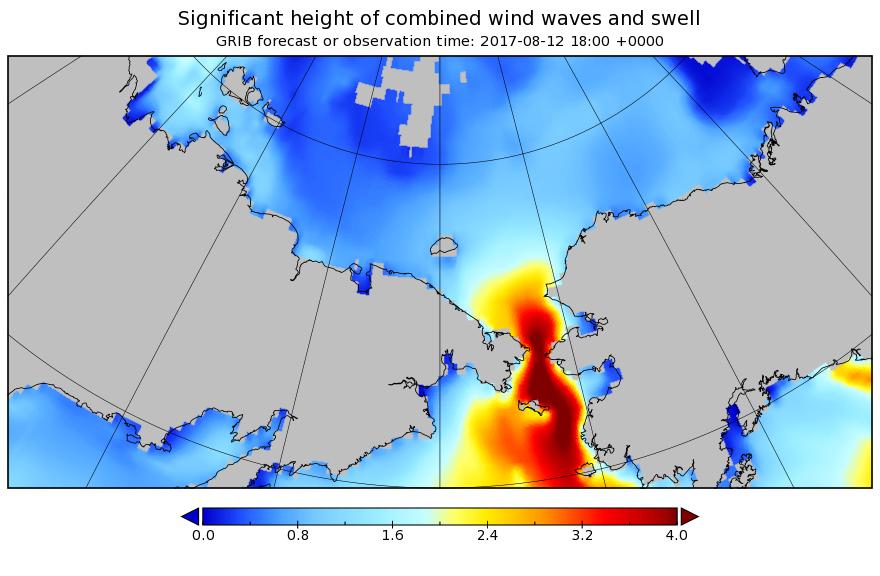
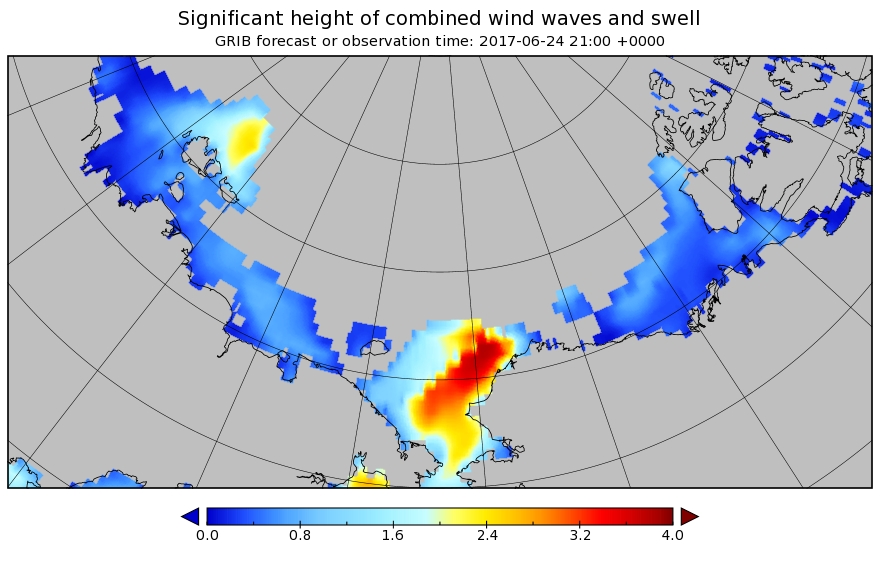
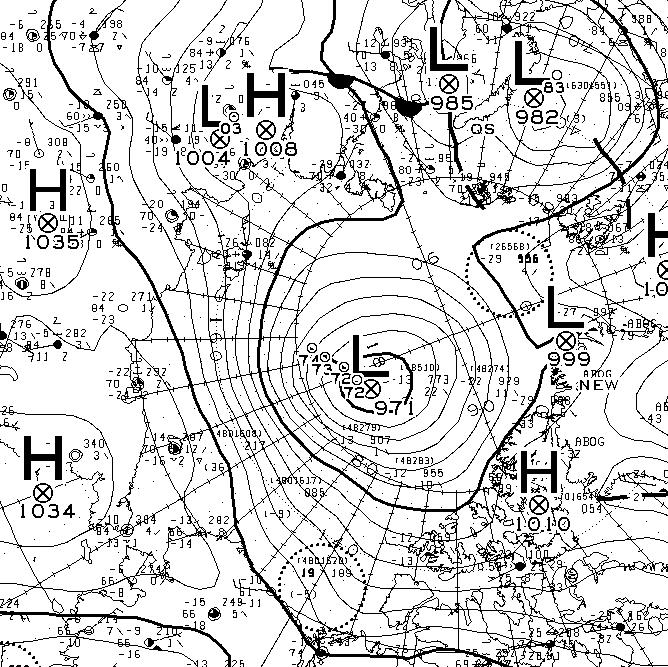
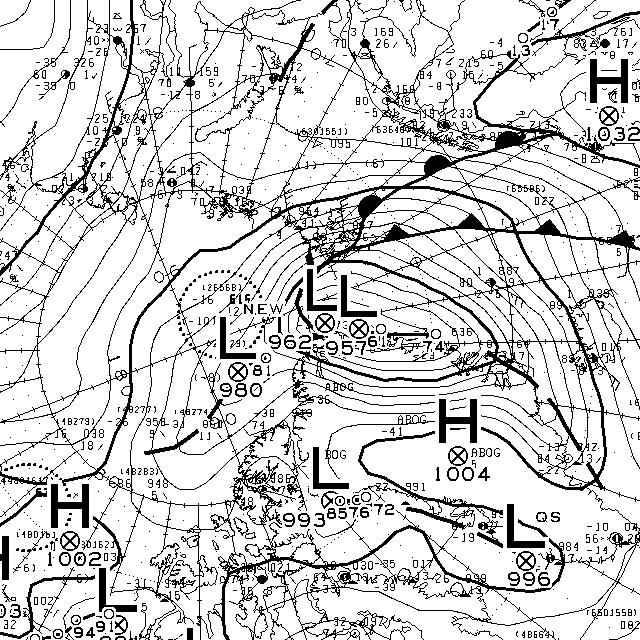
Personally I don’t think those numbers will last long, and here’s one reason why. The “surf forecast” for the far North Atlantic for midday on September 6th:
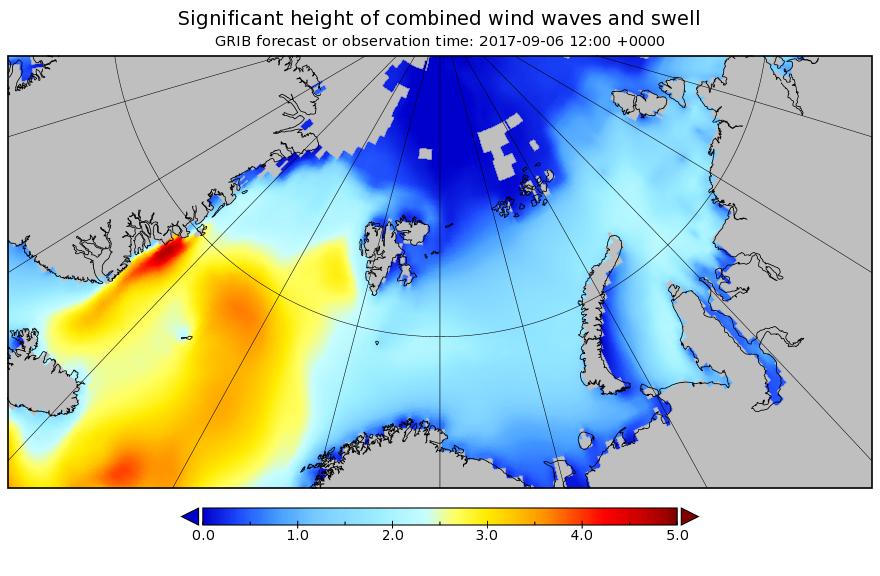
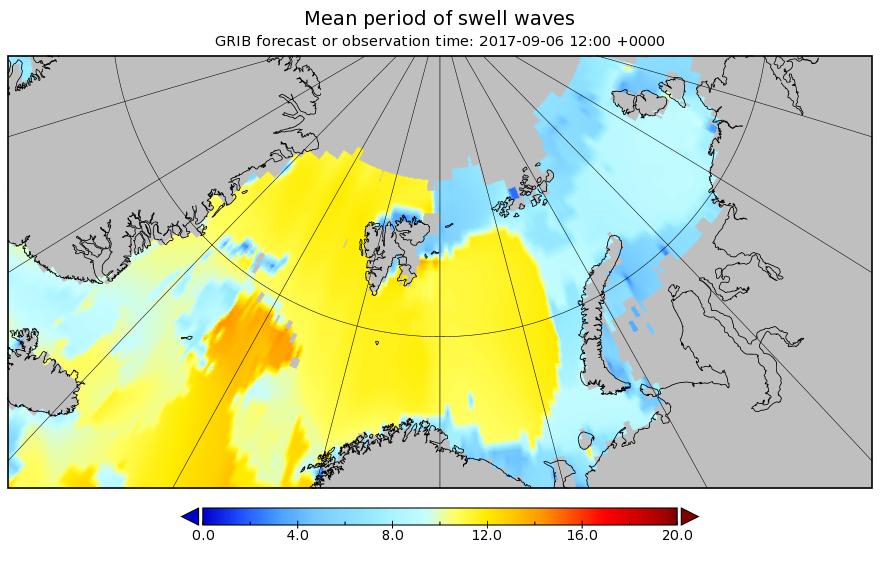
Some significant swells are currently forecast to batter the ice edge on the Atlantic side of the Arctic over the next few days.
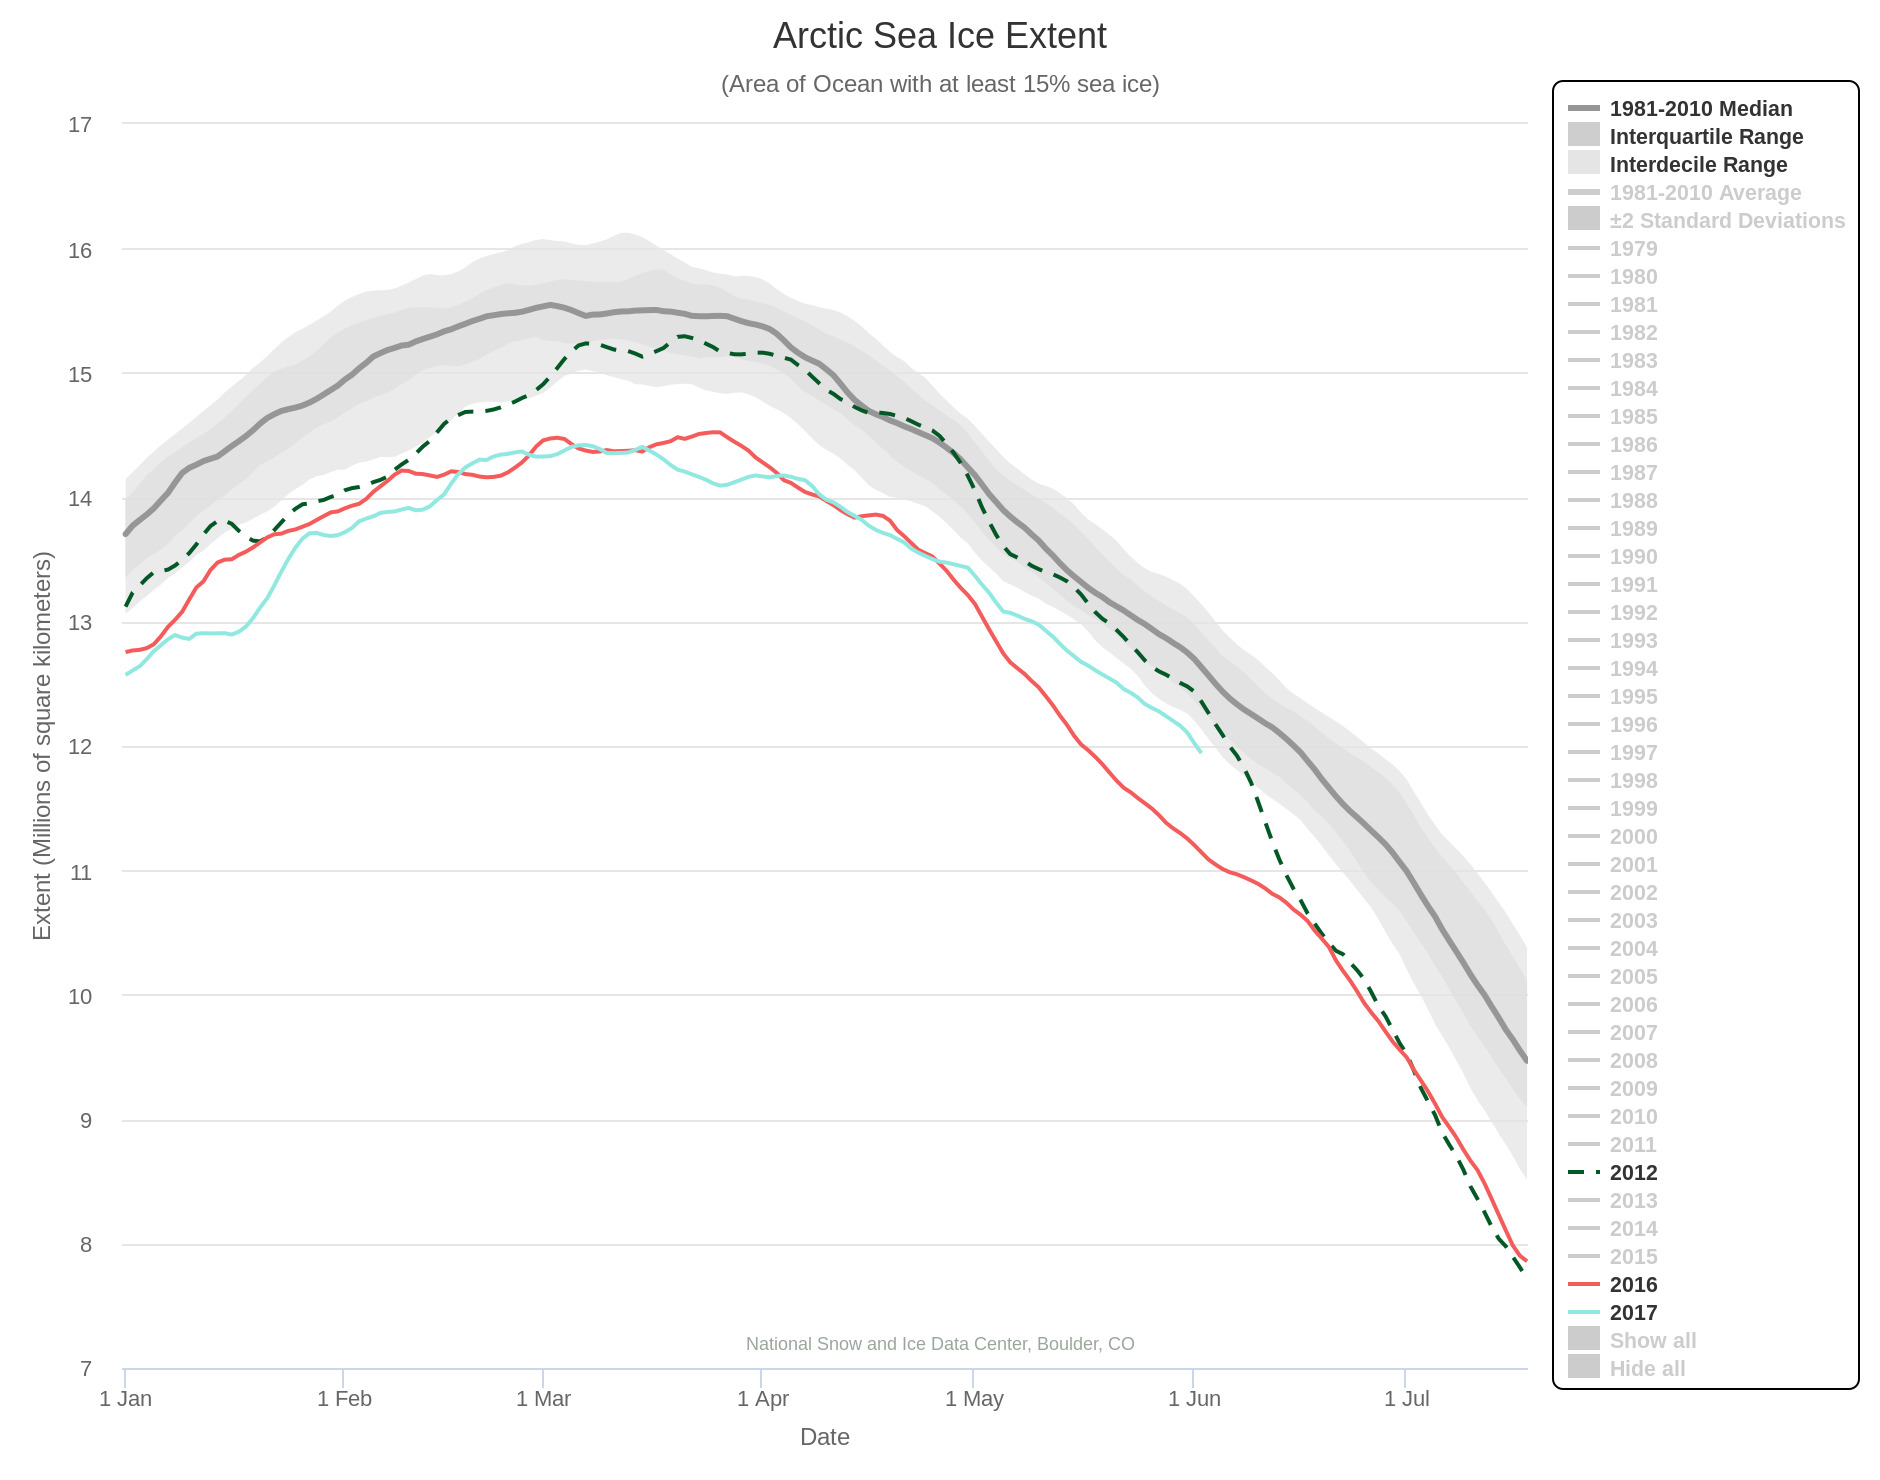
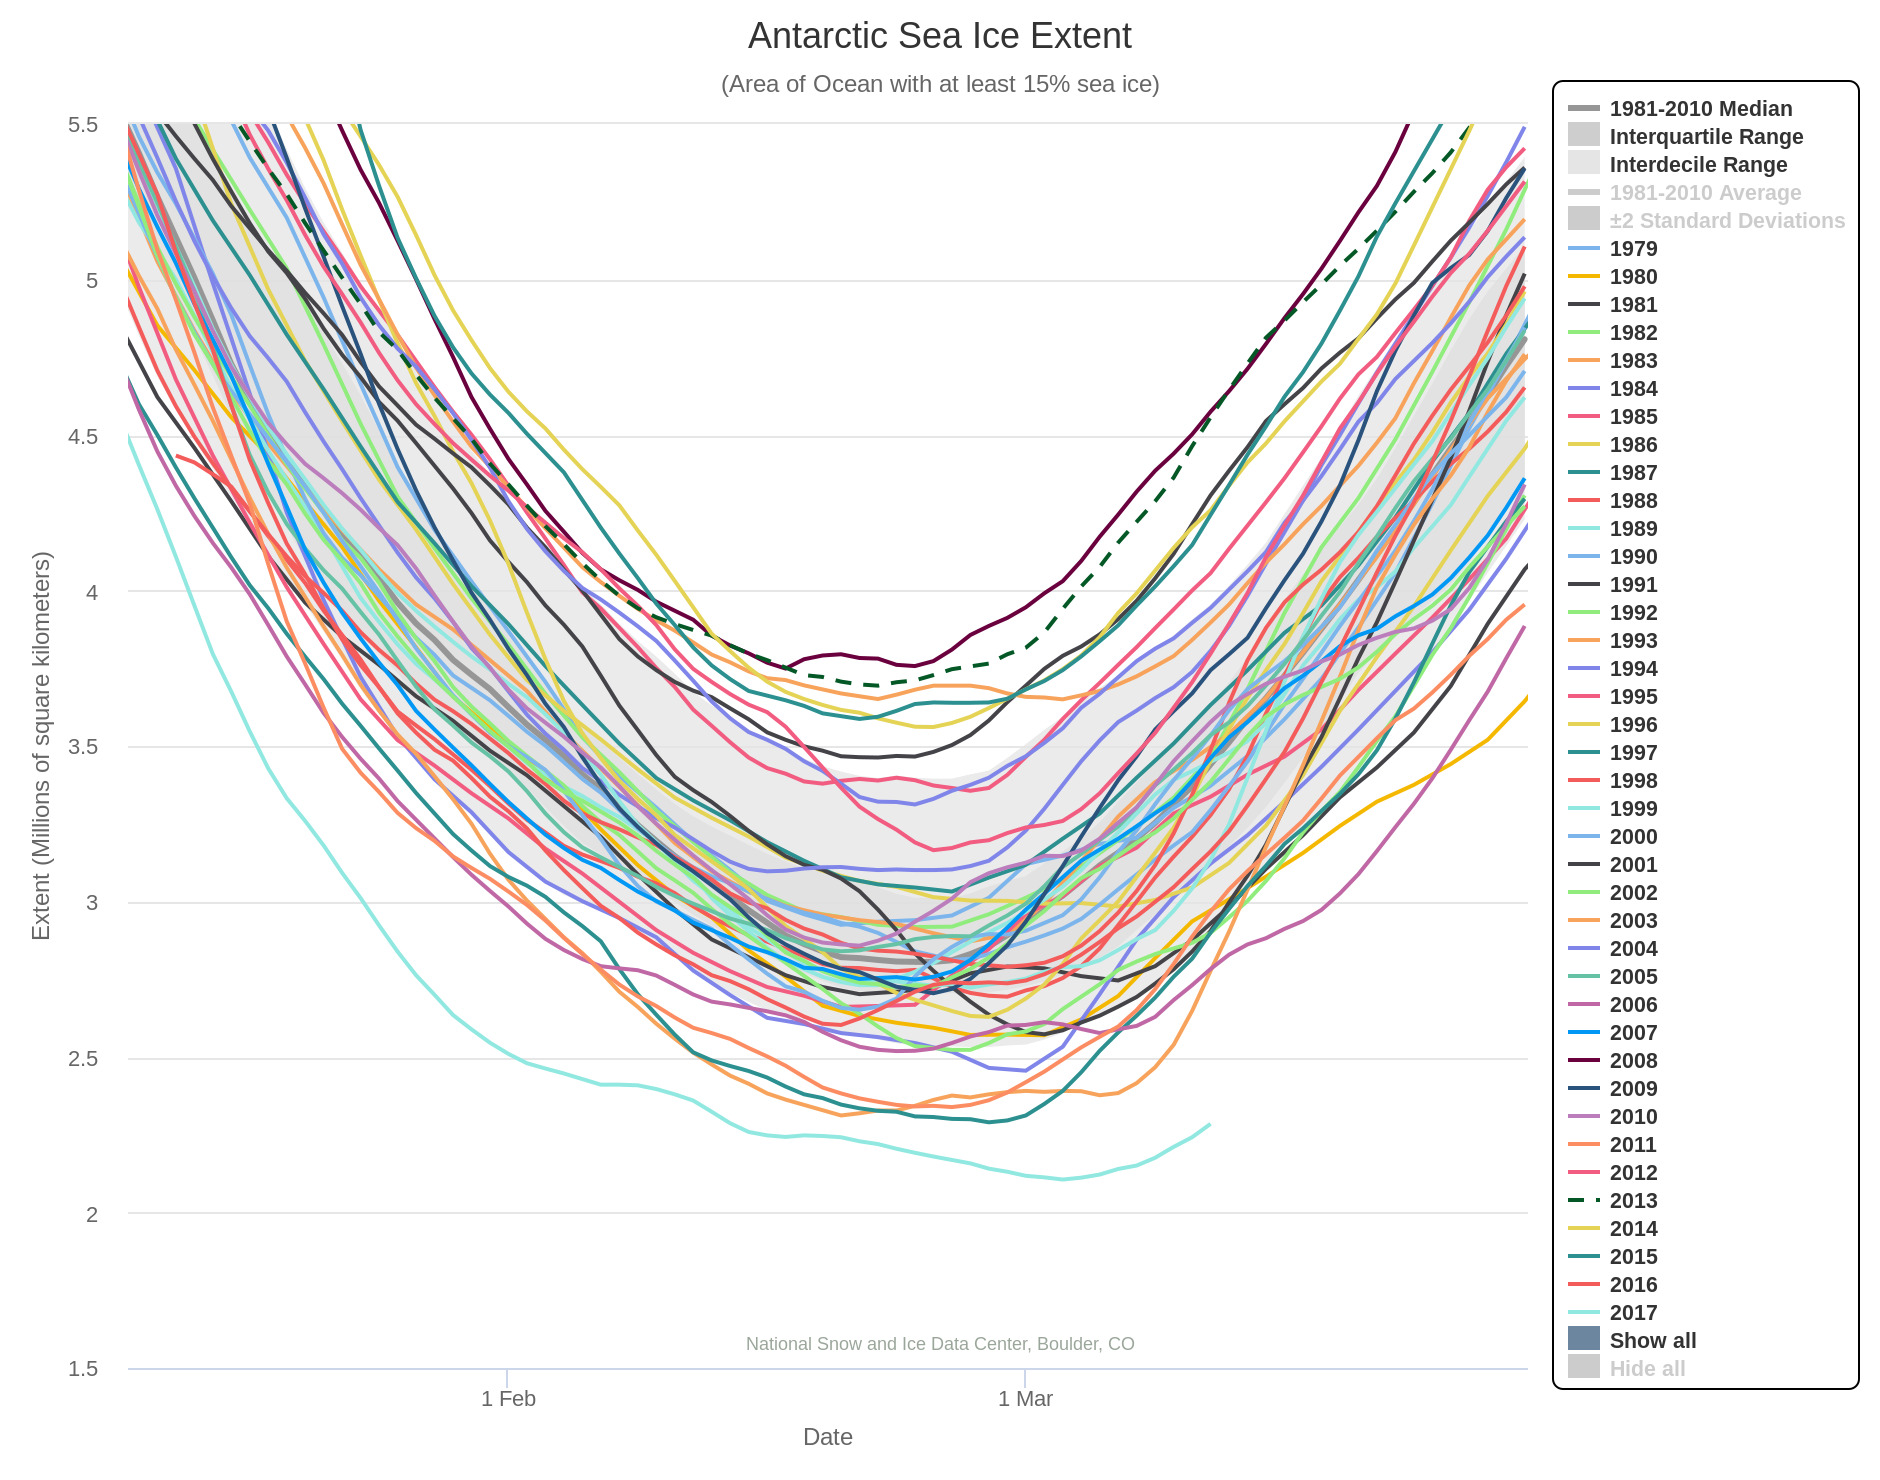
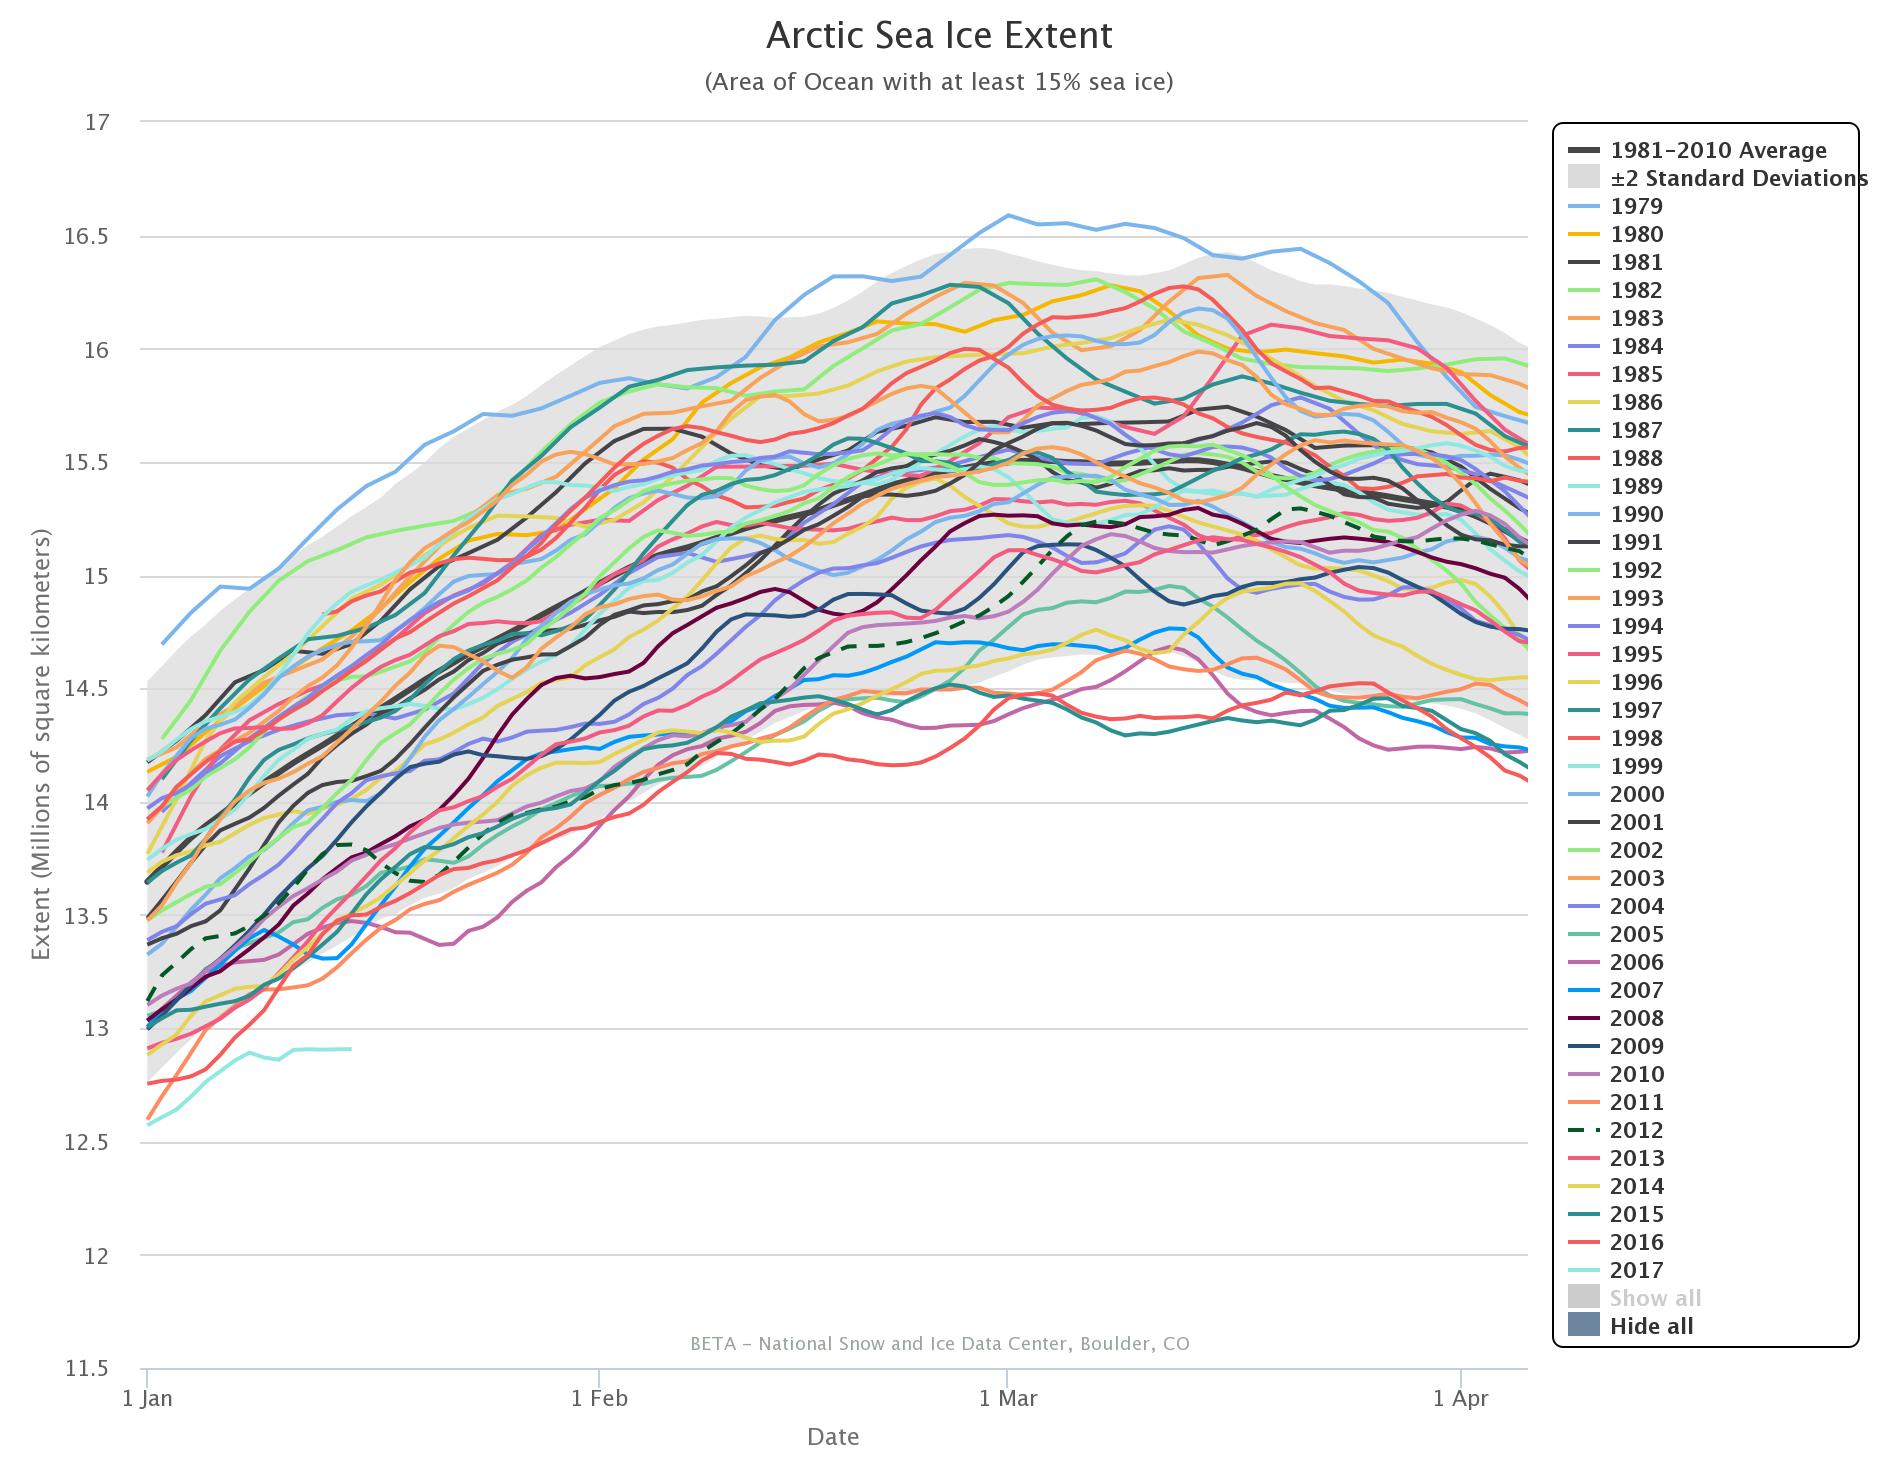
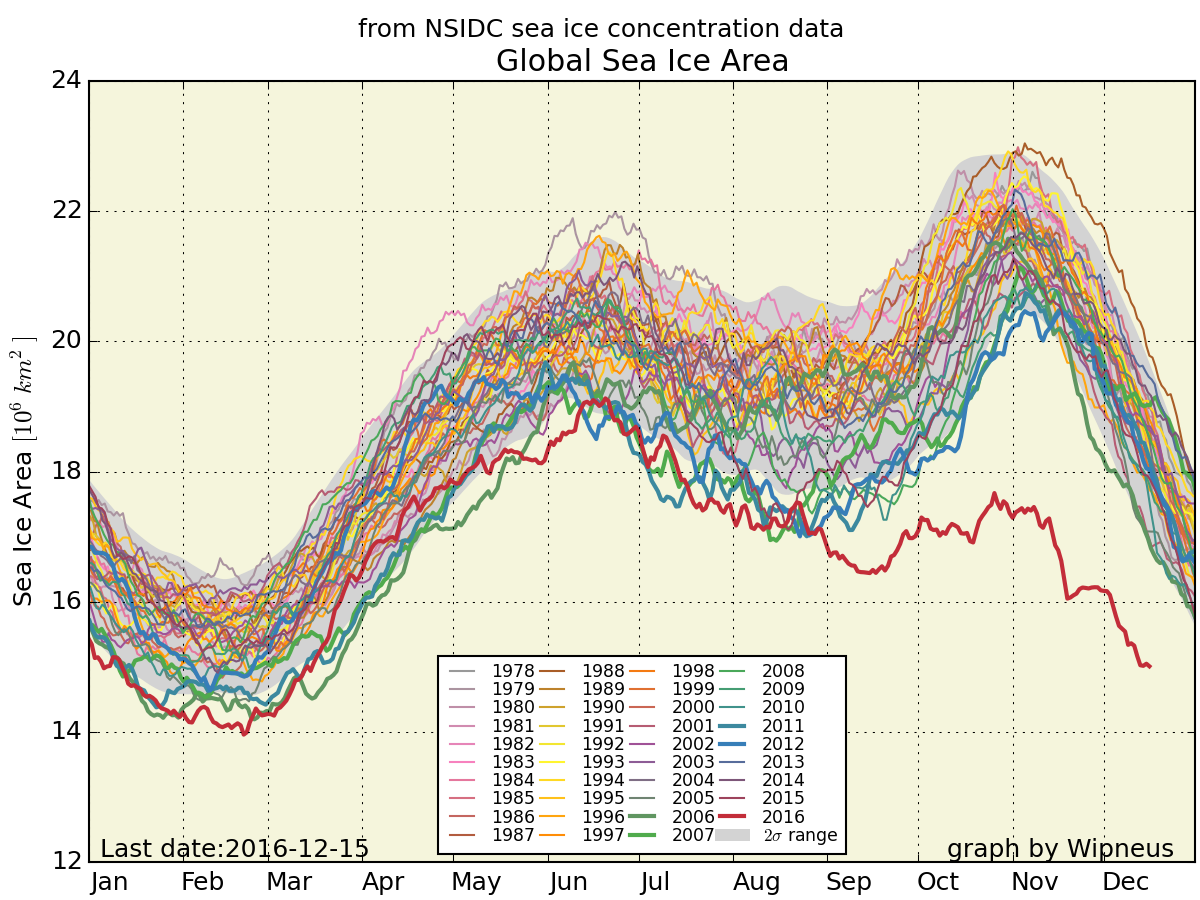
Shock news! Tony Heller has made a prediction about this year’s minimum!! Unlike last year, this year the NSIDC 5 day average extent seems to be his Arctic metric of choice:
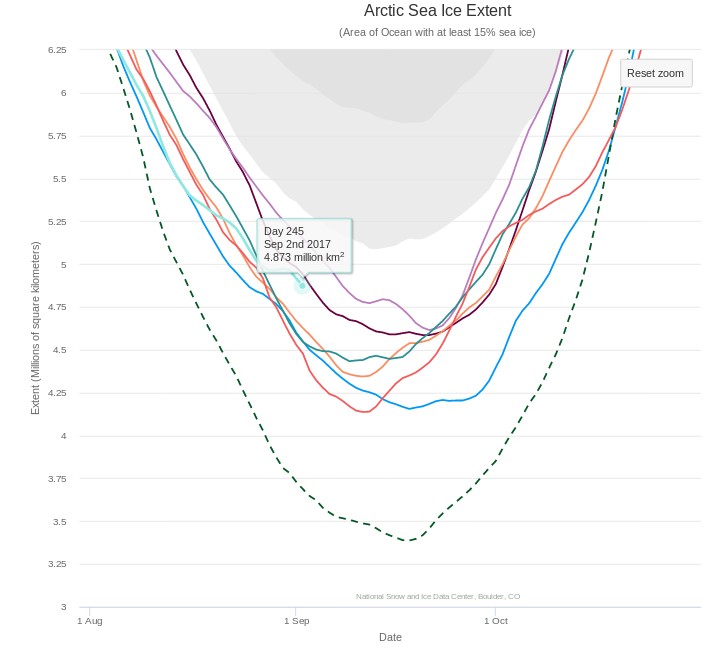
Tony tells his faithful flock:
The Arctic sea ice minimum this year is very likely going to be be larger than 2016, 2015, 2012, 2011 and 2007.
It is also likely that the minimum extent will be higher than 2010 and 2008.
Instead of reporting the huge gain in ice and massive failure of their forecasts, climate alarmists will report that extent was “8th lowest on record.”
All those years are on the graph above. We shall see.
Our normal Arctic sea ice extent 2017 minimum service will be restored as soon as possible. Meanwhile here is the test card:
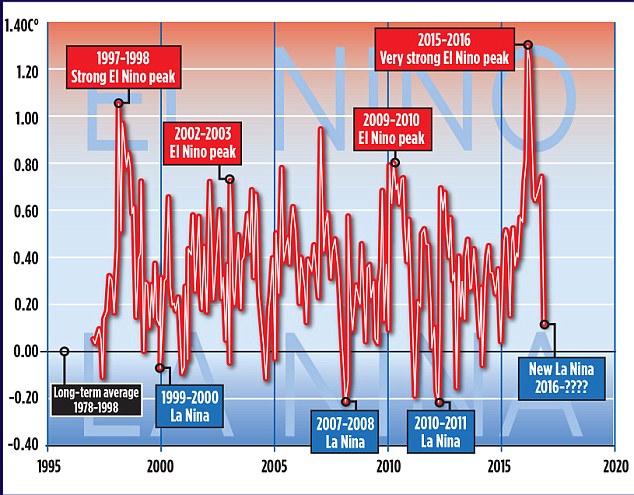
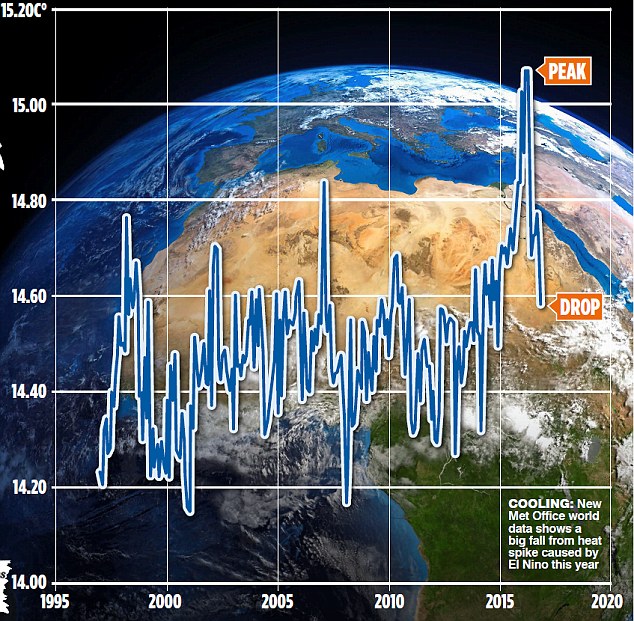
That comes to you via the Daily Express of all places!
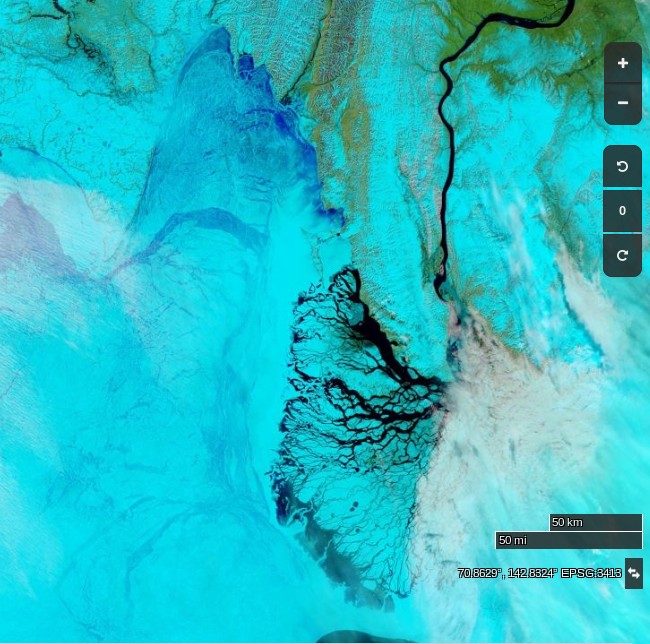
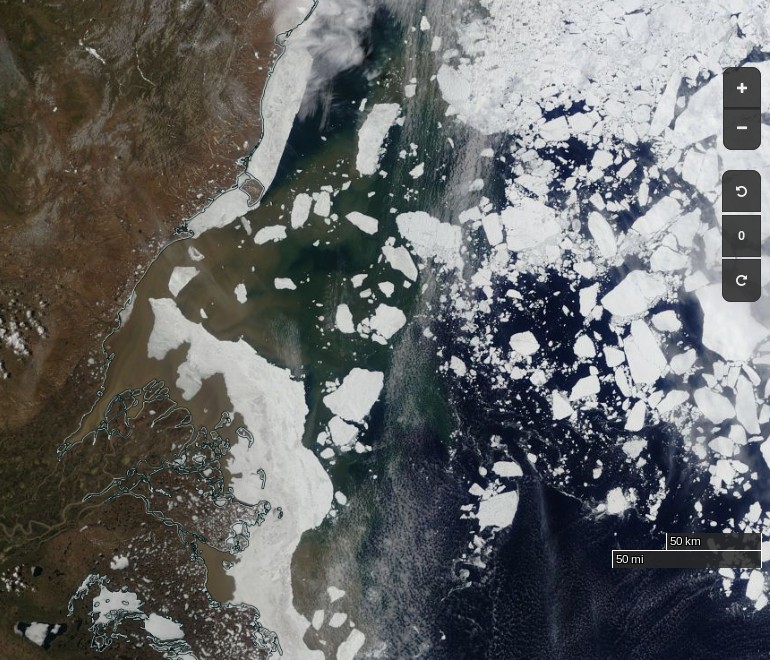
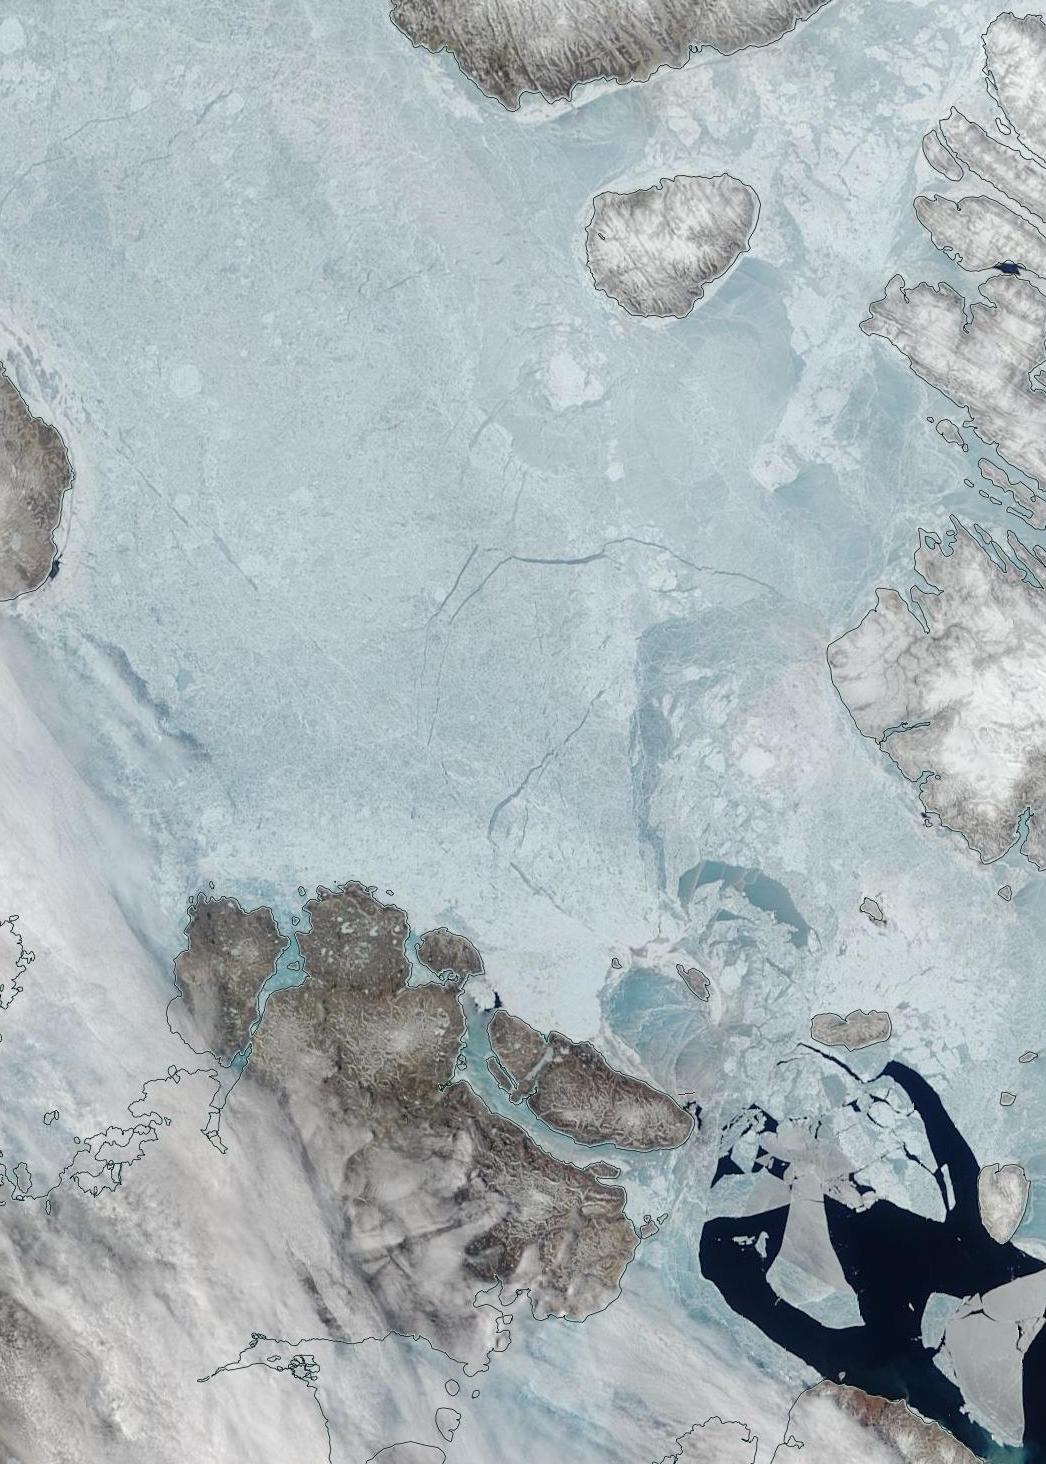
On the way the cruise’s resident naturalist and Smithsonian lecturer, Michael Scott, risked the wrath of Trump supporters by pointing to some of the changes Greenland is undergoing.
A Nasa map based on data between 2004 and 2014 revealed that the ice is melting across most of Greenland – an area nine times the size of the UK.
Pulling together several papers, Michael said Greenland’s summer melt season now lasts 70 days longer than in the early 1970s.
This melting is unfreezing the fringes of the permafrost, which may explain why Nasa satellites are picking up fires raging where the ice has retreated.
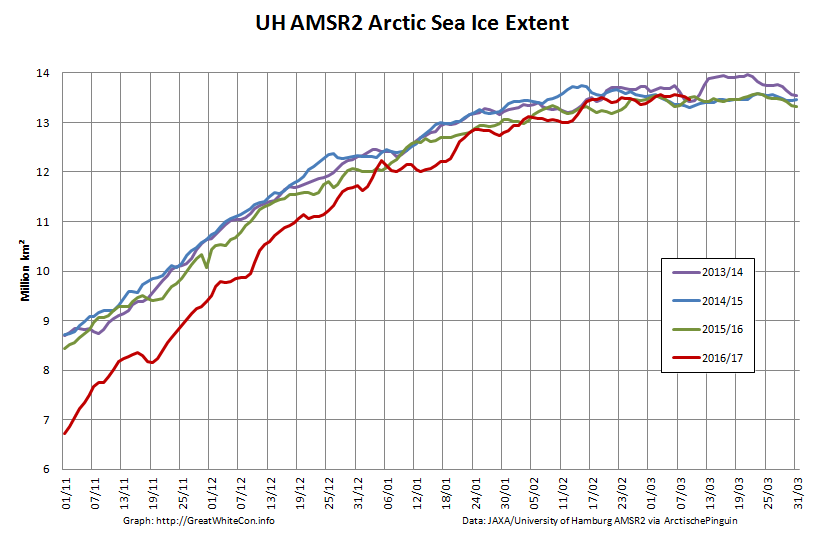
It is of course still to early to be 100% certain about this. However:
It certainly looks as though the bottom is in for the University of Hamburg AMSR2 extent: 4.25 million km² on September 11th.
It’s much the same story for JAXA extent:
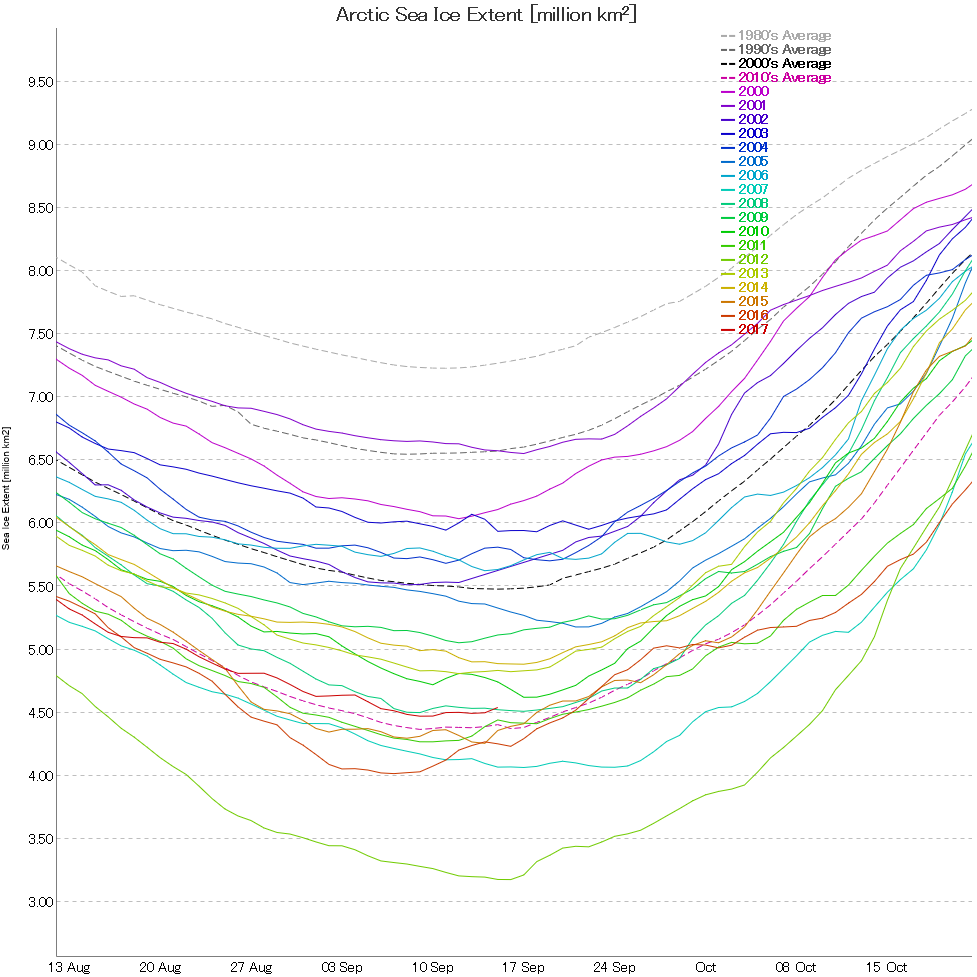
4.47 million km² on September 9th and 10th.
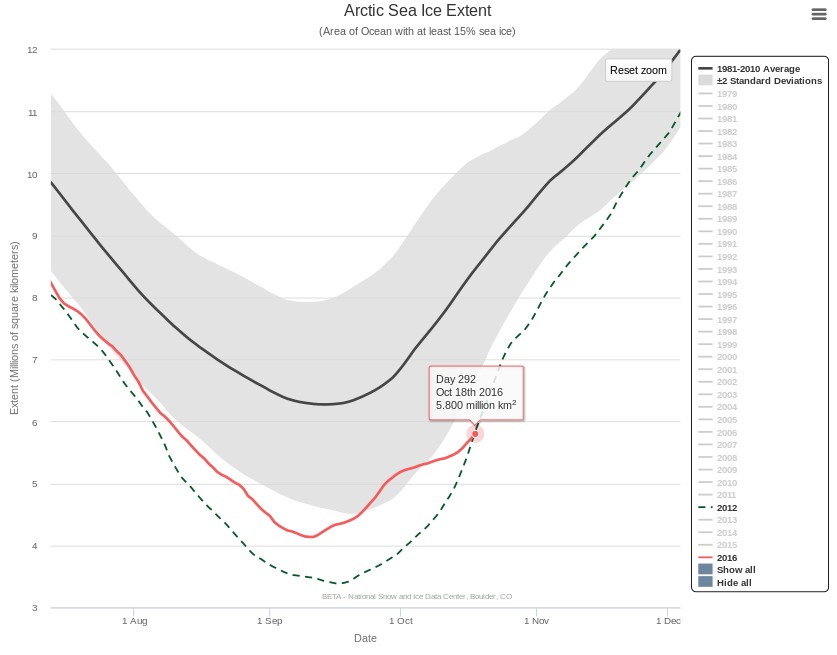
The NSIDC have followed in Snow White’s glass slippered footsteps and tentatively called the minimum:
On September 13, Arctic sea ice appears to have reached its seasonal minimum extent of 4.64 million square kilometers (1.79 million square miles), the eighth lowest in the 38-year satellite record. The overall rate of ice loss this summer was slowed by a persistent pattern of low sea level pressure focused over the central Arctic Ocean.
Please note that this is a preliminary announcement. Changing winds or late-season melt could still reduce the Arctic ice extent, as happened in 2005 and 2010. NSIDC scientists will release a full analysis of the Arctic melt season, and discuss the Antarctic winter sea ice growth, in early October.
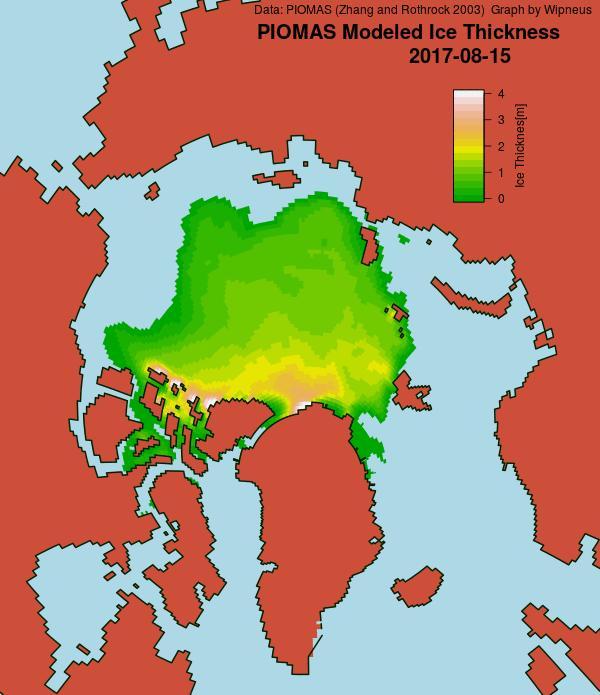
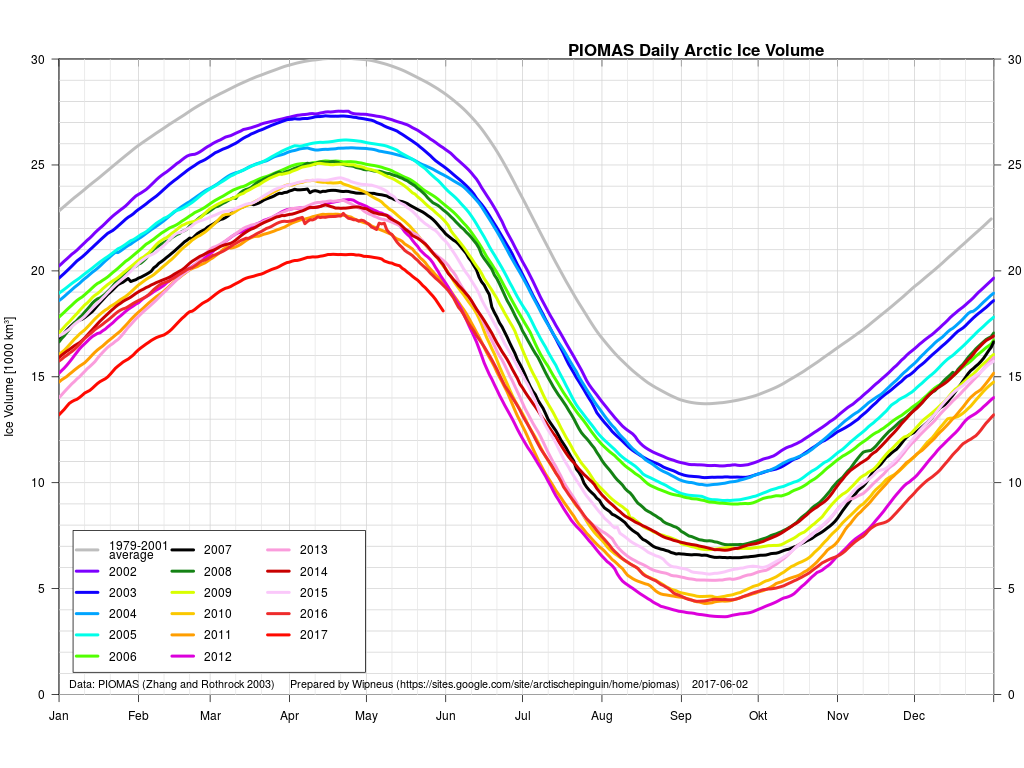
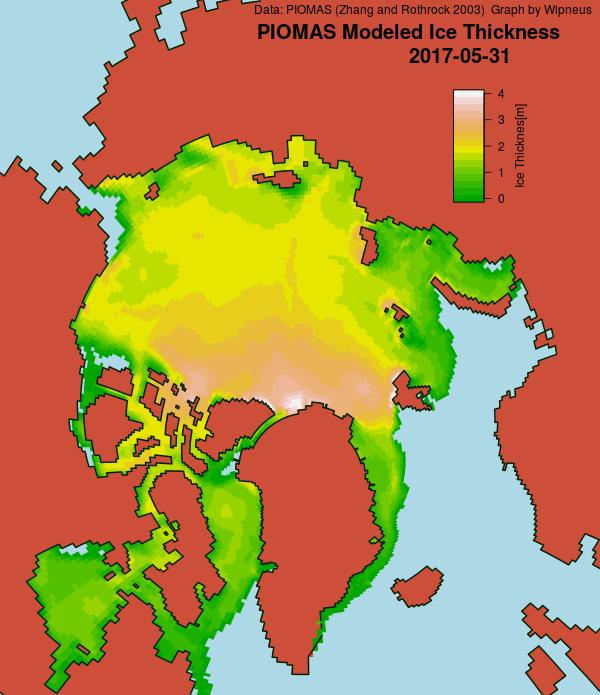
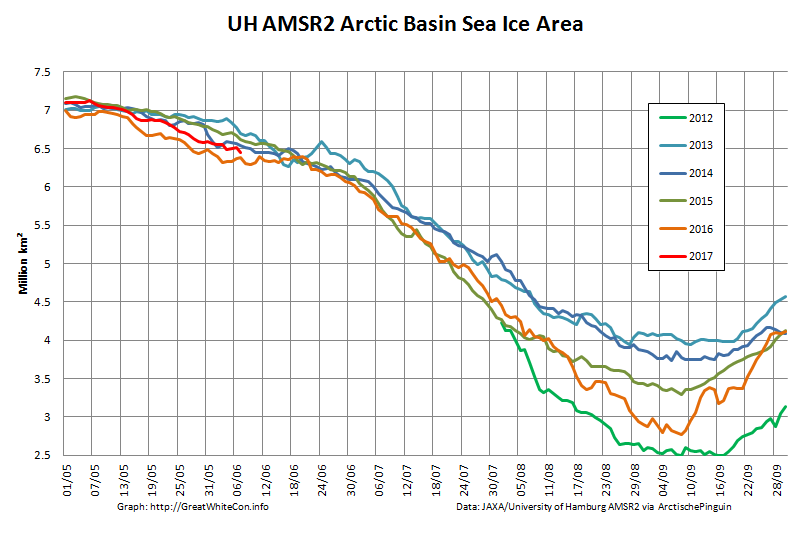
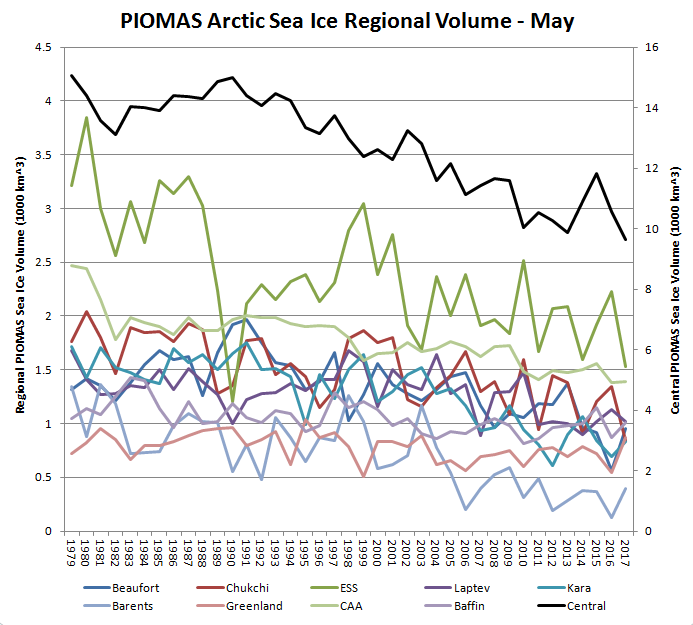
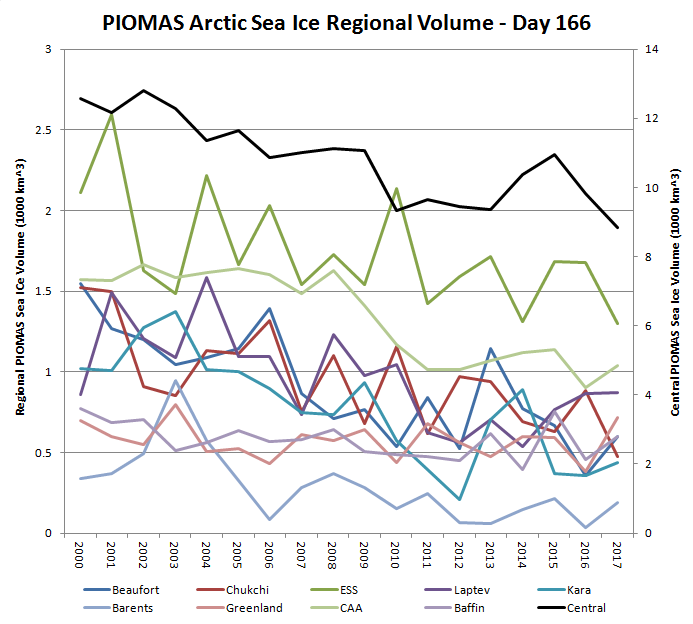
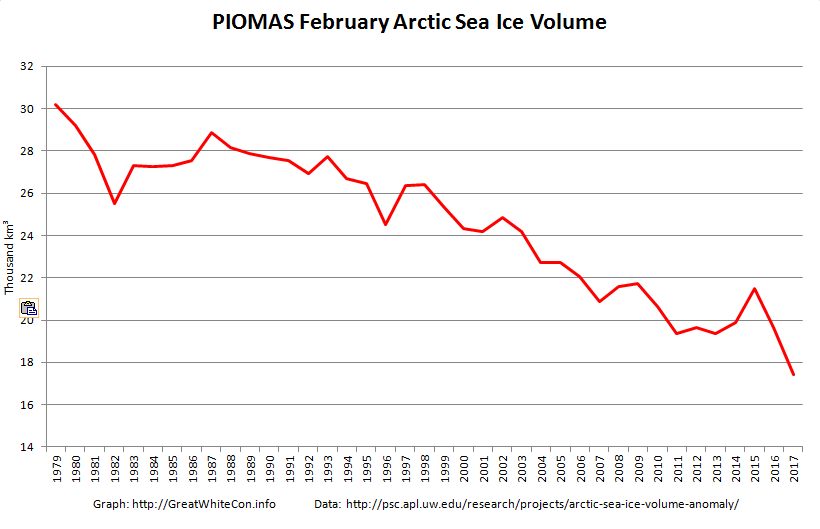
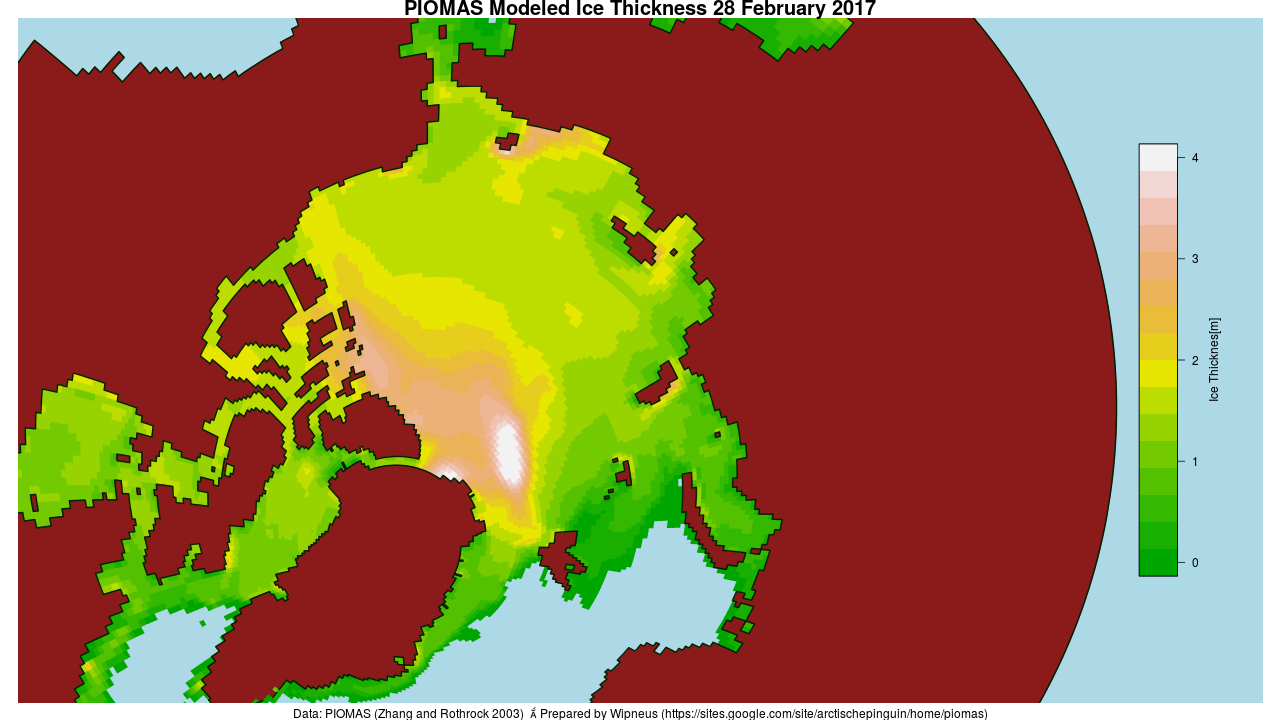
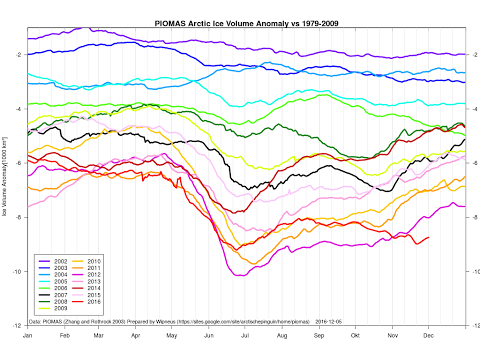
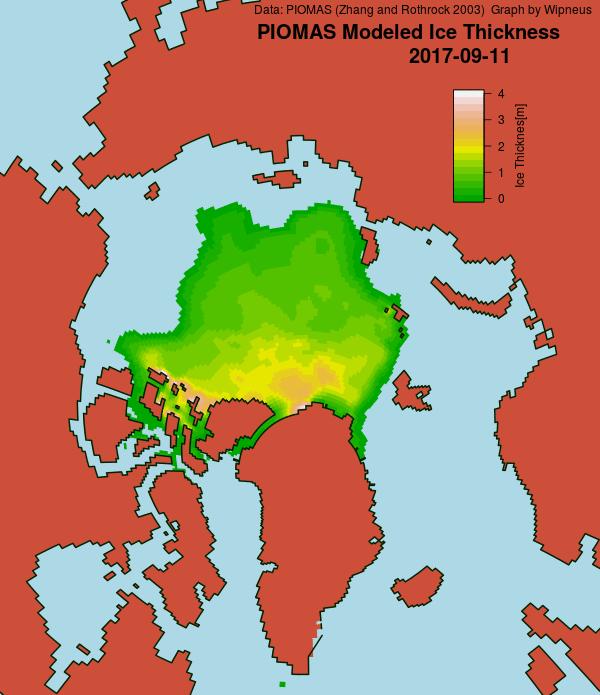
The ever industrious Wipneus has also called the PIOMAS minimum volume for 2017:
Minimum volume was reached at 11th September: 4.542 103km3, which is fourth lowest after 2012, 2011 and 2016 (resp 3.673, 4.302, 4.402) and just below 2010 (4.582).
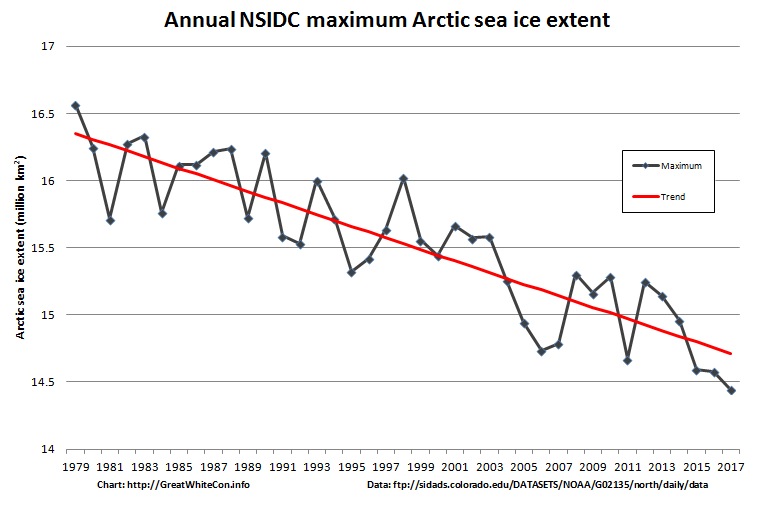
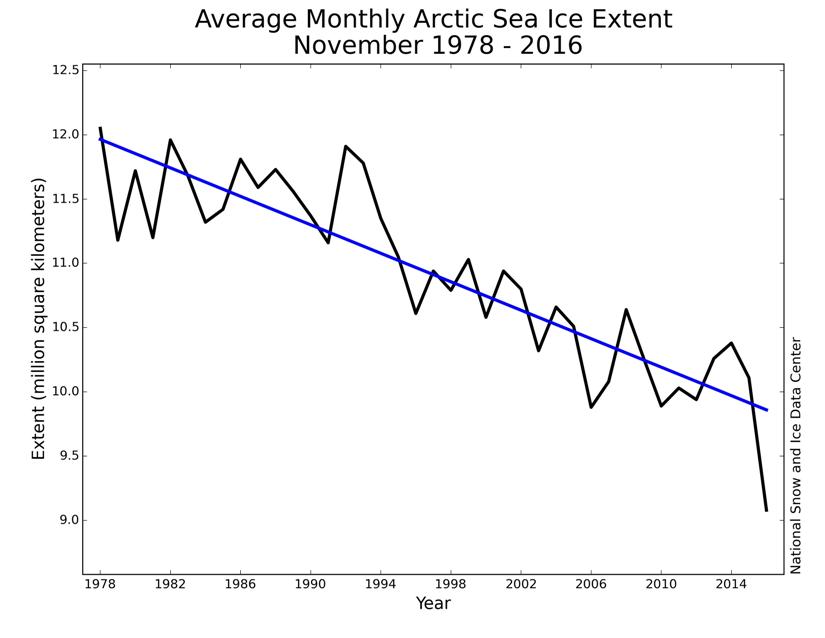
Here’s the 2017 edition of our annual NSIDC daily max/min extent graph:
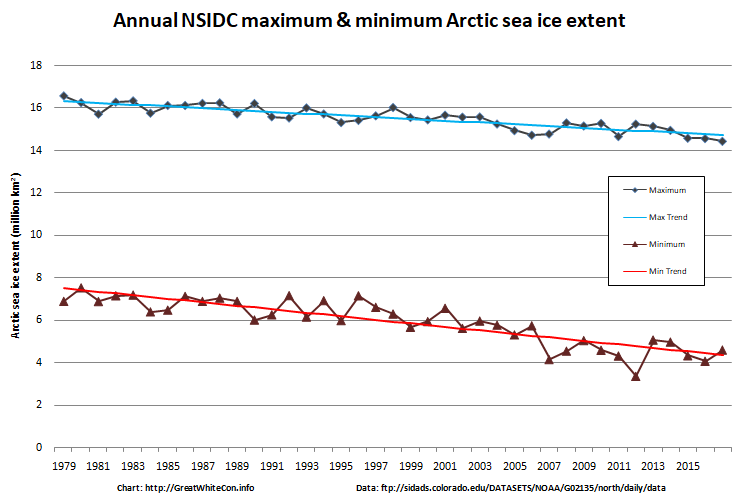
The maximum extent was the lowest in the satellite record, and the minimum was just fractionally above the trend line. For those that concern themselves with “statistical significance”, the PIOMAS minimum volume was a “statistical tie” for second place:

Watch this space!