Depending on whether you’re reading an “alarmist” or a “skeptical” web site you may have been told either that the Northern Sea Route is already “open” or that the “icebreaker stuck in the sea ice off Pevek” escaped very late this summer. Here at Great White Con we like to think of ourselves as “realists”, so what are the actual facts of the matter.
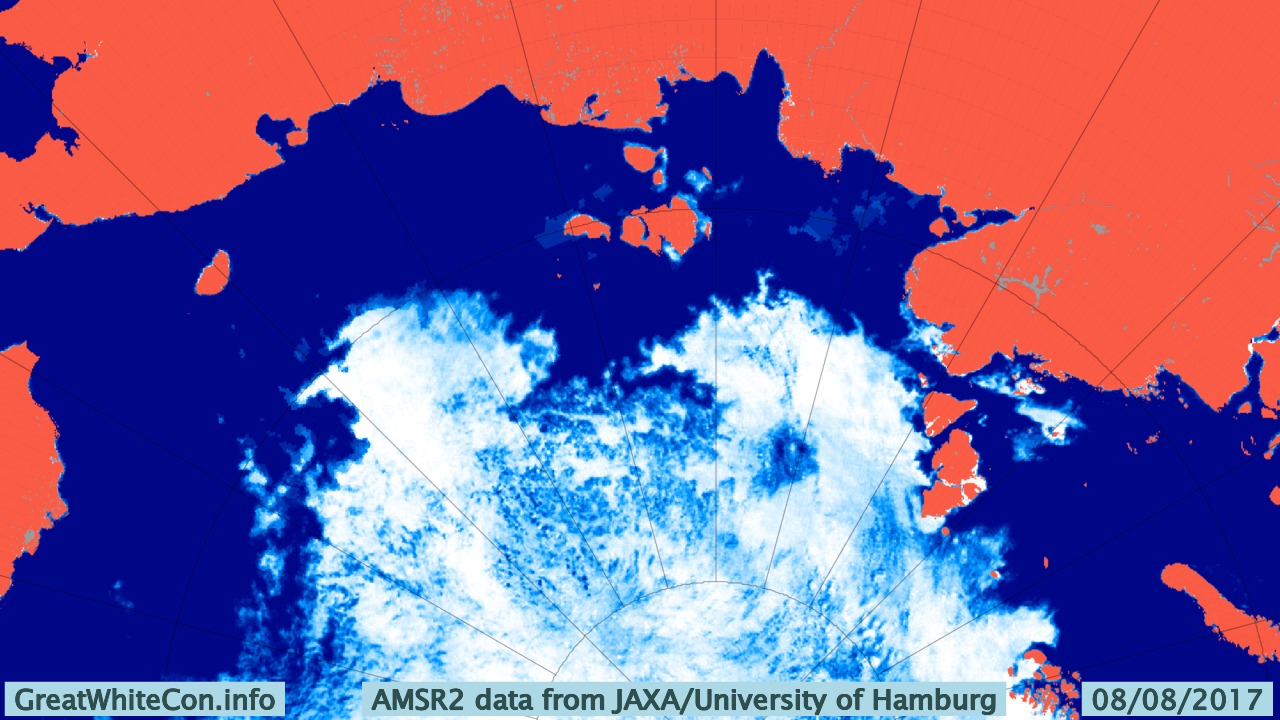
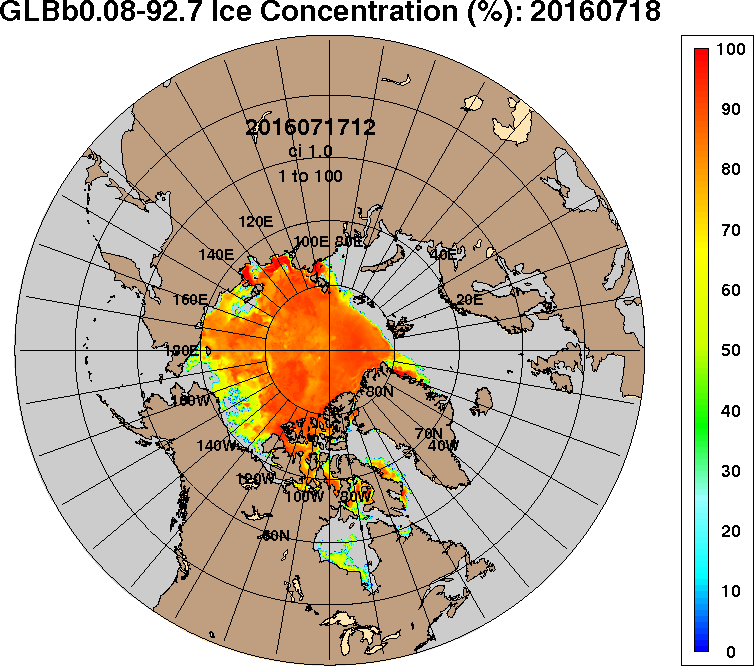
Our customary way of looking at such things is to use the Canadian Ice Service’s definition of “open” for the Northwest Passage, which seems to be 3/10 or less concentration along the entire route. That would allow an intrepid little yacht like Northabout through without too much trouble, but that point has not quite been reached yet this year. The NSR looks to be eminently “open” already if you only look at an AMSR2 concentration map:
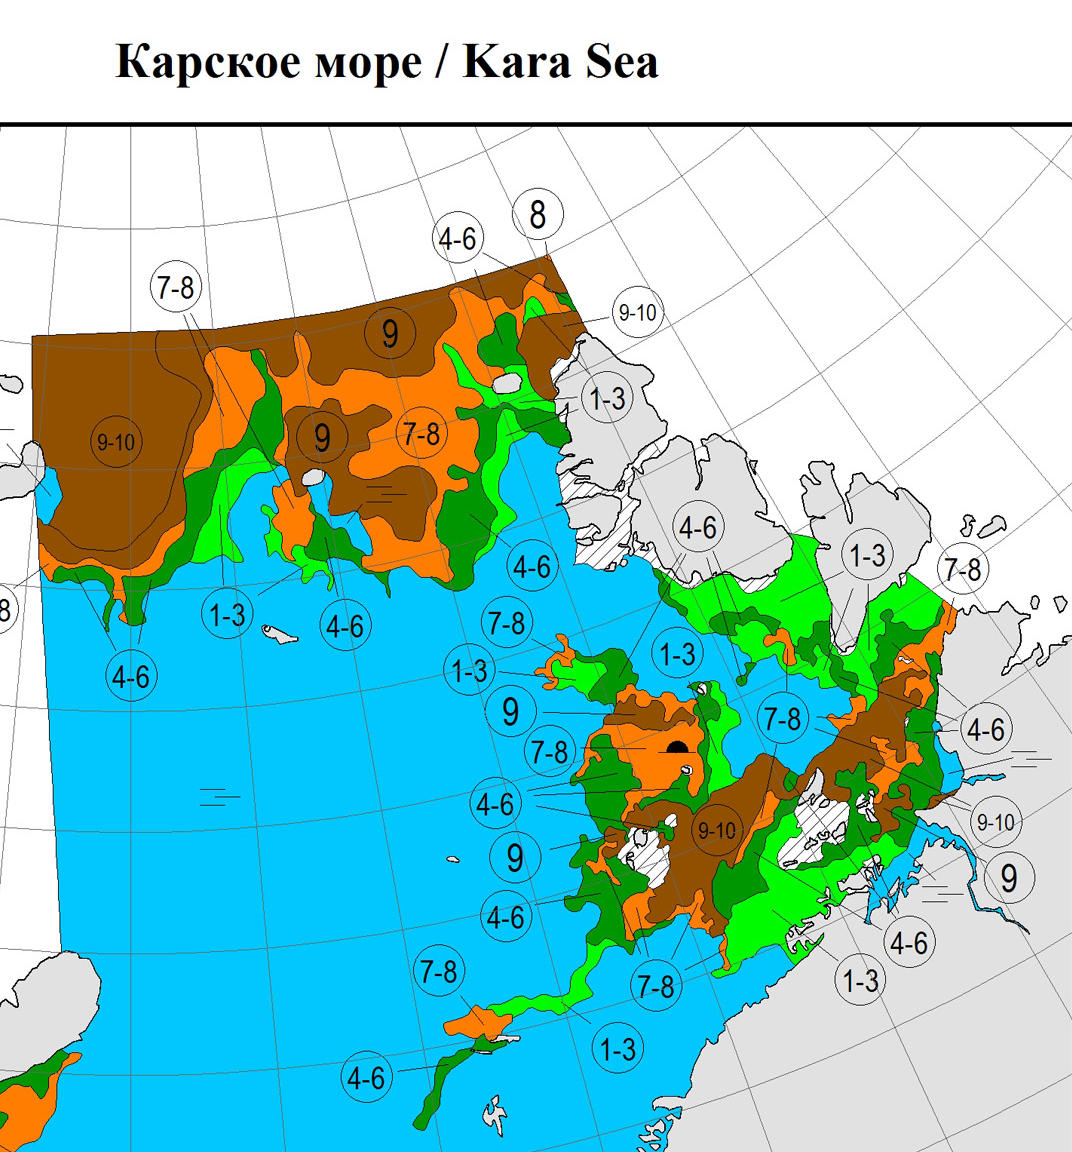
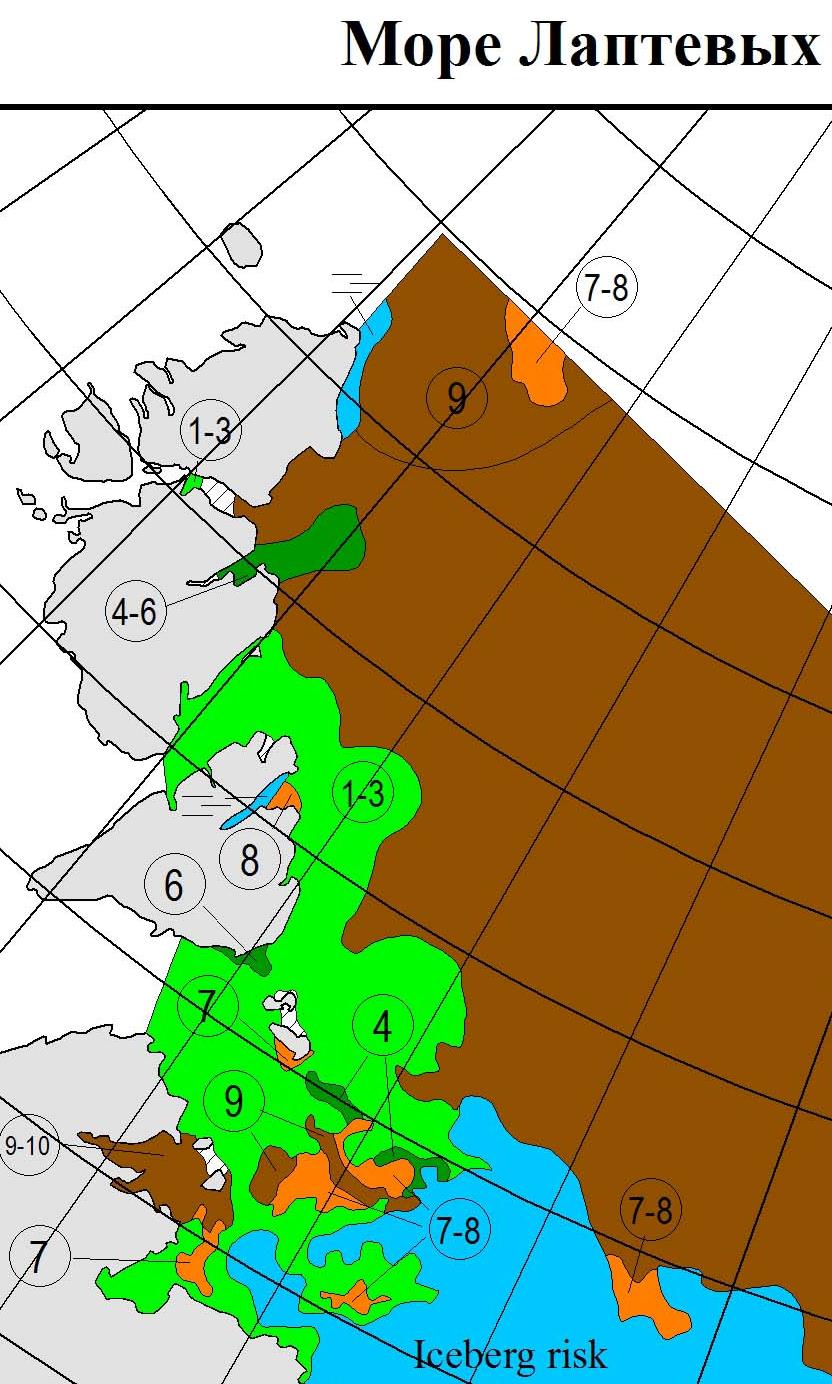
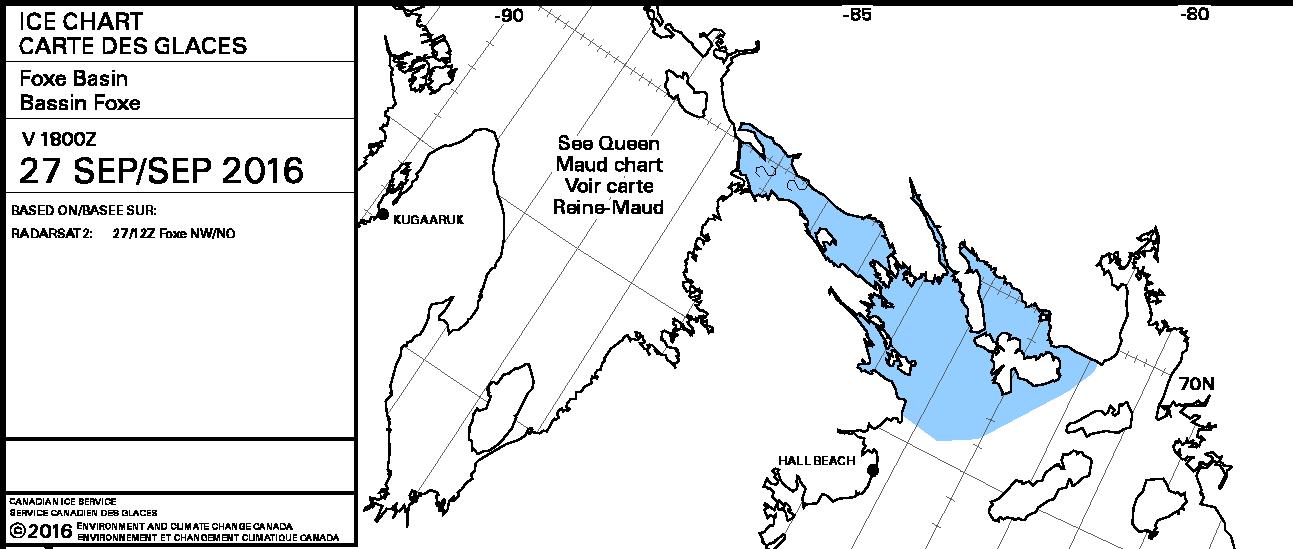
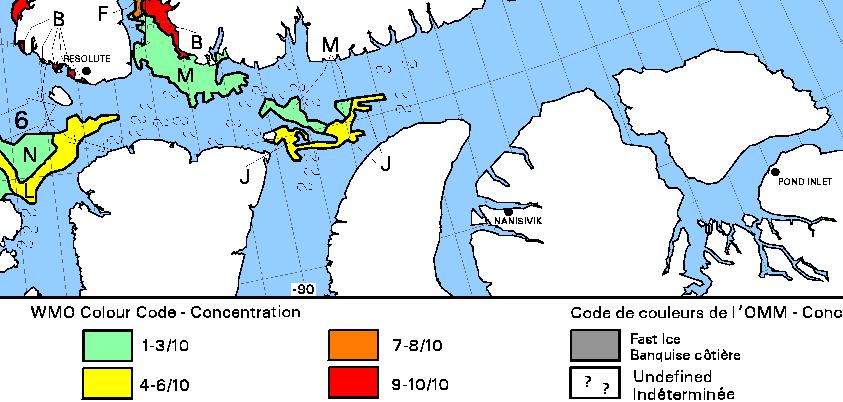
However according to the Russian Arctic and Antarctic Research Institute (AARI for short) there is still not a suitably simple way through Vilkitsky Strait. Here’s their latest ice chart of the area:
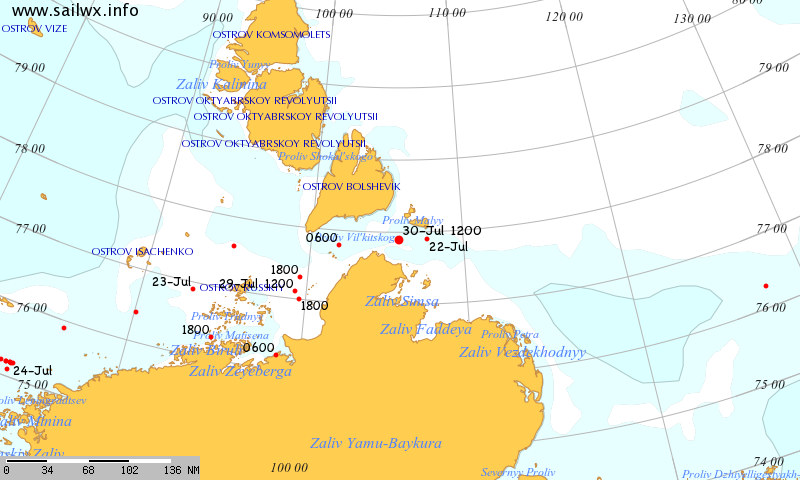
Convoys led by nuclear powered icebreakers have already passed through the Vilkitsky Strait this summer. See for example this tracking map of Yamal from a few days ago:
Also an unaccompanied liquid natural gas carrier has made it through the Vilkitsky Strait already this year. According to a Total press release:
After loading its cargo at the Snøhvit LNG export terminal in Norway, in which Total has an 18.4% interest, the Christophe de Margerie is taking the Northern Sea Route to Boryeong in South Korea, where it will deliver a cargo for Total Gas & Power. It’s the first unescorted merchant LNG vessel ever to take this route, which makes it possible to reach Asia via the Bering Strait in 15 days versus 30 days via the Suez Canal.
This technological feat was made possible through the participation of Total teams to the design of these next-generation LNG carriers. Compilations of technology, they efficiently transport large quantities of LNG year-round, without requiring escort icebreakers during the period from July to November. The Christophe de Margerie is the first of a total of 15 planned LNG carriers that will be gradually deployed.
As you can see, whilst it travels forwards in open water the Christophe de Margerie goes into reverse when breaking ice! Little yachts and other unaccompanied vessels lacking an ice class certificate will have to wait just a little longer however, unless of course they are inclined to be “intrepid”.
[Edit – August 19th]
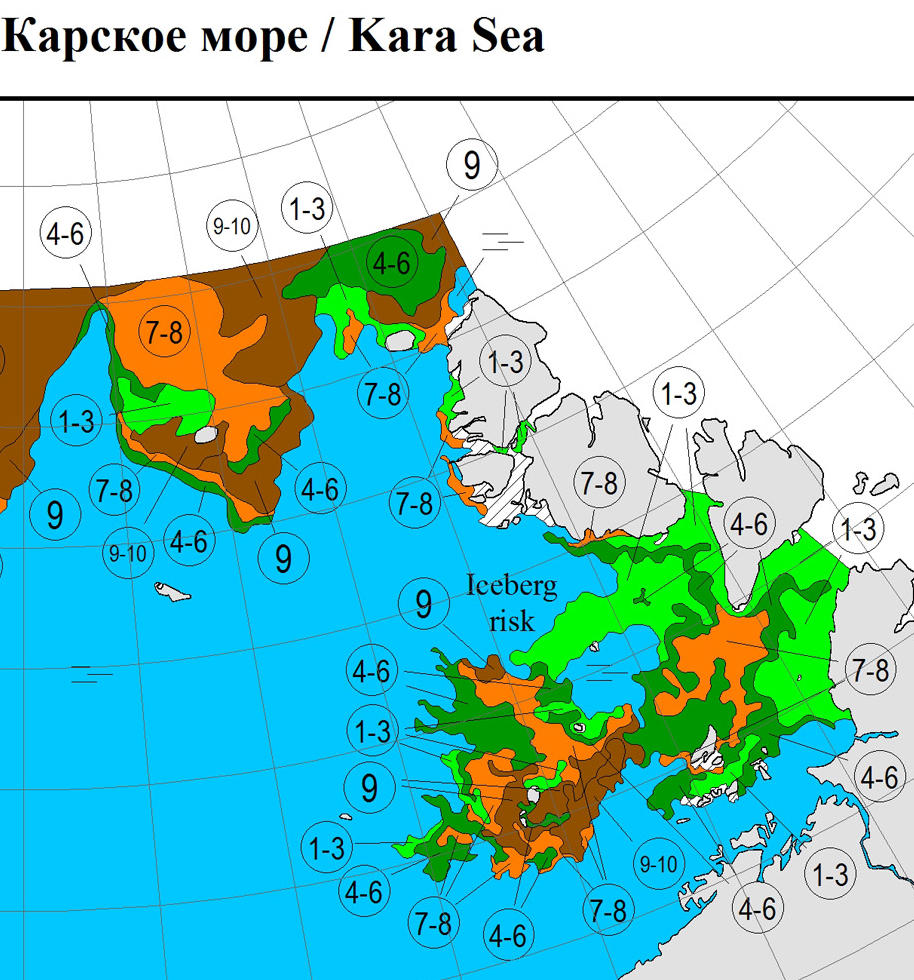
As Cesium points out below, there is now a <= 3/10 concentration channel through the Vilkitsky Strait on the AARI maps.
Here’s a couple of Sentinel 1A tiles from this morning stitched together:
We can now safely declare the Northern Sea Route “open”, even for less intrepid little yachts.
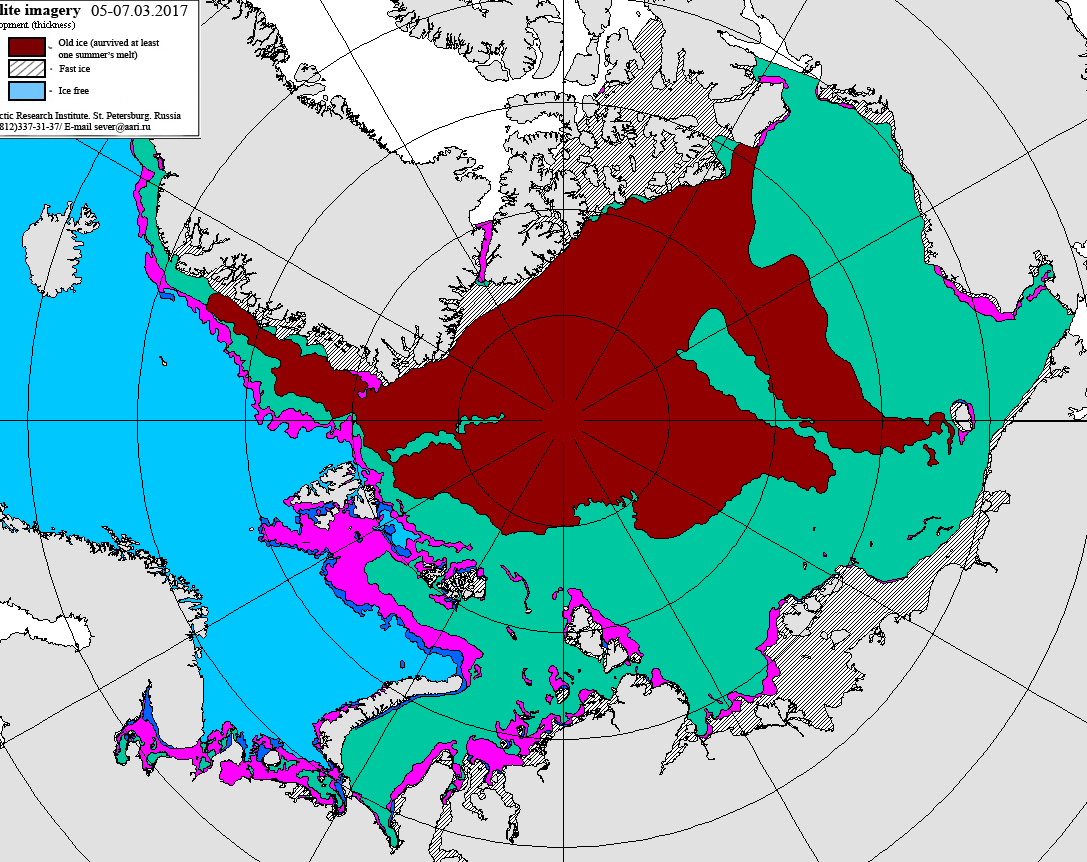
Our old friend Tony Heller has been publishing a glorious Gish gallop of articles showing OSI-SAF Arctic sea ice type maps and claiming amongst other things:
A decade after declaring the end of Arctic multi-year sea ice, it has increased 116% and now covers nearly half of the Arctic.
That is of course not true. In actual fact it’s an “alternative fact” par excellence!
I have been endeavouring to point out to Tony the error of his ways for weeks now, but my words have wisdom have fallen on deaf ears. My graphic graphics have been viewed only by “snow blind” eyes. My incontrovertible arguments have been misapprehended by purpose built dumb and dumberer wetware illogic. By way of example, here’s a refreshingly ad hom free riposte from a typical commenter:
Jimmy Boy actually thinks his honesty and integrity are equally to that of Anthony Watts???
No doubt we’ll get around to discussing Anthony Watts “honesty and integrity” again soon, but for now let’s see if we can finally set this particular badly warped record straight shall we?
Here is the latest OSI-SAF ice type map, for March 16th 2017:
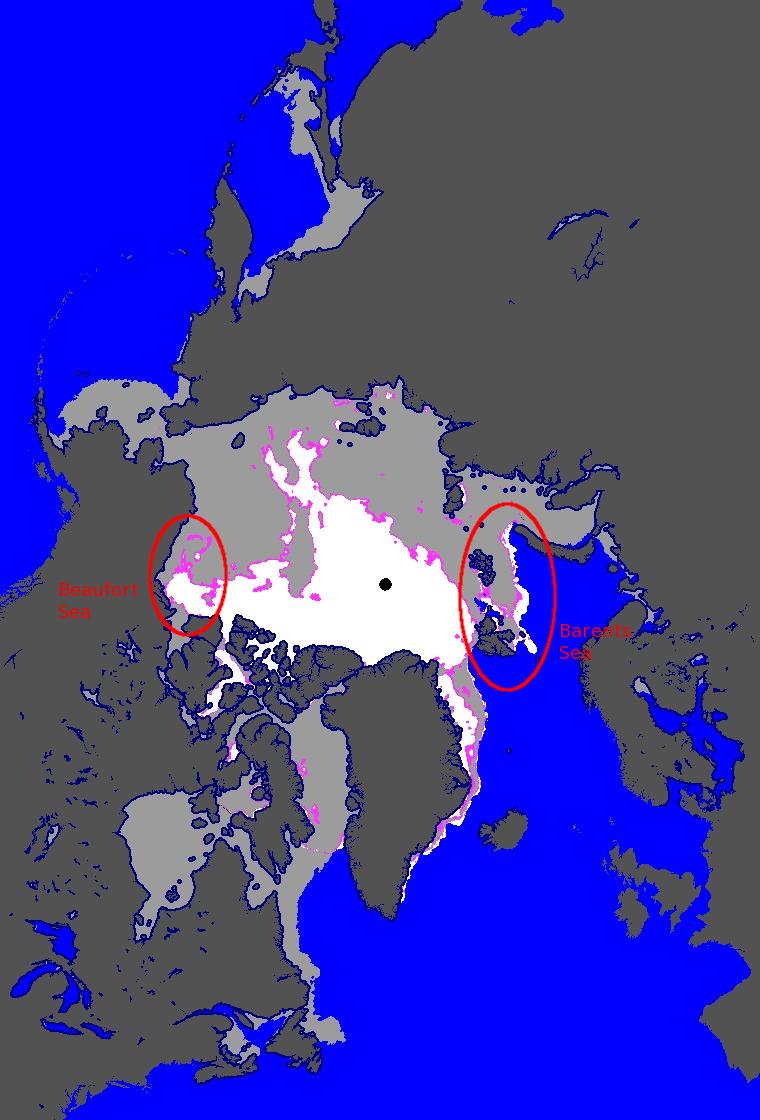
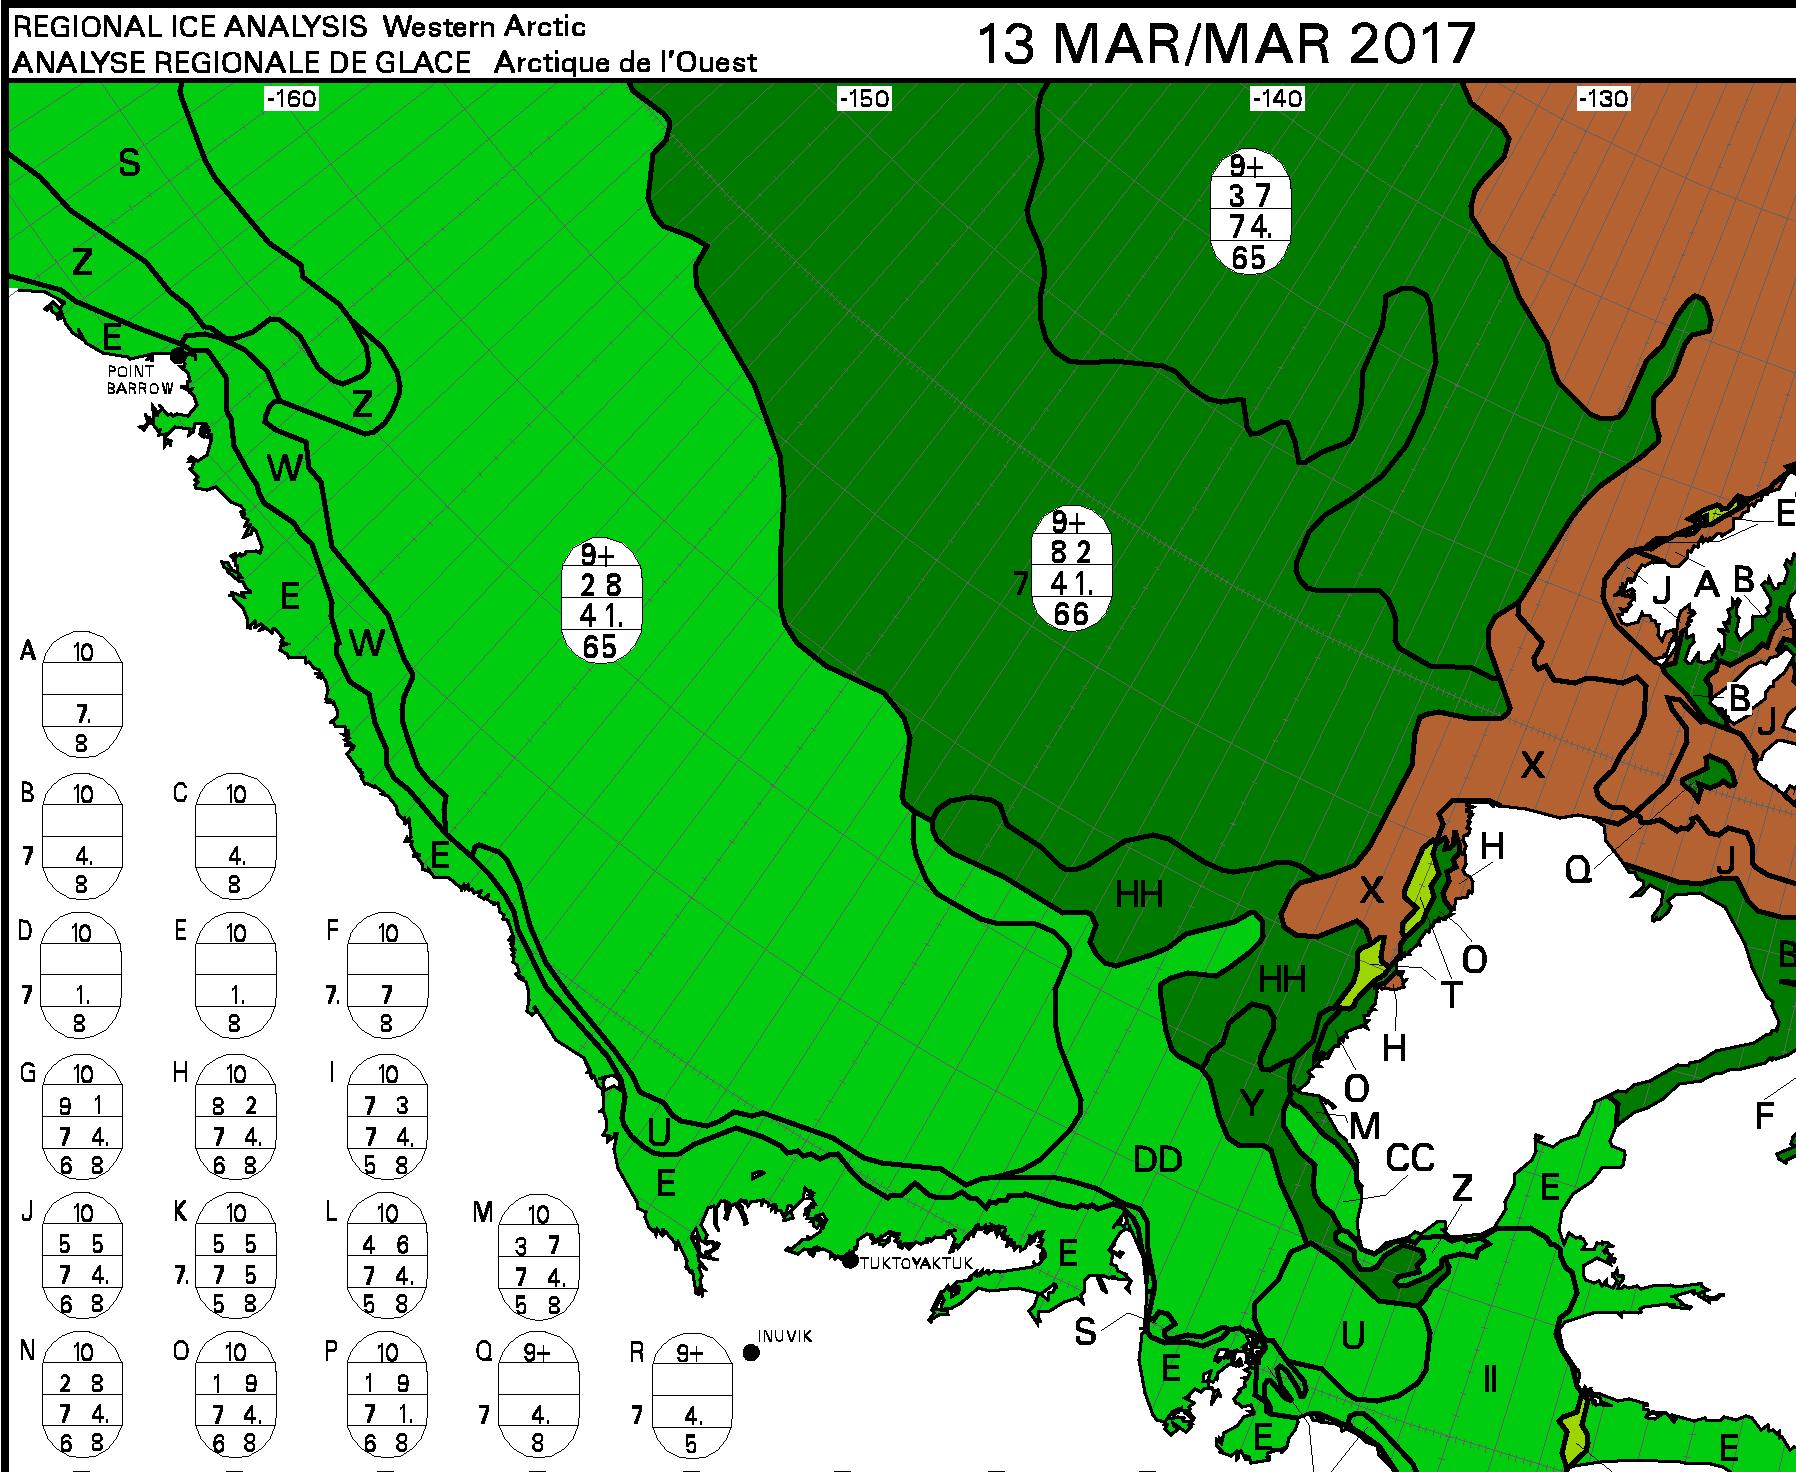
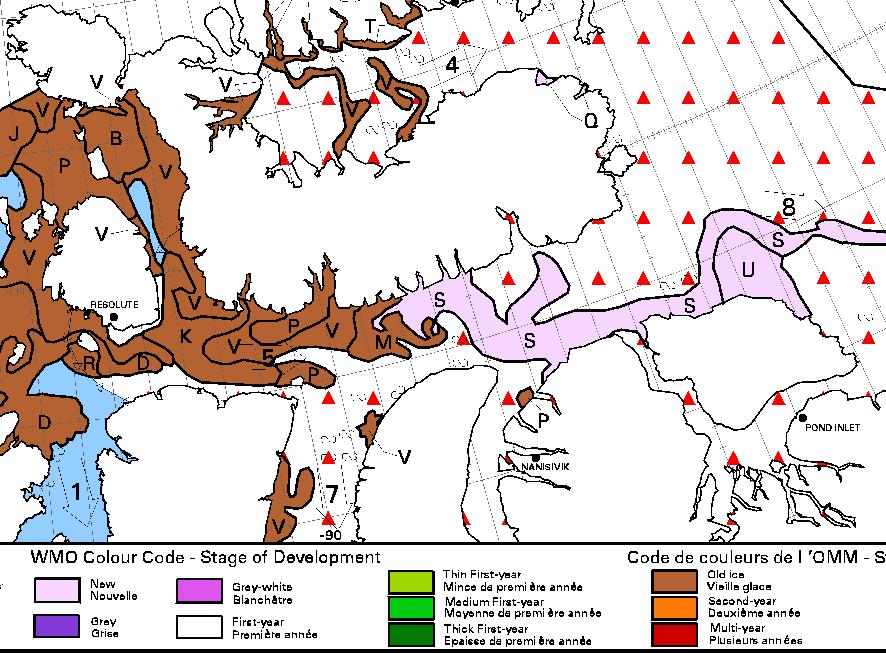
The highlighted area on the left is the Beaufort Sea to the north of Canada. If you’re not “snow blind” you can no doubt readily perceive a large area of allegedly “multi-year sea ice” coloured white. Let’s now take a look at the most recent Canadian Ice Service map of the same area, for March 13th 2017:
Canadian Ice Service sea ice stage of development on March 13th 2017
Can you see a large area of brown “old ice” covering most of the surface of the Beaufort Sea?
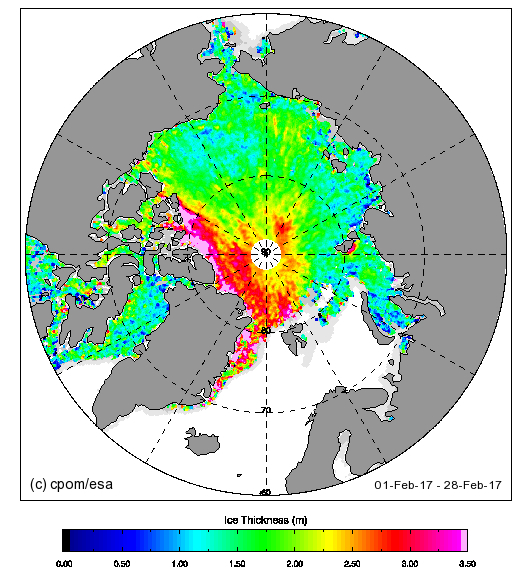
Now let’s take a look on the other side of the Arctic at the area north of the Barents Sea. Can you see a large area of allegedly “multi-year sea ice” coloured white inside the red ellipse on the OSI-SAF map? Next let’s take a look at the most recent University of Bremen SMOS map of the Arctic, for March 15th 2017:
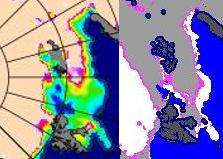
On this map the brightly coloured areas show sea ice that’s less than 50 cm thick. Even when two people explain this point slowly to them the “deplorable denizens” at Mr. Heller’s blog do not manage to get the message! So now let’s look at a closeup comparison between the OSI-SAF ice type map and the University of Bremen SMOS sea ice thickness map:
As I popped the question to the deplorable denizens over on Tony Heller’s Deplorable Climate Science blog:
For anybody else here who isn’t deaf, dumb and blind, please note all the young, thin sea ice around Svalbard identified by SMOS that OSI-SAF currently classifies as “multi-year” ice.
At the risk of (repeating myself)^n, n → ∞:
Why do Tony, Tommy and Andy persist with this nonsense?
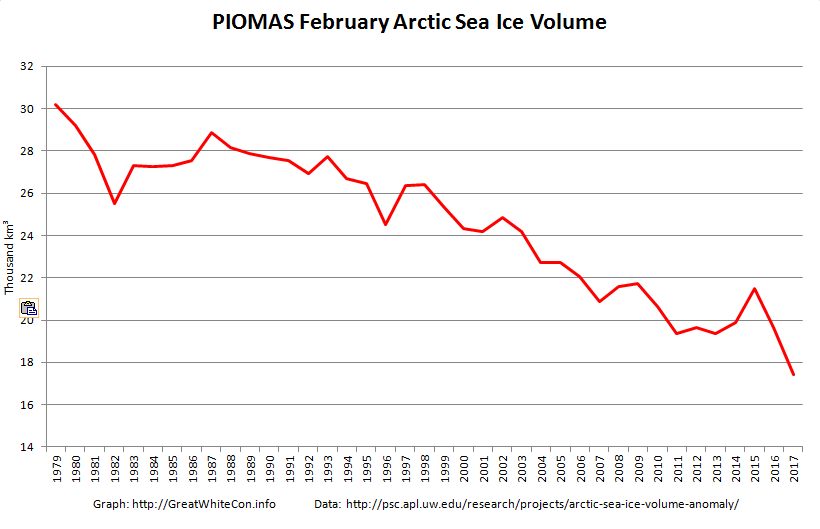
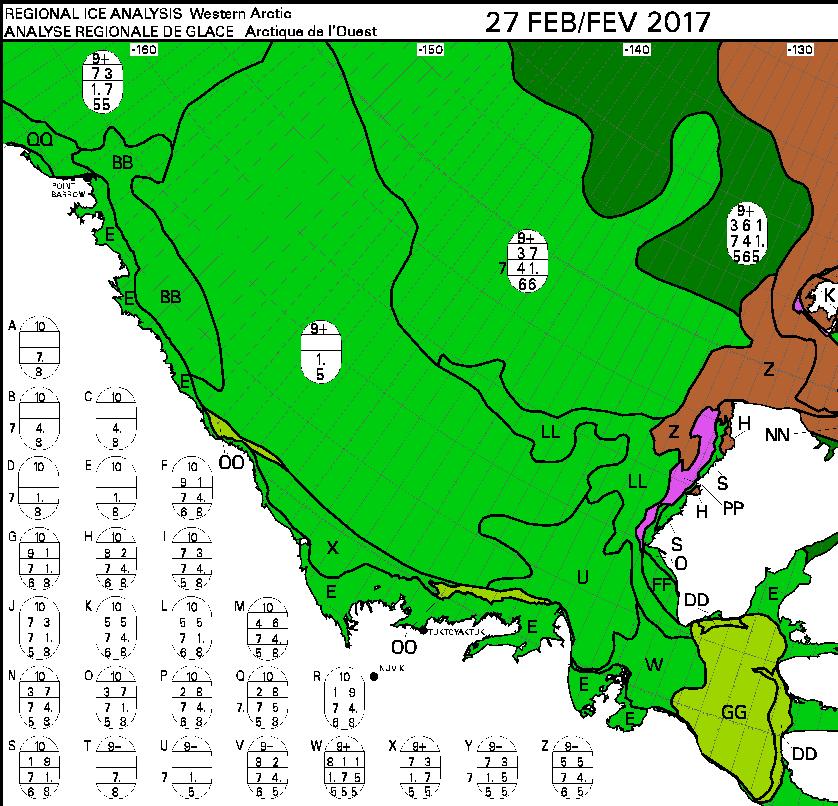
The February 2017 PIOMAS Arctic sea ice volume numbers are out. It’s no longer surprising to report that they are the lowest ever for the month of February in records going back to 1979:
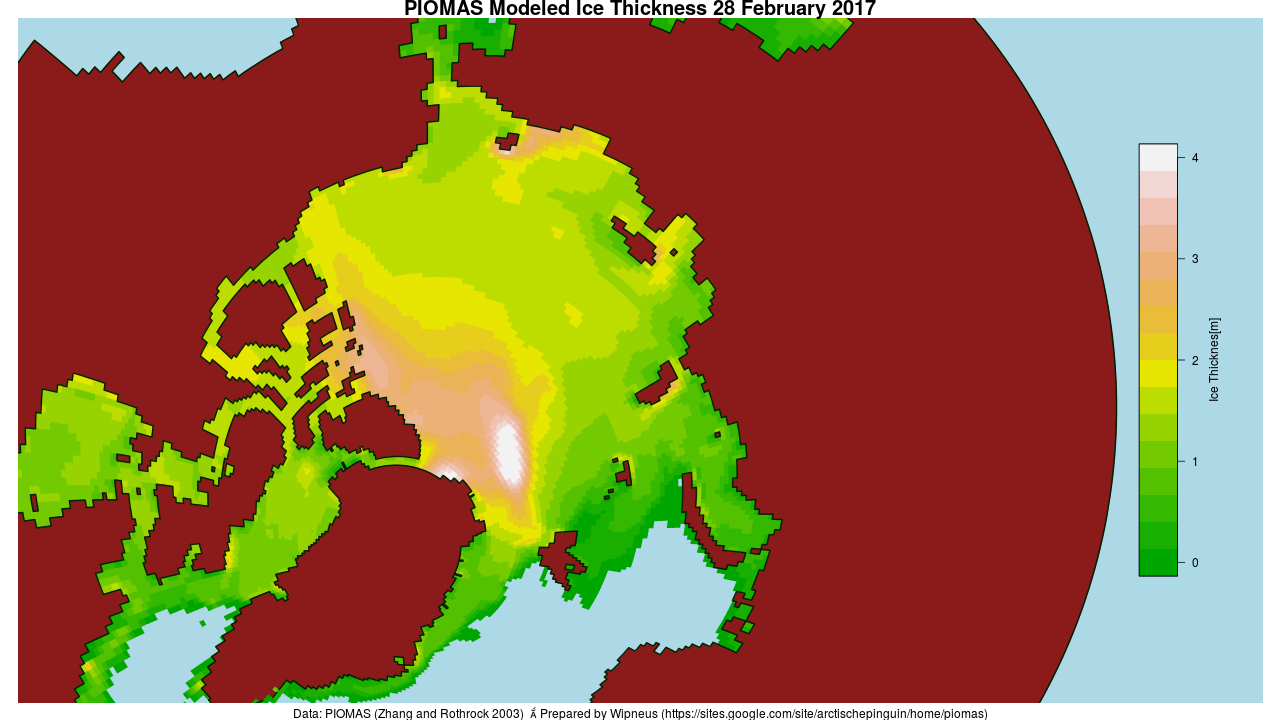
Here’s the PIOMAS gridded thickness map for February 28th:
There does seem to be a small patch of slightly thicker ice in the East Siberian Sea off Chaunskaya Bay, but there’s still a much larger area of sub 0.5 meter thick ice in the Laptev and Kara Seas.
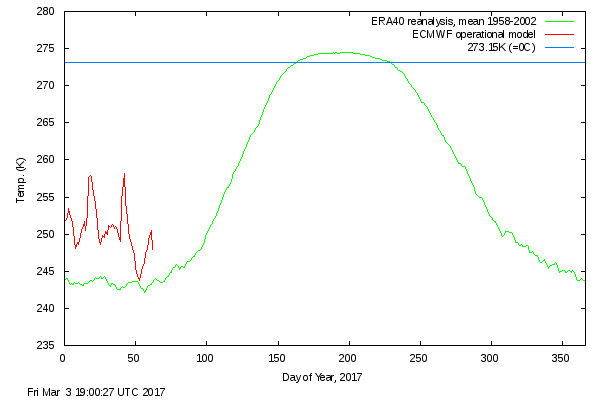
The Danish Meteorological Institute’s temperatures for the “Arctic area north of the 80th northern parallel” graph shows somewhat more “normal” readings in February 2017, but still without falling below the ERA40 climatology this year or in 2016:
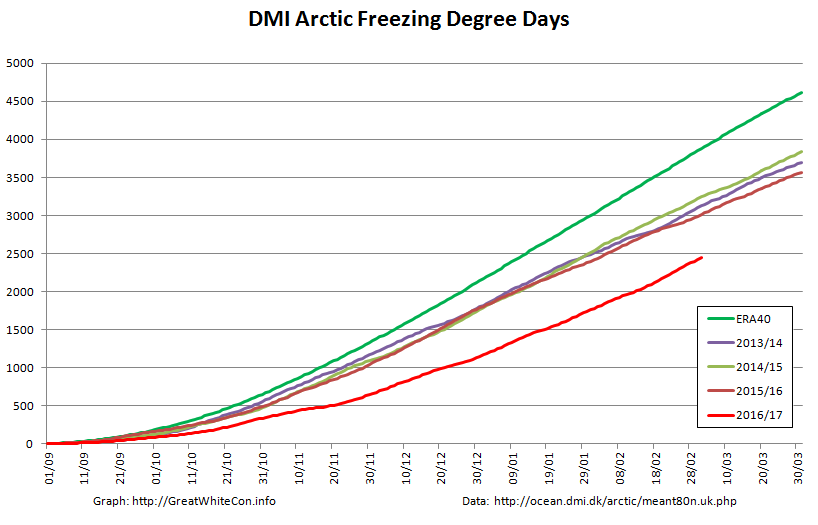
The graph of cumulative Freezing Degree Days (FDD for short) is still far below all previous years in DMI’s records going back to 1958:
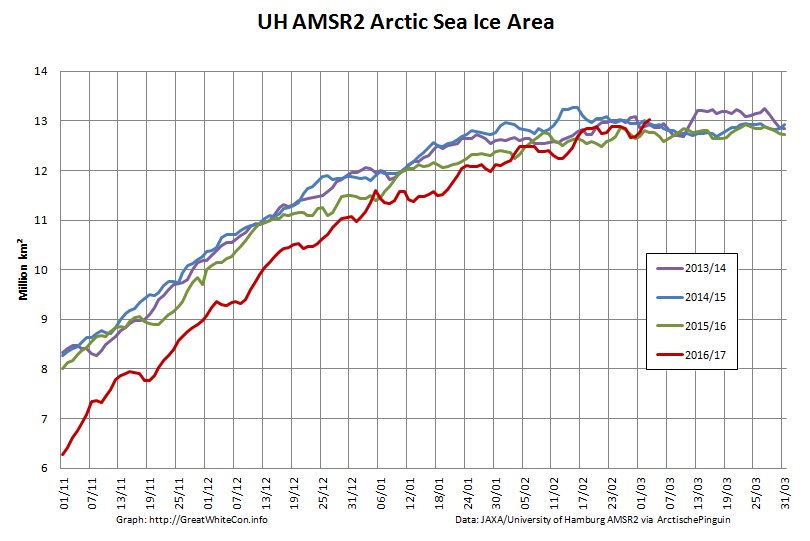
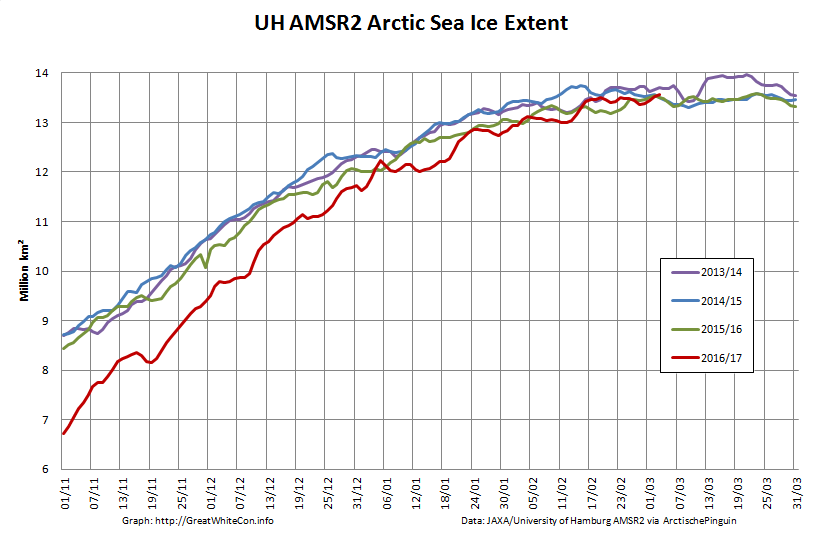
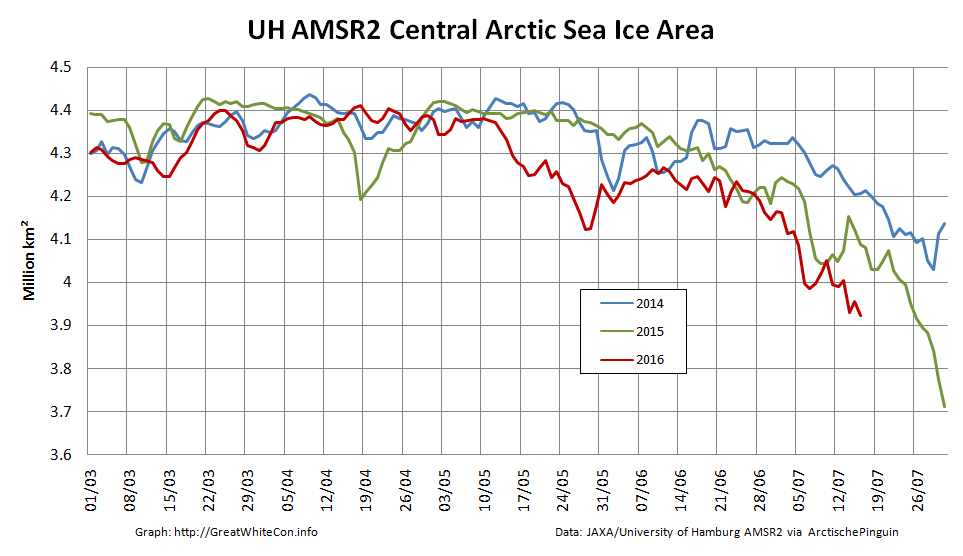
Finally, for the moment at least, here’s the high resolution AMSR2 Arctic sea ice area and extent:
I’m going to have to eat some humble pie, or crow pie as I gather it’s usually referred to across the Atlantic, following my tentative “2017 maximum prediction” a couple of weeks ago. Both area and extent posted new highs for the year yesterday, with area creeping above 13 million square kilometers for the first time this year.
[Edit – March 7th]
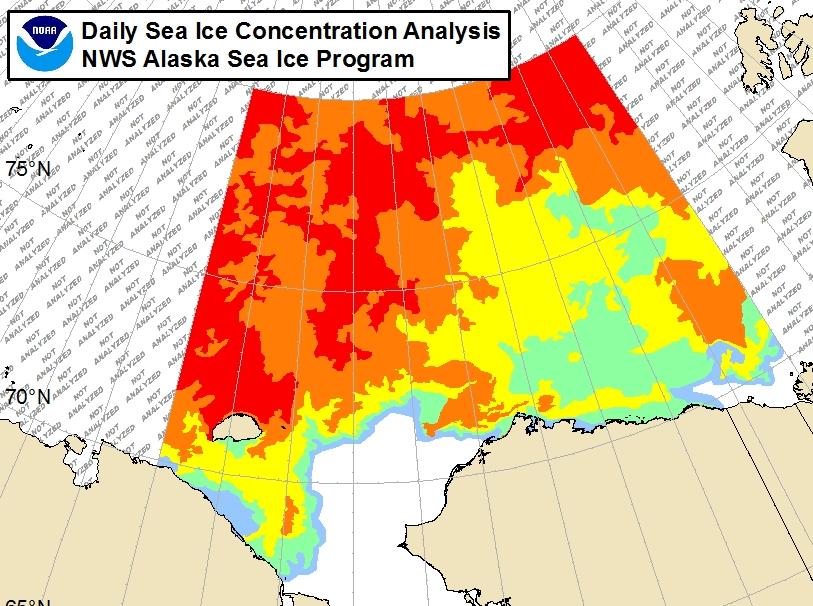
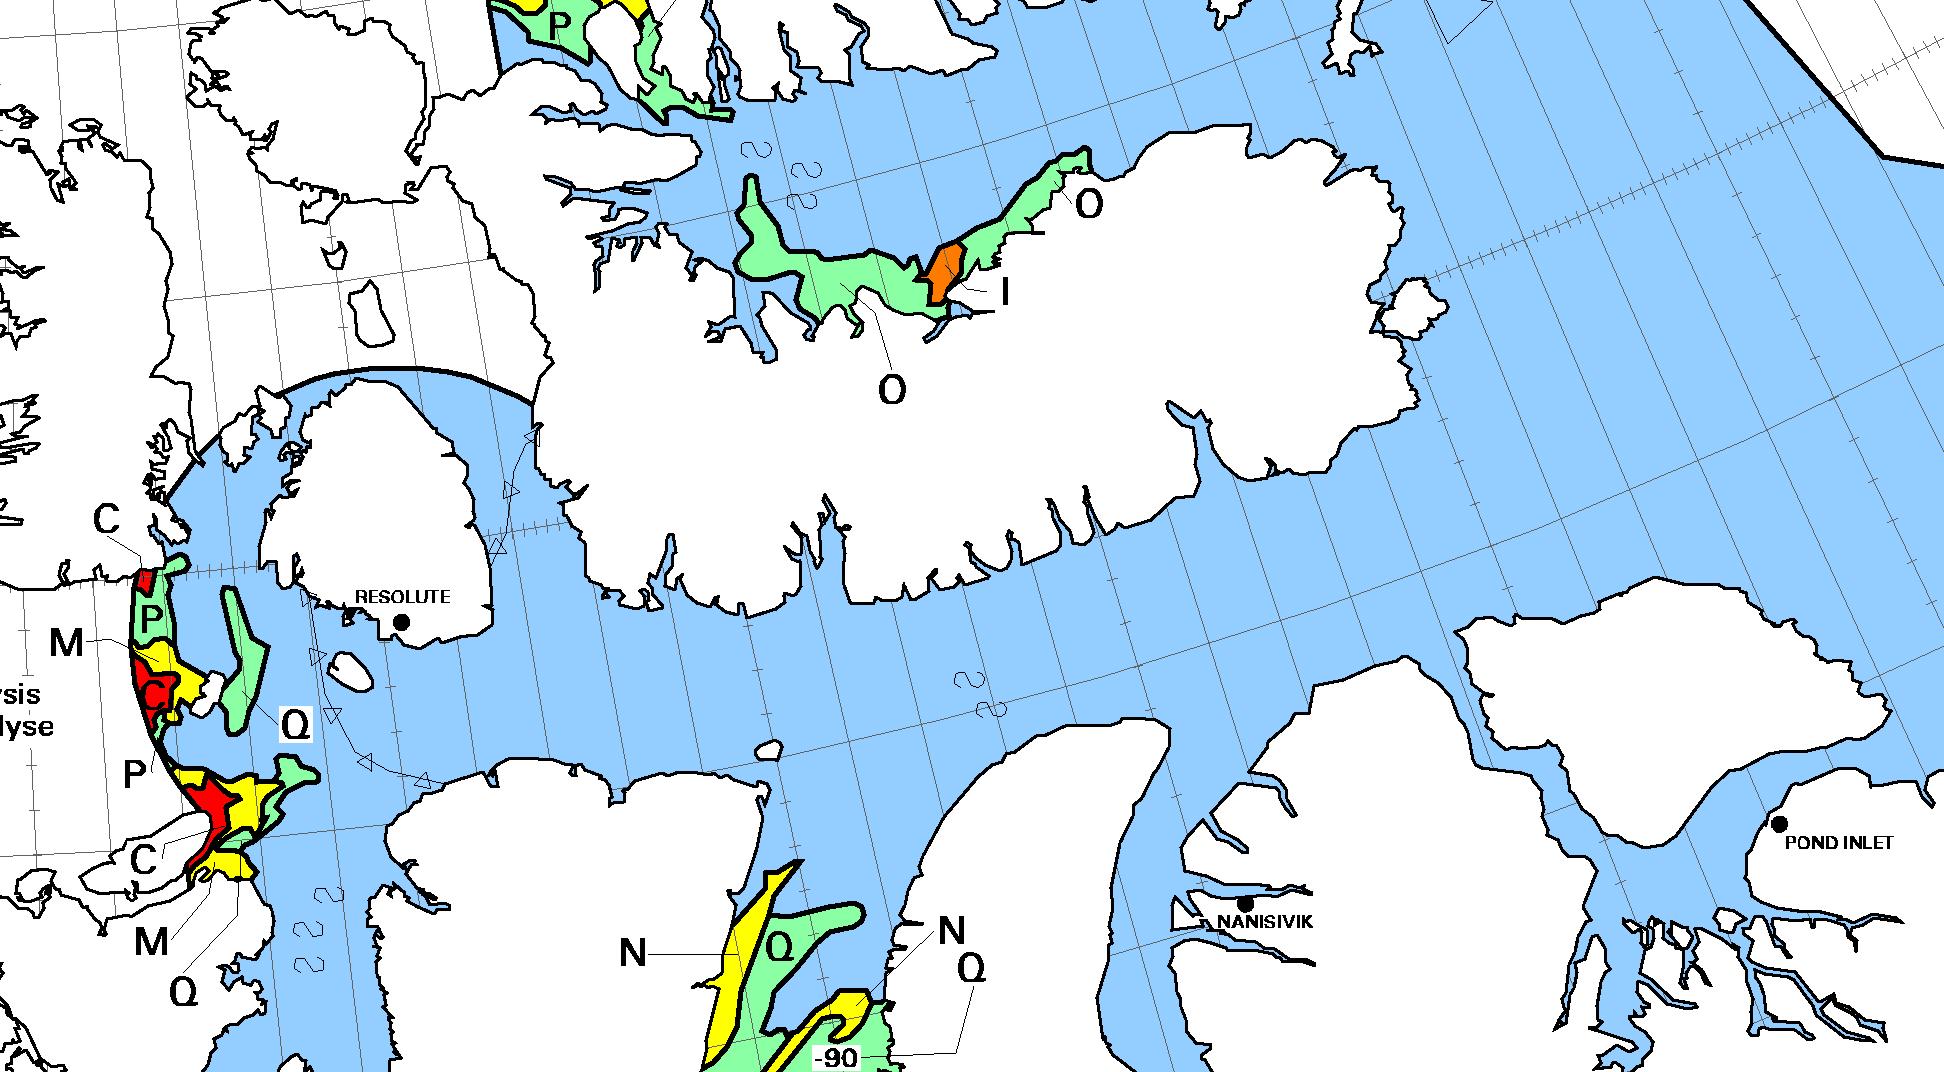
Commenter Michael Olsen suggests that “thicker ice being pushed into the Alaskan and Russian parts of the Arctic Ocean”. Here’s some evidence:
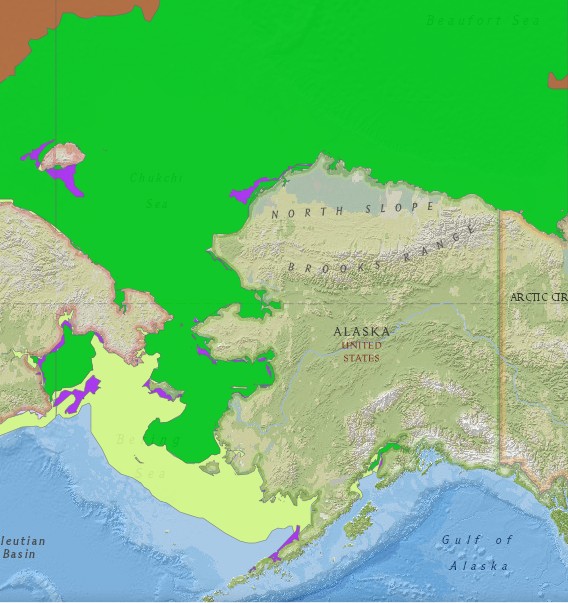
The United States’ National Weather Service current sea ice stage of development map for Alaskan waters:
This week’s Canadian Ice Service sea ice stage of development map is expected later today, so for now here’s last week’s:
Especially for Michael, a visual image of all the “thicker ice [that’s been] pushed into the Russian parts of the Arctic Ocean” courtesy of the nice folks at NASA:
NASA Worldview “true-color” image of the Chukchi Sea on March 10th 2017, derived from the MODIS sensor on the Aqua satellite
[Edit – March 12th]
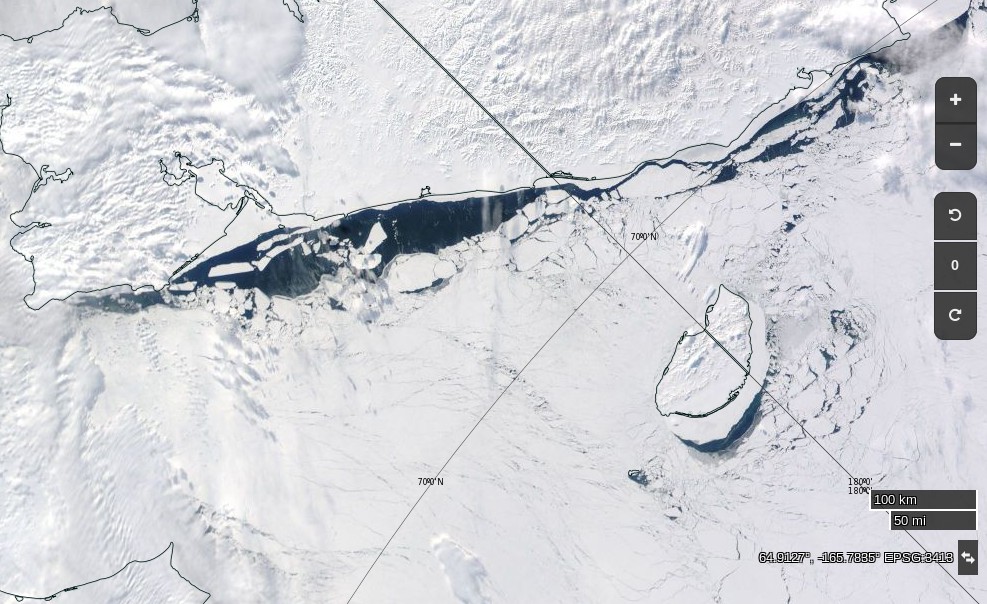
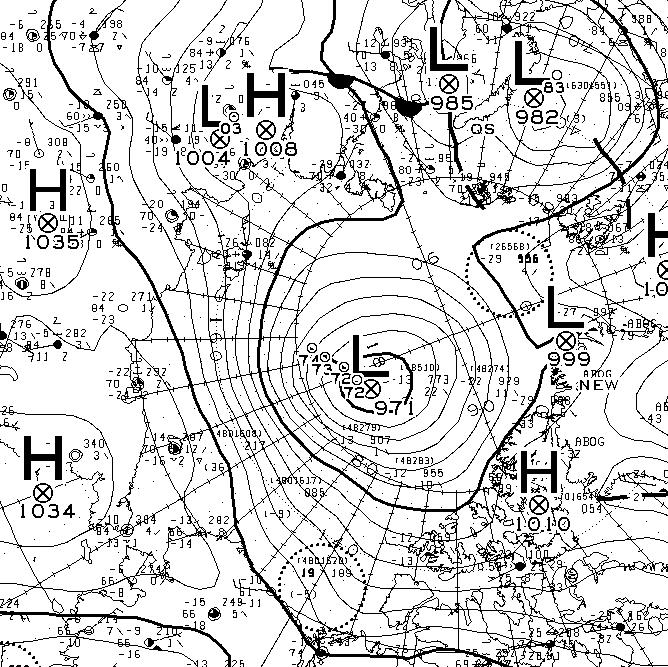
Yet another strong Arctic cyclone has been battering the sea ice in the Arctic Basin. According to Environment Canada this one bottomed out at 971 hPa at 06:00 UTC today.
A reader writes to ask us to explain the answer to the above question in more detail. Are you sitting comfortably once again? Then let us begin.
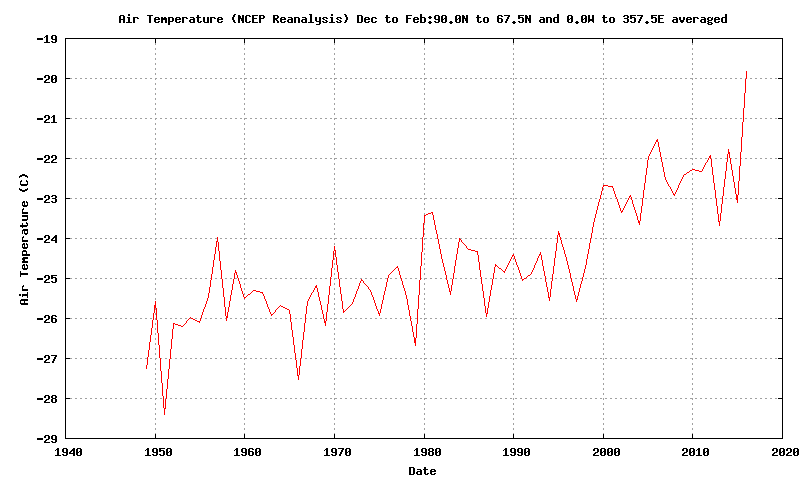
There has been a lot of unusual “weather” in the Arctic over the last twelve months. First of all there was an anomalously warm winter:
Then came what we dubbed the Great Arctic Anticyclone of 2016 in April. Take a look at what happened to the sea ice north of Alaska and Canada during the Spring and early Summer:
The ice was put through the mincer for the first time. Then during August there were a series of strong cyclones, collectively the Great Arctic Cyclone of 2016. The ice was put through the mincer once again, but in an anti-clockwise direction this time. Watch what happens in the Northwest Passage as summer turns to Autumn:
Some of the oldest, thickest ice in the Arctic has been chopped into small pieces which then easily flow through the channels of the Canadian Arctic Archipelago and into the Northwest Passage. Hence when the yacht Northabout (amongst others) was racing to reach Baffin Bay it wasn’t to avoid “the refreeze” as claimed in certain quarters. It was in fact to try and avoid the worst of the chopped up chunks of old sea ice being carried swiftly in their direction by winds and currents. Here’s what some of them looked like in close up:
The next question then becomes, if the Northwest Passage wasn’t refreezing then, is it freezing now? The answer is not yet. In fact the favourite talking point of the cryodenialista, McClure Strait at the western end of the “main” route through the Passage has recently become navigable:
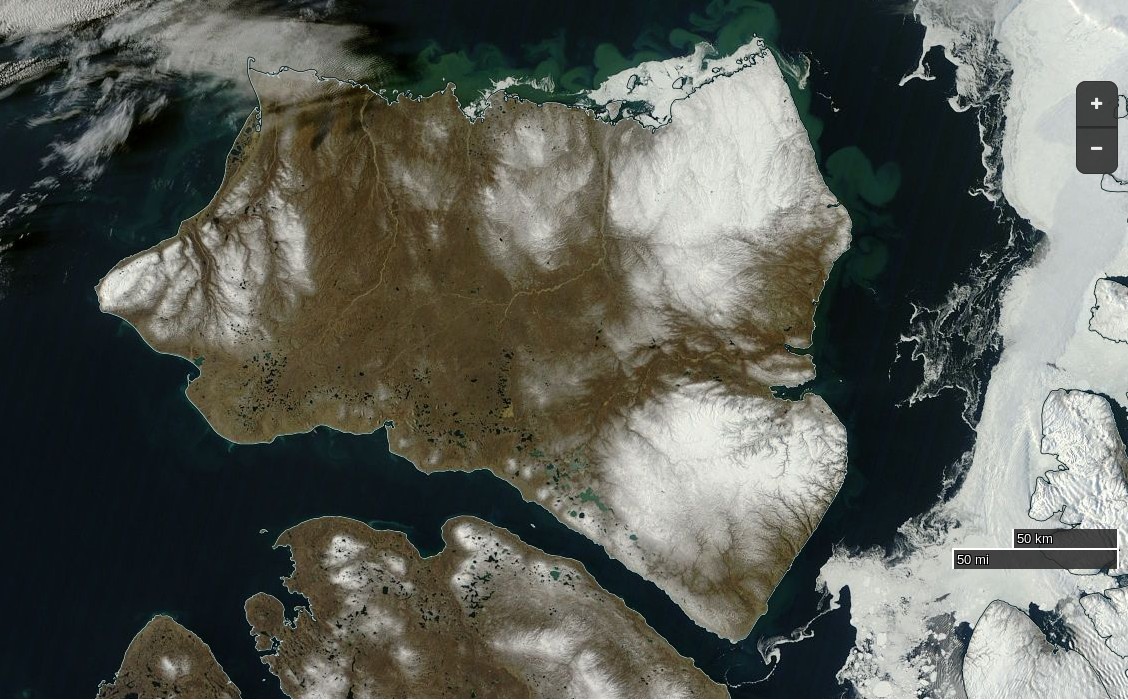
NASA Worldview “true-color” image of Banks Island on September 24th 2016, derived from the MODIS sensor on the Terra satellite
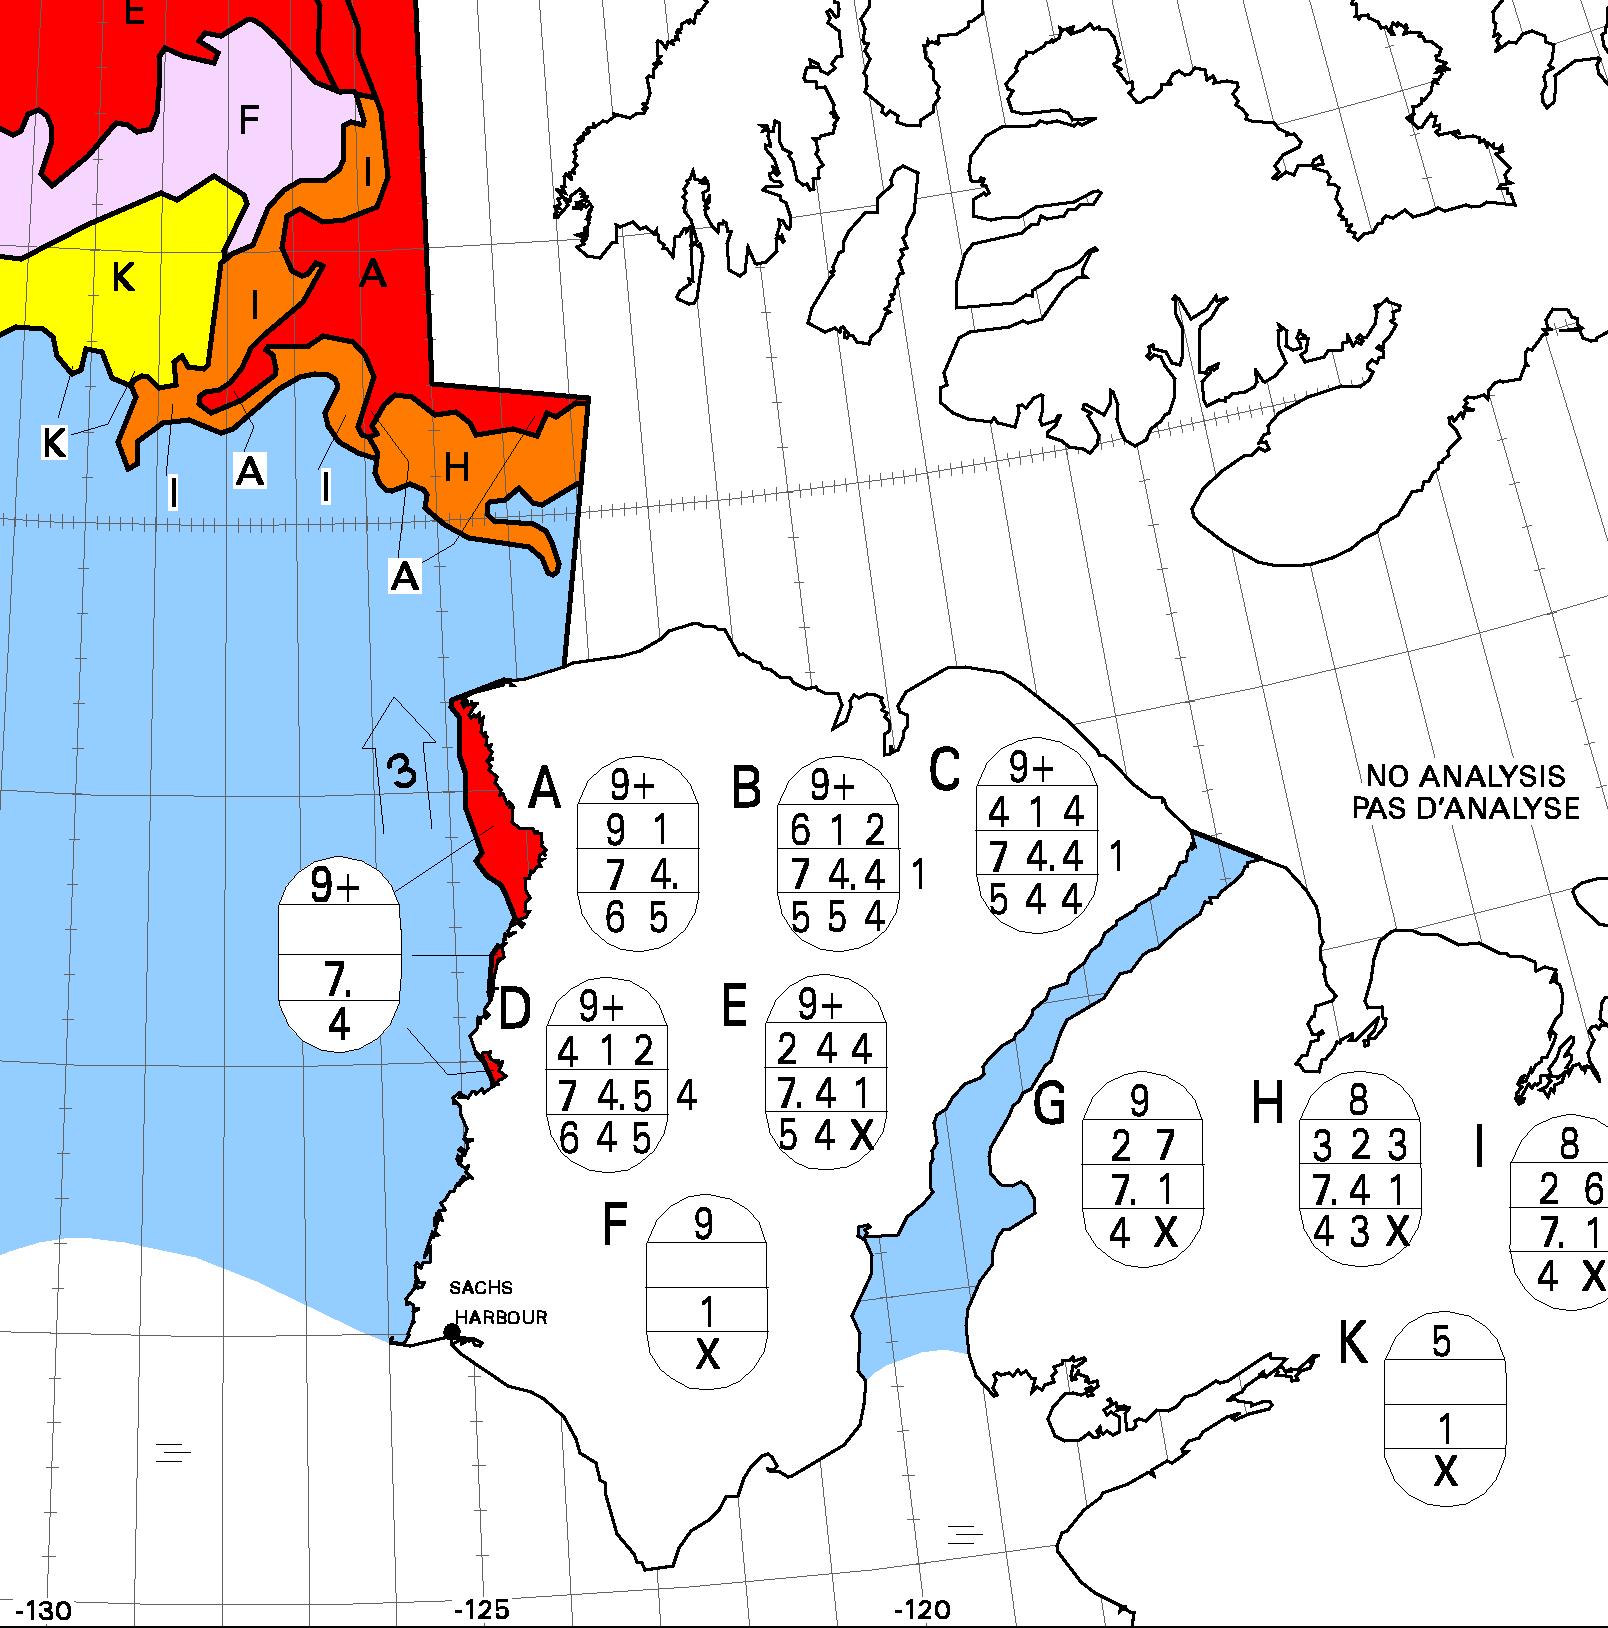
The “pretty pink” area towards the top left of the chart reveals “new ice”. The Northwest Passage will have started to refreeze when some of that shows up on a “stage of development” chart of the Passage itself, but that hasn’t happened yet. Here’s yesterday evening’s chart of the “Approaches to Resolute“:
Lots of old ice! It was raining in Resolute yesterday, and the old ice there was still melting:
[Edit – September 27th]
No sooner said than done! This evening’s ice charts from the CIS do now show some “pretty pink” new ice in the Northwest Passage:
The wispy areas of new ice are also visible on this “false-color” image of the Parry Channel:
NASA Worldview “false-color” image of the Parry Channel on September 27th 2016, derived from the MODIS sensor on the Terra satellite
However even if Northabout were still in Prince Regent Inlet she wouldn’t be “trapped in ice”. There is still a way back to Bristol via Fury and Hecla Strait:
A clear view of McClure Strait from the Terra satellite in “false colour”:
NASA Worldview “false-color” image of the McClure Strait on September 30th 2016, derived from the MODIS sensor on the Terra satellite
The inclusion of some infra red reveals the thicker old ice on the right noticeably paler than the new ice to its left. Compare also with the CIS ice chart, which has been rotated to match the orientation of the satellite image:
[Edit – October 2nd]
Pretty patterns in the new sea ice forming at the western entrance to McClure Strait:
NASA Worldview “true-color” image of the McClure Strait on October 1st 2016, derived from the MODIS sensor on the Aqua satellite
The freshly frozen new ice in the Northwest Passage has been spotted by the AMSR2 instrument aboard the Japanese “Shizuku” satellite:
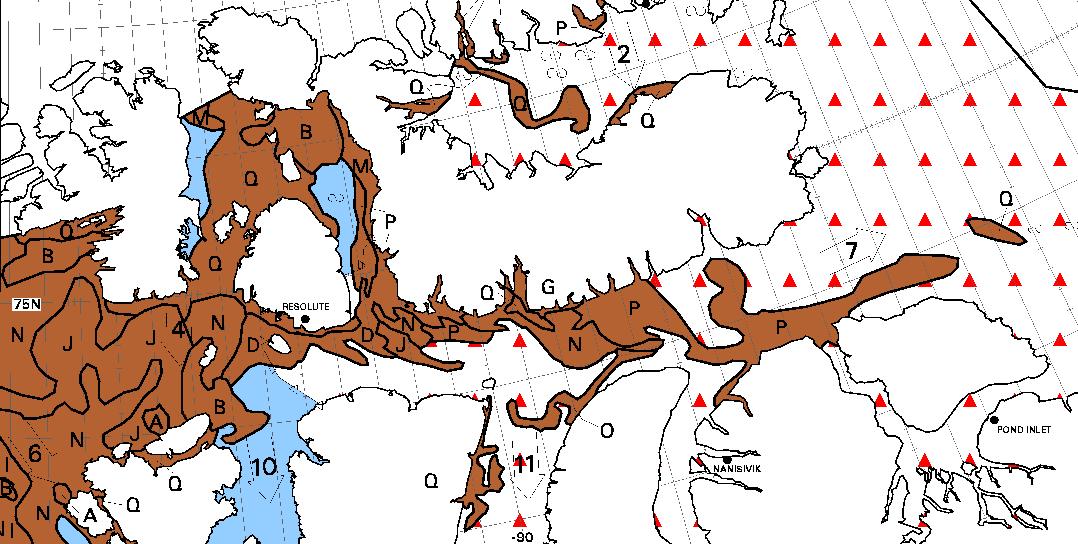
On the latest CIS “stage of development” chart the brown “old ice” has turned to deep red “multi-year ice”, and there’s lots more pretty pink out in the Beaufort Sea:
Looking at the latest Eastern Arctic ice charts from the Canadian Ice Service, I don’t think the crew [of Northabout] will exactly be shitting themselves.
I’m more interested in what a certain Tony Heller will be coming out with next.
It seems as though a certain Tony Heller and his many merry minions are already shitting themselves at the prospect of the plucky little yacht Northabout NOT getting “trapped in ice”. Hence we can provide this preliminary report on the astonishing ignorance of Tony and his faithful flock concerning all things Arctic. For the present we will confine ourselves to Mr. Heller’s latest missive on the Polar Ocean Challenge expedition, wittily entitled but strangely capitalised:
“we are in a race against time before the freeze”
I blogged the same thing yesterday, and the usual hysterical alarmists showed up complaining.
As luck would have it I blogged the same thing recently, and in actual fact it’s the usual hysterical denialists who have showed up both here and there to pen over a hundred comments and counting. Let’s take a look at a select few of them shall we?
For a reason known only to herself our old friend (and “New Einstein” award winner!) Gail Combsposted the weather forecast for Resolute yesterday, but without any link to her source(s):
TONIGHT: Saturday Night 09/10 80% / 1-3 in of snow
Snow showers early will become steadier snow overnight. Low 28 °F. Winds S at 15 to 25 mph. Chance of snow 80%. Snow accumulating 1 to 3 inches.
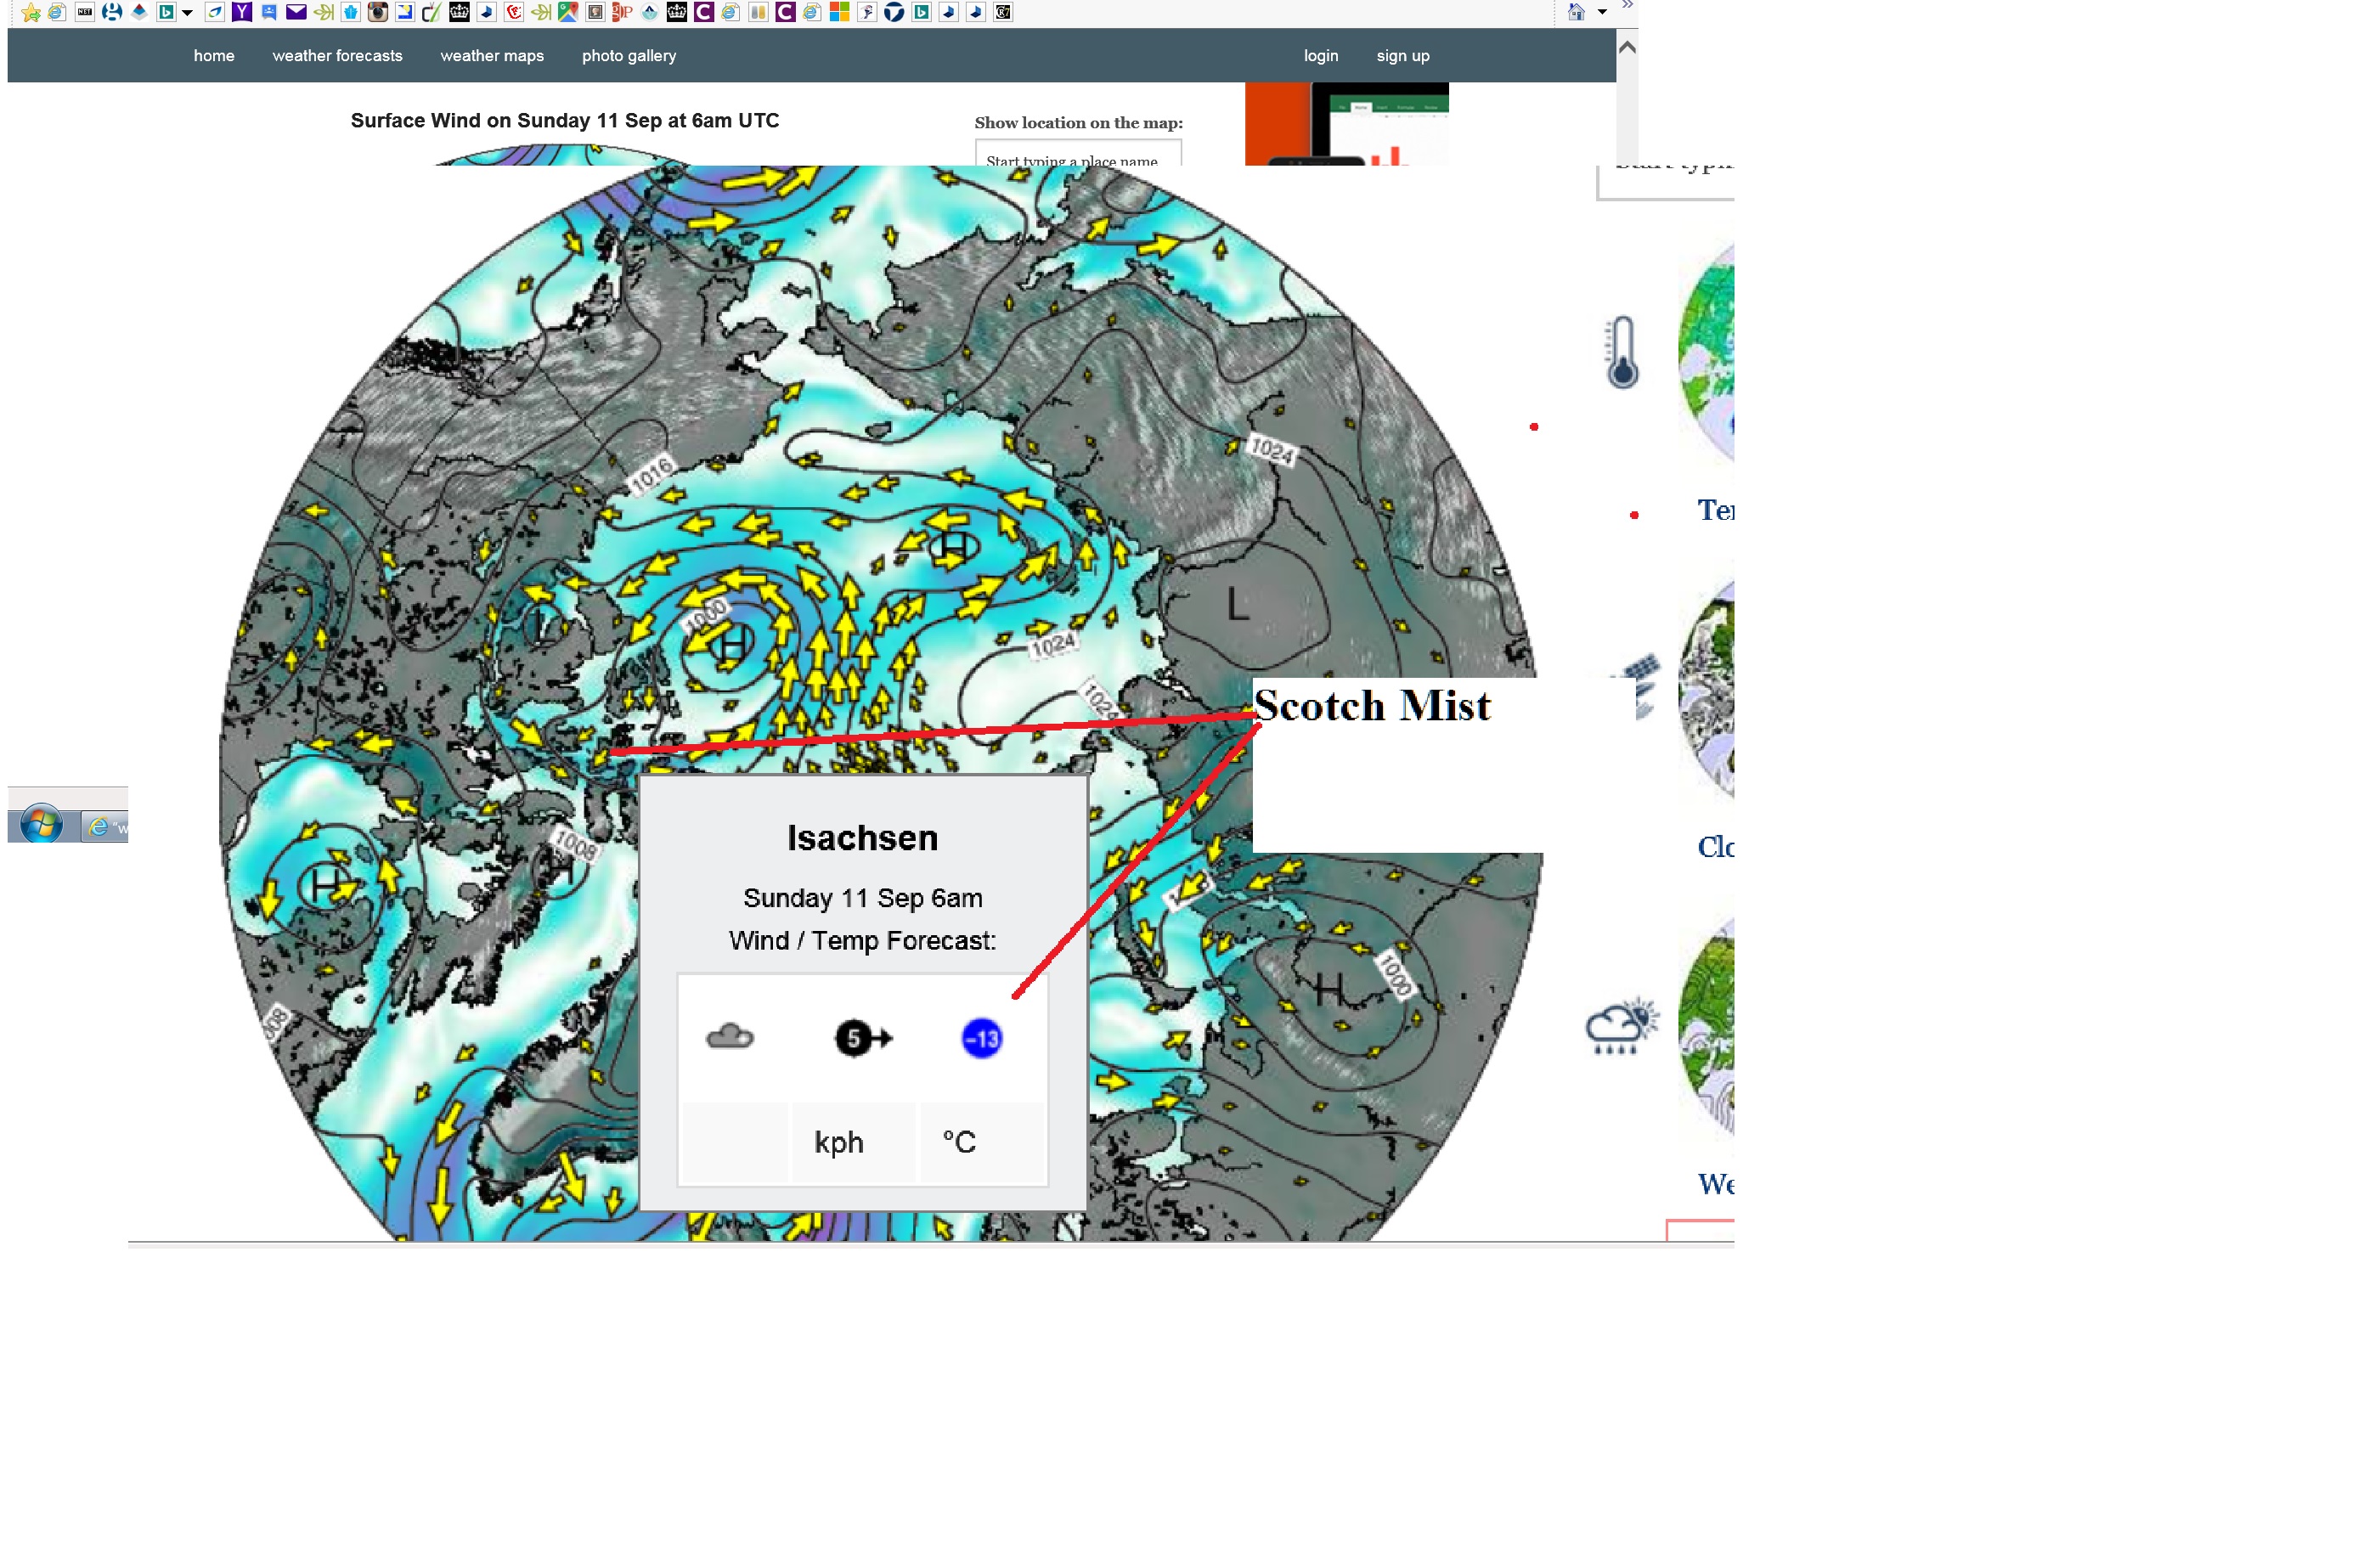
Then today Lawrence13 posts what purports to be the weather forecast for Isachsen whilst simultaneously suggesting that Isachsen is just around the corner from Resolute, which of course it is not:
Thing to note though, is that the northern part of the Northwest Passage was blocked by multi-year ice – foremost the western exit – FOR THE ENTIRE SUMMER, and was even not passable by ice breakers.
Needless to say Andy didn’t trouble to provide a link to his source. I therefore took the liberty of revealing to him the latest and greatest Great White Con Northwest Passage video:
He appears to be convinced that Isachsen is somewhere on the “main” route through the Northwest Passage. I took the trouble to inform him that:
According to the Environment Canada Climate Severity Index, Isachsen and the surrounding area has the worst weather in Canada with a CSI severity value of 99 out of a possible 100.
For some strange reason the Polar Ocean Challenge team are not planning on sailing past Isachsen any time soon!
His reply?
Nothing strange about it at all, Jimbo.
The Satellite Sea Ice charts told them they had NO CHANCE through the main North West Passage, so they snuck around through Cambridge Bay.
Andy then doubled down by throwing down all his gauntlets and issuing this challenge to Snow White’s manhood:
FFs, Jimbo, you have GOT to be joking !!!
Come on, coward, take my challenge.
Next year, WITHOUT sea ice charts, FOSSIL FUELS, or satellite navigation..
Do you fancy your chances surfing calving glaciers against GMac?
It’s hard to be sure, but I don’t think he does:
So, refusing to take up the challenge.
Coward.
There’s no answer to that! Or is there?
Please feel free to let me know when you want to be fitted for your polar bear suit Andy.
As you may be able to imagine, there’s plenty more dumbness to be discovered where that lot came from. As the day wears on and as time allows expect more amusing anecdotes from the depths of the cryodenialosphere.
[Edit – September 13th]
Not content with the dumbness quotient displayed by his faithful follows at the Blog of Fools, “Steven Goddard” has taken to Twitter to harangue poor defenceless Snow White. Here is a brief extract from his Gish gallop around the North Pole:
[Edit – September 14th]
Not content with haranguing Snow White about the Arctic “Steve”/Tony and merry Mendy fulminate about flash flooding in Cornwall & Manchester. Allegedly it’s all the media’s fault.
[Edit – September 19th]
Tony Heller has blocked poor defenceless Snow White on Twitter, so she cannot include his Tweets in her Storifys. Please feel free to try and work out where this one fits in the grand scheme of things:
Only a complete moron would conflate a wave with "rising sea levels" https://t.co/QeeYOJHLZr
It seems self evident that Americans have no sense of humour. They can’t even spell the word correctly. What’s more they also seem not to have the slightest clue about flash floods on this side of the Atlantic, preferring instead to rant about (the lack of) sea level rise on the shores of the “Land of the Free”:
Believe it or not, there’s plenty more where that lot came from.
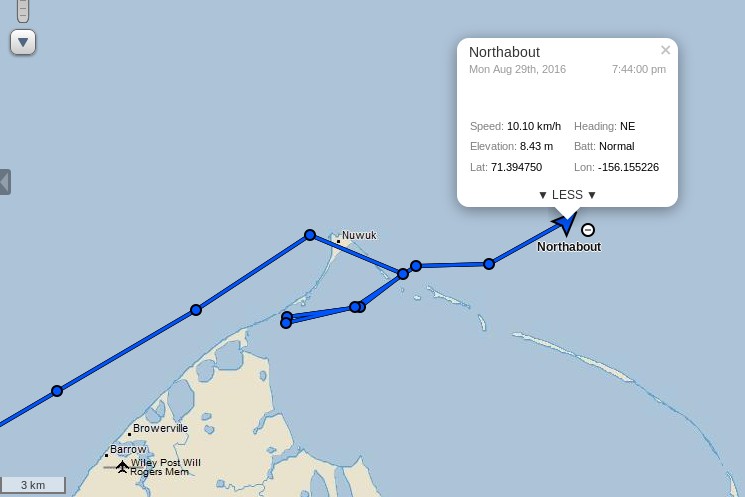
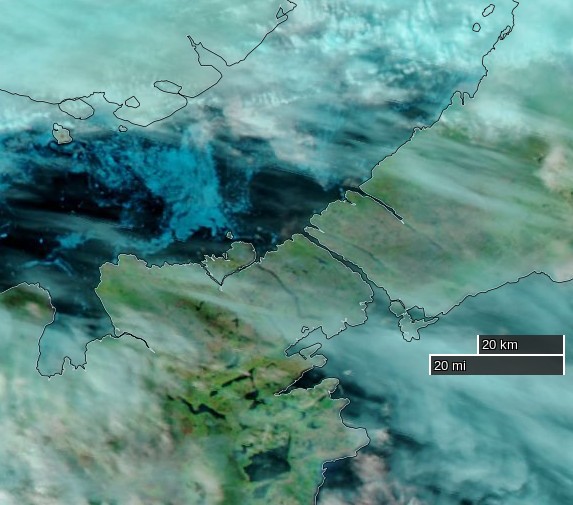
After the briefest of stops in Elson Lagoon behind Point Barrow Northabout is on the move once again:
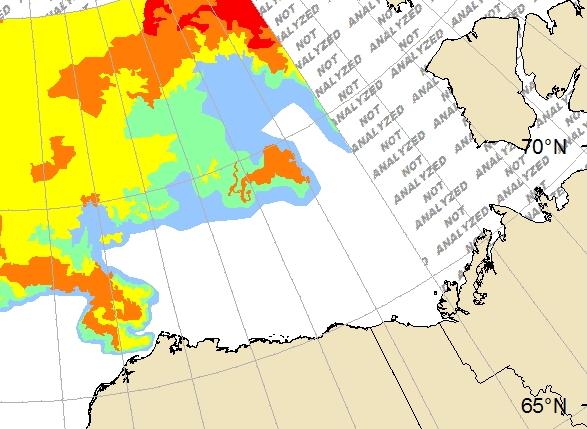
She’s currently heading out into the Beaufort Sea before following in the giant footsteps of the cruise liner Crystal Serenity in the direction of the Amundsen Gulf and the Canadian Arctic Archipelago. Here’s the United States National Weather Service’s current ice chart for Alaskan waters:
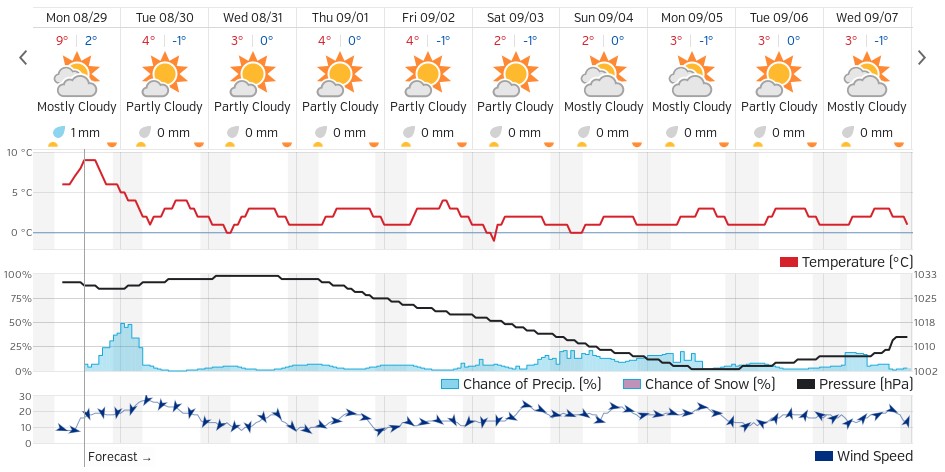
There looks to be far less to worry about ice wise on the next leg of the Polar Ocean Challenge than on the previous one! The weather forecast isn’t too bad either, with high pressure over the Beaufort Sea and a fair bit of sunshine. Here’s the Weather Underground forecast for Ulukhaktok, Crystal Serenity’s first port of call in the CAA:
There is currently a “small craft advisory” warning in effect for the Beaufort Sea coast:
CAPE HALKETT TO FLAXMAN ISLAND-
207 PM AKDT MON AUG 29 2016
…SMALL CRAFT ADVISORY IN EFFECT FROM TUESDAY MORNING THROUGH
TUESDAY AFTERNOON…
TONIGHT
E WINDS 20 KT. SEAS BUILDING TO 4 FT.
TUE
E WINDS 25 KT. SEAS 5 FT.
TUE NIGHT
E WINDS 20 KT. SEAS 6 FT.
WED
E WINDS 20 KT. SEAS 6 FT.
WED NIGHT
E WINDS 20 KT. SEAS 5 FT.
THU
NE WINDS 20 KT. SEAS 4 FT.
THU NIGHT
NE WINDS 15 KT. SEAS 4 FT.
FRI
N WINDS 10 KT. SEAS 2 FT.
SAT
N WINDS 15 KT. SEAS 3 FT.
All in all it looks like fairly plain sailing for the foreseeable future, with only occasional moderate headwinds to contend with.
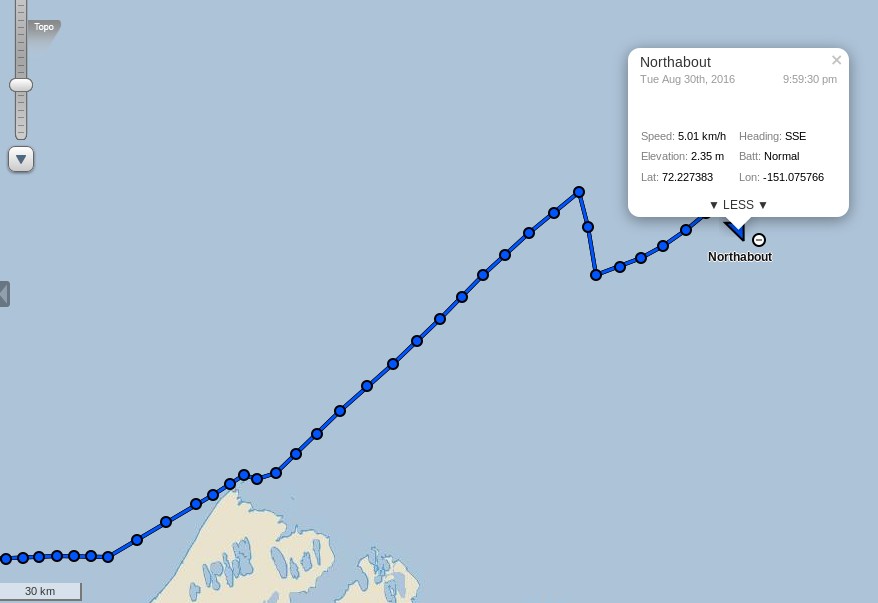
[Edit – August 30th]
It seems my “fairly plain sailing” conclusion was overly hasty. According to the latest “Ship’s Log“:
The weather forecast is pants. A 30/35 knot headwind along the coast . No one has the appetite for it, so we are heading North, slacker winds, staysail out, still a choppy sea and uncomfortable, but not as bad as 30 knots. Hopefully no ice tonight on my watch.
This is the end result:
As Phil points out below:
Our next stop along the North West Passage is Tuktoyaktuk. That’s when we can use a pontoon, get rid of our rubbish, fill the tanks, do the laundry and have a shower. 500nm away.
[Edit – August 31st]
The Polar Ocean Challenge team report via Twitter:
They have some more to carry out in Tuk too. Despite the great “groove” displayed above Ben Edwards reports that:
Joy of joys, the auto-helm’s stopped working. Dad (Steve Edwards, crew), thinks he knows why so we’ll hopefully be able to fix it in Tuk. In the meantime we’re back to helming by hand. This is a mixed blessing, on the one hand it’s really irritating to have to helm in large swells and with a strong headwind because any movement you make is at first ignored, and then exaggerated by, the wind. So it’s hard to keep a decent track and it makes it harder to look out for ice. On the other hand, moving and putting effort into the steering keeps you warm which is nice and it means you don’t have to put as many clothes on which is also nice because when you go down stairs and it’s twenty four degrees it can get quite uncomfortable.
We all had our job lists, ice lights, bilge pumps, laundry, shopping but the man who gets the Vodka Salute is unquestionably Steve.
I dropped him off wth Willard. Two peas in a pod. They made a broken Pilot Spigot. That sounds quite easy but it took the whole day in a machine shop in a container, working to fine tolerances, and many modifications. Fitting it in the bowels of the Lazzerette in cold weather and driving rain. It worked first time. Brilliant effort.
Issued 07:00 AM MDT 04 September 2016
Today Tonight and Monday
Wind – Northwest 15 knots diminishing to light late this morning then becoming northwest 15 Monday morning.
Waves
Seas – 1 metre.
Weather & Visibility – Chance of showers changing to periods of rain near noon then to chance of showers tonight and Monday. Fog patches dissipating early this evening.
My famous last words? Plain sailing by the look of it!
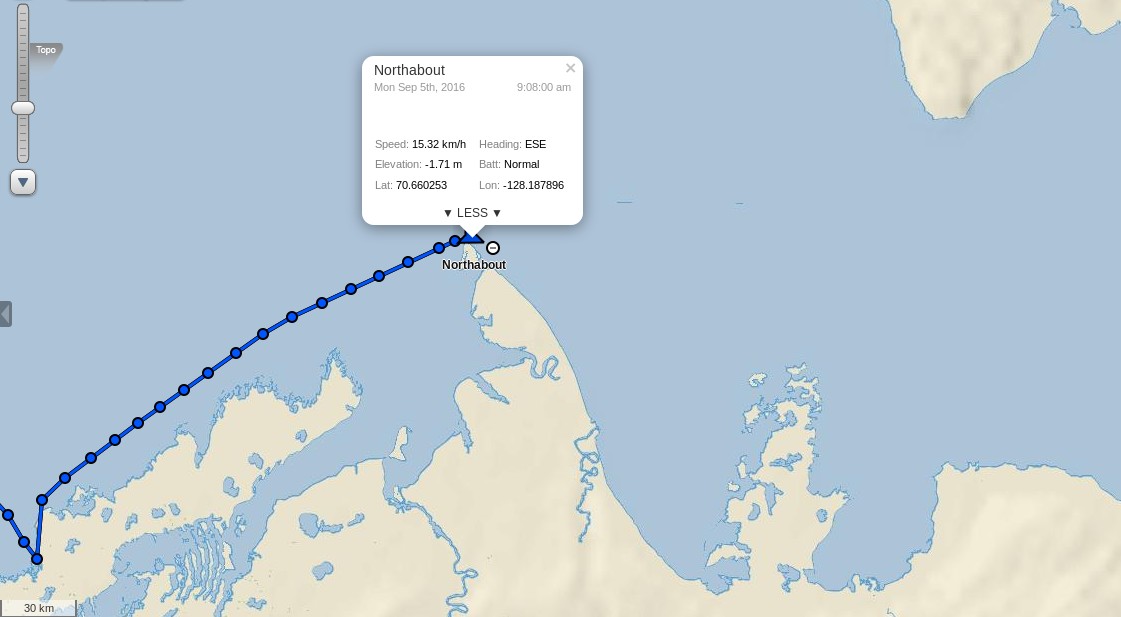
[Edit – September 5th]
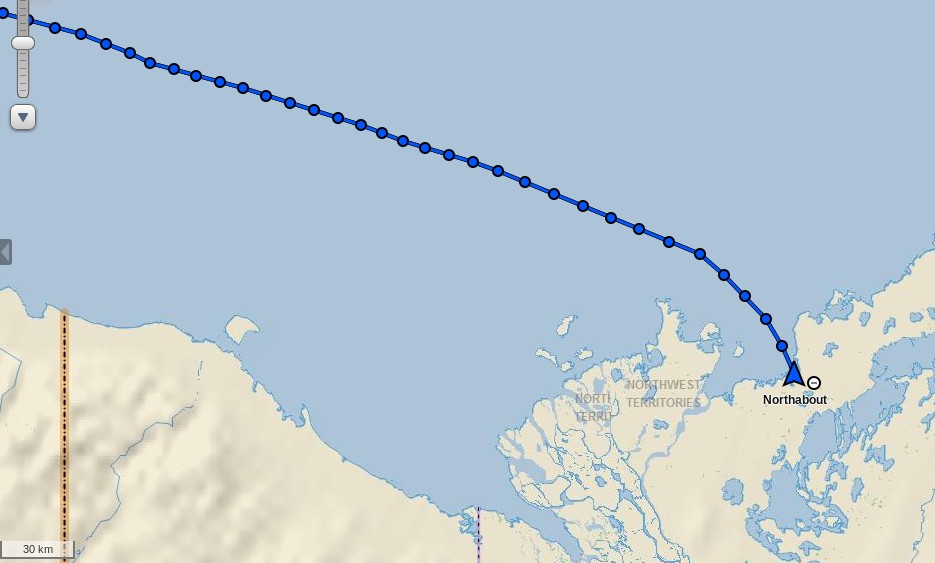
Northabout has just rounded Cape Bathurst, the northernmost point of mainland Northwest Territories:
I wonder if her crew will take a close look at the nearby Smoking Hills?
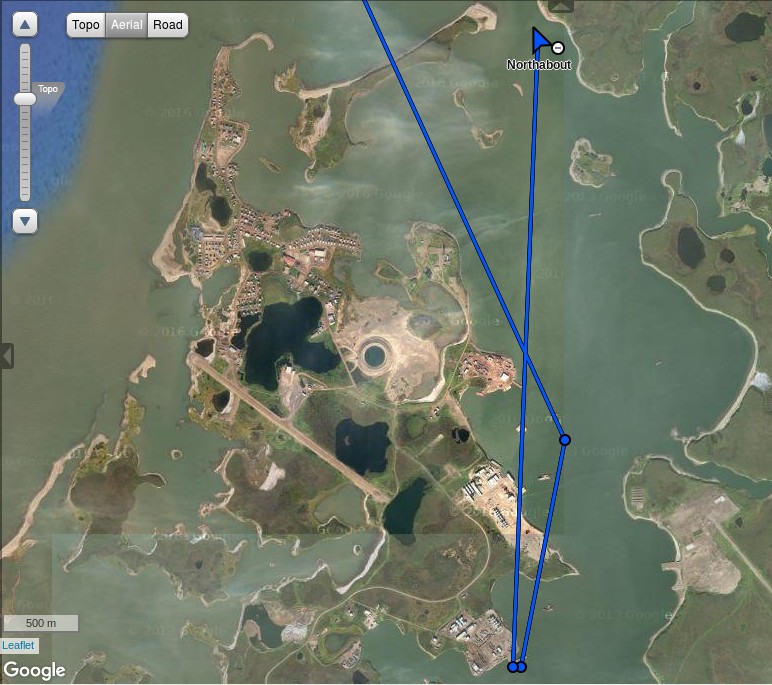
[Edit – September 6th]
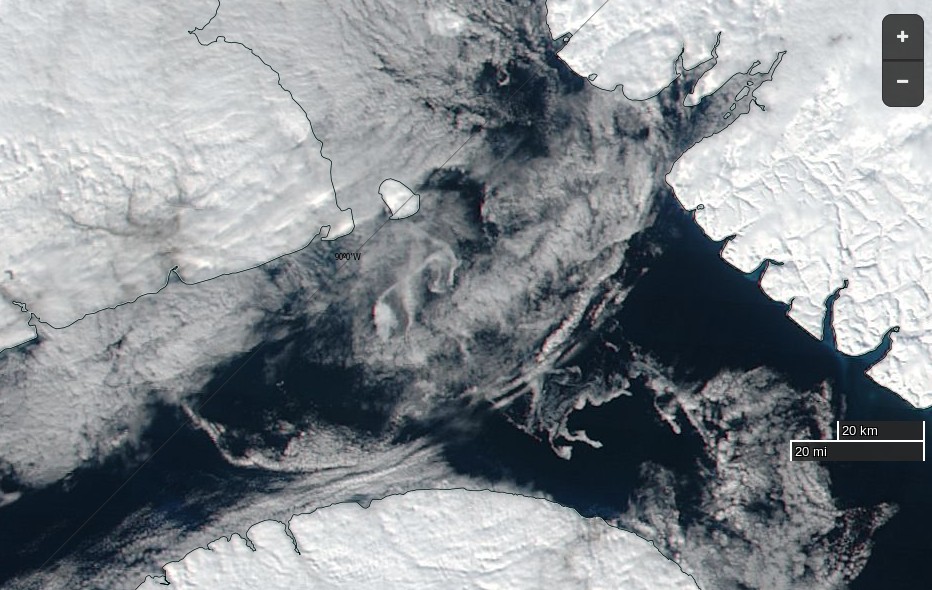
Northabout gave the Smoking Hills a miss and headed strait for Cape Parry. She has already crossed the Amundsen Gulf and is heading into the Dolphin & Union Strait:
In light of the lack of ice and in the spirit of saving time we’ve decided not to stop in Cambridge Bay or Pond Inlet and go straight on to Upernavik in Greenland before doing our crew change. Looking at the ice maps at the moment it seems we’ll be able to get through with little or no trouble, though this is almost bound to change, if it stays that way we’ll reach Upernavik in about fourteen days. I’m looking forward to it!
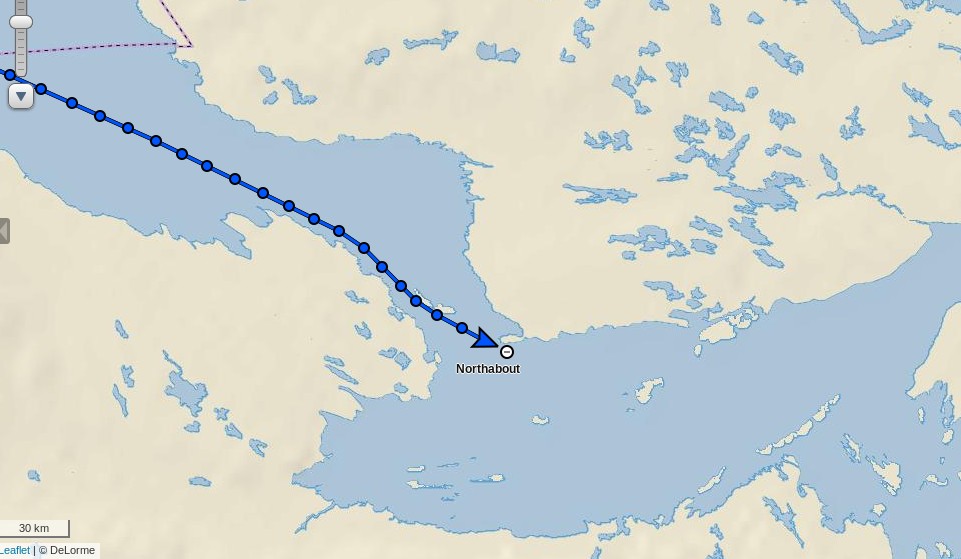
This morning Northabout is rapidly approaching the western entrance to Bellot Strait:
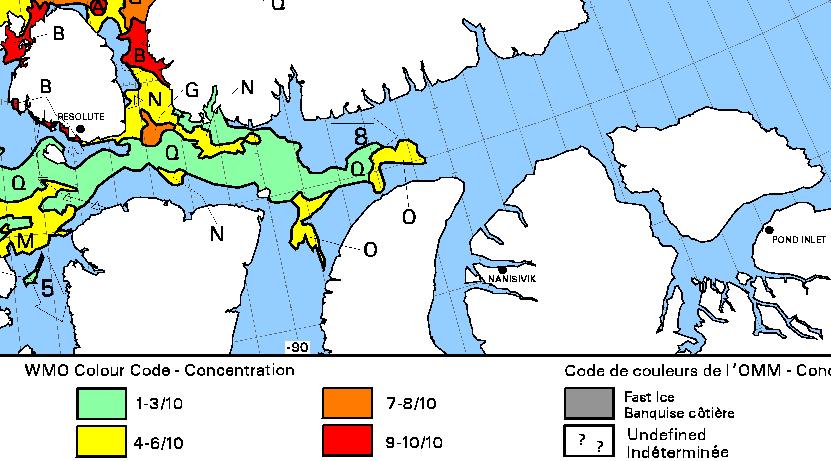
Their stated intentions are to head past Pond Inlet and across Baffin Bay to Upernavik in Greenland. Assuming they initially follow the same route as Crystal Serenity they will soon to need to pick their way past some bergy bits in Prince Regent Inlet before negotiating some currently “wispy” areas of sea ice as they enter Lancaster Sound. Here is the current Canadian Ice Service chart for the area:
plus a rather cloudy “visual” image:
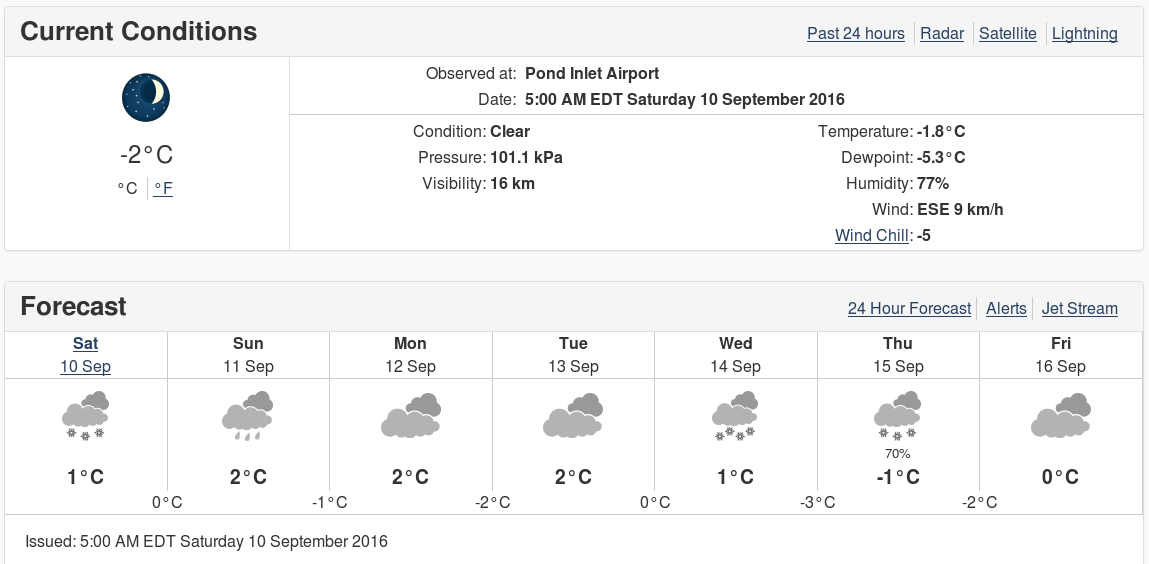
The current weather forecast for Pond Inlet doesn’t suggest the parts of the Northwest Passage still on Northabout’s route are going to start refreezing just yet:
Currently there is an obvious passage past the existing ice, but that may of course have changed by the time Northabout gets there.
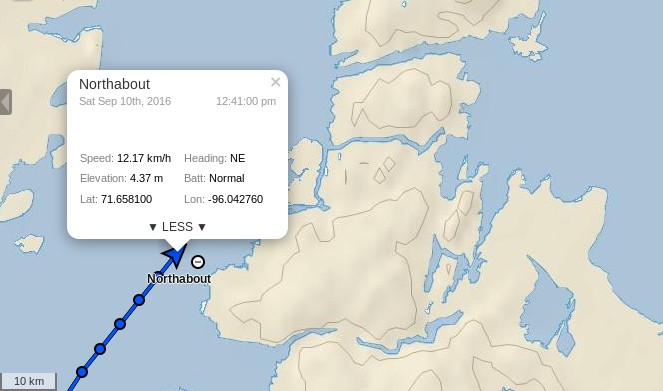
[Edit – September 10th PM]
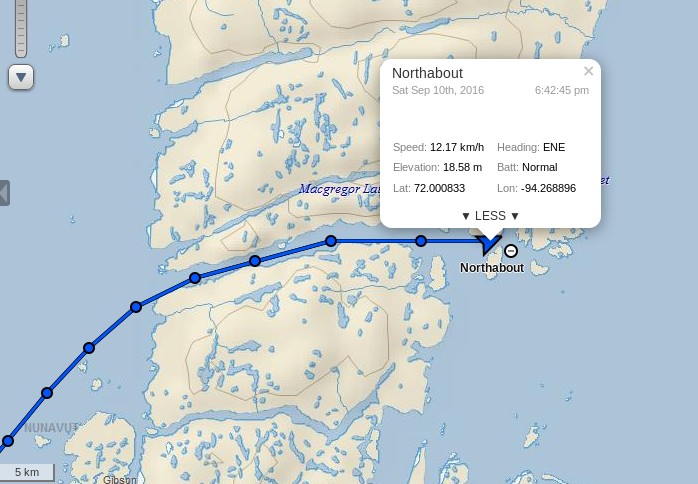
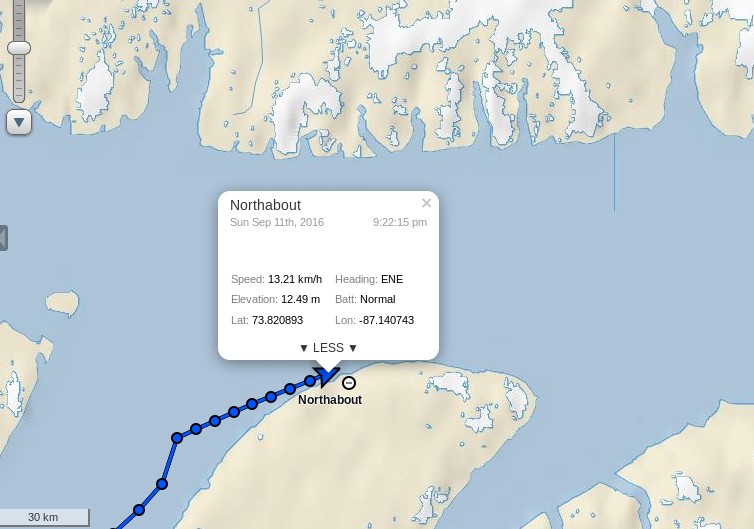
Northabout has just emerged safely from the eastern end of Bellot Strait:
I wonder if her crew will stop to make a new entry in the visitors book at Fort Ross?
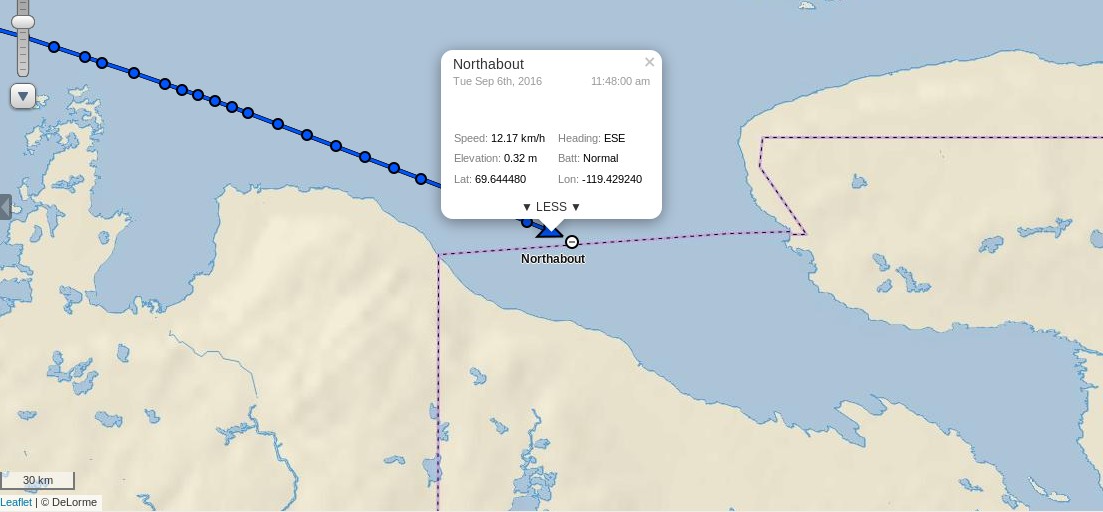
[Edit – September 11th]
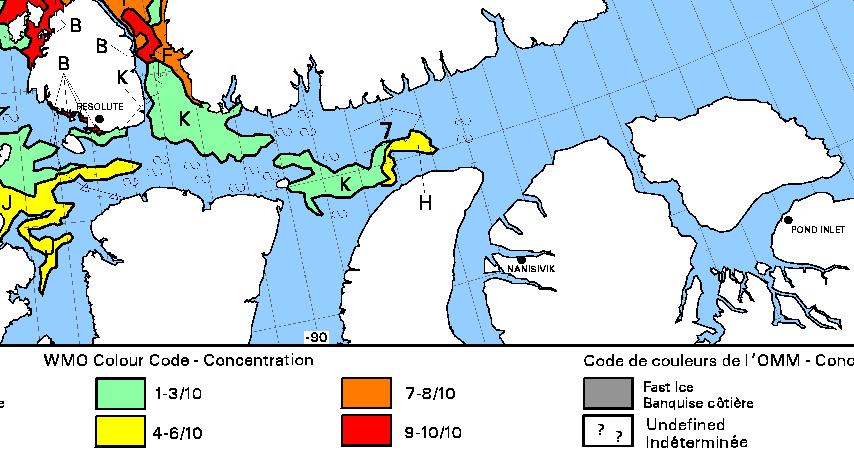
Here’s the latest CIS ice chart:
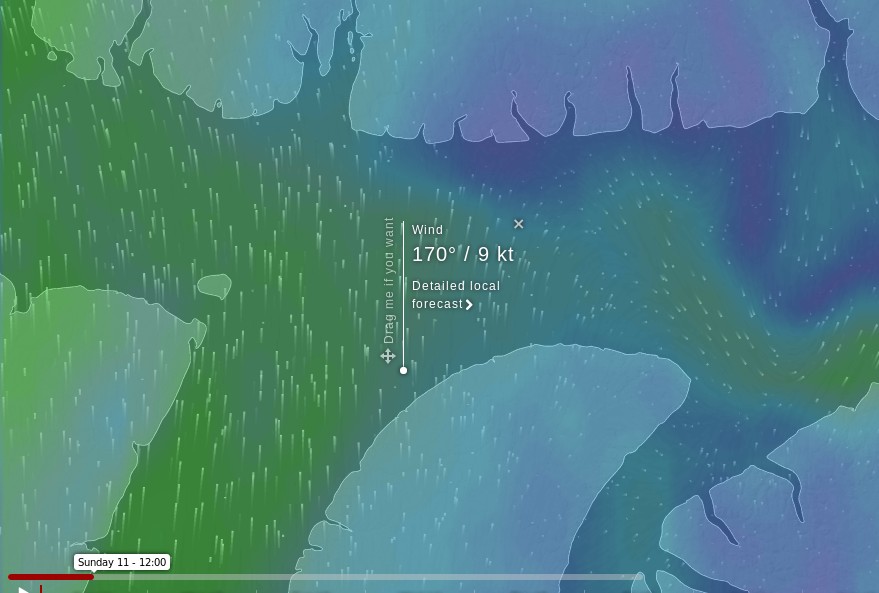
The gap between the coast and the yellow area of 4-6/10 concentration ice has closed considerably, and there’s now a broad expanse of 1-3/10 ice which Northabout may be forced to try and wend her way through. A change in wind direction would come in very handy, and that’s just what the ECMWF forecast at Windyty is suggesting for Sunday 11th:
Just what the doctor ordered?
[Edit – September 11th PM]
Video shot from Northabout’s drone of her ice-free passage through Bellot Strait:
However the passage from Prince Regent Inlet into Lancaster Sound has not proved to be ice-free!
Northabout is obviously endeavouring to skirt around the eastern edge of the 4-6/10 old ice in her path:
Today’s CIS ice concentration chart suggests there isn’t much room to spare:
The stage of development chart does reveal some new ice, but it’s well to the north of Northabout’s route through Lancaster Sound to Pond Inlet:
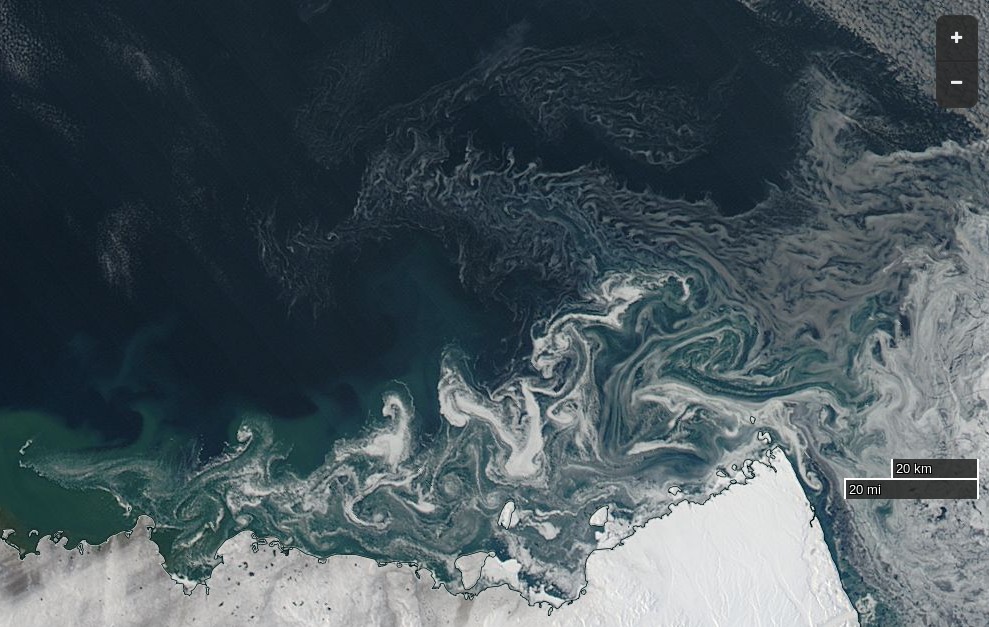
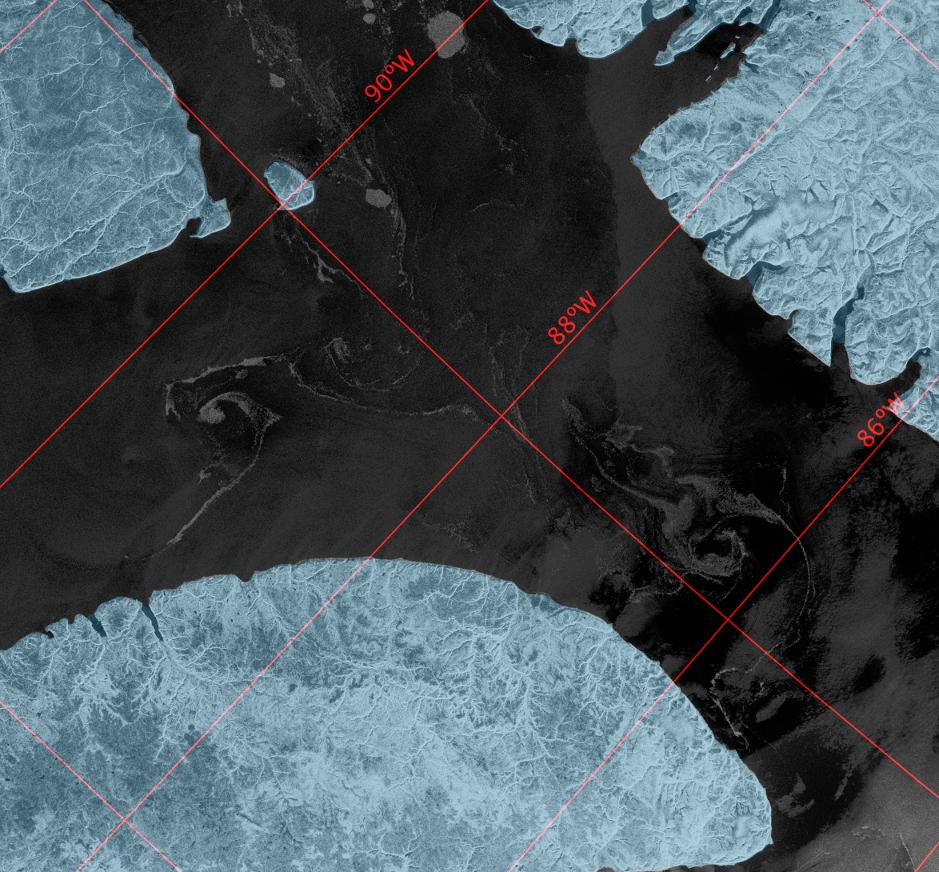
Somewhat belatedly, here’s a Sentinel 1A synthetic aperture radar image of the sea ice Northabout is squeezing past as we speak:
[Edit – September 12th]
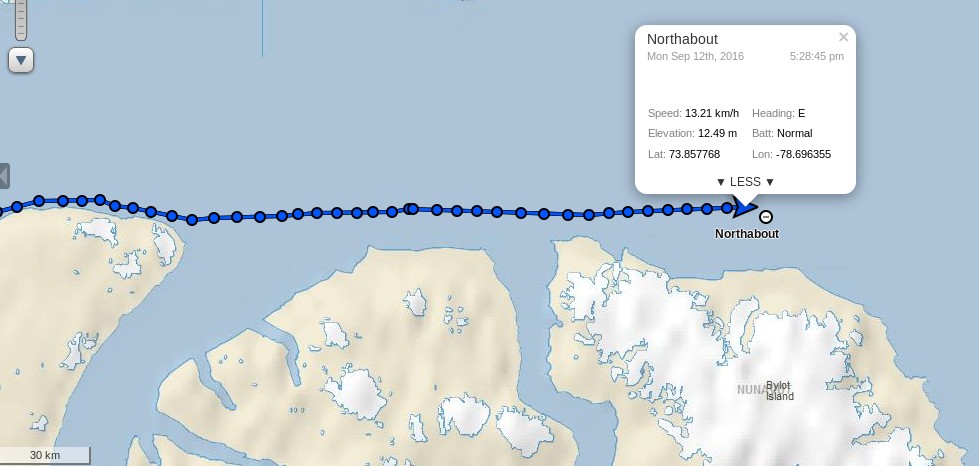
Northabout has emerged safely into Lancaster Sound, and is bypassing Pond Inlet in order to head strait across Baffin Bay:
Here are a couple of videos of some remnants of sea ice on her once again eastward travels:
There are several more on the Polar Ocean Challenge web site.
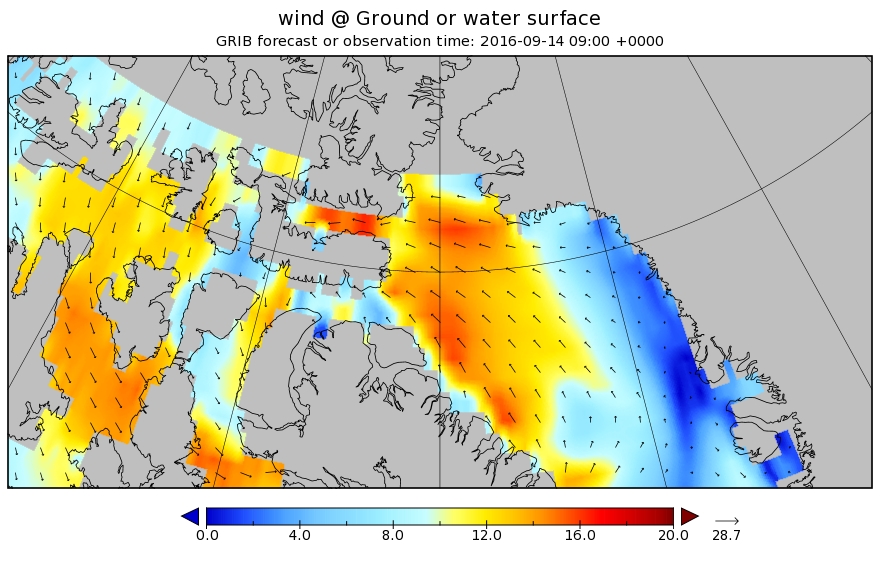
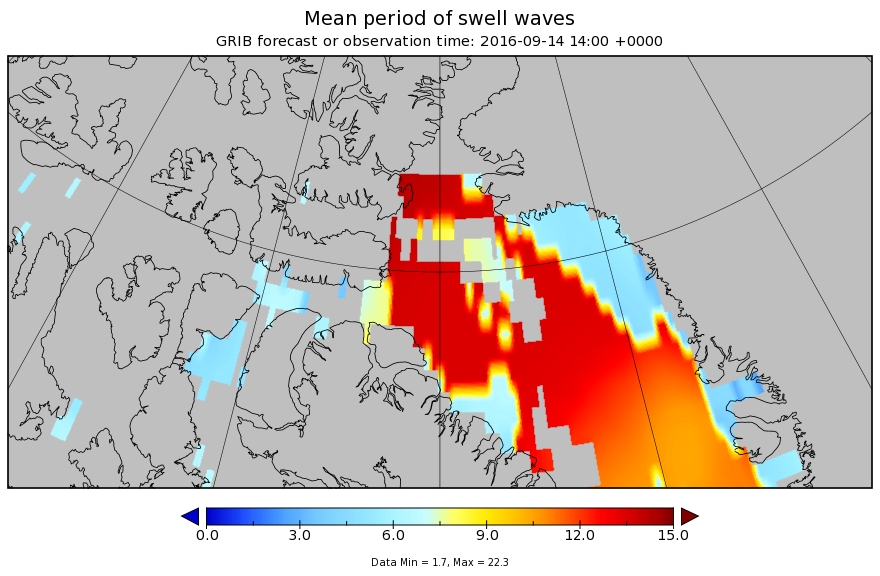
With all that ice now safely behind her Northabout has new dangers to face. Wind and waves! Let’s take a look at the WaveWatch III “surf forecast” for Baffin Bay over the next few days. A low pressure area is heading in Northabout’s direction from across the Canadian Arctic Archipelago. By Wednesday morning (UTC) the resultant wind field looks like this:
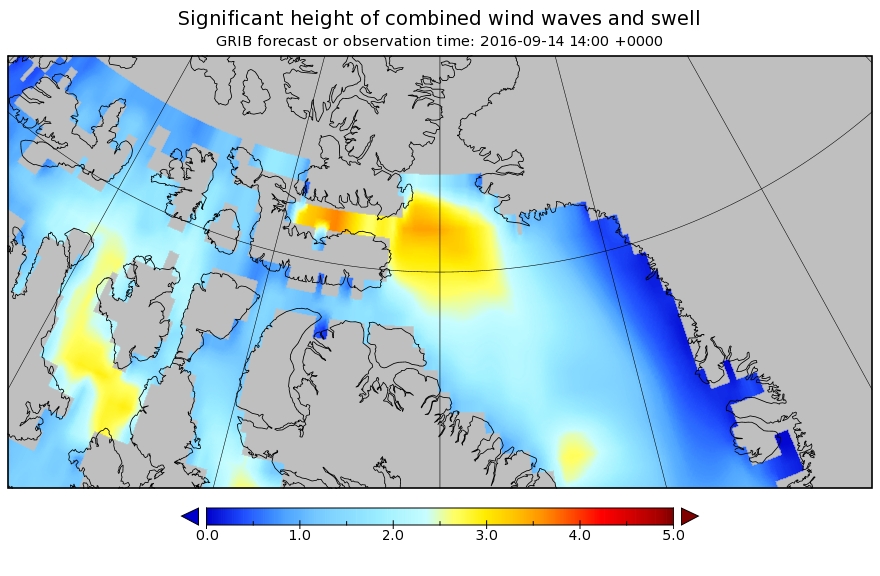
By Wednesday afternoon those winds of around 15 m/s will have produced waves in Baffin Bay that are forecast to have reached over 3 meters high:
and what’s more they won’t be just wind waves. A modest swell with a period of over 12 seconds is predicted too:
I’m sure the Polar Ocean Challenge team will be doing their level best to be safely on the opposite side of Baffin Bay by the time the worst of the weather arrives!
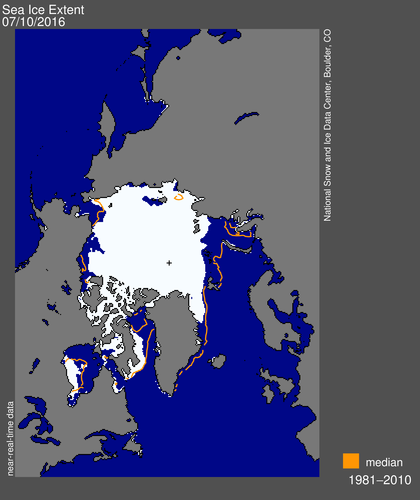
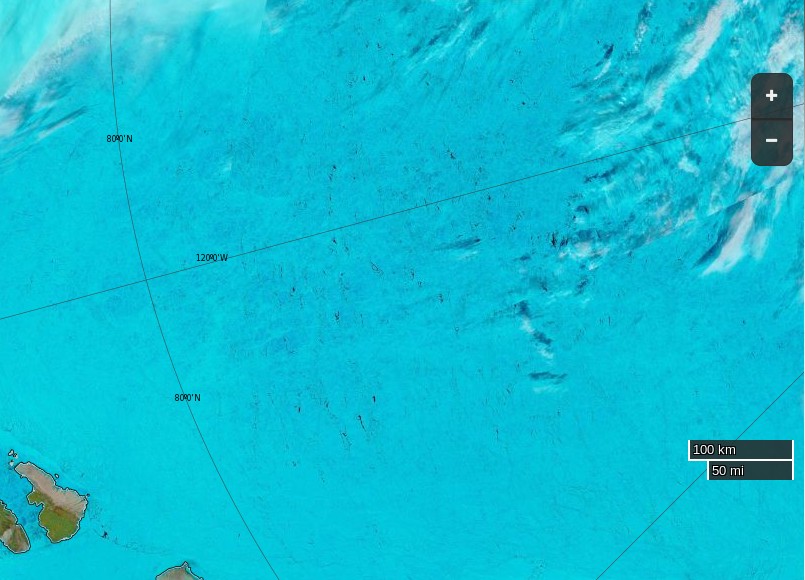
We asked this question last year, albeit a couple of weeks later. It looks like it is if you only peruse passive microwave visualisations such as this one:
However if you were the captain of a yacht attempting to sail through the Northwest Passage this year you might well have some reservations. For example, the Barrow webcam (currently stuck on July 31st) reveals this:
Discretion being the better part of valour, in all the circumstances waiting a day or two longer before casting off might prove prudent:
[Edit – August 3rd]
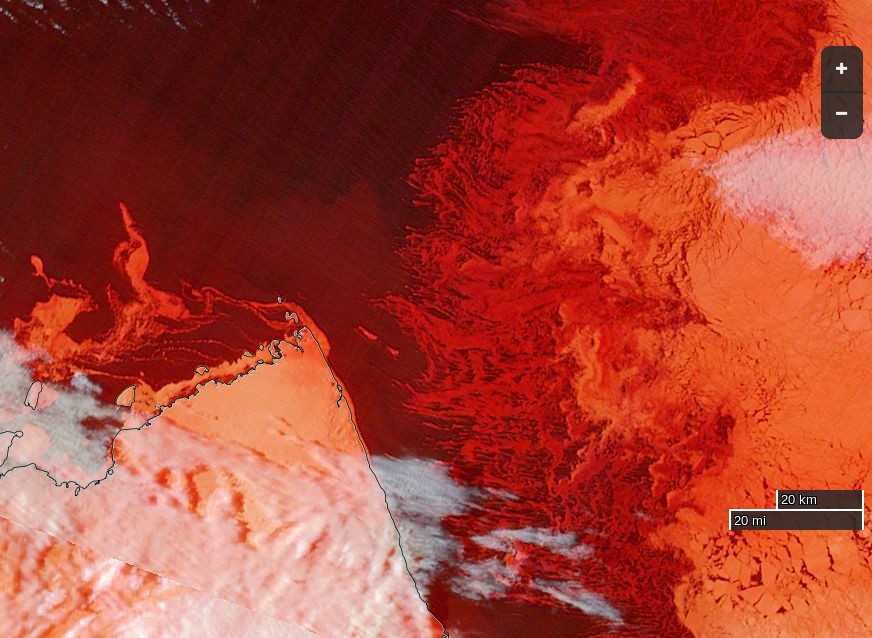
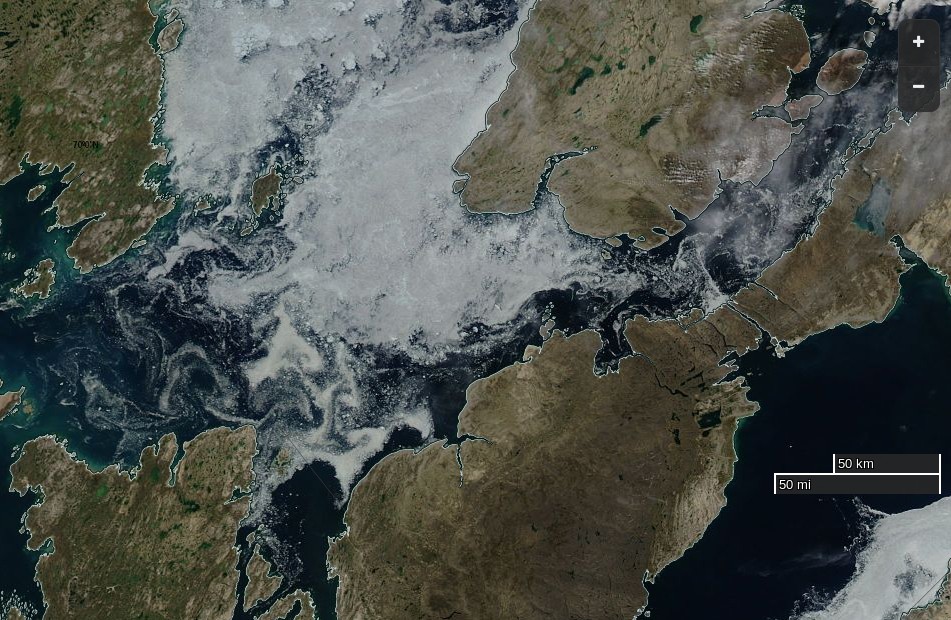
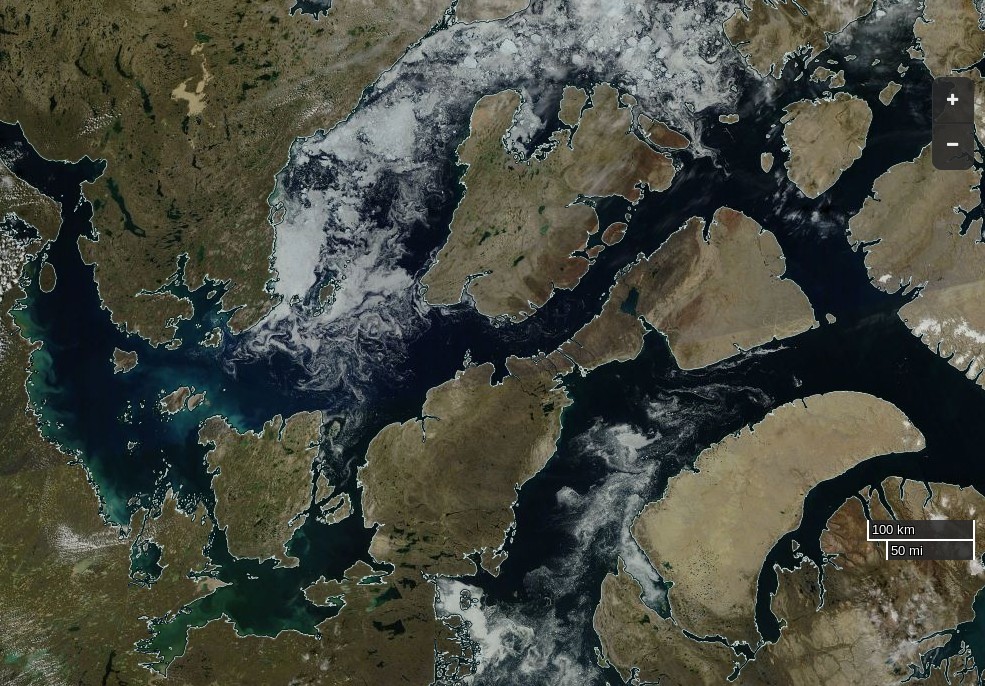
Clearer skies over the Northwest Passage yesterday reveal the remaining ice:
NASA Worldview “true-color” image of Larsen Sound on August 2nd 2016, derived from the MODIS sensor on the Aqua satellite
Here’s the CIS chart of the area from yesterday evening:
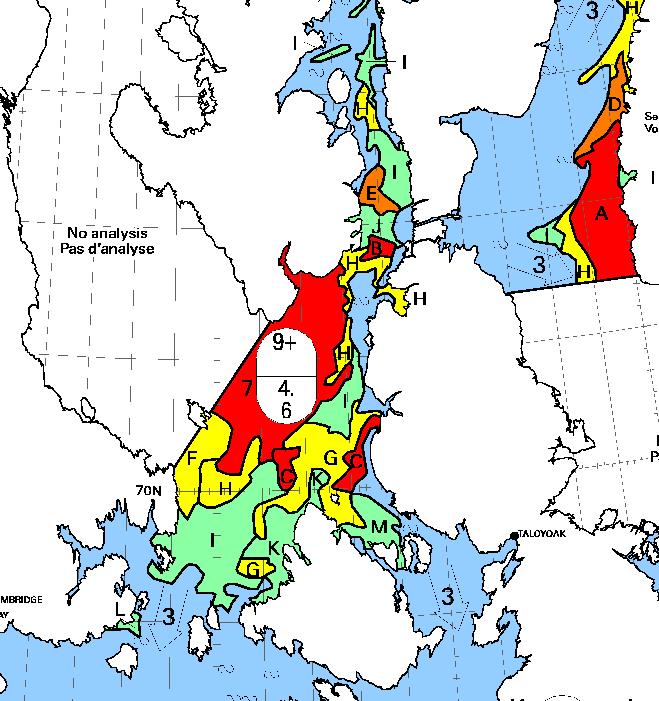
[Edit – August 7th]
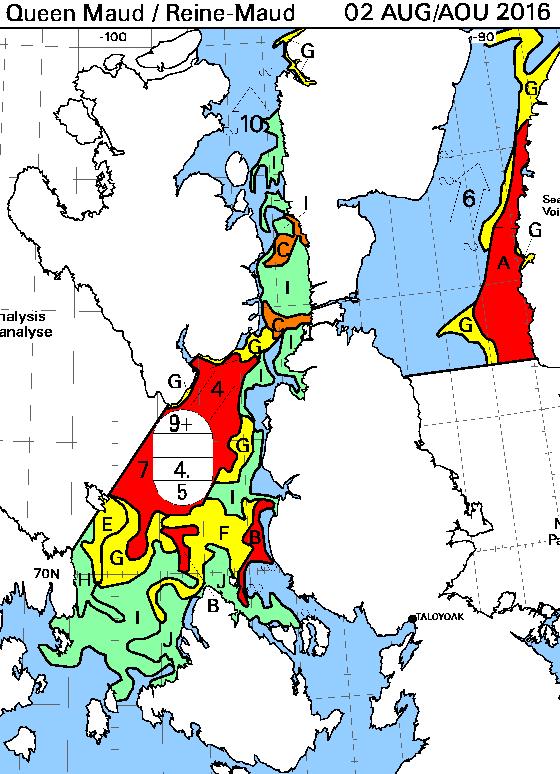
Here’s the August 7th CIS chart for the Queen Maud Gulf and points north:
Today there looks to be a route past Gjoa Havn and through Bellot Strait that doesn’t involve negotiating more than 3/10 concentration sea ice. The ice has been pushed back from Point Barrow too, so by my reckoning we can now declare one route through the Northwest Passage “open”, for the moment at least.
[Edit – August 10th]
A nice clear MODIS image of the Northwest Passage yesterday:
NASA Worldview “true-color” image of the Northwest Passage on August 9th 2016, derived from the MODIS sensor on the Terra satellite
In the spirit of providing some spurious “balance” to the contentious Arctic sea ice “debate” our quote for today comes fairly fresh from the Arctic Sea Ice Forum:
idk how people are confusing the gaping fissures that span from Siberia to Canada with melt ponds but it seems like half the people here have blinders on to what is ongoing.
I know HYCOM gets a lot of flak but instead of projecting out, let’s look at the last five days.
[Superfluous image redacted]
The ice has clearly broken completely in two now, and the recent ~970mb low did a major whomping to the ice in the “cleavage” between what’s stuck against Siberia and the main CAB.
Intriguingly this was in response to an informed comment on June 23rd to the effect that:
As we have seen recently, these large area drops in the middle of the pack do not mean the ice is gone, just that its top is wet/ponded. In a couple of days some of these drops might be reversed. Of course the ice has suffered in the meantime, but still it’s risky to simply extrapolate these numbers.
Even more intriguingly our headline for today is remarkably like the inverse of a phrase in a Mail on Sunday article that led us to create this site in the first place!
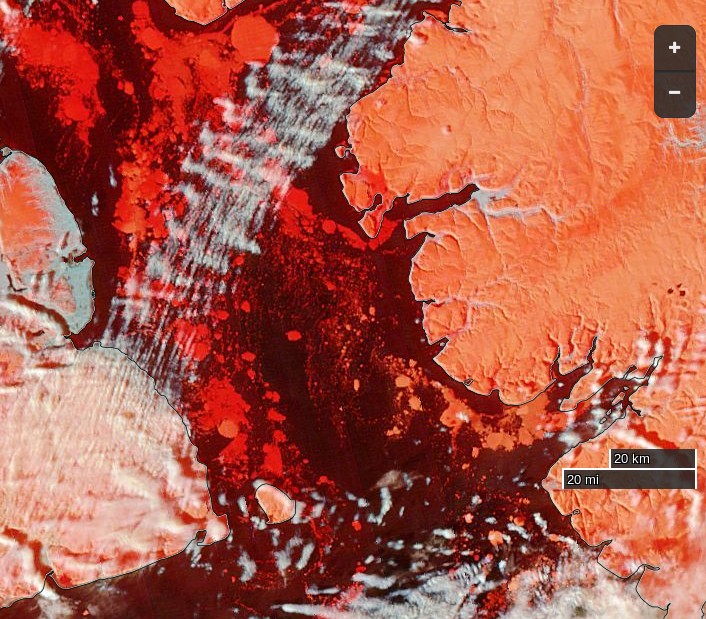
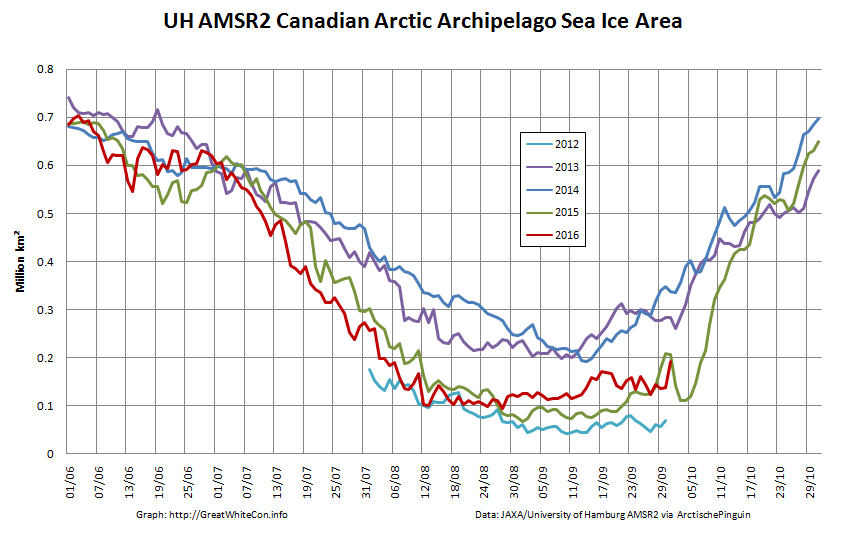
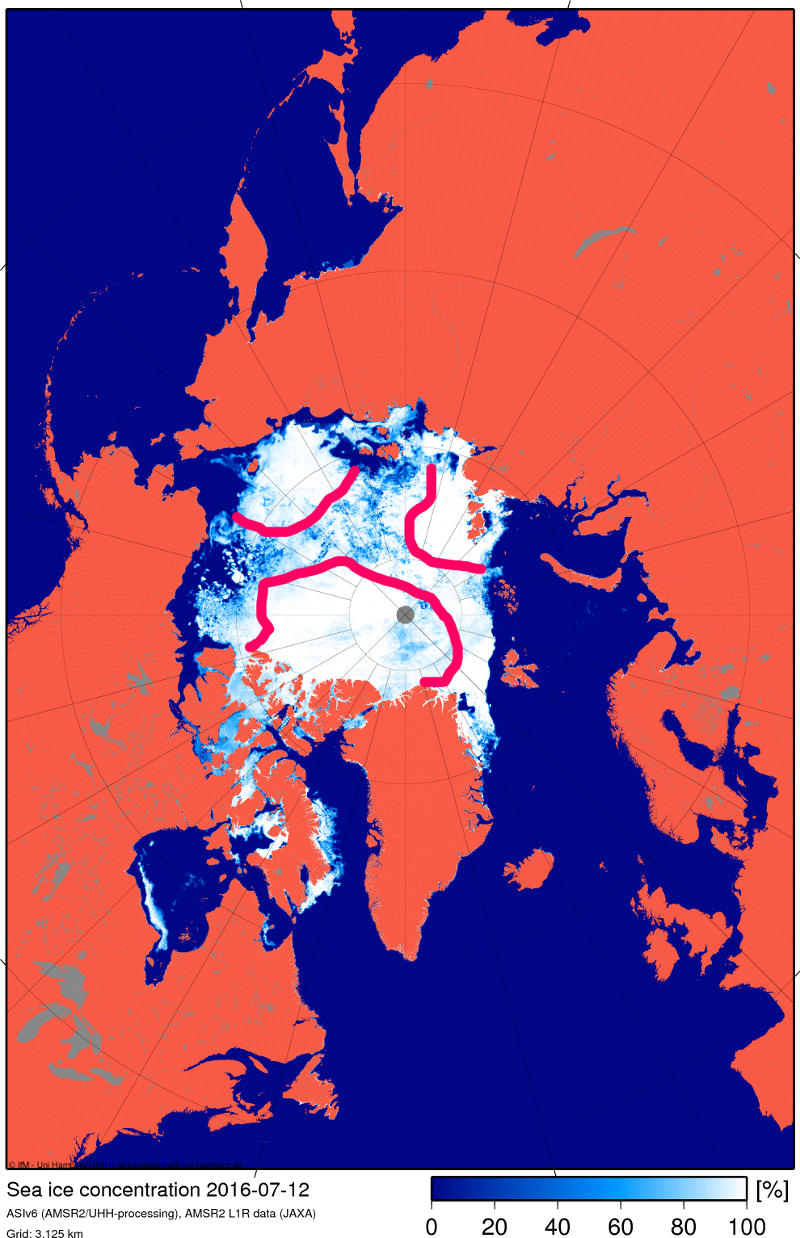
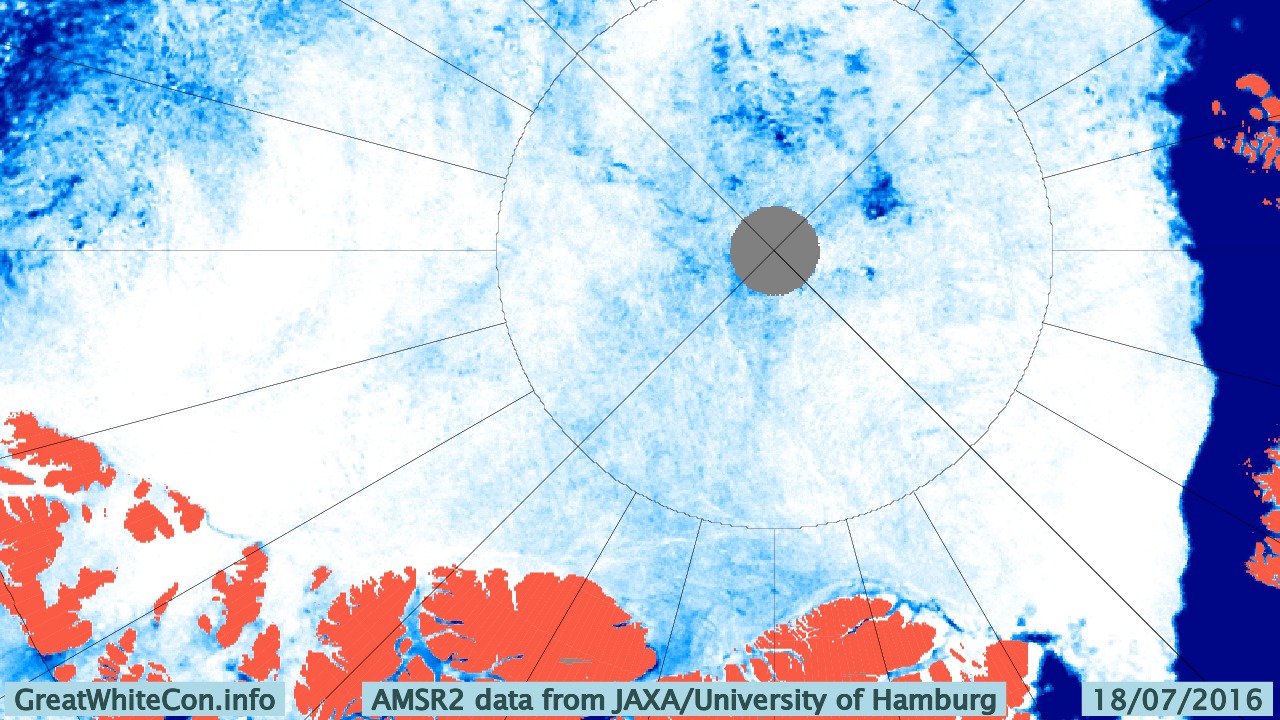
Nearly three weeks have passed since those “gaping fissures that span from Siberia to Canada” were announced, and you may well (like me) be wondering how they have been coming along? In partial answer to that question here is our very latest video based on the University of Hamburg’s AMSR2 concentration visualisations:
In my own humble opinion this doesn’t really count as a “gaping fissure” but MODIS imagery does now show a fair bit of open water between Siberia and the North Pole:
A “gaping fissure” between the Pole and Canada (and/or Greenland) is however conspicuous only by its absence:
NASA Worldview “false-color” image of the Central Arctic Basin on July 11th 2016, derived from the MODIS sensor on the Aqua satellite
I do think that I can spot some melt ponds in the area at the moment though. How about you?
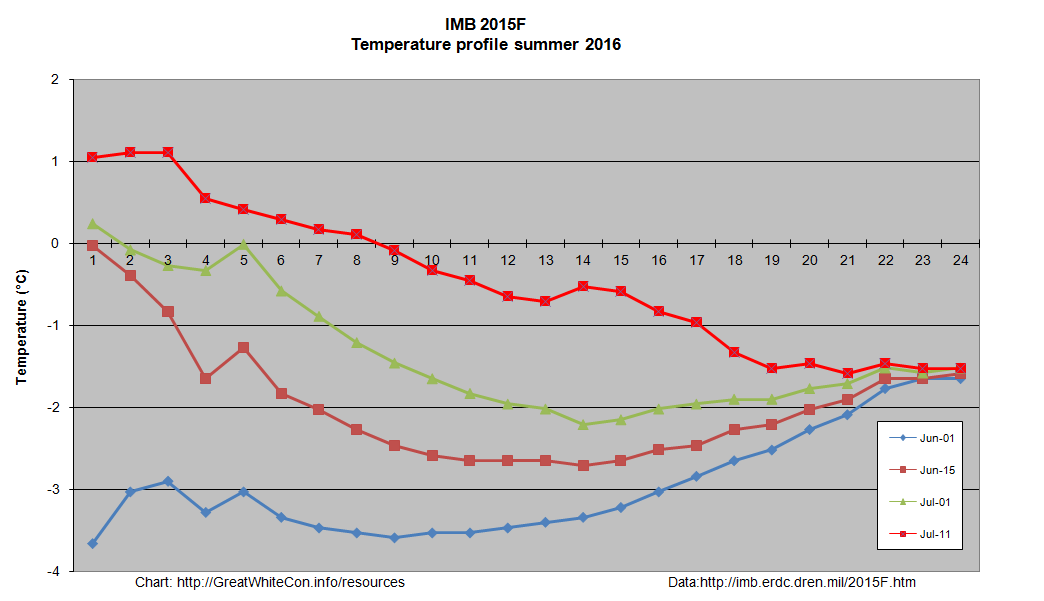
The one CRREL/ERDC ice mass balance buoy still reporting reveals that both surface and bottom melting have started at around 83 degrees north:
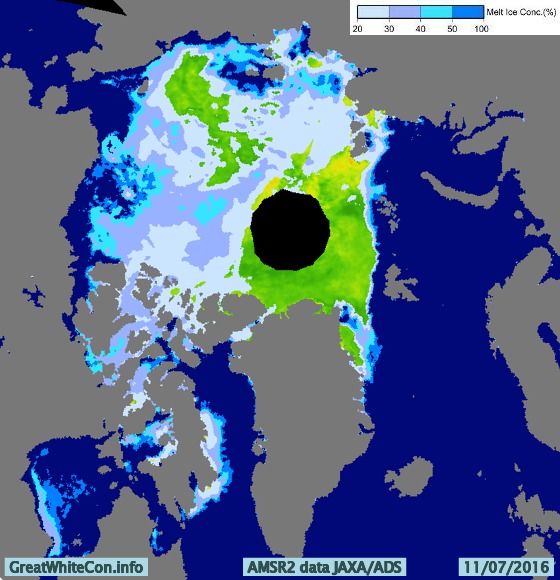
The 2016 multi-year ice melting season has evidently now begun, and the floe upon which buoy 2015F is sitting still has ~1.9 metres of melting to go. It’s not beyond the bounds of possibilty that a “gaping fissure” from the Atlantic to the Pacific will ultimately emerge this year. However based on the evidence thus far I’ll be extremely surprised if there is one “from Siberia to Canada”, unless of course you count the Chukchi & Beaufort Seas. That route is already open to intrepid Arctic seafarers, as can be seen at the bottom of the animation above and on the current JAXA/ADS Arctic sea ice surface melt map:
I have taken lots of flack I will stand by my prediction that we are heading for sub-1M KM2 come September (or early October).
Structurally [the ice] has actually now broken into three pieces, one is attached to the islands N of Siberia/NE of Svalbard, one is near Wrangel/ESS, and the “bulk” is pushed against the CAA/Greenland.
The lower concentrations in CAB are clearly open water and not melt ponds.
I felt compelled to explain to (presumably) him that:
Here’s the NSIDC’s view of those “gaping fissures” of yours:
Despite some faults I think both ARC and GLB are onto the truth. Satellite grabs over the past few days show failure on all three fronts (ATL, PAC, and the Russian side especially), but the Russian side doesn’t present as a solid front (nor does the Beaufort melt), and the leads keep getting absorbed into the slush of the main pack (which is why the ‘slush’ keeps expanding, and why most of the CAB has now evolved into this state). The only solid regions of ice are those bordering the steaming ATL waters as well as some remnants north of the CAA (no coincidence the latter was chosen as ‘evidence’).
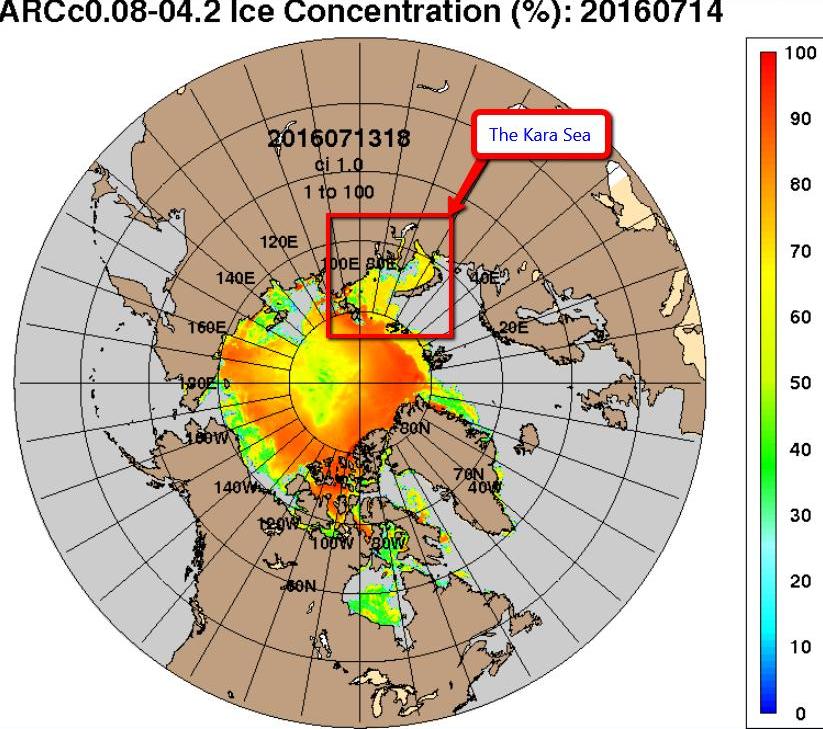
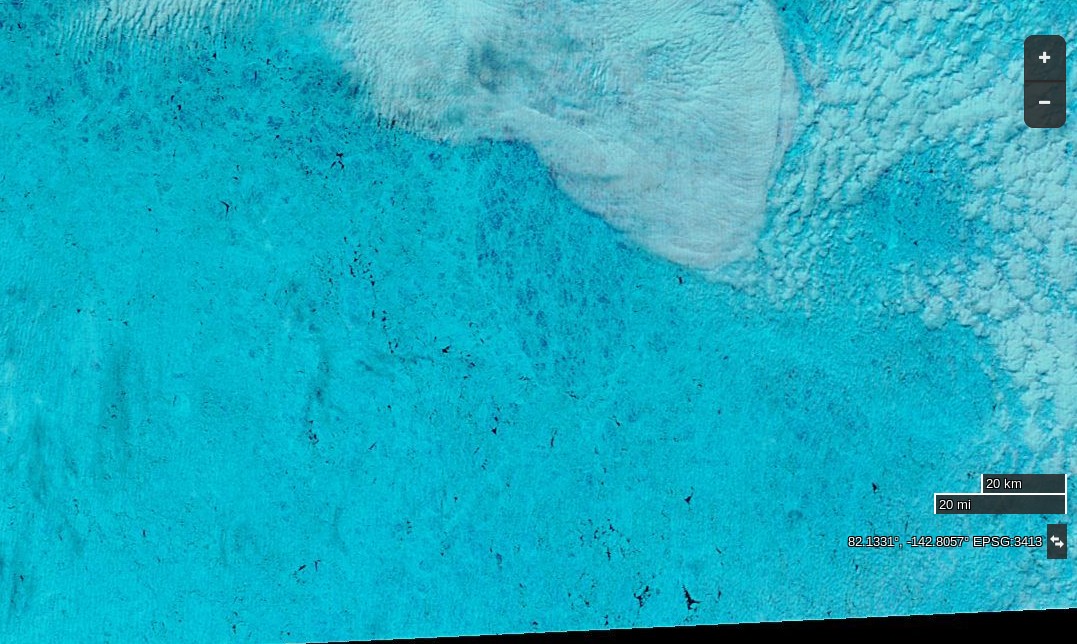
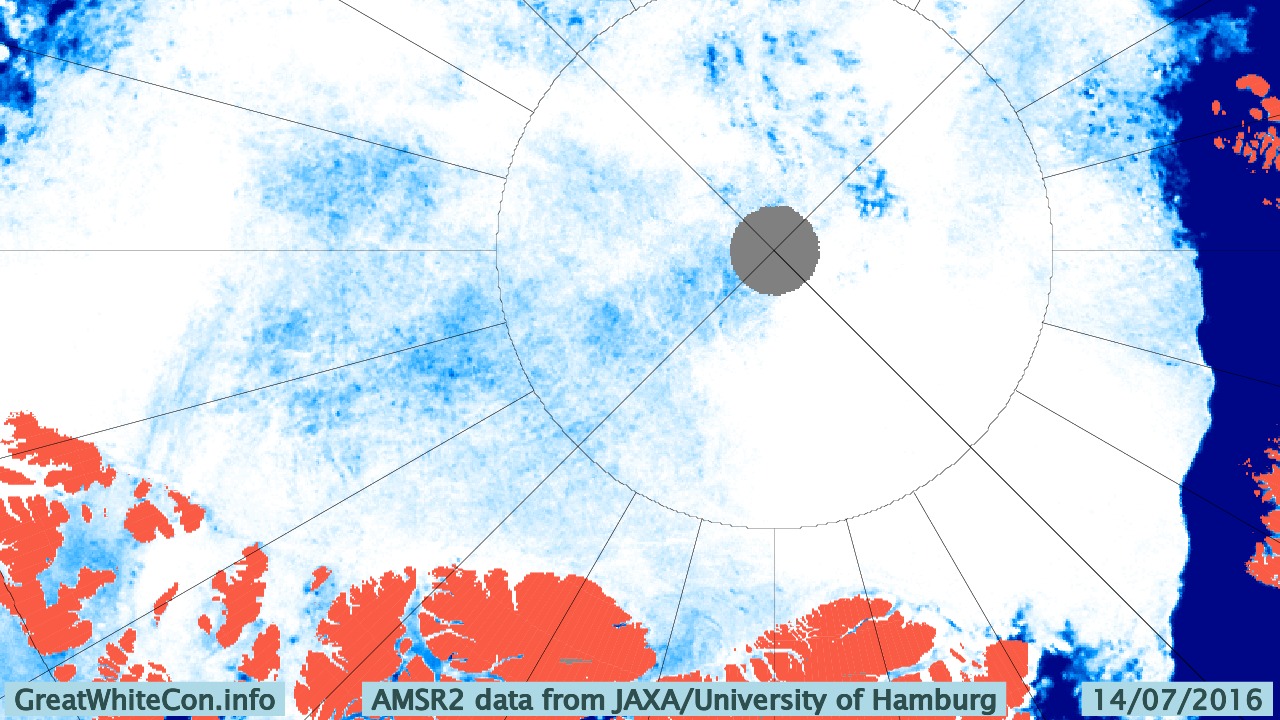
Yesterday the Kara Sea didn’t suddenly become covered in sea ice, and today the area of the Central Arctic Basin around 82 N, 135 W looks like this to the MODIS instrument on board the Terra Satellite:
NASA Worldview “false-color” image of the Central Arctic Basin on July 15th 2016, derived from the MODIS sensor on the Terra satellite
and like this to the University of Hamburg’s ARTIST sea ice concentration algorithm:
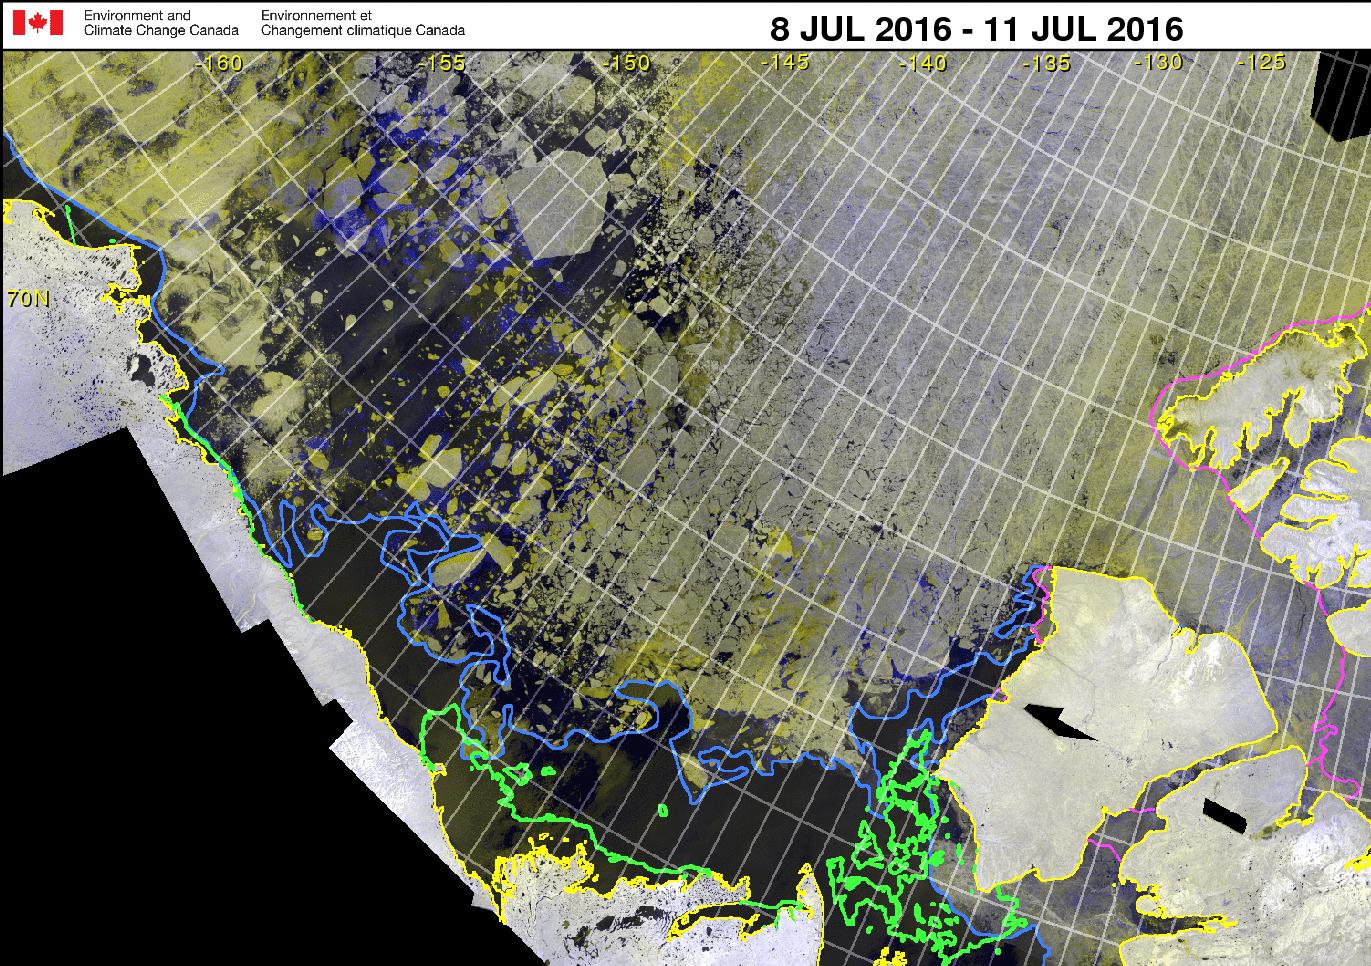
whilst here’s the latest Canadian Ice Service RadarSat mosaic for the Western Arctic:
Canadian Ice Service Western Arctic RadarSat mosaic for 8-11 July 2016
Current Buoy Data (07/15/2016):
Pos: 82.89 N, 137.34 W
Air Temp: -0.76 C
Air Pres: 1011.16 mb
Ice thickness : 185 cm
[Edit July 16th 2016]
The Arctic Sea Ice Forum management have banished “Flack Jacket” to the sin bin for a month.
I’m fed up with the personal insults because a model that has a history of errors is showing something spectacular that no other data source does. Come back in a month if you still feel like it.
Meanwhile in answer to my enquiry on the HYCOM support forum Alan Wallcraft tells me:
We now use the National Ice Center’s IMS sea ice extent product in our assimiltion, see http://www.natice.noaa.gov/ims/. This is manually produced every day, and generally avoids the artifacts and deficiencies of satellite sea ice concentrations. However yesterdays IMS fields were not good, and that is where the spurious sea ice came from. Today’s IMS field is good, and we may rerun the 2016/07/13-18Z nowcast/forecast to clear this up.
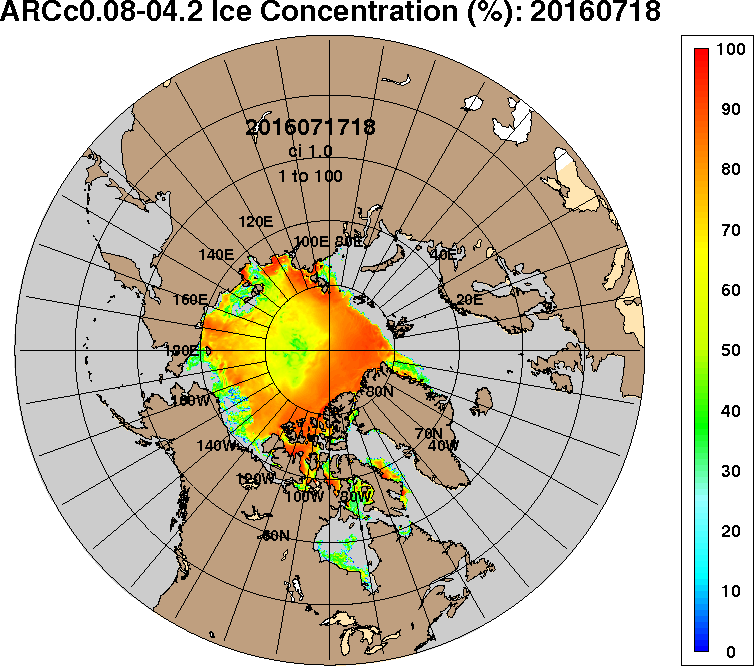
After a brief “pause” ACNFS is back in action, and here is its latest Arctic sea ice concentration “nowcast”:
Yesterday the skies were clear once again over the corner of the Arctic where buoy 2015F is located:
NASA Worldview “false-color” image of the Central Arctic Basin on July 15th 2016, derived from the MODIS sensor on the Aqua satellite
Here’s how the sea ice area in the Central Arctic Basin has been faring recently:
[Edit July 19th 2016]
Here’s an early image of the North Pole from the Aqua satellite this morning, recorded for posterity in case it changes later:
NASA Worldview “true-color” image of the North Pole at 09:00 UTC on July 19th 2016, derived from the MODIS sensor on the Aqua satellite
and as the recent Arctic storm heads towards the Canadian Arctic Archipelago here’s the latest Hamburg AMSR2 concentration map:
I attach the ACNFS plot you referenced and the corresponding plot from our next global real-time system (GOFS 3.1), which will likely replace our current global analysis (and ACNFS) once NAVGEM 1.4 is operational (it is running here with NAVGEM 1.3, like ACNFS). They assimilate the same observations, but ACNFS only does so near the ice edge while GOFS 3.1 assimilates sea ice concentration everywhere (but with higher error bounds in the ice interior). The reason for ACNFS only assimilating near the edge is in part due to that being the most important area for navigation but also because SSMI satelite ice concentrations tend to “over saturate” in the summer. We switched GOFS 3.1 to “believe” the observations because they are generally better in recent years.
The two are quite different in the interior of the sea ice and GOFS 3.1 is certainly better there. We did not see the low concentrations near the North Pole in ACNFS this time last year, so something has happened to make the free running model produce low concentrations this summer. We are looking into it.
People keep on posing that question just at the moment. Here’s a typical example from the Arctic Sea Ice Blog this morning:
Albeit not ‘officially’ declared as such, the daily Uni-Bremen chart shows Amundsen’s route is cleared and free now.
Here’s an extract from the “Daily Uni-Bremen chart” referred to, with an apparently “ice free” section of the southern route through the Northwest Passage highlighted:
As we’ve been discussing here recently, the automated passive microwave based satellite Arctic sea ice concentration products can miss ice that’s visible to the naked human eye. Here’s some pictures from the Great White Con Northwest Passage page:
NASA Worldview “false-color” image of the Northwest Passage on August 13th 2015, derived from bands 7, 2 and 1 of the MODIS sensor on the Terra satellite
The Canadian Ice Service sea ice concentration chart for the Queen Maud Gulf on August 13th 2015
Here’s an extract from the NSIDC’s Multisensor Analyzed Sea Ice Extent (MASIE) product (currently for August 12th 2015):
and here’s an extract from an answer I gave to a similar question on the Arctic Sea Ice Forum earlier this morning:
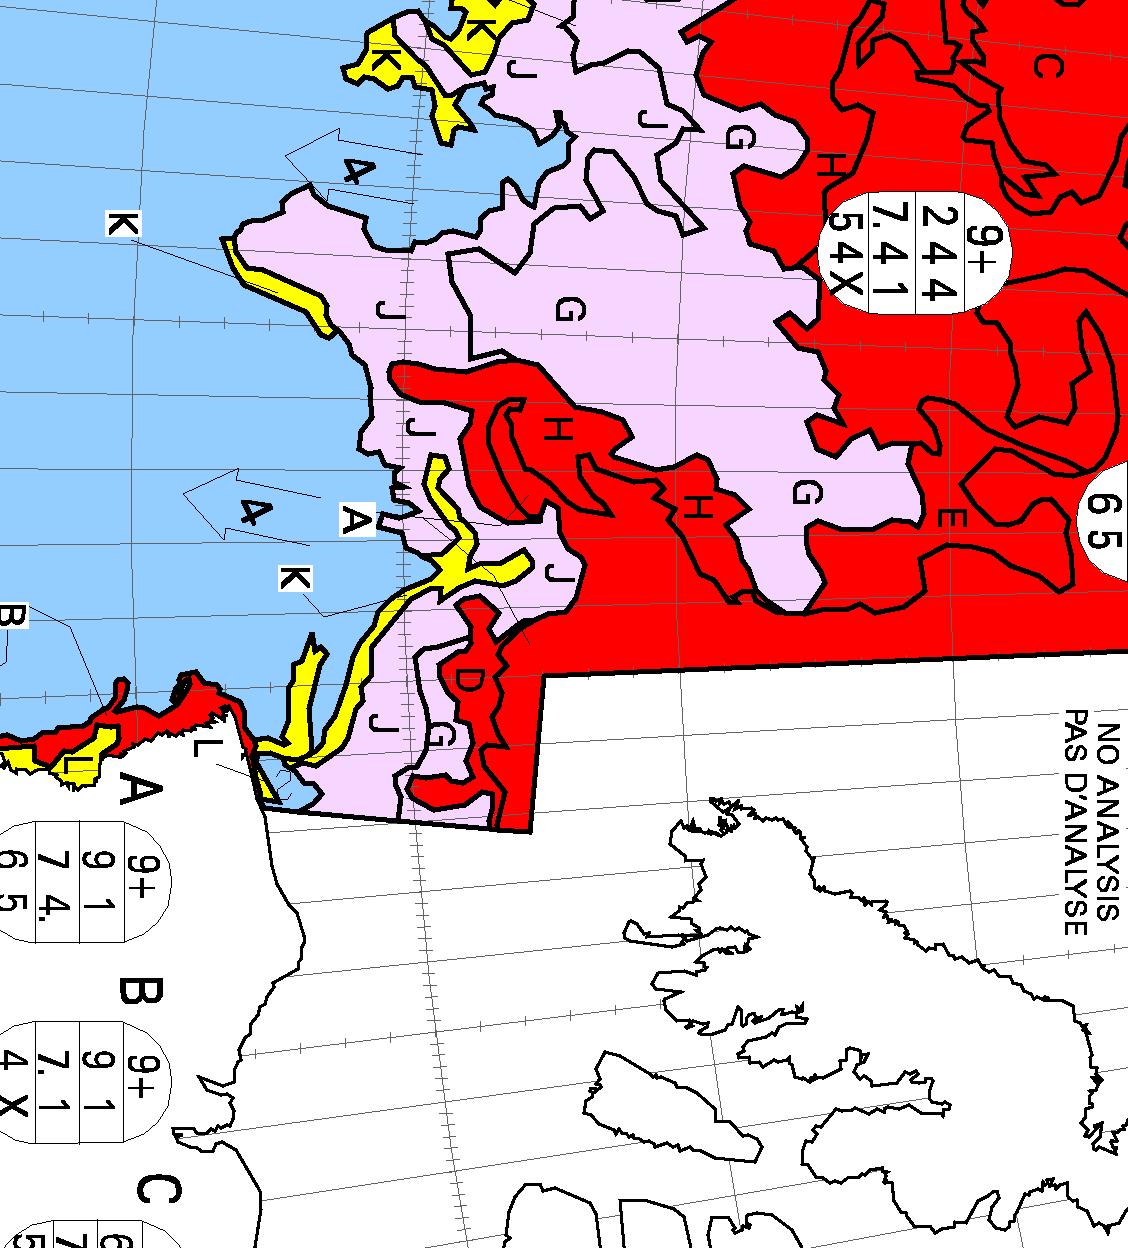
The Canadian Ice Service still have 4-6/10 ice within a whisker of the coast. Would you fancy your chances in amongst that and a bit of a breeze?
The CIS definition of “navigable” is “a criteria of less than 60% ice cover over all sections of the Northwest Passage”. See:
The answer to the question posed in the title to this article is therefore currently NO, the Northwest Passage is not open yet, both officially from the CIS and unofficially from any mariner with a sense of self preservation in charge of any vessel that isn’t “ice hardened”. In all the circumstances that answer might change quite quickly though!
[Edit 18/09/15]
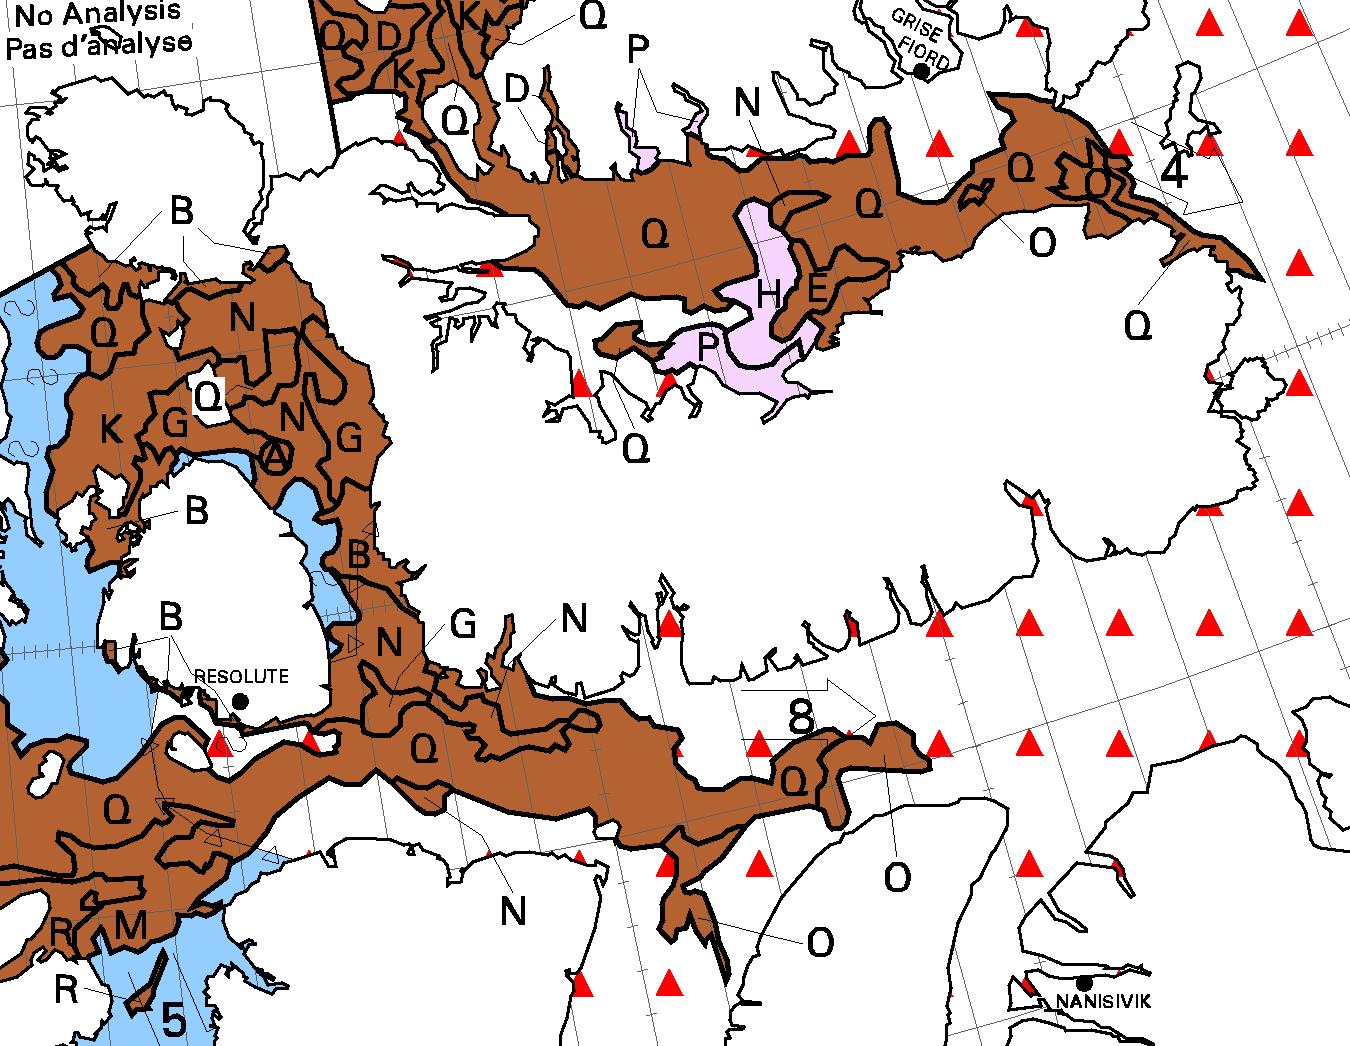
The Canadian Ice Service have finally published a close up map of the Parry Channel that doesn’t say “No Analysis”. Here it is:
There’s still a (narrow!) green path into McClure Strait, so I reckon we can at long last confidently declare the main Northwest Passage to be OPEN!
This website uses cookies to improve your experience. We'll assume you're ok with this, but you can opt-out if you wish. Cookie settingsACCEPT
Privacy & Cookies Policy
Privacy Overview
This website uses cookies to improve your experience while you navigate through the website. Out of these, the cookies that are categorized as necessary are stored on your browser as they are essential for the working of basic functionalities of the website. We also use third-party cookies that help us analyze and understand how you use this website. These cookies will be stored in your browser only with your consent. You also have the option to opt-out of these cookies. But opting out of some of these cookies may affect your browsing experience.
Necessary cookies are absolutely essential for the website to function properly. This category only includes cookies that ensures basic functionalities and security features of the website. These cookies do not store any personal information.
Any cookies that may not be particularly necessary for the website to function and is used specifically to collect user personal data via analytics, ads, other embedded contents are termed as non-necessary cookies. It is mandatory to procure user consent prior to running these cookies on your website.