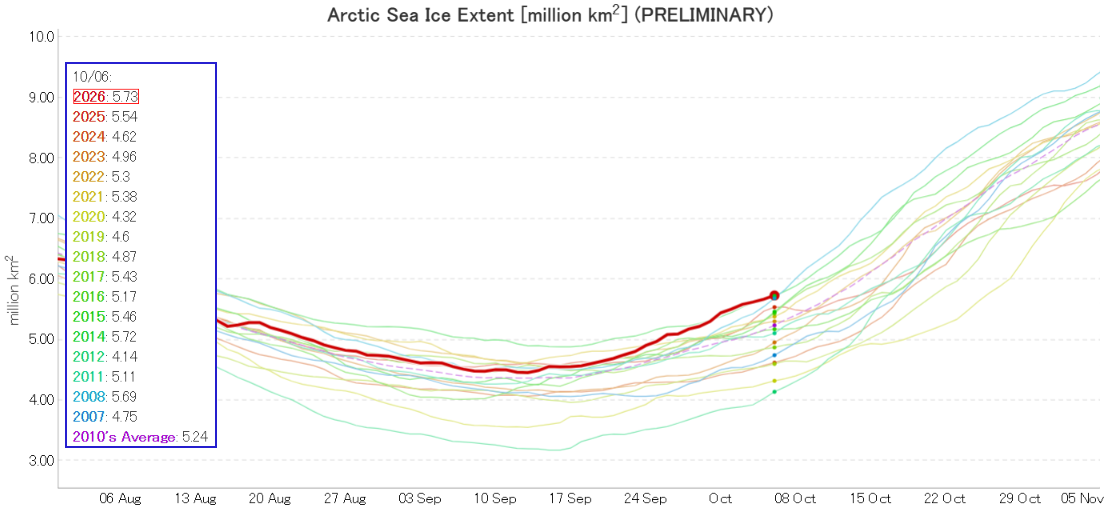
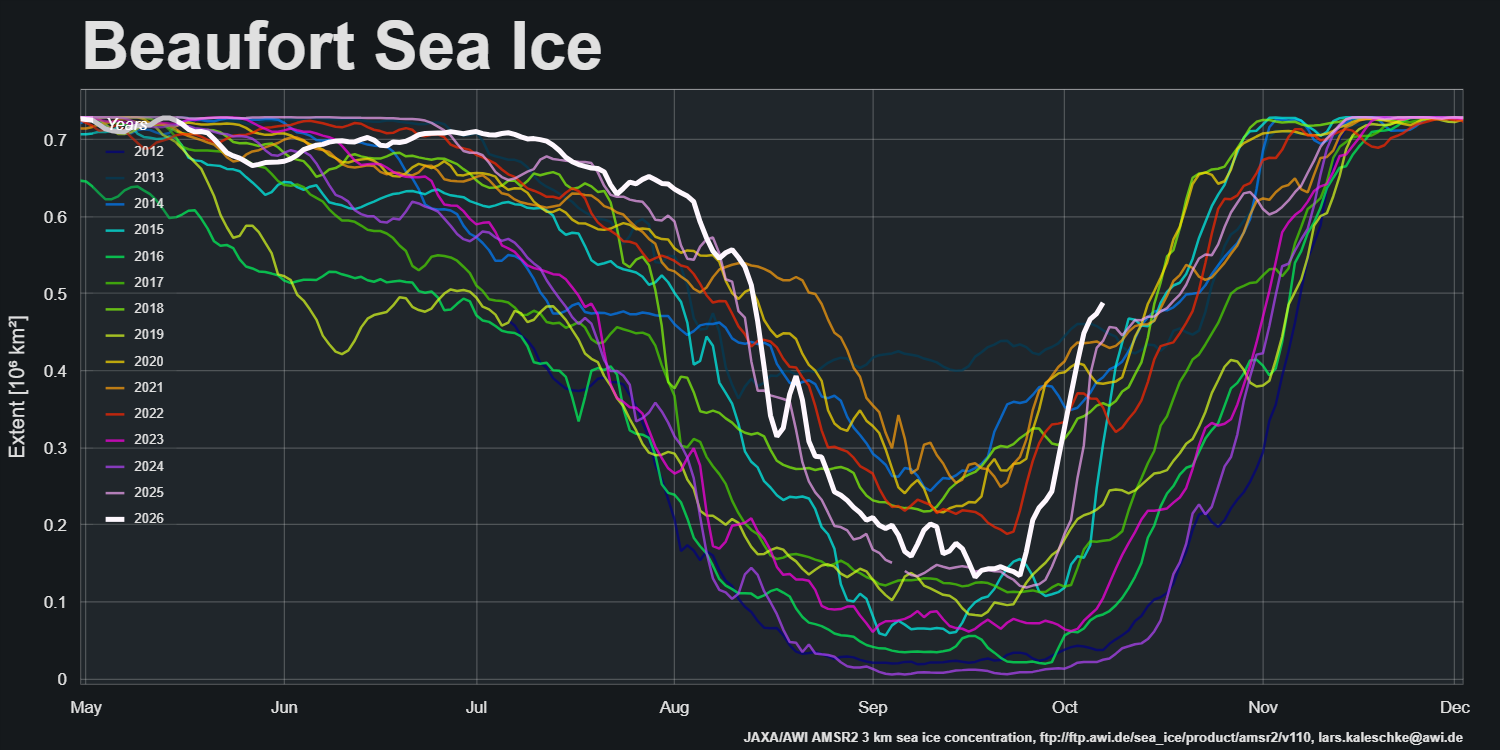
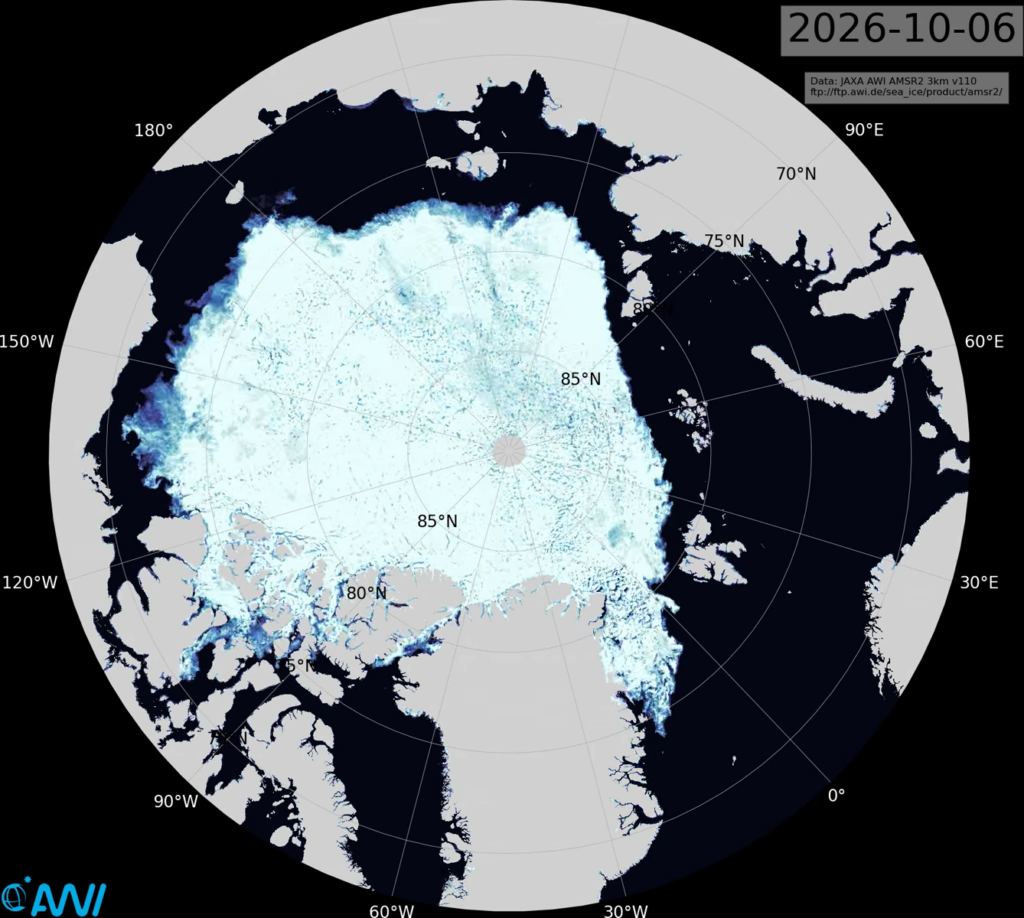
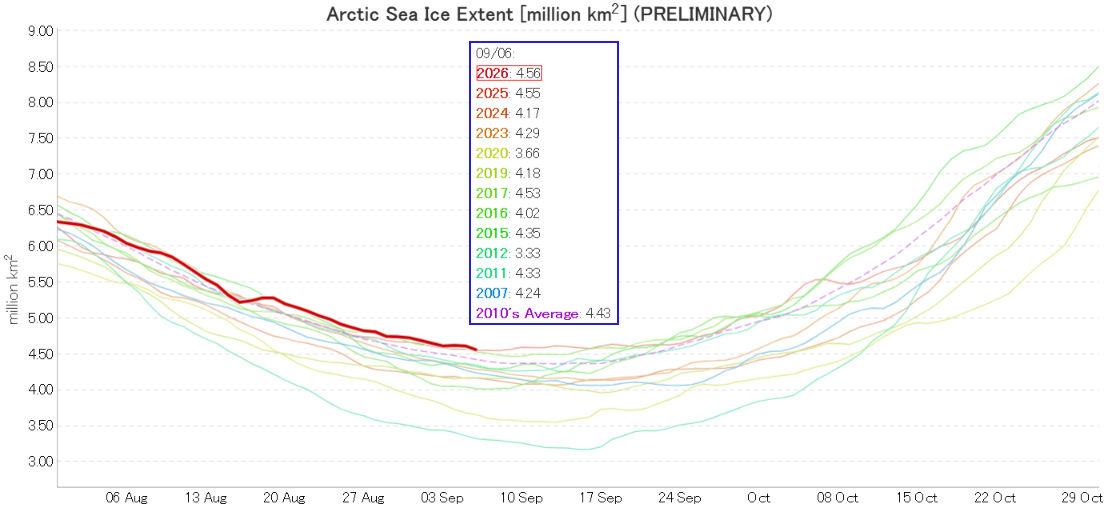
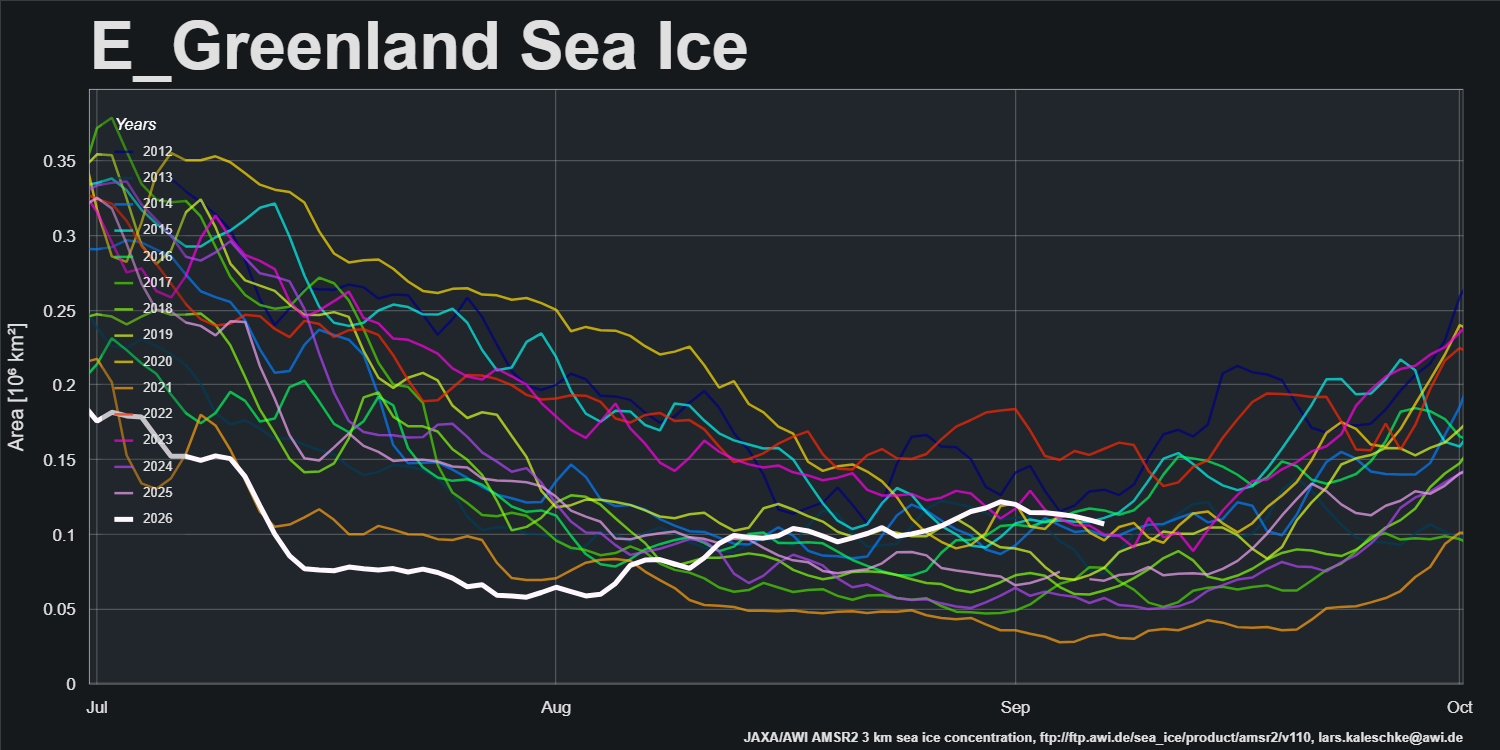
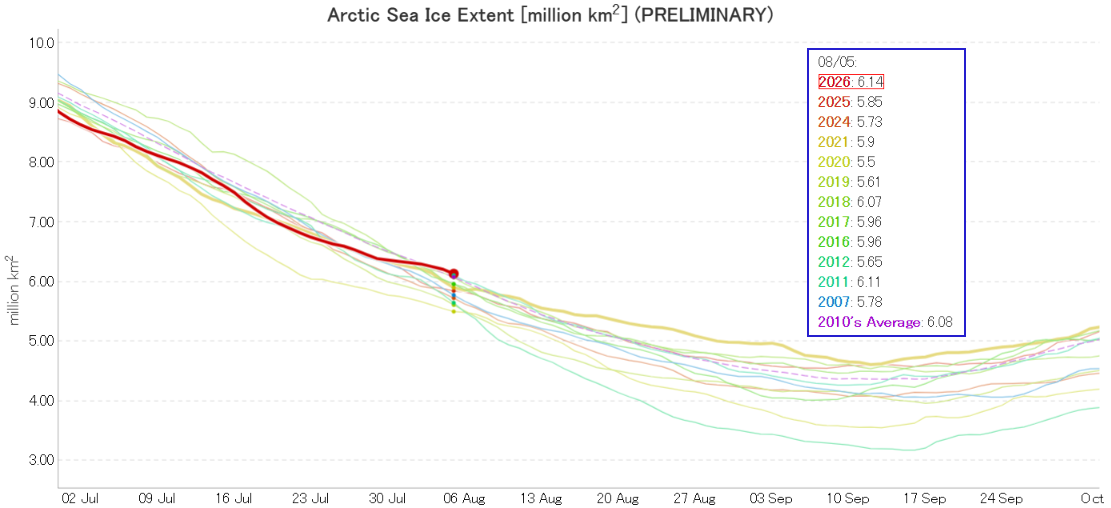
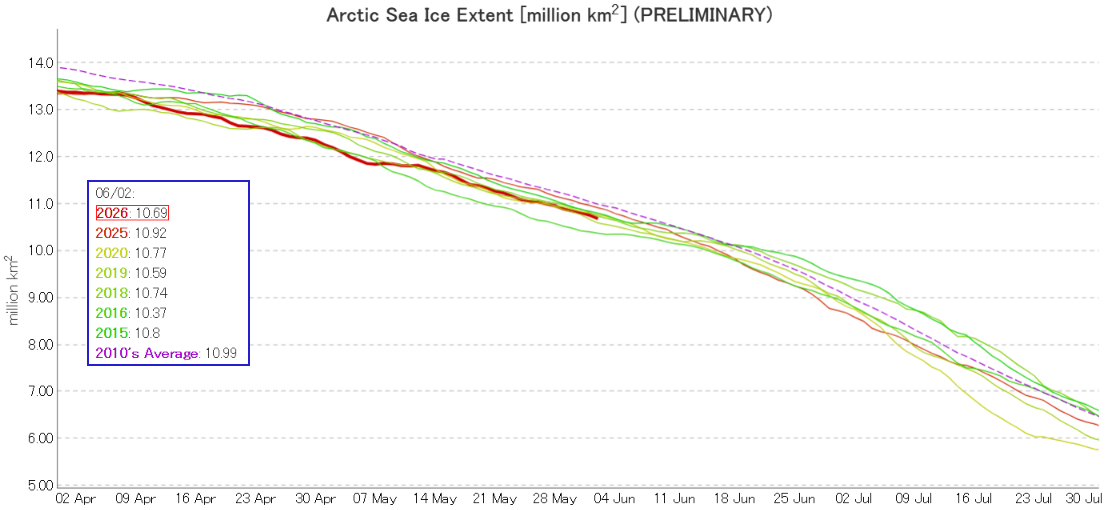
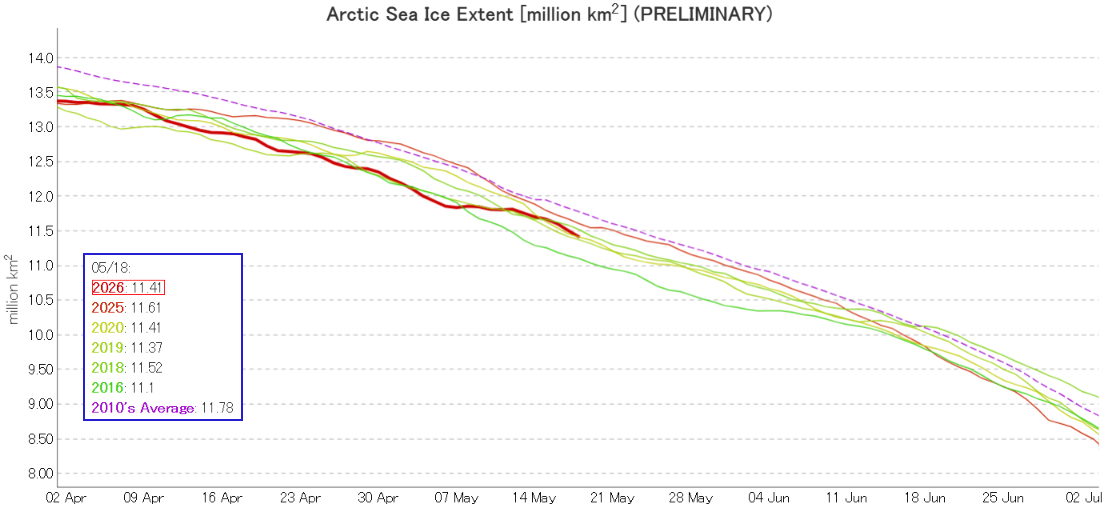
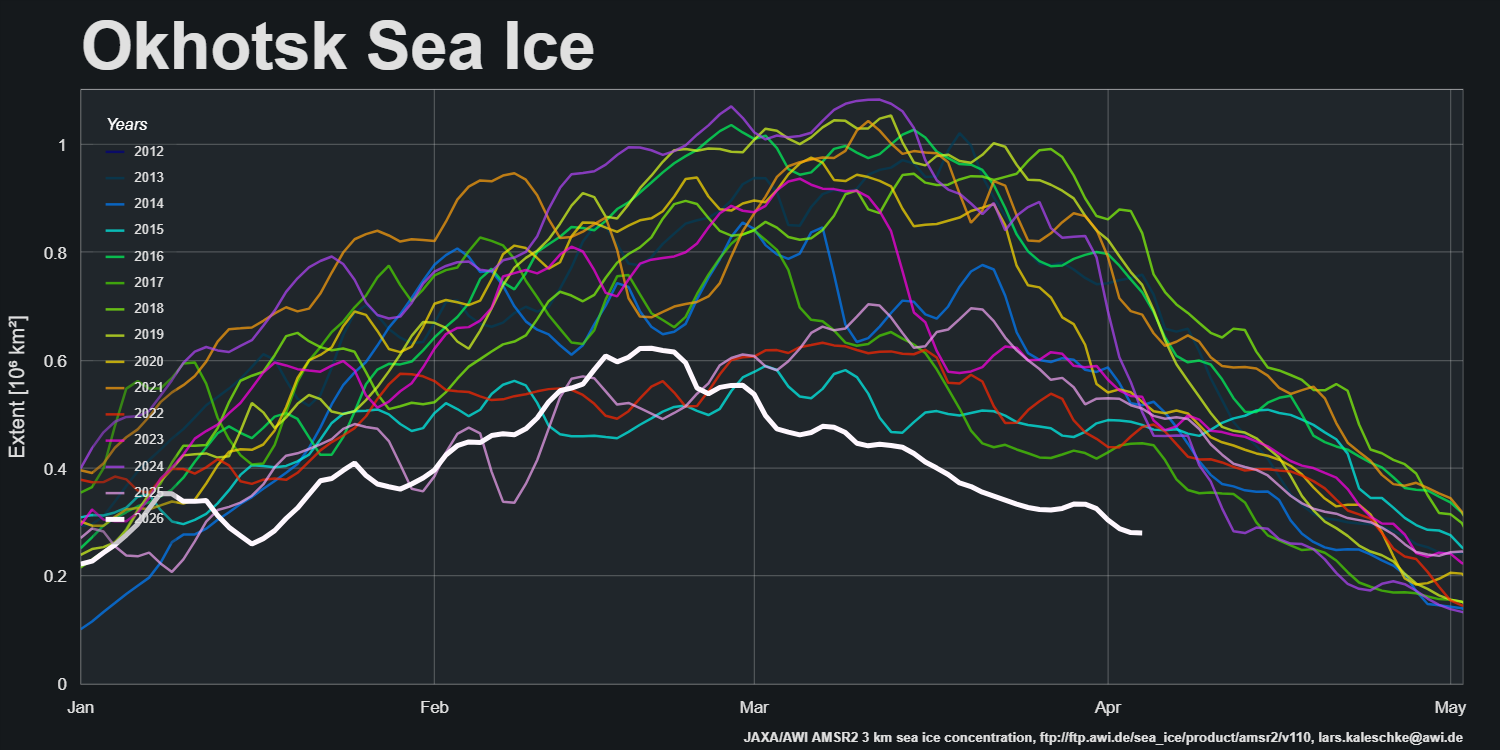
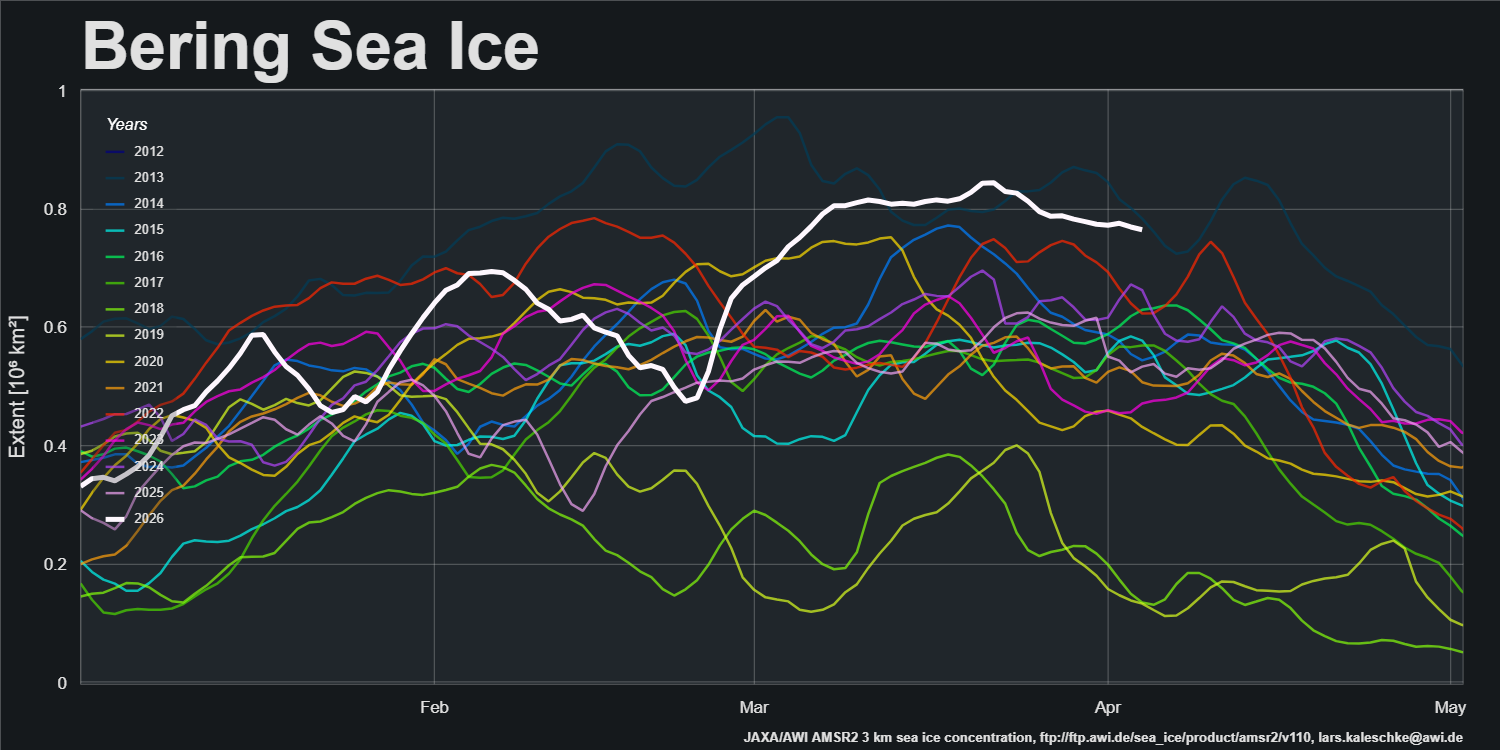
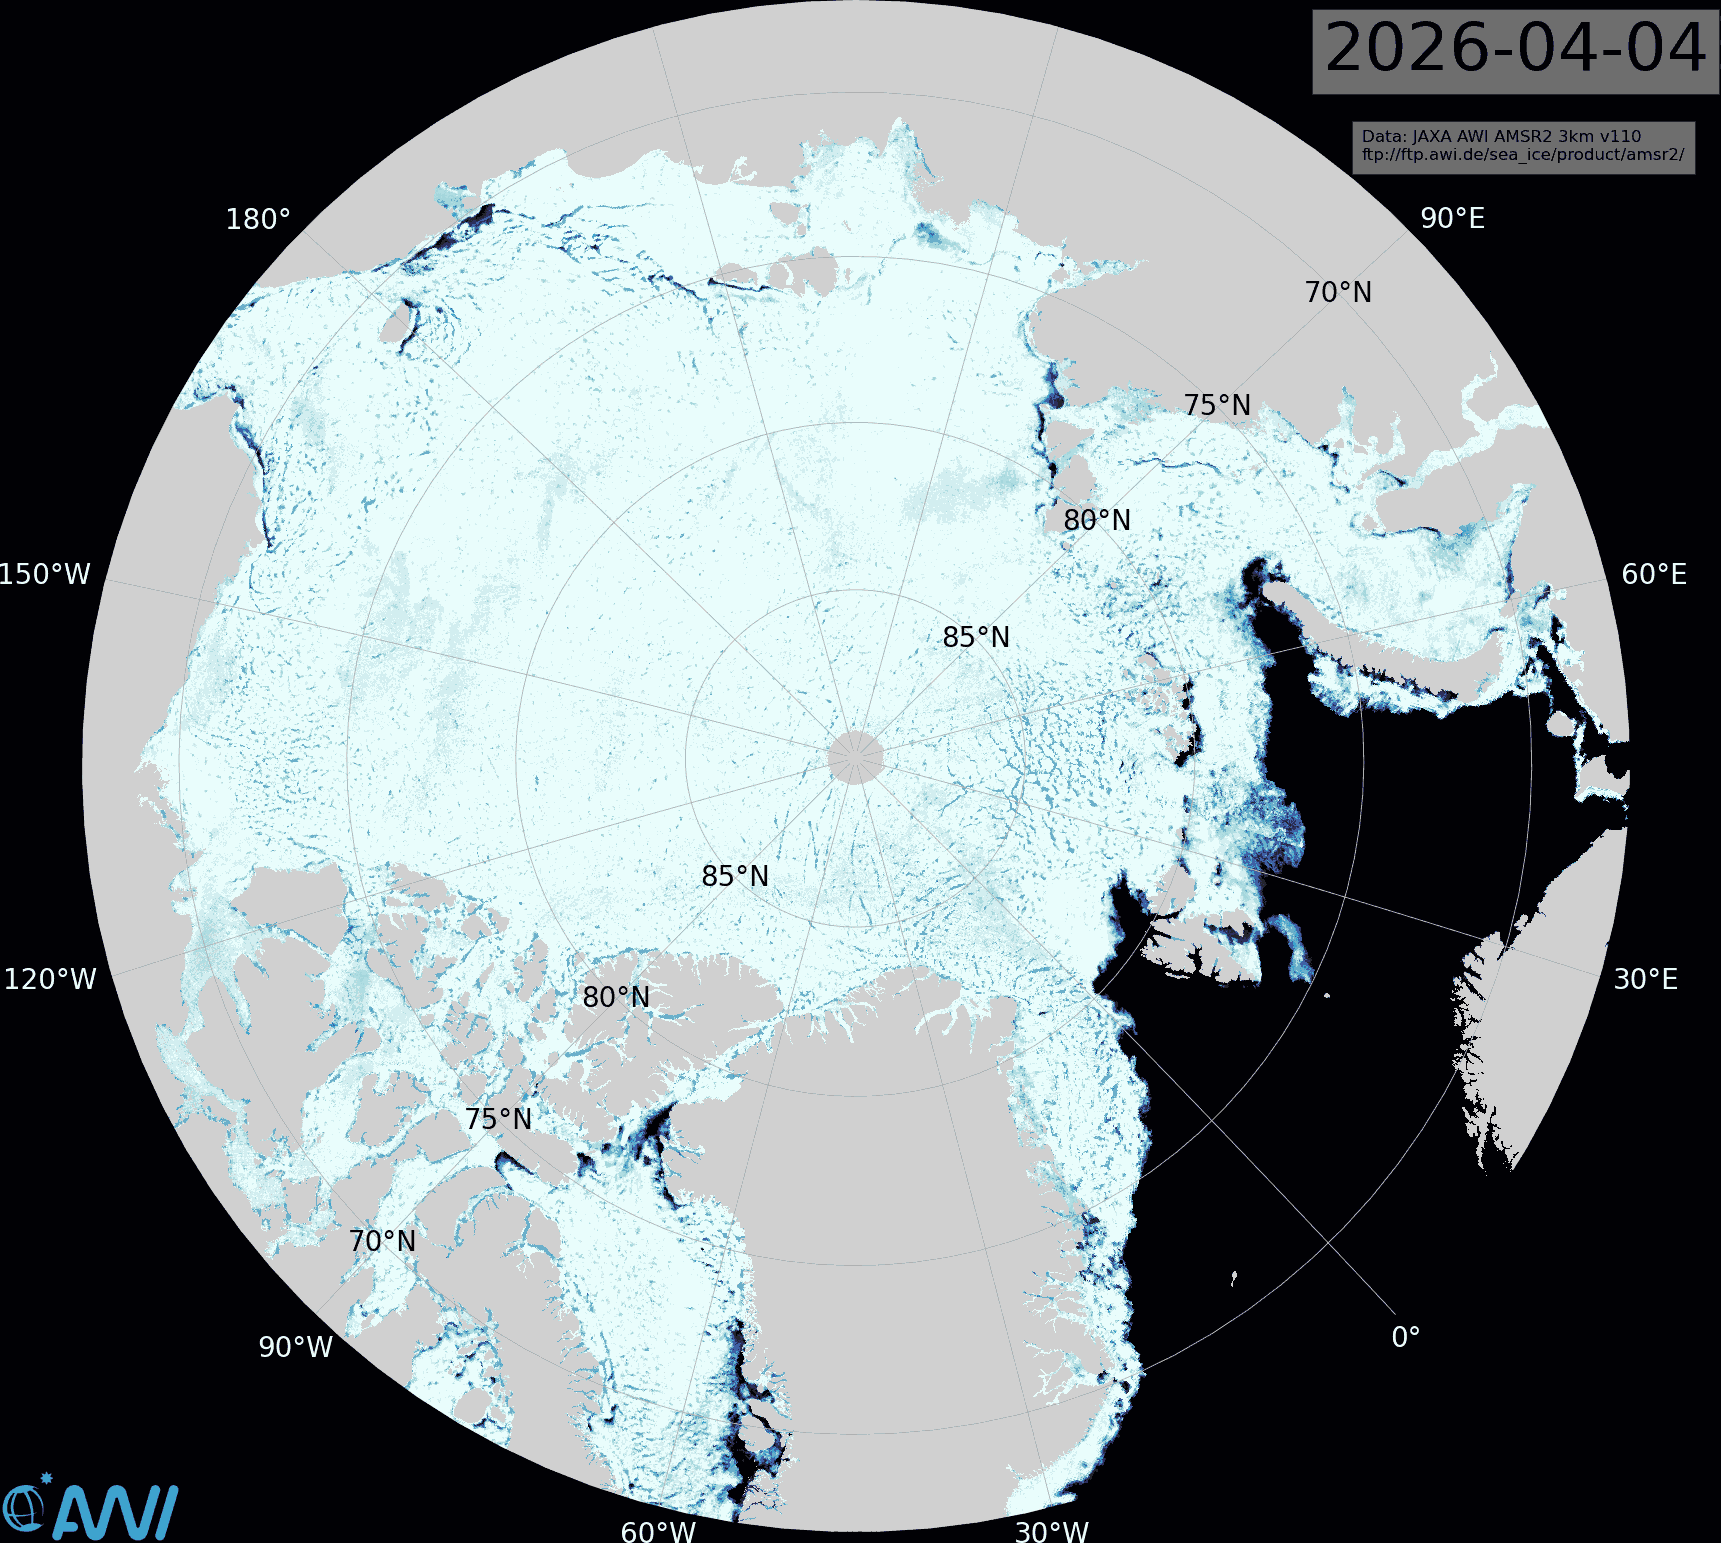
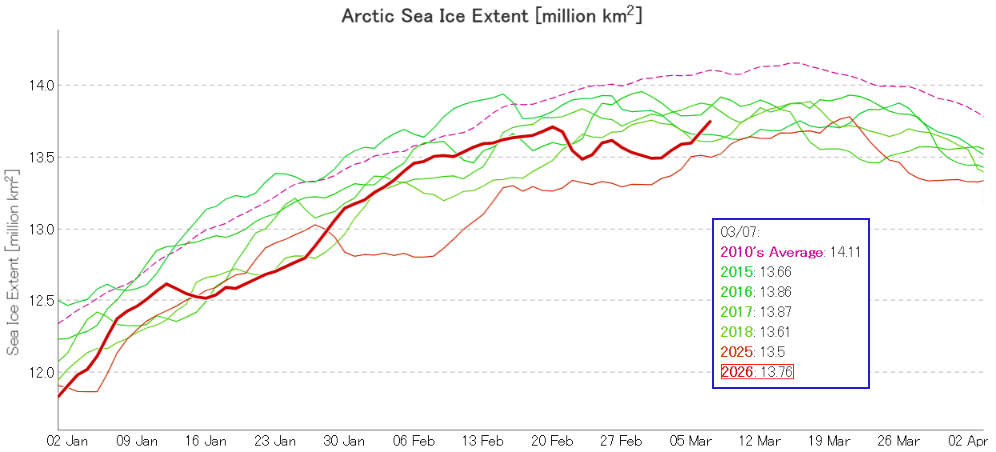
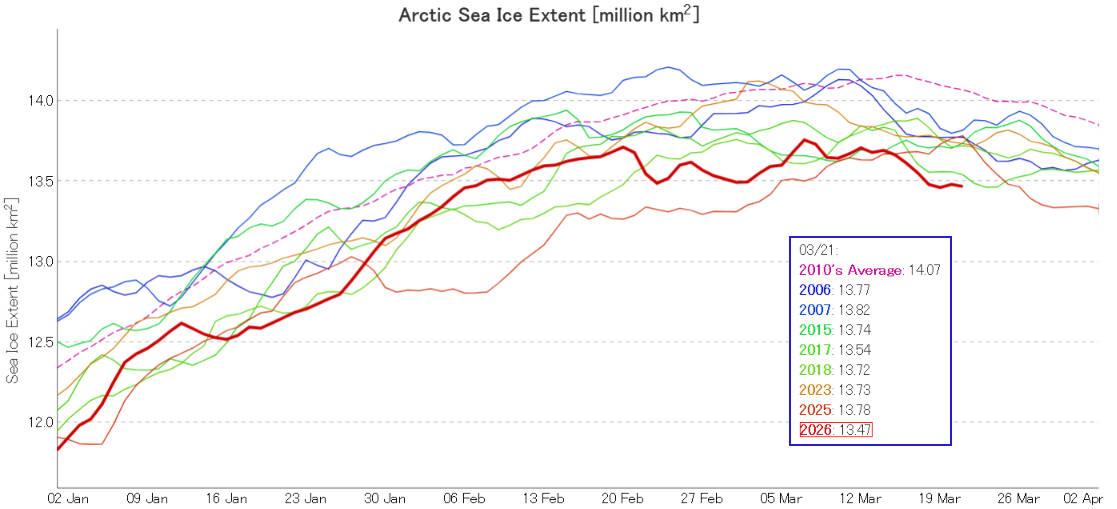
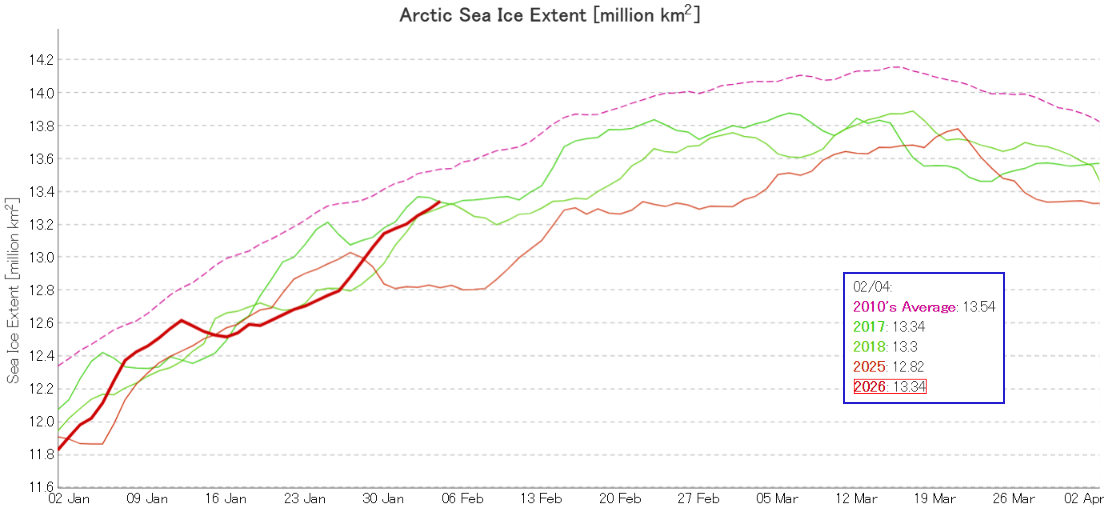
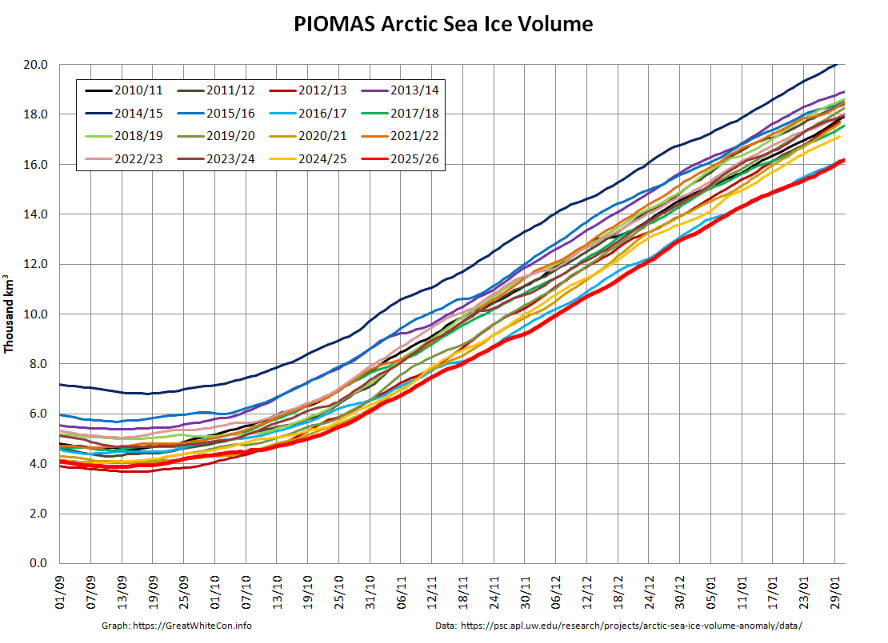
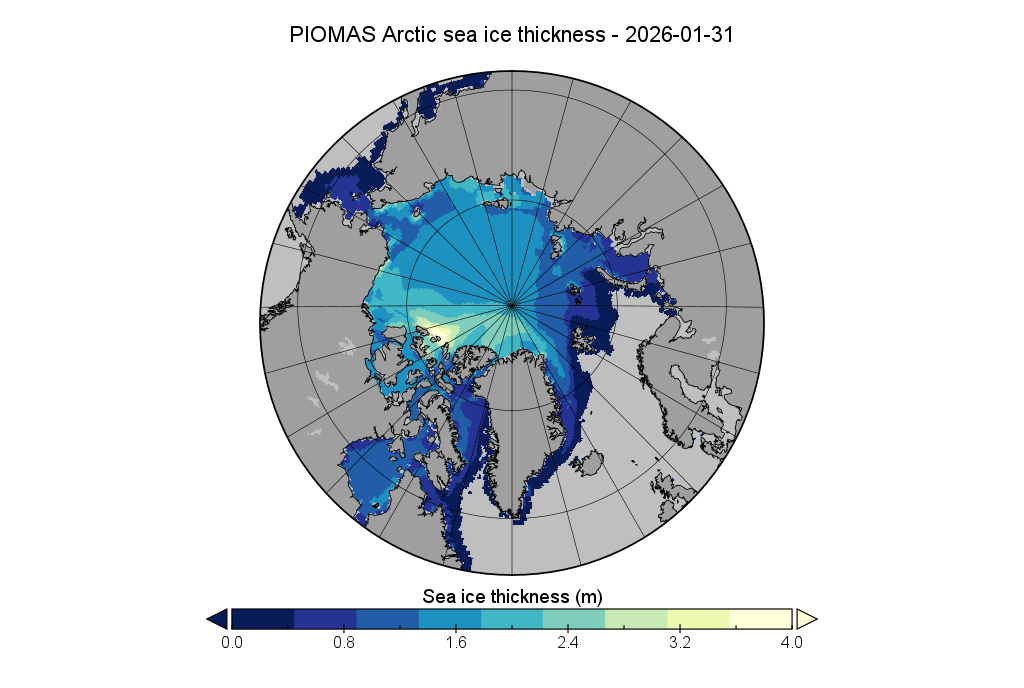
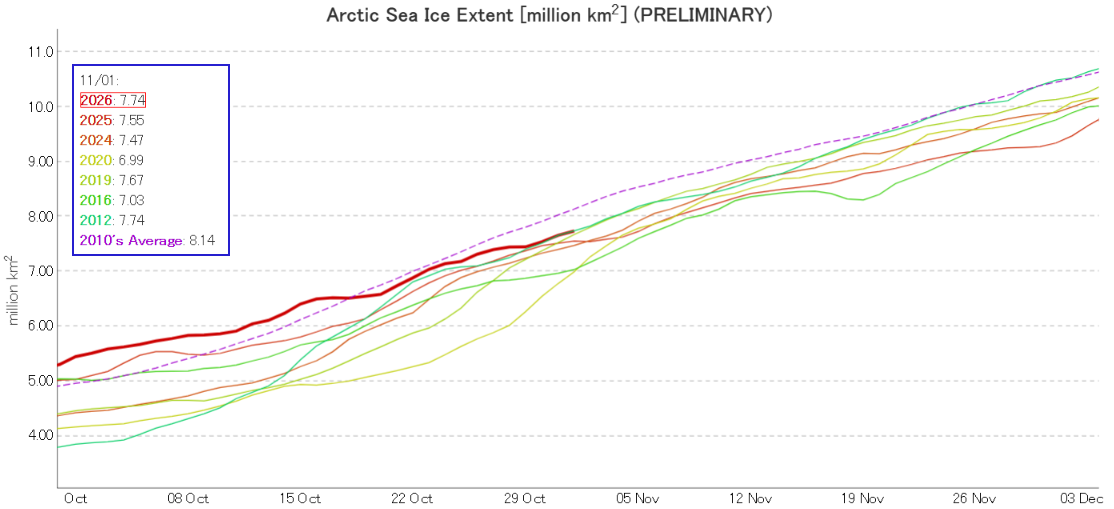
At the beginning of November JAXA/ViSHOP extent is in a “statistical tie” with 2012 for 6th lowest for the date in the satellite era:
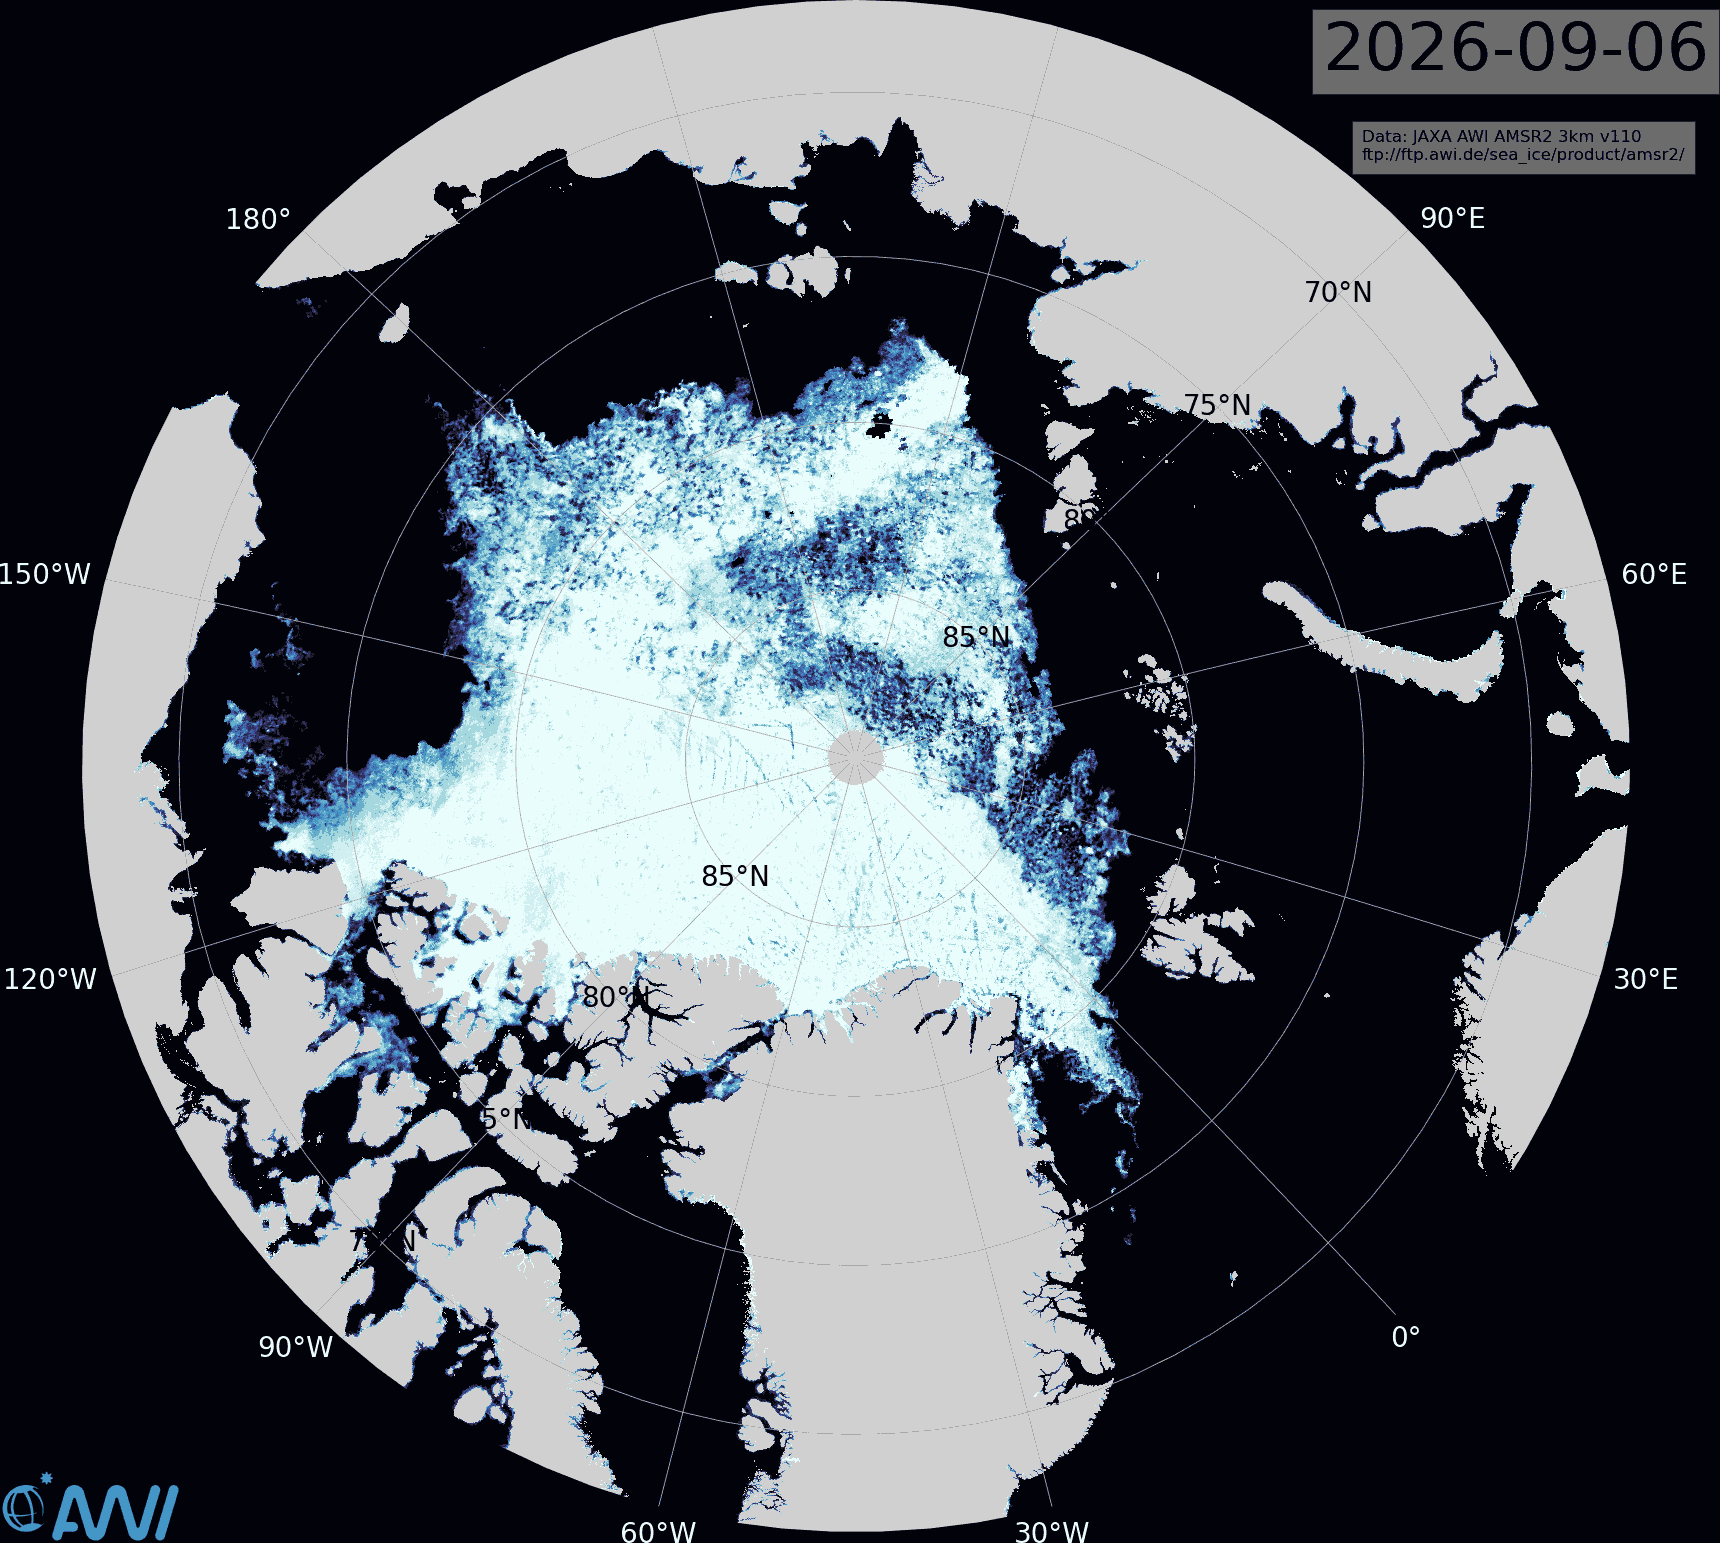
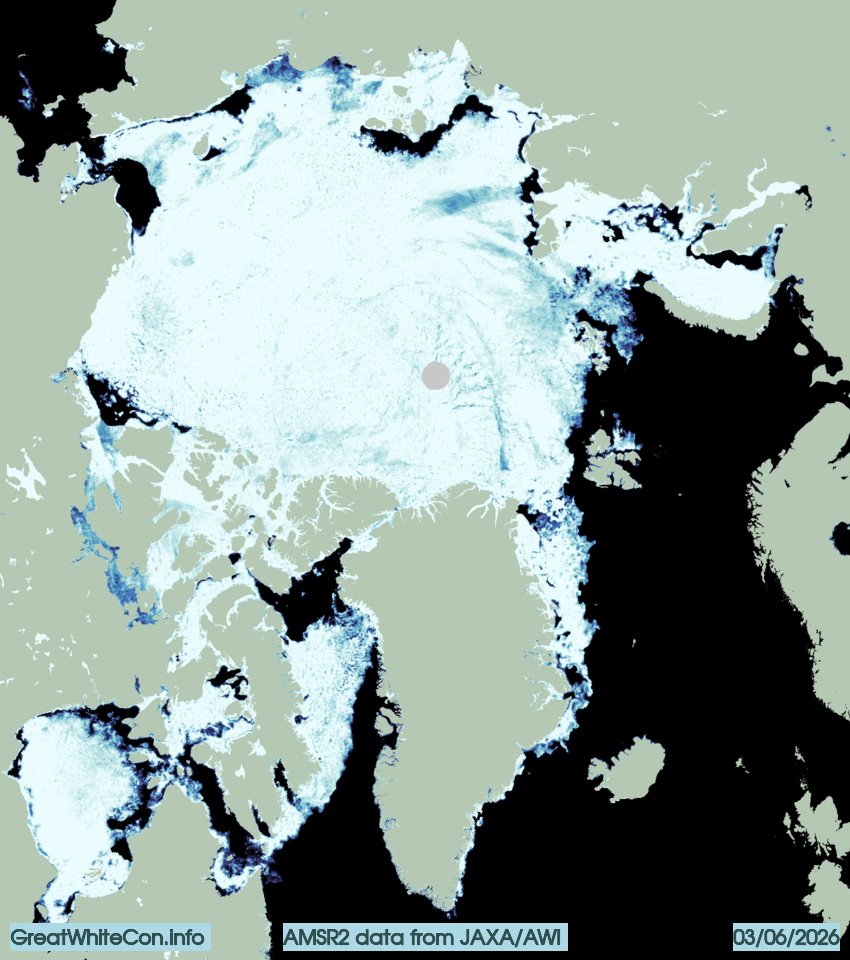
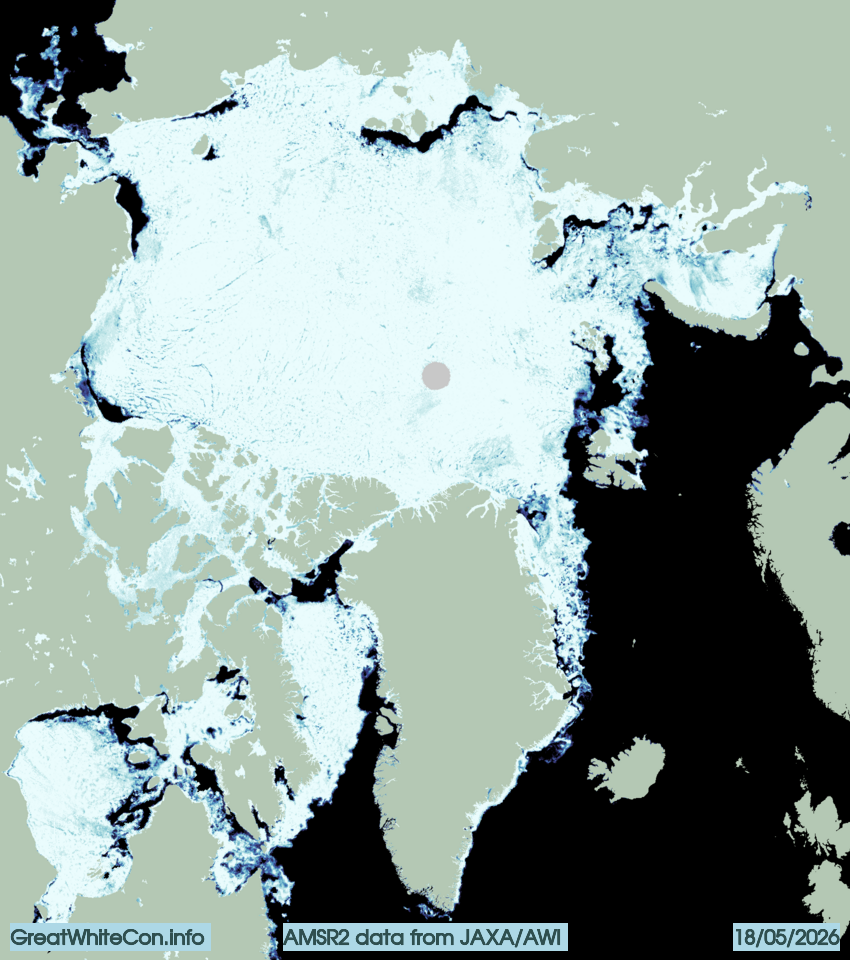
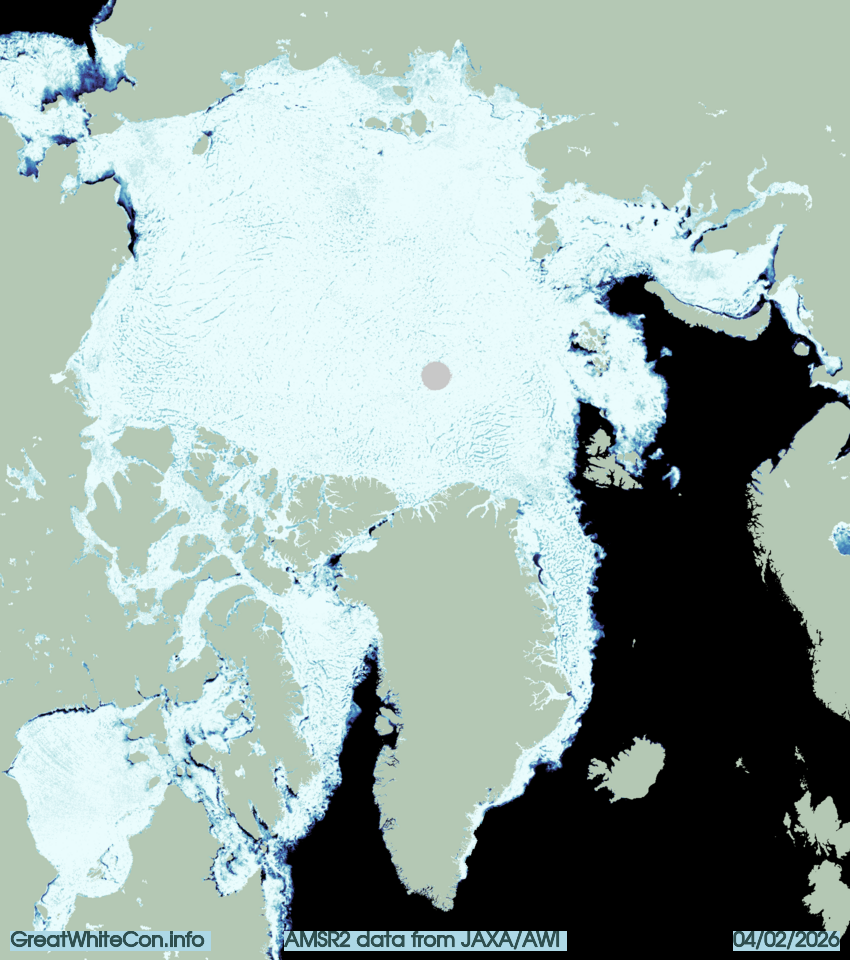
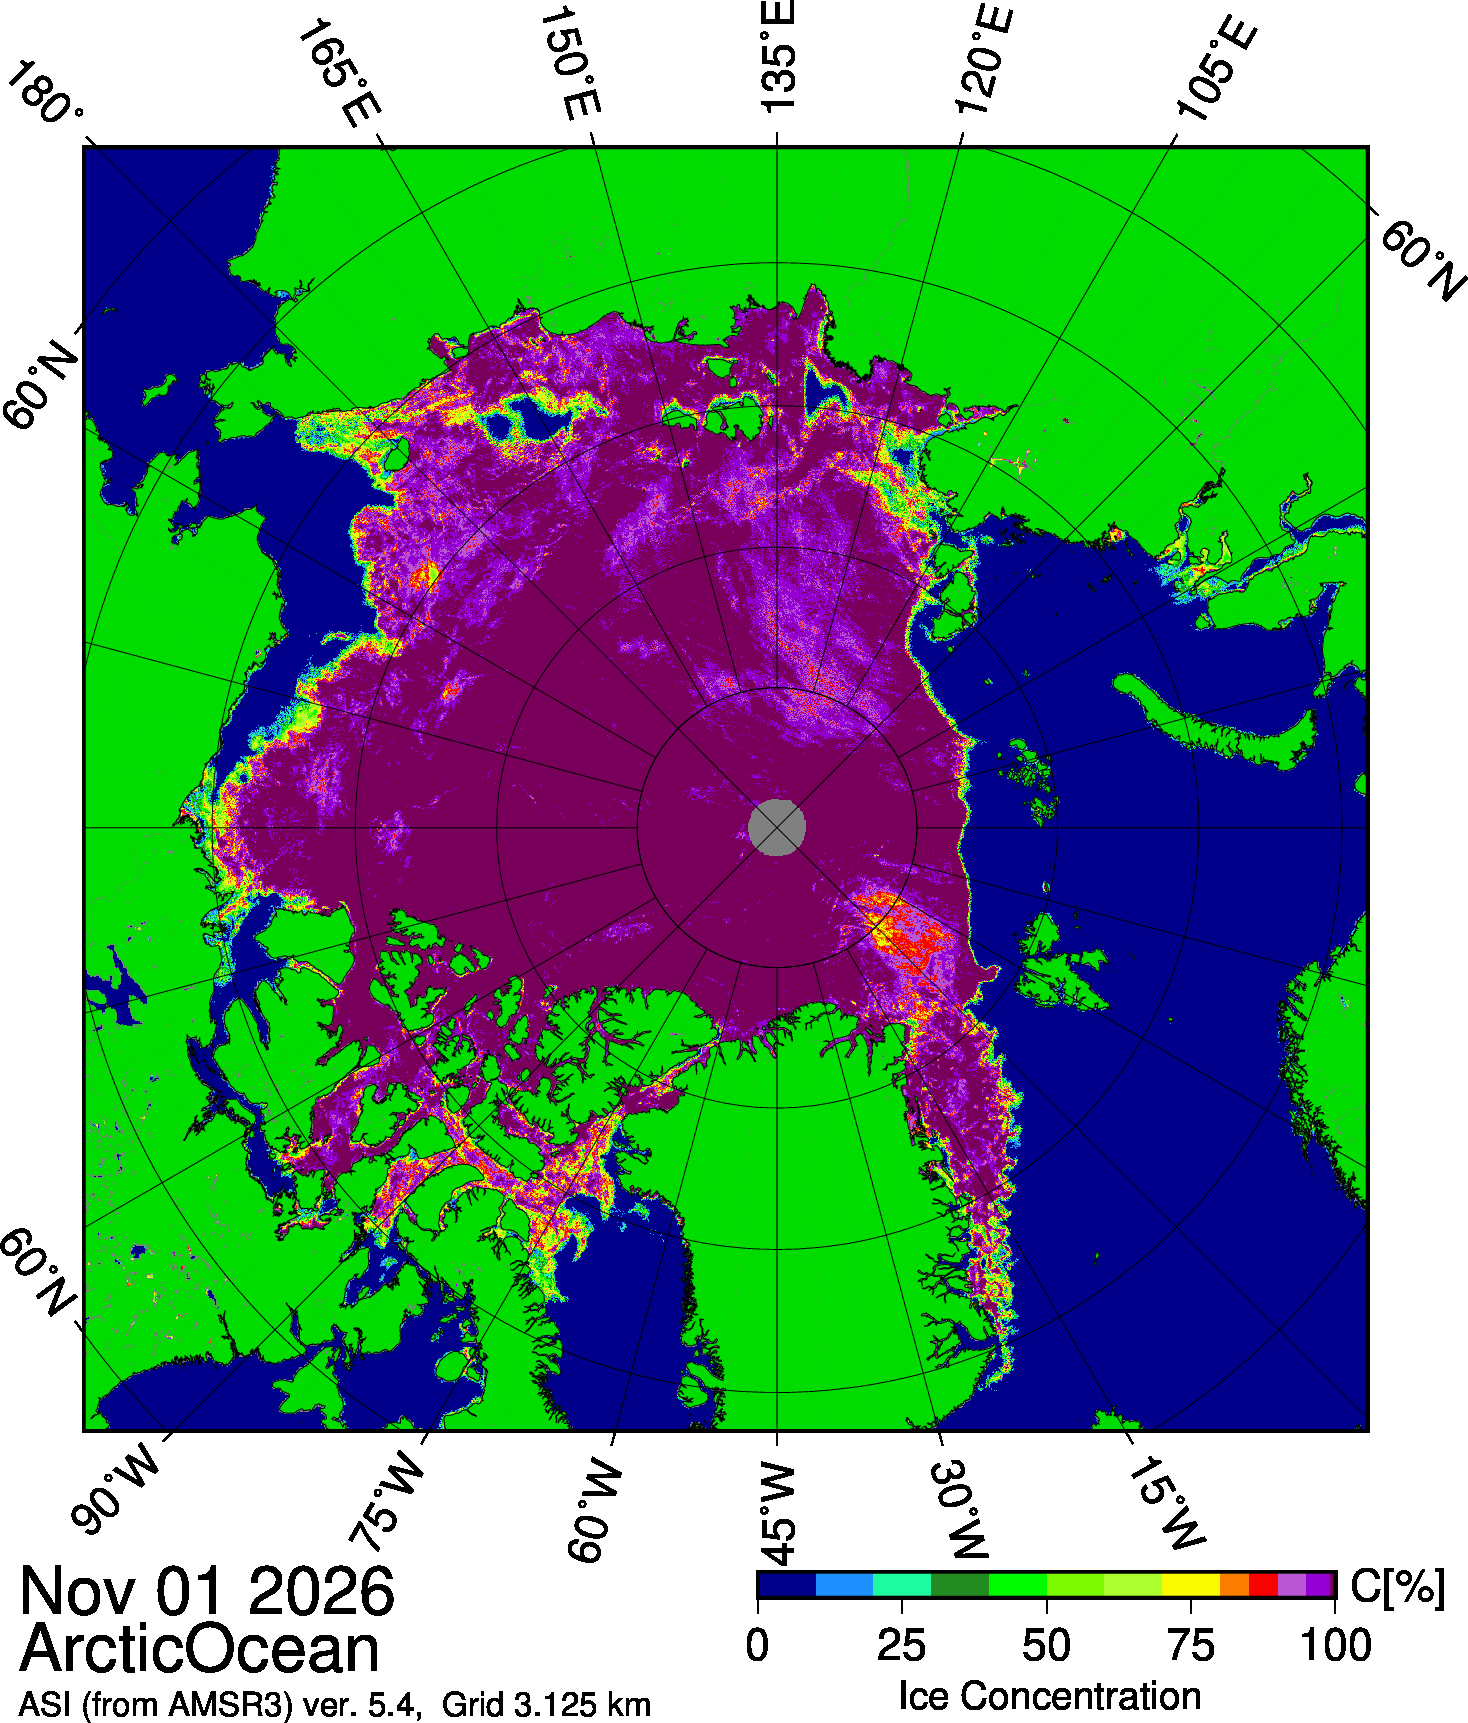
In the continuing absence of the Alfred Wegener Institute’s Arctic sea ice concentration map, here once again is the AMSR3 based map from the University of Bremen:
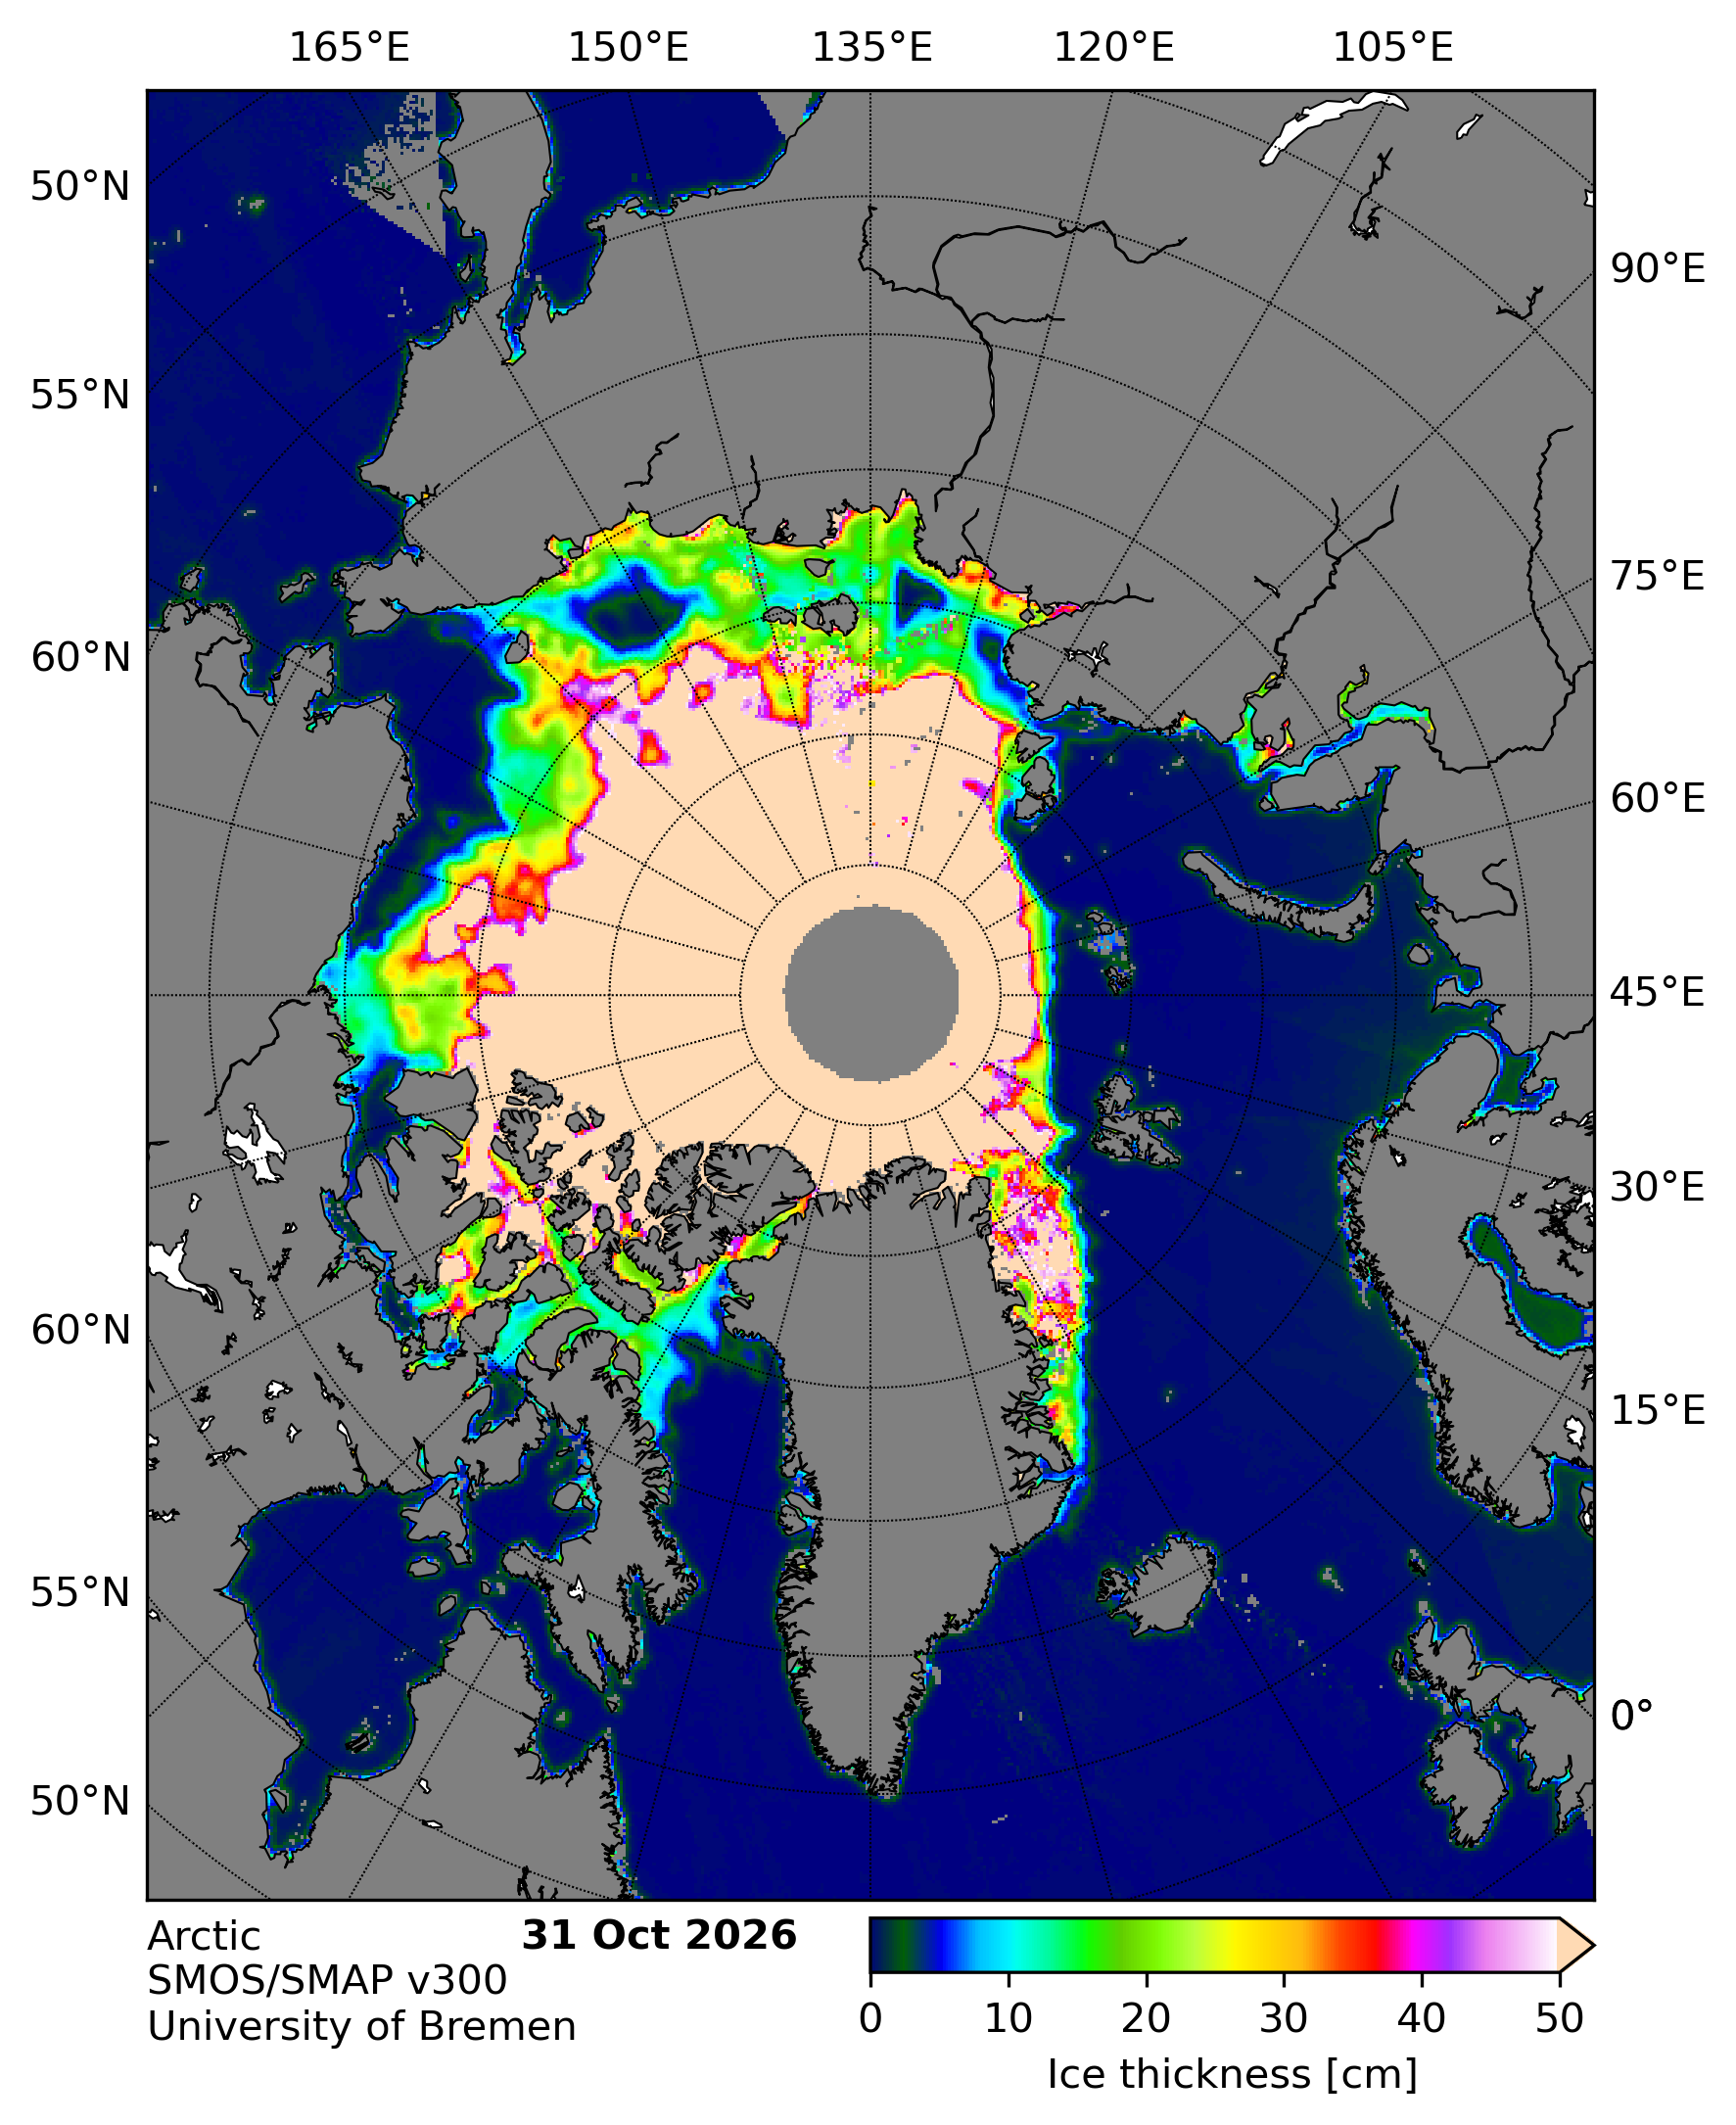
Here too is the University of Bremen’s latest SMOS/SMAP “thin ice thickness” map:
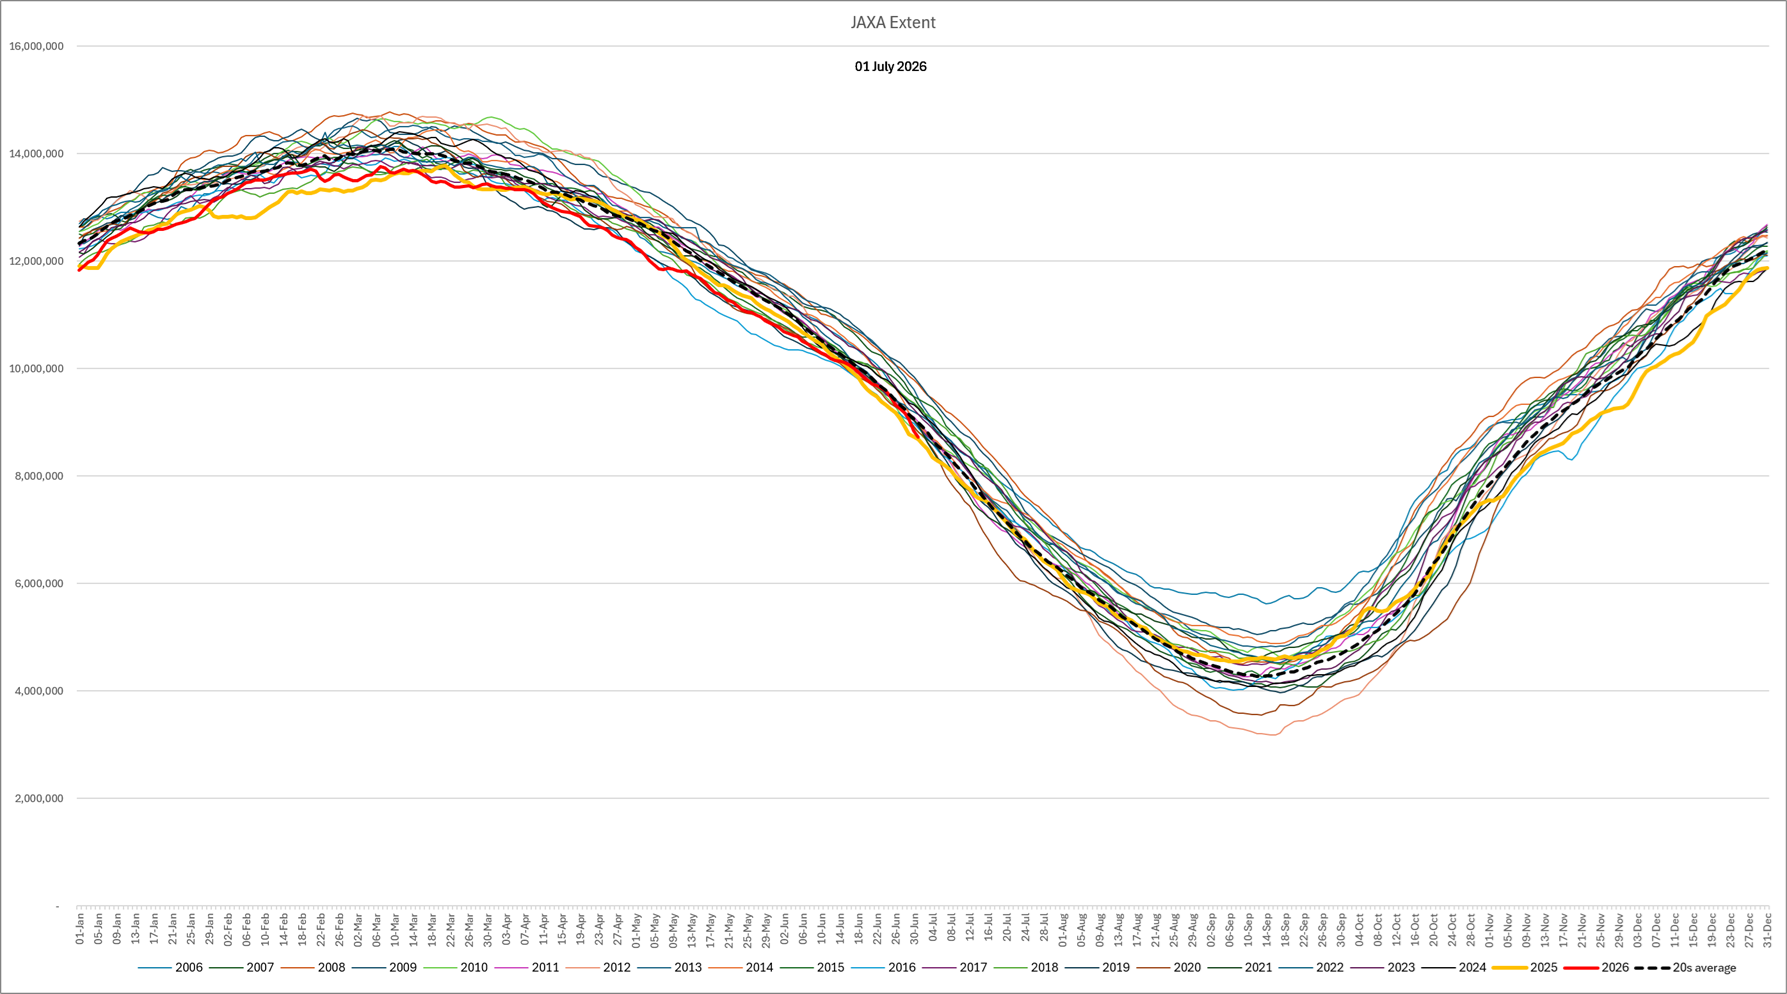
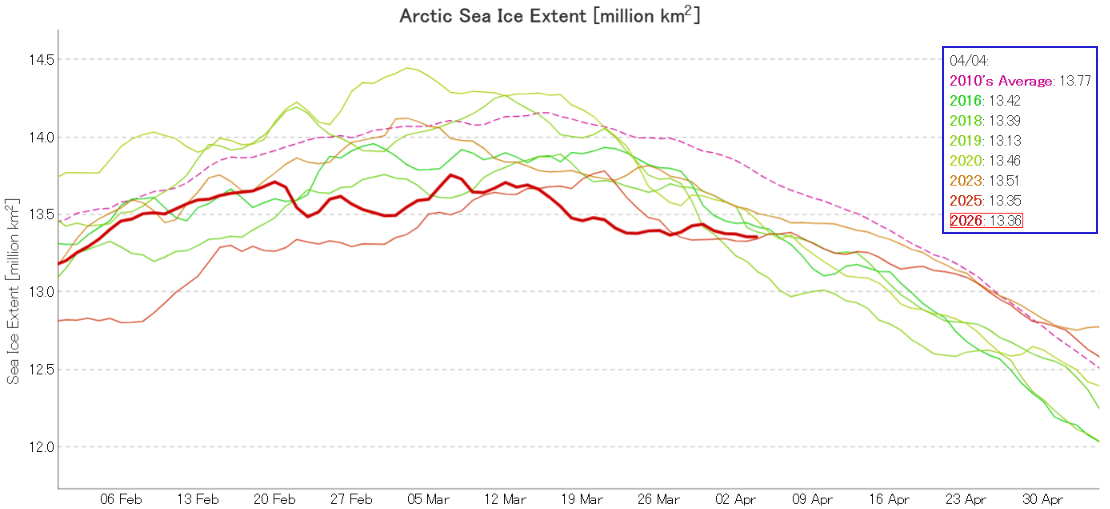
The JAXA web site is online once again, but currently extent data is only available up to November 7th:
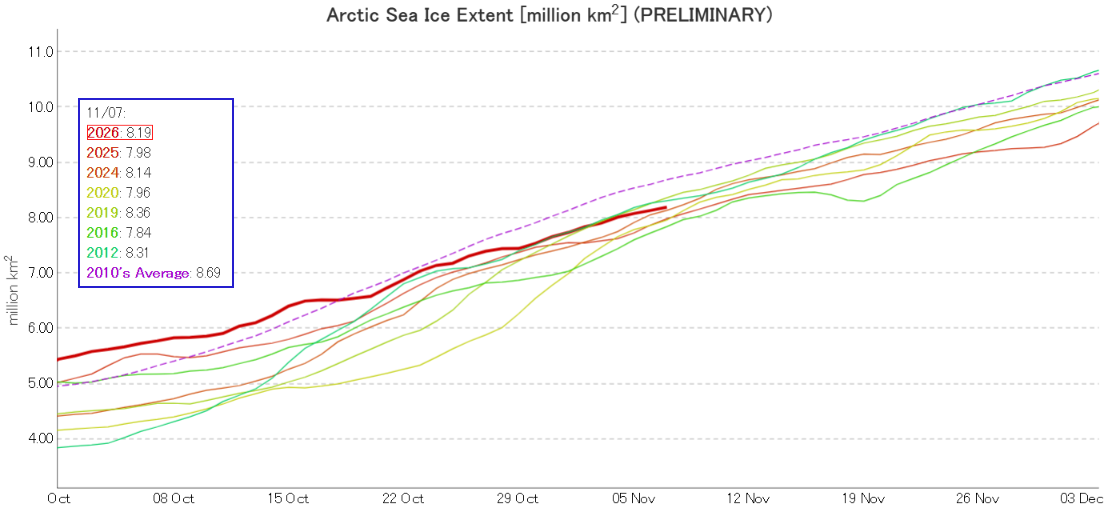
On the 7th extent was 5th lowest for the date.
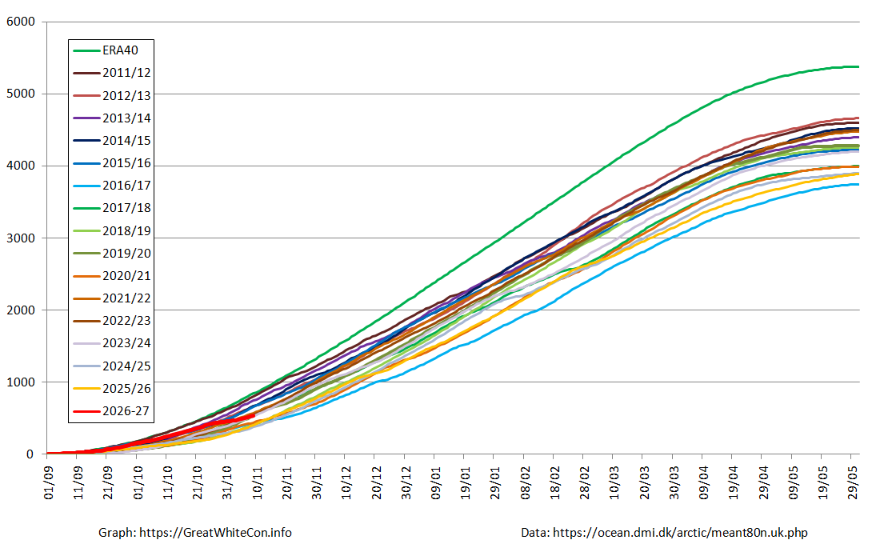
After a brisk start to the freezing season, the slope of the DMI freezing degree days graph has reduced over recent days:
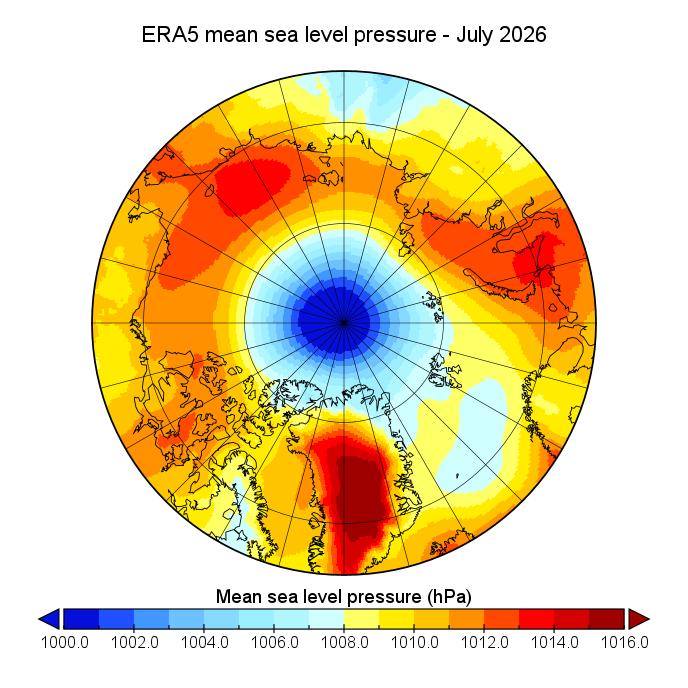
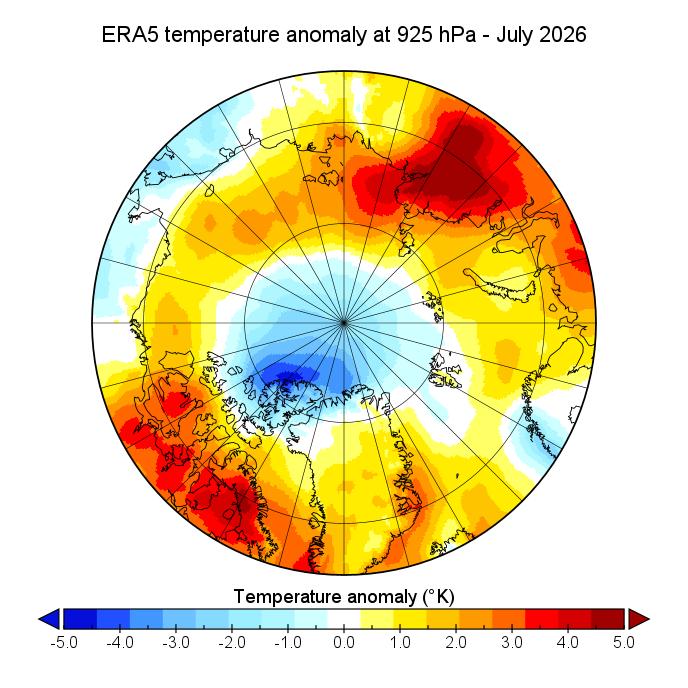
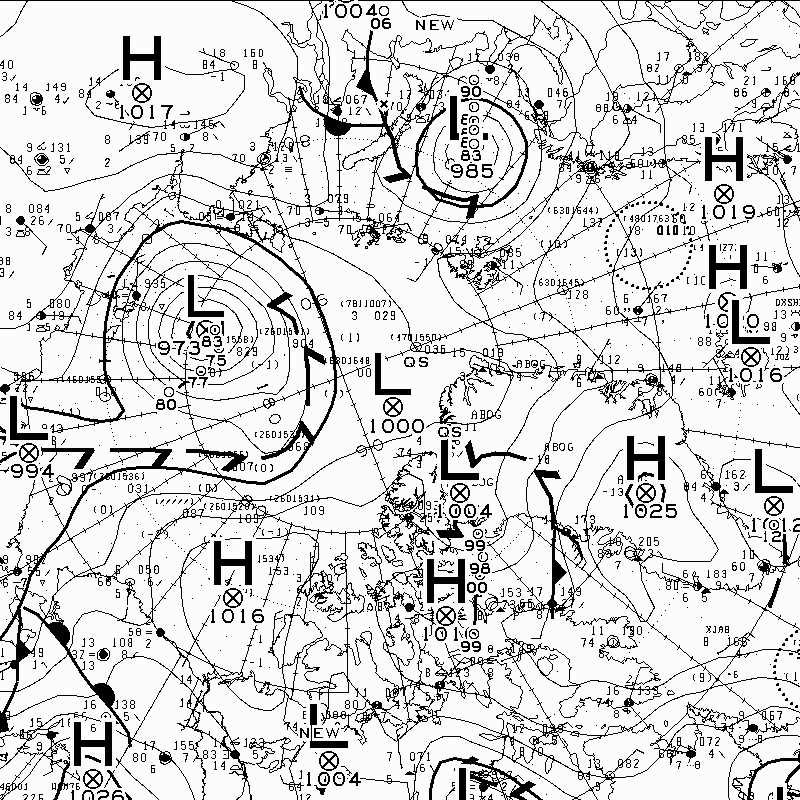
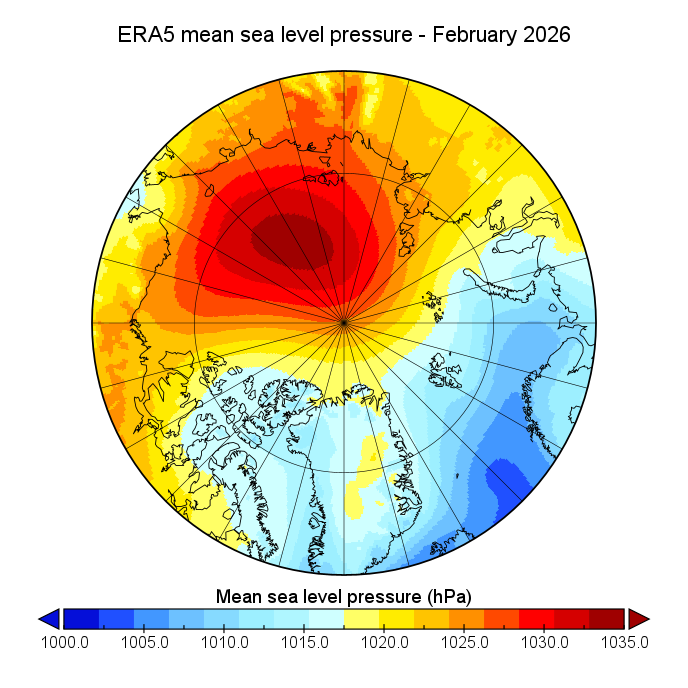
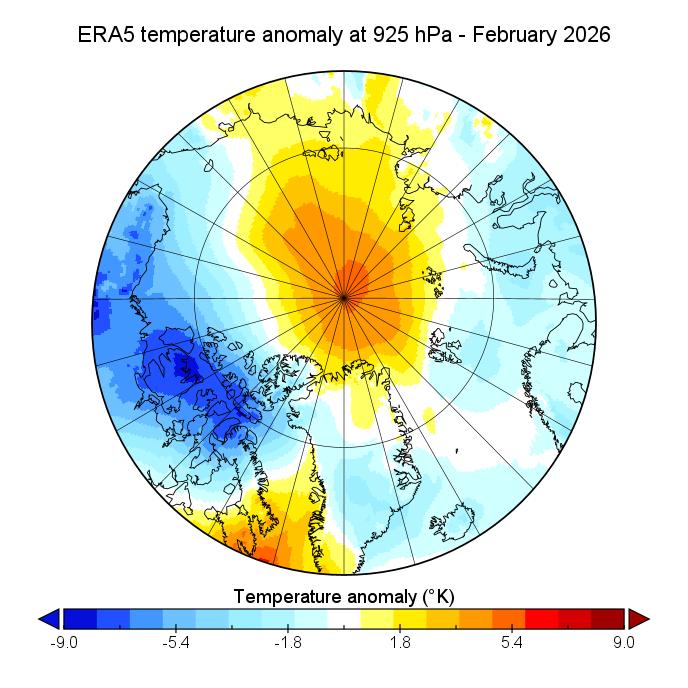
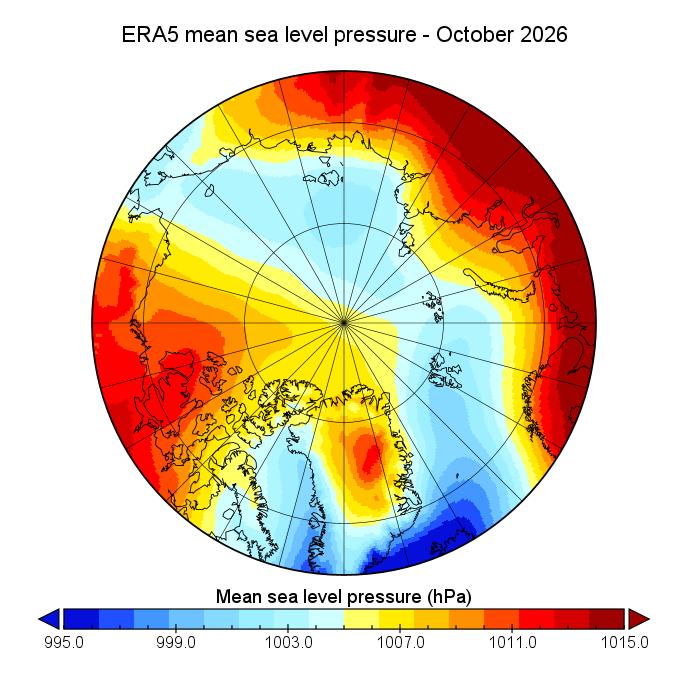
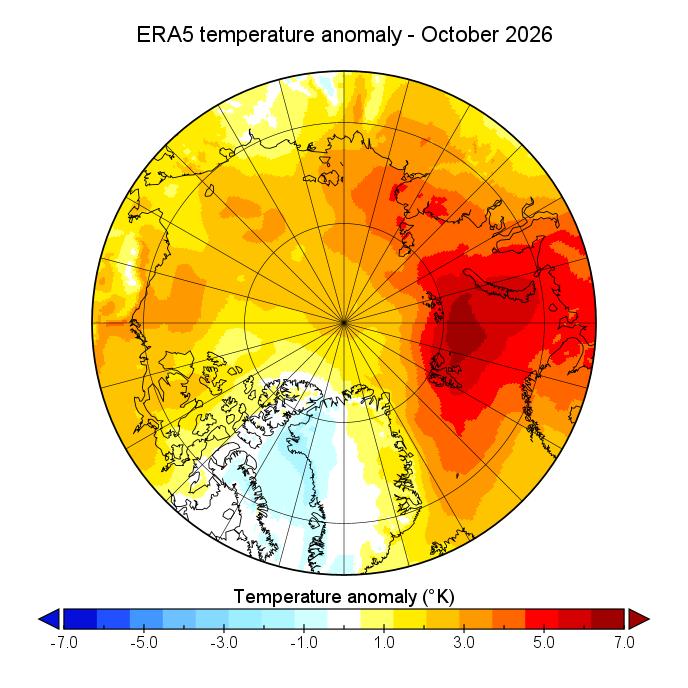
At long last atmospheric conditions over the Arctic in October failed to show persistent low pressure over the Central Arctic Basin. In October there was a dipole pattern, with low pressure on the Siberian side of the CAB opposed to high pressure on the Canadian side. Temperatures at the 925 hPa pressure level were anomalously high across most of the Arctic, in particular over the Barents Sea. Baffin Bay was the only area slightly cooler than average:
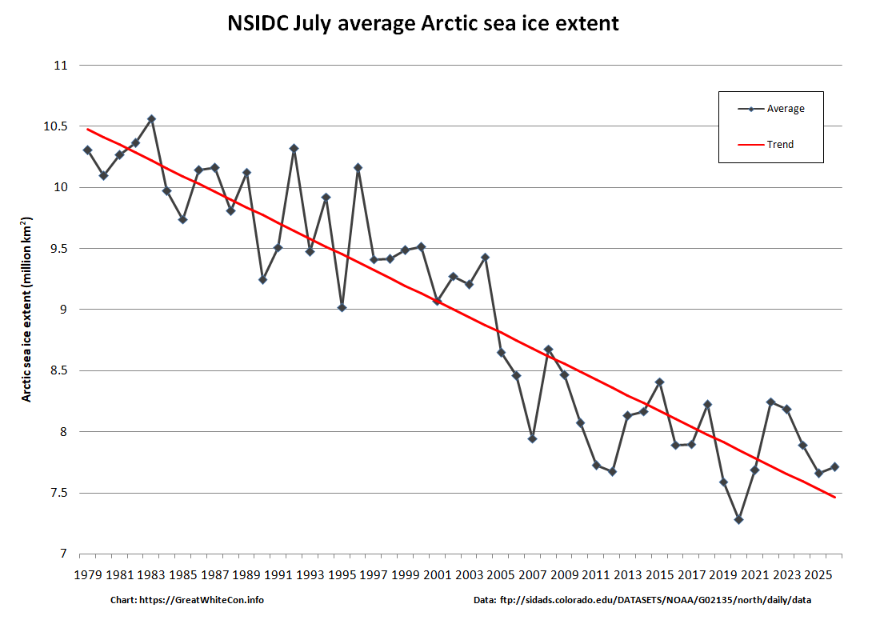
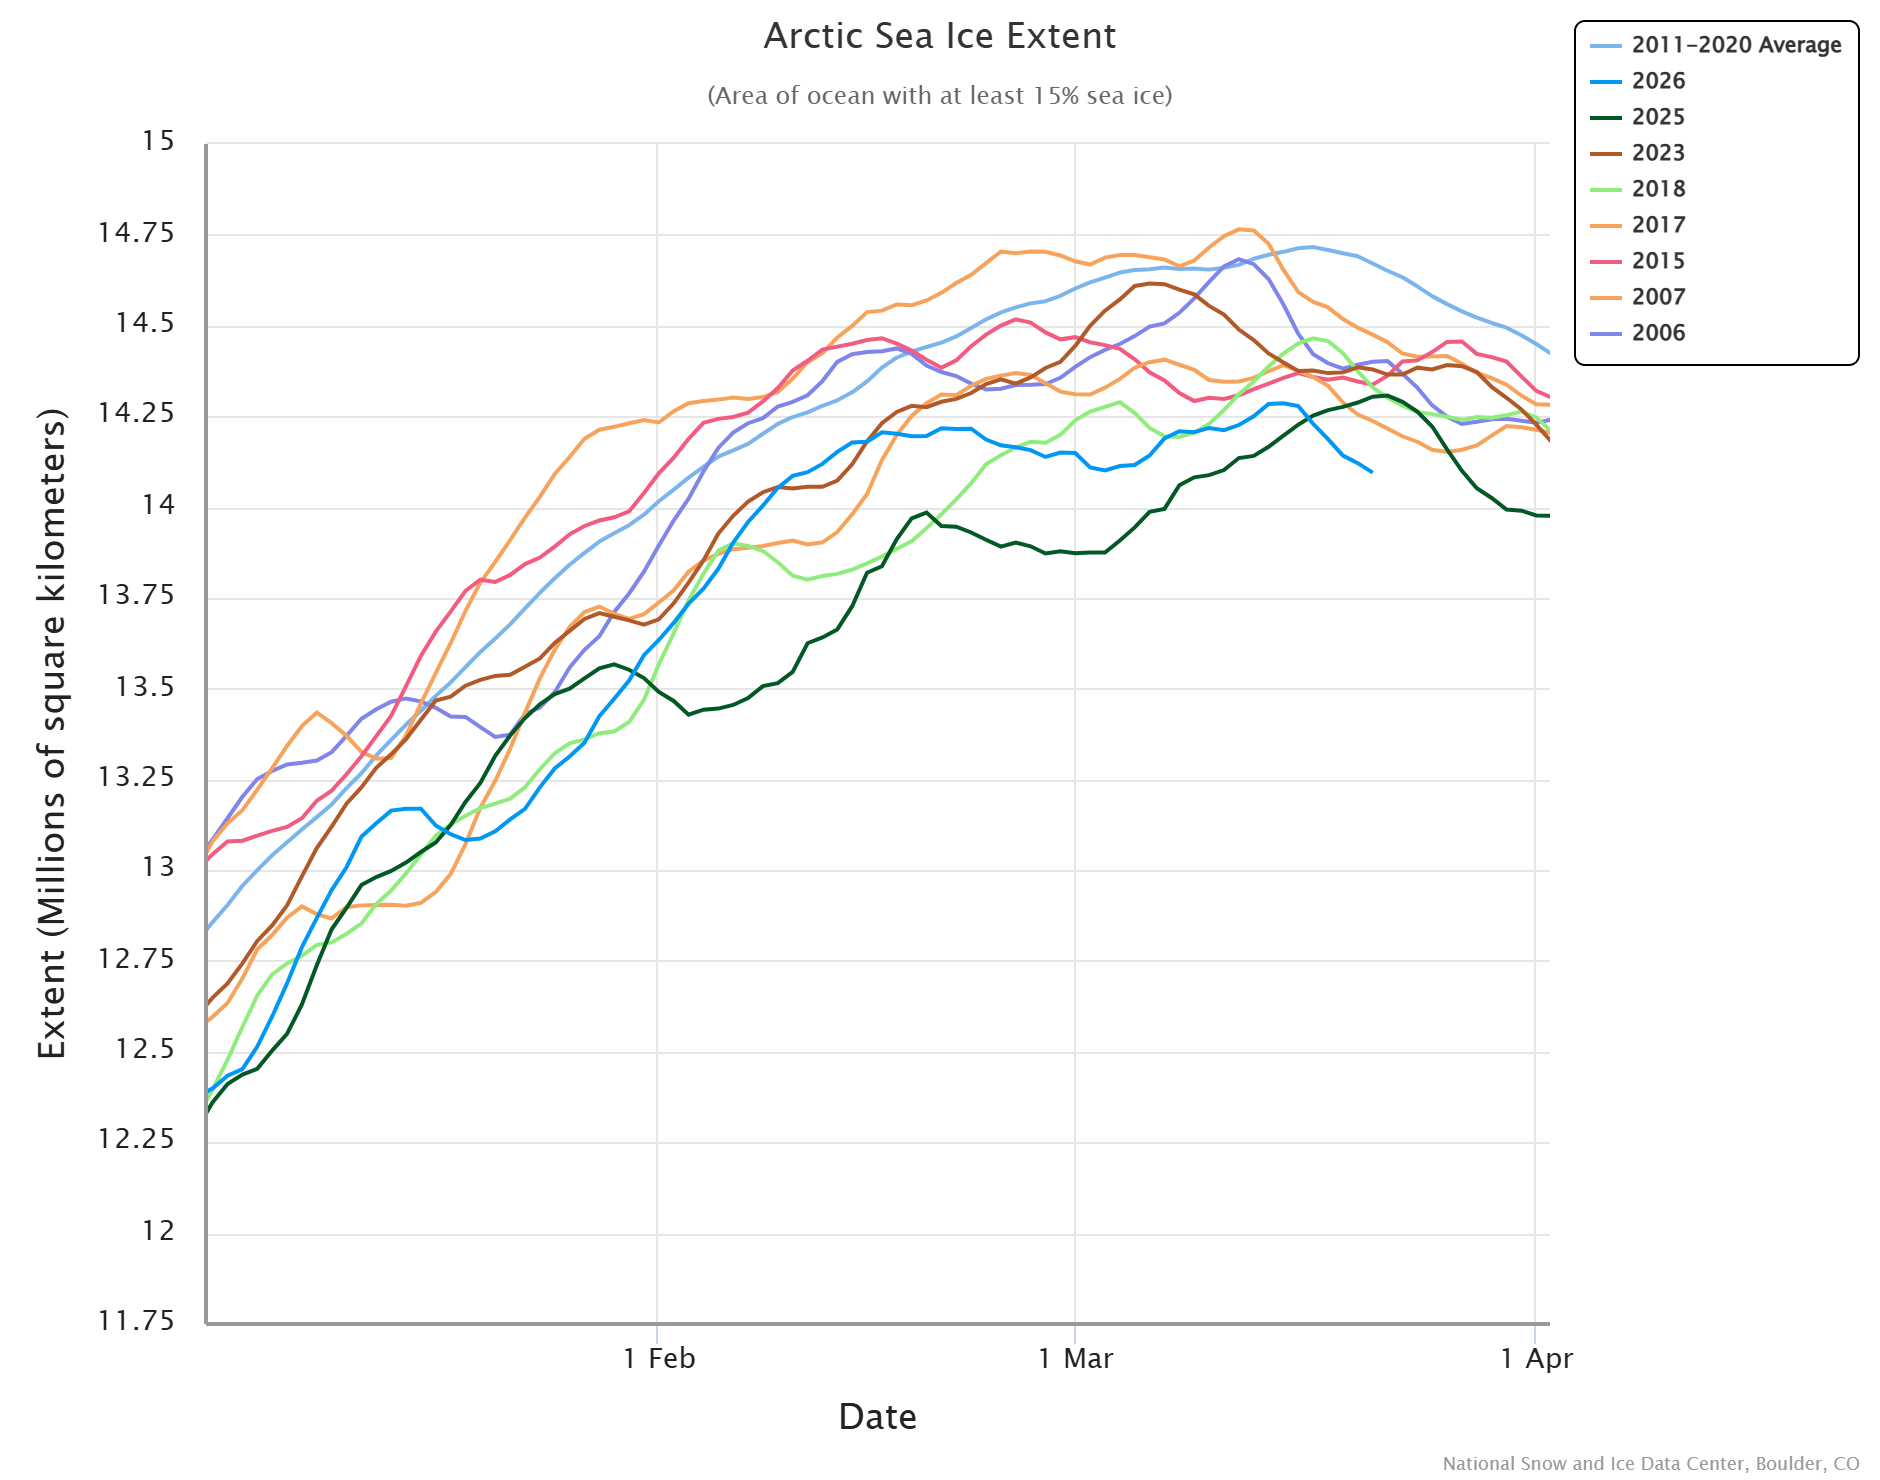
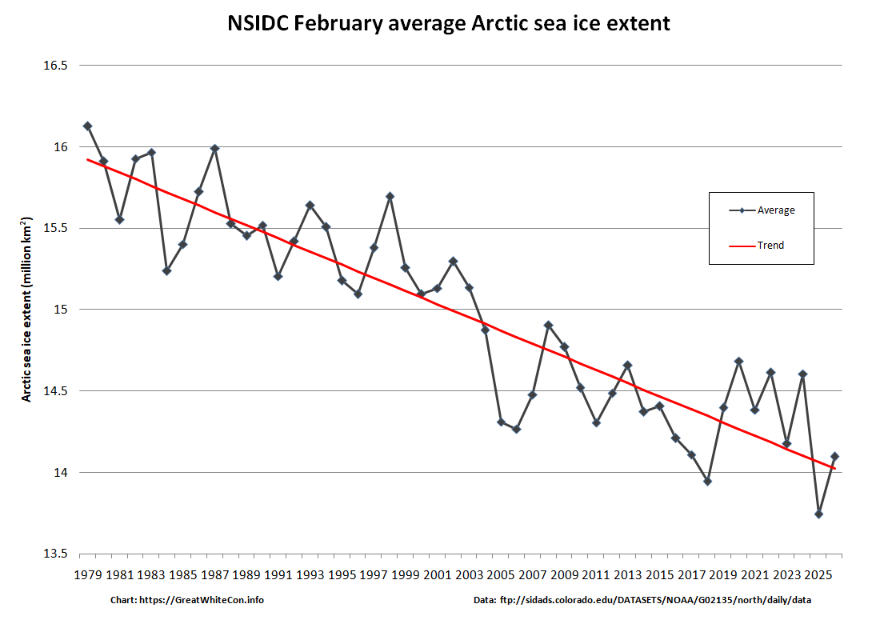
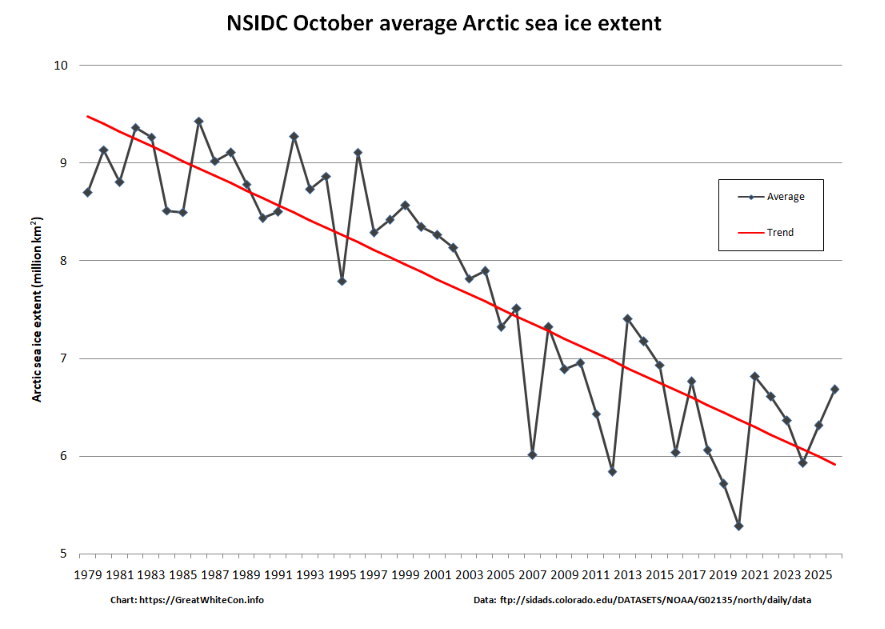
Much like last month, NSIDC average sea ice extent for October is significantly above the long term trend:
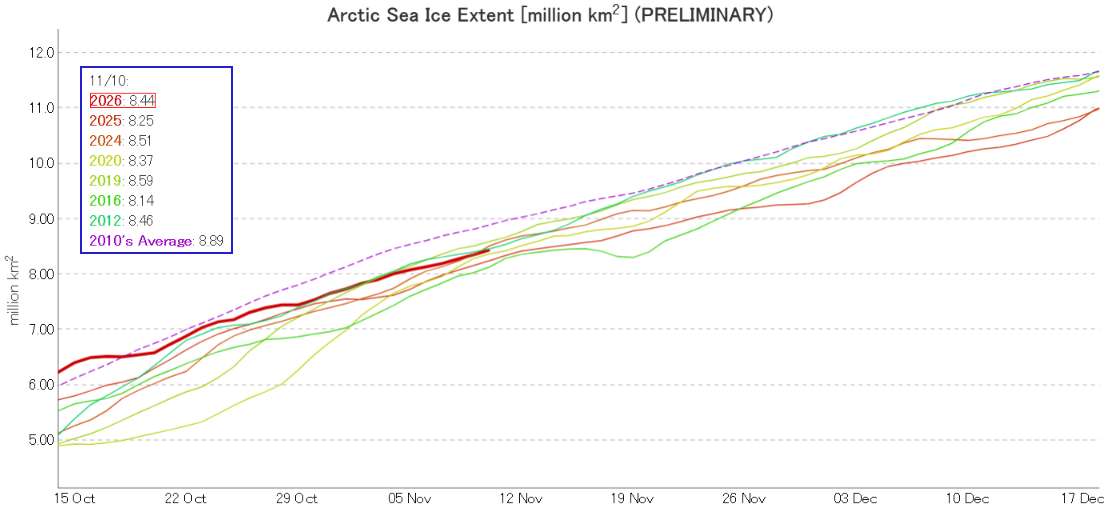
JAXA extent has caught up with the recent backlog, and GS will no doubt be overjoyed to find it currently in 4th lowest position for the date. In the satellite era!
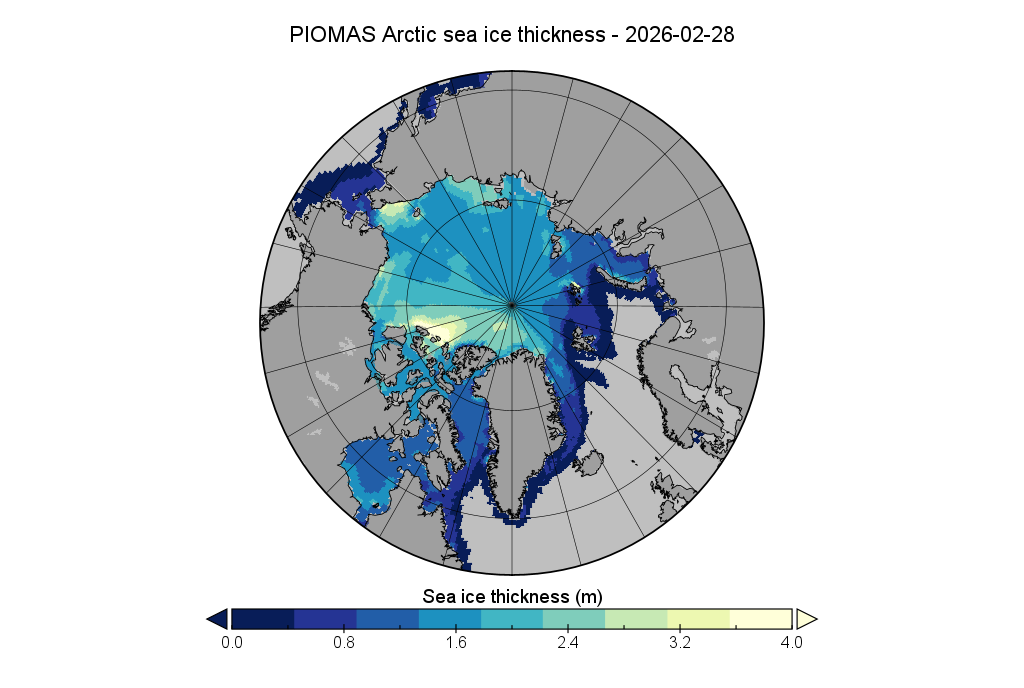
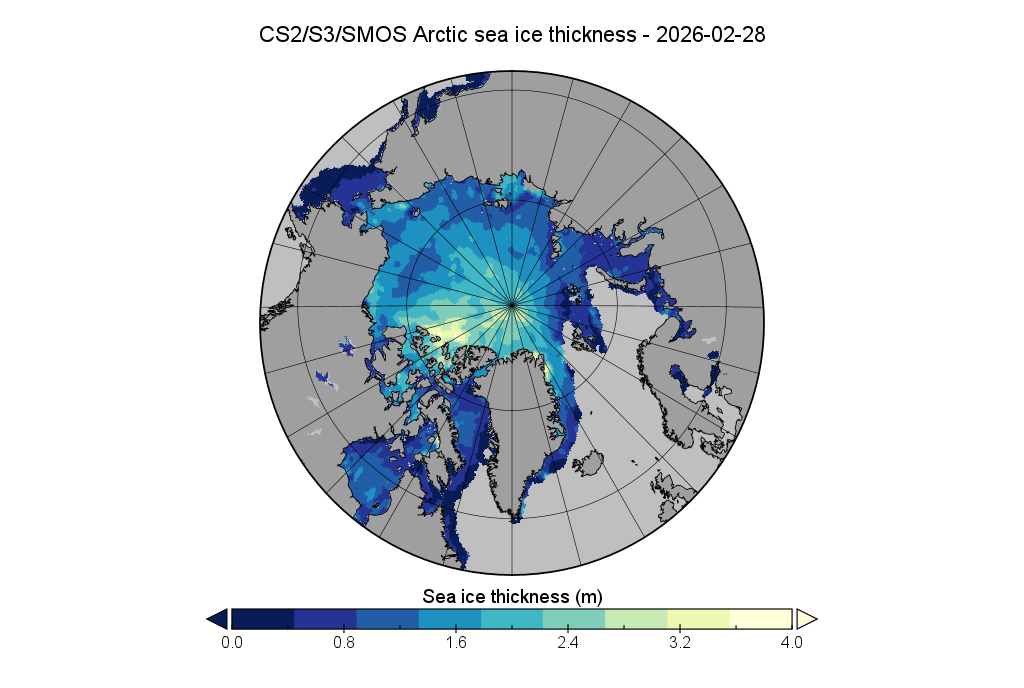
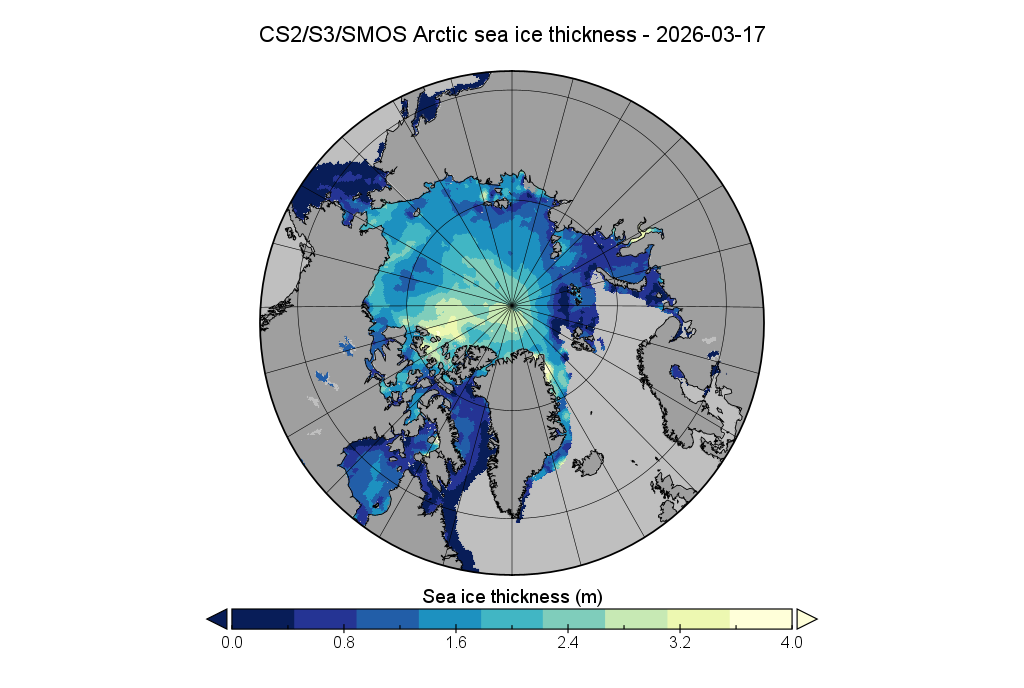
Here too is the current Arctic sea ice thickness map, based on AWI’s combined CryoSat-2, Sentinel 3 and SMOS data:
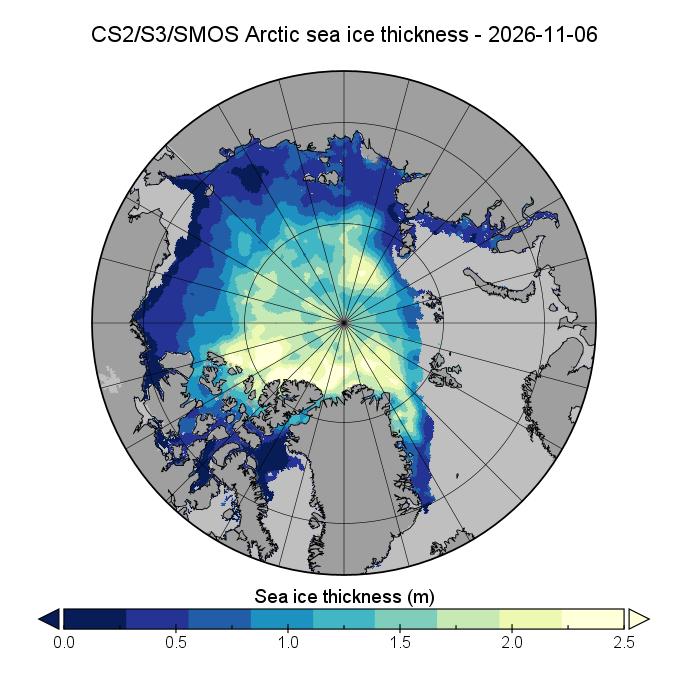
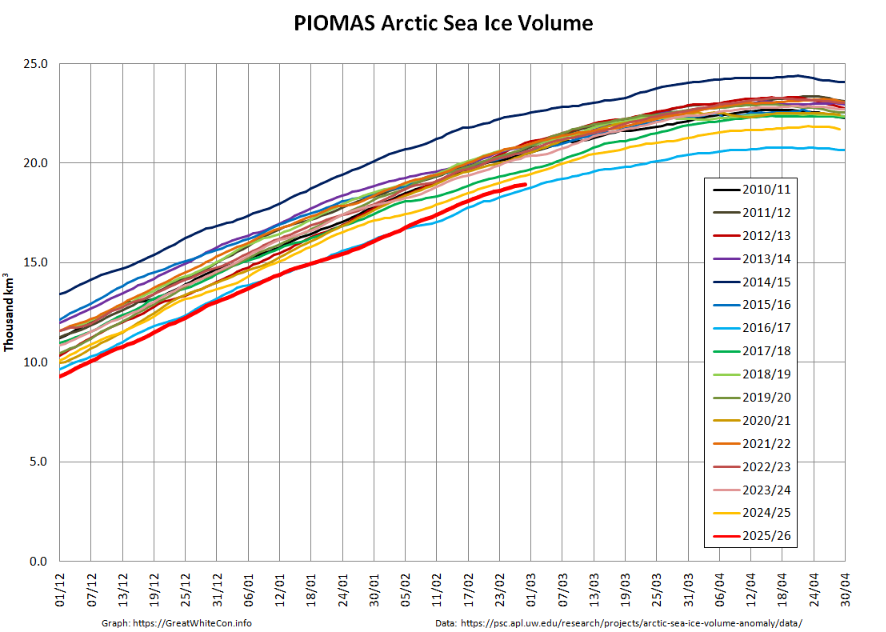
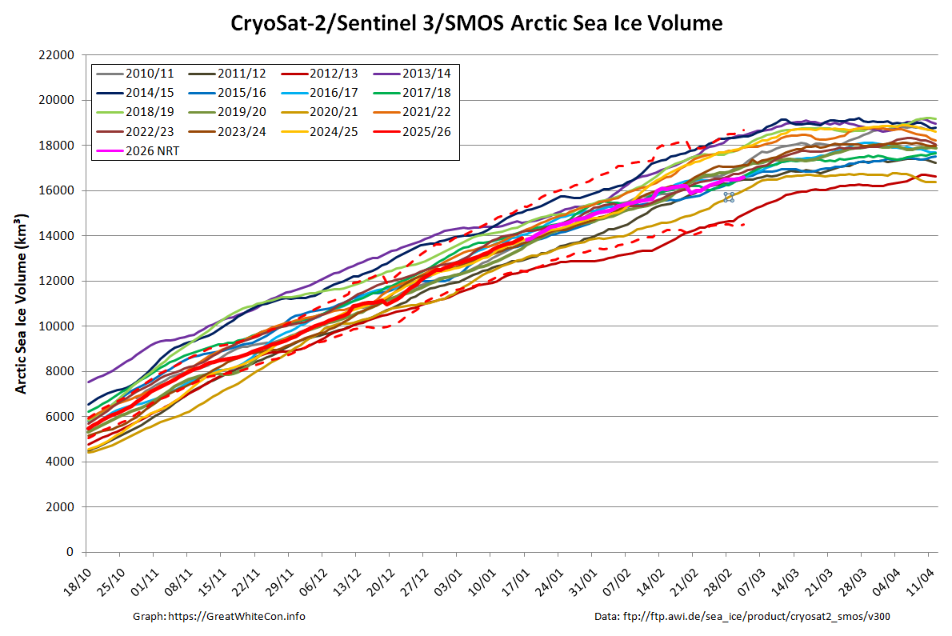
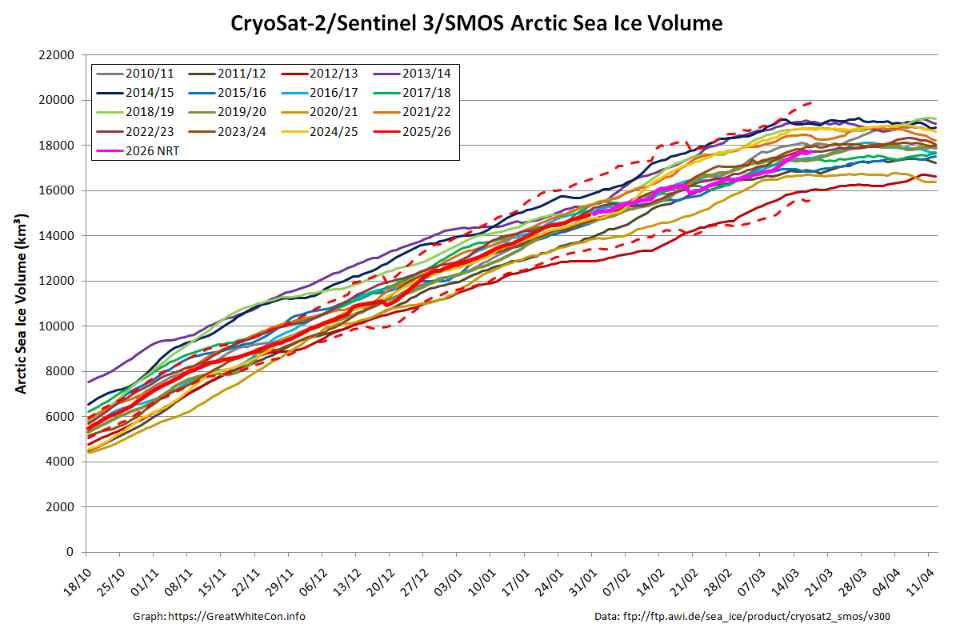
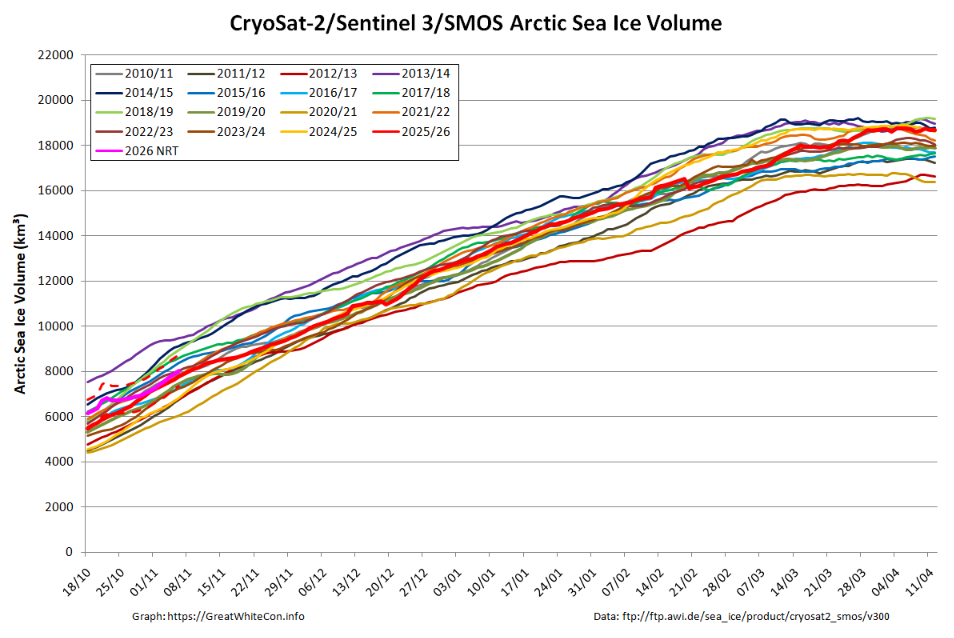
For the 7 days centred on November 6th Arctic sea ice volume was 8038.9 km³.
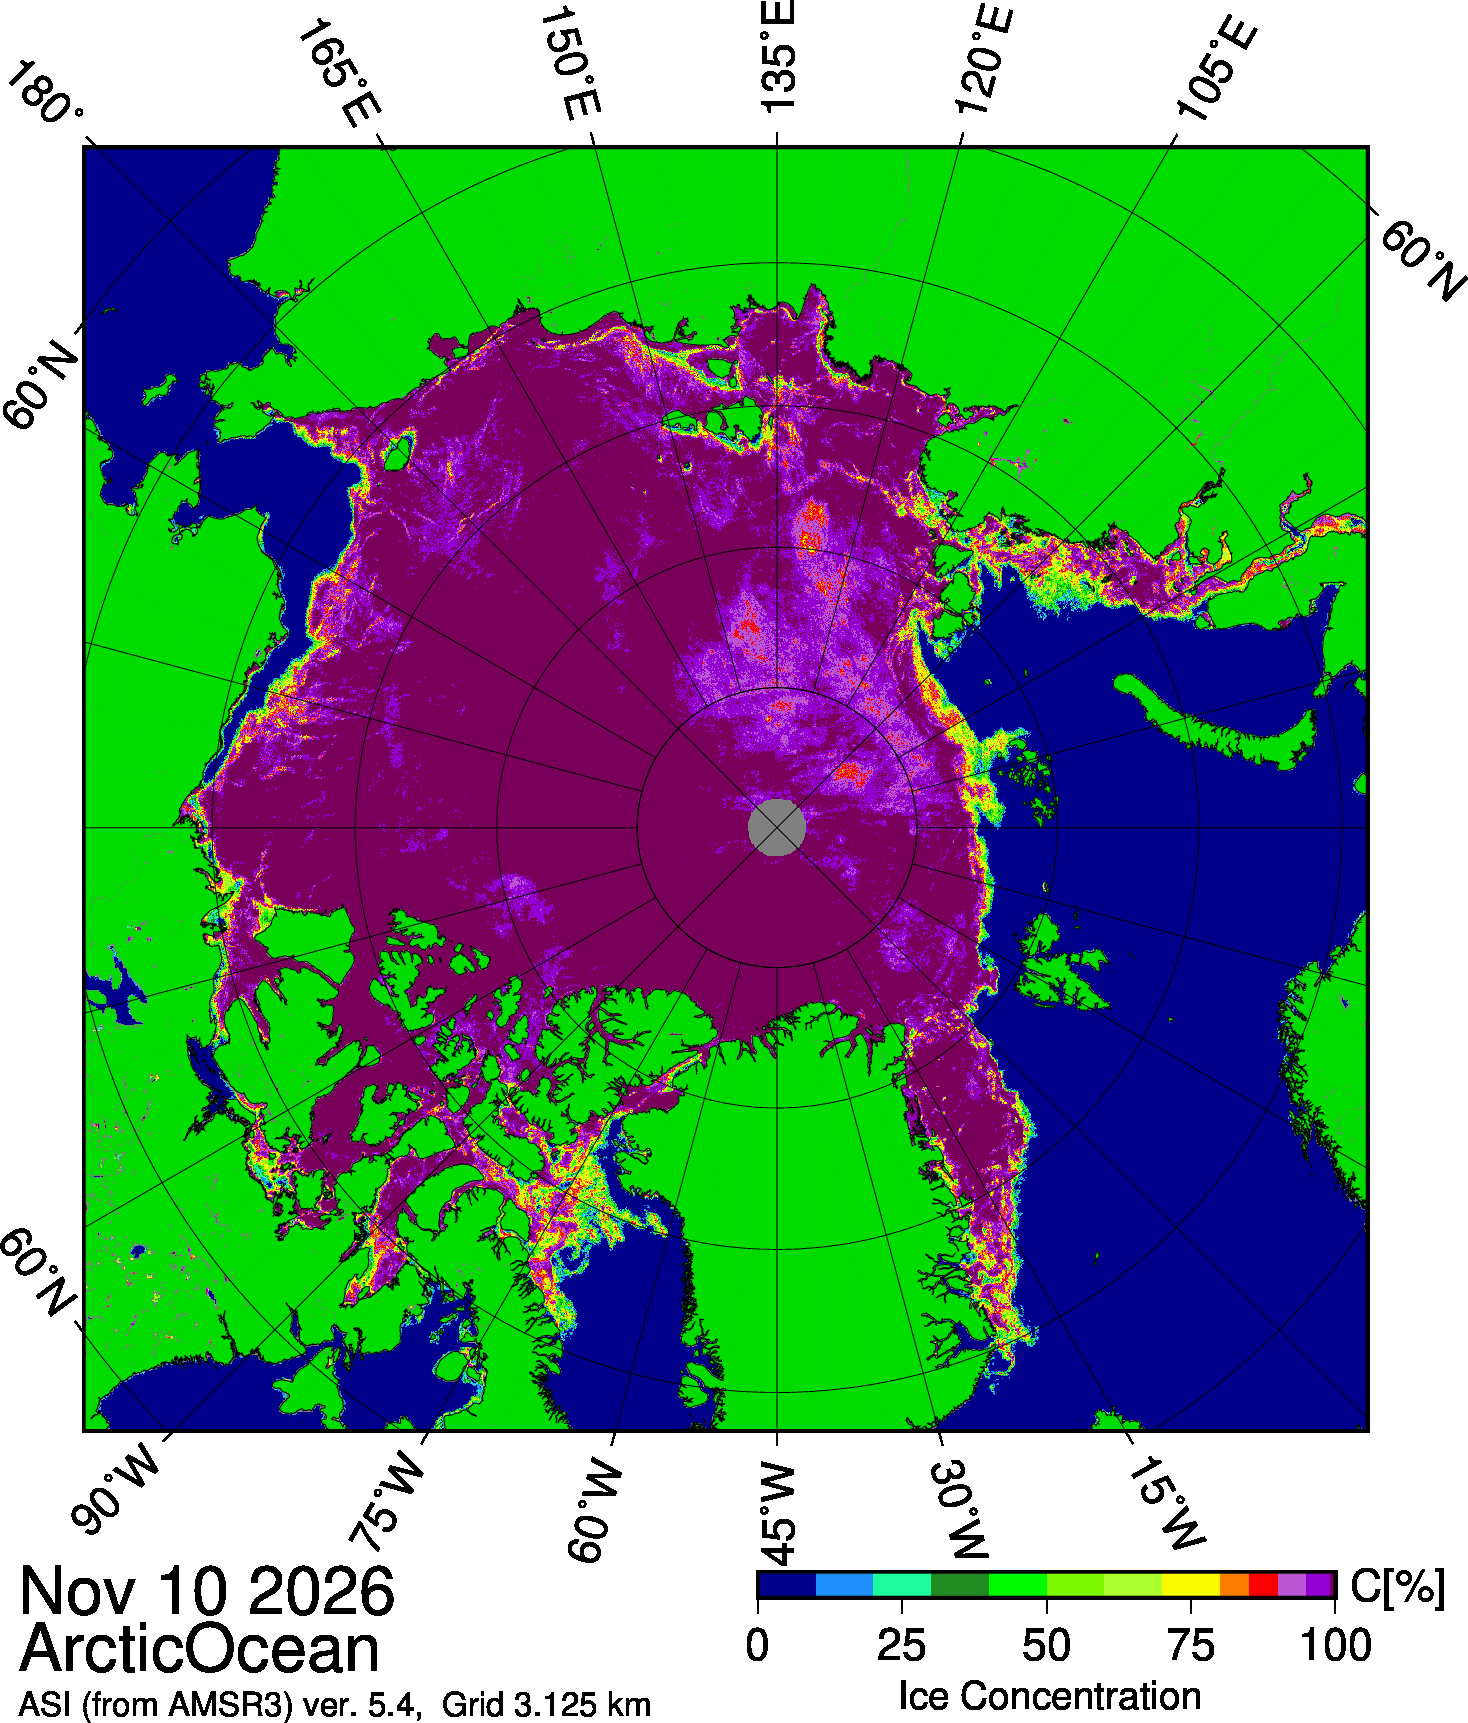
Finally for today, here is the University of Bremen’s latest AMSR3 concentration map for the Arctic Ocean:
Watch this space!