Tag Archives: Volume

Facts About the Arctic in June 2020

As is our current habit this month’s report begins with the high resolution Arctic sea ice area and extent graphs based on the University of Hamburg’s AMSR2 concentration maps:

Area and extent are currently vying for second place with 2019 on the “lowest for the date” leader board, a little behind 2016 at this point in the 2020 melting season.

However following the extremely warm spring in Siberia, the sea ice area along the assorted sea that comprise the Northern Sea Route is well below all previous years in the AMSR2 record:

Another effect of the sweltering Siberian spring is evident in the melt ponds visible below the clouds across the southernmost parts of the Laptev Sea:

NASA Worldview “false-color” image of the Laptev Sea on June 1st 2020, derived from the MODIS sensor on the Aqua satellite

plus the East Siberian Sea and Chaunskaya Bay:

NASA Worldview “false-color” image of the East Siberian Sea on June 1st 2020, derived from the MODIS sensor on the Terra satellite

[Edit – June 4th]

The May 31st PIOMAS gridded thickness numbers have been released, and Wipneus has crunched the numbers:

Here too is the latest volume graph:

According to the Polar Science Center’s May 2020 update:

Average Arctic sea ice volume in May 2020 was 21,500 km3. This value is 1700 km3 above the record minimum value of 19,800 km3 set in 2017, making it the sixth lowest on record. Monthly ice volume was 39% below the maximum in 1979 and 25% below the mean value for 1979-2019. May 2020 ice volume falls 0.8 standard deviations above the trend line. Daily volume anomalies for May progressed at a fairly normal pace for recent years. Average ice thickness is in the middle of the pack for the more recent years. Ice thickness anomalies for May 2020 relative to 2011-2018 continue the April pattern and show relatively thin ice along the Russian Coast and thicker than normal sea ice in the Barents sea. There are some fairly strong positive anomalies in the eastern Beaufort and north of Greenland. This anomaly pattern is likely due to the very strong positive Arctic-Oscillation index pattern that occurred during the Winter of 2020.

There looks to be a lot of anomalously thick ice waiting to melt out on the Atlantic periphery, and it will be interesting to see how the thicker ice in the eastern Beaufort Sea fares as the melting season progresses.

As also suggested by the area graph above, the Northern Sea Route is going to be open early in 2020. In fact a ice hardened tanker has already begun its journey through, unsupported by an icebreaker:

It was the “Christophe de Margerie” that on the 19th May kickstarted this year’s shipping season across the eastern part of the Northern Sea Route. The vessel owned and operated by Russian shipping company Sovcomflot loaded up liquefied natural gas in Sabetta and is due to arrive in the Chinese port of Jingtang on the 11th June. It was the earliest east-bound shipment on the route ever for this kind of vessel.

Shipments in the Northern Sea Route 27th May 2020. Map by MarineTraffic

By 27th May, the ship had made it almost to Wrangel Island, information from ship tracker service MarineTraffic shows. The “Christophe de Margerie” is accompanied by nuclear powered icebreaker “Yamal”.

In the wake of the almost 300 meter long vessel now follows the “Vladimir Voronin”, a vessel that is operated by company Teekay. The “Vladimir Voronin” on the 25th May left Sabetta and was on May 27th located in the Vilkitsky Strait north of the Taymyr Peninsula.

The ”Vladimir Voronin” is not accompanied by icebreaker. The “50 Let Pobedy” that escorted the ship out of Sabetta and eastwards towards the Vilkitsky Strait has now returned and appears to be on its way back to Sabetta.

[Edit – June 17th]

The mid month PIOMAS gridded thickness numbers have just been released. Here’s the thickness map:

and the volume graph:

In addition JAXA extent is now in a “statistical tie” with 2019 in the “lowest for the date” competition:

Watch this space!

Facts About the Arctic in May 2020

Let us begin this month’s report from the far north with the high resolution Arctic sea ice area and extent graphs based on the University of Hamburg’s AMSR2 concentration maps:

Area is currently lowest for the date in the AMSR2 record. After briefly occupying that position extent has increased over the last few days of April due to winds causing sea ice to move in the direction of the far North Atlantic:


The Alfred Wegener Institute has now finished reanalysing their CryoSat-2/SMOS thickness data, and the resulting volume graph looks like this:

“Measured” Arctic sea ice volume is the lowest in the CryoSat-2 era as we head towards the main 2020 melting season, which in my calendar at least begins on June 1st. The PIOMAS modelled volume numbers should be released shortly.

[Edit – May 5th]

The April 30th PIOMAS gridded thickness numbers have been released, and Wipneus has worked his usual magic. By way of comparison with the AWI metric:

Obviously differing from CryoSat-2/SMOS, PIOMAS has 2020 volume a long way above 2017, in amongst a gaggle of other years.

[Edit – May 13th]

The middle of May is rapidly approaching, so let’s start to set the scene for the forthcoming melting season. First off here are the hi res AMSR2 area and extent graphs:

Extent is currently significantly above 2016 due to the recent “dispersion” mentioned above, but area is very close to an all time low for the date.

Next take a look at the current northern hemisphere snow cover anomalies from the Rutgers University Snow Lab:

Whilst there is a positive anomaly near Hudson Bay, there are significant negative anomalies across Siberia and Alaska. This does not augur well for sea ice retention along both the Northern Sea Route and Northwest Passage by September 2020.

Watch this space!

Facts About the Arctic in April 2020

This comes to you a couple of days early, but the clocks have just changed to British Summer Time in the once United Kingdom and there is news to impart.

JAXA Arctic sea ice extent has fallen to the lowest level for the date in their satellite era records going back to 1979. This graph shows every year since 2000:

The high resolution AMSR2 regional graphs make clear that the precipitous drop on the Pacific periphery has continued:

The current combined SMOS/SMAP Arctic sea ice “thinness” map makes clear that there is plenty more thin ice ready for melting in the Sea of Okhotsk and Baffin Bay:

There is also a large area of thin ice in the Laptev Sea, which will be interesting to watch once the 2020 melting season gets underway in earnest.

[Edit – April 1st]

Today is All Fools’ Day, but this is no joke. Thanks to the consistent polar vortex over the Northern Hemisphere winter there is currently an anomalous “ozone hole” over the North Pole. As recently described in Nature:

A vast ozone hole — probably the biggest on record in the north — has opened in the skies above the Arctic. It rivals the better-known Antarctic ozone hole that forms in the southern hemisphere each year.

Record-low ozone levels currently stretch across much of the central Arctic, covering an area about three times the size of Greenland. The hole doesn’t threaten people’s health, and will probably break apart in the coming weeks. But it is an extraordinary atmospheric phenomenon that will go down in the record books.

“From my point of view, this is the first time you can speak about a real ozone hole in the Arctic,” says Martin Dameris, an atmospheric scientist at the German Aerospace Center in Oberpfaffenhofen.

Here are the latest graphics from the “Arctic Ozone Watch” section of the NASA web site:

Observations made during the still ongoing MOSAiC expedition, have confirmed the satellite derived measurements:

This year, powerful westerly winds flowed around the North Pole and trapped cold air within a ‘polar vortex’. There was more cold air above the Arctic than in any winter recorded since 1979, says Markus Rex, an atmospheric scientist at the Alfred Wegener Institute in Potsdam, Germany. In the chilly temperatures, the high-altitude clouds formed, and the ozone-destroying reactions began.

Researchers measure ozone levels by releasing weather balloons from observing stations around the Arctic (including the Polarstern icebreaker, which is frozen in sea ice for a year-long expedition). By late March, these balloons measured a 90% drop in ozone at an altitude of 18 kilometres, which is right in the heart of the ozone layer. Where the balloons would normally measure around 3.5 parts per million of ozone, they recorded only around 0.3 parts per million, says Rex. “That beats any ozone loss we have seen in the past,” he notes.

I’ve previously conjectured about the potential effect of the strong polar vortex on Northern Hemisphere snow cover this Spring, and here’s NOAA’s current snow extent graph:

JAXA extent’s precipitous recent decline has abated, and it’s now 5th lowest for the date in the satellite era:

[Edit – April 4th]

Here’s the March 31st PIOMAS Arctic sea ice gridded thickness map:

together with the traditional volume graph:

Wipneus comments on the Arctic Sea Ice Forum that:

Ice is thickening impressively against the Canadian Archipelago and North Greenland.

That is indeed the case with the PIOMAS “modelled” numbers, but is much less obvious in the latest CryoSat-2/SMOS “measured” thickness map where ice over 4 metres thick is still conspicuous by its absence North of Greenland:

Plus a bonus graph for “Turbulent Eddie”, who suggests that:

[There’s] not much thick ice on the East Coast of Greenland, indicating the increase was from reduced loss through the Fram Strait?

together with the latest AARI ice age map:

[Edit – April 6th]

Here’s the latest update of our novel NRT volume metric:

I’ve applied a crude correction to the still problematic NRT data so that it at least coincides with the reanalysed data on March 14th. Whilst we await the reanalysed numbers for the rest of March and early April it looks as though Arctic sea ice volume reached at least a temporary peak on March 20th 2020.

[Edit – April 19th]

Here’s another update of our novel NRT volume metric, still incorporating my “fudge factor”:

Note also this handy hint from Stefan Hendricks on Twitter:

[Edit – April 21st]

Wipneus has crunched the mid month PIOMAS gridded thickness numbers. Here’s the result:

The discrepancy between the PIOMAS model and the CryoSat-2 “reality” is still very evident.

[Edit – April 25th]

With another week’s worth of reanalysed data now processed, it now seems certain that the CS2/SMOS Arctic sea ice volume maximum was 18469 km³ on April 6th:

[Edit – April 28th]

The high resolution AMSR2 area and extent metrics are now both “lowest for the date” in the AMSR2 record:

JAXA/ViSHOP AMSR2 extent isn’t quite there yet:

The 2020 Maximum Arctic Sea Ice Extent

As Zack Labe has recently pointed out, in 2015 the Arctic sea ice maximum extent based on the JAXA numbers had already occurred on February 15th:

Perhaps it’s time we started paying attention this year! However the National Snow and Ice Data Center reported a significantly later date in 2015:

On February 25, 2015, Arctic sea ice extent appeared to have reached its annual maximum extent, marking the beginning of the sea ice melt season. This year’s maximum extent not only occurred early; it is also the lowest in the satellite record. However, a late season surge in ice growth is still possible.

Each year we keep track of the assorted Arctic sea ice metrics over the next month or so, and they rarely agree on the date of maximum extent, and never agree on the sea ice extent on that date! The reason for that is explained in a 2017 paper entitled “Variability and trends in the Arctic Sea ice cover: Results from different techniques“:

Reports on the sea ice cover have been provided by different institutions using basically the same set of satellite data but different techniques for estimating key parameters such as ice concentration, ice extent, and ice area. In this study, a comparison of results from four different techniques that are frequently used shows significant disagreements in the characterization of the distribution of the sea ice cover primarily in areas that have a large fraction of new ice cover or significant amount of surface melt.

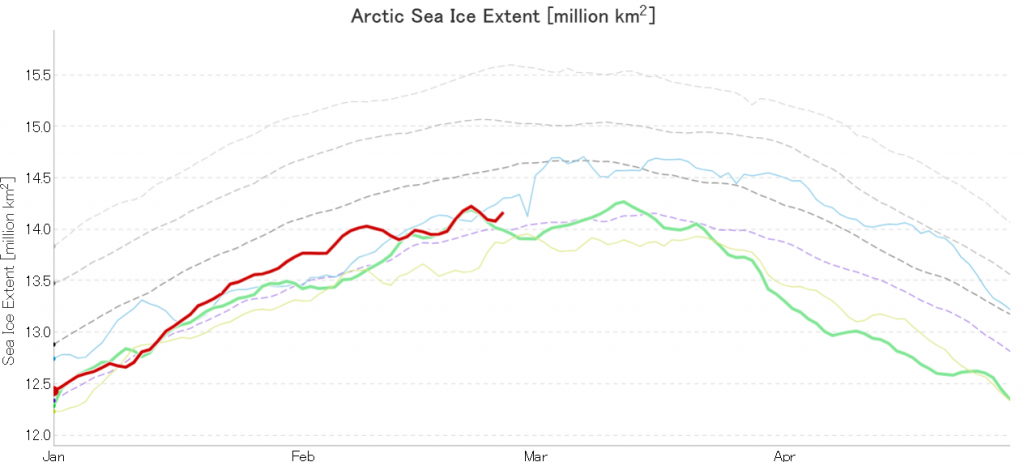
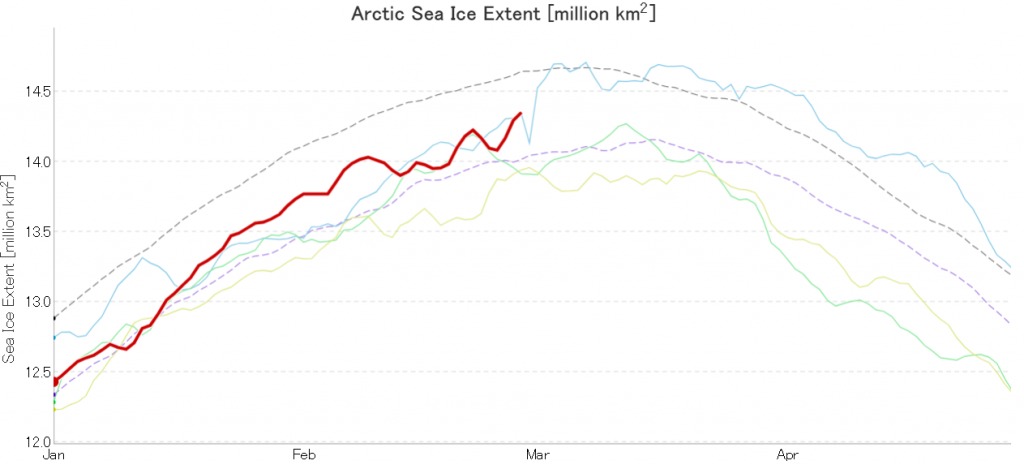
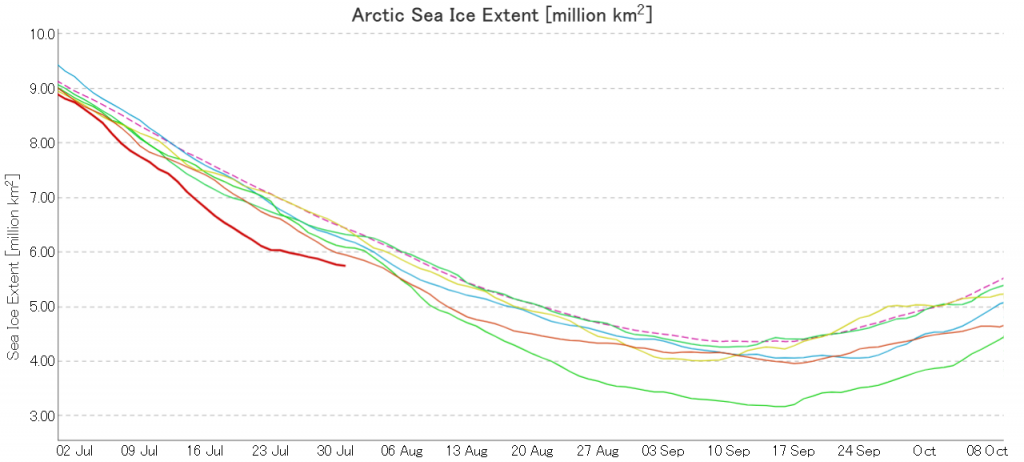
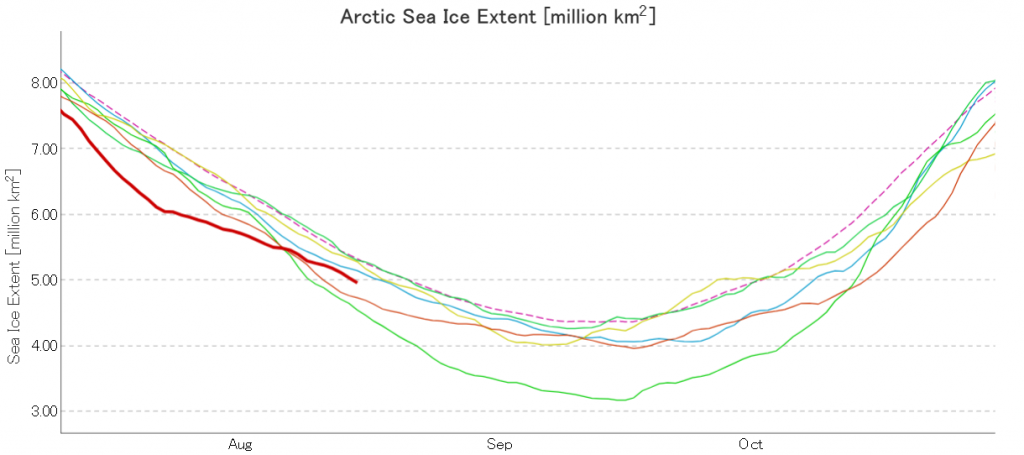
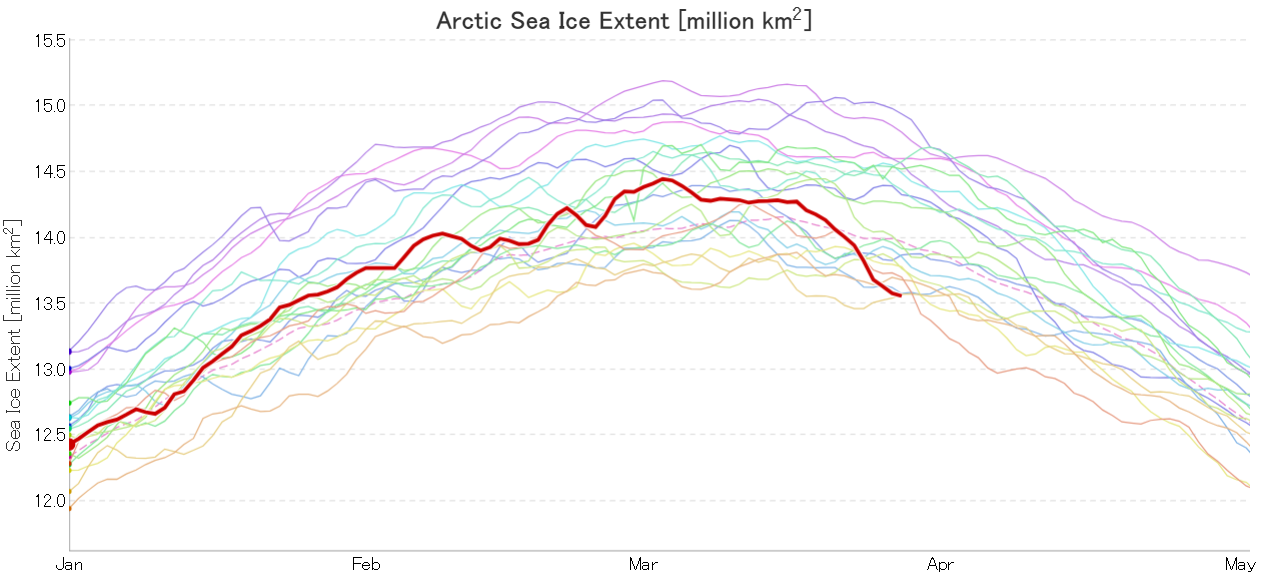
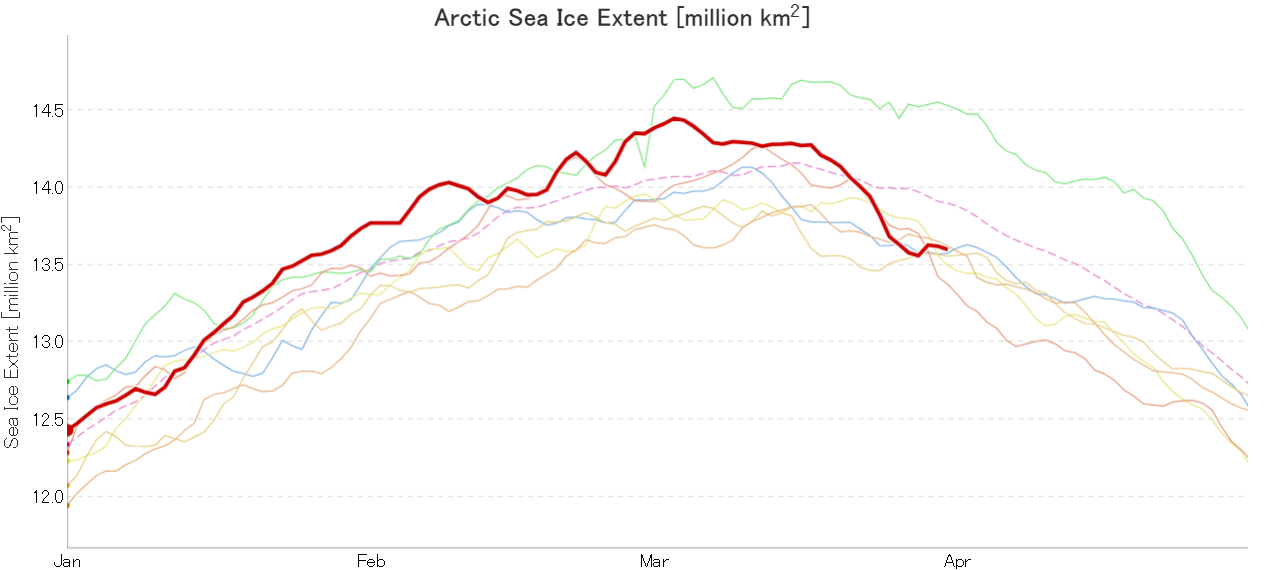
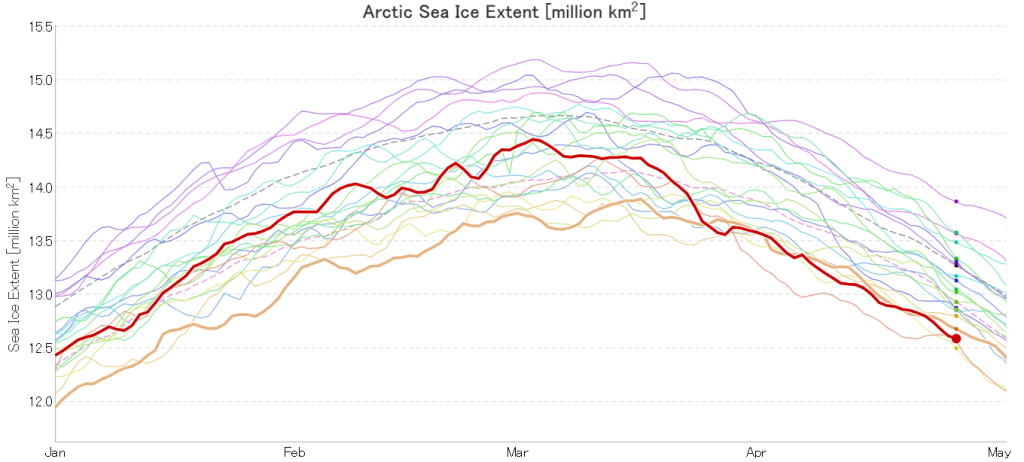
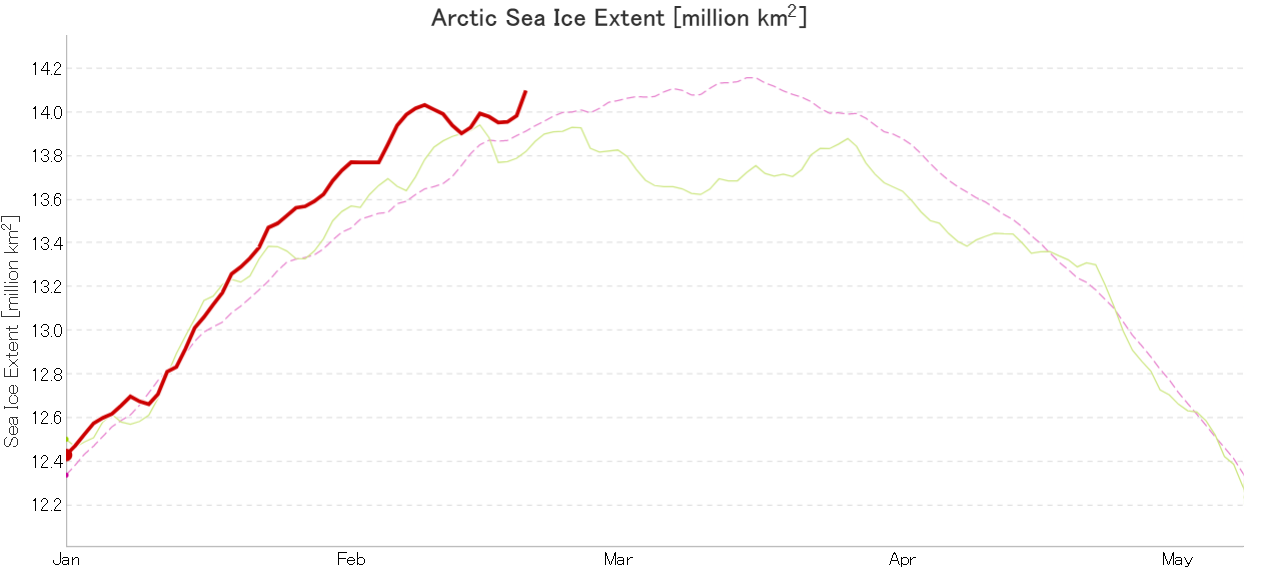
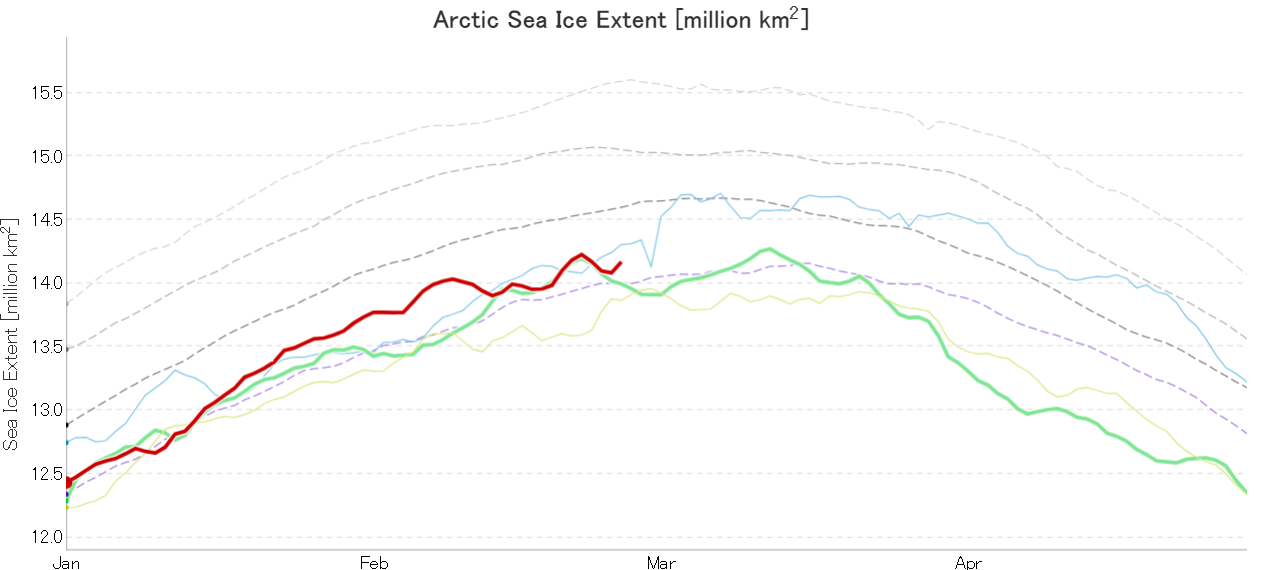
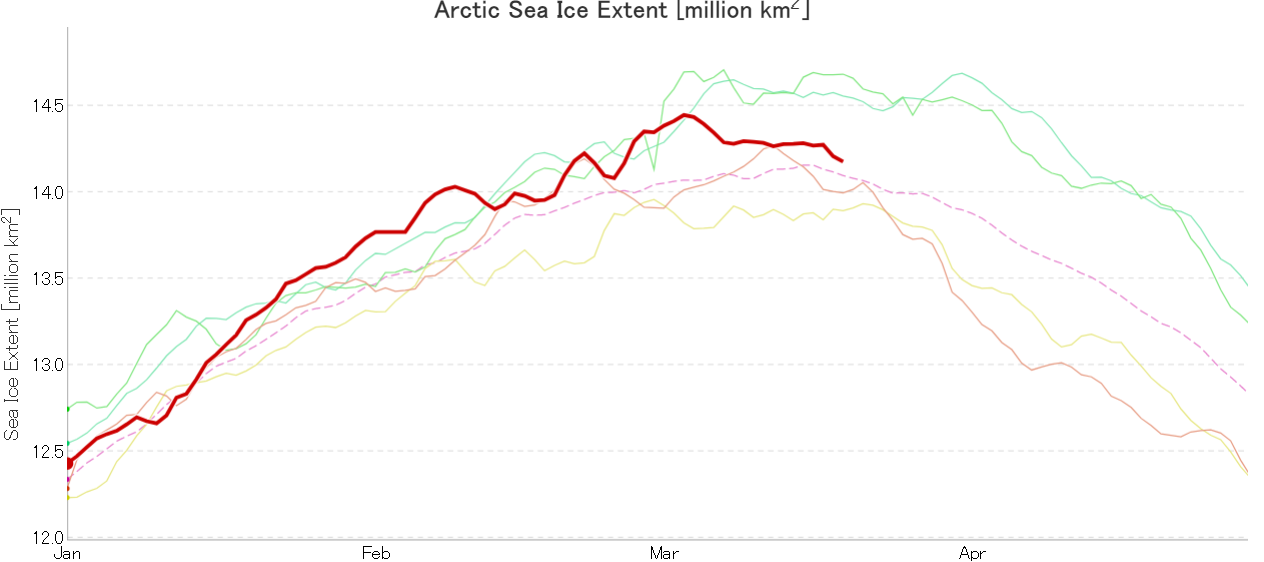
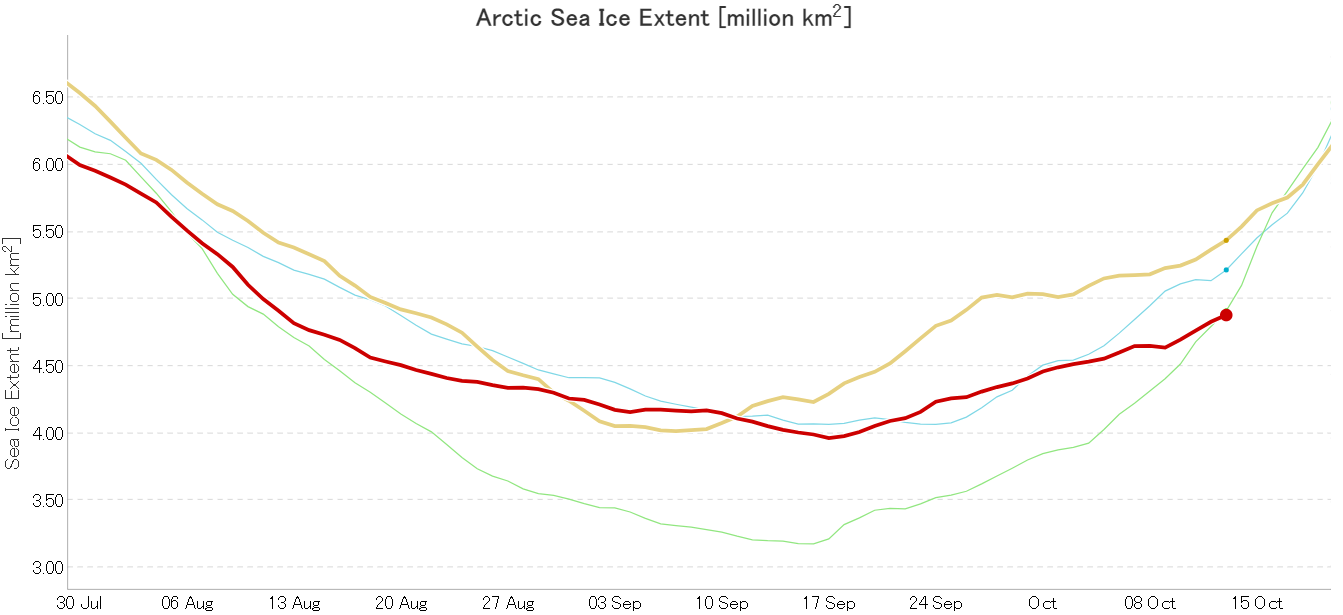
In due course we’ll look at the metrics from a variety of different institutions, but let’s start with JAXA, comparing 2020 with 2015 and the 2010s average:

Extent is clearly increasing just at the moment! Will the next peak prove to be the maximum for the year or will we have to wait another month or more to find out that value, as suggested by the average?

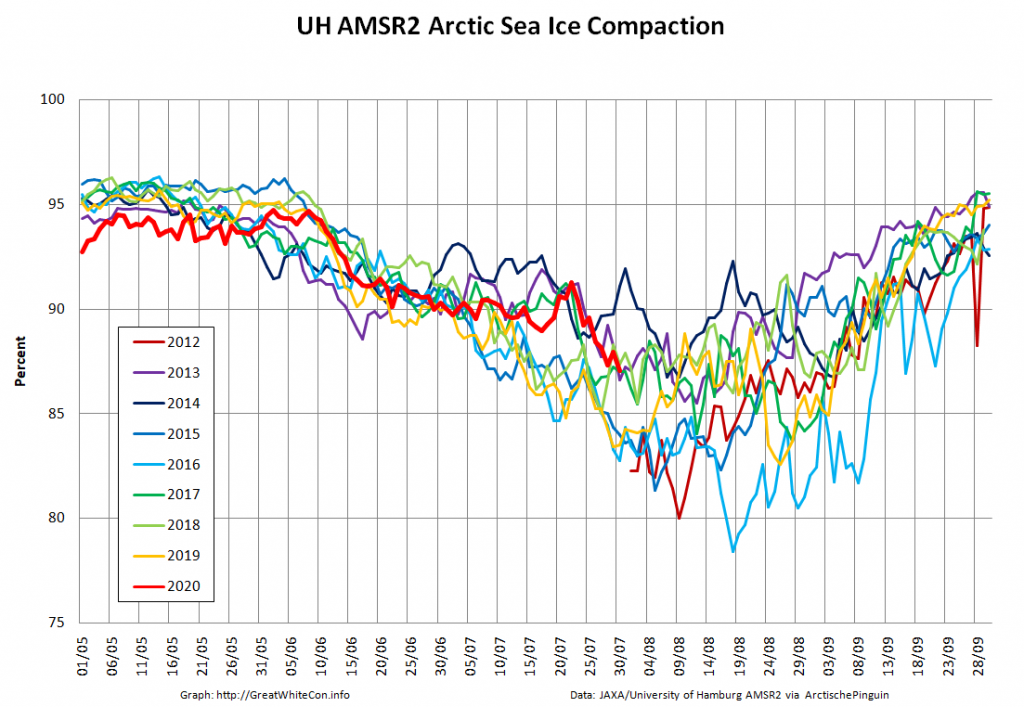
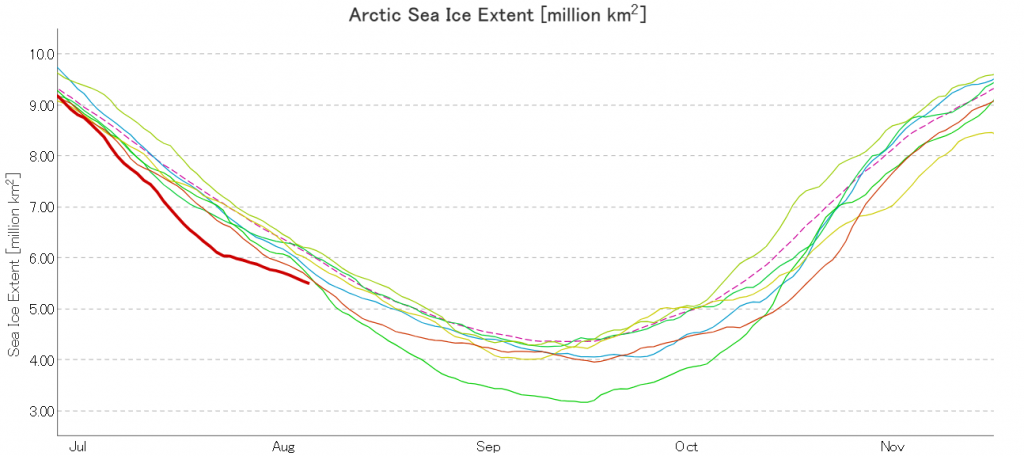
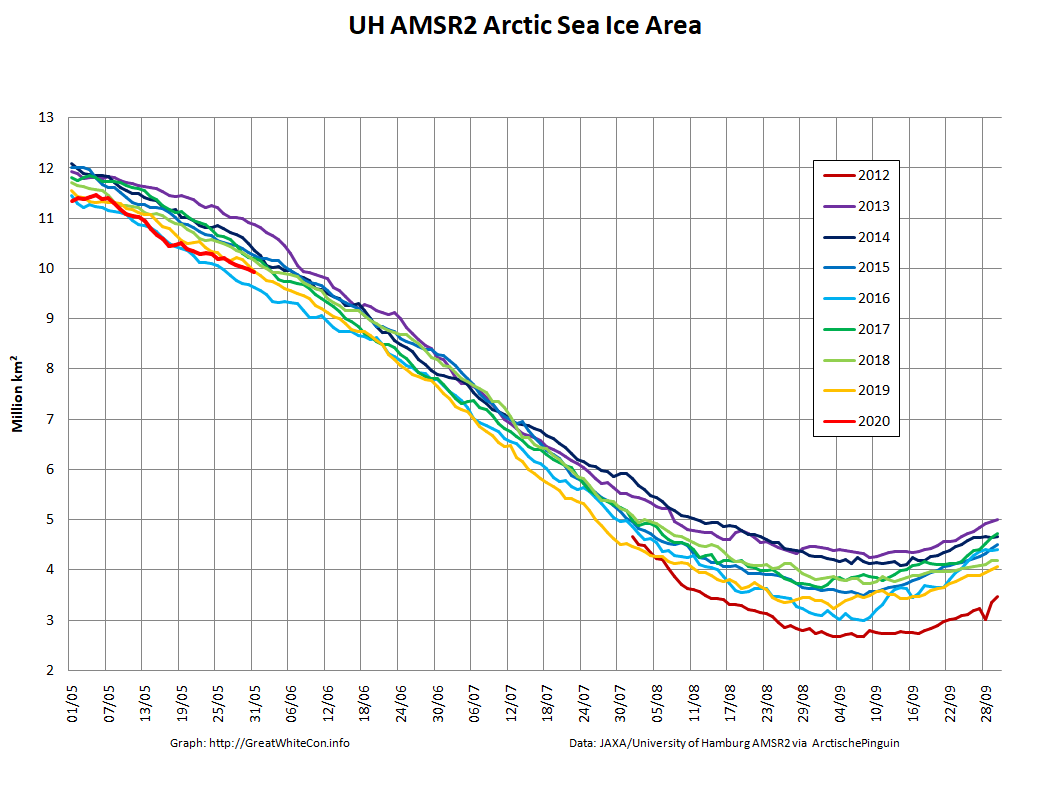
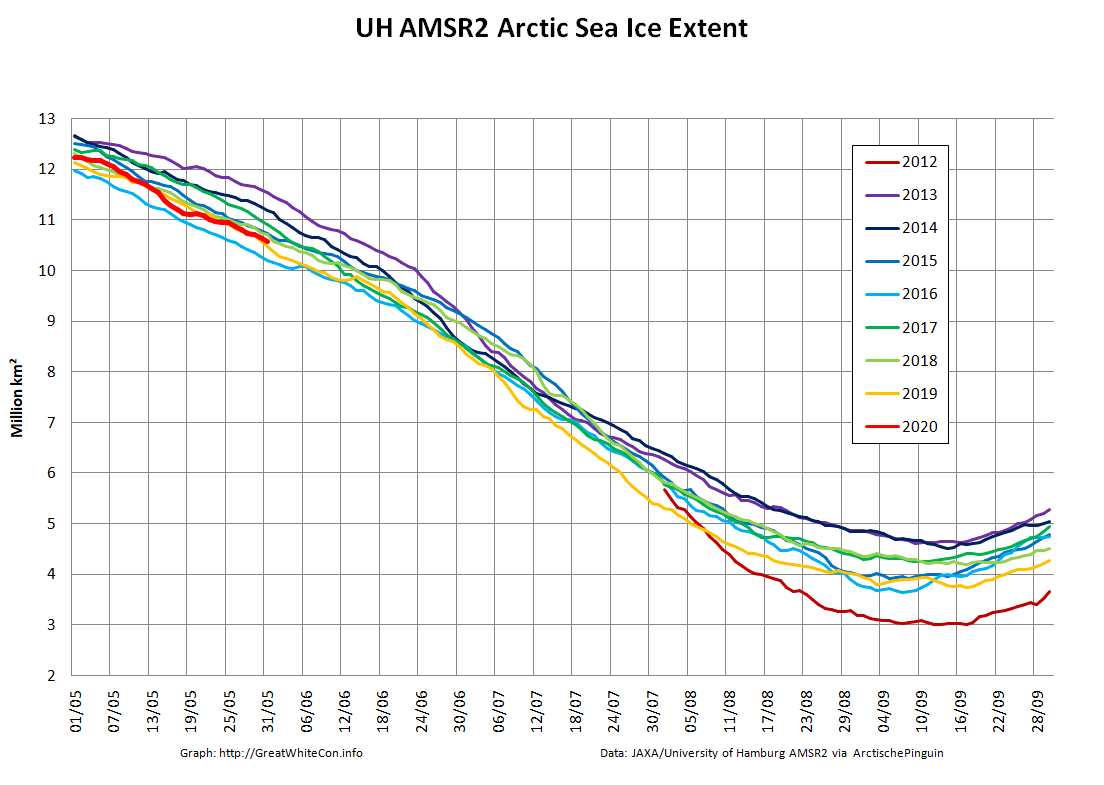
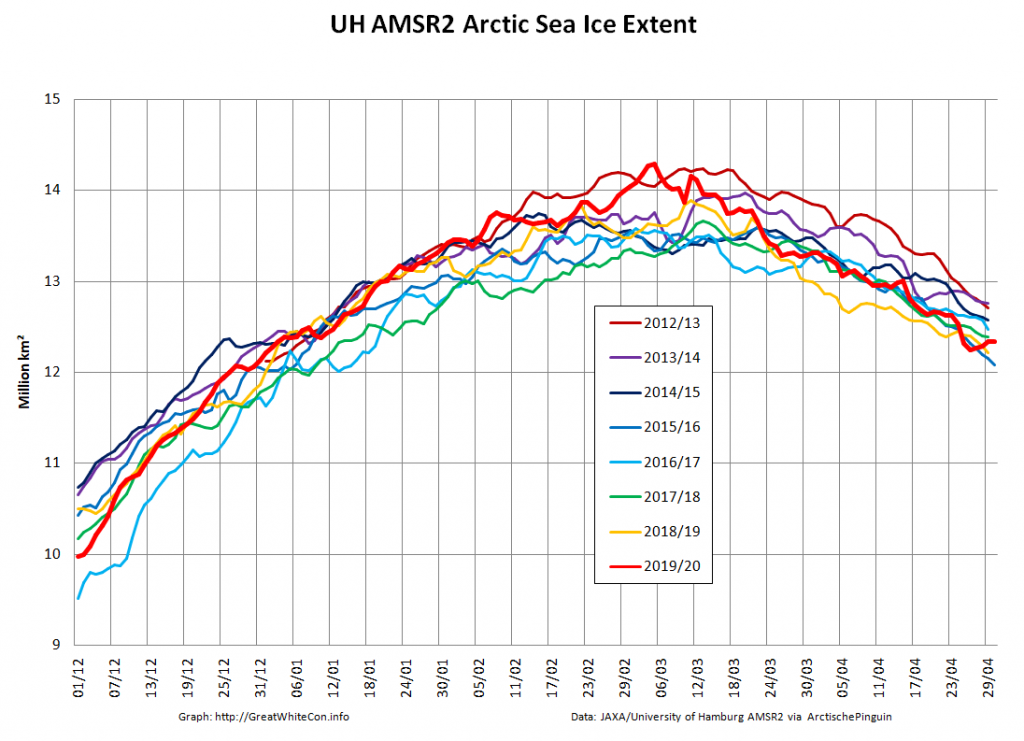
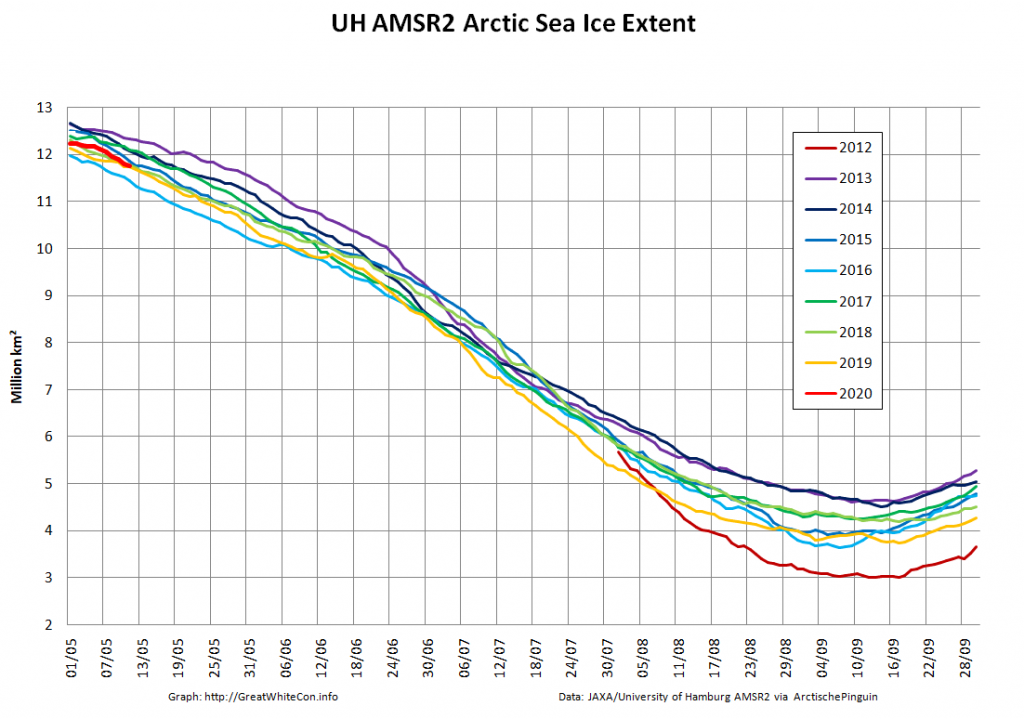
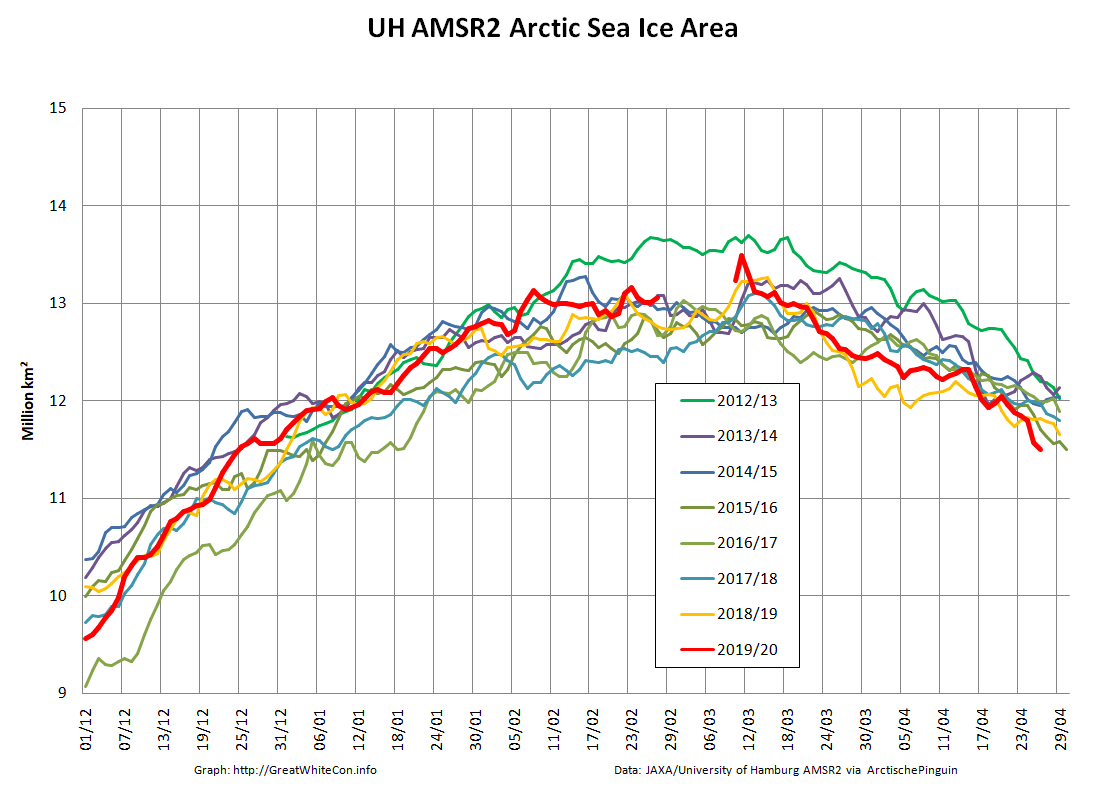
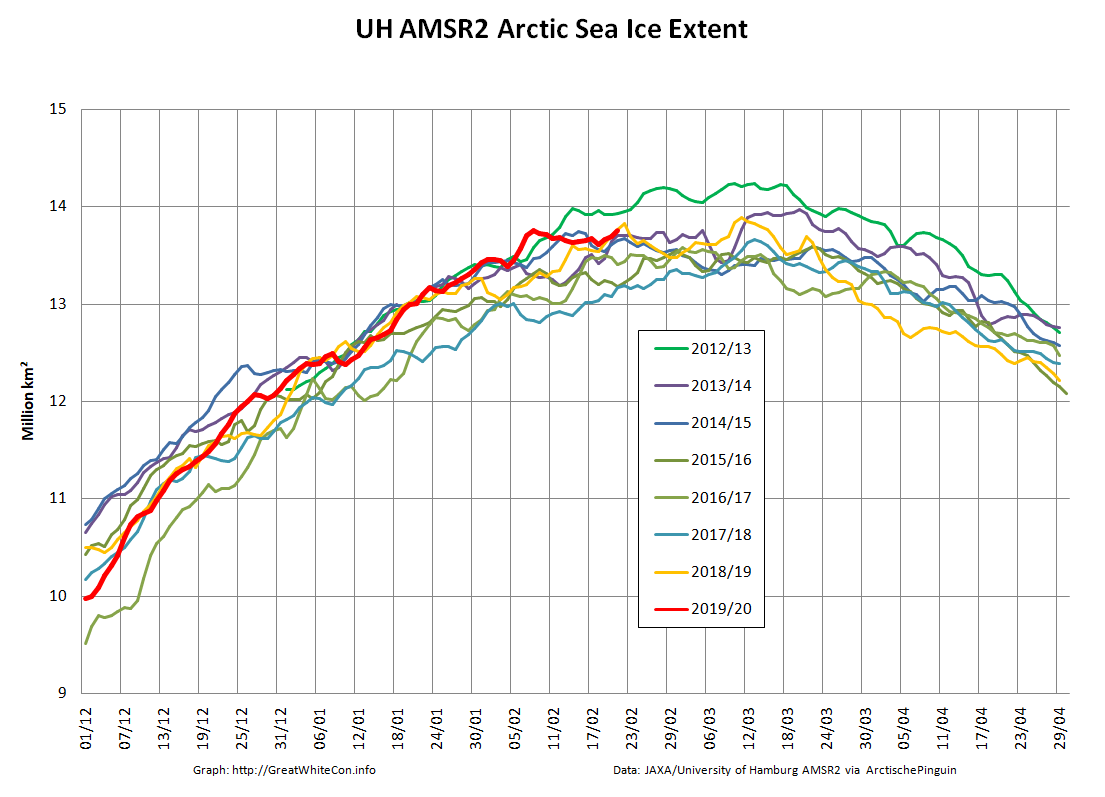
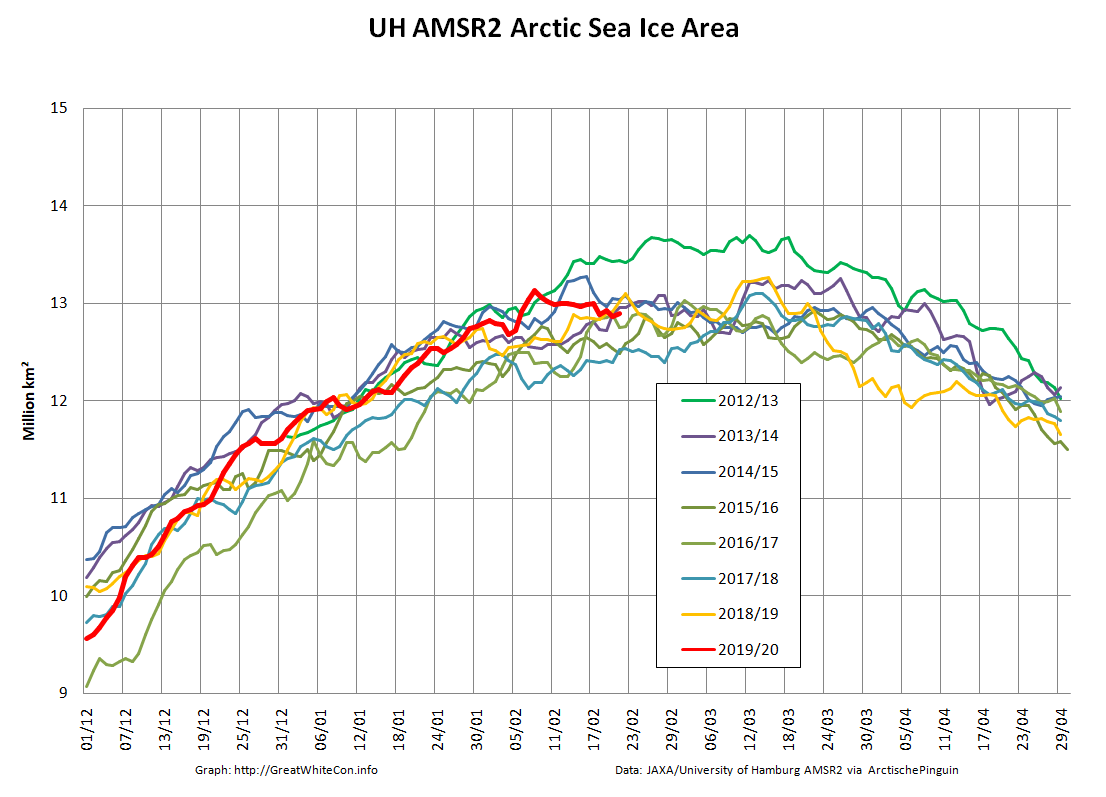
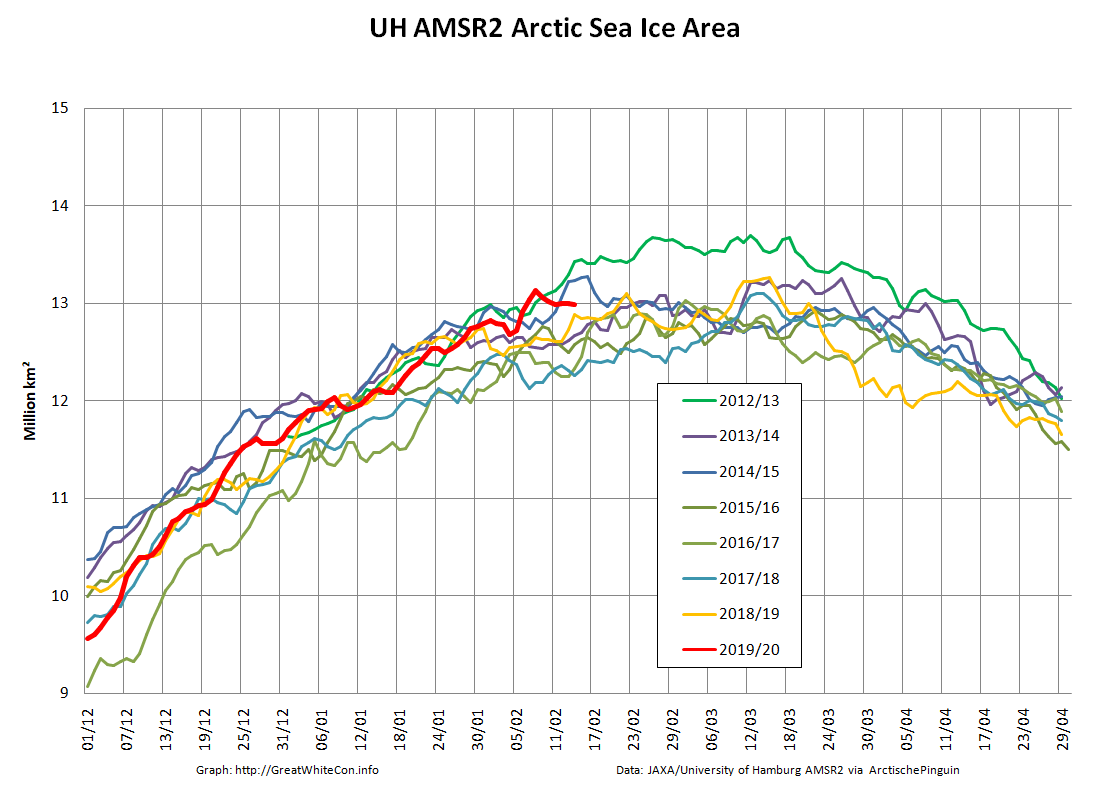
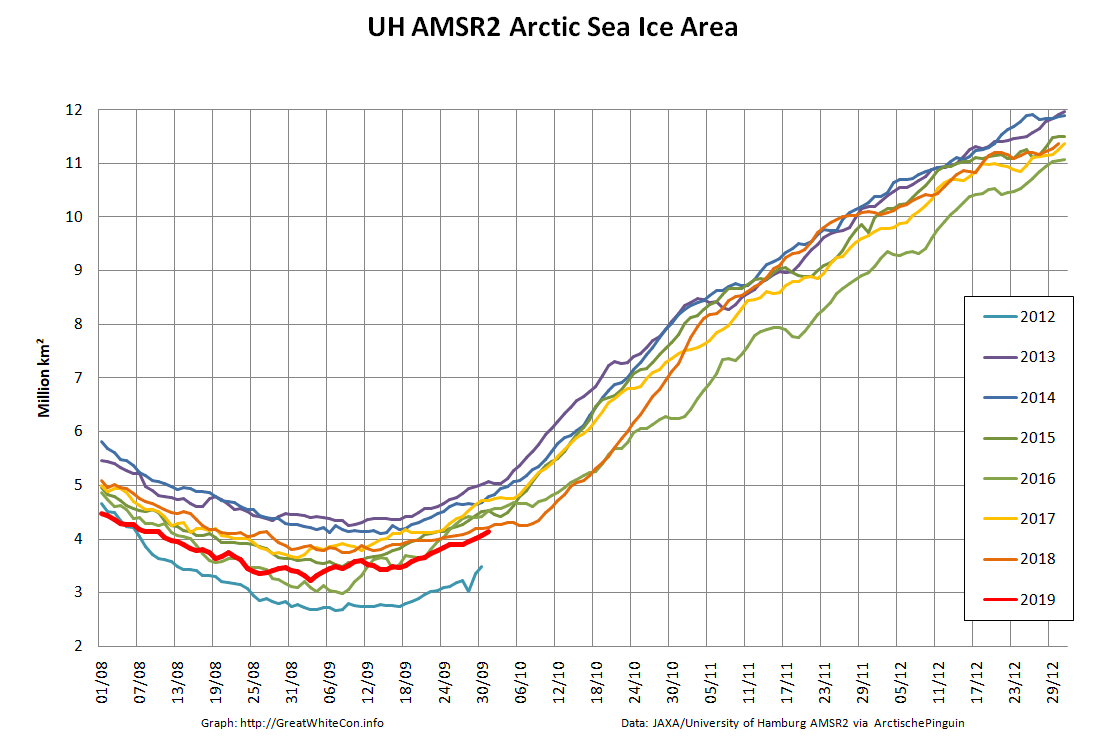
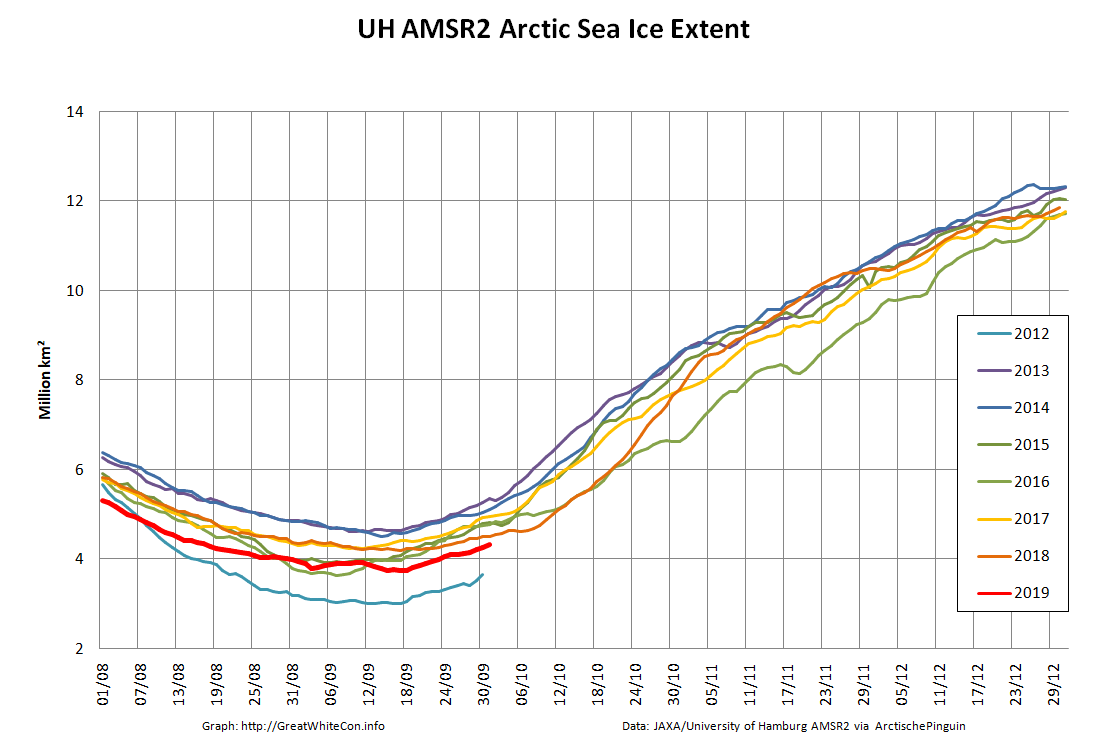
Compare and contrast JAXA extent with Wipneus’ high resolution AMSR2 extent and area:

Perhaps the 2020 maximum area has already been reached?

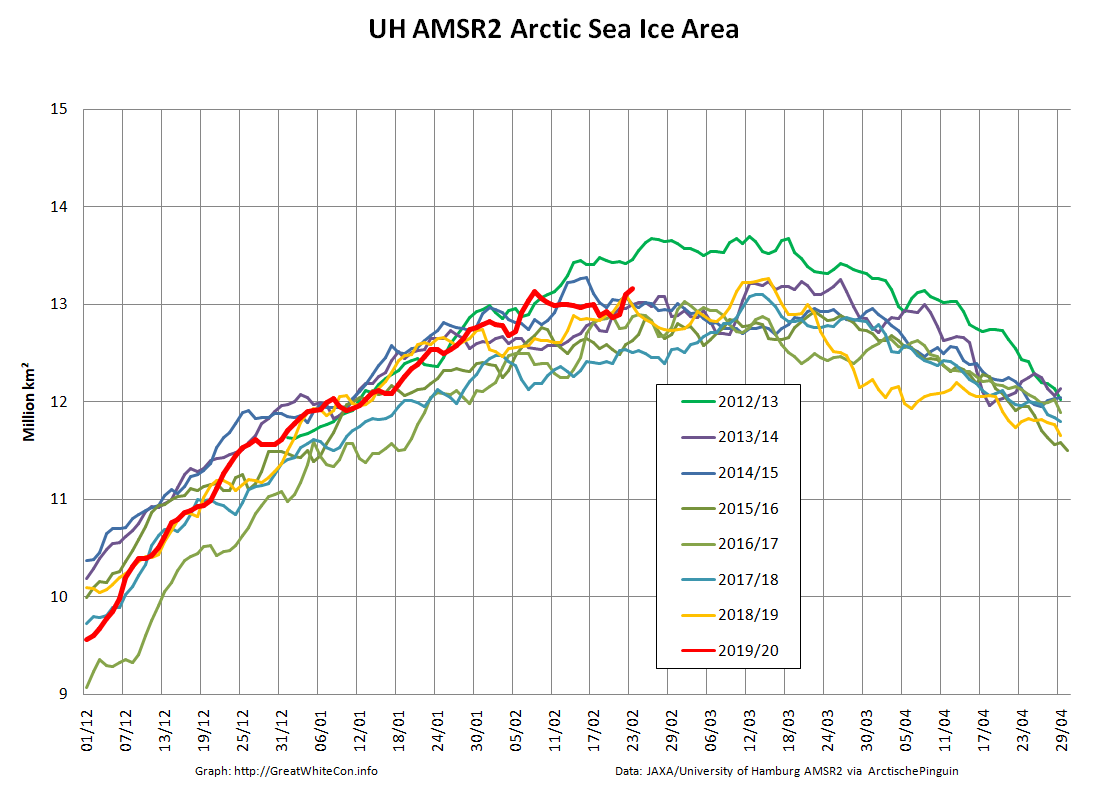
[Edit – February 25th]

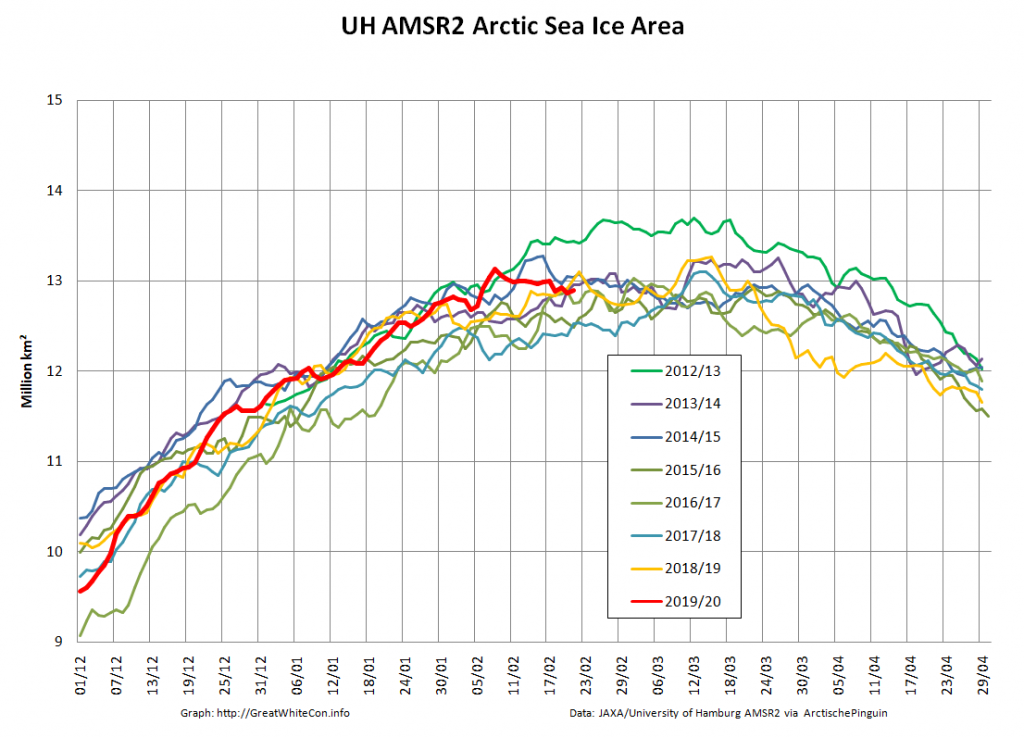
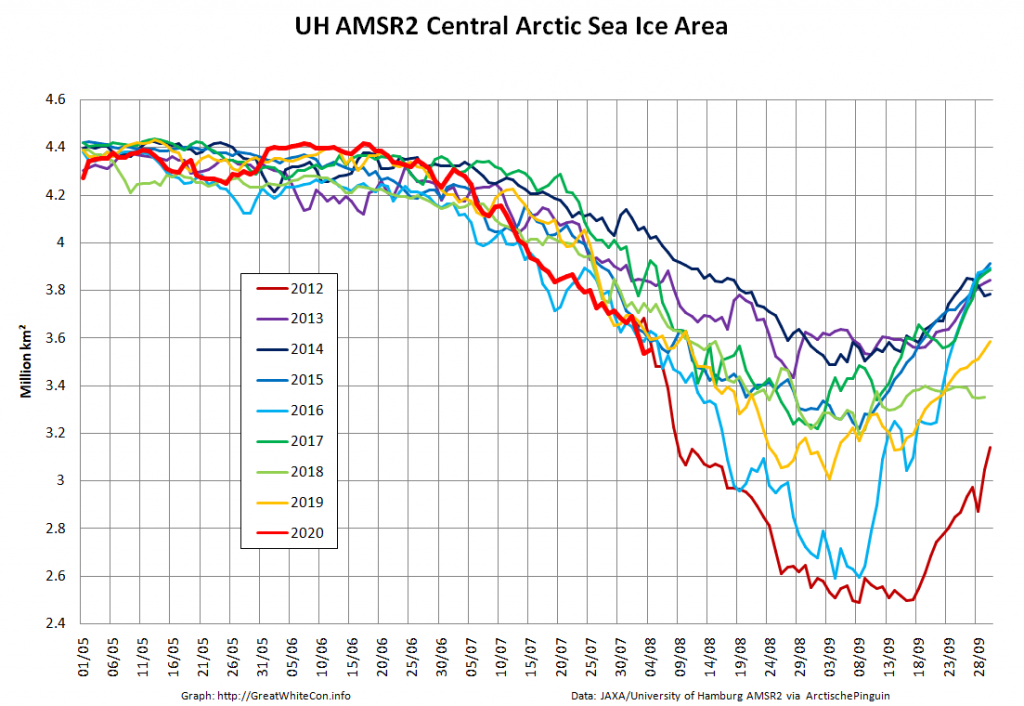
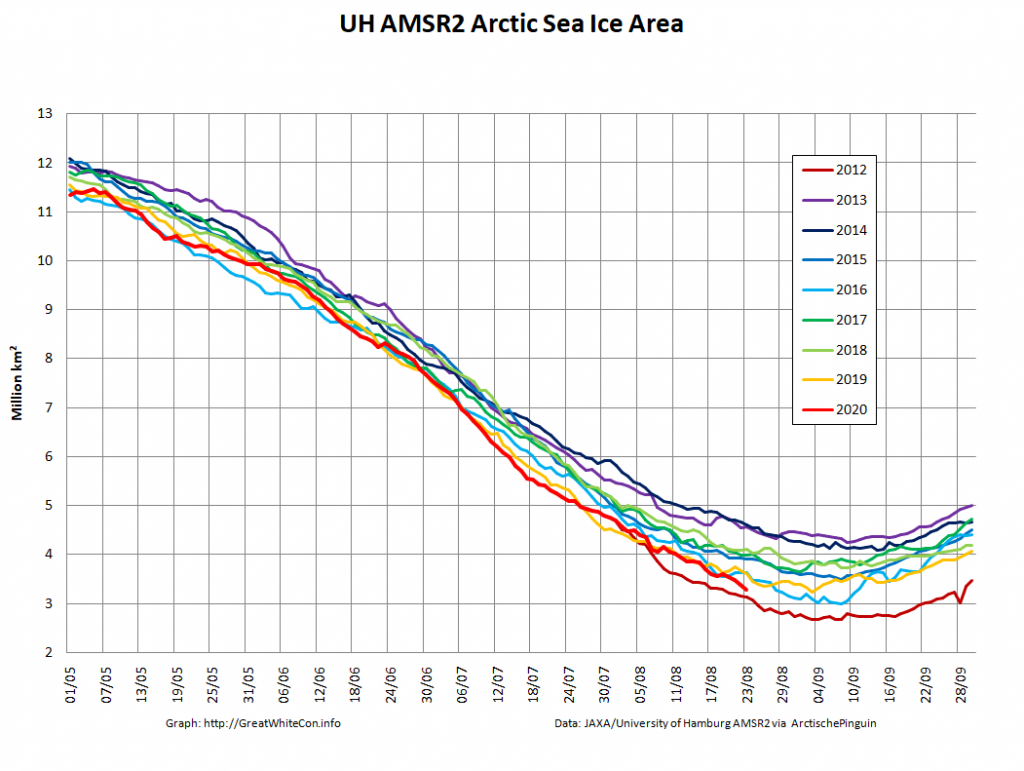
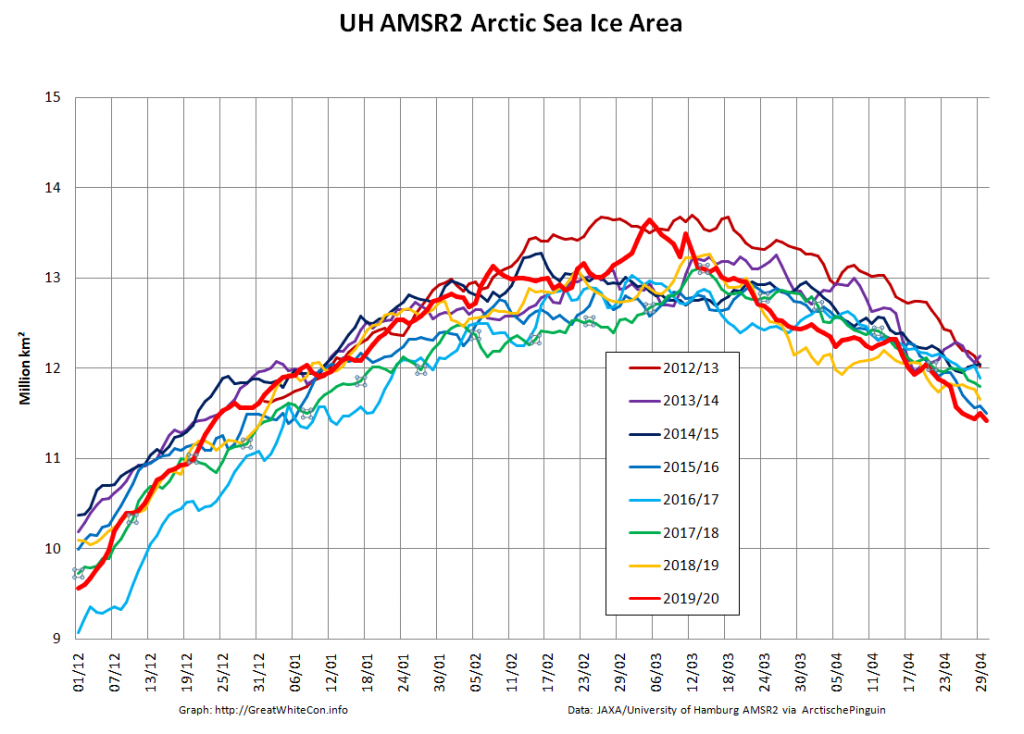
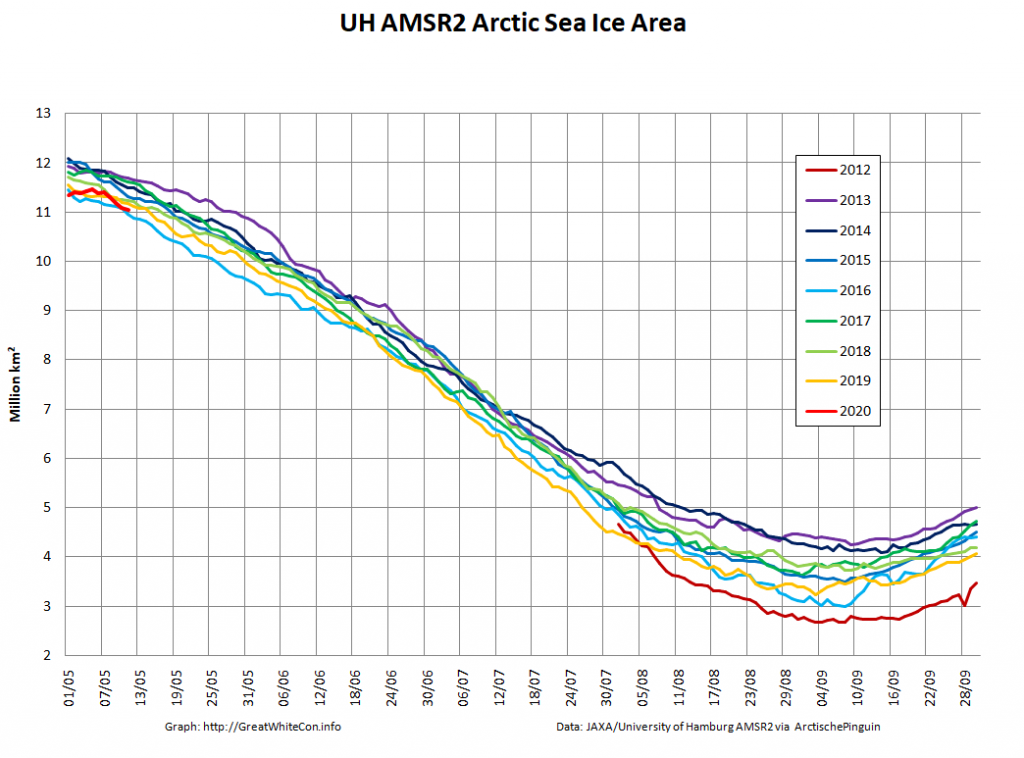
Or perhaps not! We’re playing mix and match this morning, since Wipneus’s new numbers haven’t been released yet. Here UH AMSR2 high resolution Arctic sea ice area from February 23rd:

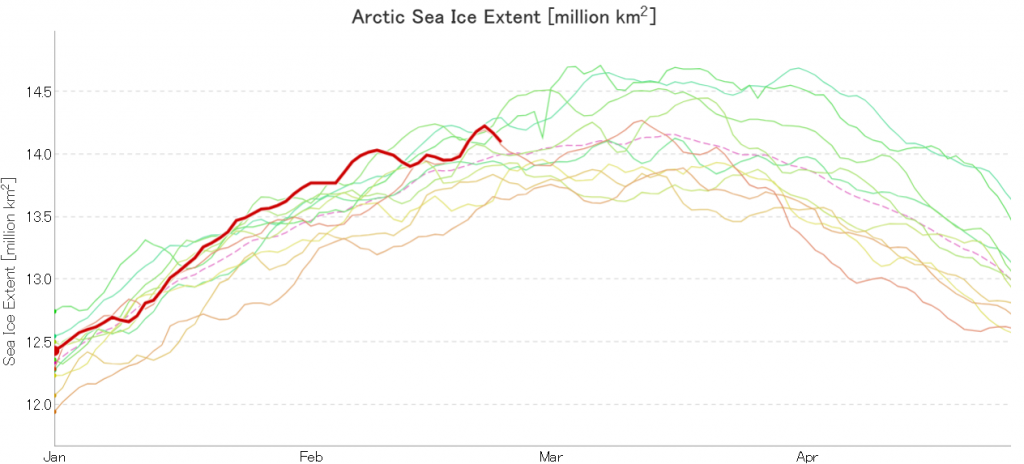
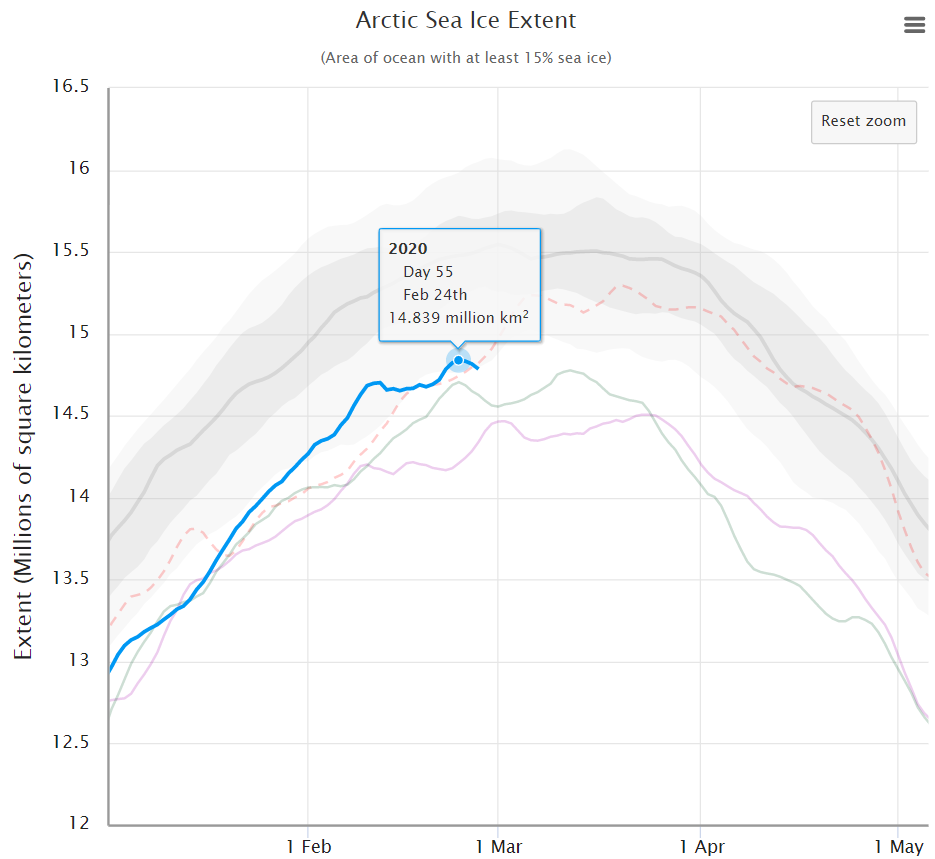
Plus JAXA extent for the 24th:

[Edit – February 27th]

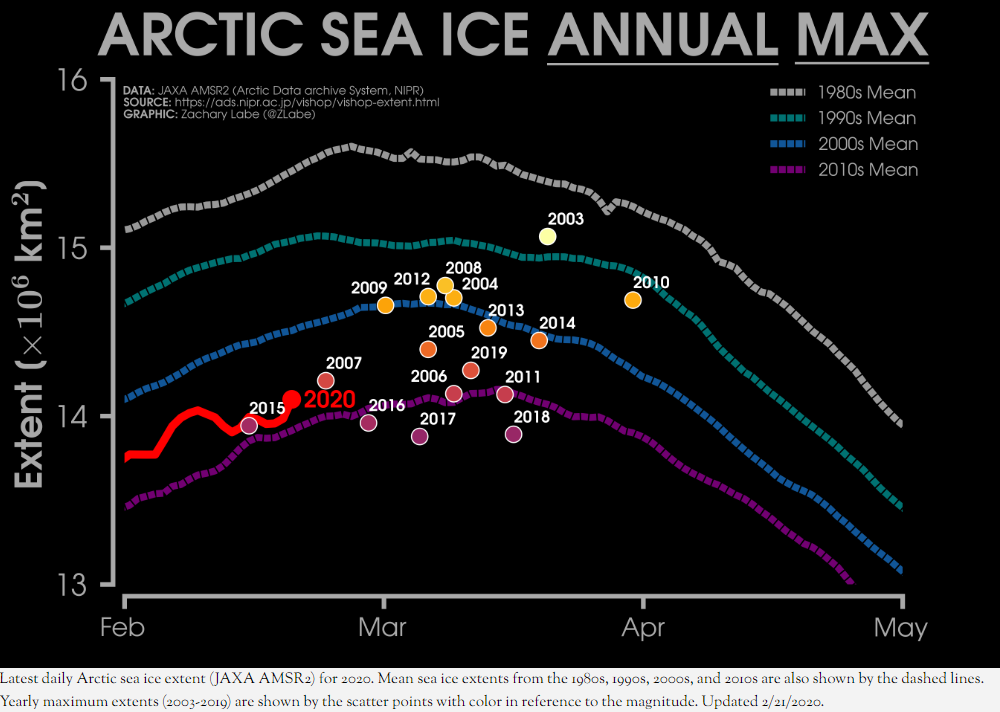
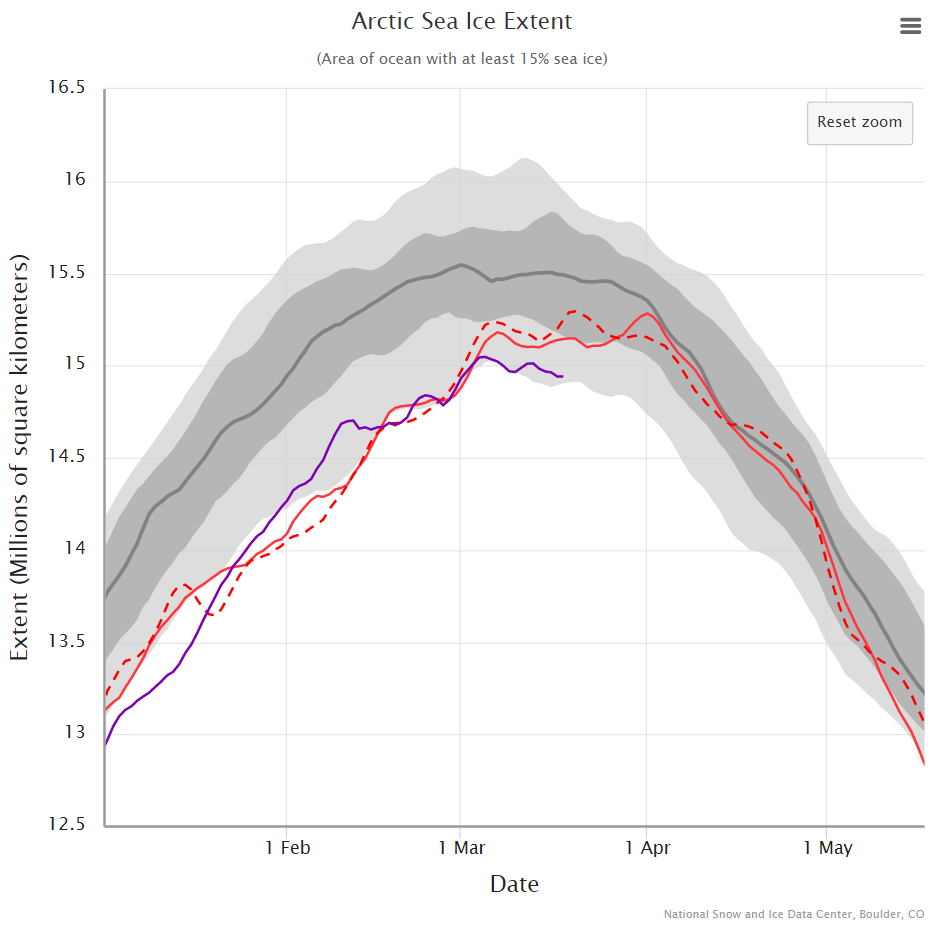
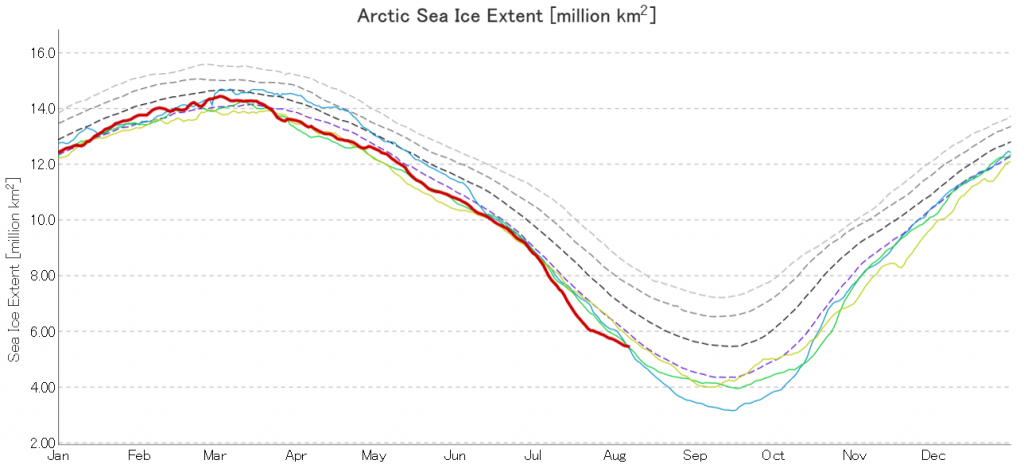
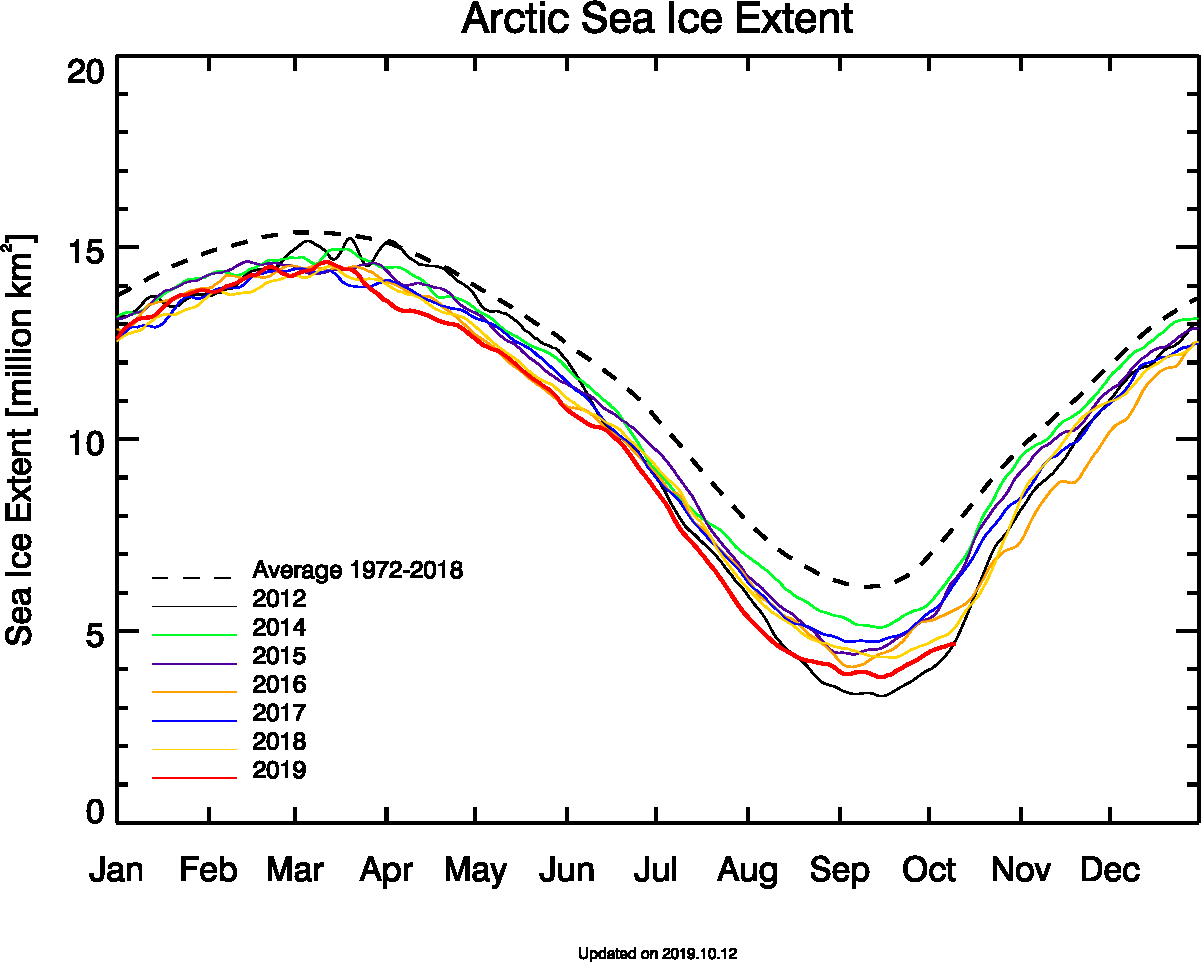
Tony Heller’s latest sea ice themed article claims “Normal Sea Ice Extent At Both Poles”. Hence today’s JAXA extent graph includes the averages for previous decades:

Extent is evidently increasing once again, and is even more evidently well below what passed for “normal” in the twentieth century!

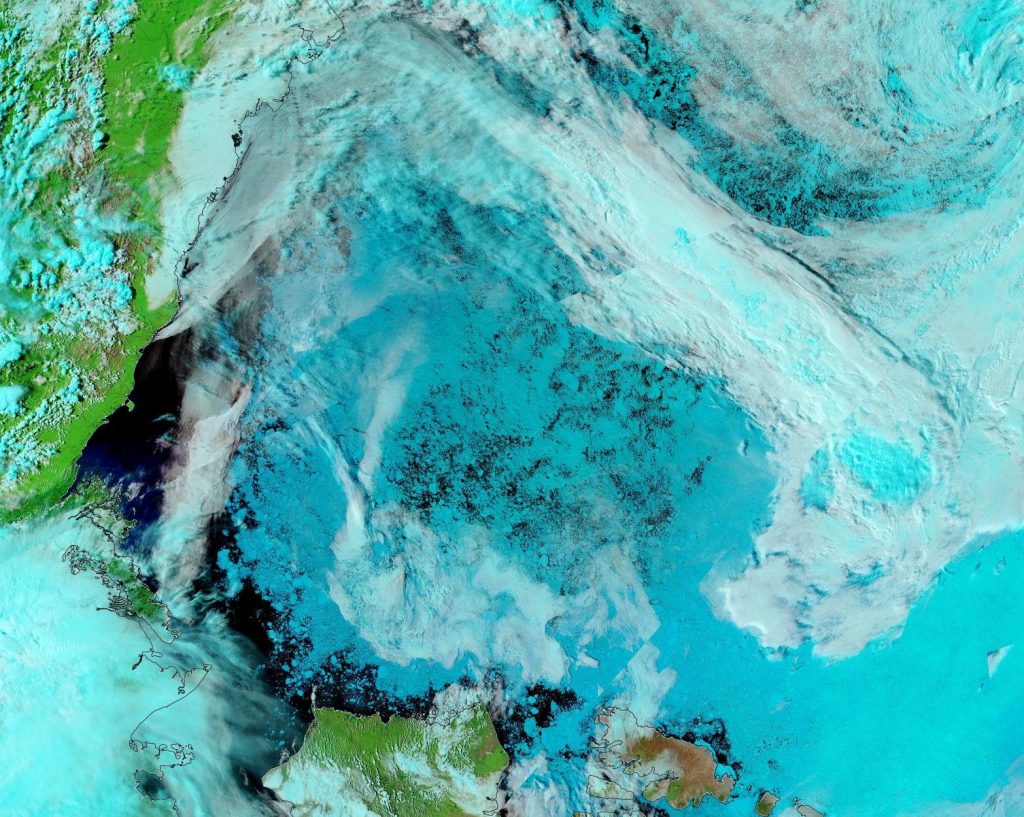
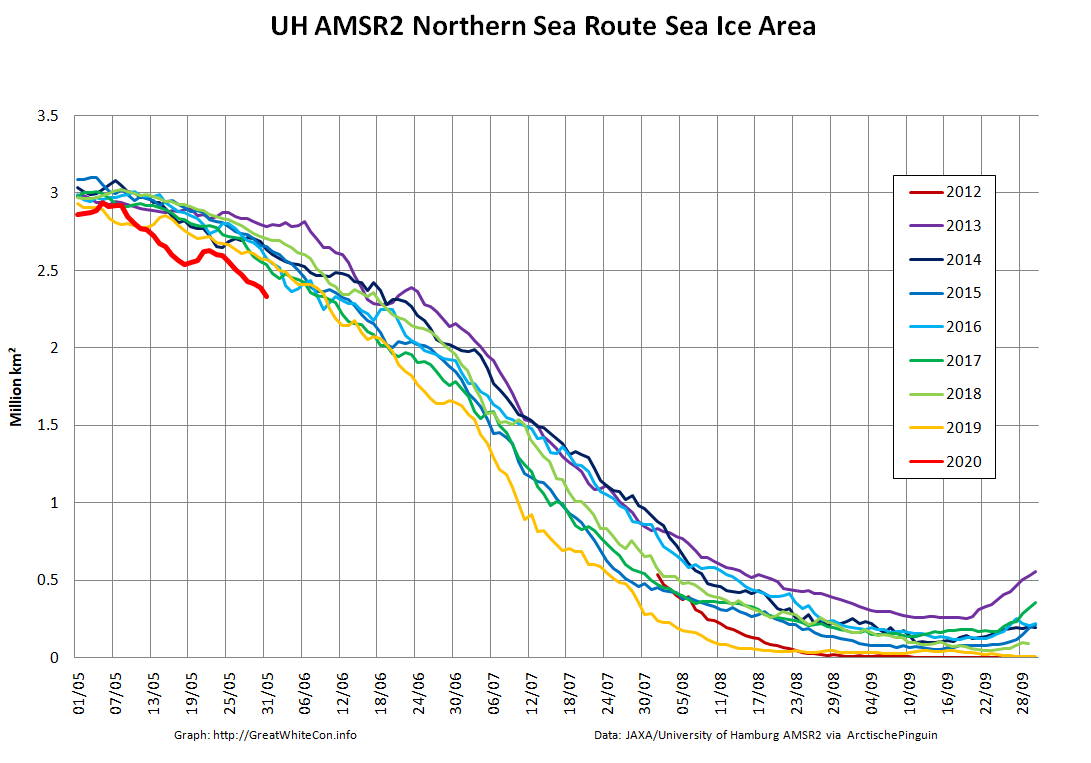
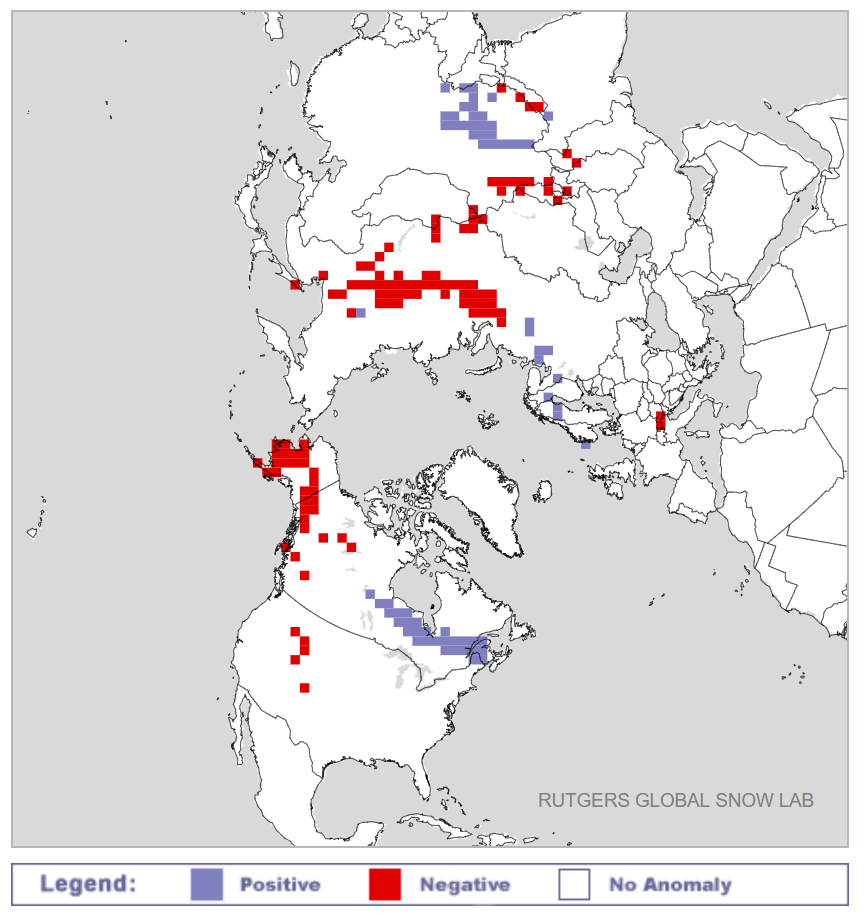
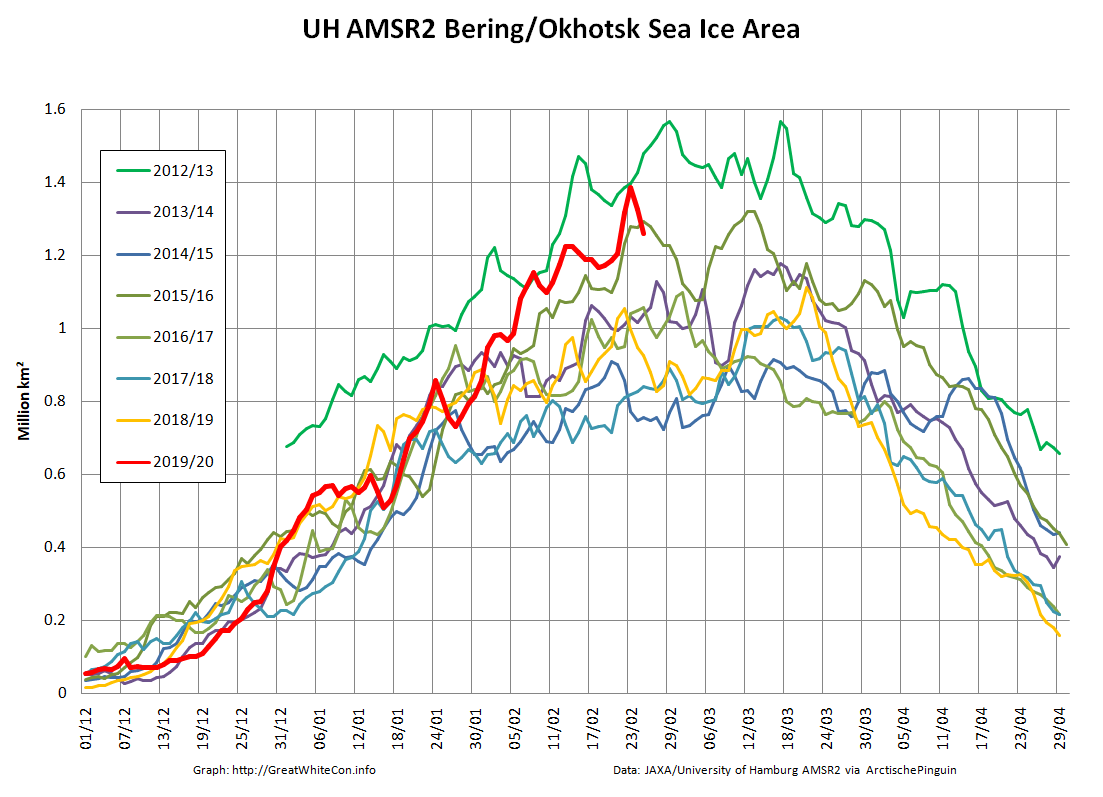
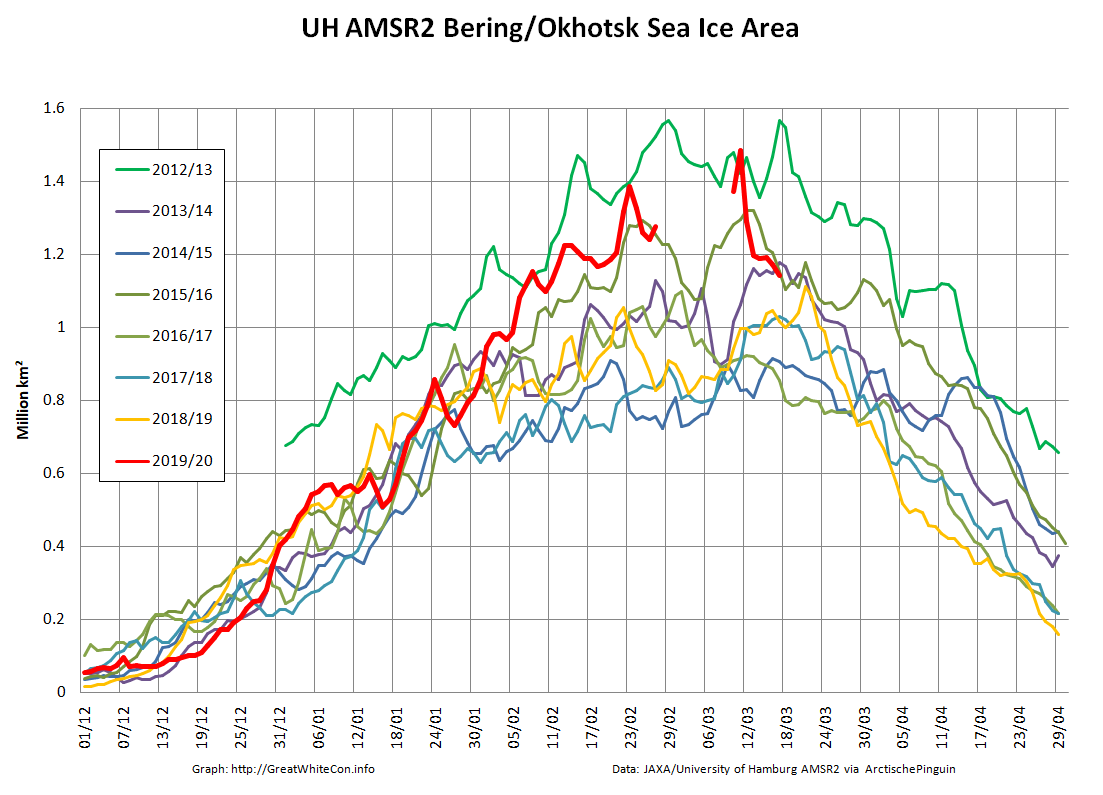
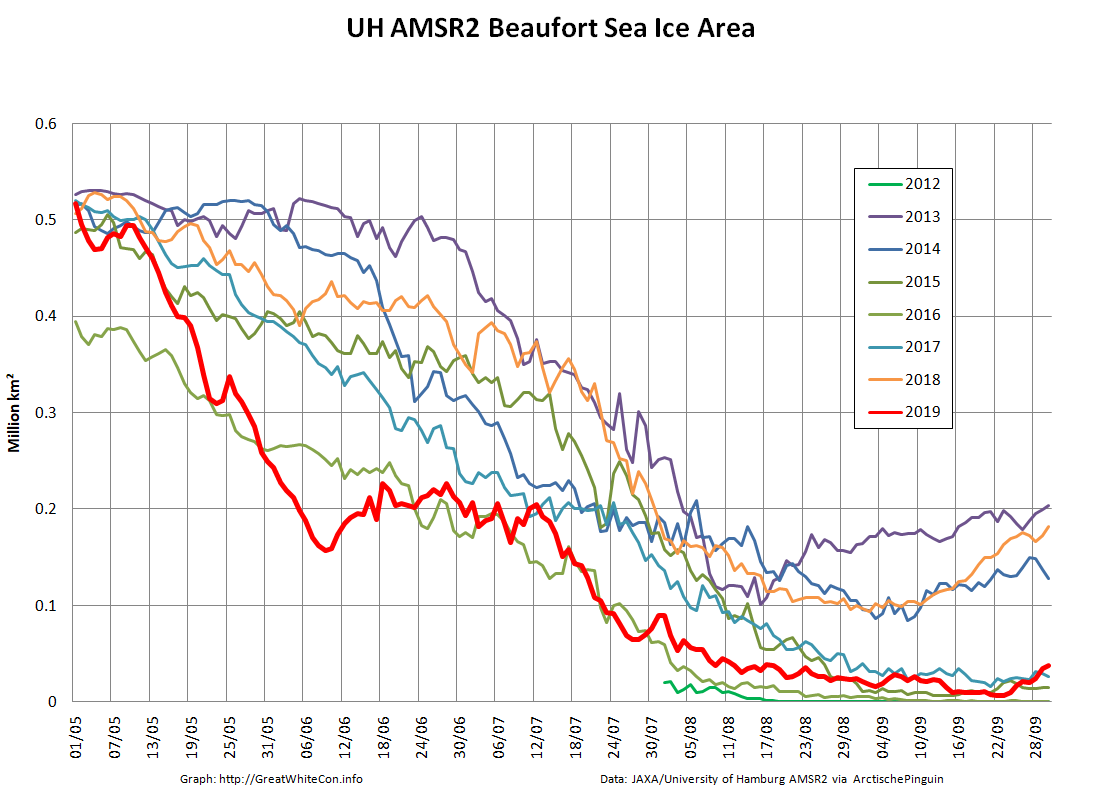
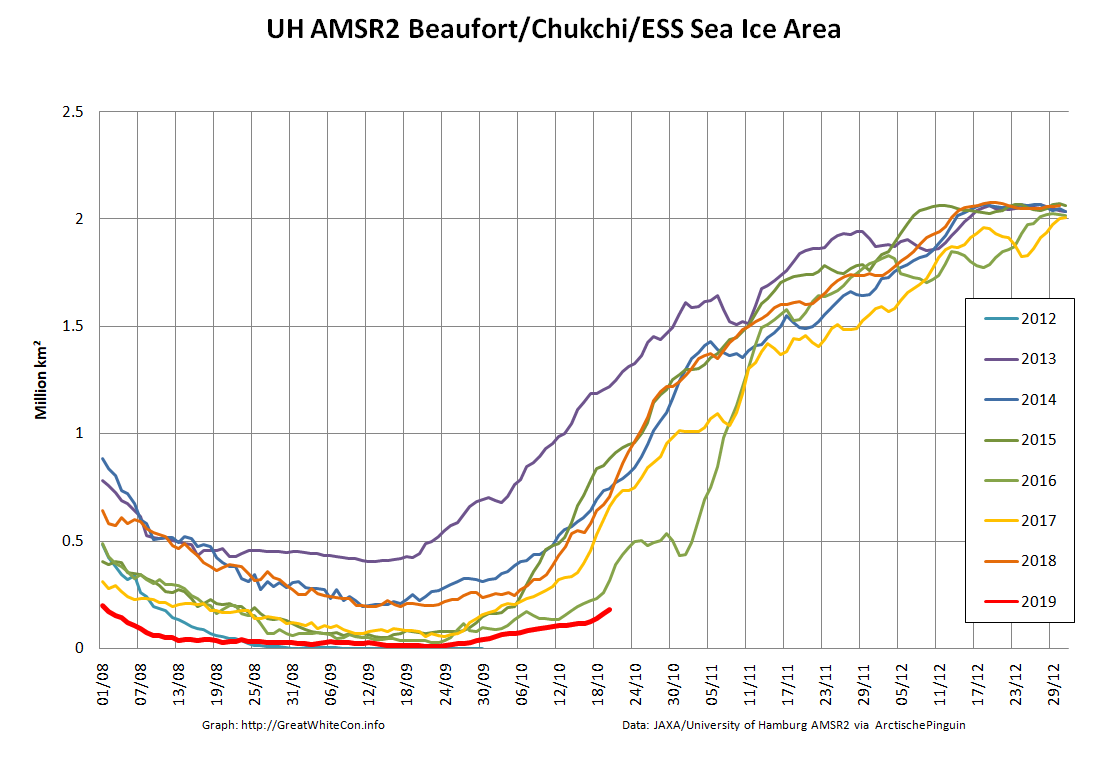
Let’s also compare the Pacific periphery:

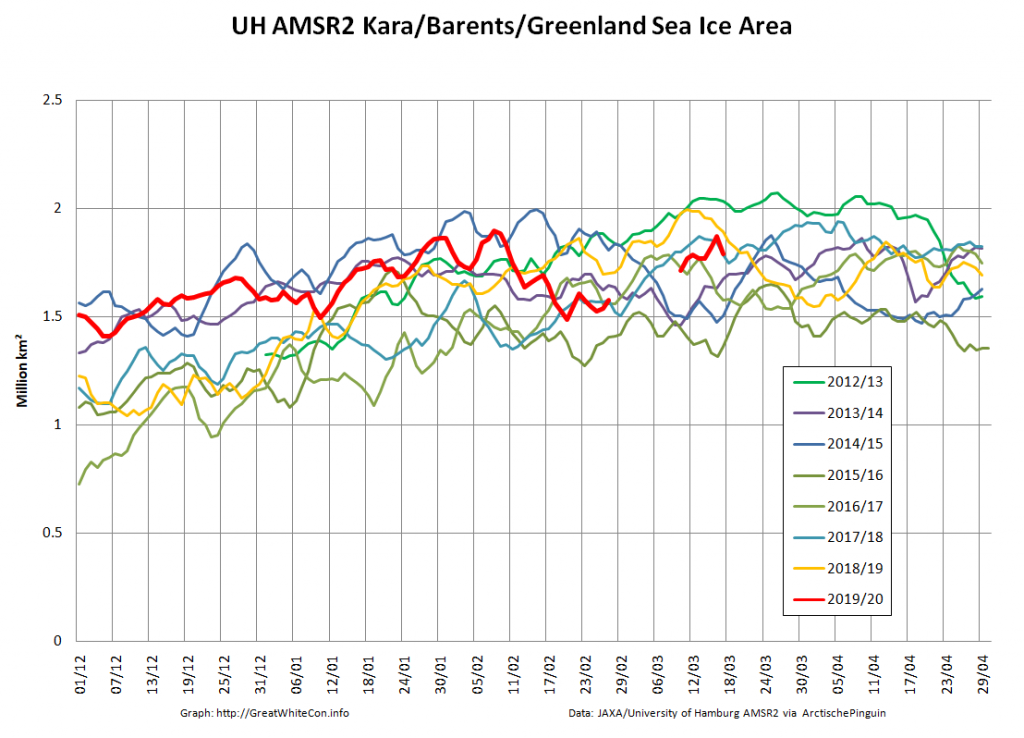
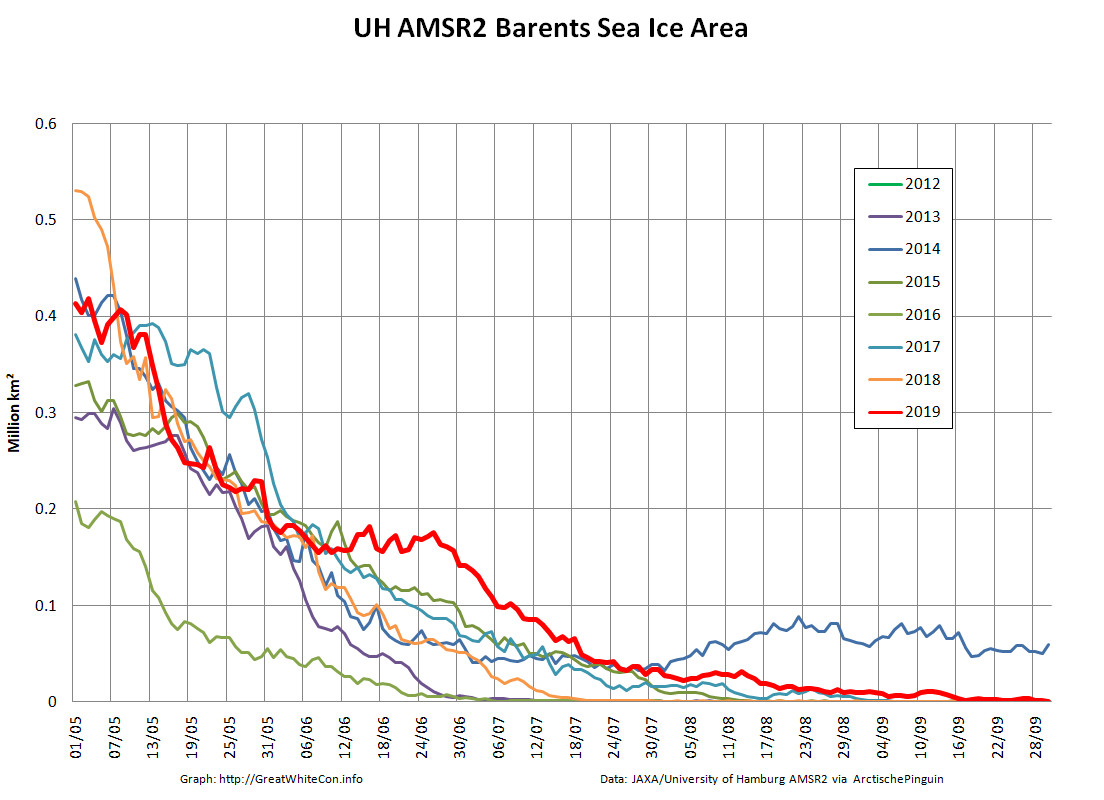
with the Atlantic side of the Arctic Ocean:

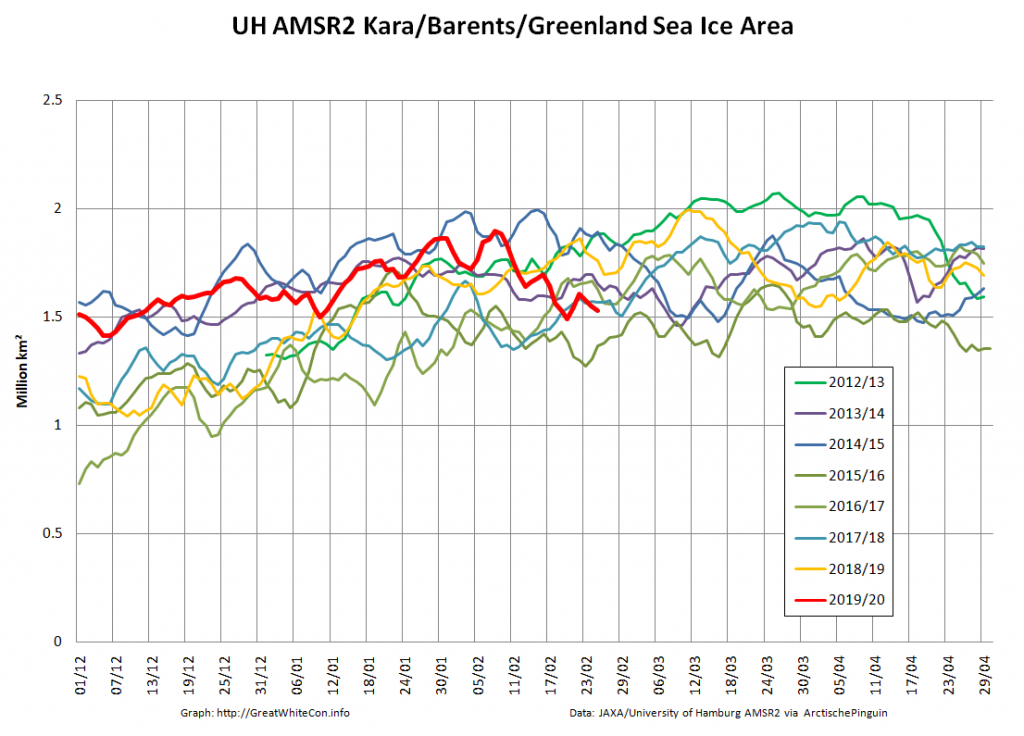
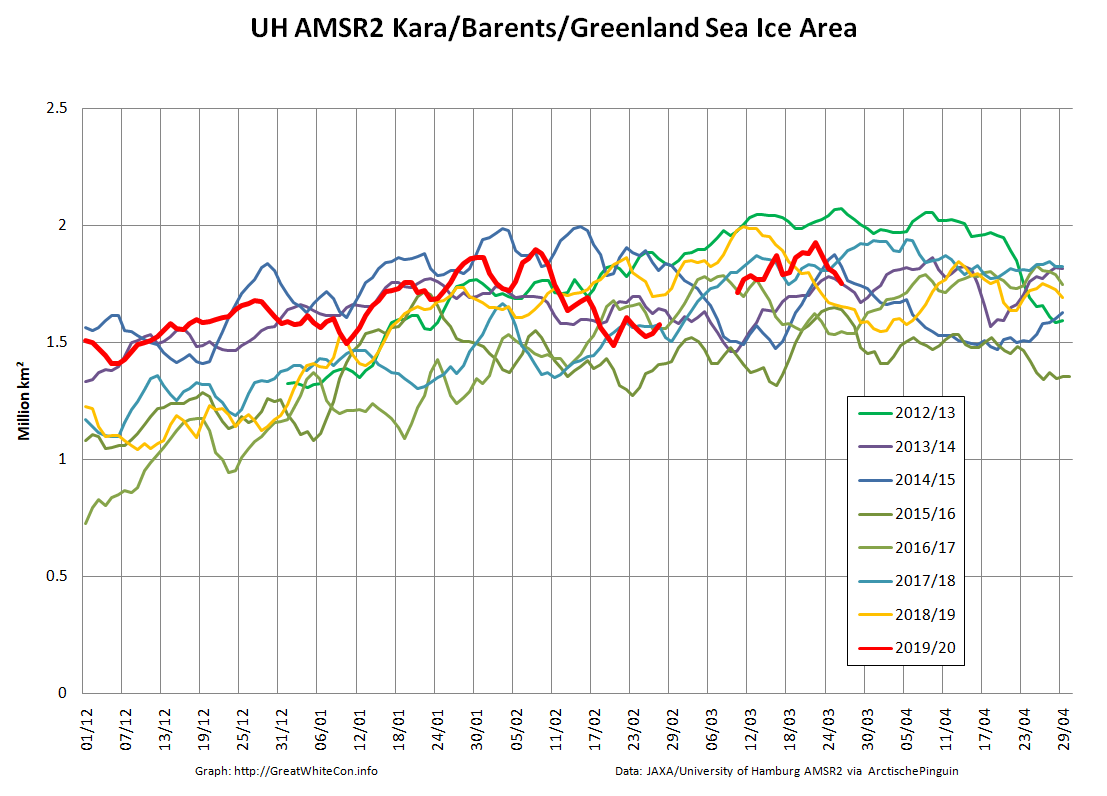
The Bering and Okhotsk Seas will be sea ice free by the time September 2020 arrives. How about the Kara, Barents and particularly Greenland Seas though?

[Edit – February 29th]

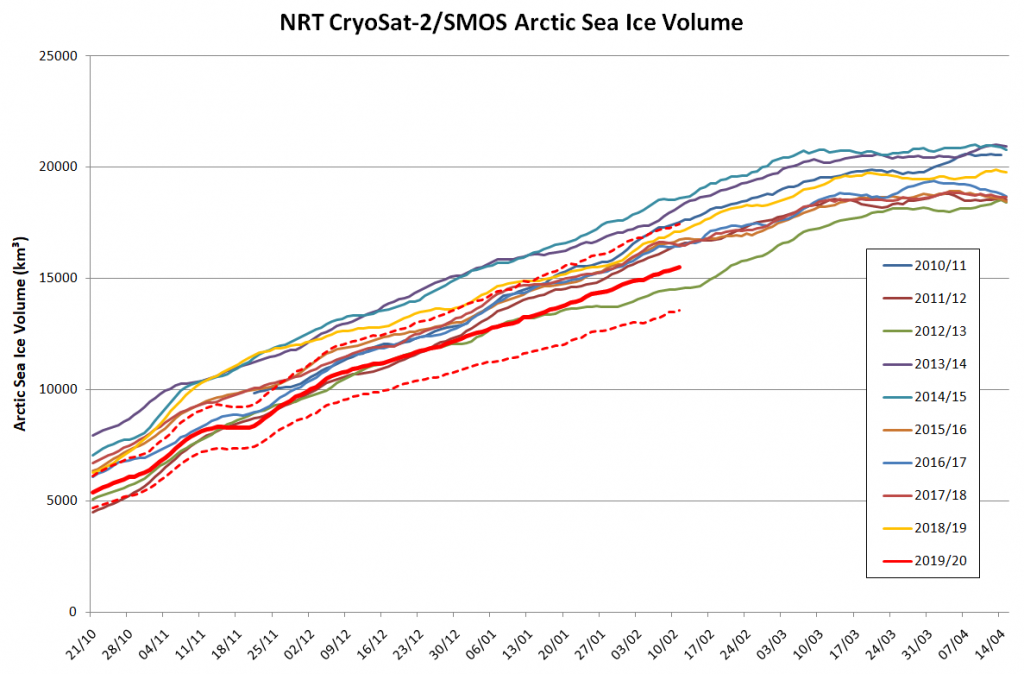
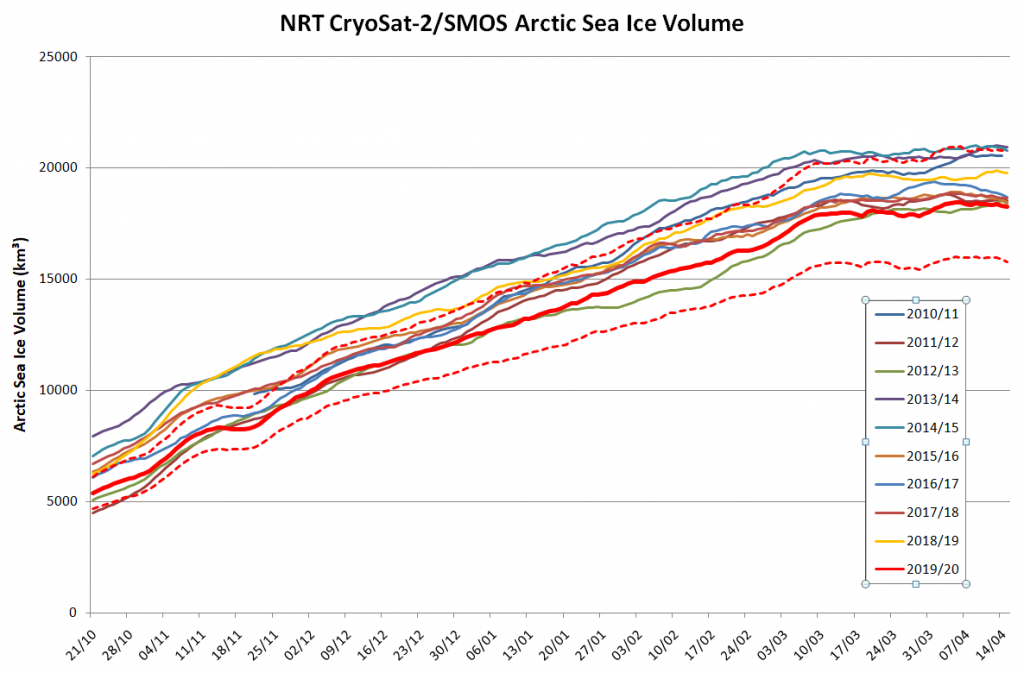
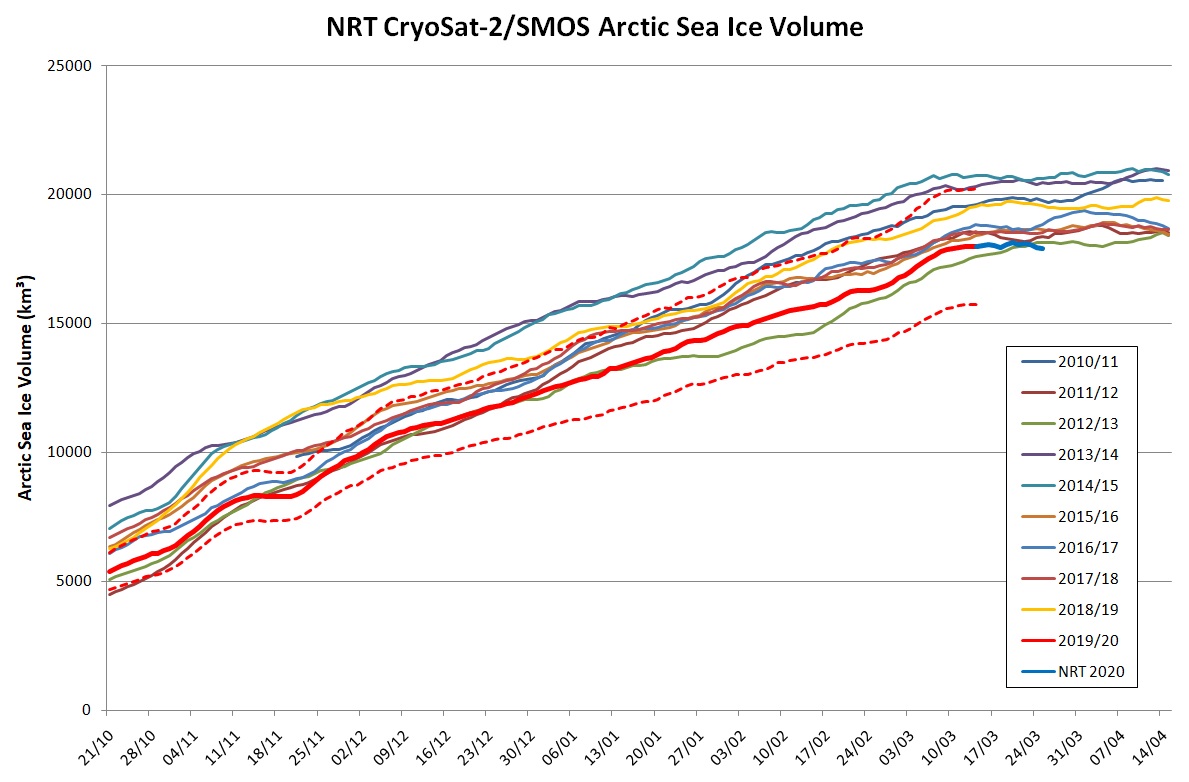
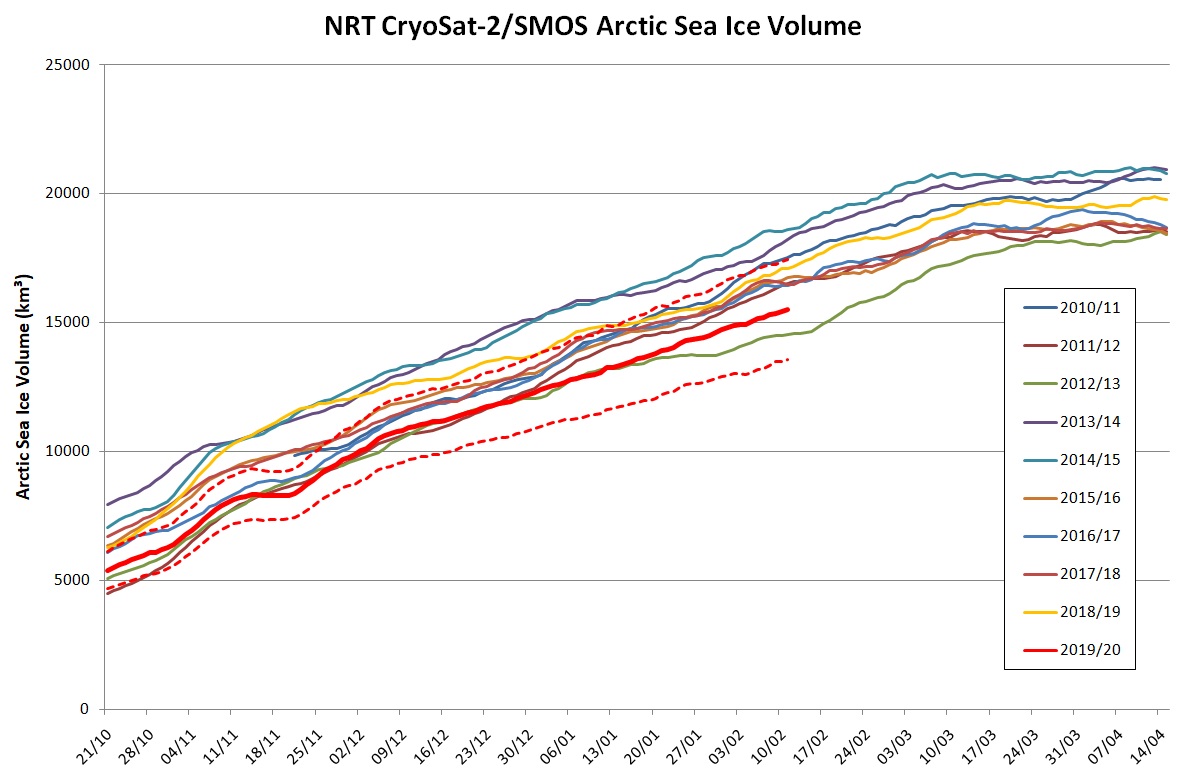
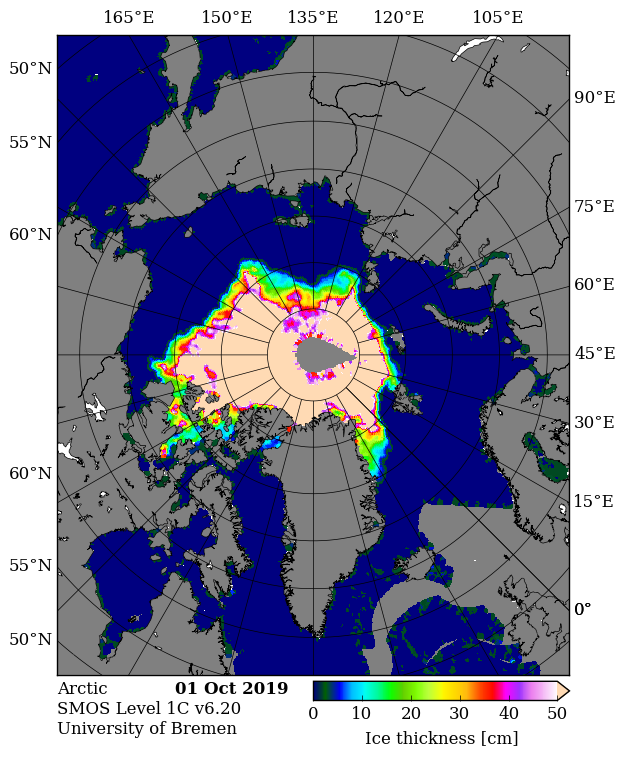
Arctic sea ice maximum volume usually occurs in April, but nonetheless let’s keep an eye on the metric that most nearly measure the “amount” of sea ice left in the Arctic in 2020. Here’s our “measured” CryoSat-2/SMOS volume metric, using reanalysed data up to February 12th:

PIOMAS “modelled” volume for February should be released soon, but getting back to extent the JAXA flavour has been setting new highs over recent days:

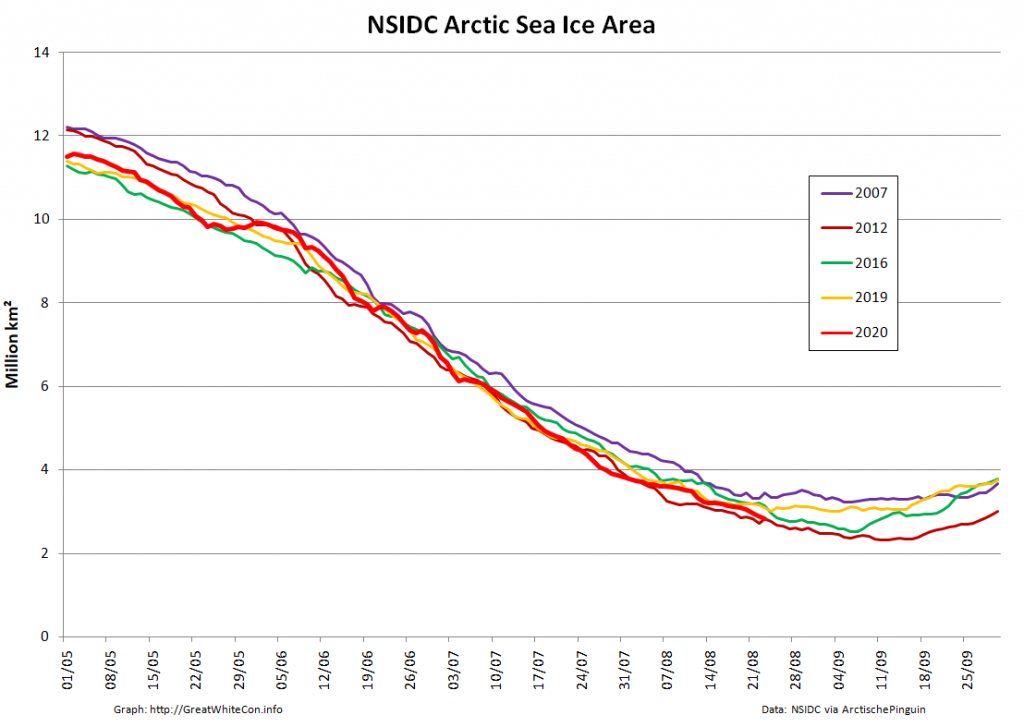
whereas the NSIDC’s Charctic 5 day averaged extent has not!

[Edit – March 6th]

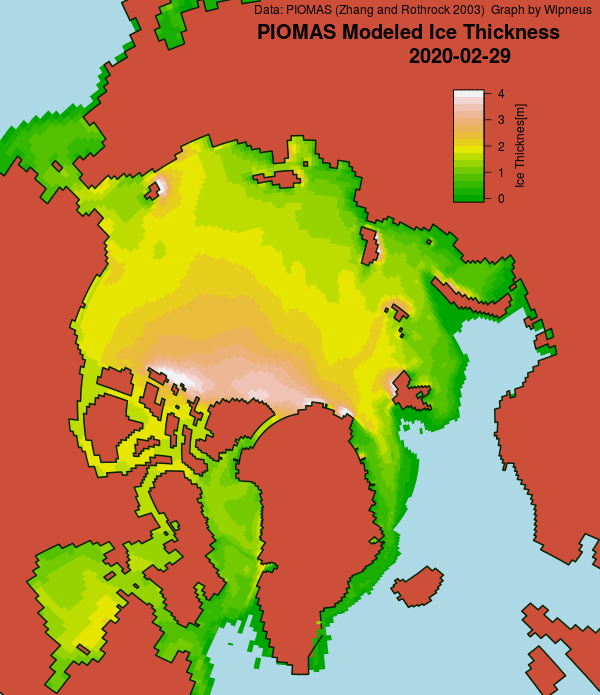
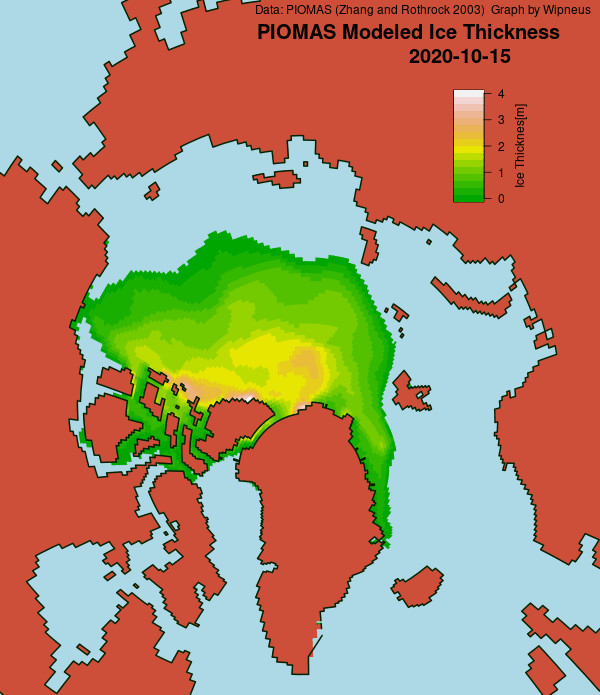
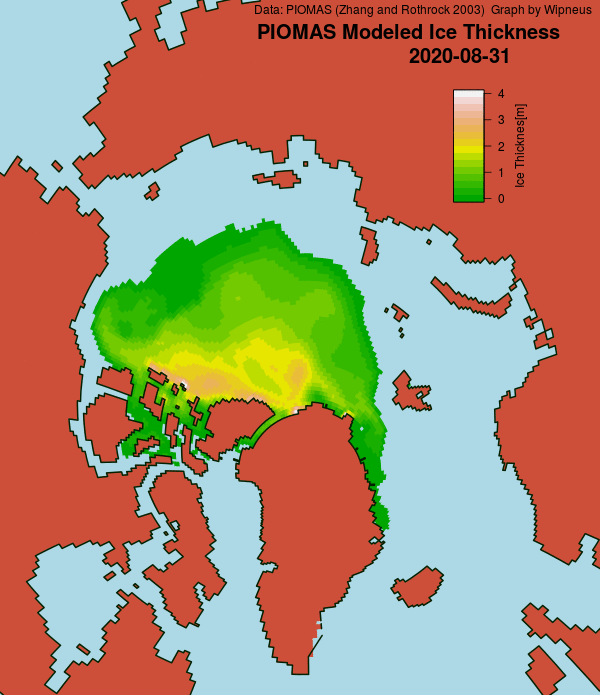
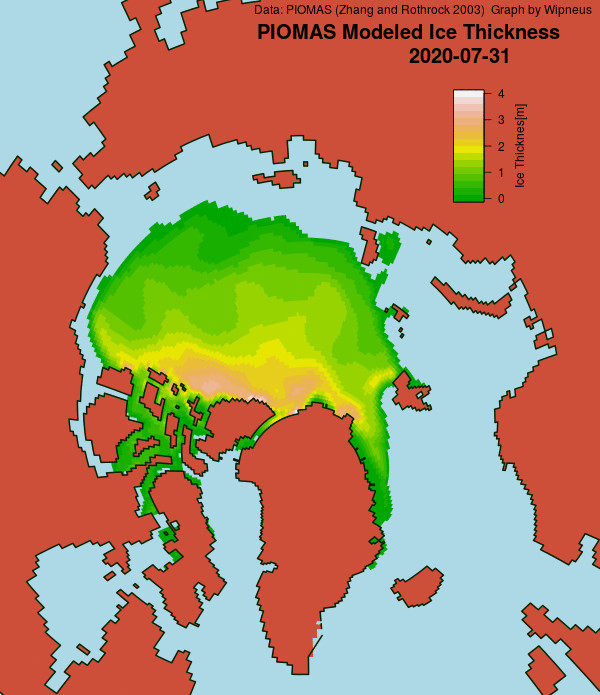
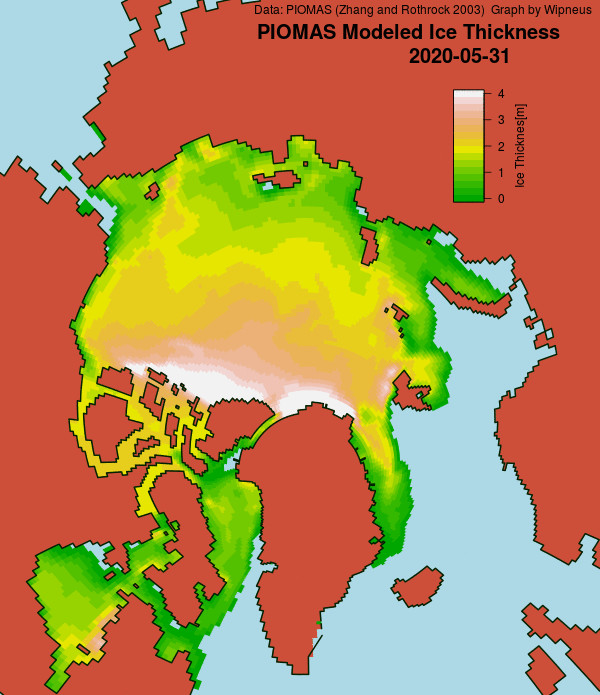
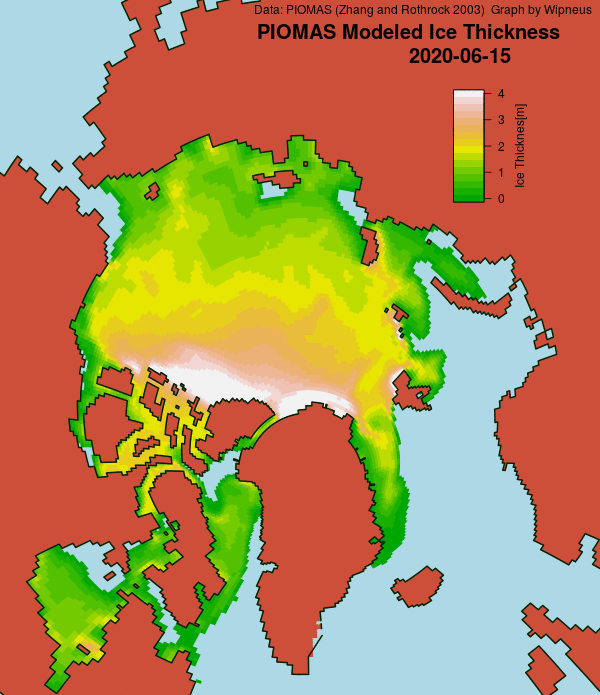
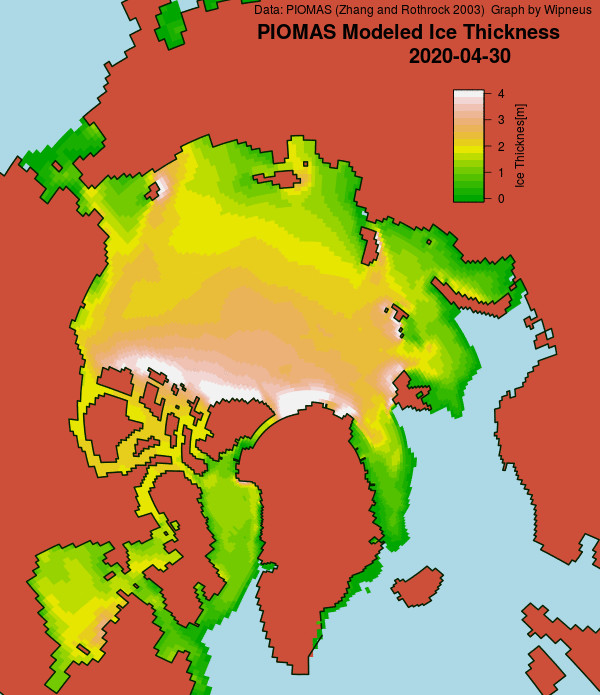
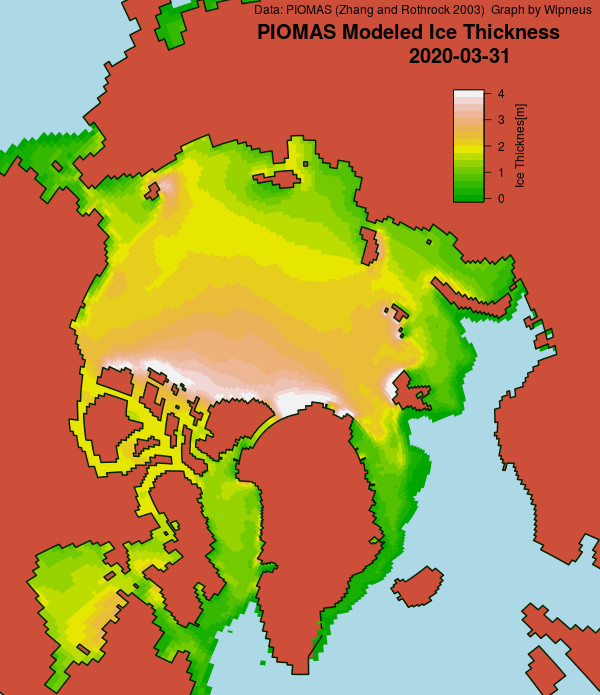
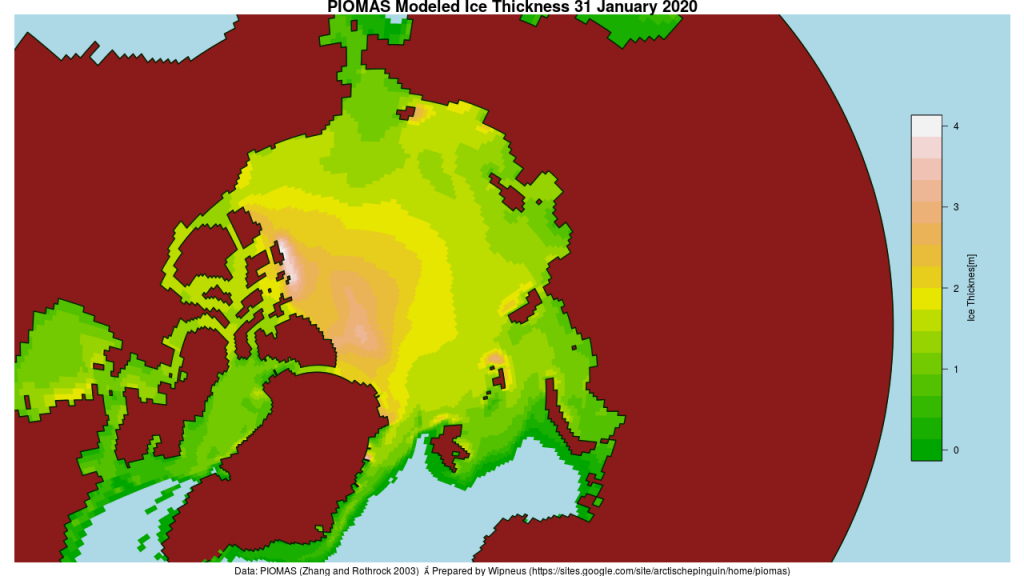
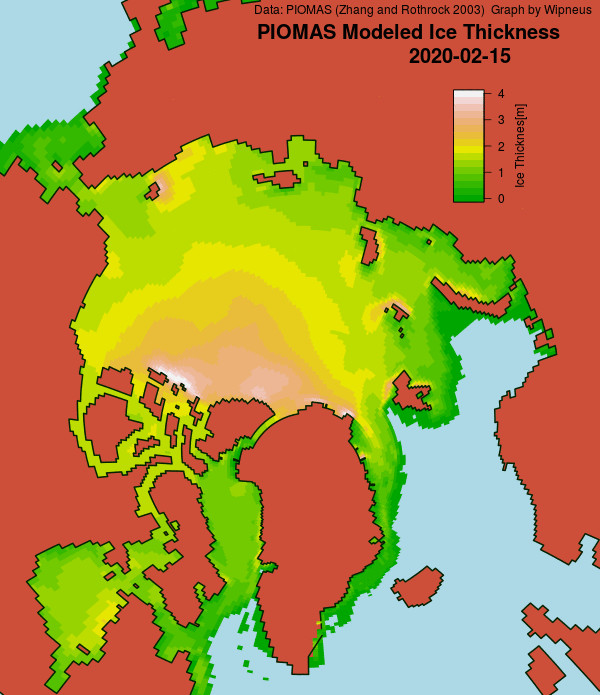
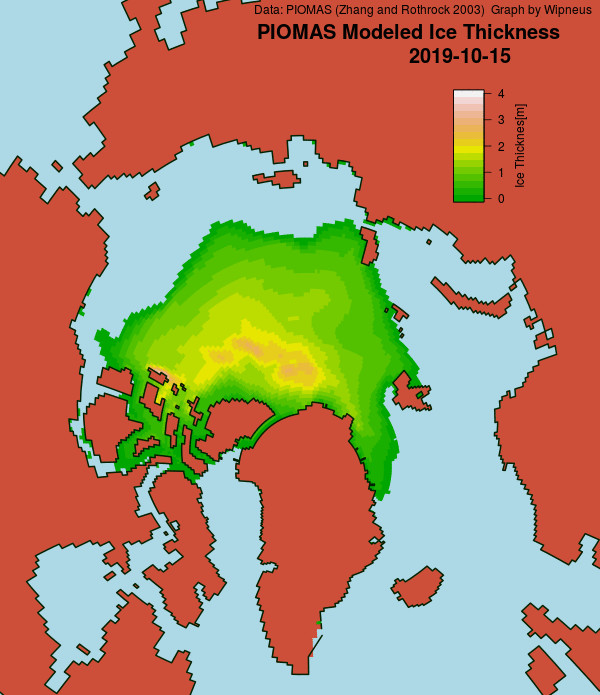
Here’s the February PIOMAS gridded Arctic sea ice thickness map, courtesy of Wipneus on the Arctic Sea Ice Forum:

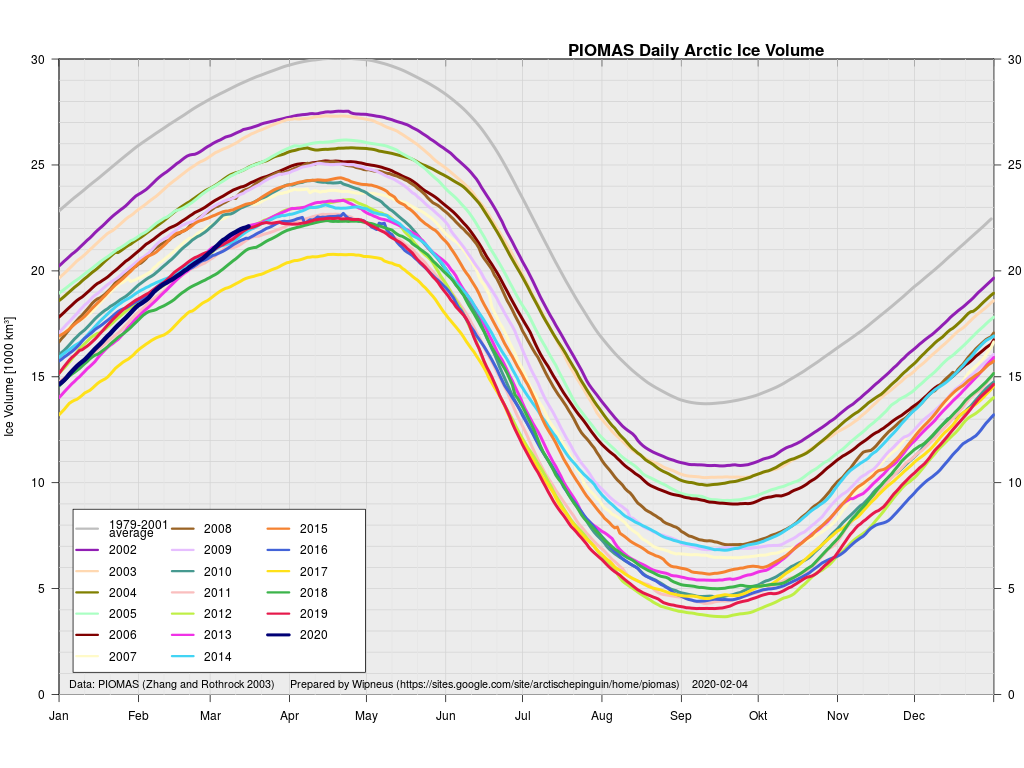
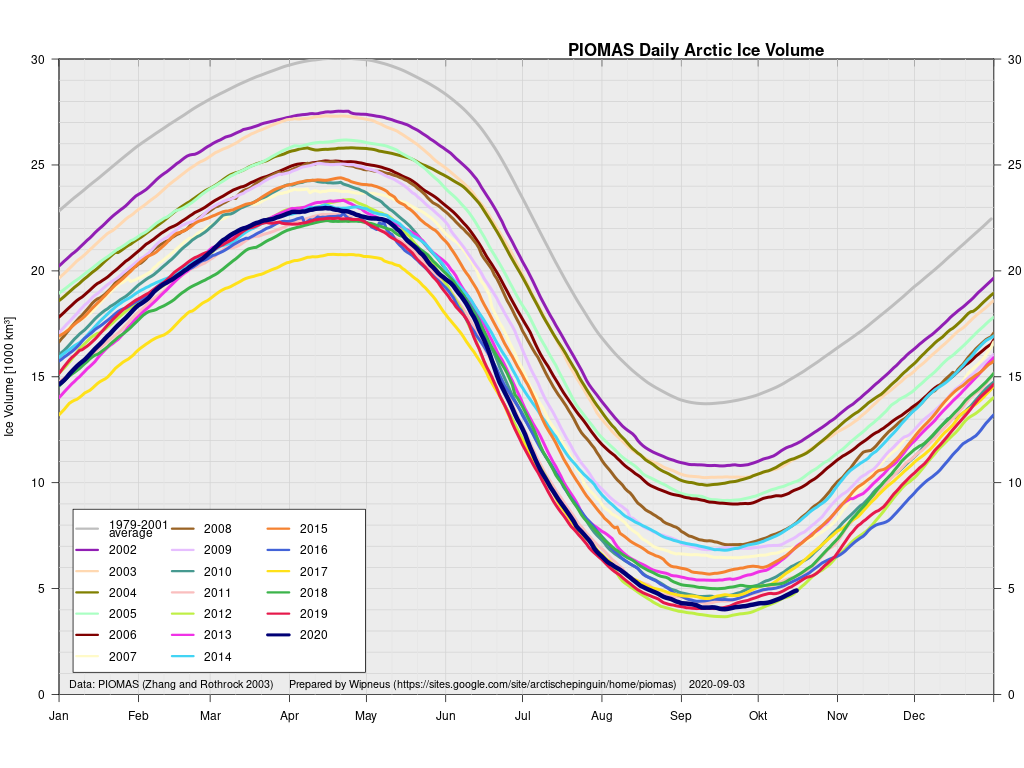
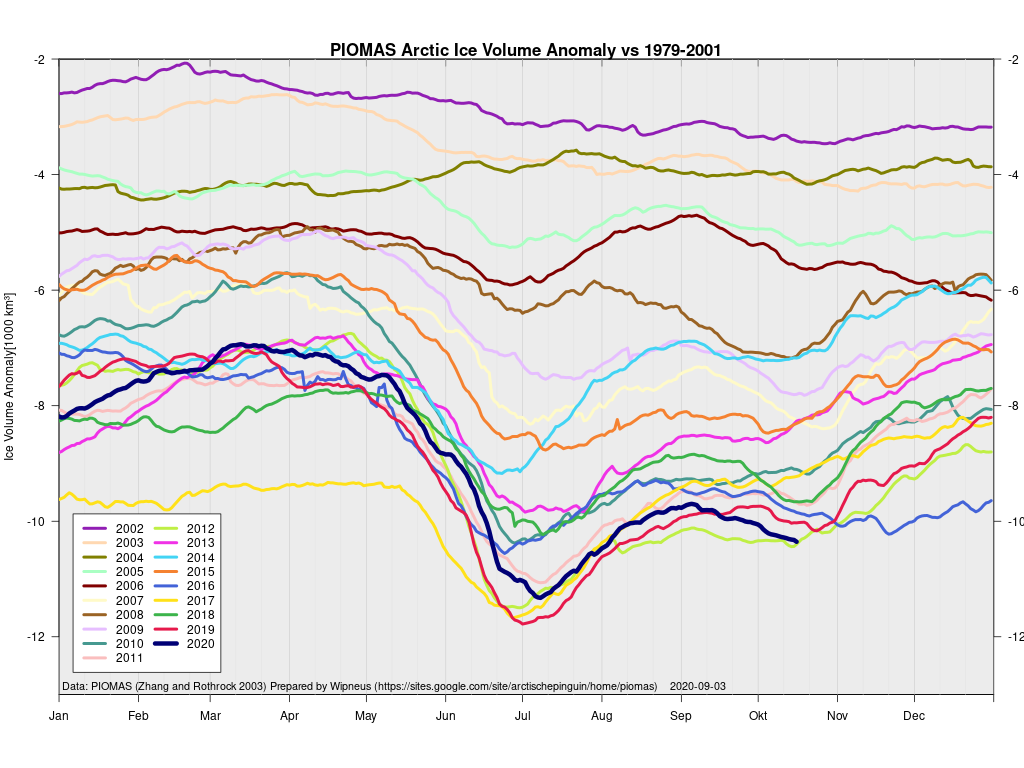
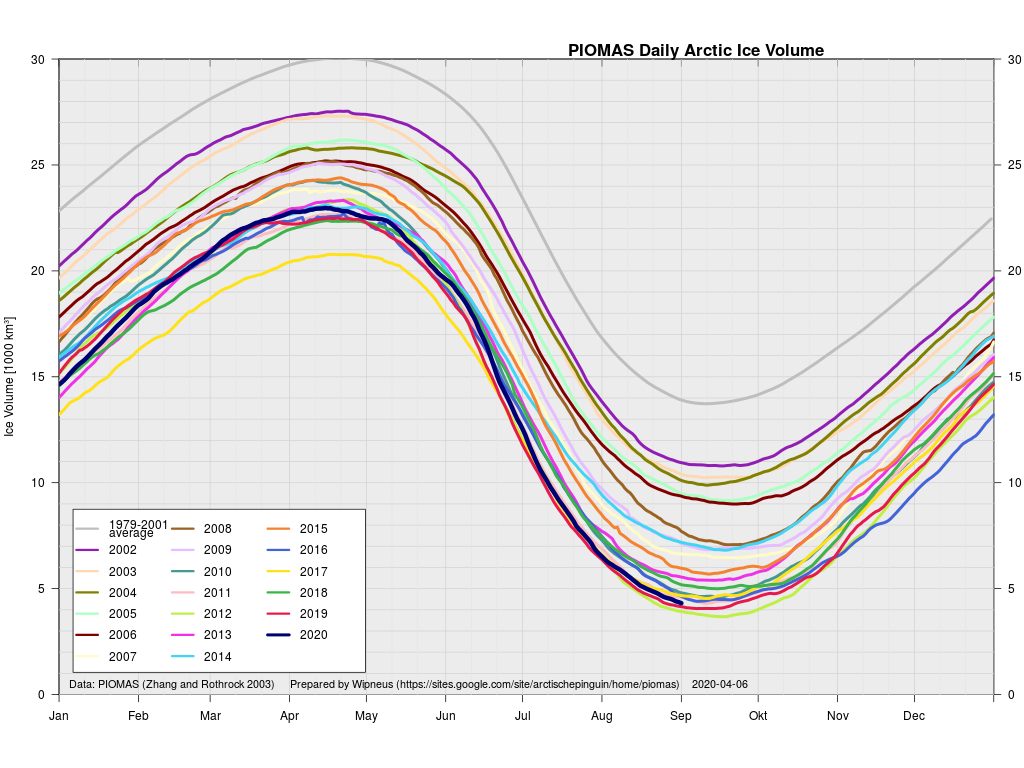
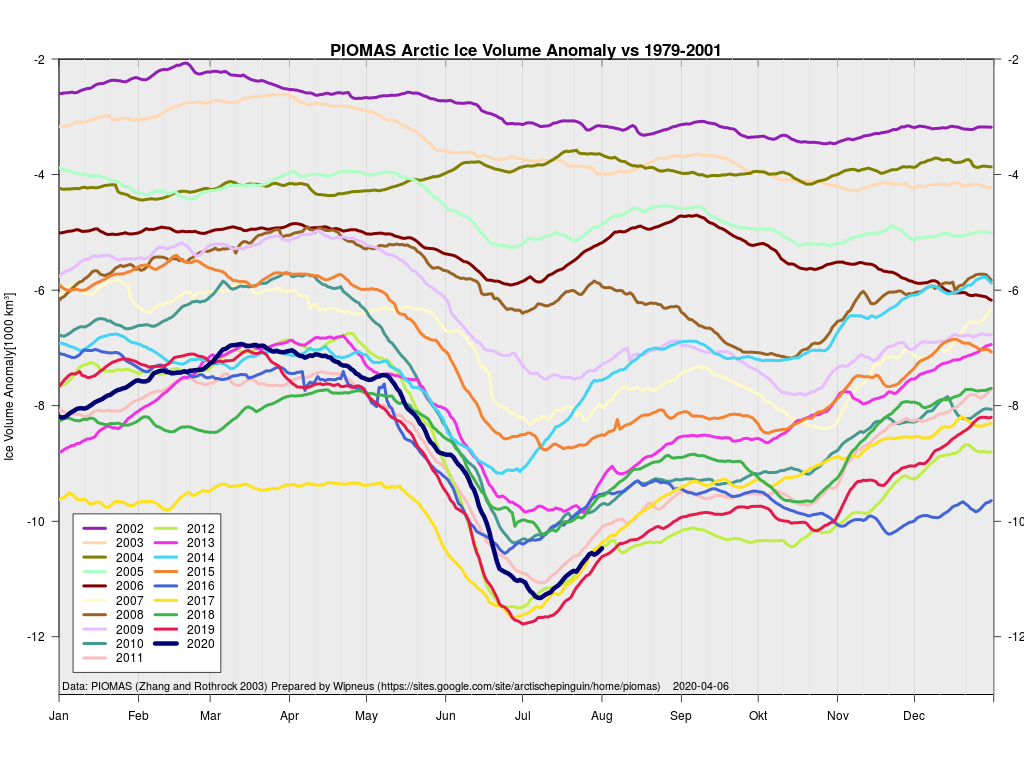
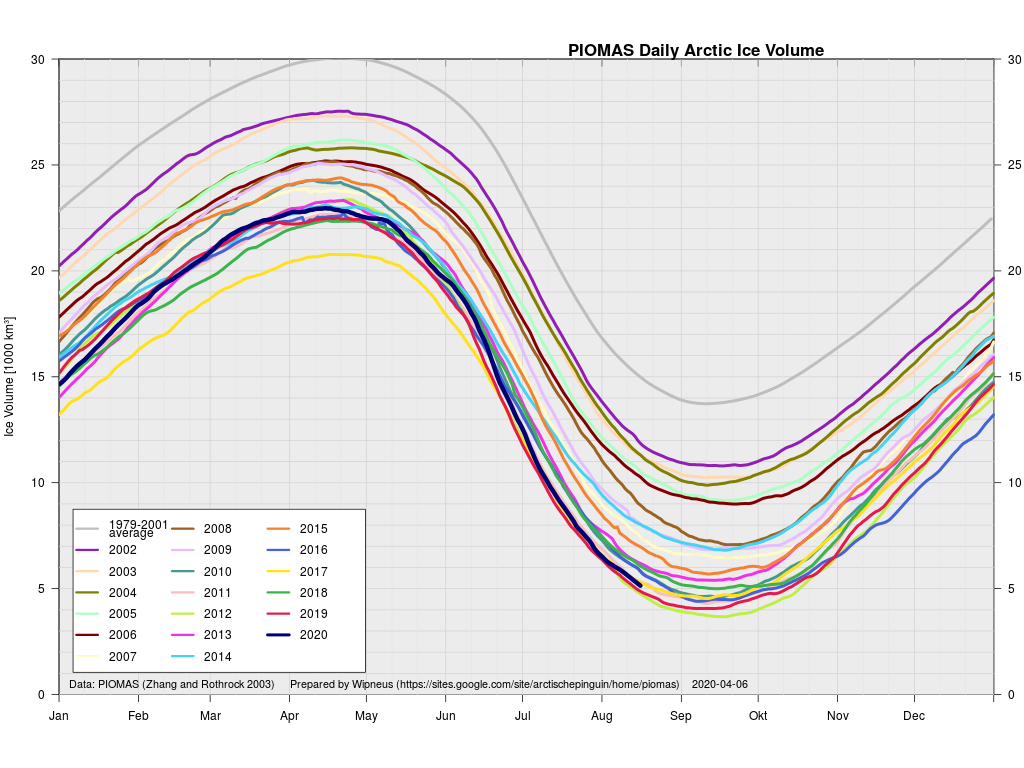
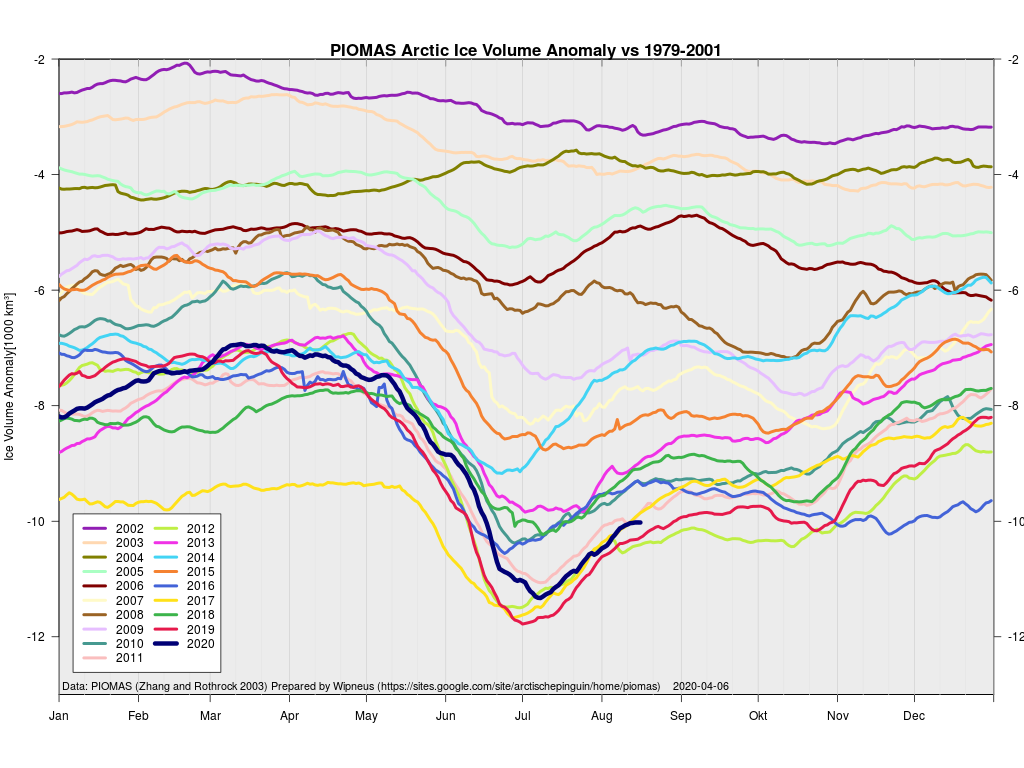
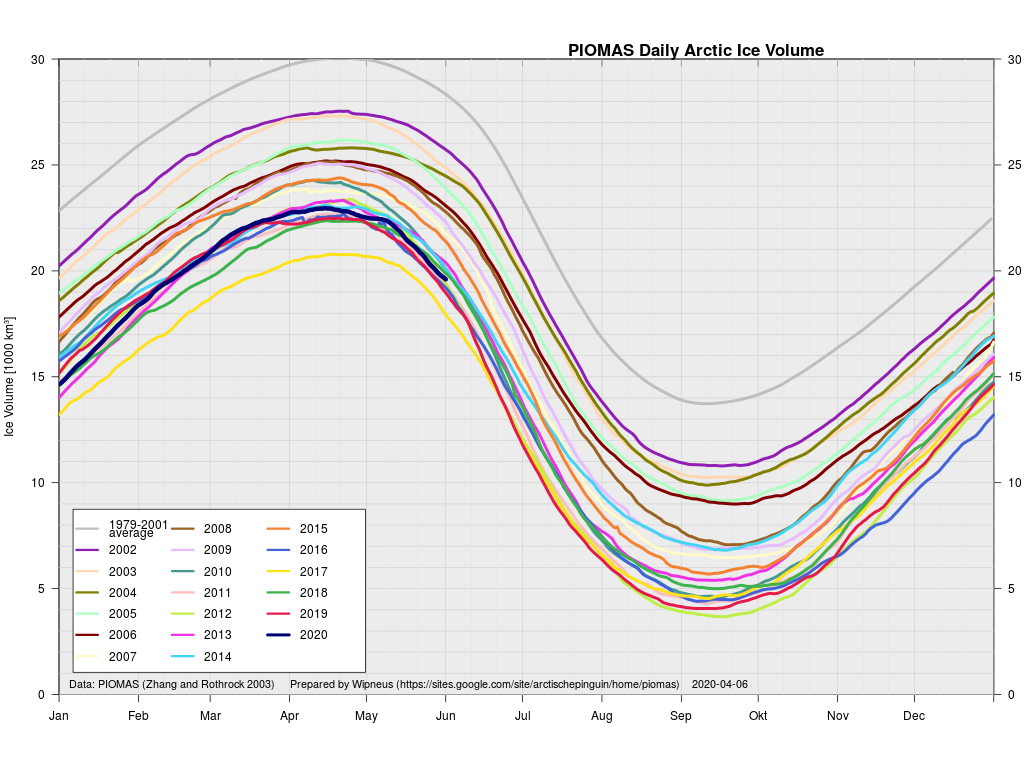
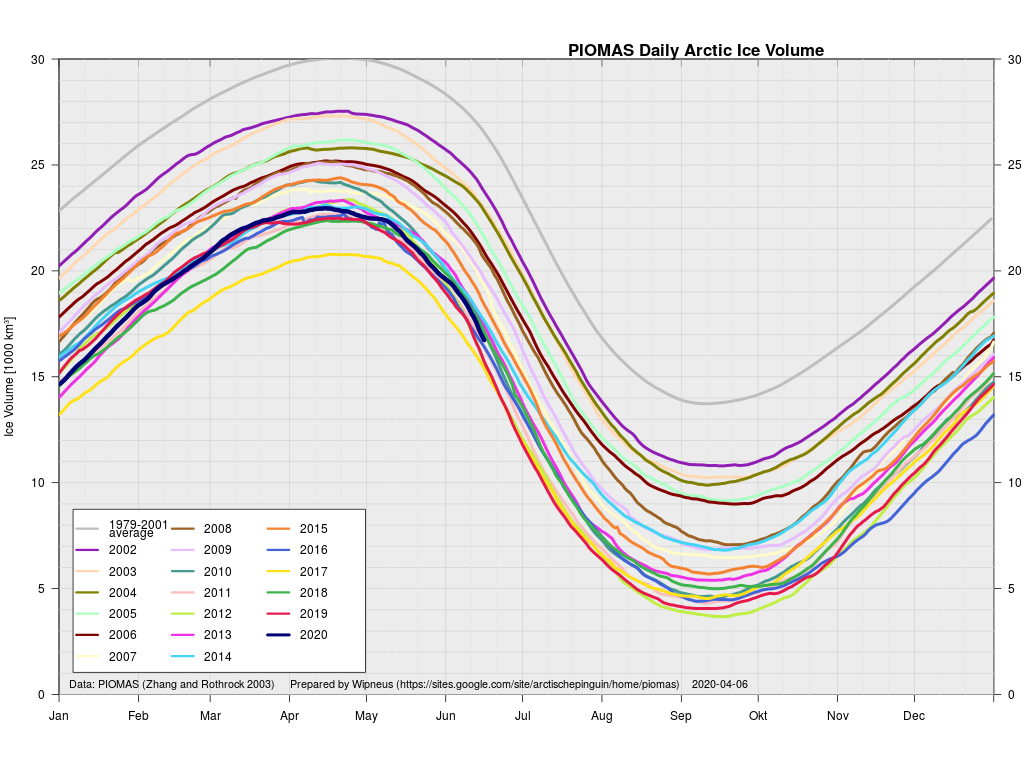
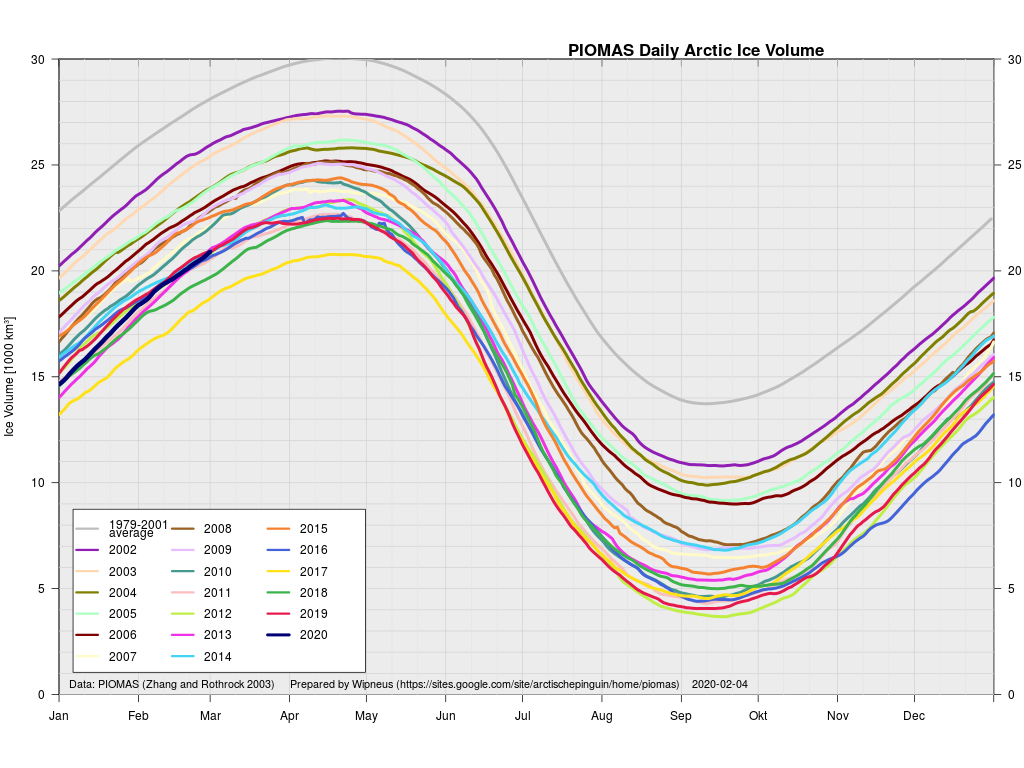
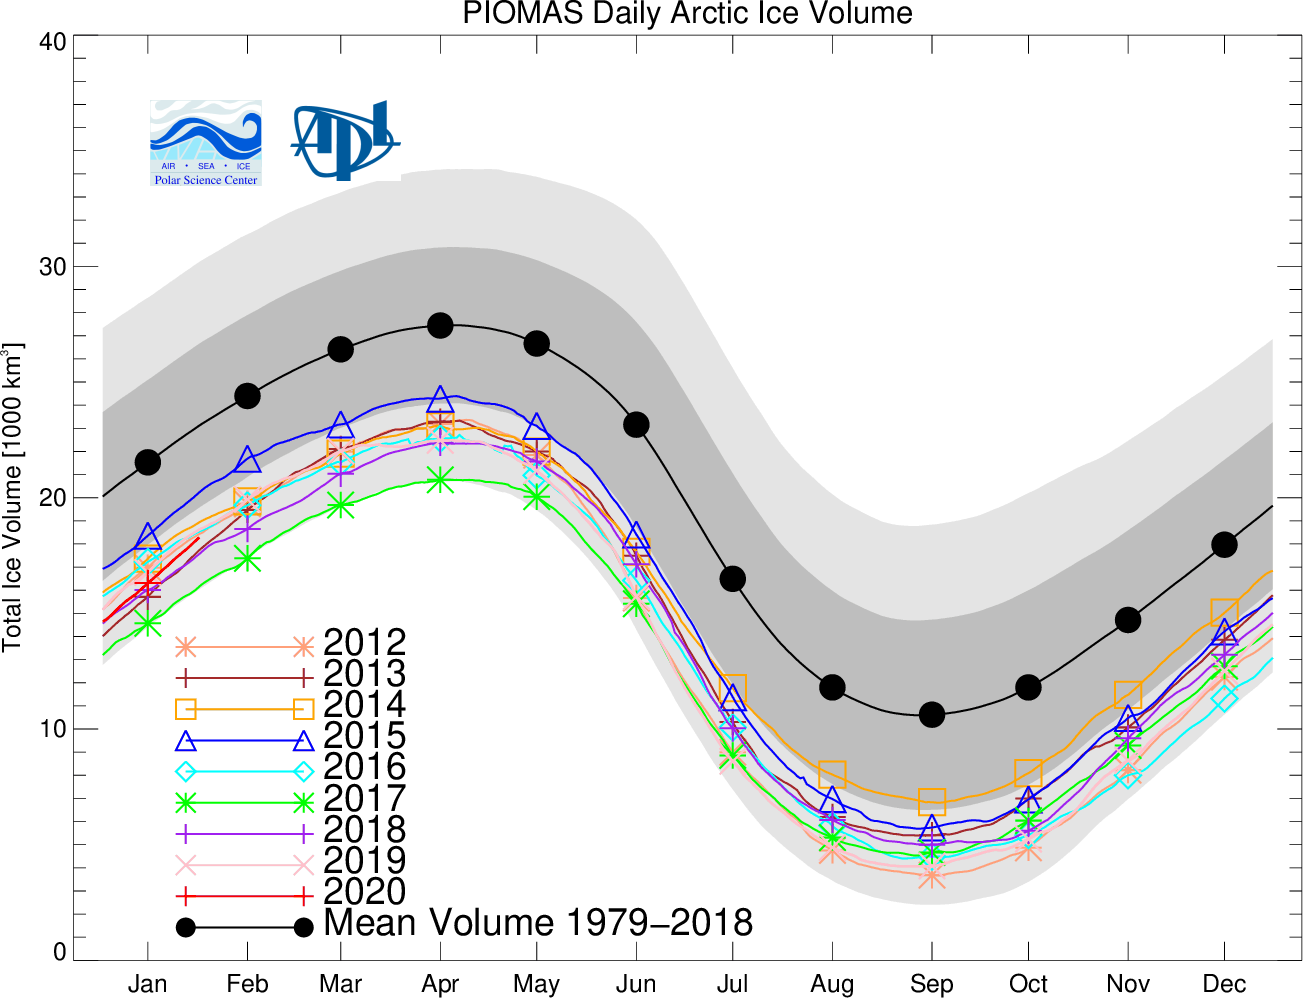
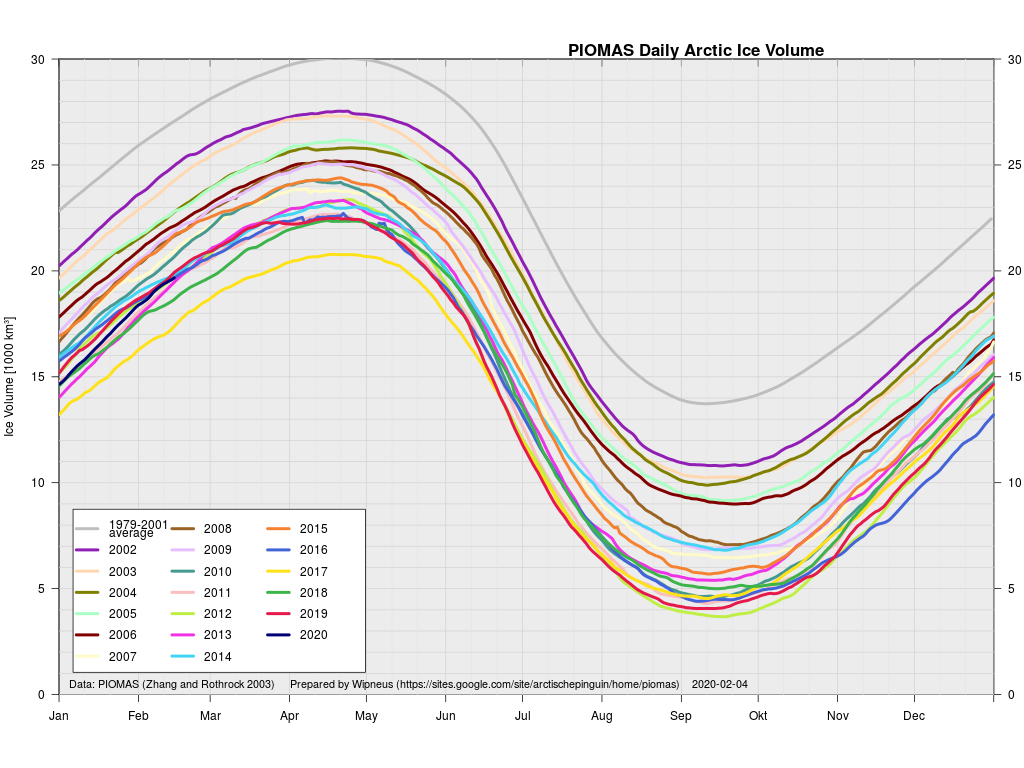
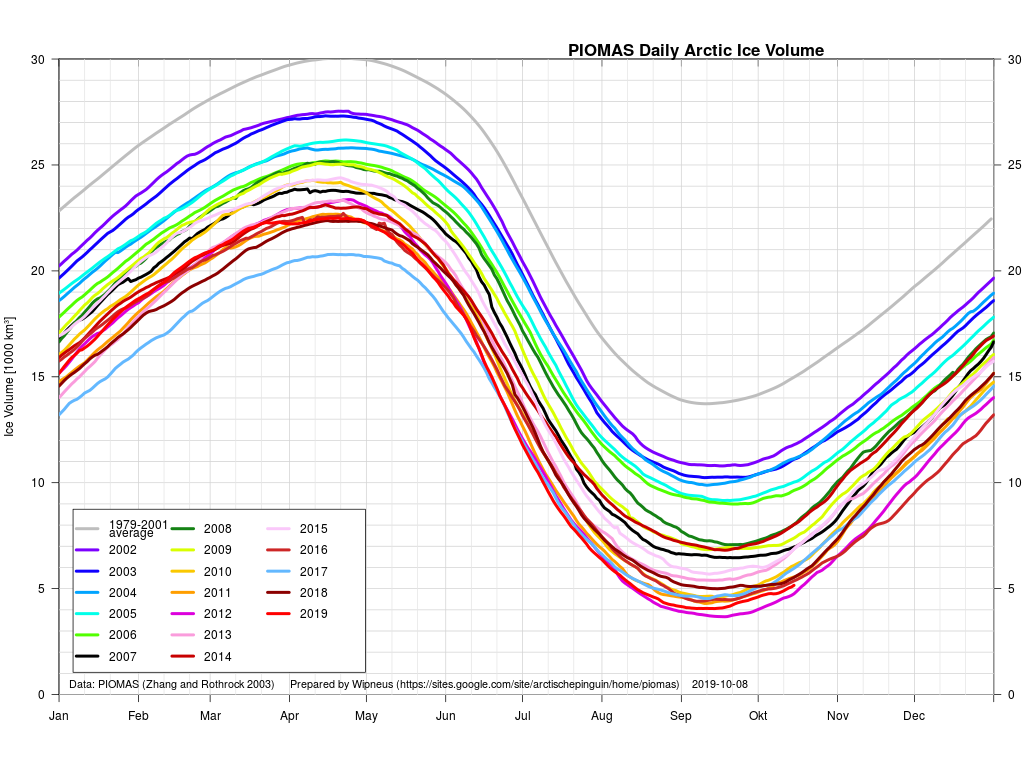
plus the traditional modelled volume graph:

As angech has pointed out elsewhere, according to the PIOMAS team:

CryoSat-2 data show total volume for February 2020 substantially lower than PIOMAS with 2020 Febuary near record low levels over the 2011-2020 period

[Edit – March 19th]

The March mid month PIOMAS numbers have been crunched by Wipneus. Here’s how things look at the moment:

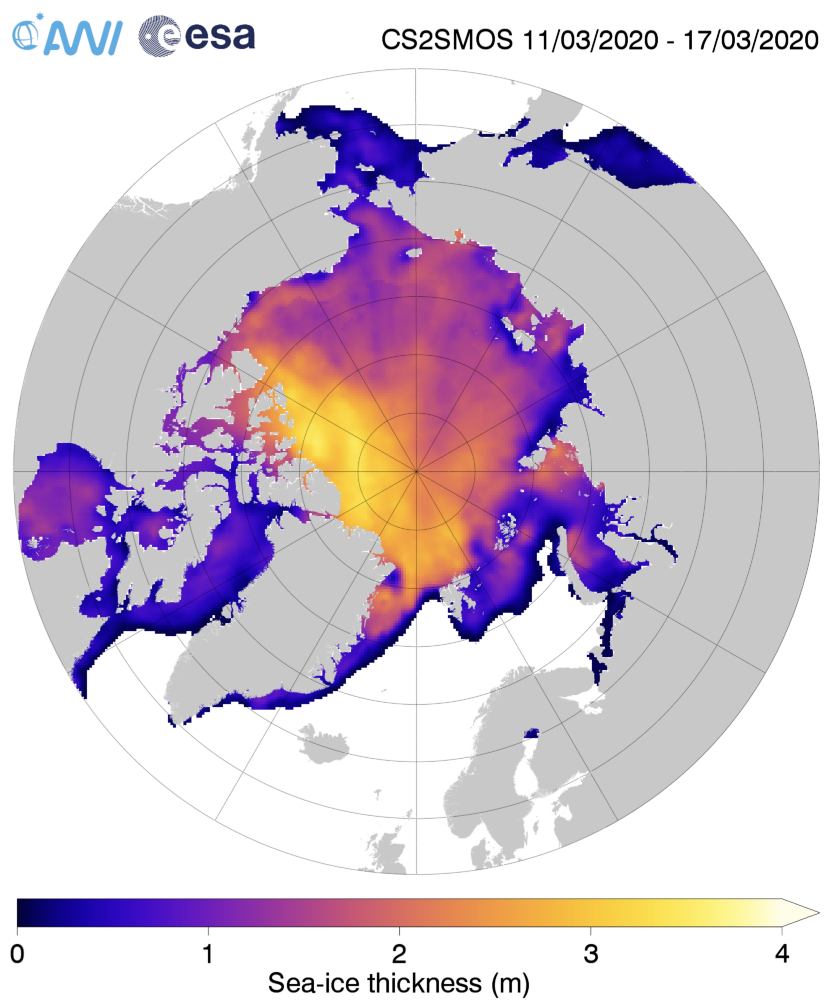
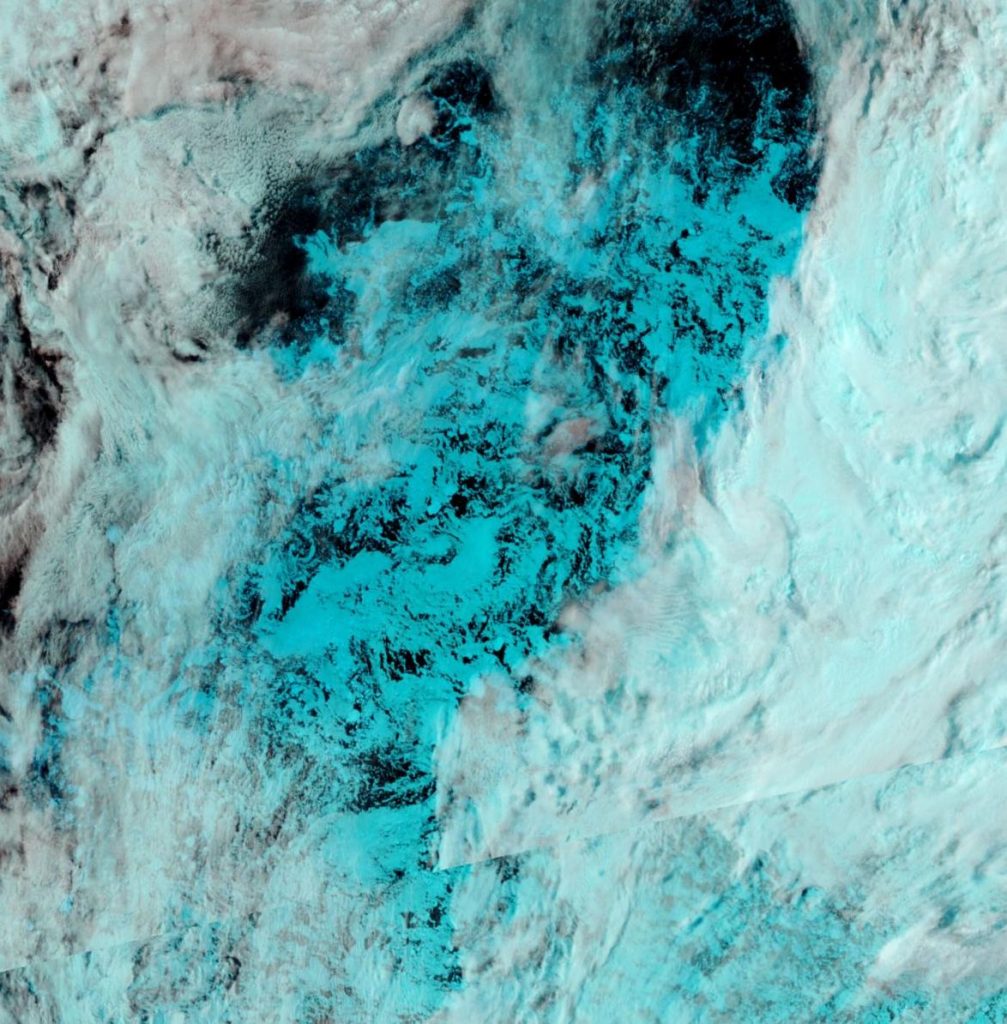
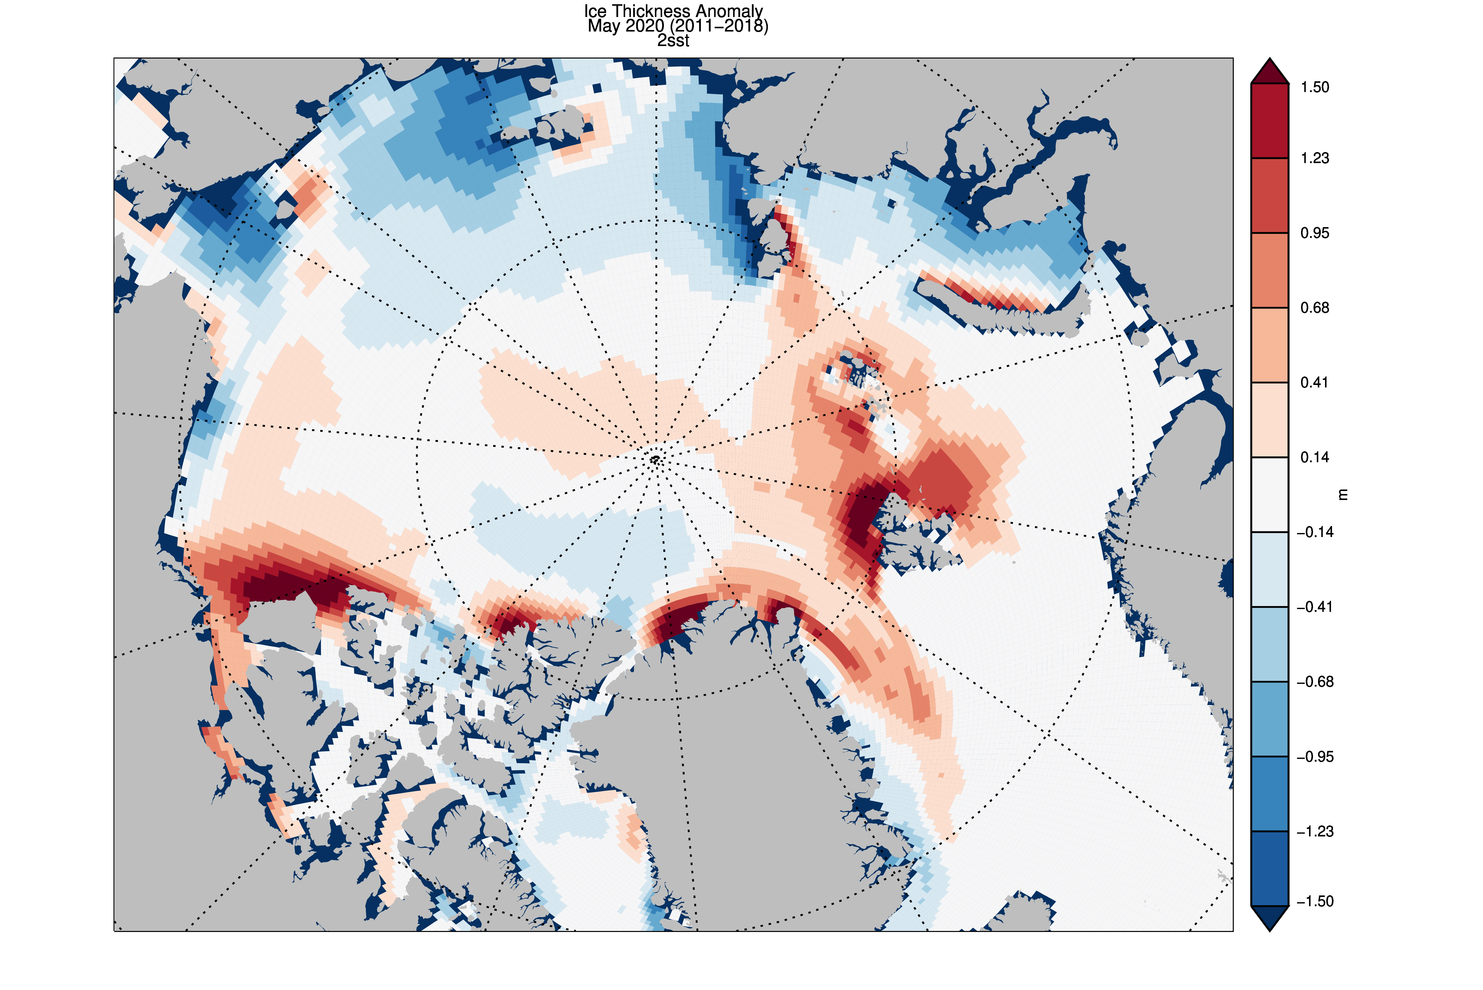
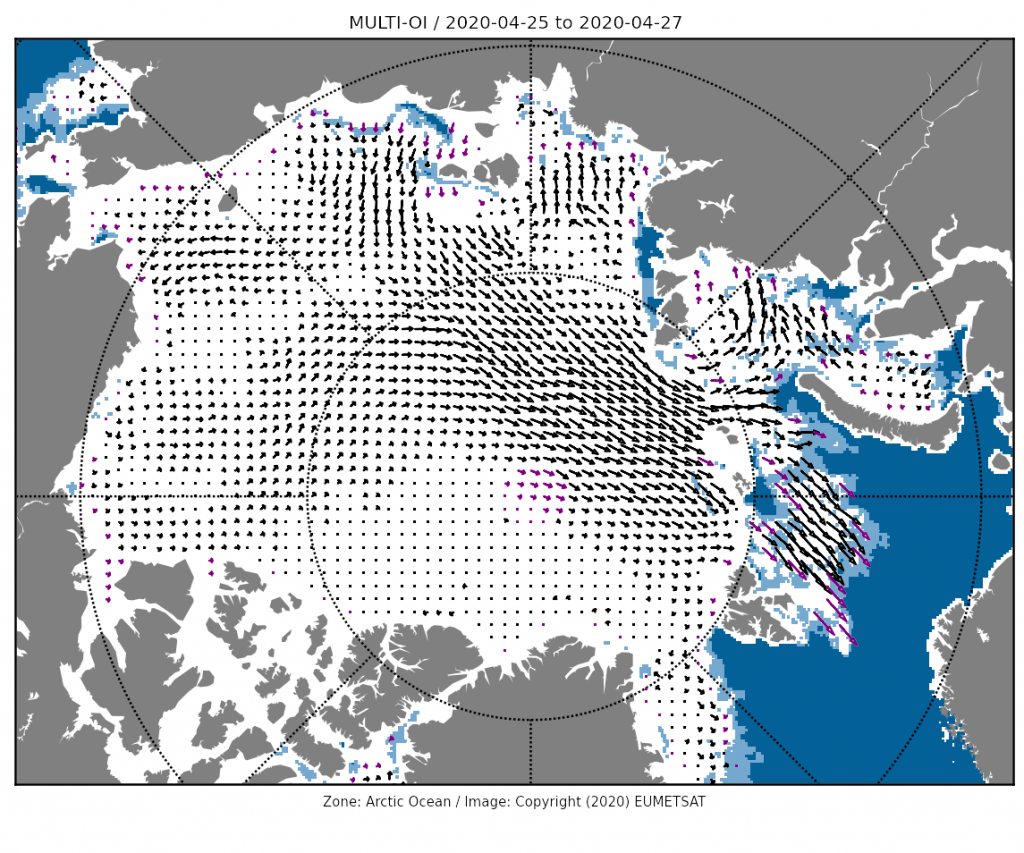
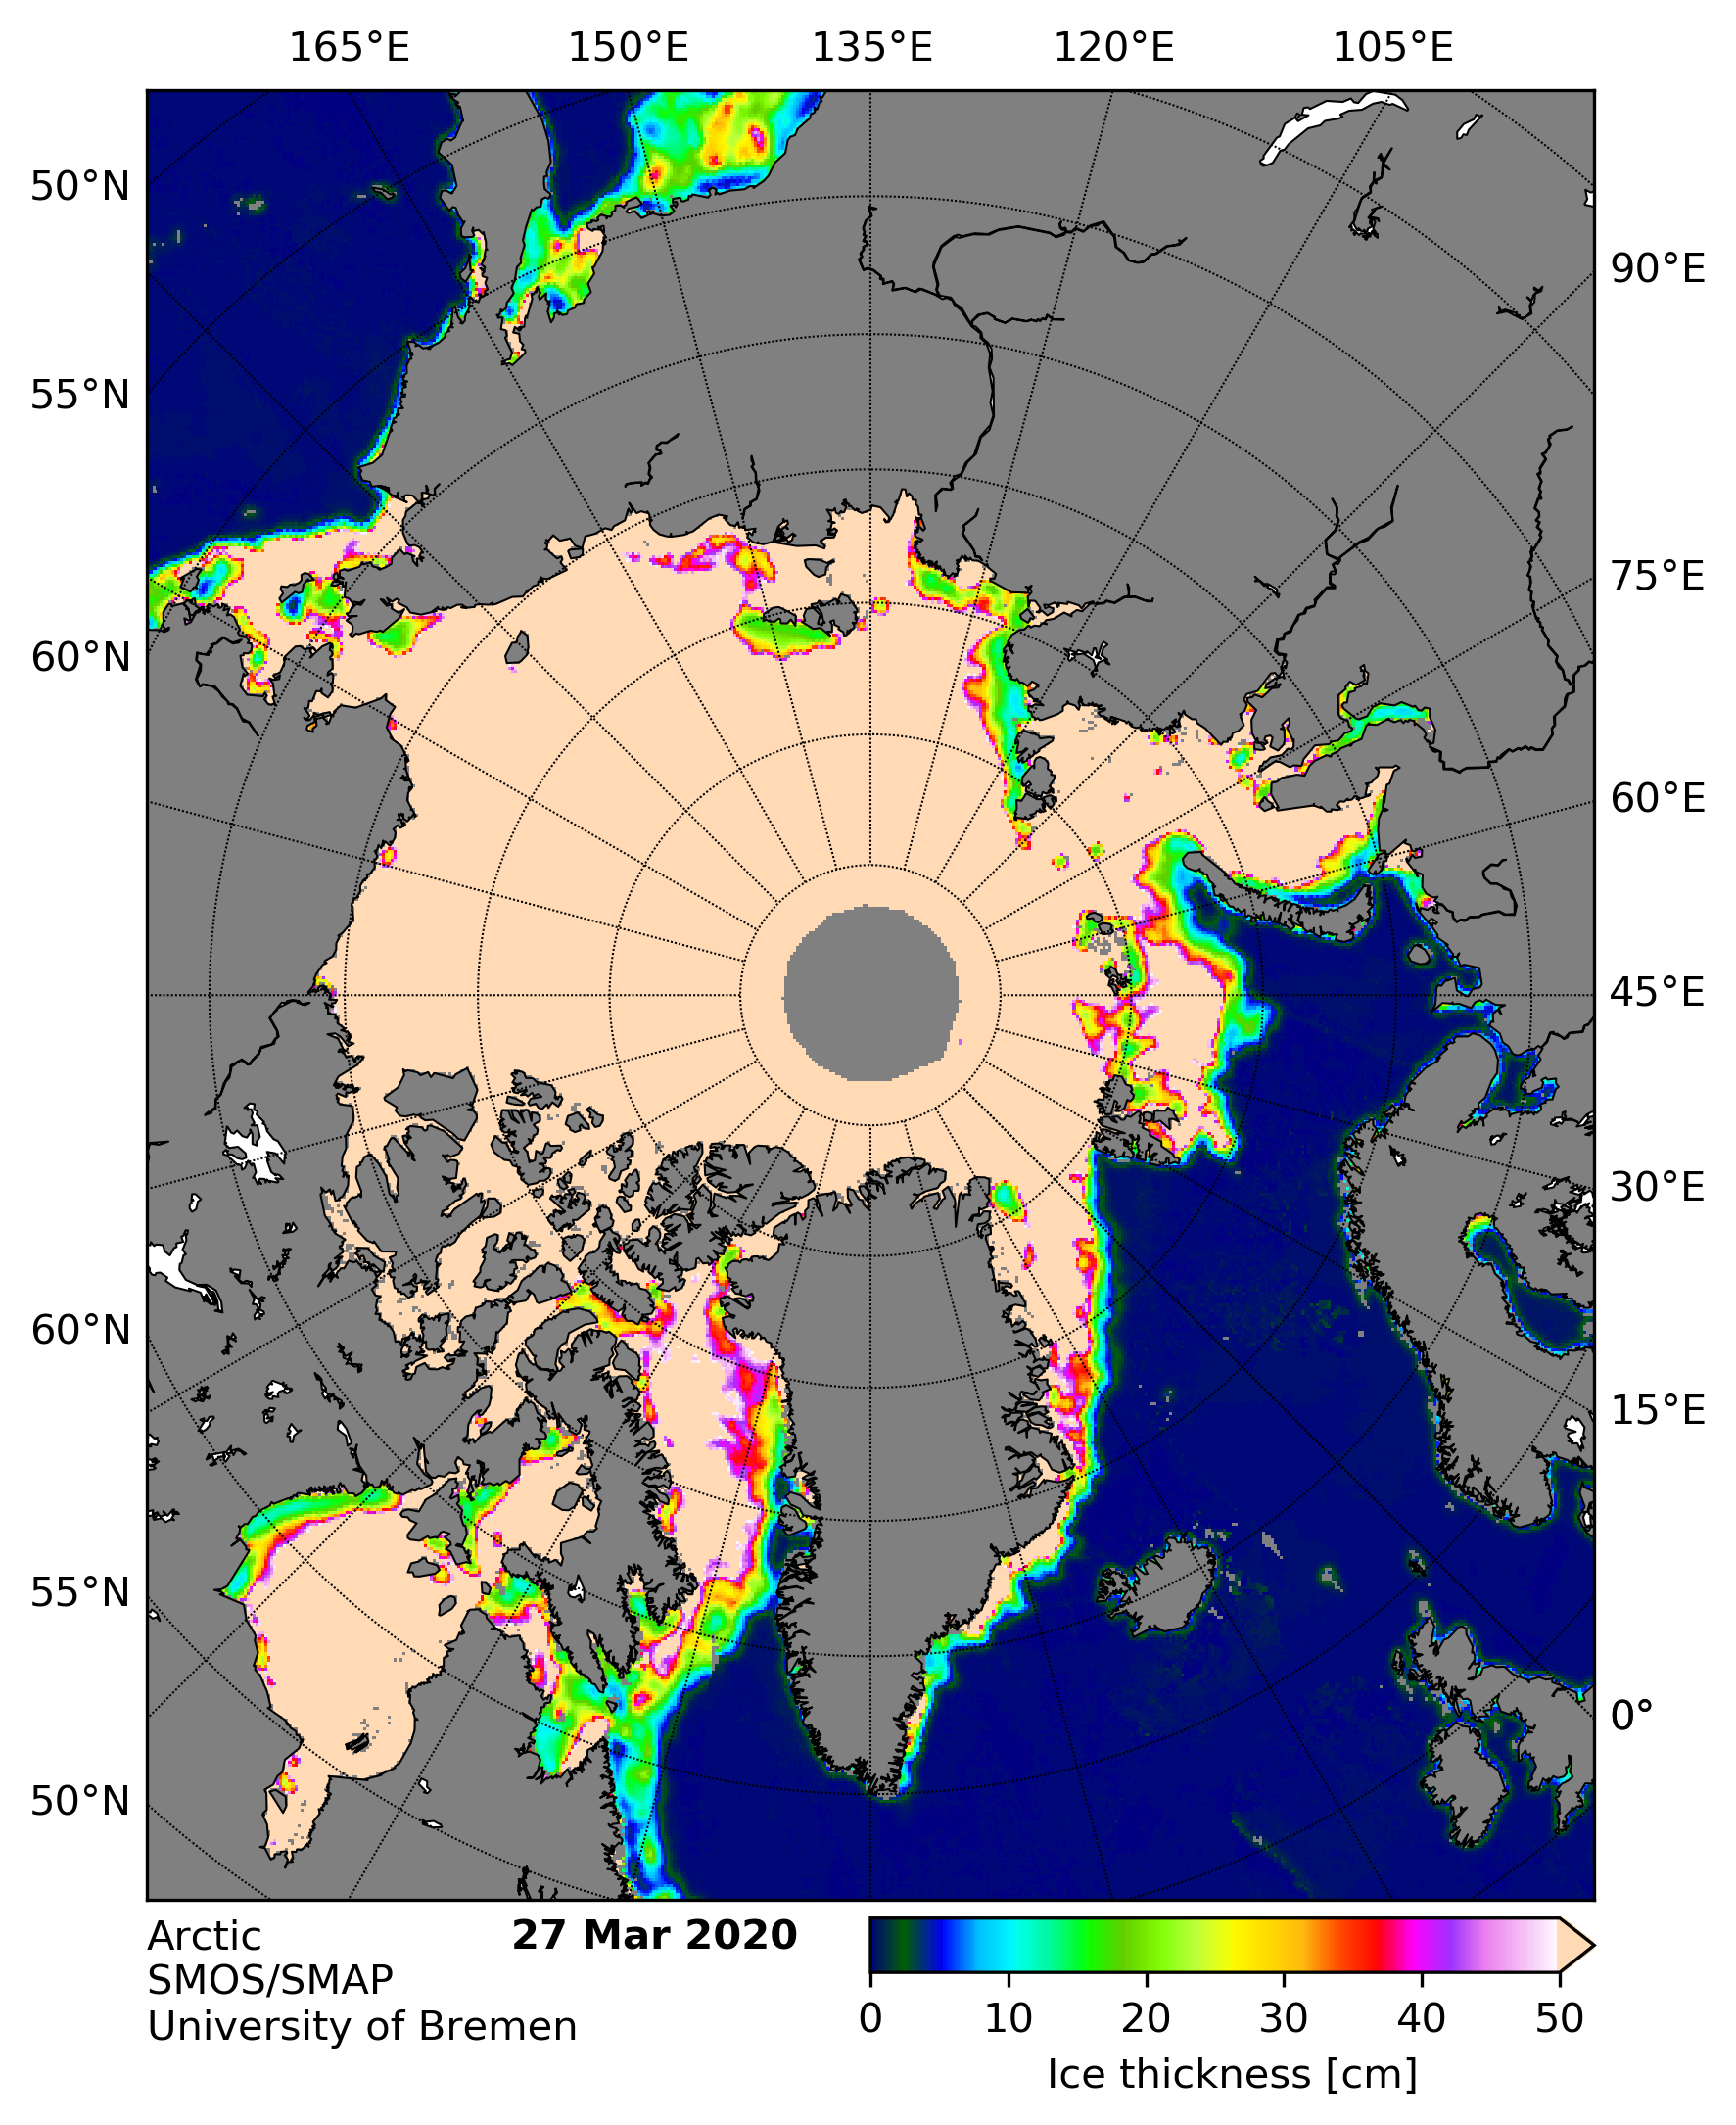
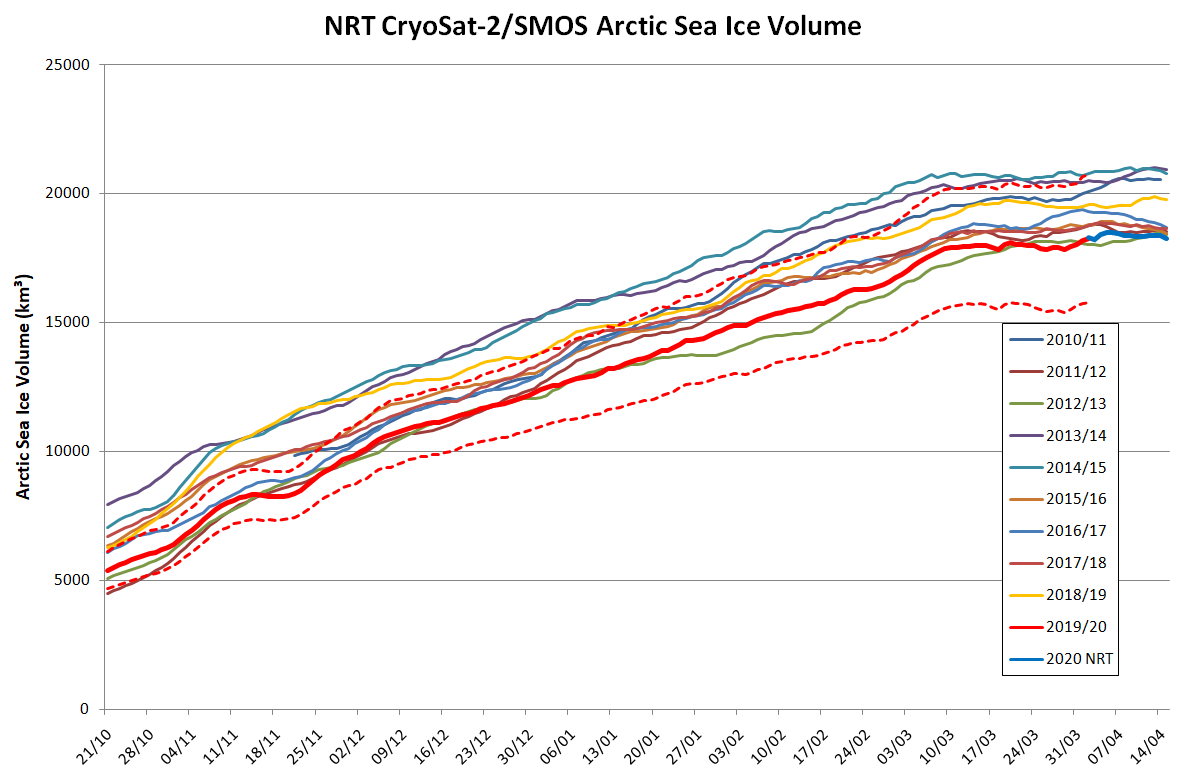
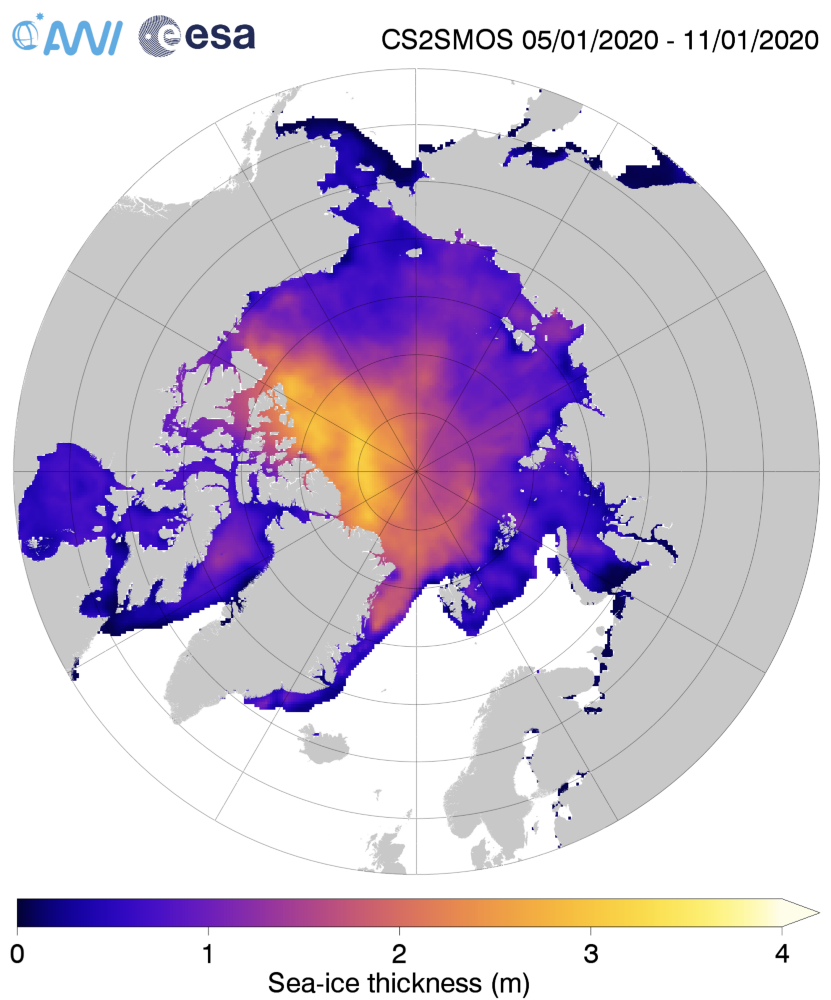
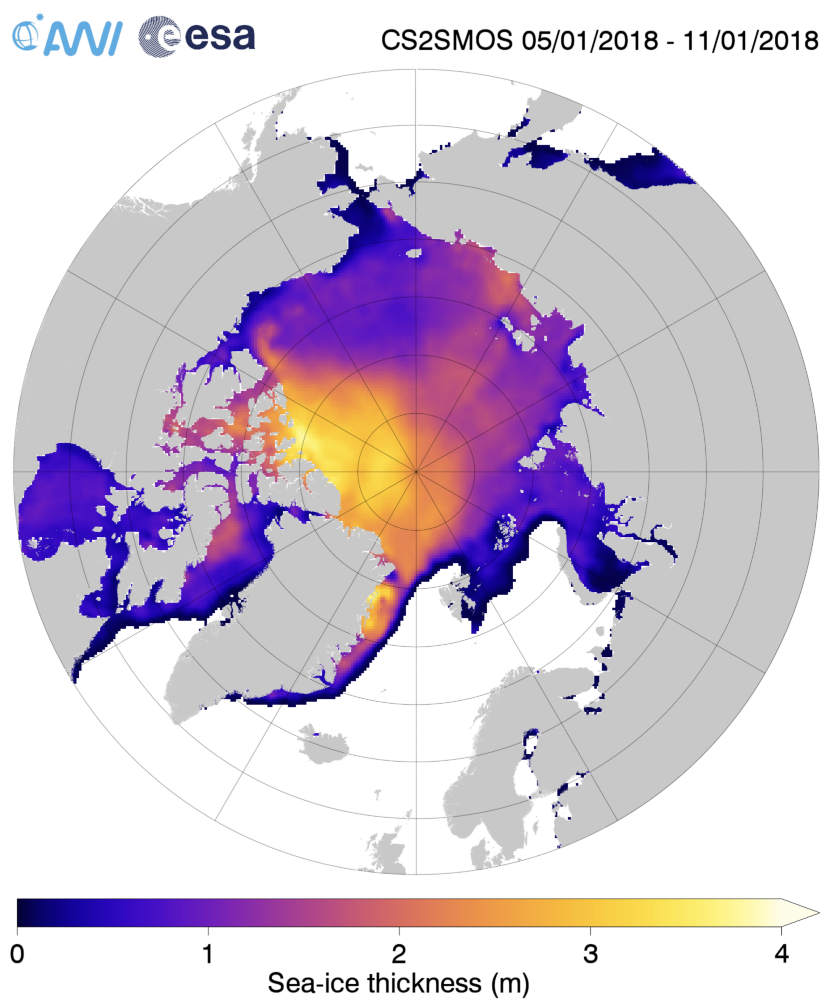
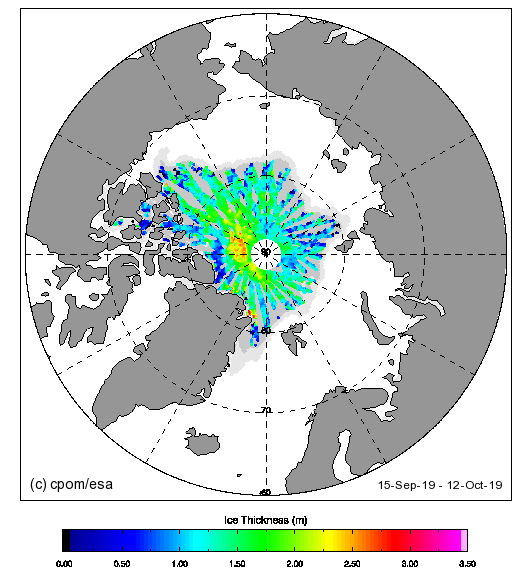
For comparison purposes here’s the current CryoSat-2/SMOS Arctic sea ice thickness map:

[Edit – March 20th]

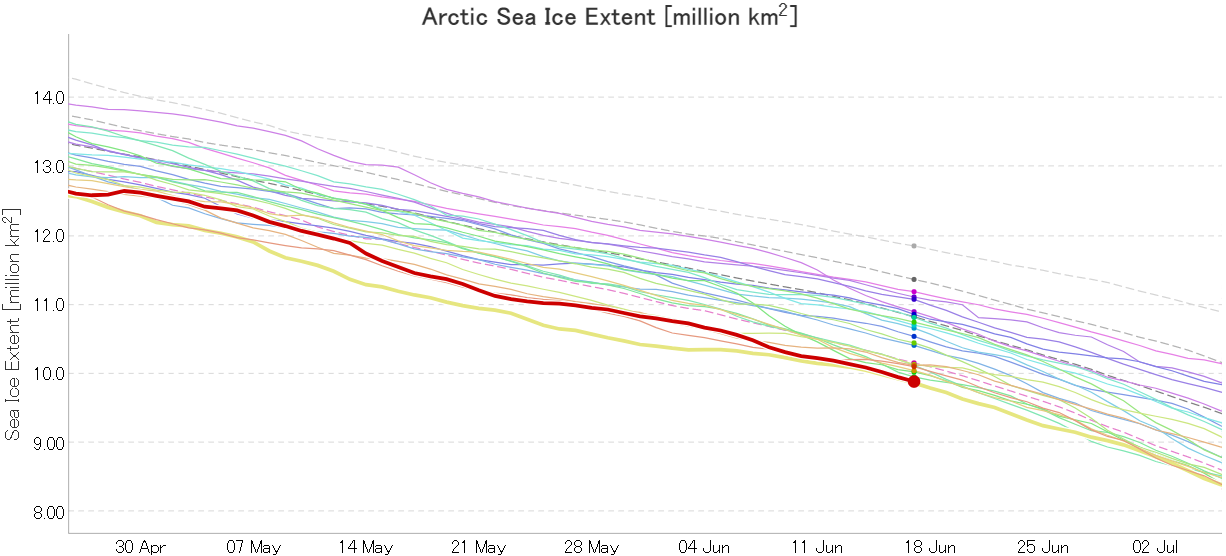
After flatlining for a long time JAXA extent has posted significant declines for two days running. There’s been no official announcement from the NSIDC as yet, but it now seems safe to conclude that there won’t be a late surge in extent similar to 2010. Here’s the current JAXA graph:

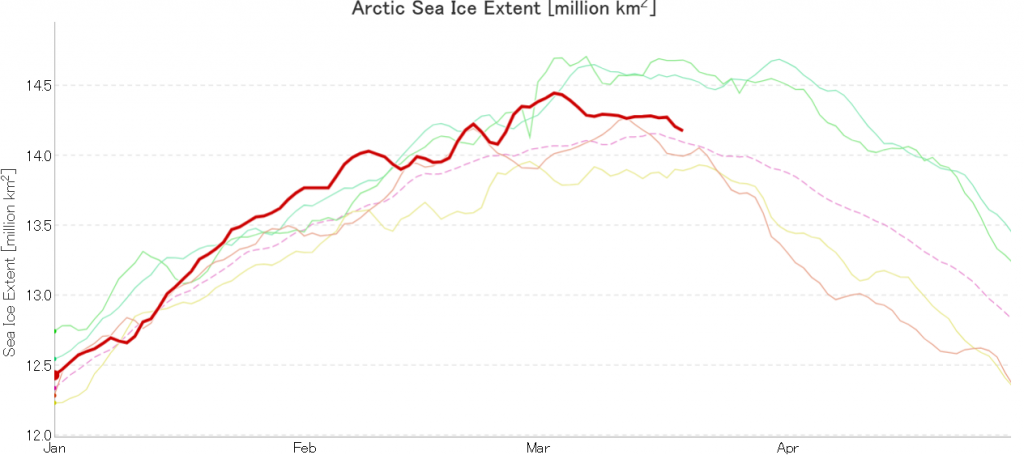
plus NSIDC’s 5 day averaged extent:

Hence the (still provisional!) maximum numbers for 2020 are:

JAXA/VISHOP AMSR2 – 14.45 million square kilometres on March 3rd
NSIDC 5 day SSMIS – 15.05 million square kilometres on March 5th

The University of Hamburg’s JAXA AMSR2 concentration data seems to have suffered an outage over the crucial period. Hopefully the gaps will be filled in due course. However more recent regional graphs  reveal the following:

The recent declines in overall extent are evidently driven by declines on the Pacific periphery.

Where’s the Thickest Arctic Sea Ice Gone?

In the absence of the usual mid month PIOMAS Arctic sea ice volume update I’m being moaned at by “angech” over on Judith Curry’s “Climate Etc.” blog:

Any ideas on why PIOMAS mid month update not out, other than not wanting to show a big recovery?

Unlike any of Judy’s denizens I checked out the comparatively new merged CryoSat-2 plus SMOS thickness maps from the Alfred Wegener Institute. “Measured” rather than “modelled” data must be a good thing surely?

Just in case there’s some significant difference between the “reanalysis” and “operational” versions of that product, here is the AWI’s most recent reanalysed Arctic sea ice thickness map, for the week ending January 11th:

together with the same date from the previous two years:

Make sure to take a close look at the white areas north of Greenland and the Canadian Arctic Archipelago showing sea ice over 4 metres thick.

Over the winter of 2018/19 ASCAT revealed that there was a relentless movement of multi-year ice towards both the North Atlantic and the Beaufort Sea.

Not unexpectedly that meant that ice in the northern Barents Sea was slow to melt out in the summer of 2019:

whilst after a fast start the melt in the Beaufort Sea also suffered a “brief hiatus” in June before ultimately melting out almost completely as well:

Perhaps a significant amount of the multi-year ice that survived the winter of 2018/19 has now simply melted away in warm water, to be replaced by much less robust first year ice in the area between the North Pole and the Siberian coast? It will be very interesting to see what the next PIOMAS update in early February reveals.

[Edit – February 4th]

The next PIOMAS update referred to above has now arrived. Here’s the Polar Science Center’s graph:

Over on Climate Etc. angech is already exclaiming:

Strange it did go up a fair bit the old PIOMAS.
No publicity at the usual going down sites.

Actually it’s not at all strange, because thus far this winter the polar vortex has been remarkably well behaved. By and large cold air air has stayed in the Arctic. There hasn’t been much in the way of cold air intrusions into mid latitudes or warm air intrusions into the Arctic.

Hence it’s not at all surprising that the thickness of sea ice in the Arctic has been increasing slightly more quickly this winter than in other recent years. By way of some longer term context, here are the official Polar Science Center min/max trends:

[Edit – February 4th PM]

Wipneus has just released the January PIOMAS gridded thickness map. Here it is:

[Edit – February 5th]

As is all too frequently the case, AdR and other commenters below get very excited about trivial increases in sea ice extent without considering snow extent. One side effect of the lack of cold air outbreaks into mid latitudes so far this winter currently looks like this:

[Edit – February 6th]

The AWI and PIOMAS sea ice thickness maps above look somewhat different at first glance. That being the case, I’ve written a program to crunch the AWI numbers. Here’s the result:

The source code plus raw and processed data can be accessed via the Arctic Sea Ice Forum:

CryoSat-2/SMOS Arctic Sea Ice Volume

[Edit – February 10th]

Further support for my “polar vortex” theory, from Judah Cohen no less!

[Edit – February 16th]

Here’s the latest update of our novel NRT volume metric:

Please note that there is a known problem with the NRT data from January 31st onwards.

Here too are Wipneus’ latest high resolution AMSR2 area and extent graphs:

[Edit – February 18th]

Wipneus has released his usual mid month PIOMAS update on the Arctic Sea Ice Forum:

I am forced to ponder once again why the CryoSat-2/SMOS thickness “measured” numbers just above seem to be more at variance with PIOMAS in 2020 than in previous years:

[Edit – February 22nd]

Here’s another weekly NRT volume update:

This time I’ve left off the NRT data from February 6th onwards, since the “issue” referred to above obviously hasn’t been solved yet. As an added bonus here’s a graph showing the trends (or lack thereof) on 3 dates during the October to April freezing season:

Watts Up With Arctic Sea Ice Thickness?

Regular readers will no doubt recall that I have previously been “banned” on trumped up charges at the “Watts Up With That” blog. It thus came as a pleasant surprise when I recently popped back there and tried to pass comment on a “reprint” of an article by Professor Byron Sharp in Medium entitled “How I changed my mind… about global warming“:

Most, if not all, people would consider themselves to be open-minded. Yet, if you ask someone to name an important belief that they have changed their mind about, in response to evidence and/or logic, most struggle to give even one example.

This is the first in a series of blogs where I describe how and why I changed my mind about something. I hope to encourage myself to change my mind more often. And to encourage others.

Short summary: I now worry less about global warming than I did, the scientific evidence is that it’s not going to be catastrophic. PS Our best course of action is to adapt to the effects and to invest in R&D to develop new low carbon energy.

My initial comments survived the onerous WUWT moderation process and several of them were published without undue delay. The gist of my argument was quite simple:

I even managed to comment when somebody introduced the word “thickness” into the discussion:

Needless to say my good fortune couldn’t last forever, and eventually Anthony himself was on my case:

My request for an explanation has thus far been ignored:

How “unfortunate” it is then, that a couple of days after my “banning” on yet more trumped up charges WUWT published an article by David Middleton entitled “Back to the Anthropocene! Arctic Sea Ice Edition”, telling a familiar tale:

Two key takeaways:

  1. Maximum Holocene sea ice extent occurred within the past 500-1,000 years at every location.
  2. The current sea ice extent is higher at all of the locations than over 50% to 85% of the Holocene.

A significant reduction in Arctic summer sea ice relative to today, would be returning to Early Holocene conditions. If we currently have an “Anthropocene in the Arctic,” it’s actually icier than most of the Holocene’s “Goldilocks conditions.”

David’s article once again neglected to mention Arctic sea ice thickness and/or volume. My plaintive cries were made in vain:


Amongst other things my recent “banning” from Watts Up With That means I am unable to ask David the same question my Arctic alter ego “Snow White” recently put to Down Under’s favourite skeptical senator, Malcolm Roberts:

Malcolm hasn’t bothered to answer as yet.

Quod Erat Demonstrandum?

Facts About the Arctic in October 2019

Whilst we await the PIOMAS volume numbers which generally arrive around the 5th of each month, and before we look at graphs of extent, with the refreeze well under way some “measured” thickness maps are coming back! Here’s the first SMOS map this autumn:

Then of course there’s our usual Arctic wide high resolution AMSR2 area and extent graphs:

They reveal both metrics currently still second lowest (in the brief AMSR2 record) after 2012. It looks as though that may well change soon, particularly area.

The MOSAiC Expedition has started in earnest, with Polarstern and Akademik Fedorov in amongst the sea ice at long last:

However:

[Edit – October 3rd]

The near real time NSIDC monthly extent for September is 4.32 million km². Here’s the graph:

We’re eagerly awaiting the first ice mass balance buoy “near real time” data, but for now the 2019 PIOMAS minimum volume is expected to be revealed real soon now, so:

[Edit – October 5th]

As previously perfectly predicted, the PIOMAS numbers have arrived over at the ASIF. Here’s the thickness map for the end of September:

and the volume graph:

Since I’m involved is a heated “debate” about Arctic sea ice trends over at ex Prof. Judy’s, here’s an added bonus this month. The September volume trend:

[Edit – October 6th]

A marginally off topic excursion down under. The NSIDC 5 day average Antarctic sea extent looks to have peaked at 18.40 million km² on September 30th:

[Edit – October 7th]

The first of the MOSAiC Expedition’s Ice Mass Balance buoys has been installed, presumably on the ice floe Polarstern is moored to. It reveals sea ice that is currently just over 1 meter thick with a sprinkling of snow on top:

P.S MOSAiC IMB buoy #3 has gone live today too:

There’s currently only 0.5 meters of ice under this one.

[Edit – October 9th]

Here’s the latest annual PIOMAS “ice cube” animation from Andy Lee Robinson:

[Edit – October 10th]

Here’s the latest DMI “high Arctic” temperature graph:

Needless to say that means the DMI Freezing Degrees Days graph is tracking the lowest readings in the DMI’s records:

[Edit – October 11th]

MOSAiC IMB buoy #2 has now been installed and is beaming back data:

The sea ice at this location is decidedly on the thin side at present. A mere 20 cm or thereabouts!

[Edit – October 12th]

The JAXA ViSHOP web site is down at the moment, so by way of a change here is the University of Bremen’s AMSR2 based extent graph instead:

2019 Arctic sea ice is extent is now once again “lowest for the date” (since AMSRx satellite records began).

[Edit – October 14th]

The JAXA/ADS/ViSHOP web site is back online after being down over the weekend, presumably due to the effects of Typhoon Hagibis:

Sure enough the Japanese flavour of AMSR2 based extent is also now “lowest for the date”.

Plus a stunning image from Mike Horn and Borge Ousland as they attempt to “walk” to the North Pole then on towards Svalbard:

Mike and Borge’s current position was reported yesterday as: 89°35′51″N 140°30′32″E

[Edit – October 15th]

The latest SMOS Arctic sea ice “thinness” map shows sea ice starting to form on the shores of the Laptev Sea:

[Edit – October 16th]

The Centre for Polar Observation and Monitoring (CPOM) have just published the first CryoSat-2 Arctic sea ice thickness map of the 2019/20 freezing season:

Note in particular the dark blue area north of the Canadian Arctic Archipelago.

[Edit – October 20th]

Wipneus has just crunched the October mid month PIOMAS numbers. Here are the results. Not only the modelled Arctic sea ice thickness map:

but also the Arctic sea ice volume graph:

[Edit – October 21st]

Over on Twitter Judah Cohen suggests that:

Here’s the evidence:

I have been trying to bring the implications of this to the attention of the denizens of Judith Curry’s “Climate Etc.” blog, thus far with remarkably little success! This is the gist of my argument:

See:

Warming of the interior Arctic Ocean linked to sea ice losses at the basin margins” Mary-Louise Timmermans, John Toole, Richard Krishfield (2018)

“Summer solar heat absorption by the surface waters has increased fivefold over the same time period, chiefly because of reduced sea ice coverage.”

“The effects of an efficient local ice-albedo feedback are thus not confined to the surface ocean/sea ice heat budget but, in addition, lead to increased heat accumulation in the ocean interior that has consequences far beyond the summer season.”

“In the coming years, however, excess Beaufort Gyre halocline heat will give rise to enhanced upward heat fluxes year-round, creating compound effects on the system by slowing winter sea ice growth.”

Watch this space!

The 2019 Arctic Sea Ice Metric Minima

September is here once again, so the assorted minima of a variety of Arctic sea ice metrics will be reached soon, if they haven’t happened already!

In the latter category let’s first take a look at the NSIDC’s 5 day averaged SSMIS based Arctic sea ice extent:

It looks entirely feasible that the current minimum of  4.29 million square kilometres on September 7th will hold for the rest of the calendar year. The daily NSIDC number is currently 4.24 million km² on September 4th.

By way of contrast the JAXA/ViSHOP AMSR2 based extent hit a new low of  4.11 million  km² yesterday:

And what of our much beloved high resolution AMSR2 metrics derived by “Wipneus” from the University of Hamburg’s AMSR2 concentration data? Area certainly looks to be past the minimum for this year, whereas extent is still conceivably capable of another push lower:

The provisional minimum extent for 2019 is 3.80 million km² on September 3rd.

The minimum Arctic sea ice volume generally occurs slightly later than area or extent. The data certainly arrives later! Here’s the PIOMAS graph up to August 31st:

and here’s the associated thickness map:

Note that Arctic wide modelled volume is only slightly higher than in 2012 at the same time of year, but there is a noticeably greater percentage gap in extent. That implies that average ice thickness across the Arctic is lower in 2019 than in 2012.

Note also that the thickest ice is no longer located along the north coasts of Greenland and the Canadian Arctic Archipelago. Here are the equivalent maps for previous years for comparison purposes:

Perhaps JAXA extent will head still lower over the next few days? Perhaps PIOMAS volume will sneak below 2012 before the peripheral refreeze begins?

[Edit – September 13th]

JAXA Arctic sea ice extent has reached a new minimum of 4.09 million km².

NSIDC daily extent is currently 4.28 million km², still just above the September 4th minimum.

[Edit – September 14th]

JAXA Arctic sea ice extent has reached a new minimum of 4.05 million km², which now puts it below the 2007 minimum that occurred somewhat later in September:

[Edit – September 14th PM]

NSIDC 5 day averaged extent has also (by a whisker!) reached a new minimum for the year of 4.285 million km²:

The daily number fell to 4.21 million km².

[Edit – September 15th]

I have somewhat belatedly discovered that in the build up to the forthcoming MOSAiC Expedition the Alfred Wegener Institute recently announced  that:

The sea-ice extent in the Arctic is nearing its annual minimum at the end of the melt season in September. Only circa 3.9 million square kilometres of the Arctic Ocean are covered by sea ice any more, according to researchers from the Alfred Wegener Institute and the University of Bremen. This is only the second time that the annual minimum has dropped below four million square kilometres since satellite measurements began in 1979.

[Edit – September 16th]

JAXA/ViSHOP extent has dropped below the 2016 minimum, and now measures 4.01 million km²:

Only 2012 left to beat!

Wipneus’ high resolution AMSR2 extent has also posted a new low for the year, but still has a little way to go before passing 2016:

Area is also currently declining, but is still well away from a new minimum for 2019:

[Edit – September 19th]

After some more modest declines JAXA/ViSHOP extent has just increased marginally from the previous day, and now measures 3.98 million km²:

That puts the (very!) tentative minimum for 2019 at 3.96 million km² on September 17th.

[Edit – September 20th]

The mid month PIOMAS gridded thickness and volume numbers have been released:

As anticipated given recent extent values, the volume difference from 2012 has increased somewhat over the last two weeks.

[Edit – September 23rd]

The National Snow and Ice Data Center have called the 2019 minimum in their latest edition of Arctic Sea Ice News:

On September 18, 2019, sea ice extent dropped to 4.15 million square kilometers (1.60 million square miles), effectively tied for the second lowest minimum in the satellite record along with 2007 and 2016. This appears to be the lowest extent of the year. In response to the setting sun and falling temperatures, ice extent will begin increasing through autumn and winter. However, a shift in wind patterns or a period of late season melt could still push the ice extent lower.

[Edit – September 24th]

To summarise the assorted minimum extent metrics for 2019:

University of Bremen – 3.77 million km² on September 18th, 2nd lowest behind 2012.
JAXA/ViSHOP – 3.96 million km² on September 17th, “Statistical tie” with 2016 for 2nd lowest.
NSIDC 1 day – 4.10 million km² on September 17th, “Statistical tie” with 2016 for 2nd lowest.
NSIDC 5 day – 4.15 million km² on September 18th, 2nd lowest behind 2012.

[Edit – October 1st]

Two sides of the same coin? Sea ice area on the Pacific side of the Arctic has been at historic lows for most of the melting season:

whereas on the Atlantic side:

[Edit – October 7th]
The September monthly numbers have arrived from the NSIDC, together with some intriguing annotations by Walt Meier:

Watch this space. Just in case!

Facts About the Arctic in July 2019

The June PIOMAS Arctic sea ice gridded thickness numbers have been released. Here once again is Wipneus’ visualisation thereof:

The Arctic wide volume graph does not make a pretty sight:

The recent rapid rate of decline has continued through the second half of June and PIOMAS modelled volume is now lowest for the date in the Polar Science Center’s records.

The various methods of measuring Arctic sea ice thickness don’t produce meaningful results during the summer, so let’s move on to area and extent. Arctic wide high resolution AMSR2 area and extent remain “lowest for the date”, although it currently looks as though 2016 may regain that dubious honour in the near future:

Confining the view to the Arctic Basin there is no doubt that 2019’s position will not be in doubt for quite some time:

The apparent discrepancy is explained by taking a closer look at the Atlantic side of the Arctic:

Some of the thicker ice that has continued to be exported from the central Arctic in the direction of the North Atlantic is surviving there, for the moment at least.

Watch this space!

Facts About the Arctic in October 2018

A somewhat belated start to our October 2018 coverage, but firstly please take a look at this graph:

VISHOP_Extent_20181020

Following a remarkably sluggish refreeze this year JAXA extent is currently the lowest for the date since their records began. Meanwhile Wipneus has just released his mid month PIOMAS volume update on the Arctic Sea Ice Forum:

piomas-trnd4-2018-10-20

That graph reveals that Arctic sea ice volume has been increasing much more slowly than usual during October. The fact that the DMI freezing degree days graph is currently below all previous years in their records no doubt has something to do with that:

DMI-FDD-2018-10-20

Wipneus has also updated the mid month PIOMAS gridded thickness map:

PIOMAS-20181015

That’s the output of a model of course, but here too is the CPOM version of CryoSat-2 “measured” thickness:

Both sources agree that there’s a remarkable lack of thick ice in the Wandel Sea off north east Greenland this Autumn.

For a handle on the areas of thinner ice where refreezing is taking place around the periphery of the pack, here’s the latest SMOS map:

Finally, for the moment at least, here’s our favourite high resolution AMSR2 area and extent metrics based on JAXA data processed by the University of Hamburg to produced gridded concentration which is then used to derive area and extent by the inimitable Wipneus once again:

UH-Arctic-Area-2018-10-20

UH-Arctic-Extent-2018-10-20


[Edit – October 28th]

Here’s the latest thickness maps from SMOS:

and CryoSat-2:

There’s been a recent rapid refreeze, leaving large areas of thin ice around the edges of the central pack: