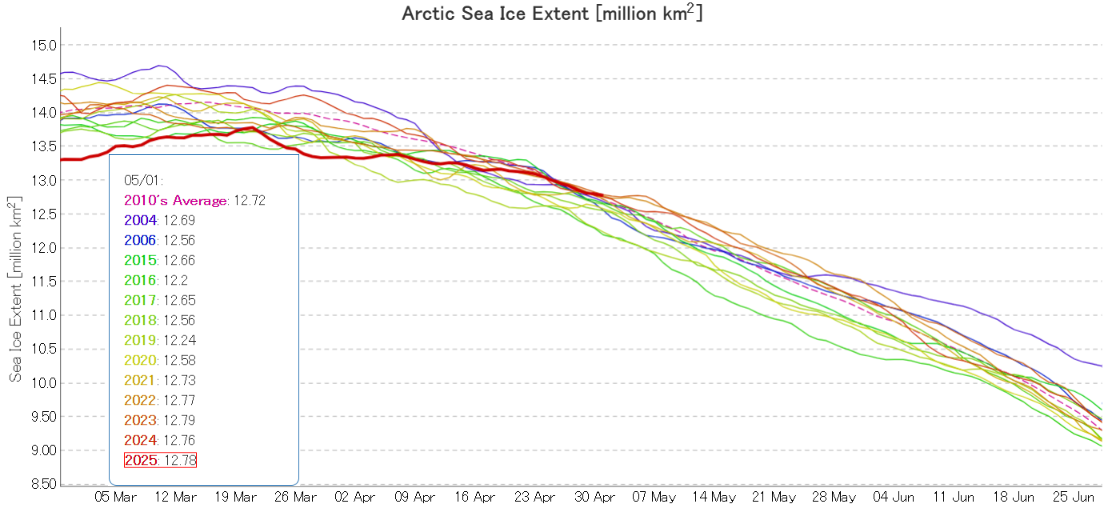
JAXA/ViSHOP extent is no longer “lowest for the date”! After “flatlining” for most of April the metric is now in the midst of a close knit group of the other years in the 2020s:
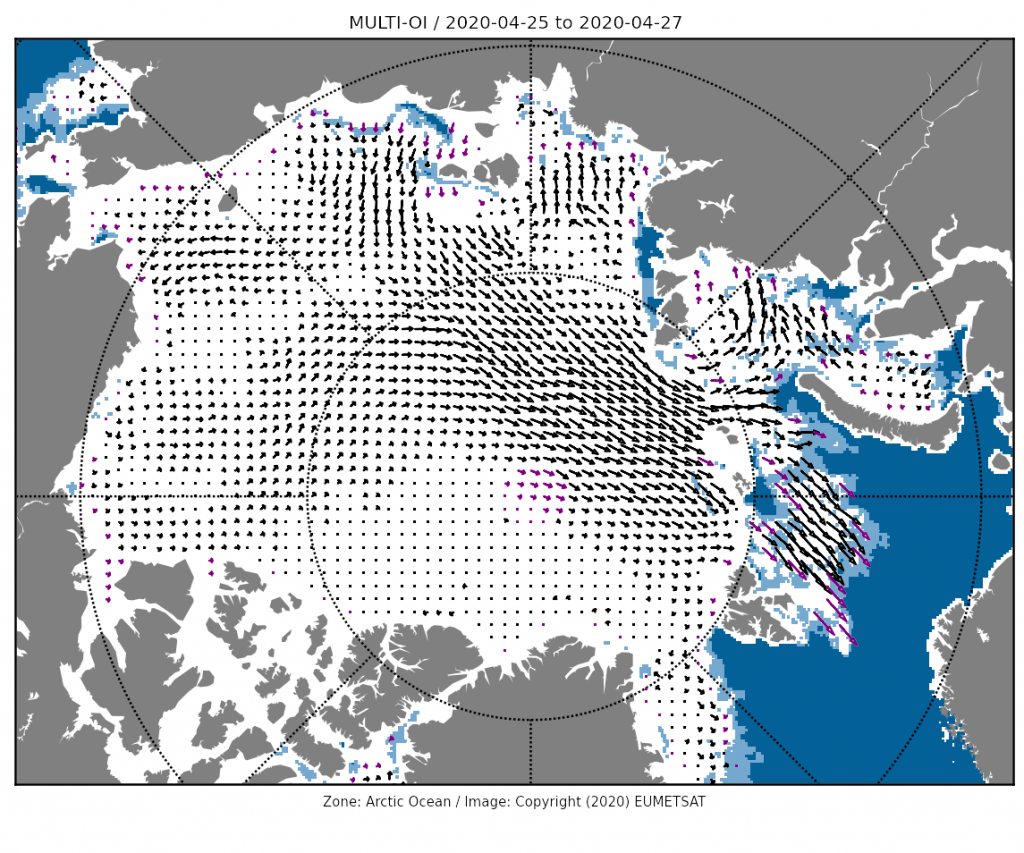
The high pressure area over the Central Arctic persisted through the second half of April, and so did the consequent drift of ice from the Pacific side of the Arctic to the Atlantic periphery:
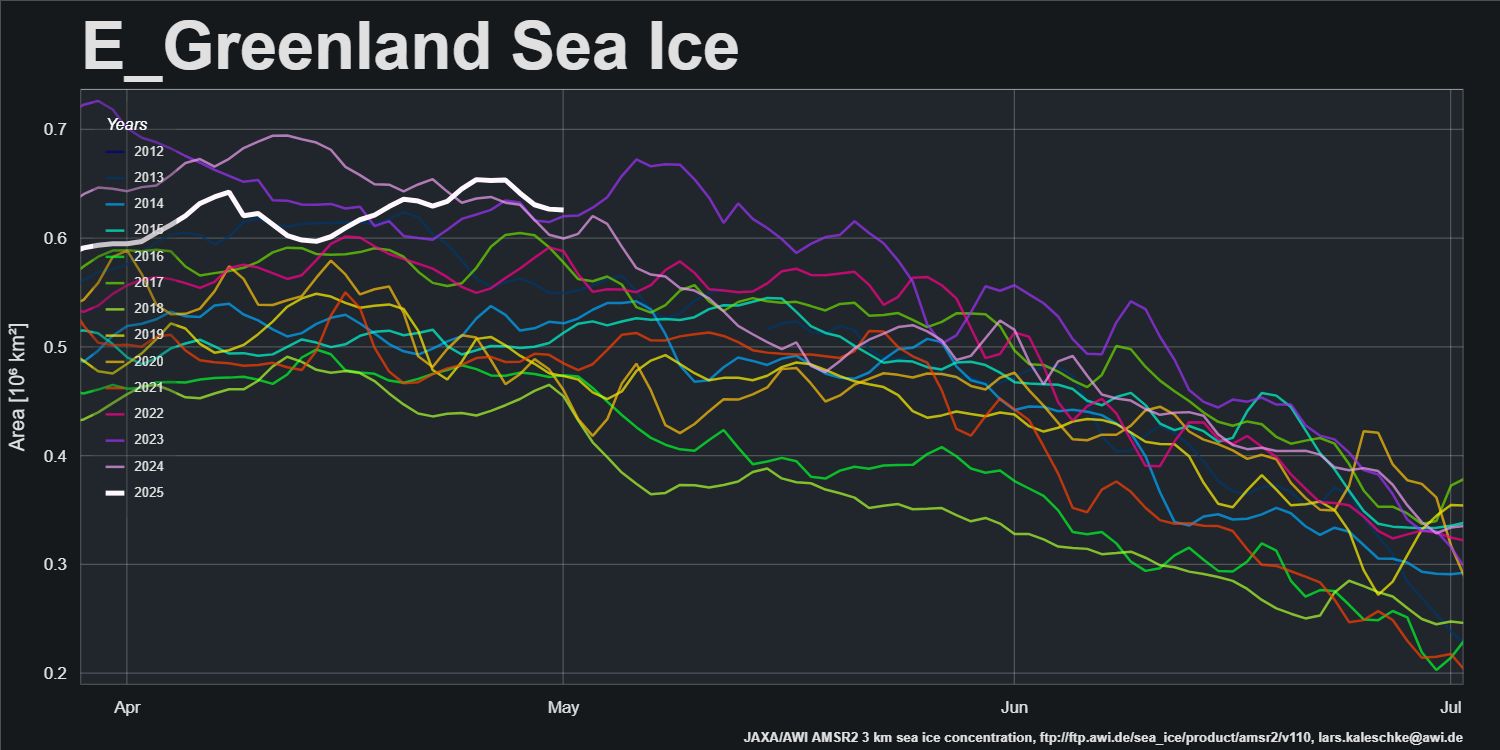
AWI’s sea ice area for the Greenland Sea is currently “highest for the date” in the AMSR2 record that started in July 2012:
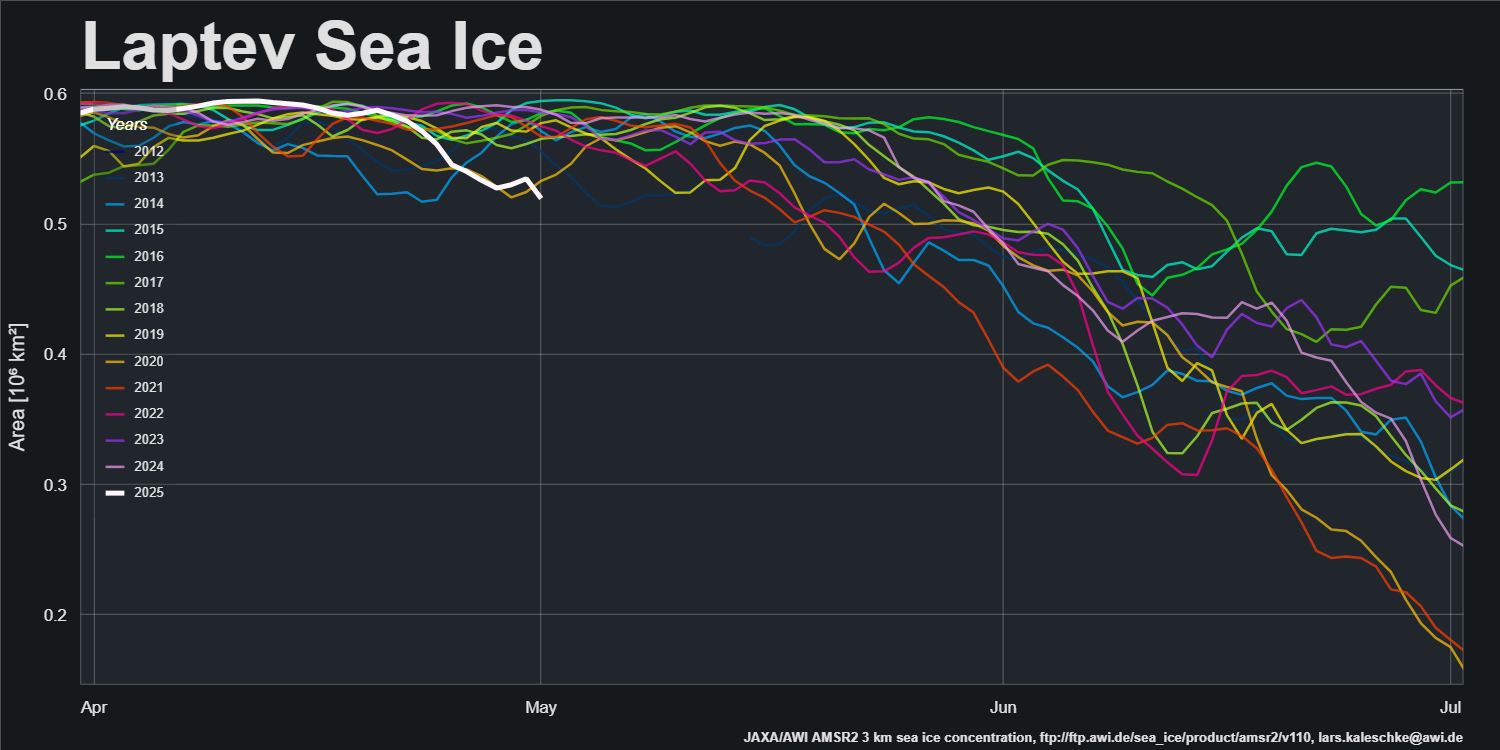
The offshore winds along the Laptev Sea coast have continued, and sea ice area is now “lowest for the date”:
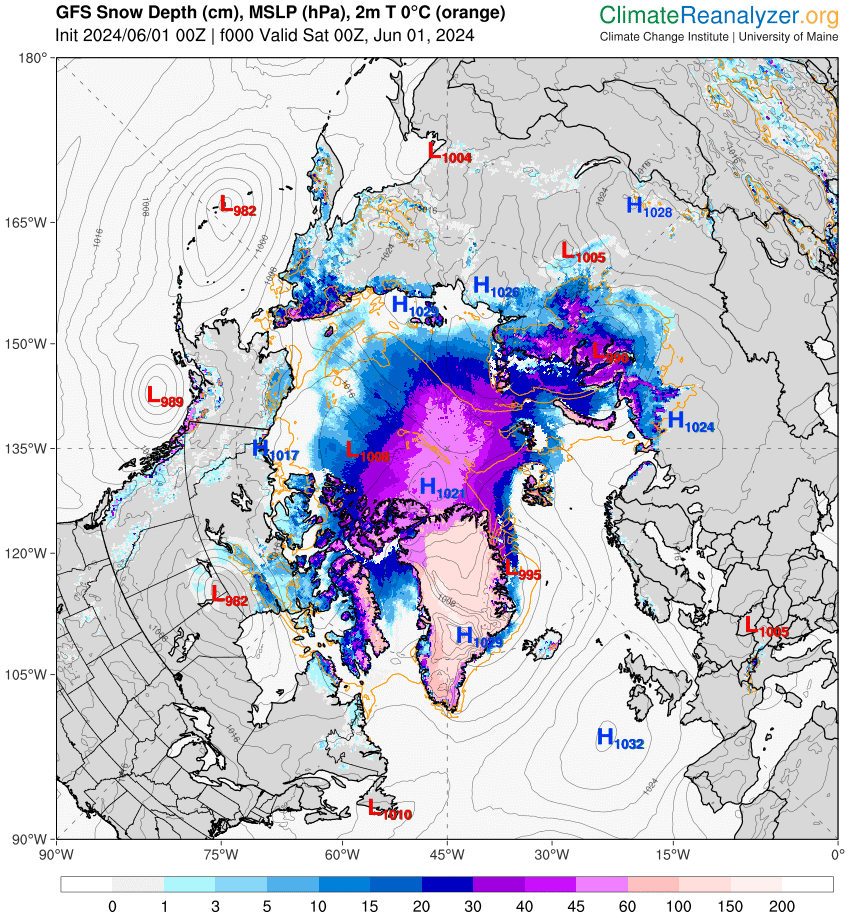
The first signs of a break in the high pressure dominance are appearing. GFS currently forecasts that a low pressure area will enter the Central Arctic, bring above zero temperatures over the Kara Sea on Sunday:
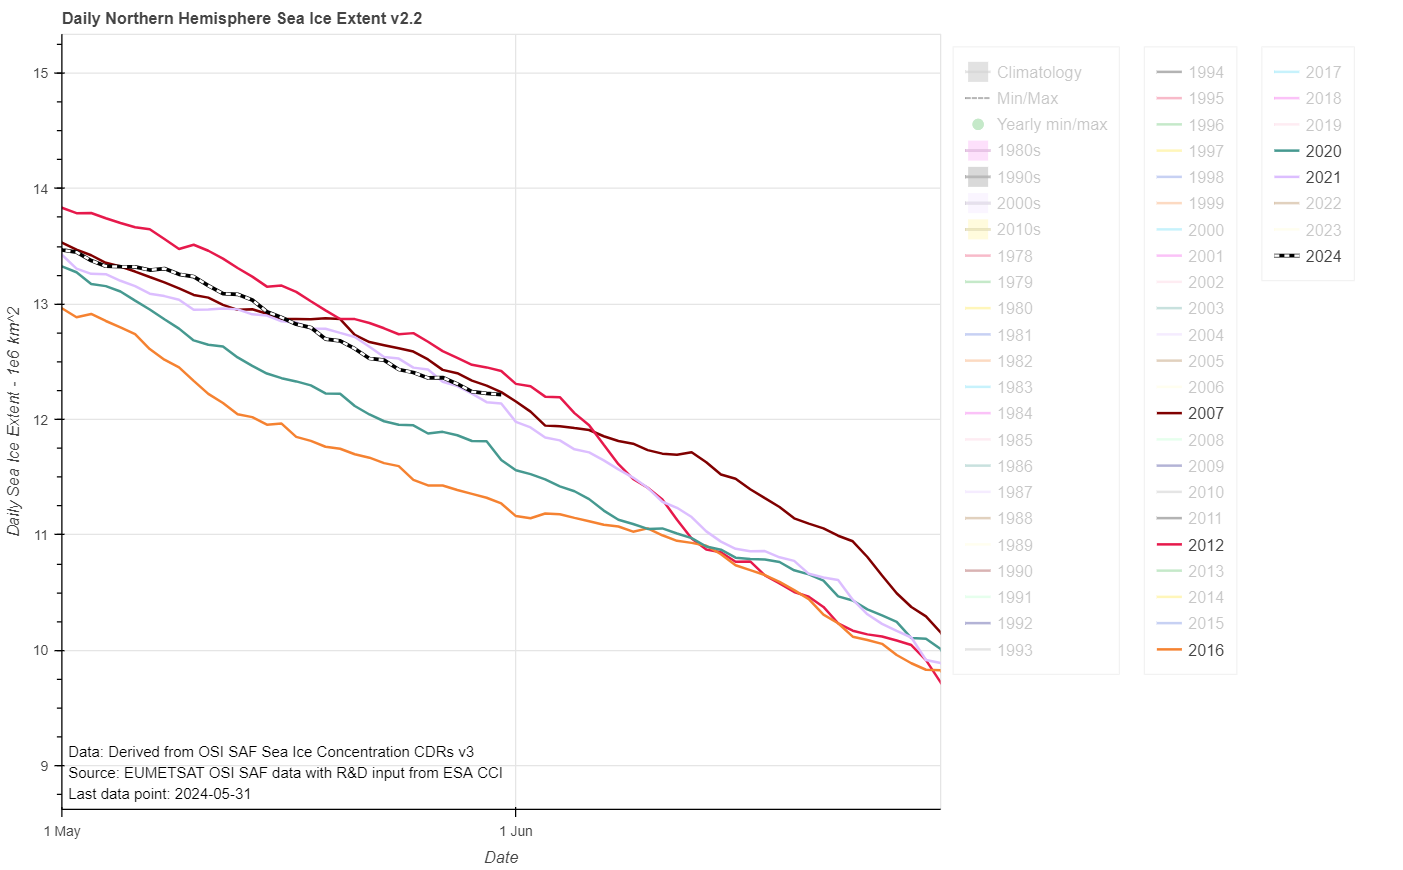
The JAXA/ViSHOP web site is currently down, so here is the current OSI SAF extent graph for the end of May:
2012’s “June cliff” is almost upon us, and if 2024’s current trajectory continues extent will cross above 2012 for the first time since February in a week or so.
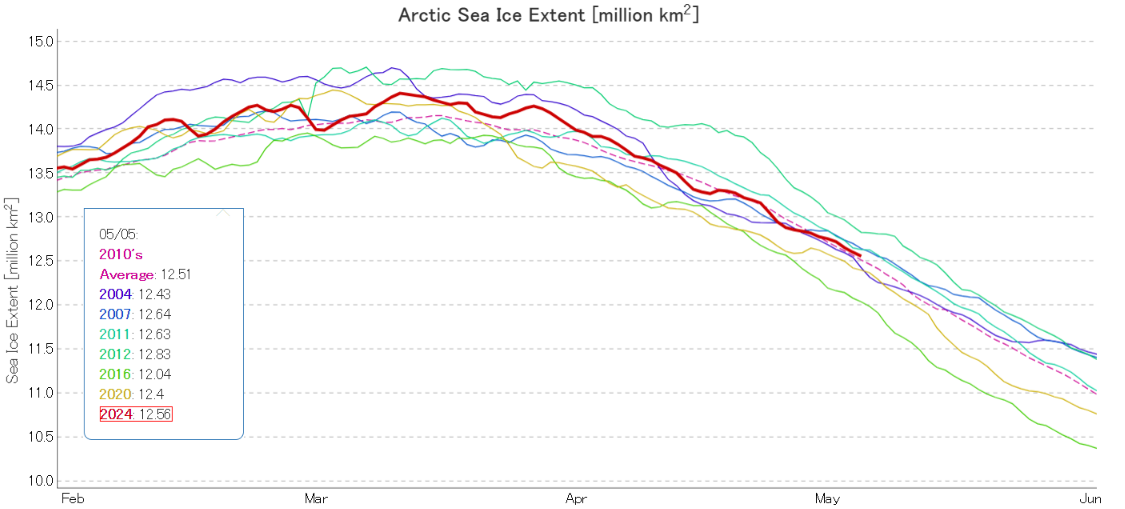
Since a certain “sceptic” has recently been comparing 2024 sea ice extent to “20 years ago”, here’s the current JAXA/ViSHOP extent graph of selected years, including 2004:
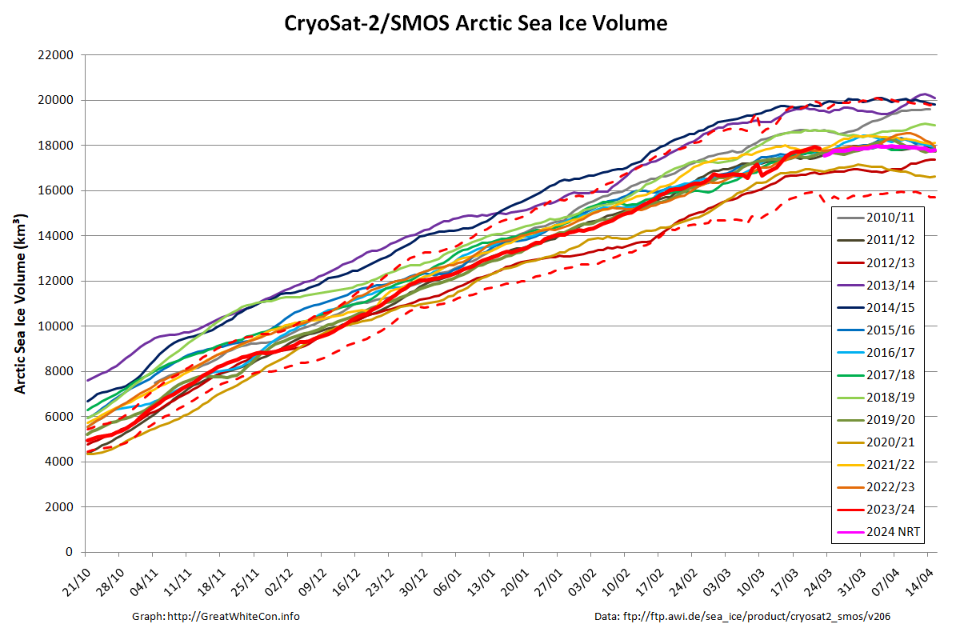
The CryoSat-2/SMOS merged Arctic sea ice volume graph finishes on April 15th, but older data is being reanalysed and here is the latest version:
The gap in the near real time data due to the problem with the SMOS satellite during the first half of March has been filled in, but the result doesn’t look very convincing to say the least!
The PIOMAS gridded thickness data for April 2024 is now available. Here’s the end of month volume graph:
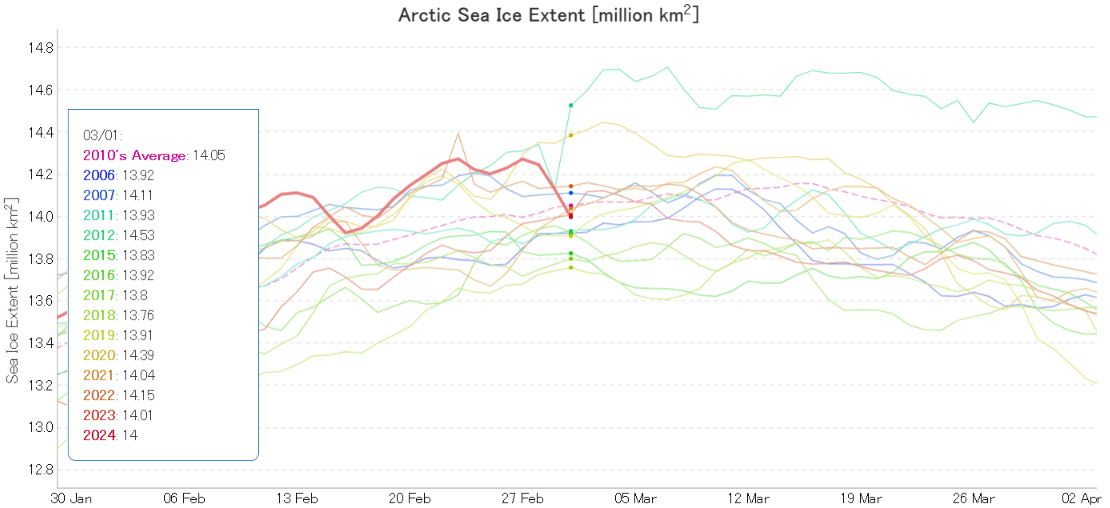
It looks as though the 2024 Arctic sea ice melting season has begun. For much greater detail see the 2024 maximum extent thread. However, here’s the latest JAXA Arctic sea ice extent graph:
Here too is an animation of sea ice motion on the Atlantic periphery, showing the effect of the passage of several Arctic cyclones through the area over the past 5 weeks or so:
[Update – March 4th]
My usual start of month processing hasn’t gone according to plan. Thanks to Lars Kaleschke at the Alfred Wegener Institute for the following information:
SMOS went into safe mode on 22 February 2024 at 05:10 UTC for reasons that are still under investigation.
The spacecraft has been back in nominal mode since 25 February 2024 and on 27 February 2024, the MIRAS instrument was switched on and is currently performing well.
The reload of the nominal acquisition planning is underway, and if all science data quality checks are positive, nominal data production and dissemination will resume in the coming days.
As the New Year rapidly approaches Tony Heller is up to his old Arctic tricks yet again. No doubt we’ll get on to many of his hoary old chestnuts in due course, but although I may easily have blinked and missed it he appears to have a new trick up his voluminous sleeve. Providing empirical evidence that the Intergovernmental Panel on Climate Change’s global warming “predictions” are correct!
Here is a recent extract from “Snow White’s” XTwitter feed:
Here's @TonyClimate demonstrating yet again that either:
1) He has no understanding of all things #Arctic, or
2) He understands well enough, but he pulls the wool over the eyes of his flock of faithful followers:https://t.co/U3tbp2qrOU
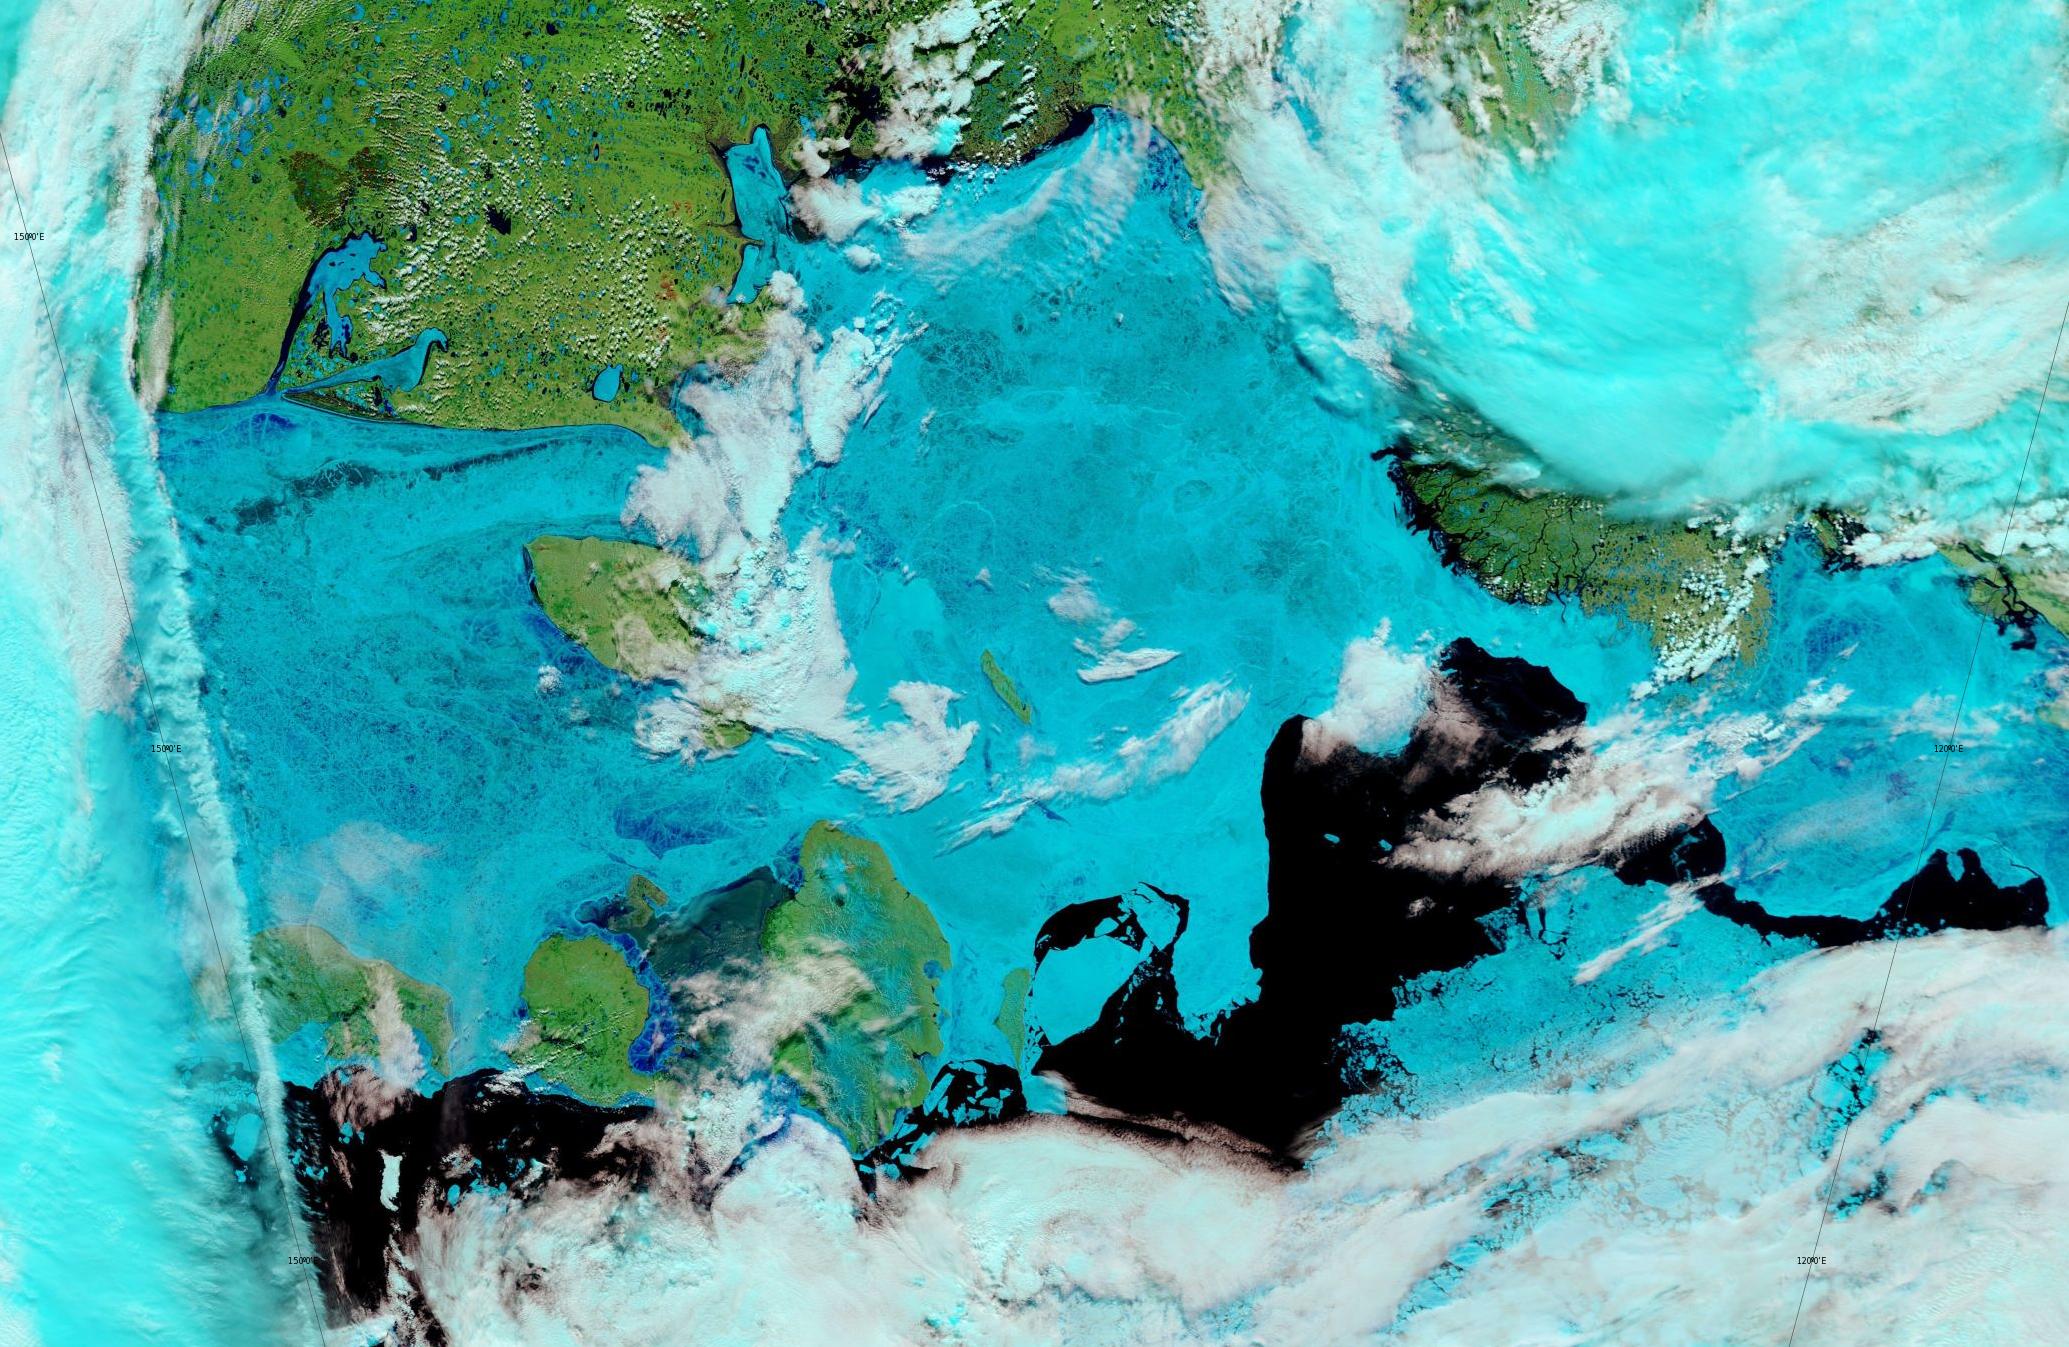
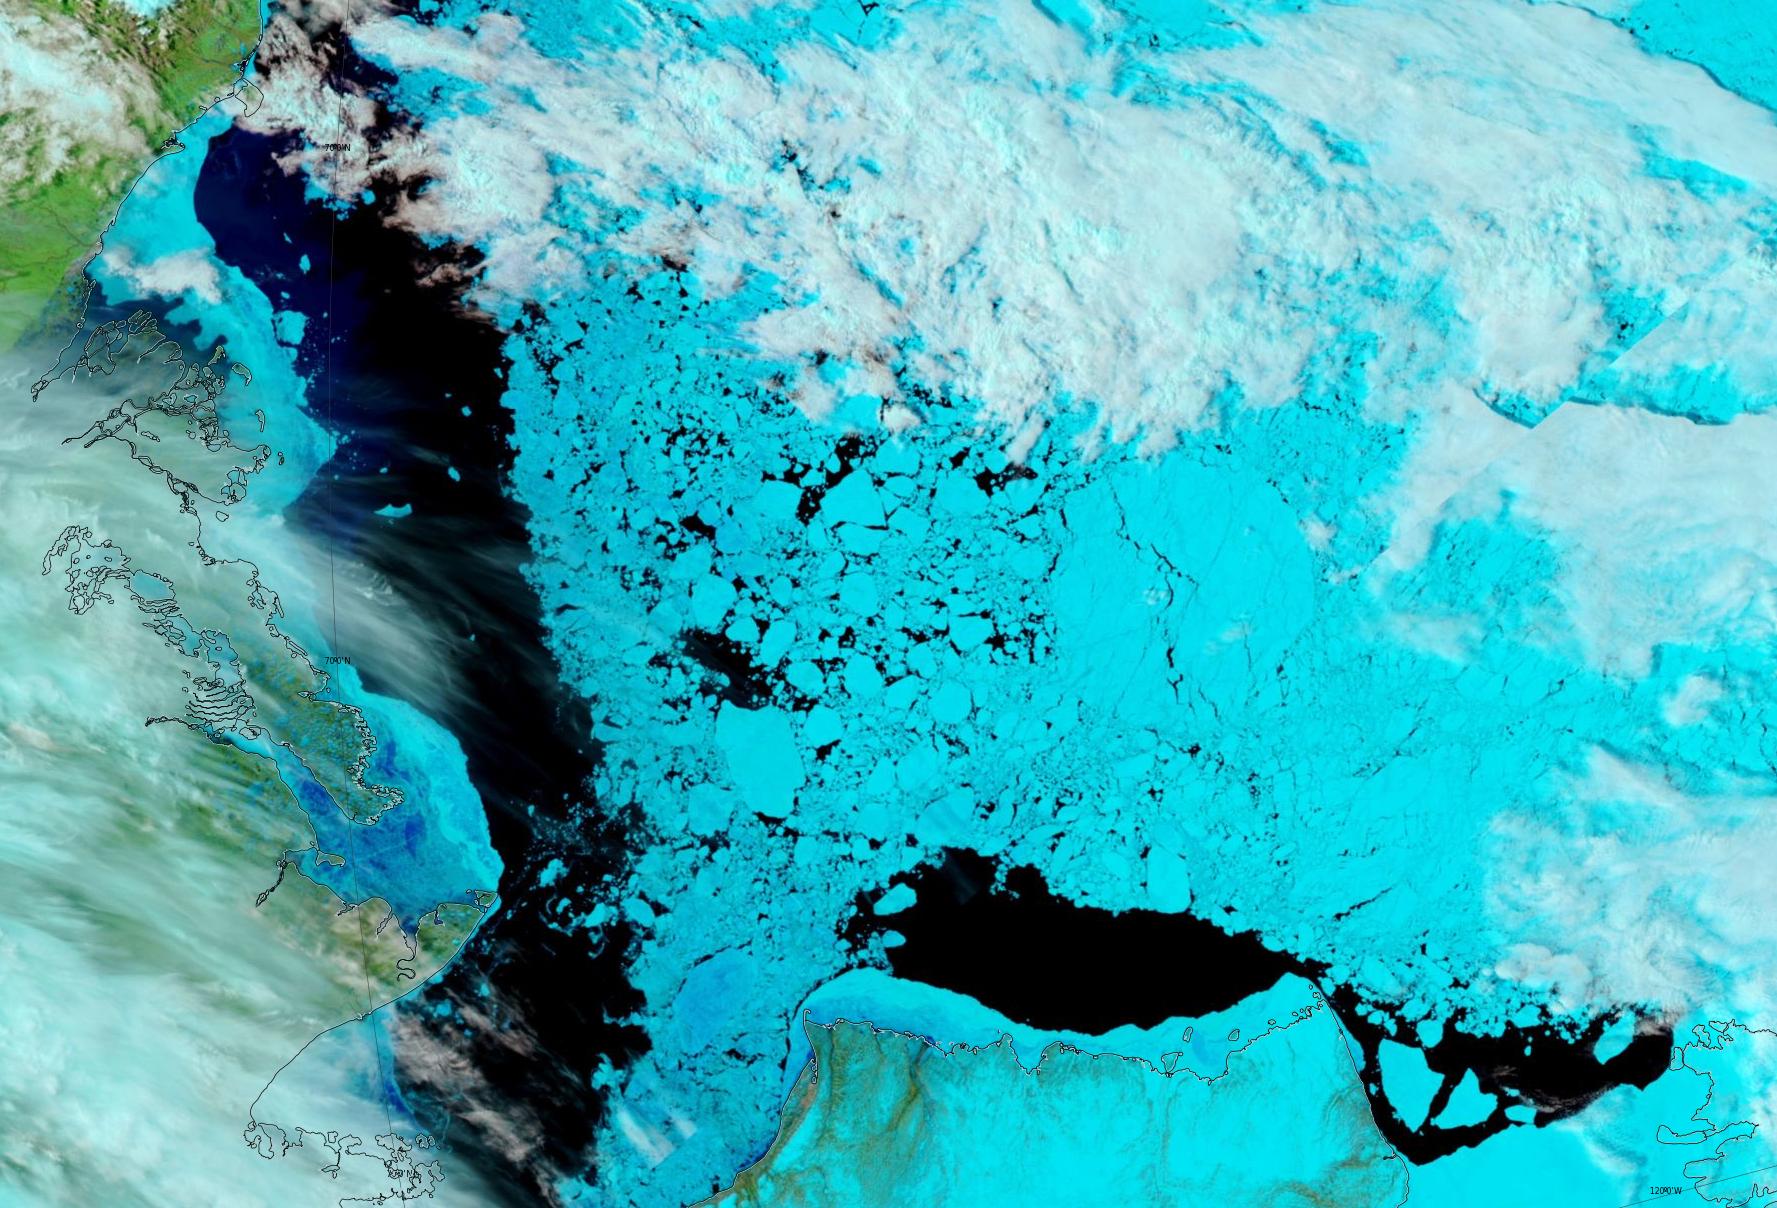
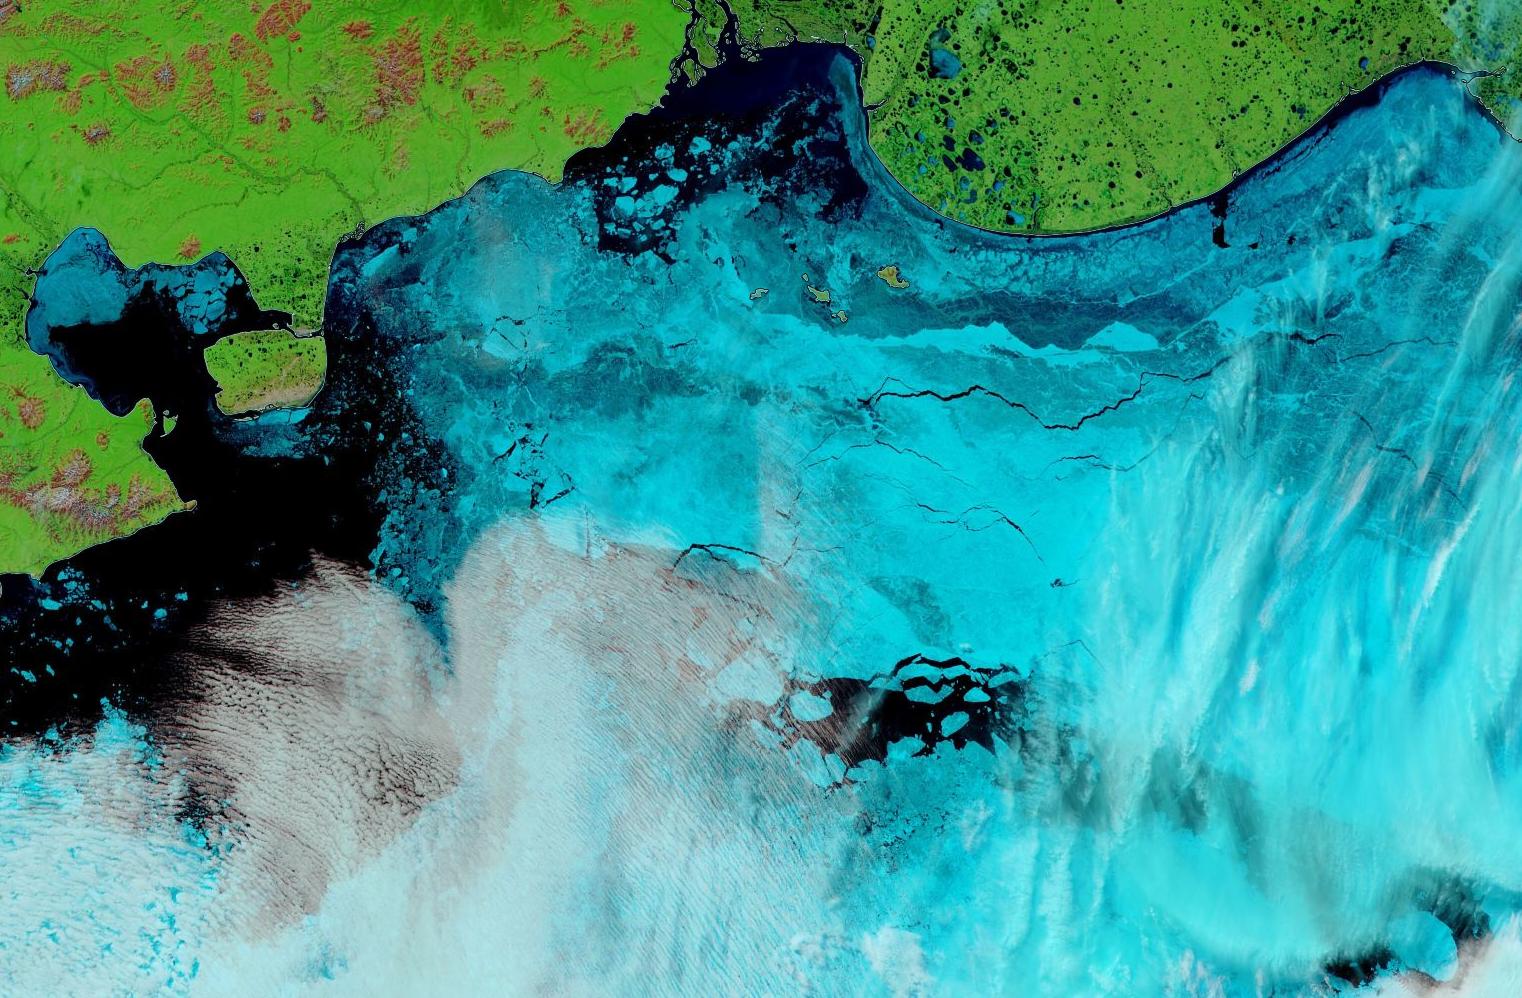
Let’s begin the month with a “true colour” image from the Terra satellite of the Laptev Sea and thereabouts:
The blueish tinge indicates the appearance of melt ponds almost everywhere over the land-fast ice currently covering the majority of the Laptev Sea.
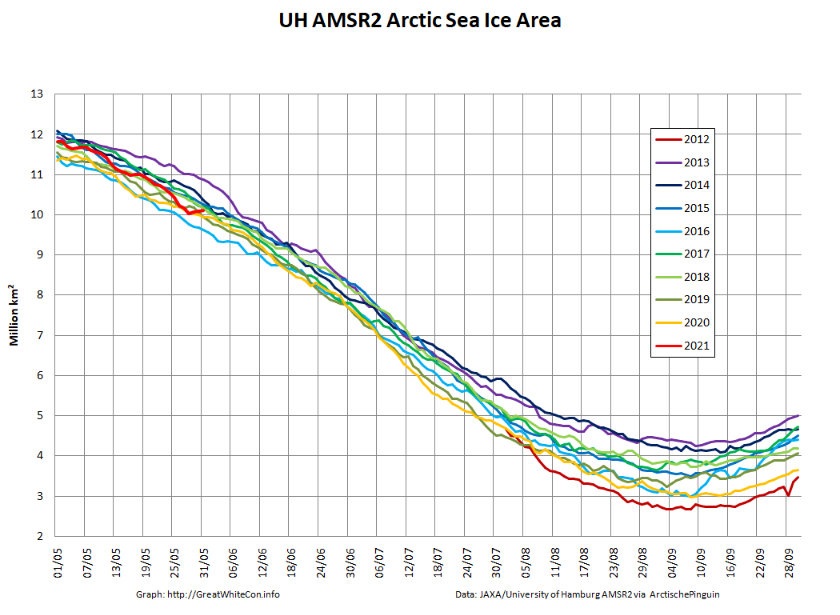
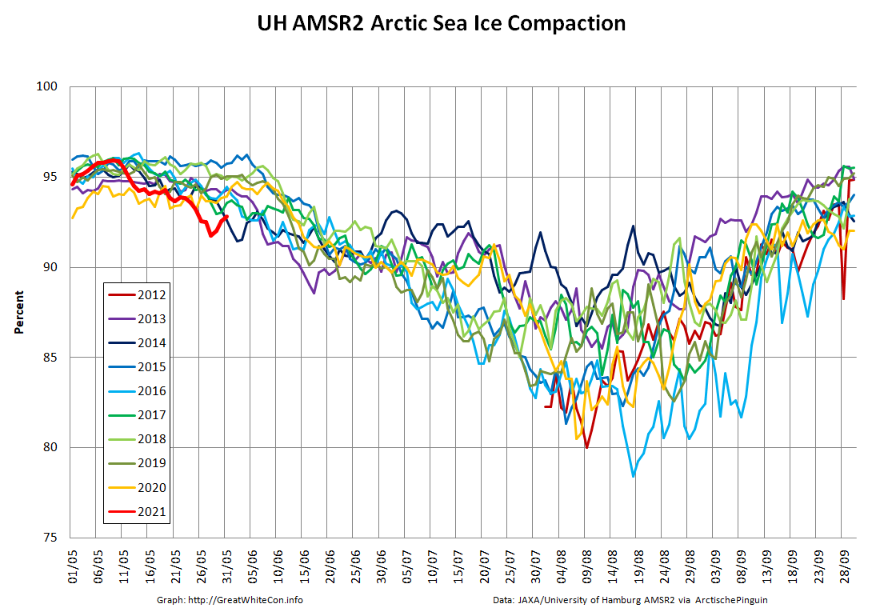
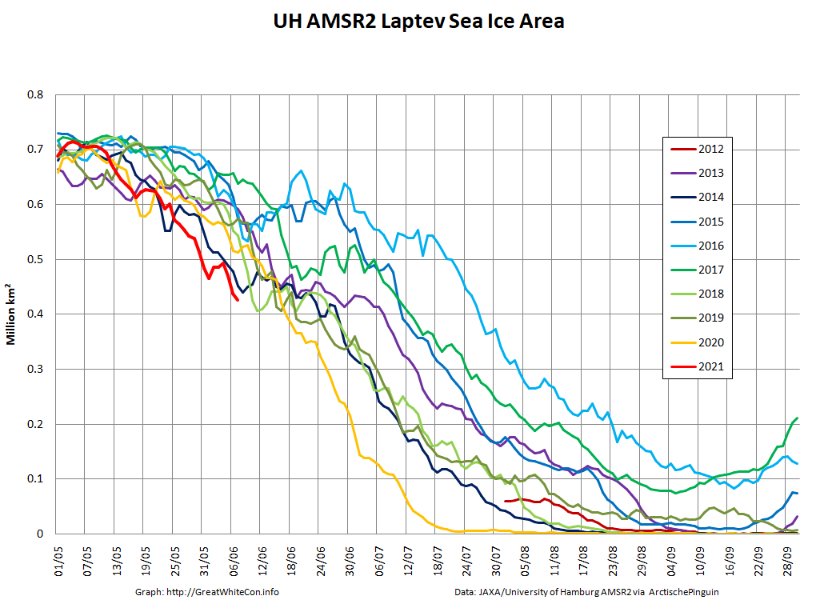
Let’s also take a look at the high resolution AMSR2 metrics for the end of May 2021:
Thanks to the recent “brief hiatus” in areal decline, Arctic wide compaction is no longer in record territory:
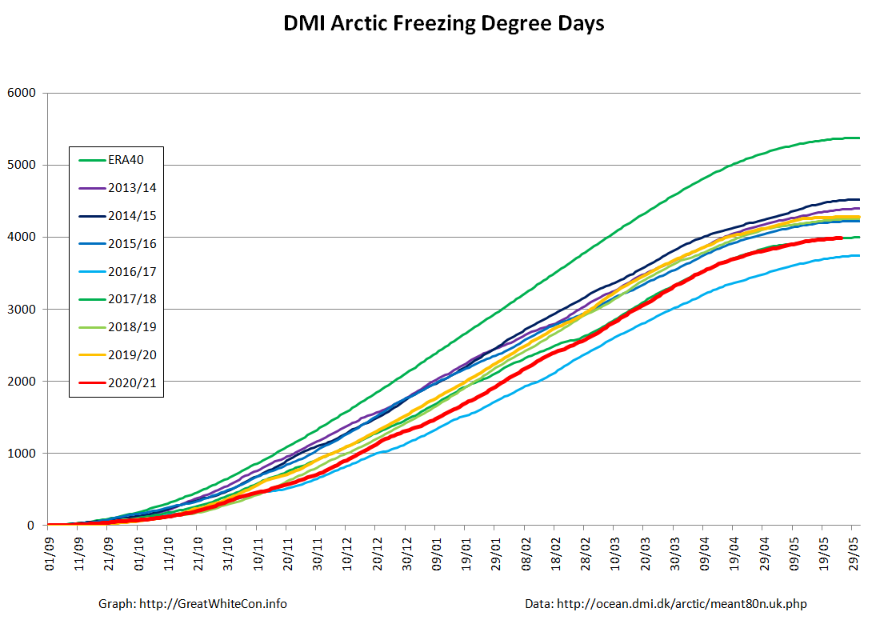
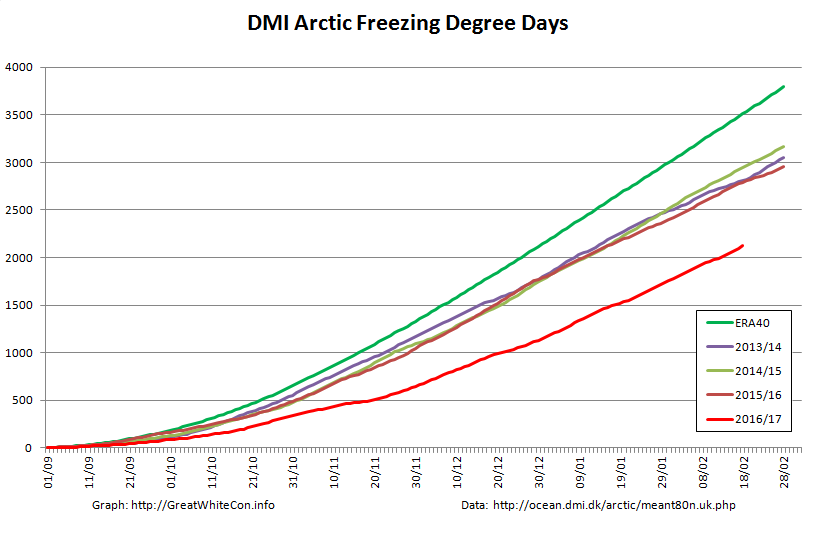
Finally, for the moment at least, here is the Danish Meteorological Institute’s high Arctic temperature data in the form of a graph of freezing degree days:
For some reason the data file still doesn’t include data to the end of May, but things won’t change much by then. Over the winter as a whole only 2016/17 was significantly warmer.
Let the 2021 Arctic sea ice summer melting season officially begin!
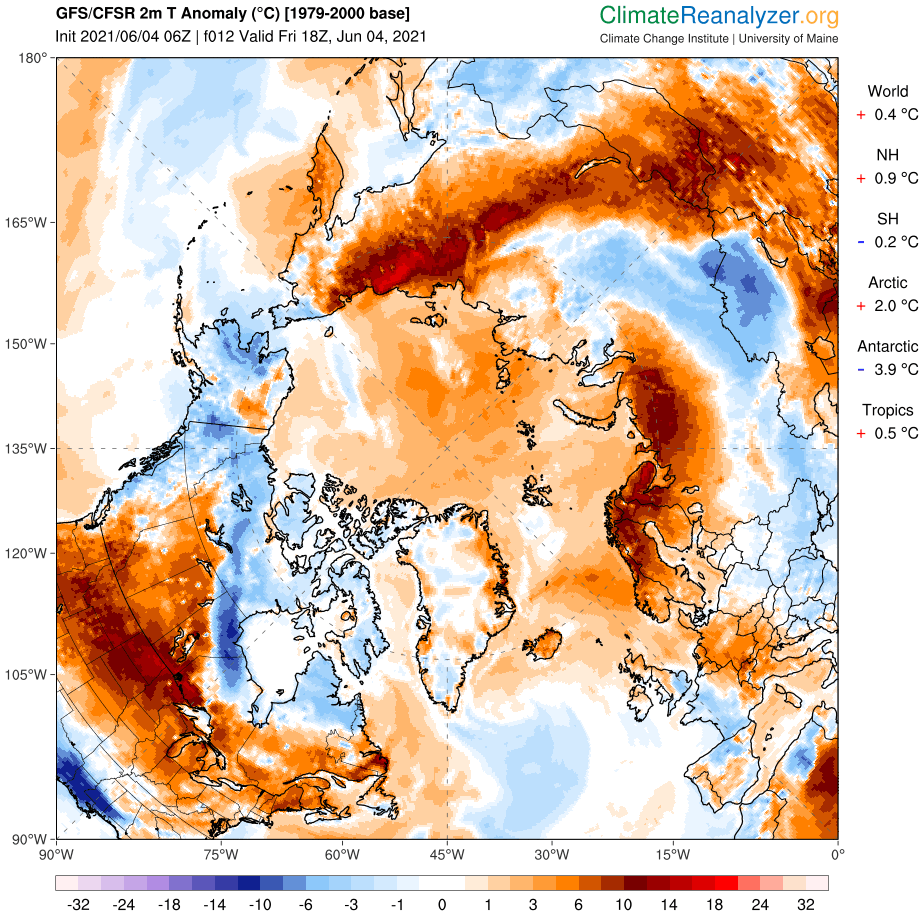
[Edit – June 4th]
Perhaps unsurprisingly the GFS forecast from four days ago hasn’t quite worked out as predicted. The Arctic as a whole is certainly on the warm side, with a +2 C anomaly at this moment:
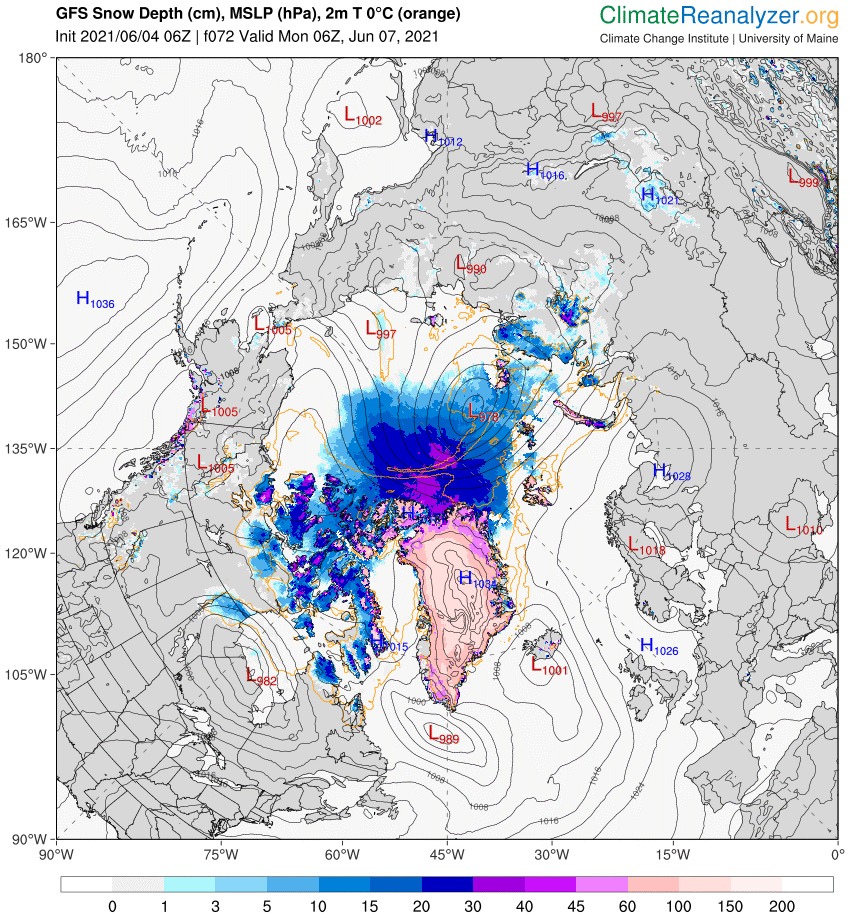
However the 966 hPa MSLP cyclone predicted for Monday is now forecast to be a mere 978 hPa:
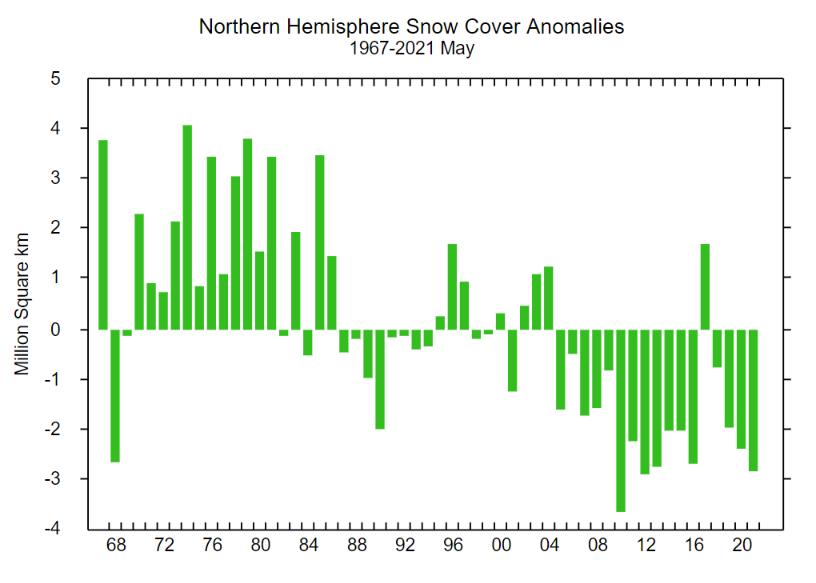
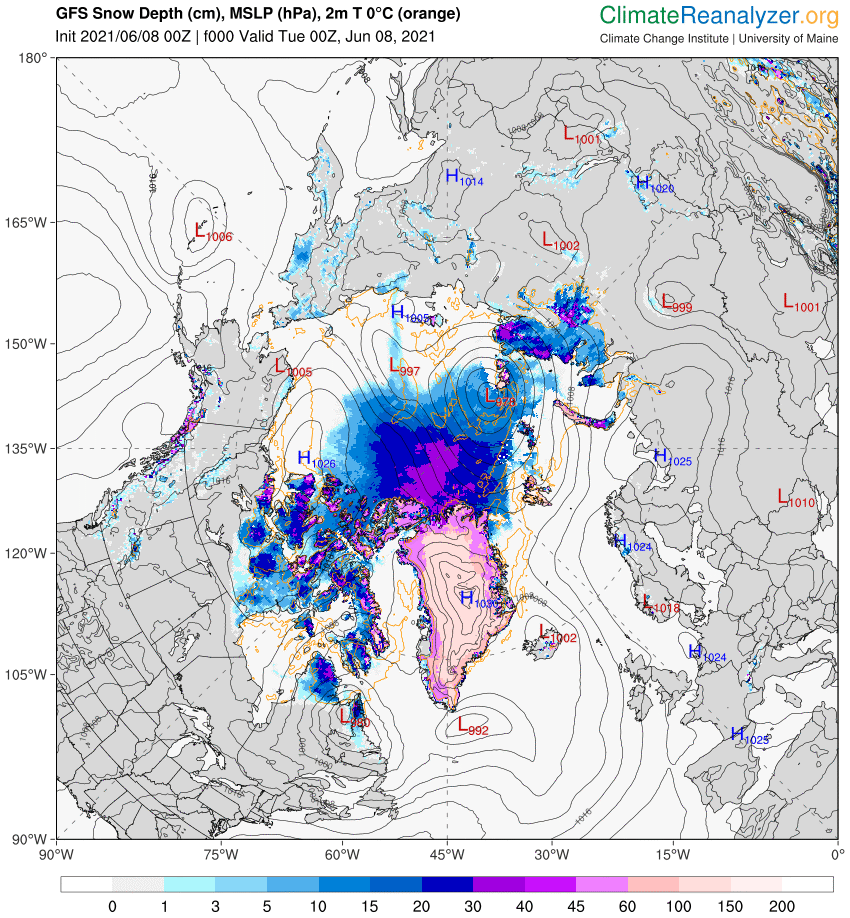
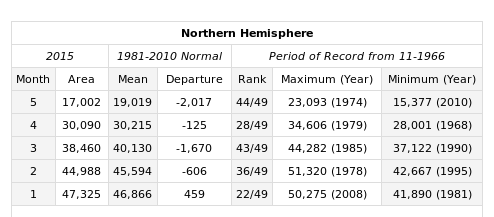
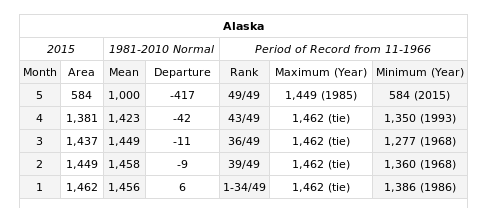
With 3 days to go there is a reasonable chance of it verifying in the “New Arctic” of 2021. As you can see from the map above a large area of the Central Arctic has now lost its snow cover. This is confirmed by the Rutgers Snow Lab northern hemisphere data for May:
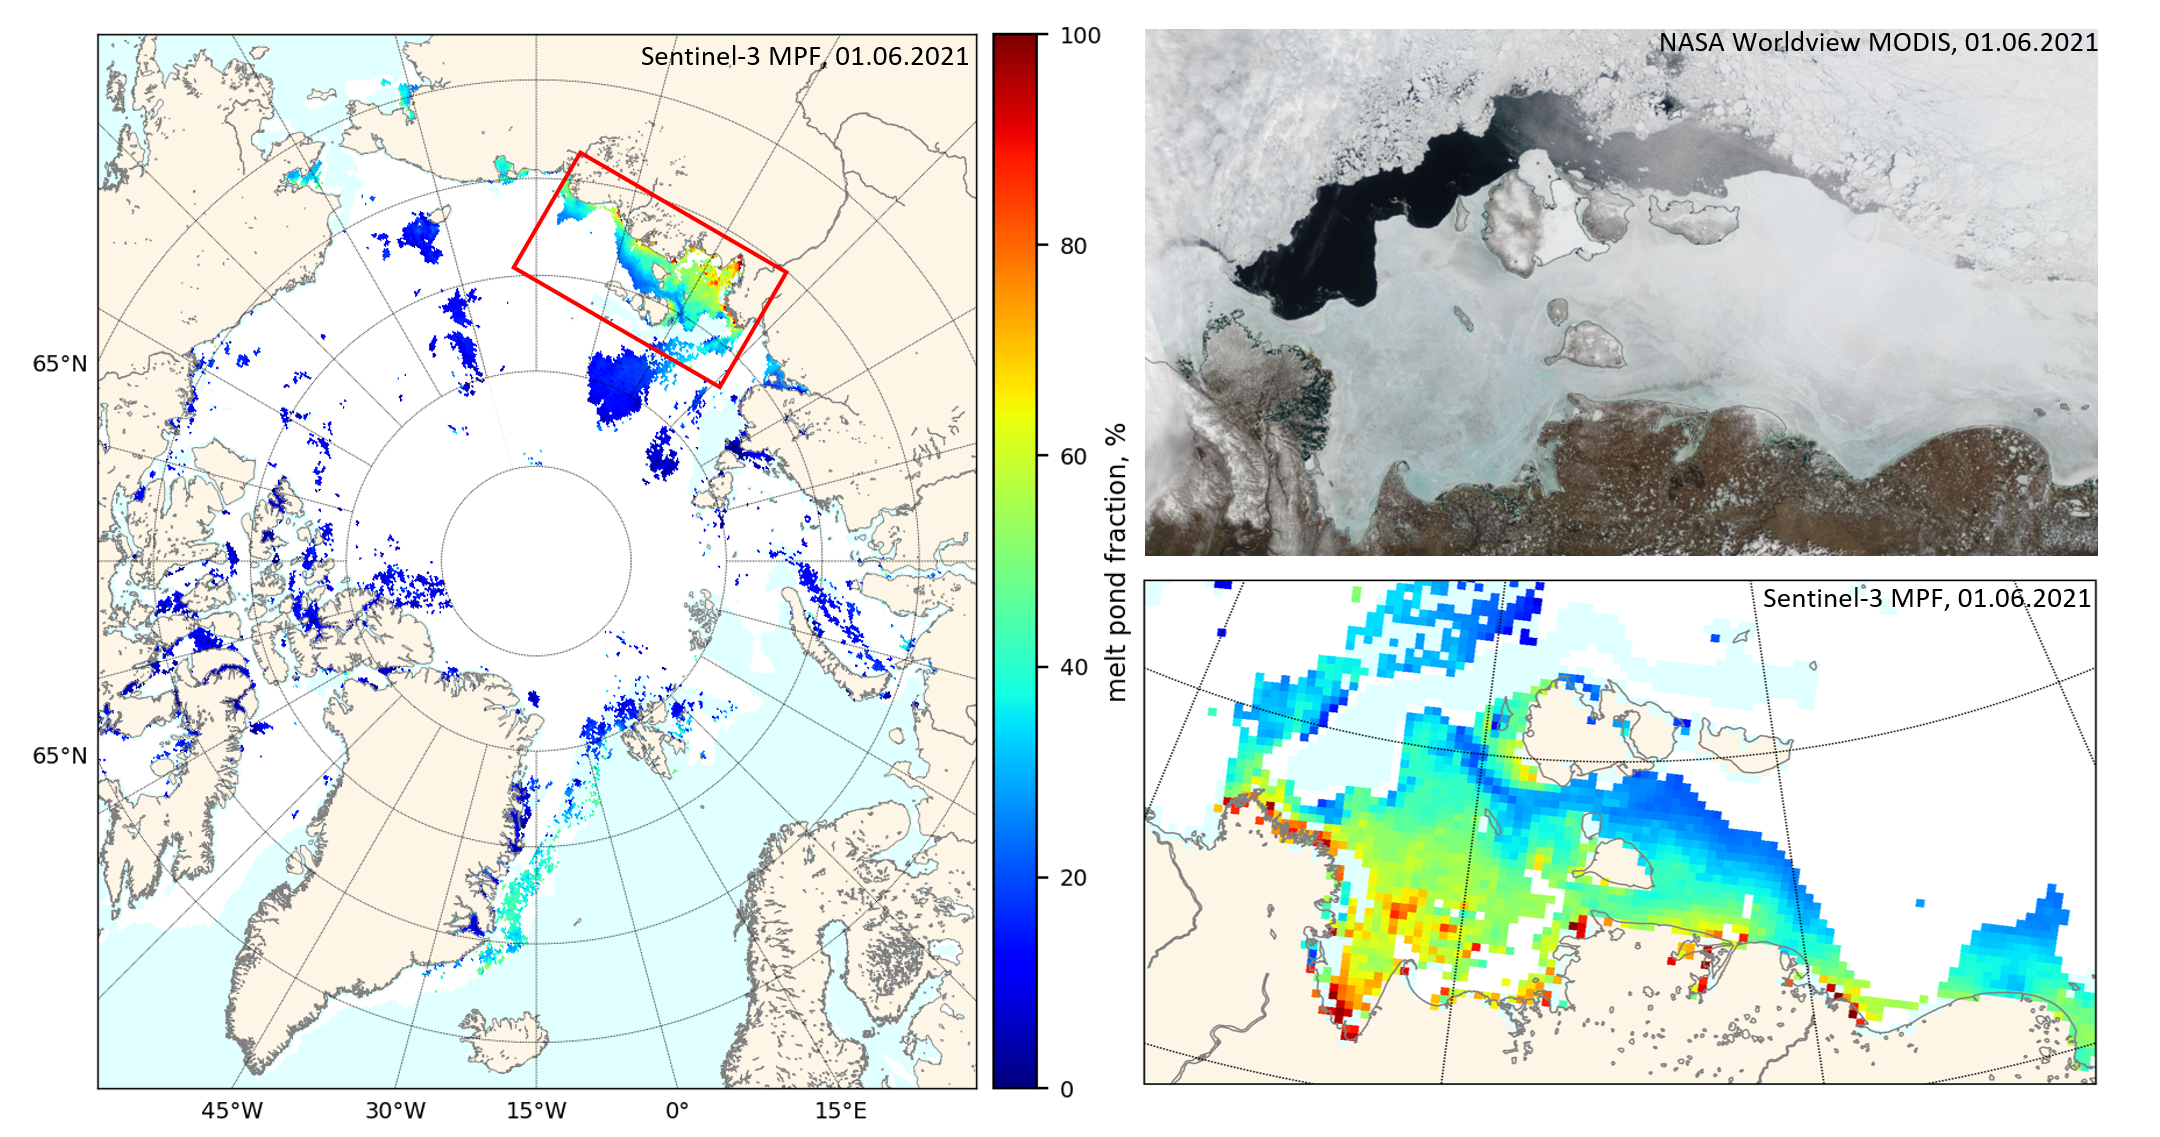
A new Sentinel 3 melt pond fraction product from the University of Bremen confirms that on the fast ice in the Laptev & East Siberian Seas snow cover has departed and melt ponds have arrived:
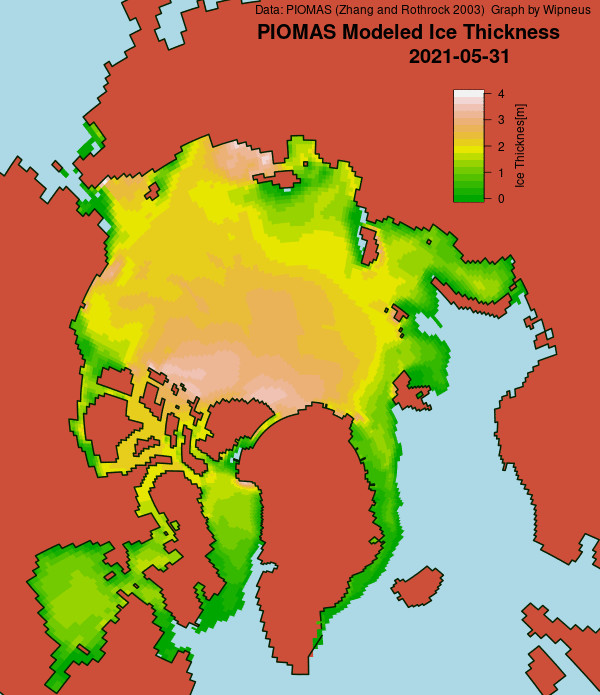
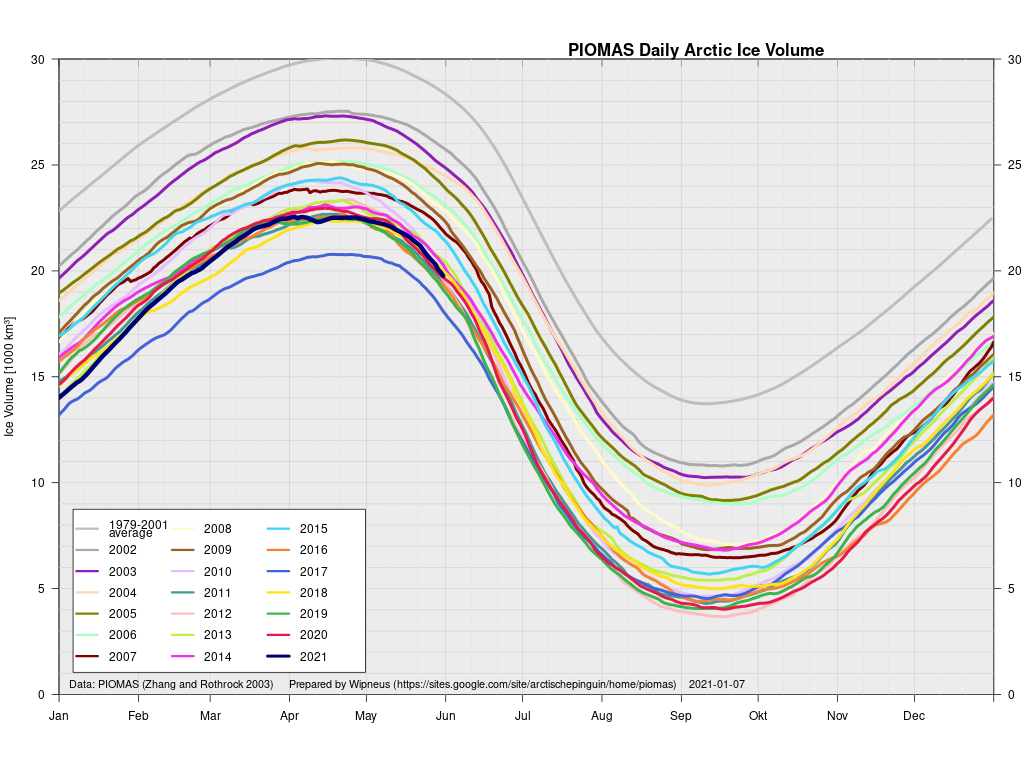
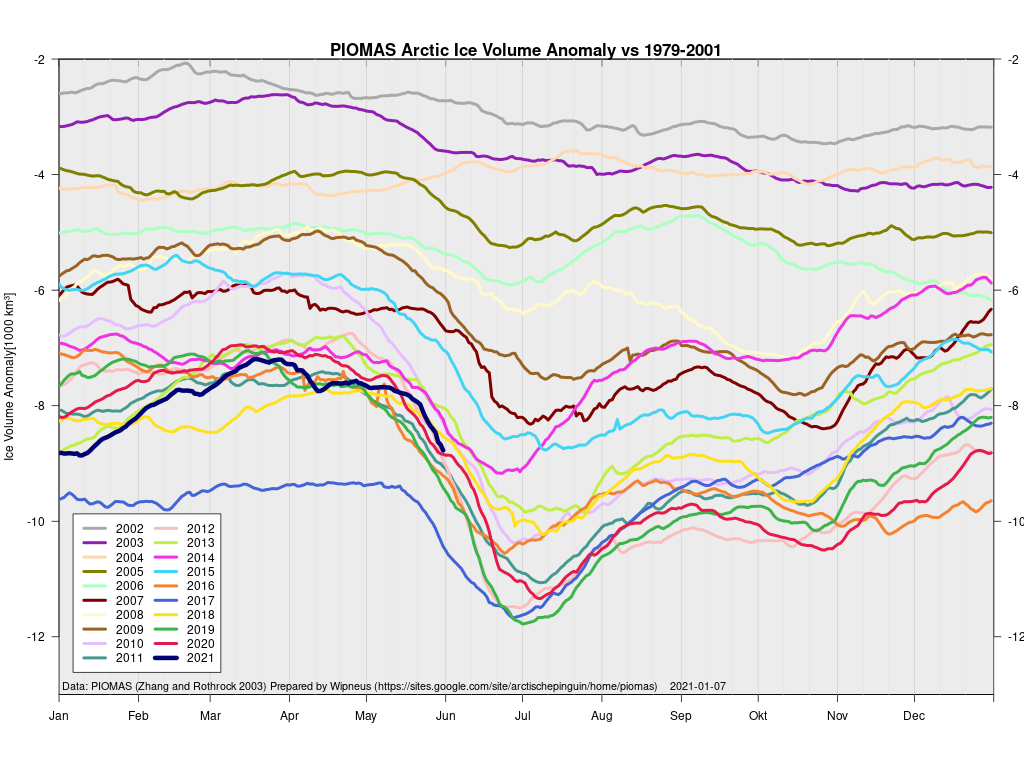
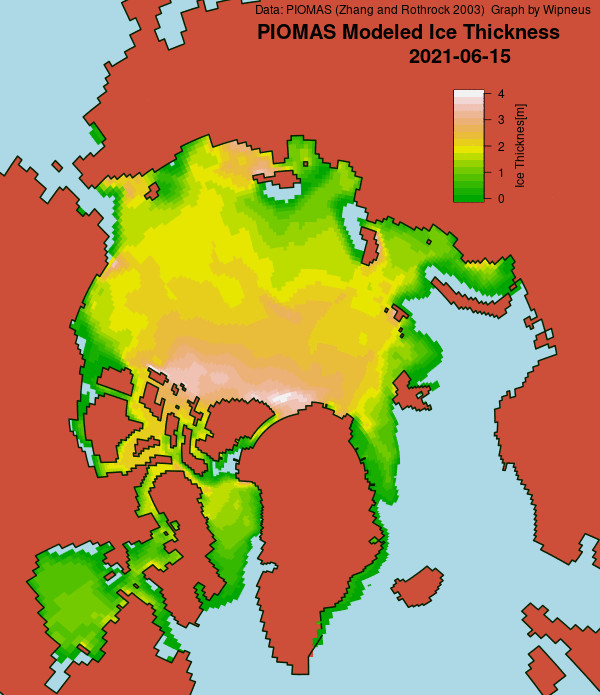
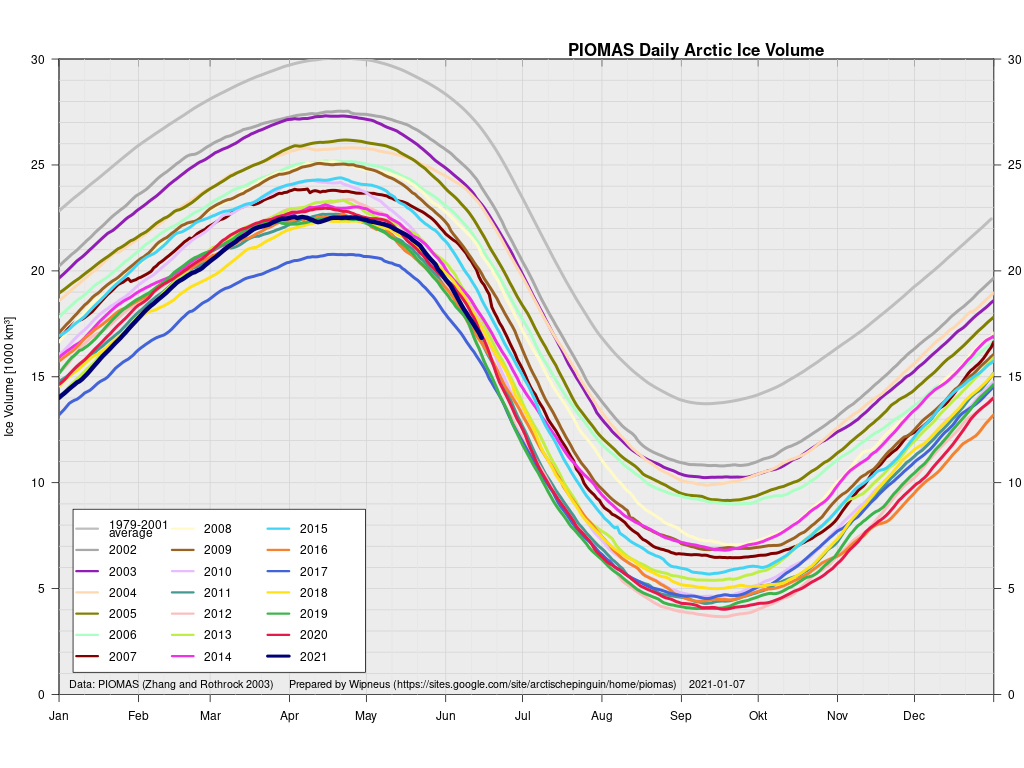
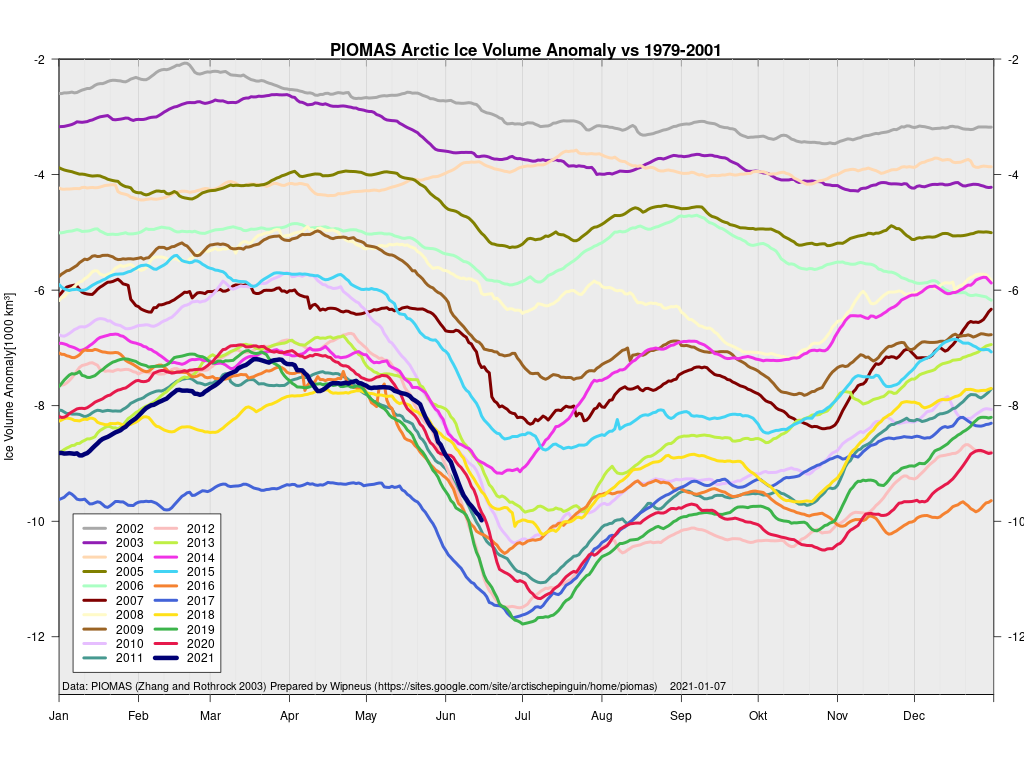
In other news Wipneus has released the latest PIOMAS gridded thickness and volume data on the Arctic Sea Ice Forum:
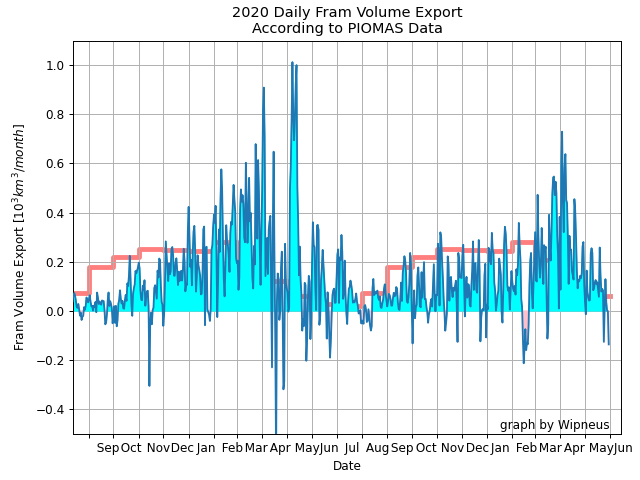
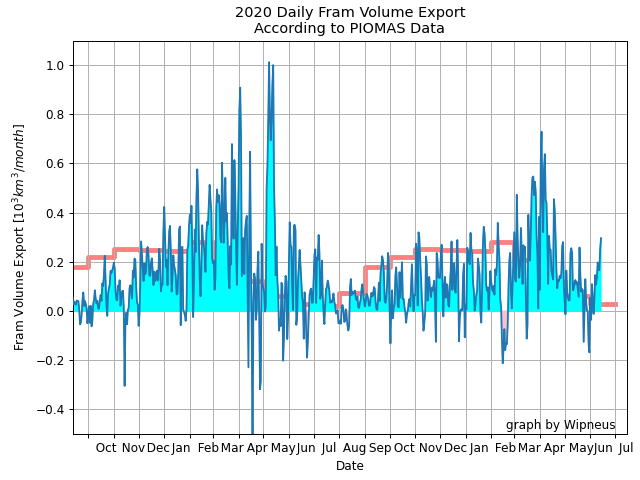
For some strange reason 2021 volume at the end of May is almost identical to 2012 and 2020! Plus of course there’s the modelled volume export from the Central Arctic via the Fram Strait:
[Edit – June 6th]
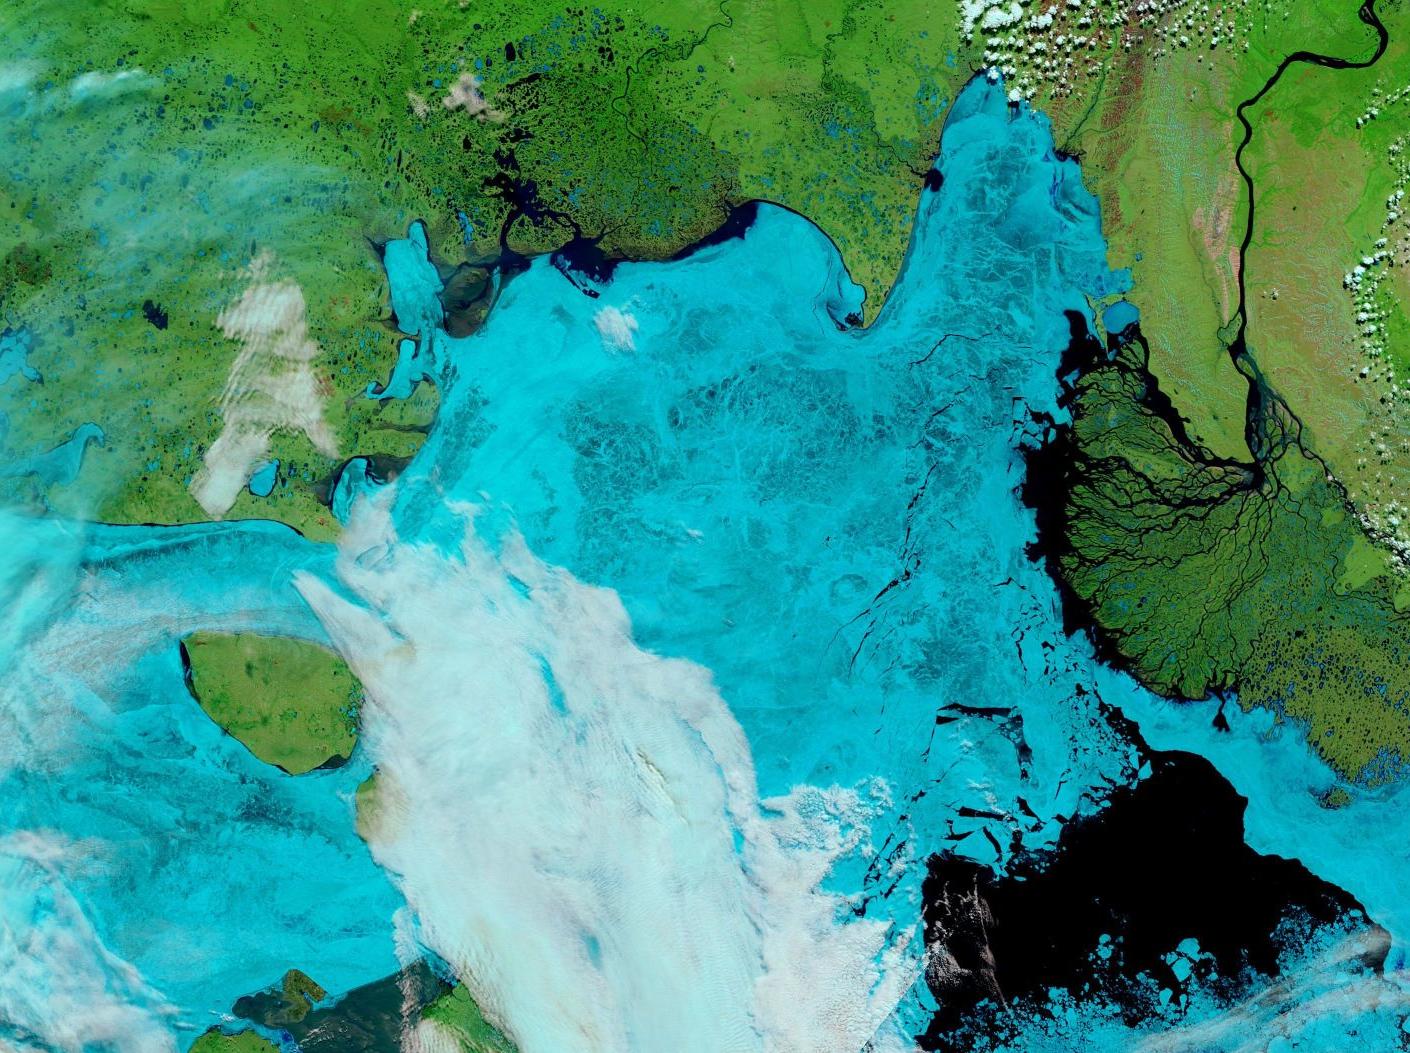
This “false colour” image reveals that there’s virtually no snow cover left on land, and this “false colour” image reveals that the land-fast ice in the East Siberian Sea is now awash with melt ponds:
[Edit – June 8th]
The forecast low pressure area appears to have bottomed out near the Severnaya Zemlya islands with a 978 hPa MSLP:
High resolution AMSR2 Arctic sea ice area is now 2nd lowest for the date after 2016:
Laptev sea ice area is still lowest for the data, and looks as though it will retain that position for a while:
[Edit – June 9th]
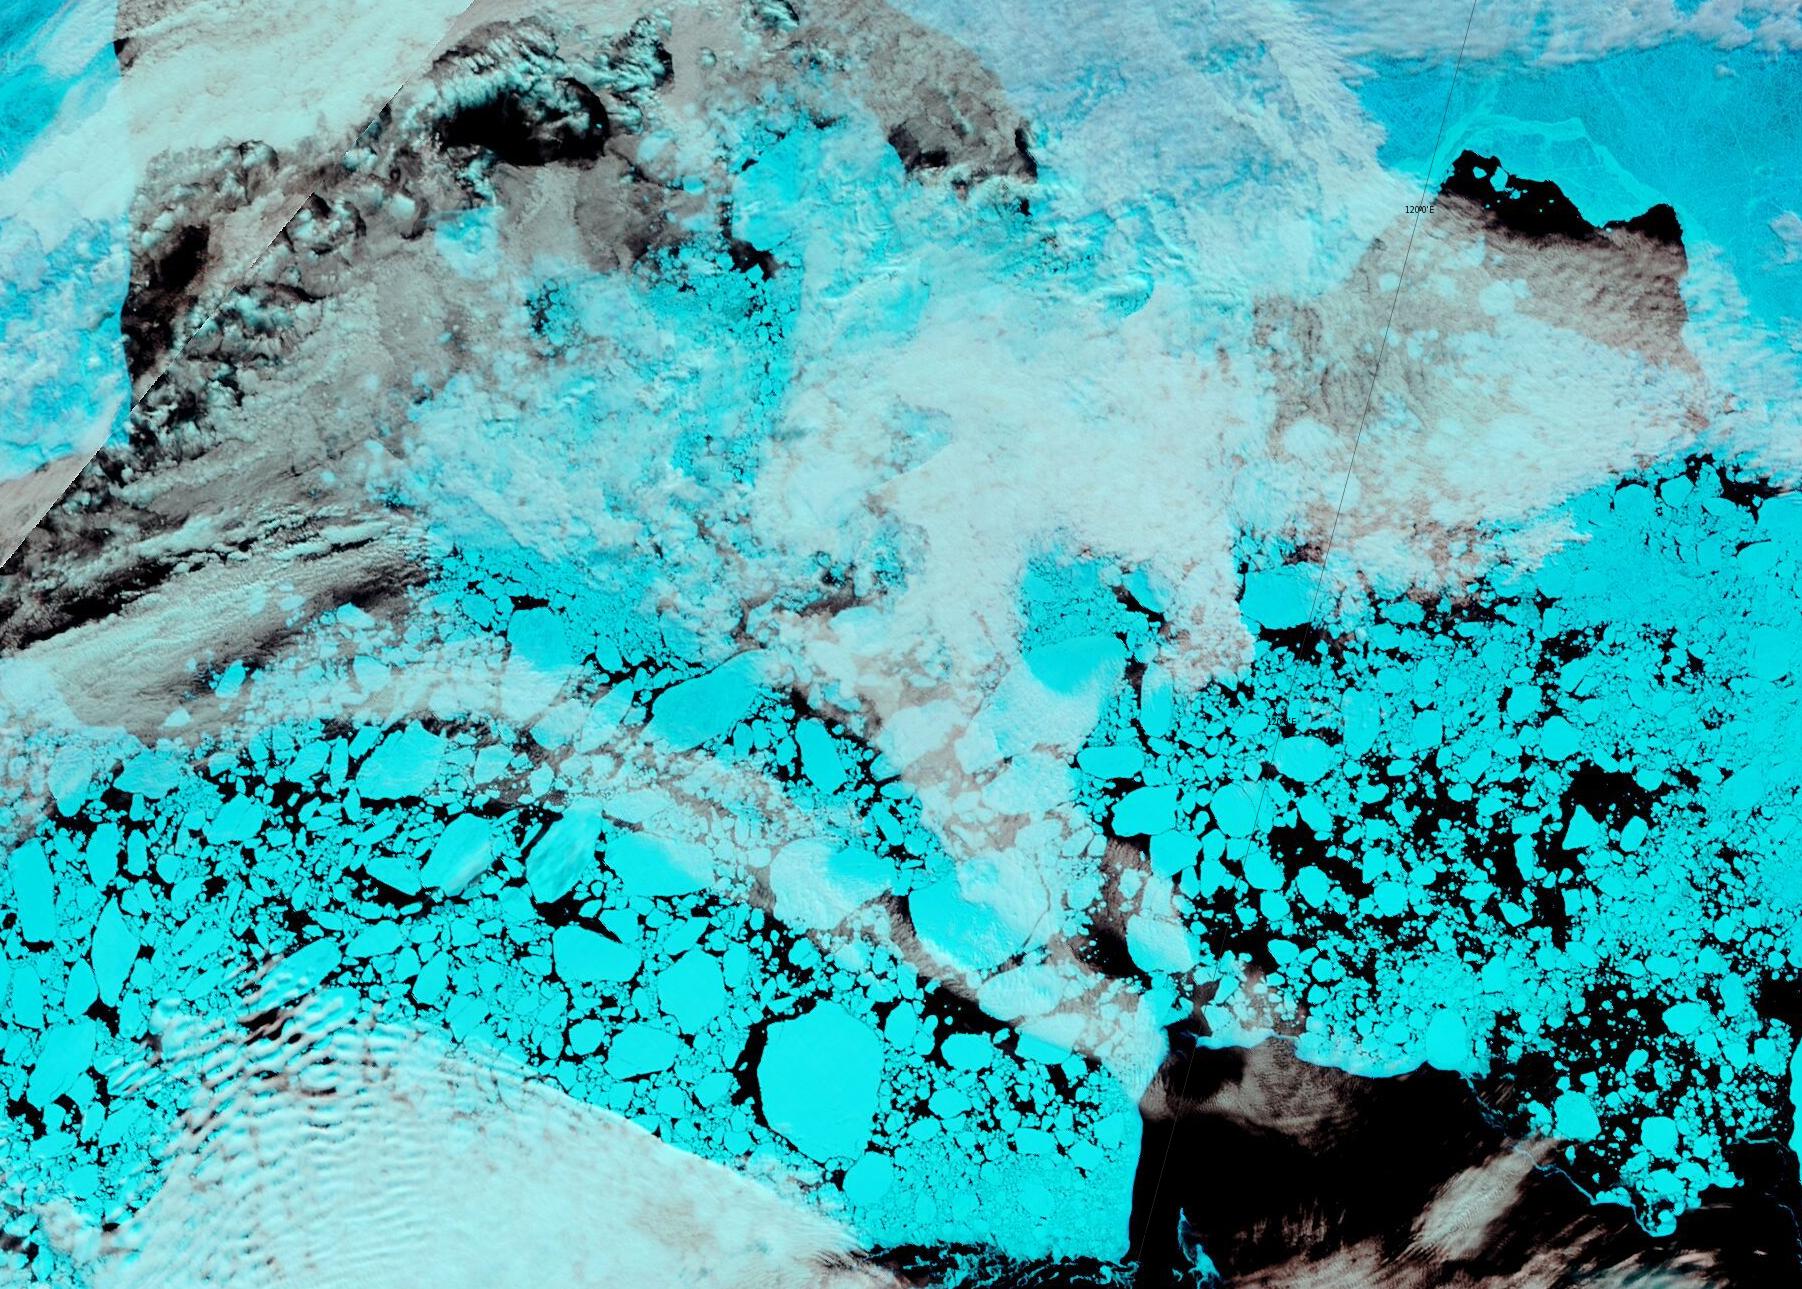
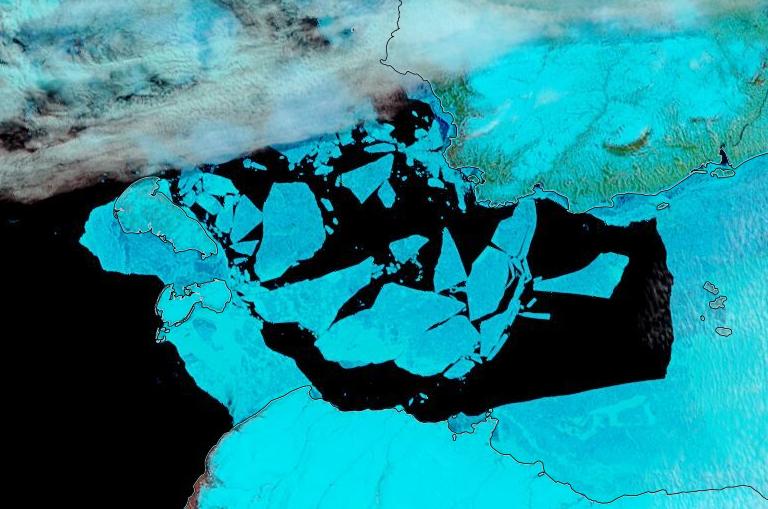
The effect of the recent heat and wind on the remaining sea ice in the Laptev Sea is now all too apparent:
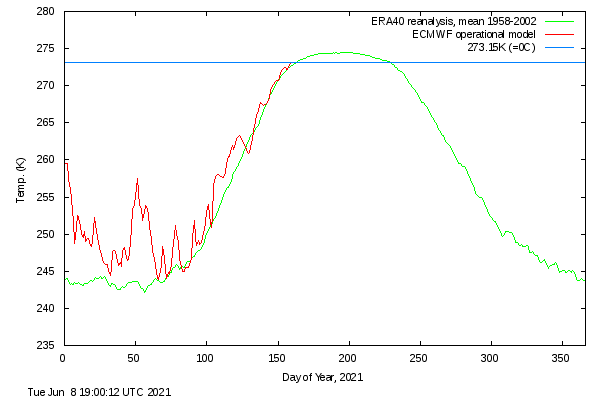
It’s also evident in the DMI >80N temperature graph, which has now reached sea ice “melting point” ahead of the climatology:
Note that the blue line is actually above the “freezing point” of salty Arctic sea water.
[Edit – June 13th]
Fairly clear skies over the Laptev Sea and the western East Siberian Sea, revealing wall to wall melt ponds and the land-fast ice starting to break up near the coast as well as on the edge of the now open ocean:
Plus yesterday’s view of the Beaufort Sea, revealing fast ice breaking up in the western entrance to the McClure Strait:
[Edit – June 18th]
A clearish view of the Laptev Sea today, revealing assorted cracks in a variety of locations:
[Edit – June 20th]
The latest mid-month PIOMAS thickness/volume numbers have been released:
[Edit – June 23rd]
The skies over the Vilkitsky Strait have been cloudy for a few days. However a fairly clear view yesterday reveals that breakup is well under way in what is usually one the last areas along the Northern Sea Route to become navigable:
[Edit – June 26th]
The land-fast ice in the East Siberian Sea has started to disintegrate en masse:
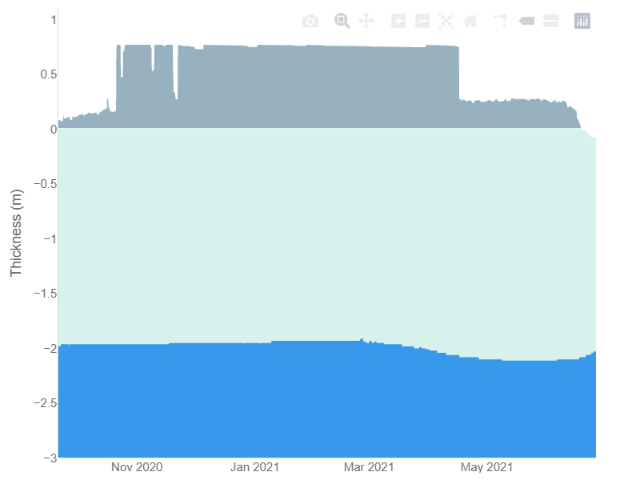
Data from ice mass balance buoy 441910, currently located at 76.1 N, 151.1 W in the Beaufort Sea, reveals the onset of both surface and bottom melt:
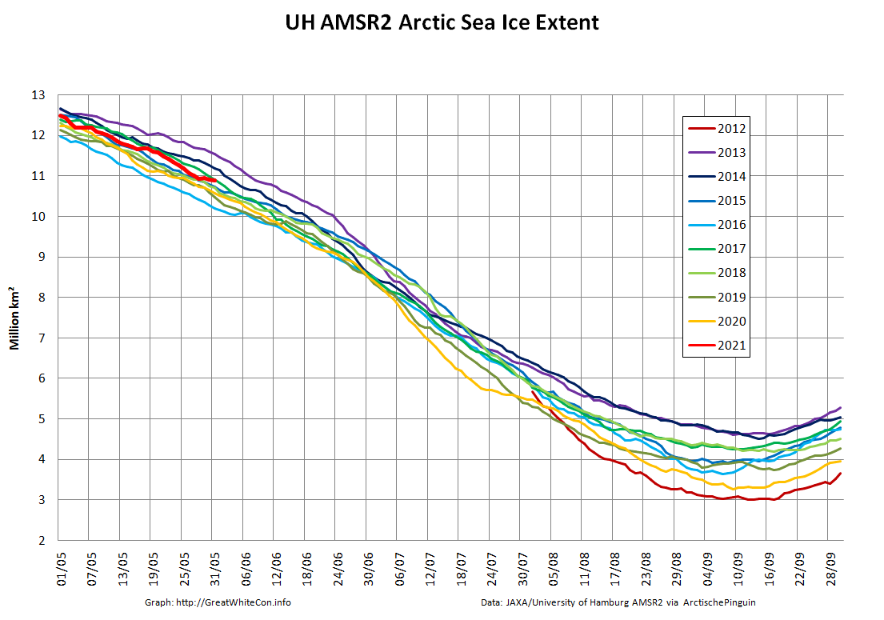
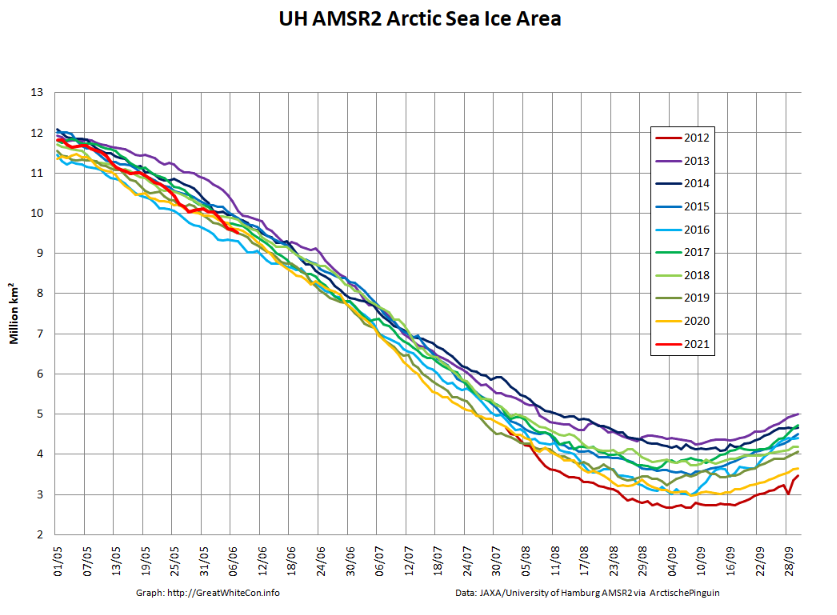
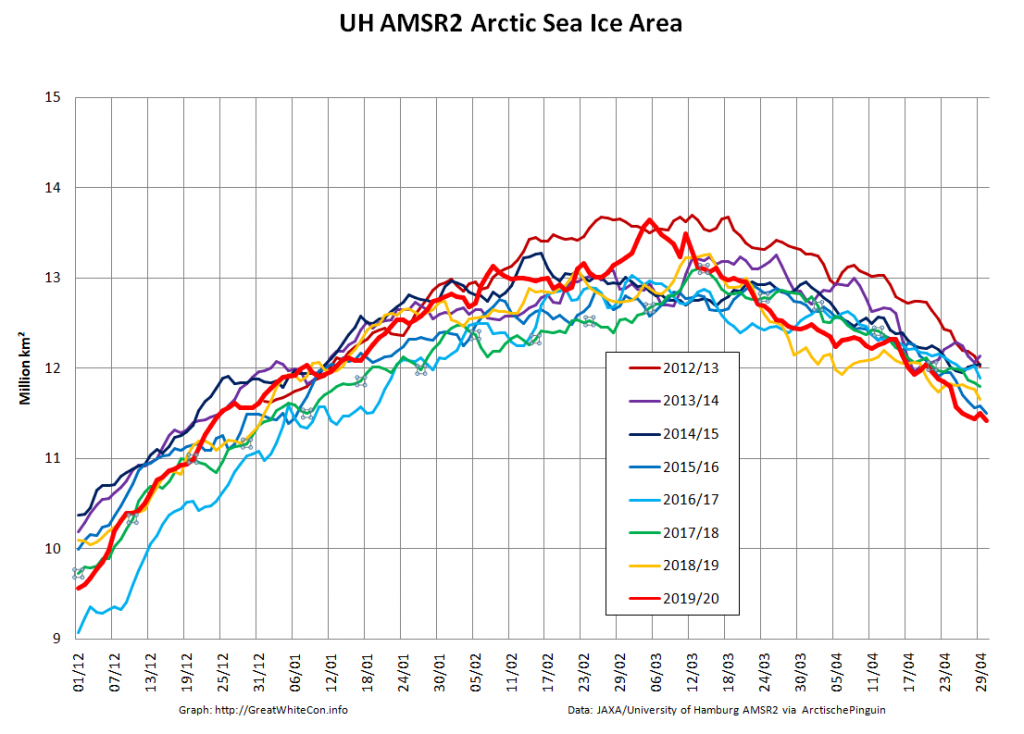
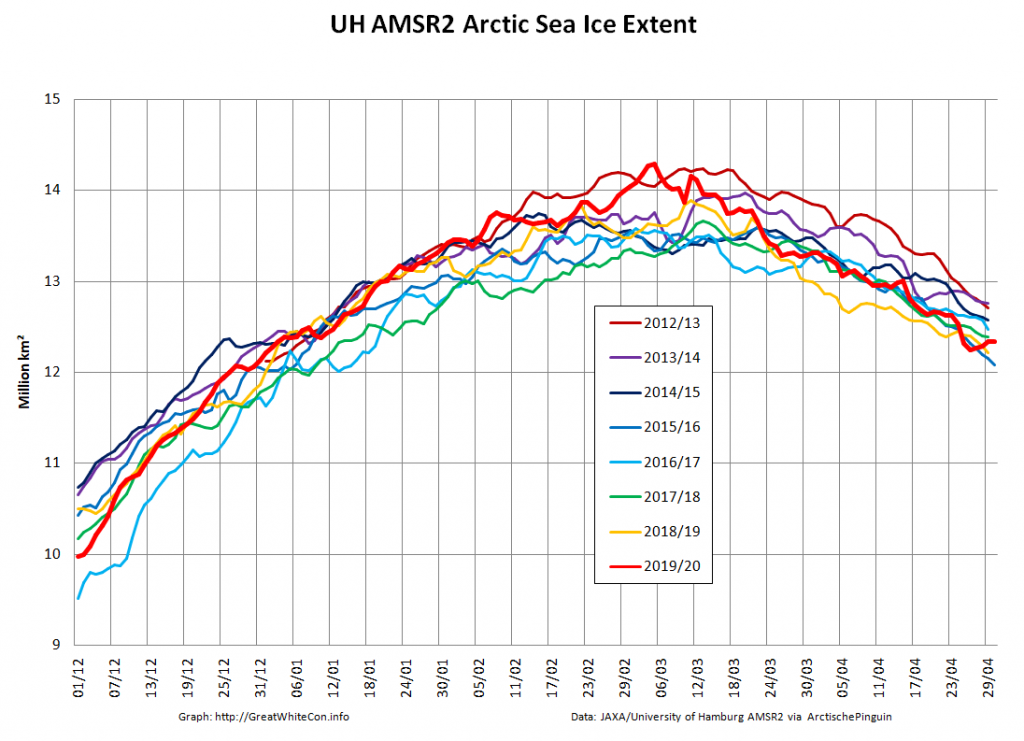
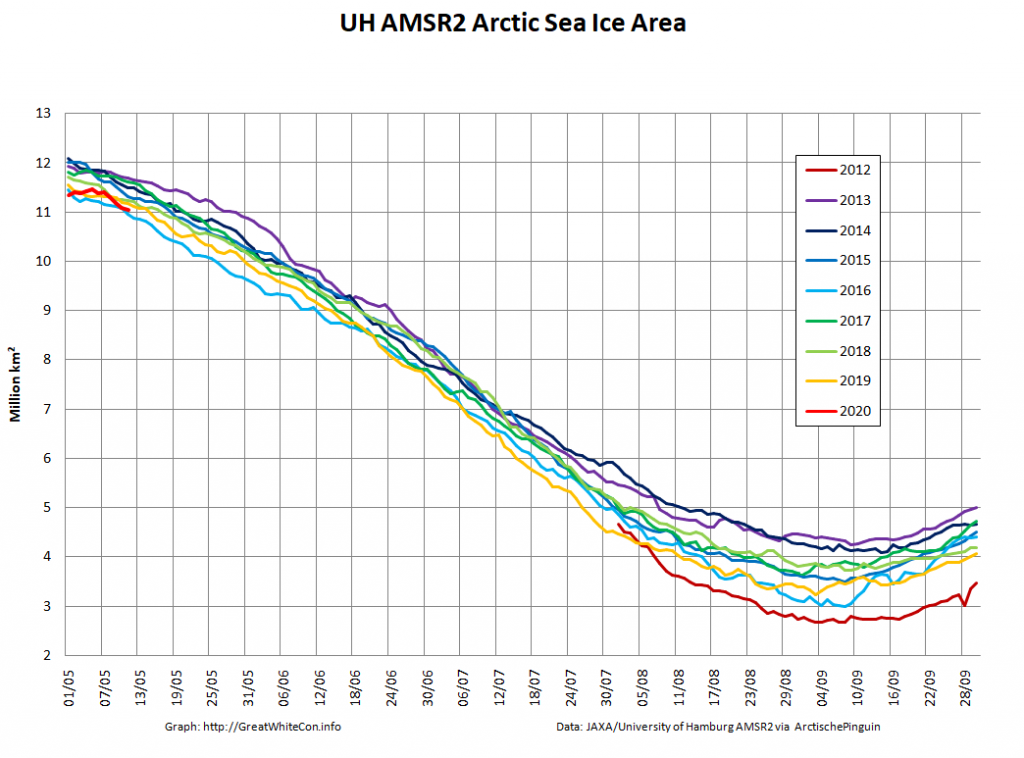
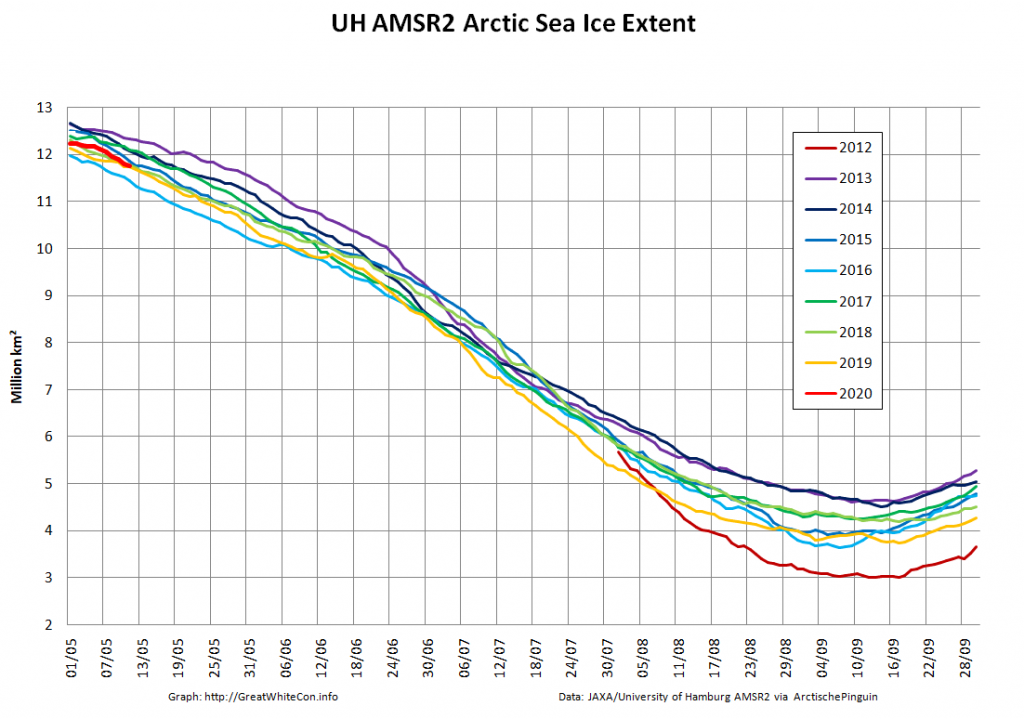
Let us begin this month’s report from the far north with the high resolution Arctic sea ice area and extent graphs based on the University of Hamburg’s AMSR2 concentration maps:
Area is currently lowest for the date in the AMSR2 record. After briefly occupying that position extent has increased over the last few days of April due to winds causing sea ice to move in the direction of the far North Atlantic:
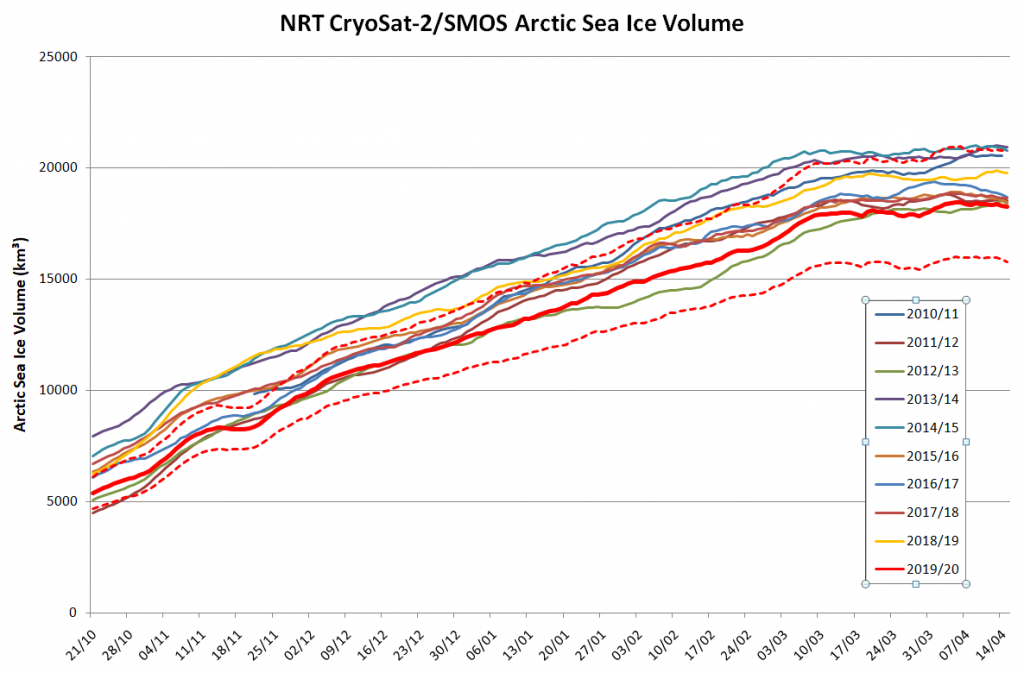
The Alfred Wegener Institute has now finished reanalysing their CryoSat-2/SMOS thickness data, and the resulting volume graph looks like this:
“Measured” Arctic sea ice volume is the lowest in the CryoSat-2 era as we head towards the main 2020 melting season, which in my calendar at least begins on June 1st. The PIOMAS modelled volume numbers should be released shortly.
[Edit – May 5th]
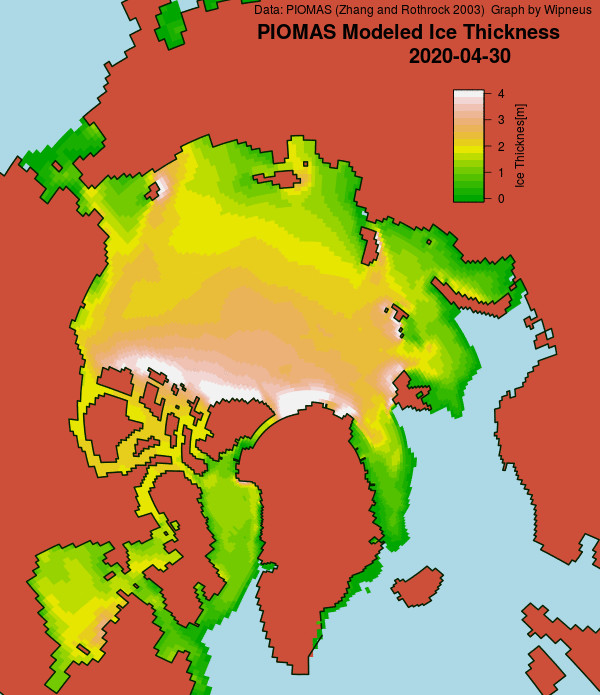
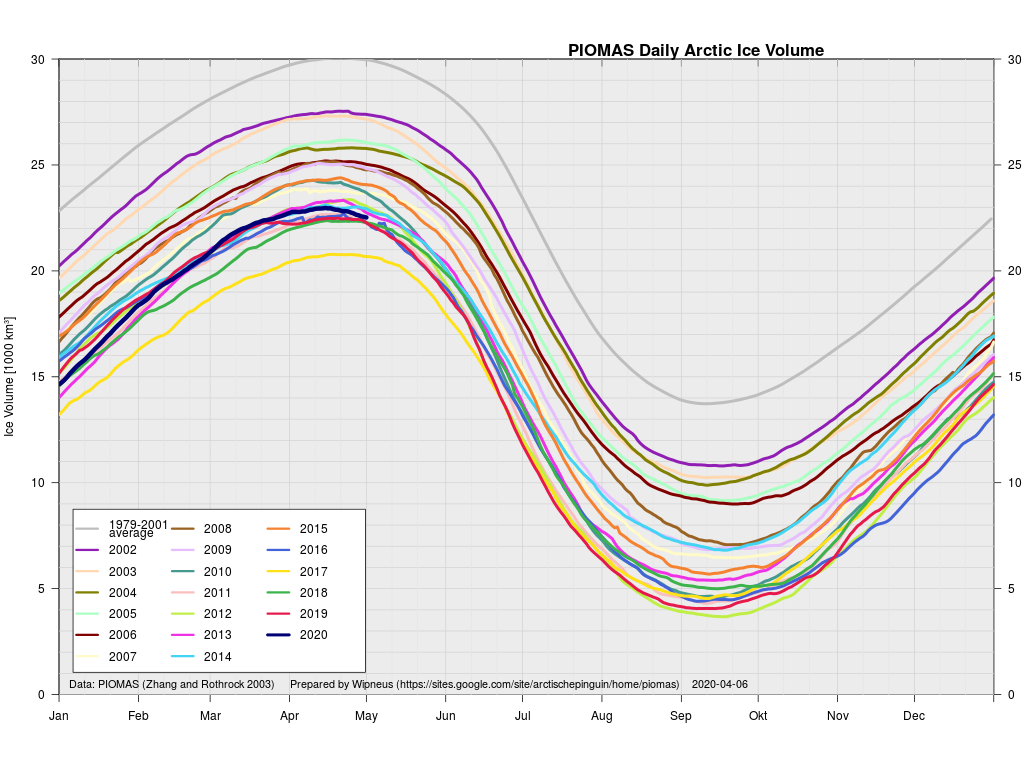
The April 30th PIOMAS gridded thickness numbers have been released, and Wipneus has worked his usual magic. By way of comparison with the AWI metric:
Obviously differing from CryoSat-2/SMOS, PIOMAS has 2020 volume a long way above 2017, in amongst a gaggle of other years.
[Edit – May 13th]
The middle of May is rapidly approaching, so let’s start to set the scene for the forthcoming melting season. First off here are the hi res AMSR2 area and extent graphs:
Extent is currently significantly above 2016 due to the recent “dispersion” mentioned above, but area is very close to an all time low for the date.
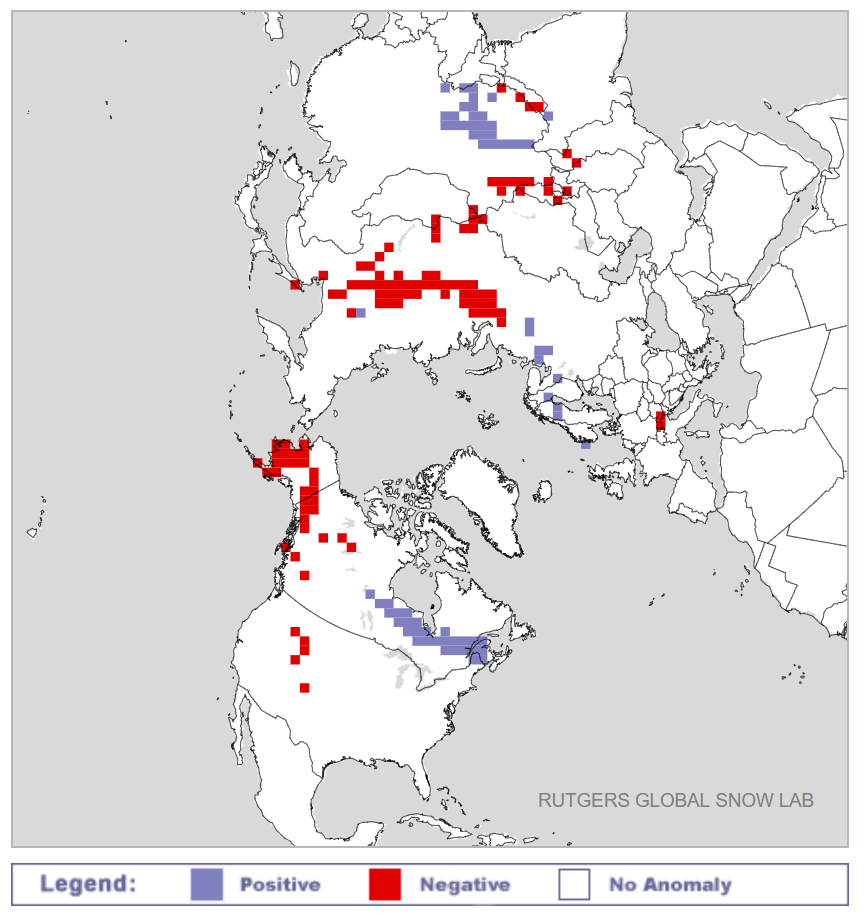
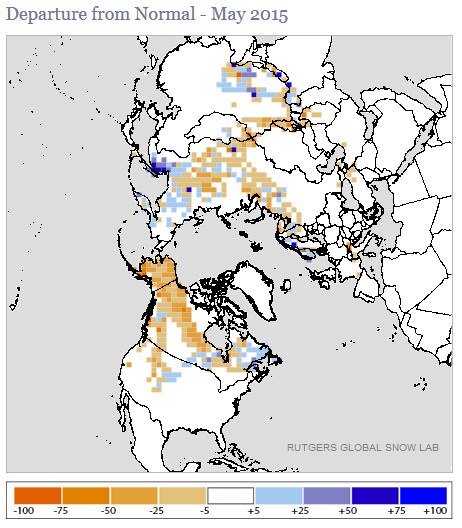
Next take a look at the current northern hemisphere snow cover anomalies from the Rutgers University Snow Lab:
Whilst there is a positive anomaly near Hudson Bay, there are significant negative anomalies across Siberia and Alaska. This does not augur well for sea ice retention along both the Northern Sea Route and Northwest Passage by September 2020.
David Rose is mercifully quiet this weekend, but there’s no rest for the wicked! Christopher Booker in the Sunday Telegraph leads a bunch of the usual Alt-facts suspects in a barrage of fake news about our dearly beloved Arctic sea ice. According to Mr. Booker in the “Arctic Myths” section of his column today:
As the fake science of global warming continues to crumble, one scare story the zealots are determined to hold on to at all costs is their claim that ice in the Arctic is dangerously vanishing. Yet again lately we have been treated to a barrage of such headlines as “Hottest Arctic on record triggers massive ice melt”.
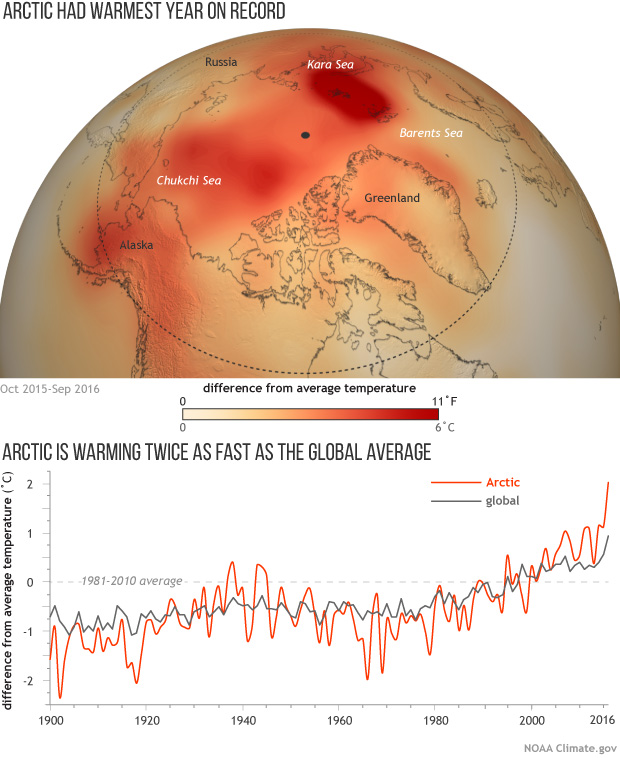
The nearest we got to such a headline here at the Great White Con was “Arctic Sea Ice News from AGU” in which article we showed images which said things like:
That’s because last year was the *hottest year on record in the Arctic! Undeterred by mere facts Mr. Booker continues:
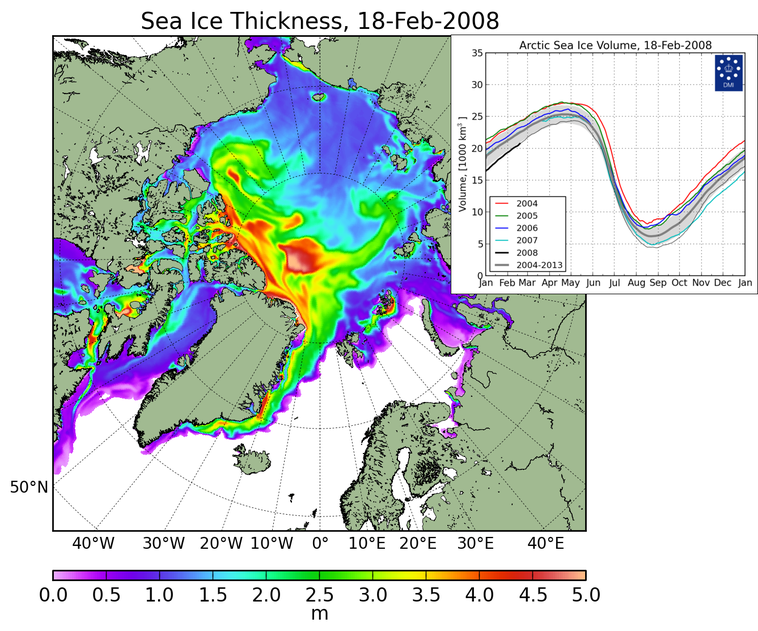
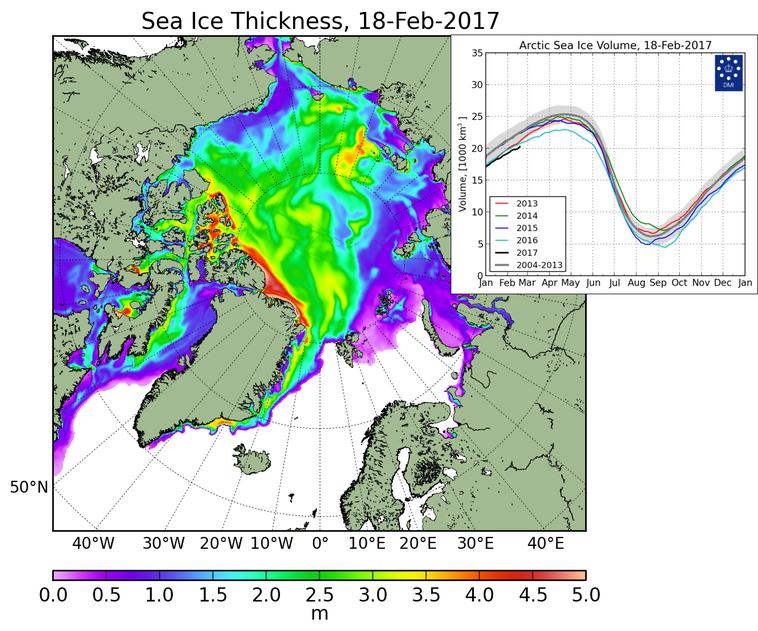
But that ever-diligent blogger Paul Homewood has drawn on official sources such as the US National Snow and Ice Data Center to uncover what is actually happening. Under “Arctic Fake News”, on NotALotOfPeopleKnowThat, he posted a graph showing that last week the extent of sea ice was much the same as it has been at this date ever since 2001. Indeed, according to the Danish Meteorological Institute, there is even more of it today than in February 2006, and it is also significantly thicker. Back in 2008 much of the ice was only a metre thick. Today that has risen to two metres, and in some places four.
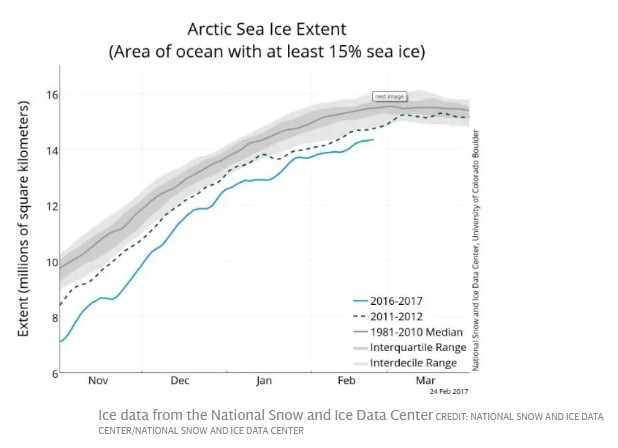
Mr. Booker appears to be more than somewhat confused, since this is what the DMI Arctic sea ice extent graph he links to reveals:
In addition the DMI thickness maps he refers to aren’t available at any of the places he mentions! Not a lot of people know that he was probably thinking of another recent article by Paul Homewood entitled “Arctic Ice Fake News“, which includes these two DMI thickness maps:
Even without considering other sources of Arctic thickness and/or volume data it is quite clear from the two volume graphs that according to the Danish Meteorological Institue Arctic sea ice volume is significantly lower this year than it was in 2008. If Arctic sea ice extent is greater this year and the volume is lower then the laws of physics (which not even the combined talents of Messrs Homewood and Booker can change) dictate that its average thickness must be LESS this year than in 2008!
Mr Booker blunders on:
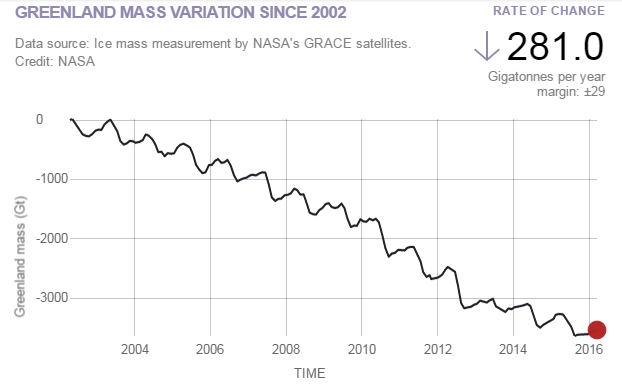
The DMI data also show that the Greenland ice sheet, which we are told is melting at horrendous speed, is actually growing this year at a record rate, to a size way above its average for the past 26 years. And the most authoritative record of Northern Hemisphere snow cover shows this year’s ranking as one of the six highest since 1967.
He seems blissfully unaware that the “DMI data” to which he refers is the output of a DMI climate model that attempts to determine the “surface mass balance” of the Greenland ice sheet. He seems to think it’s a measurement of the mass of the Greenland ice sheet, which it isn’t. However this is, courtesy of NASA:
In his bubble of astounding Arctic ignorance Mr. Booker continues:
The Deplorable Climate Science blog, run by US expert Tony Heller, gleefully reproduces a 2007 headline: “Scientists: ‘Arctic is screaming’, global warming may have passed tipping point”. As Heller comments: “The Arctic is indeed screaming at climate scientists – to shut up.”
Now as luck would have it I have been (vainly!) attempting to persuade Mr. Heller “to shut up” on the very article Mr. Booker references! Let’s take a quick look at a couple of highlights shall we?
It seems safe to assume that Mr. Booker wasn’t reading Mr Heller’s blog on or after February 22nd does it not? Otherwise he would surely have had second thoughts about writing such a ludicrous phrase as “there is even more of it today than in February 2006”?
Then of course there’s the burning question of the “Hottest Arctic on record”
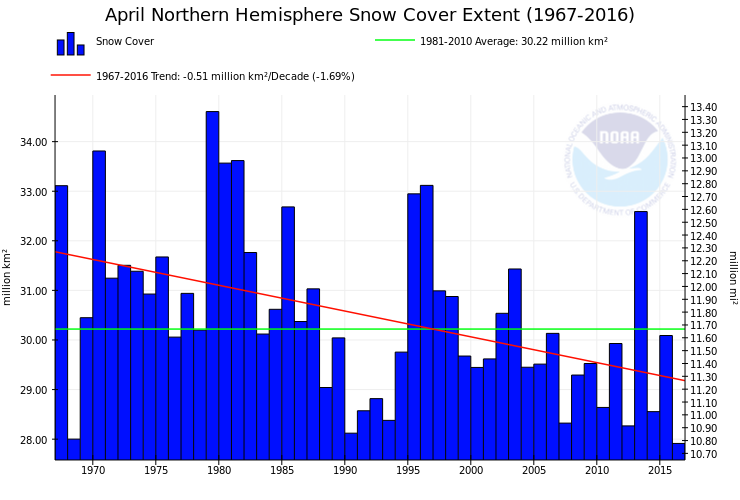
You seem to have forgotten about spring Gail? Here’s April:
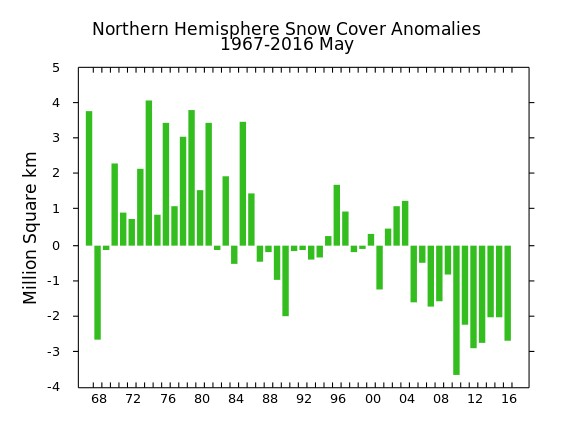
Here’s the May graph from “the most authoritative record of Northern Hemisphere snow cover” for good measure:
To summarise, Messrs Booker and Homewood could have confined their due diligence on their assorted Arctic articles to reading my comments on Mr. Heller’s blog. Having done so it would quickly have become apparent to them that every single point they made was in actual fact a “fake fact”.
The inevitable conclusion is that they have no interest whatsoever in establishing the actual facts about the Arctic. All they are interested in is propagating “fake news” about the Arctic as far and as wide as possible in pursuit of a common “agenda”. As is David Rose.
“Steven Goddard” is evidently magically turning into “Snow White’s” muse. His latest fairy tale addresses her second favourite subject after Arctic sea ice, which is of course northern hemisphere snow cover. The article is entitled “October-March Snow Cover At Record High Levels“, and proudly proclaims that:
Fifteen years ago, climate experts said that snow is a thing of the past. Since then, Northern Hemisphere snow cover has soared to record levels.
What this tells us is that cold air is intruding further south during the snow season. It also tells us that Tom Karl at NOAA is lying about global temperatures.
Snow White and I innocently followed Steve’s link, then clicked on the “Rankings” link on the left hand side, where we discovered this:
not to mention this:
Feeling confident that all the Real Scientists would be interested in the latest data hot off the presses from the Snow Lab we showed them this picture:
and enquired?
What does that tell us?
The initial response from “gator69”?
The fact that you refer to “normal” in climate or weather tells us that you have zero understanding of either.
When will you work to help the starving millions by confronting alarmists, and assist in diverting money to where it is desperately needed right now?
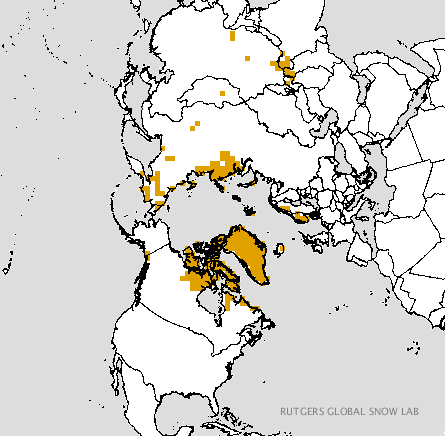
Since “Real Scientists” are apparently aghast at anomaly maps, here are the current absolute values from Rutgers:
Just in case you are wondering what all this has to do with Snow White’s favourite subject of all, here’s the current Topaz 4 map of Arctic sea ice snow cover:
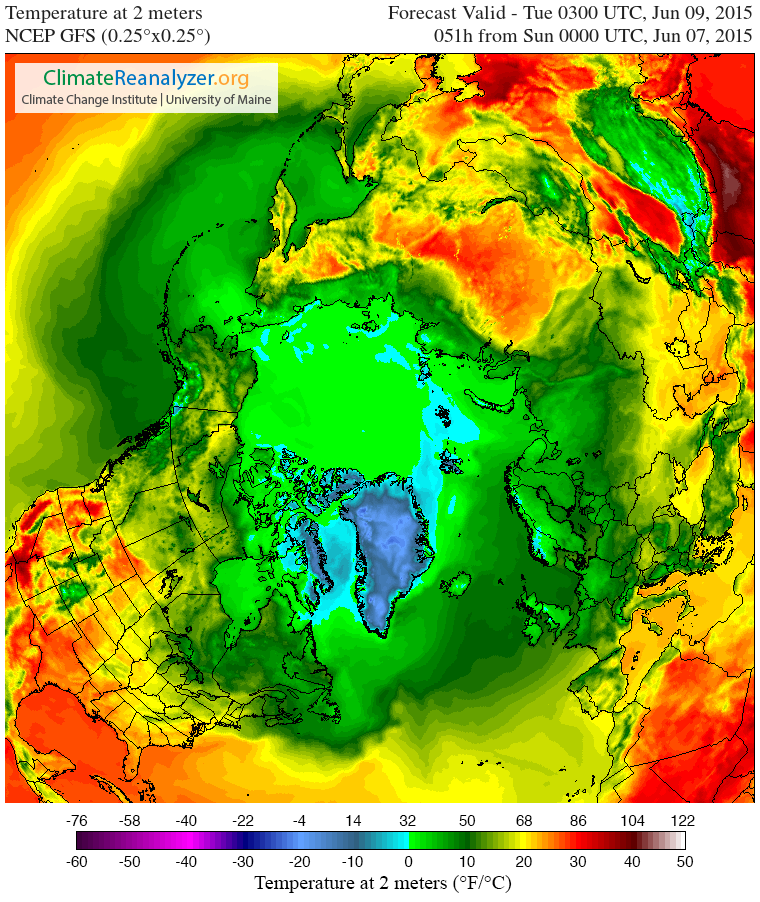
and here is the current northern hemisphere temperature forecast for Tuesday morning from the “Climate Reanalyzer”
Snow White and I cannot help but wonder what effect temperatures above zero across virtually the entire Arctic Ocean will have on the snow cover that currently remains. We also cannot help but wonder whether 2015 Arctic sea ice extent will suddenly start tracking 1995 or 2006 as a consequence.
We also wondered what Tom Karl et al. of NOAA have been saying about the Arctic, and discovered this:
Since the IPCC report, new analyses have revealed that incomplete coverage over the Arctic has led to an underestimate of recent (since 1997) warming in the Hadley Centre/Climate Research Unit data used in the IPCC report. These analyses have surmised that incomplete Arctic coverage also affects the trends from our analysis as reported by IPCC.
Finally, for the moment at least, here’s the Topaz 4 snow depth forecast for June 16th 2015:
Thanks to “Nightvid Cole” and “Vergent” at the Arctic Sea Ice Forum for bringing that view of things to our attention.
This website uses cookies to improve your experience. We'll assume you're ok with this, but you can opt-out if you wish. Cookie settingsACCEPT
Privacy & Cookies Policy
Privacy Overview
This website uses cookies to improve your experience while you navigate through the website. Out of these, the cookies that are categorized as necessary are stored on your browser as they are essential for the working of basic functionalities of the website. We also use third-party cookies that help us analyze and understand how you use this website. These cookies will be stored in your browser only with your consent. You also have the option to opt-out of these cookies. But opting out of some of these cookies may affect your browsing experience.
Necessary cookies are absolutely essential for the website to function properly. This category only includes cookies that ensures basic functionalities and security features of the website. These cookies do not store any personal information.
Any cookies that may not be particularly necessary for the website to function and is used specifically to collect user personal data via analytics, ads, other embedded contents are termed as non-necessary cookies. It is mandatory to procure user consent prior to running these cookies on your website.