“Steven Goddard” is evidently magically turning into “Snow White’s” muse. His latest fairy tale addresses her second favourite subject after Arctic sea ice, which is of course northern hemisphere snow cover. The article is entitled “October-March Snow Cover At Record High Levels“, and proudly proclaims that:
Fifteen years ago, climate experts said that snow is a thing of the past. Since then, Northern Hemisphere snow cover has soared to record levels.
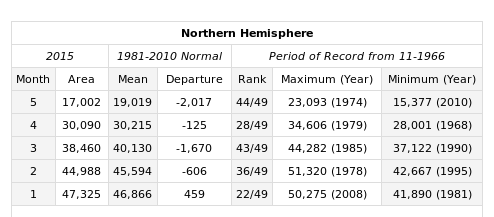
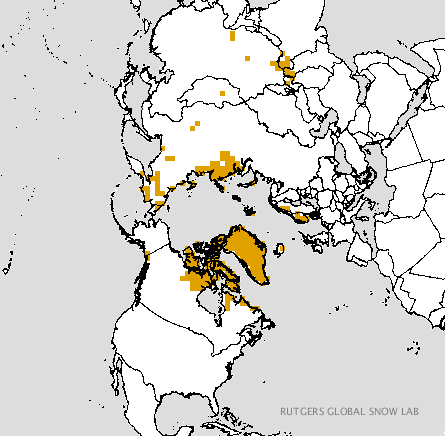
Rutgers University Climate Lab :: Global Snow Lab
What this tells us is that cold air is intruding further south during the snow season. It also tells us that Tom Karl at NOAA is lying about global temperatures.
Snow White and I innocently followed Steve’s link, then clicked on the “Rankings” link on the left hand side, where we discovered this:
not to mention this:
Feeling confident that all the Real Scientists would be interested in the latest data hot off the presses from the Snow Lab we showed them this picture:
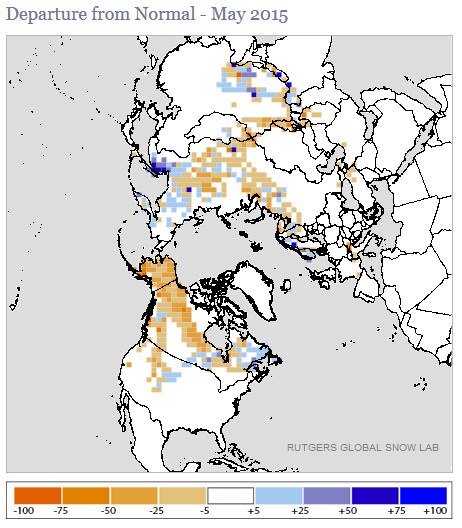
and enquired?
What does that tell us?
The initial response from “gator69”?
The fact that you refer to “normal” in climate or weather tells us that you have zero understanding of either.
When will you work to help the starving millions by confronting alarmists, and assist in diverting money to where it is desperately needed right now?
Since “Real Scientists” are apparently aghast at anomaly maps, here are the current absolute values from Rutgers:
Just in case you are wondering what all this has to do with Snow White’s favourite subject of all, here’s the current Topaz 4 map of Arctic sea ice snow cover:

and here is the current northern hemisphere temperature forecast for Tuesday morning from the “Climate Reanalyzer”
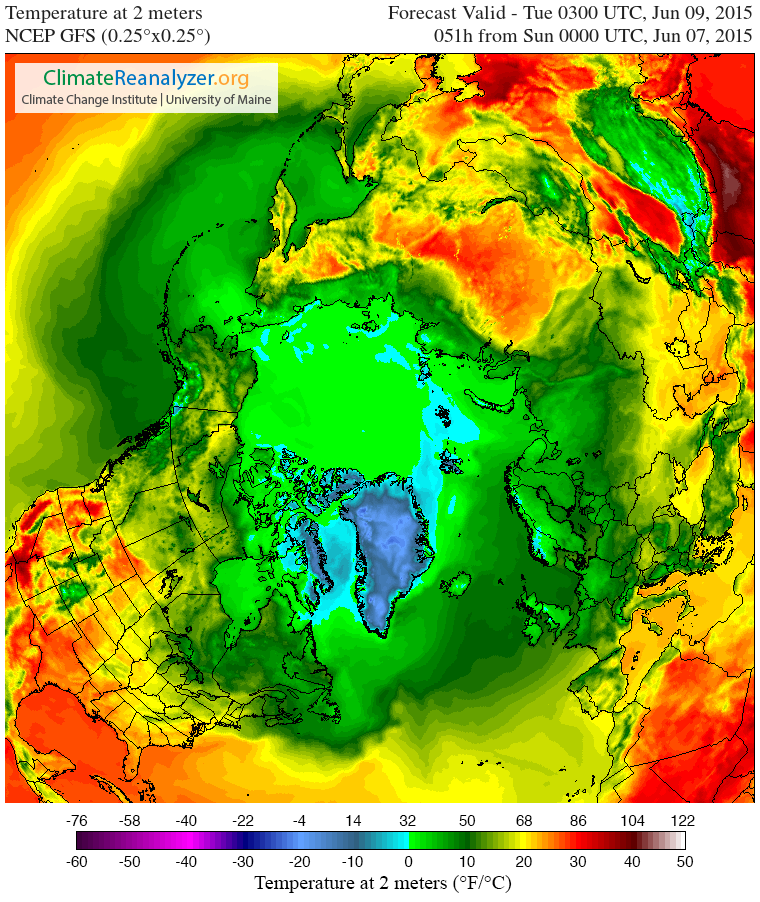
Snow White and I cannot help but wonder what effect temperatures above zero across virtually the entire Arctic Ocean will have on the snow cover that currently remains. We also cannot help but wonder whether 2015 Arctic sea ice extent will suddenly start tracking 1995 or 2006 as a consequence.
We also wondered what Tom Karl et al. of NOAA have been saying about the Arctic, and discovered this:
Since the IPCC report, new analyses have revealed that incomplete coverage over the Arctic has led to an underestimate of recent (since 1997) warming in the Hadley Centre/Climate Research Unit data used in the IPCC report. These analyses have surmised that incomplete Arctic coverage also affects the trends from our analysis as reported by IPCC.
Finally, for the moment at least, here’s the Topaz 4 snow depth forecast for June 16th 2015:

Thanks to “Nightvid Cole” and “Vergent” at the Arctic Sea Ice Forum for bringing that view of things to our attention.
Thanks once again Jim, for all the work you do compiling the facts in the face of continuous contemptible nonsense and insult as argument.
Guys, the Graph Goddard Plotted is Correct…
April 1968 had less Northern Hemisphere snow cover than we have today in 2015… go look at the data … so .. HOW can Snow/Ice be in a DOWNWARD Spiral??
1968 had LESS Snow than 2015.. 47 years later… yet you guys think there’s Global Warming and Snowfall is a thing of the past??
Snow White and the dwarfs here are purposefully missing the point… We’re constantly bombarded with this idea of Global Warming, disappearing Ice, dead Polar Bears, … when … it just isn’t happening. The “Rankings” section does not include data before 1981, so the Cherry Pick here is yours Snow White..
Phil – Is Northern Hemisphere snow cover currently “at record levels”? Was it “at record levels” on June 7th?
Q.E.D?
My pleasure Susan!
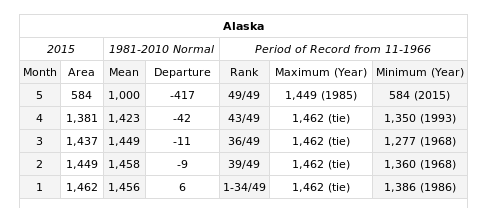
Gator’s contempt knows no bounds, and he’s now in danger of appearing on the leaderboard of our 2015 “New Einstein” award. Here’s his current best effort:
I guess that must mean Alaska snow cover is currently at a record high level after all?
how is the greenland ice sheet doing jim ?
According to the NSIDC:
Nice Try.. that doesn’t really answer it..
Greenland has been GAINING Ice in 2015 just like the Arctic …
You know the drill. Gotta link or 3, or merely evidence free assertions?
Here’s the current Greenland SMB from Steve/Tony’s beloved DMI:
i am surprised you are thanking vergent, jim . he appears to be assuming the role the frivolous one occupied last melt season. namely that of true believer of mid range forecasts and “reanalysis” data .
it is interesting to note that despite the tone of the posts on the asif ,the predictions for september extent are mostly in the realist band,with only a few outliers at the low end.
the next time any of them ask the question of why all the thin and broken ice is not melting as per forecasts, ask them what is the maximum thickness ice achieves in the arctic. if they are starting from the premise the thickest ice in the arctic is as displayed on the charts of modeled ice such as hycom,ie 5m ,and they also believe all the ice displayed as sub 2 m thick on these charts is really sub 2 m thick, then maybe they might , just might , be able to figure out where they are going wrong 😉
Chilly – By way of a change this post is about snow area/depth, not ice extent/thickness. Did you read the headline?
Do you have any comment to make about Tony Heller claiming that “Northern Hemisphere snow cover has soared to record levels” when the latest data from his chosen source reveals that it is in fact 44th lowest out of 49?
Here’s the latest Topaz 4 “nowcast” for June 16th:
to be fair jim, i thought the greenland ice sheet was covered in very deep snow at the moment 🙂 i have to agree with you, whilst northern hemisphere snow cover has been increasing from a low around 1990 ,it is well below record levels currently,based on the available data i have looked at.
Greenland is finally warming up. Melt area is now >2 sigma above “normal” according to the NSIDC:
Same ol, same ol. A link to this got me banned from WTFUWT.
http://s1215.photobucket.com/user/technophile50/media/snocoveranomaly.jpg.html?o=3
[Displayed the image – Jim]
to be fair,you might need to display a longer time series to make that point,6 years in the middle of nowhere could well be described as cherry picking. i do not know that it is,or is not. however if you were to display the entire satellite era it may carry a bit more weight,maybe even just 2000 to 2014 might make the point a bit better.
Since I normalized to the monthly averages of the full data range, the earliest years show a positive bump in summer snow cover. The computer with the spreadsheet crashed, & I haven’t bothered to find my backup. The reason the data only goes through 2009 is because that was the last full year at the time I did the analysis & posted it to WTFUWT. It would be interesting to extend the analysis through 2014, as well as comparing North America with Eurasia. The August North America average for 1974-1983 is 1.295, Stdev 0.366; 2005-2014 Aug avg is 0.395, Stdev 0.144.
For those who didn’t click on the link, a little background is in order. This graph is derived from North American Rutgers data of monthly snow cover from 1967 to 2009. I normalized the data to the monthly averages and then calculated the deviations. (Normalizing the data supresses noise caused by small relative changes in larger absolute snowfall cover numbers – e.g, if I lose 8 kg, its only 10 percent of my body weight, but if a sick 32 kg child loses 8 kg, that’s a serious change)
thanks for the explanation brian. that is actually a very clear image of what you state . jim might want to use that in one of his posts.
any chance you could have a word with buddy and the tinfoil man on the asif jim ?according to buddy the greenland ice sheet is on the brink of collapse. some of these guys are really dragging down the quality of the very good site/forum neven has created.
lots of informative discussion unfortunately interspersed with an increasing amount of hyperbole .
You will no doubt be pleased to learn I have had a few words with Vergent about increasing the signal to noise ratio over on the Arctic Sea Ice Forum.
He doesn’t seem to have got the message yet though!
thanks jim. it is hard enough work for neven and the guys like Chris Reynolds as it is ,without having to deal with the hyperbole. i notice chris seems to be getting a bit worn down by dealing with the more “enthusiastic” contributors.
his input over there is fantastic , and should be appreciated by what appear to be younger and less informed members.
Another week has passed, so here’s the current Topaz 4 Arctic snow depth “nowcast”
almost the exact opposite of last year from what i can remember jim. this year has good cover over the greenland ice sheet (at the moment anyway !) but the sea ice cover appears sparse. that extra volume will come in handy to resist melt, but for how long we will have to wait and see.
The first of July is upon us, so here is Topaz 4 once again. Note the change of scale from 0.3 down to 0.1:
i think there may well be an increase in snow cover in the coming week or so jim. keep an eye on the weather. have to say again,there appears to be a real frenzy of speculation of what is happening in the arctic on the asif yet again. fortunately jim pettit and a few others keep stepping in with some reality.
it is almost like some people are completely disregarding the increase in volume over the last two years and they definitely do not appreciate how thick the ice is in some areas , 10 metre thick ice takes a lot of melting.
Re volume/thickness, I’ve been having a chat to Steve/Tony’s favourite data suppliers at DMI. Here their latest HYCOM/CICE model output:
and
Looks to me like it’s tracking 2011, not 2006 or 1995!
the big problem is it is modeled output jim ,and we all know how far off this can be.
modeling the actual volume involves a huge amount of assumption ,so i cannot place much faith in the results.
Steve/Tony and his band of merry minions currently seem quite content to quote the PIOMAS model without similar caveats though? According to Tony:
but his favourite sea ice specialists at DMI say otherwise!
he may well do jim, but i do not agree . the volume models are wrong from the outset if they place an upper bound of 5m thick ice.
this is maybe worth a viewing for the tinfoil man that cannot understand why the ice is not melting. http://ocean.dmi.dk/arctic/ice_temp/index.uk.php
note the sea surface temp on the pacific side now.
Did you check the date on that picture Chilly? It says “Dec 10 2014”!
Here at GWC we strongly suggest you check our very own resources section in the first instance. How does the up to date version of the DMI SST map strike you?
https://greatWhiteCon.info/resources/arctic-sea-ice-graphs/#DmiSST
By the way, it may interest you to discover that Prof. Peter Wadhams recently suggested that you may lose your bet with me later this very summer!
https://greatWhiteCon.info/2015/07/is-time-running-out-for-arctic-sea-ice/
doh ! ask peter wadhams if he also fancies a bet jim , i know he will not. all academics are the same,too used to not having to worry whether they are right or wrong, unlike engineers whose employment depends on being right all the time:)
a good example here why i do not have much faith in climate scientists,particularly those involved in the arctic . http://www.pri.org/stories/2014-12-11/scientist-unlocks-one-mysteries-arctic-ice-melt if only they had asked an engineer,they would have got the answer immediately.
The bit about how melt water doesn’t drain away instantly, but does in actual fact manage to accumulate into ponds?
I don’t recall you writing a paper on the subject for a scientific journal!
I fancy Peter Wadhams isn’t your average punter. However, if you have a proposition I’ll see if I can forward it to him!
same proposition that you accepted jim ,seems you have more faith than the man himself.
Another week has passed, so here’s the latest Topaz 4 snow cover map:
Note yet another change of scale, from 0.1 down to 0.05
a small hint at the discrepancy between the forecasts that frivolousz 21 gets himself into a frenzy over and reality jim. please read the comments from people actually on the ground regarding forecasts and the reality of the weather up there.
http://northwestpassage2015.blogspot.co.uk/2015/07/for-second-year-anne-quemere-has.html