September is here once again, so the assorted minima of a variety of Arctic sea ice metrics will be reached soon, if they haven’t happened already!
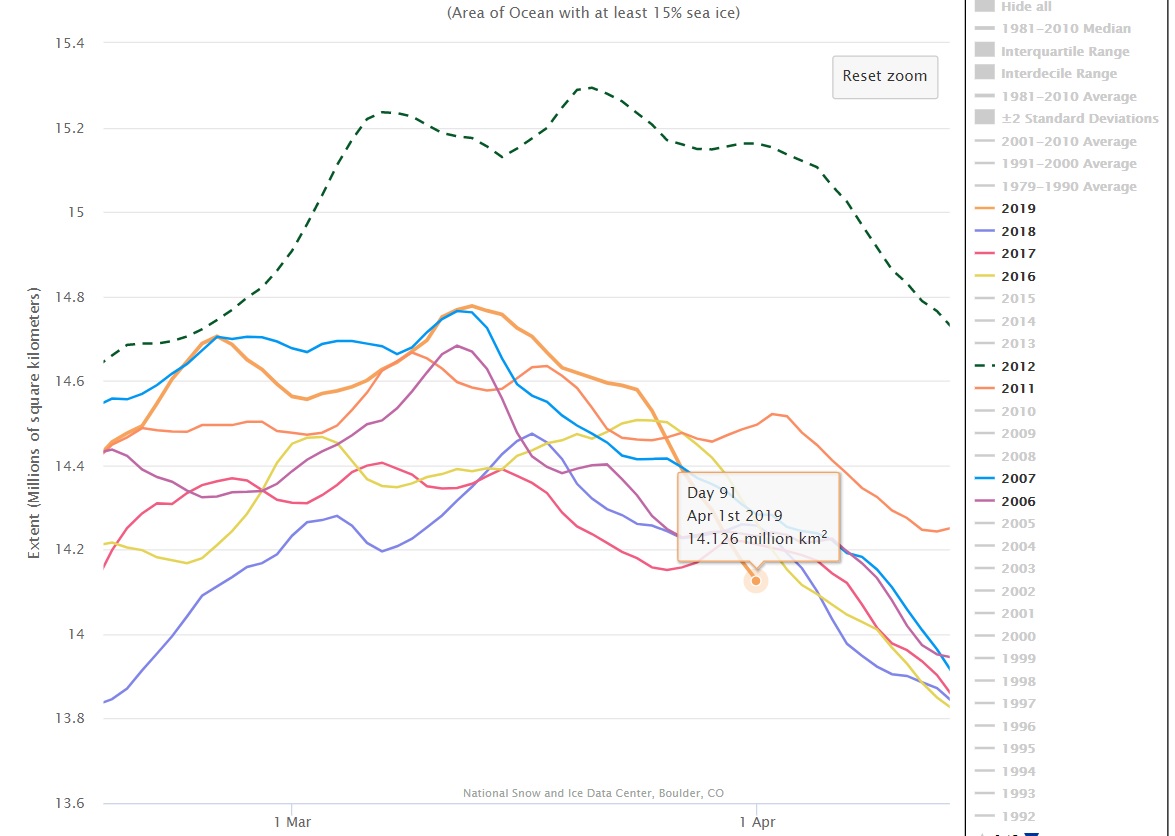
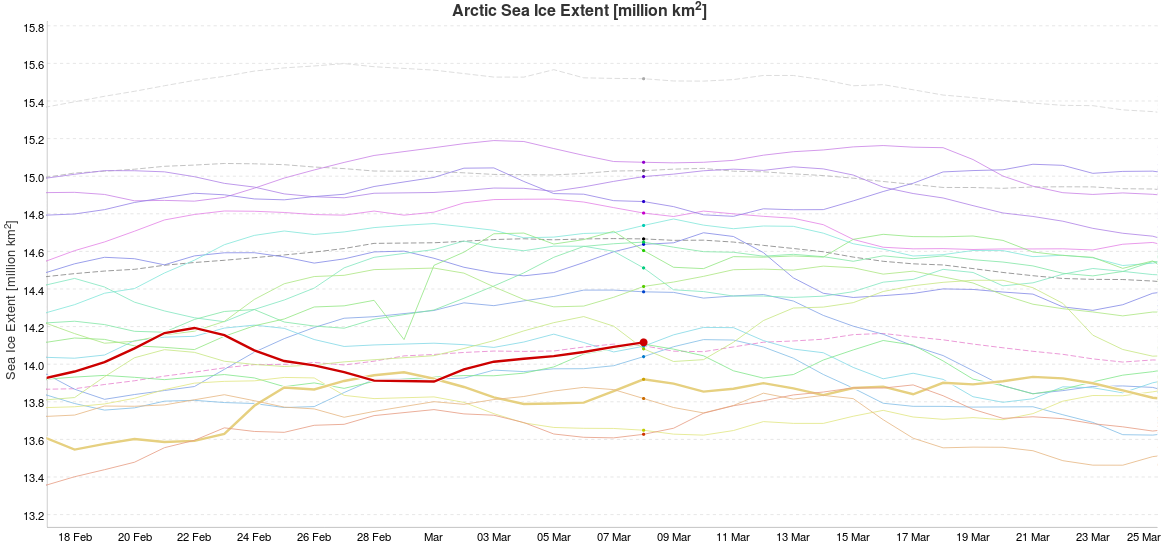
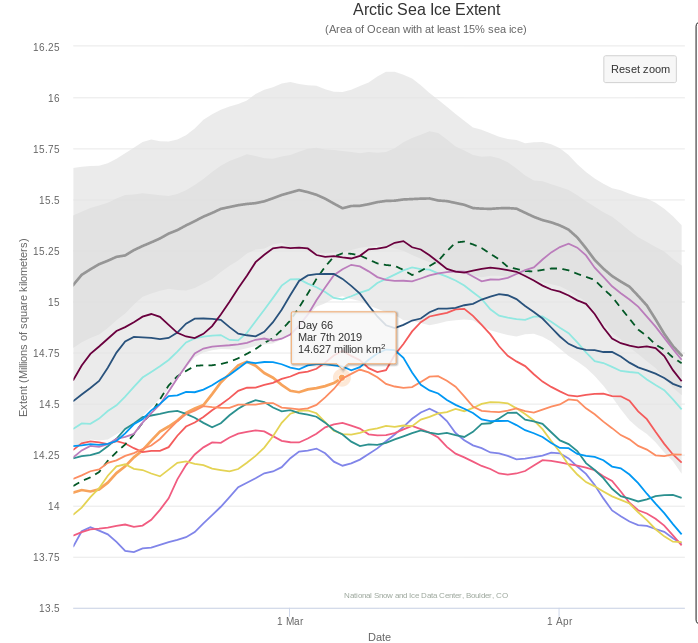
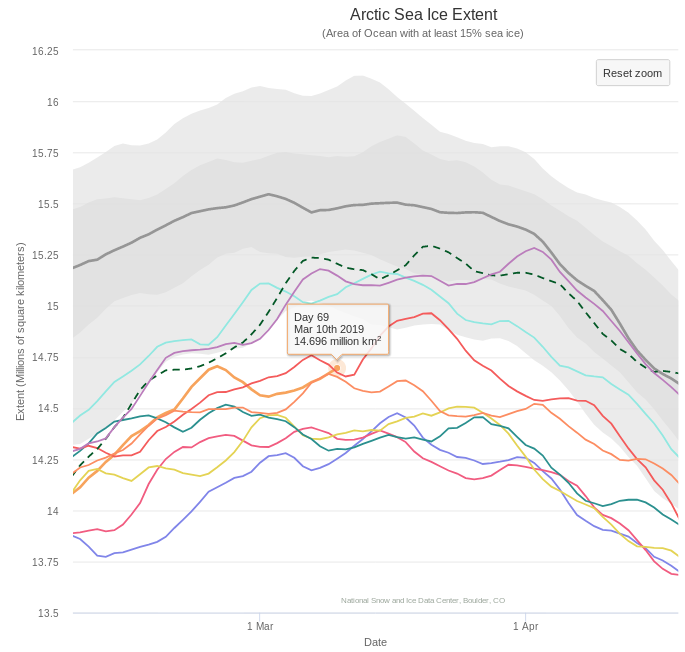
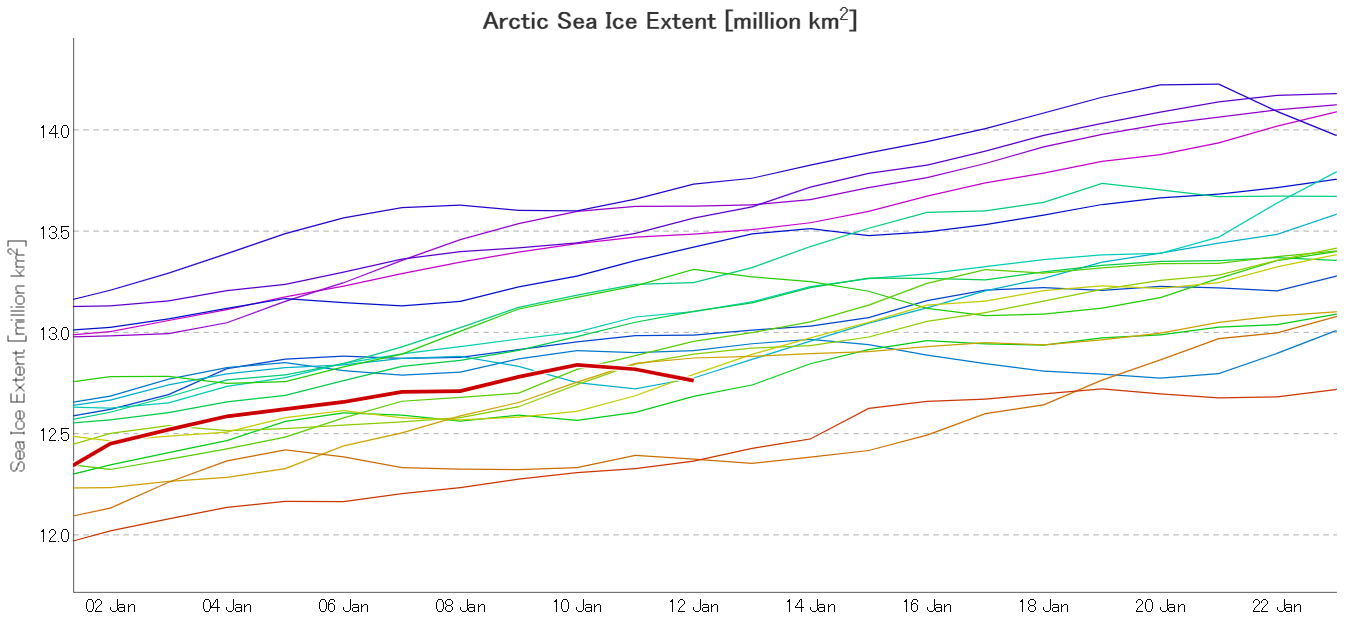
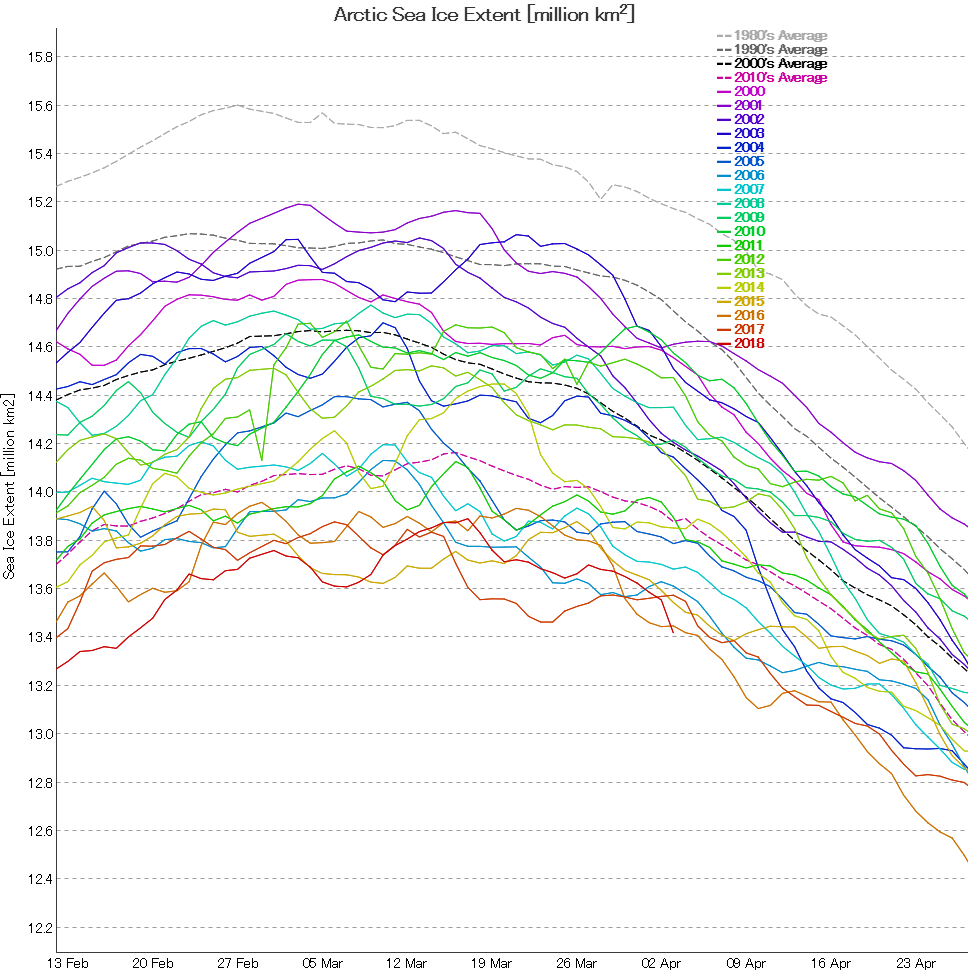
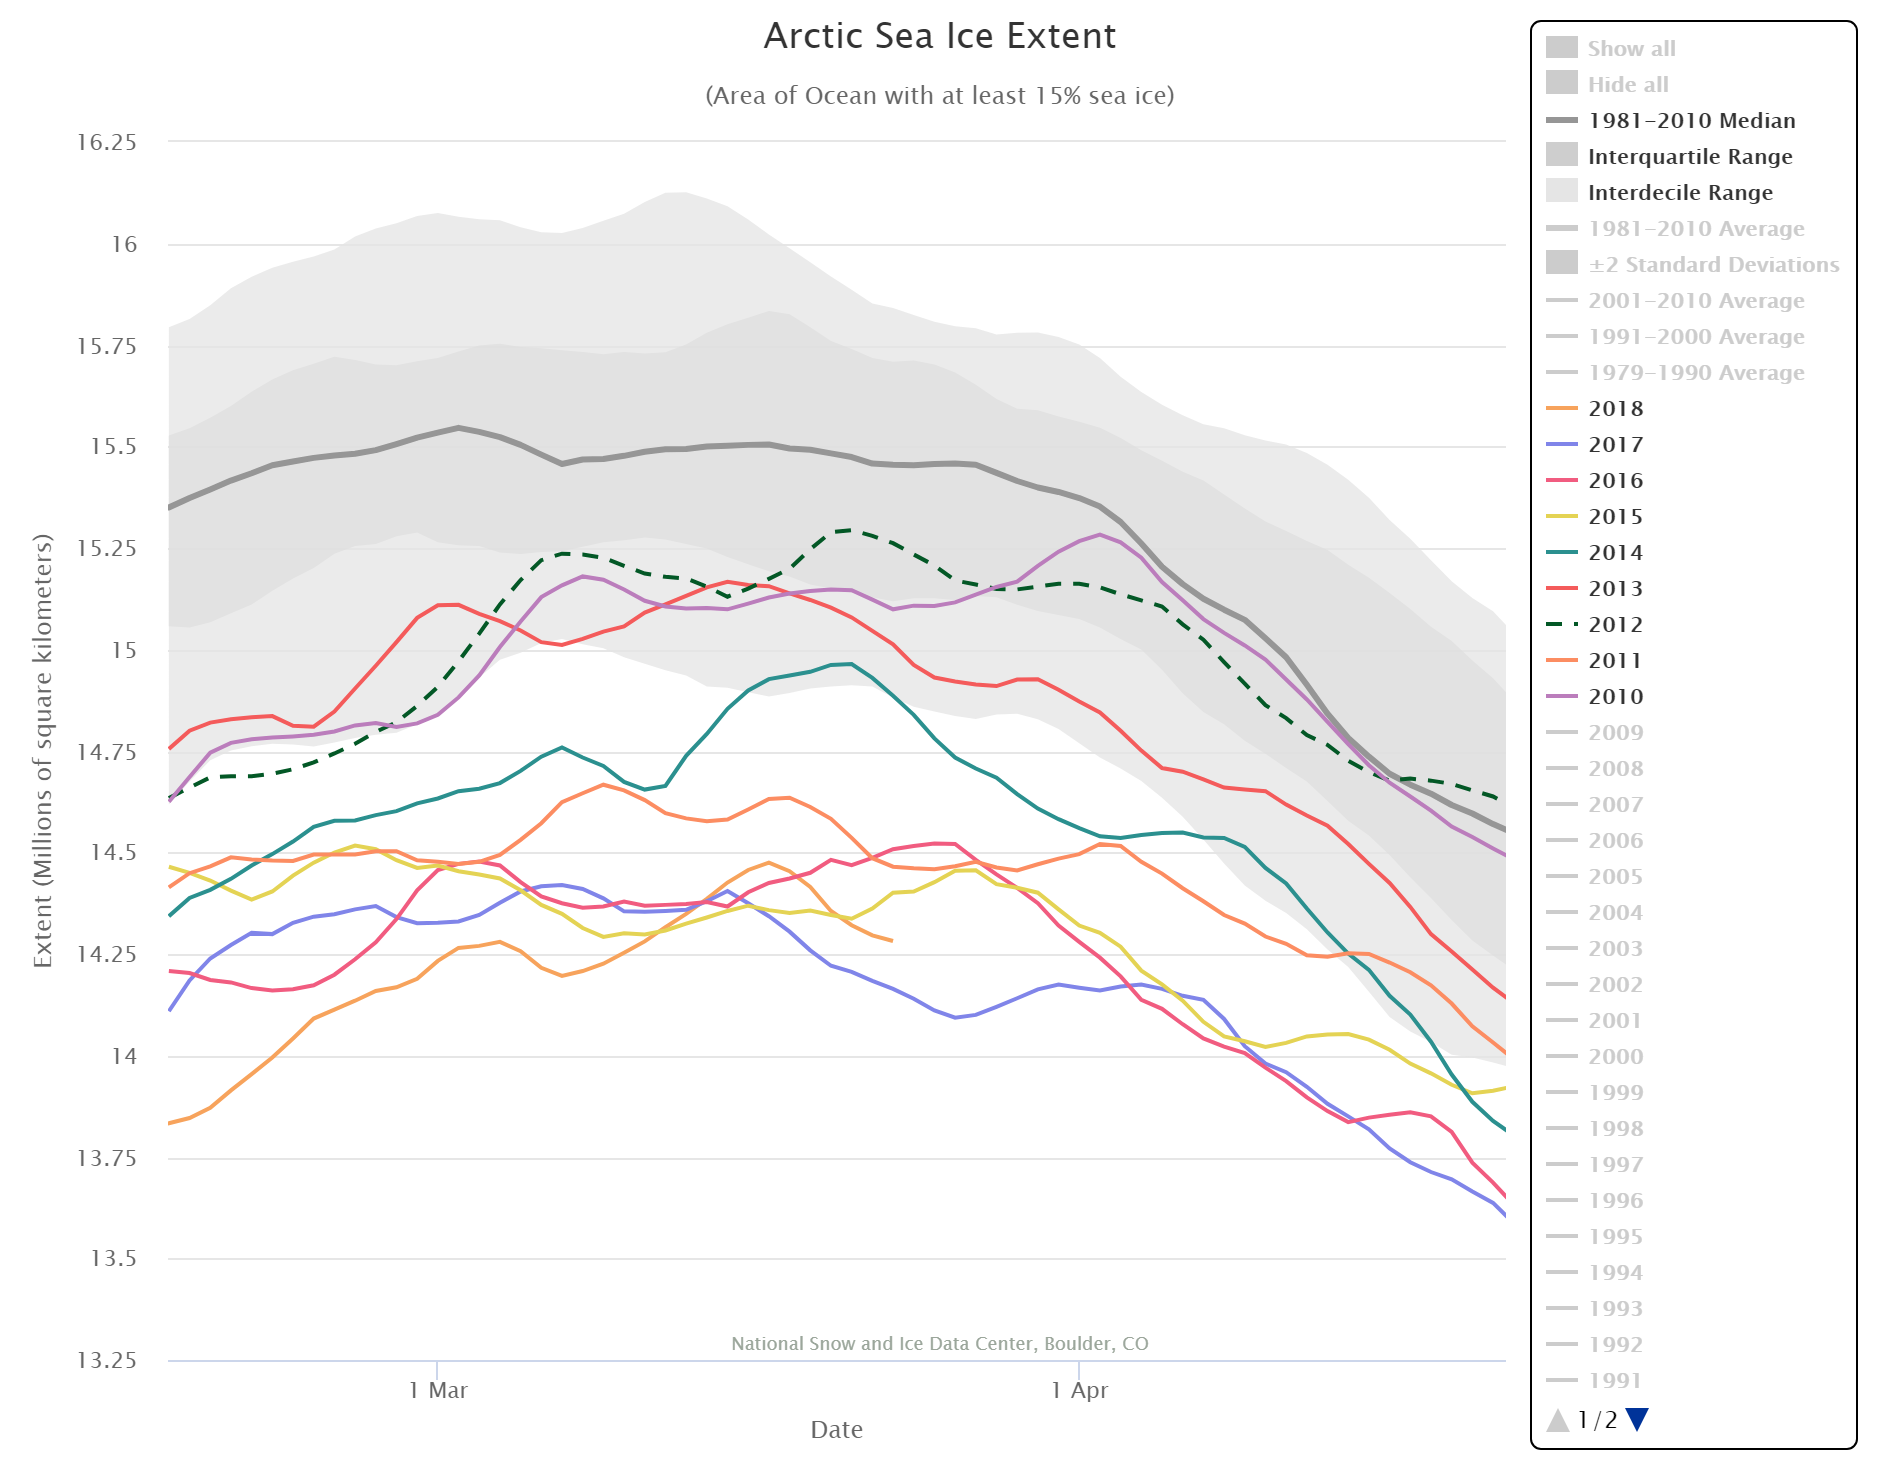
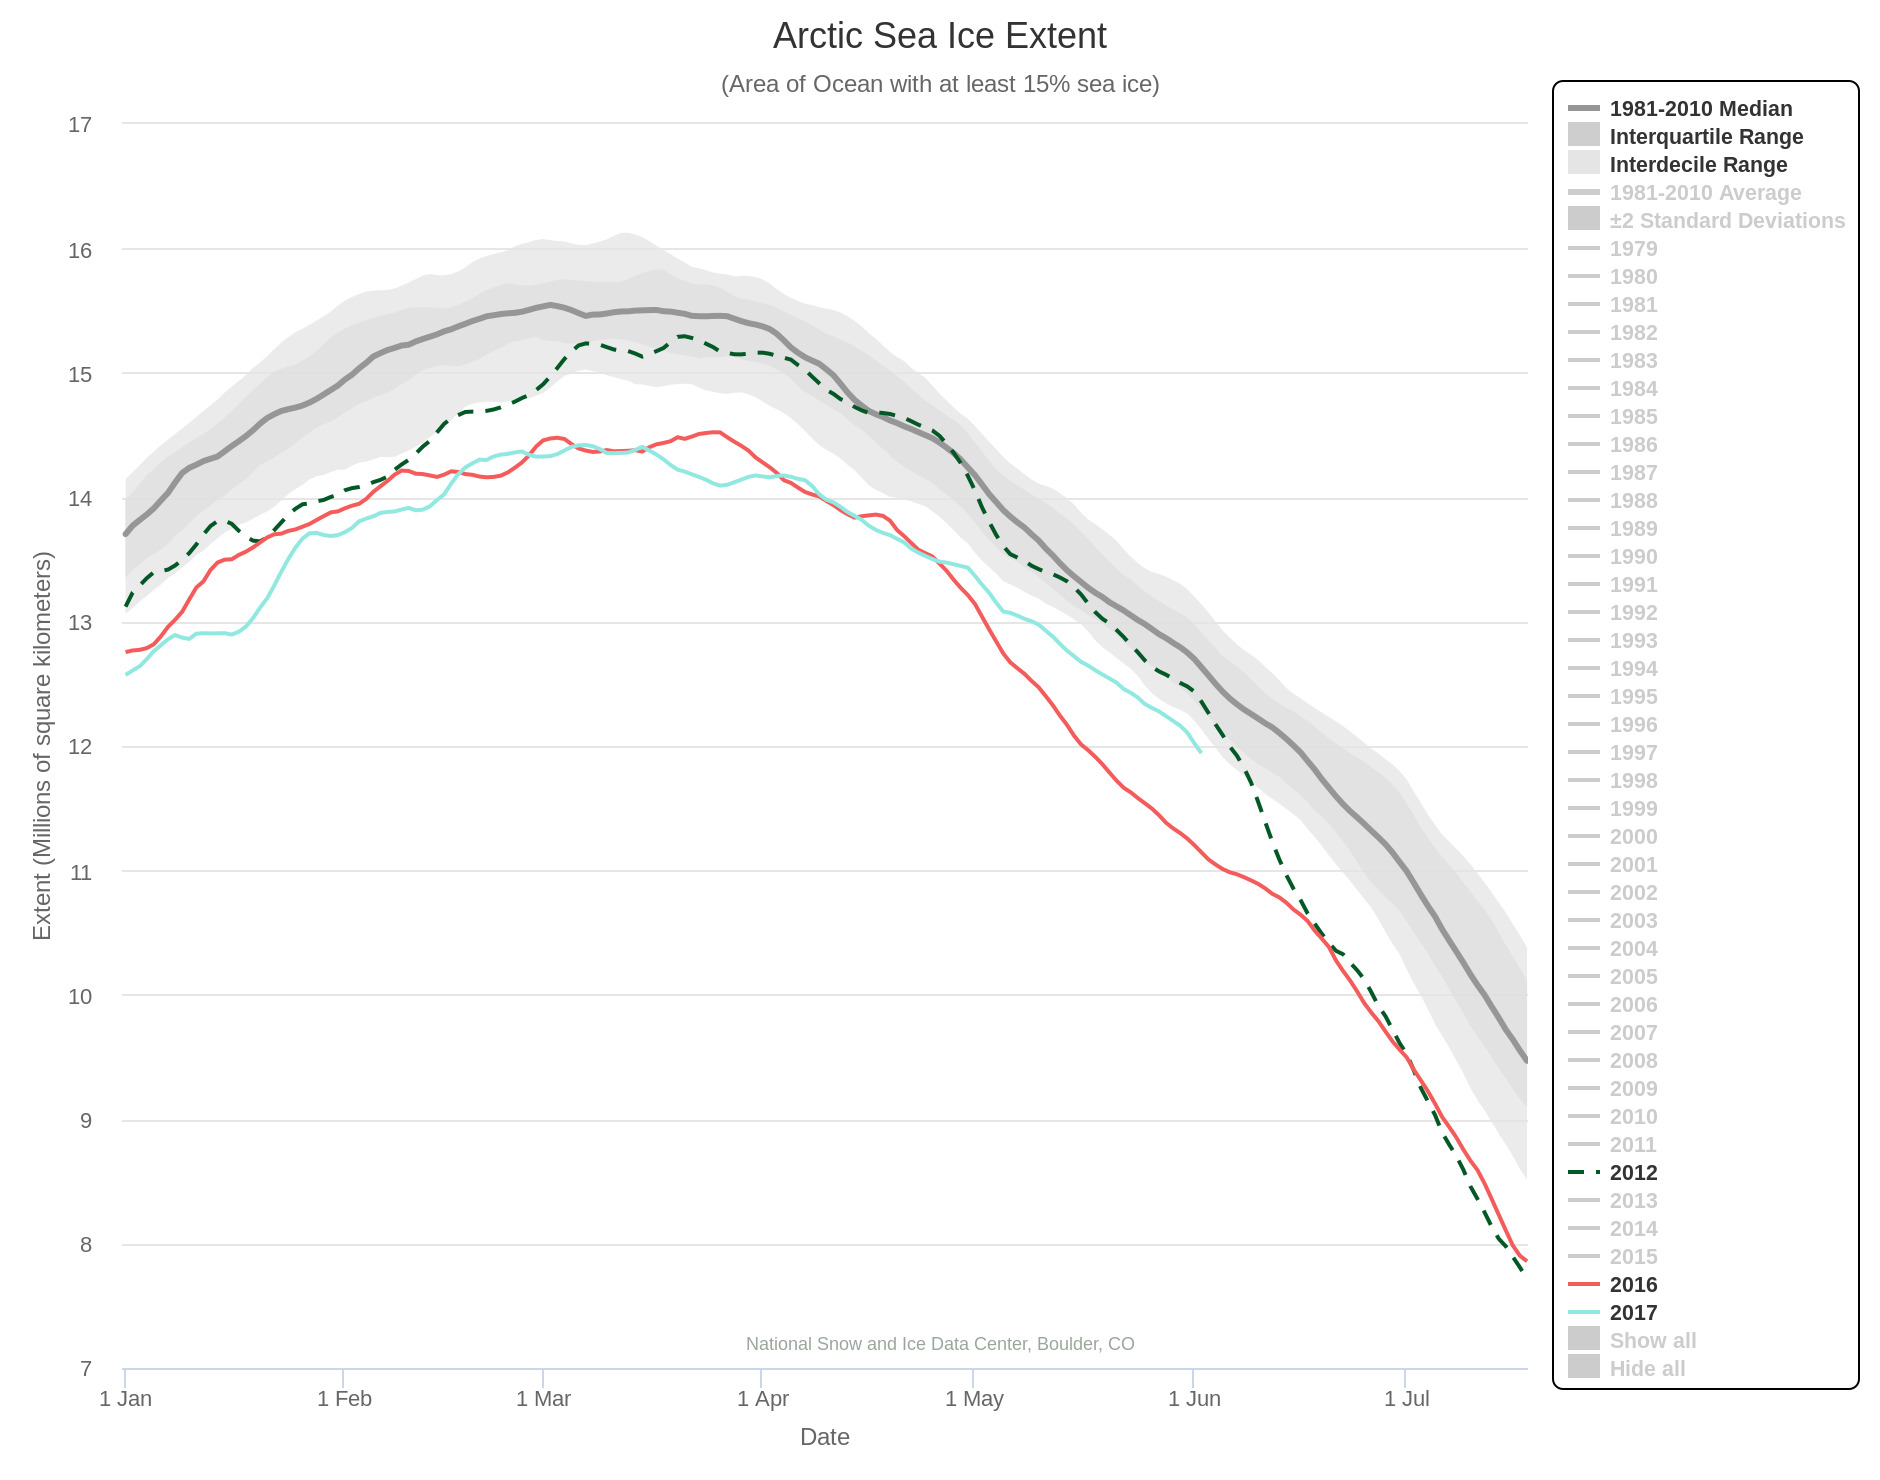
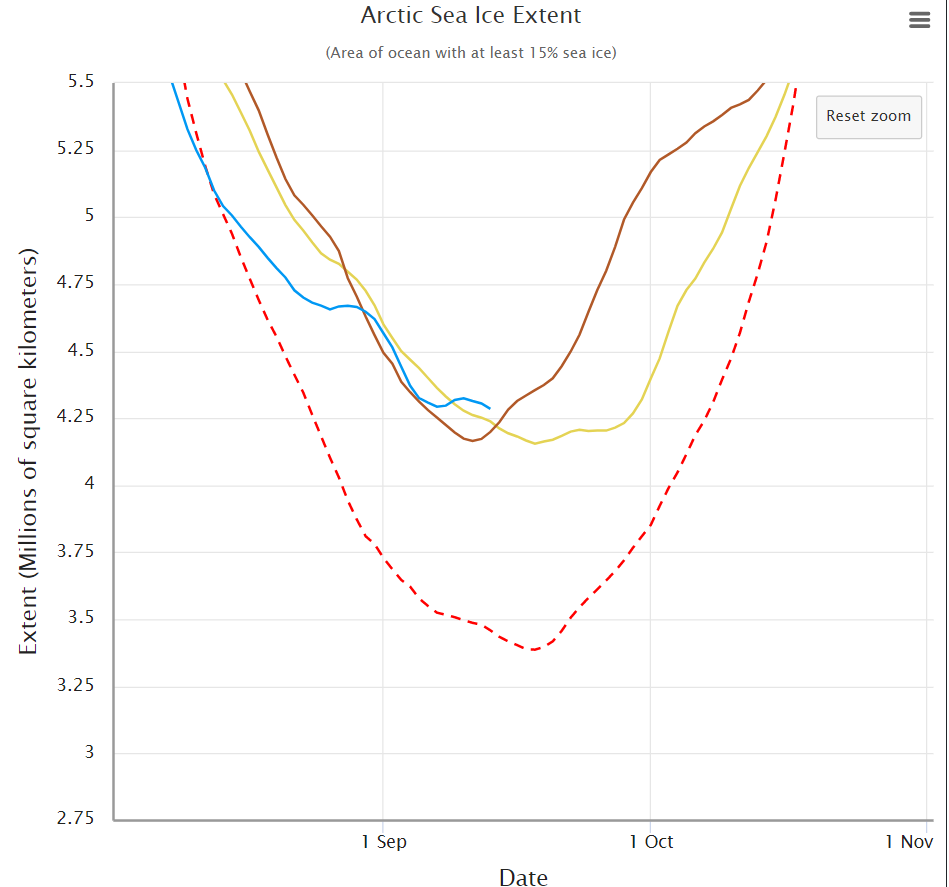
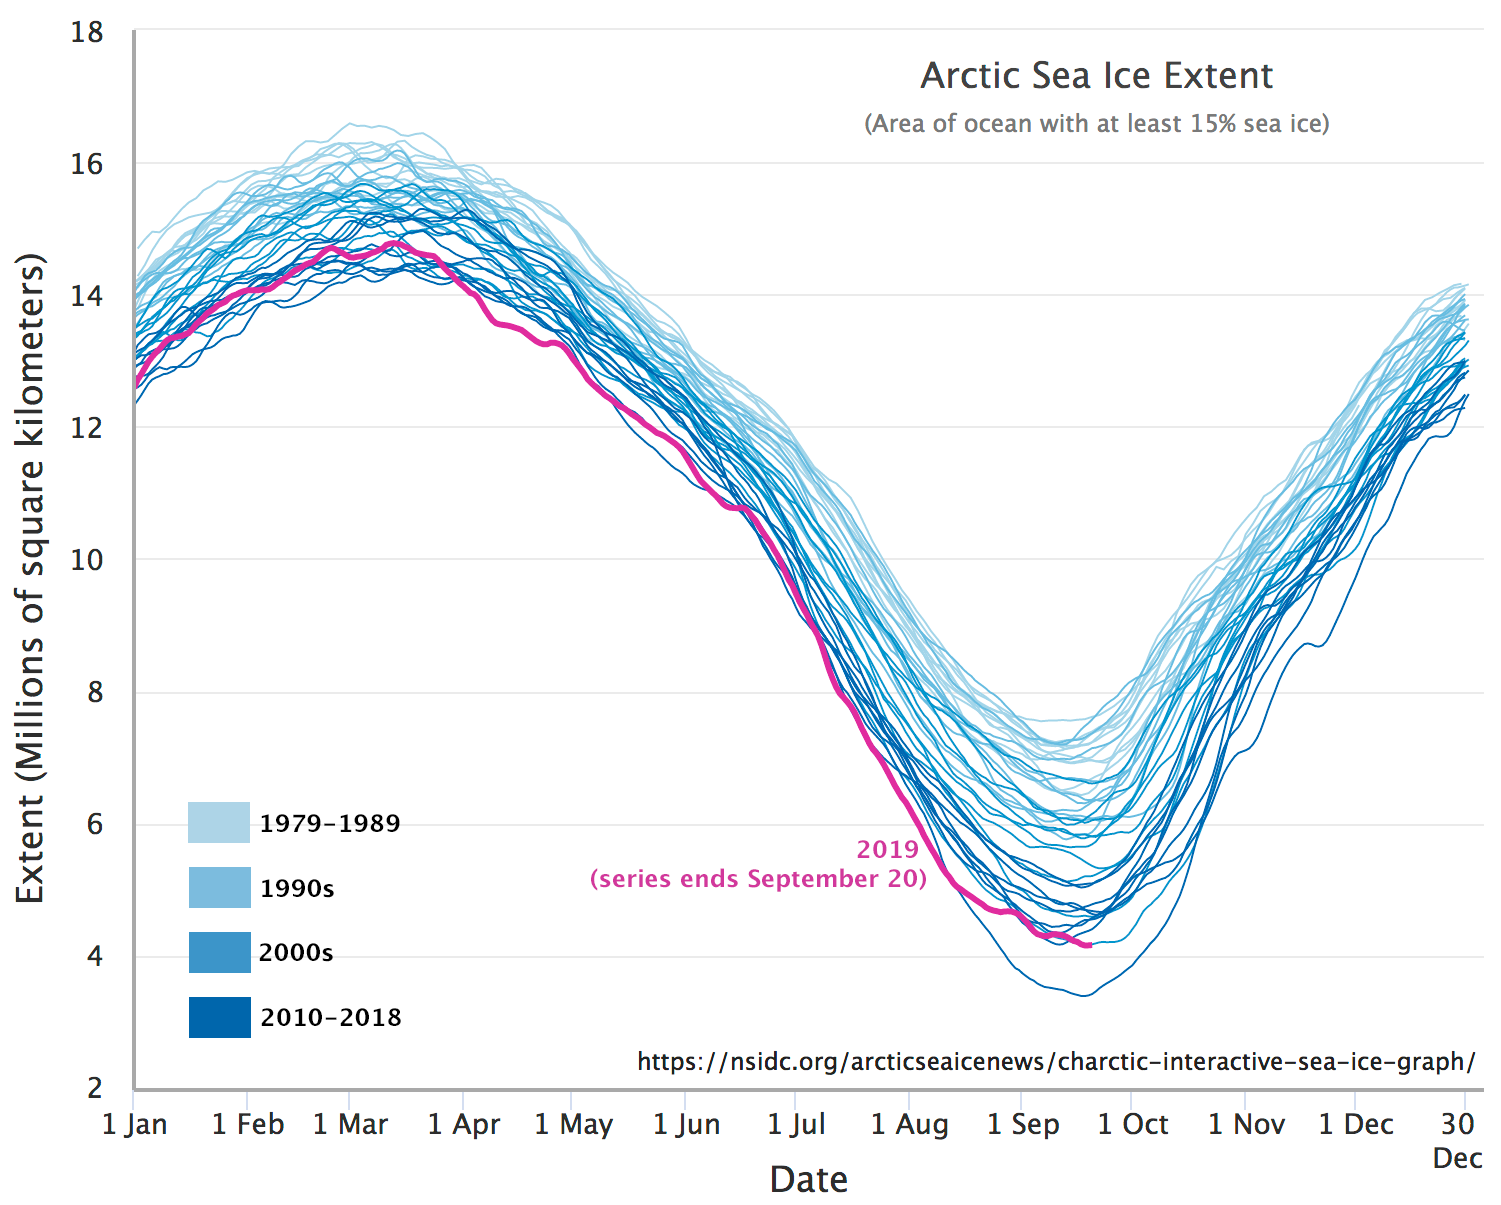
In the latter category let’s first take a look at the NSIDC’s 5 day averaged SSMIS based Arctic sea ice extent:
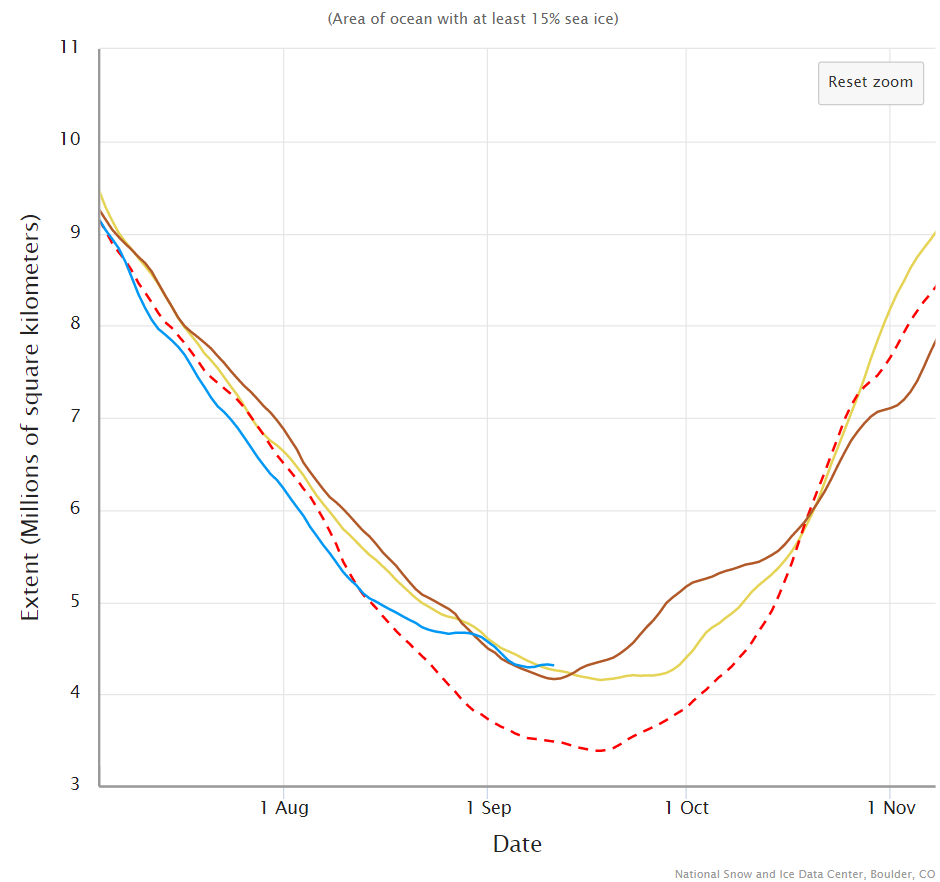
It looks entirely feasible that the current minimum of 4.29 million square kilometres on September 7th will hold for the rest of the calendar year. The daily NSIDC number is currently 4.24 million km² on September 4th.
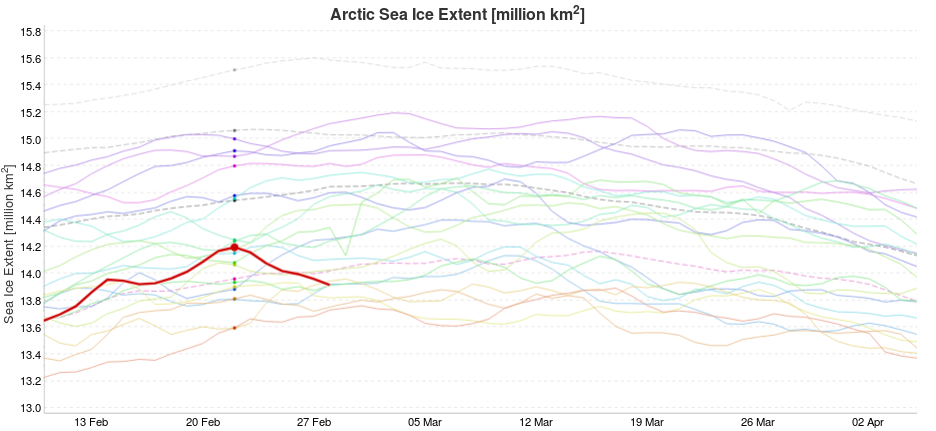
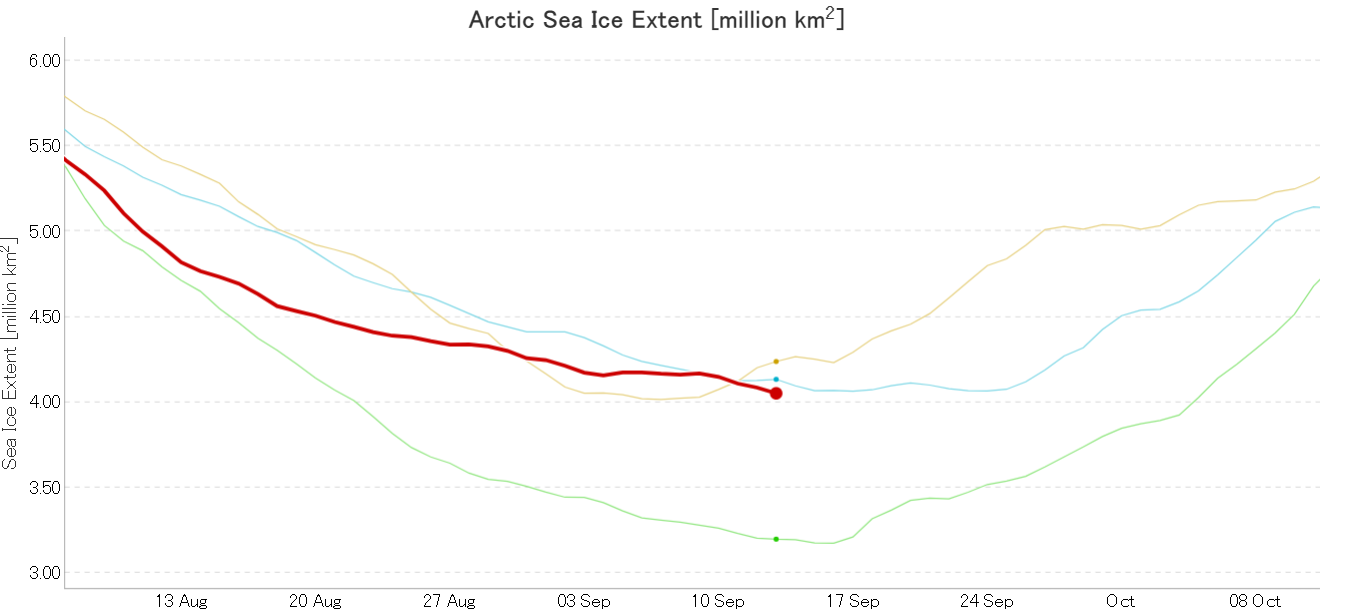
By way of contrast the JAXA/ViSHOP AMSR2 based extent hit a new low of 4.11 million km² yesterday:

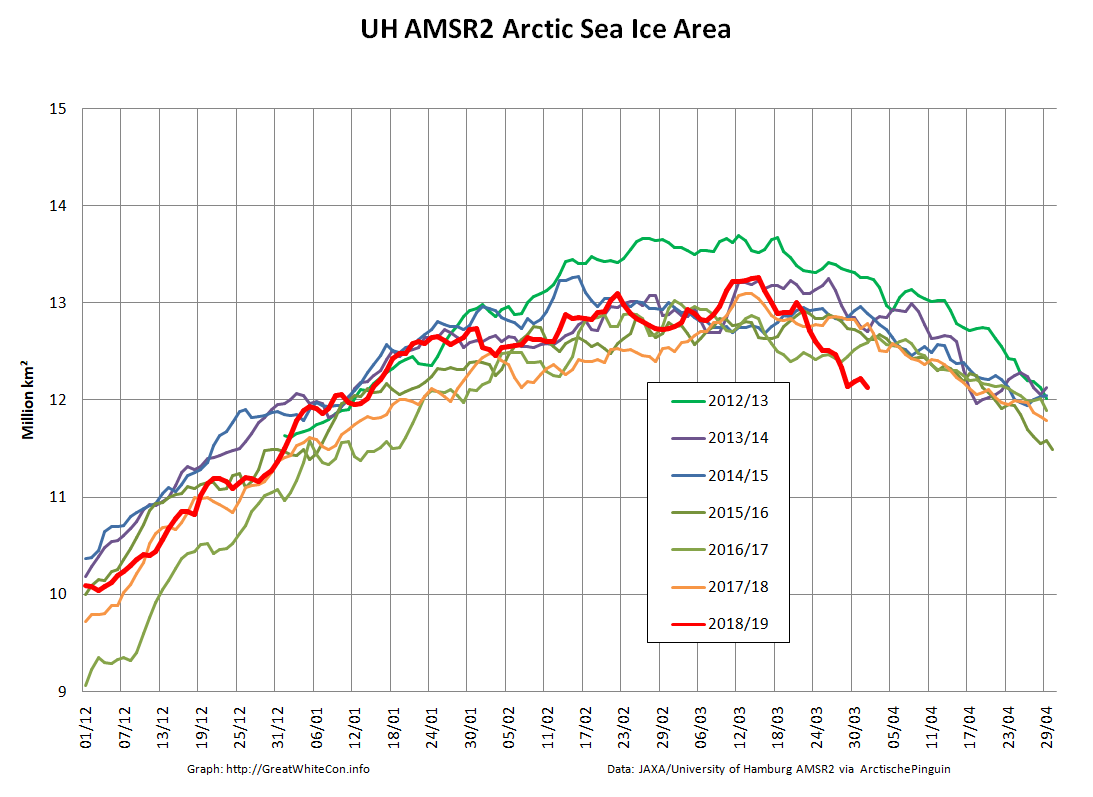
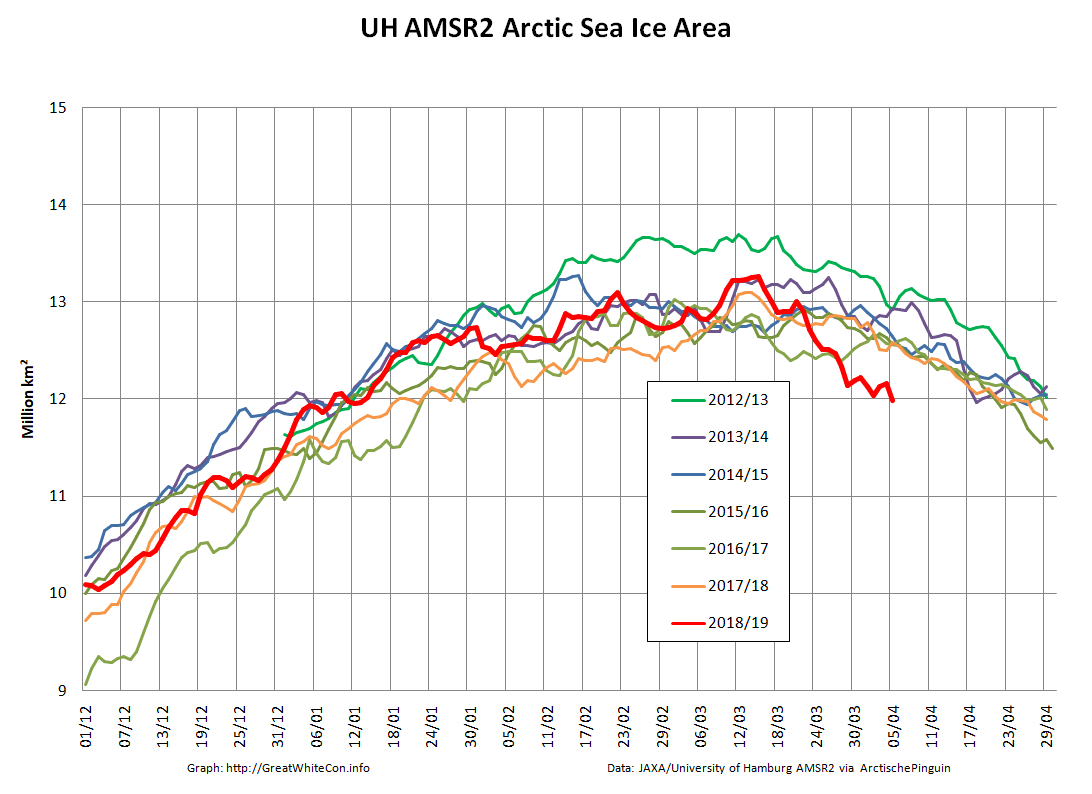
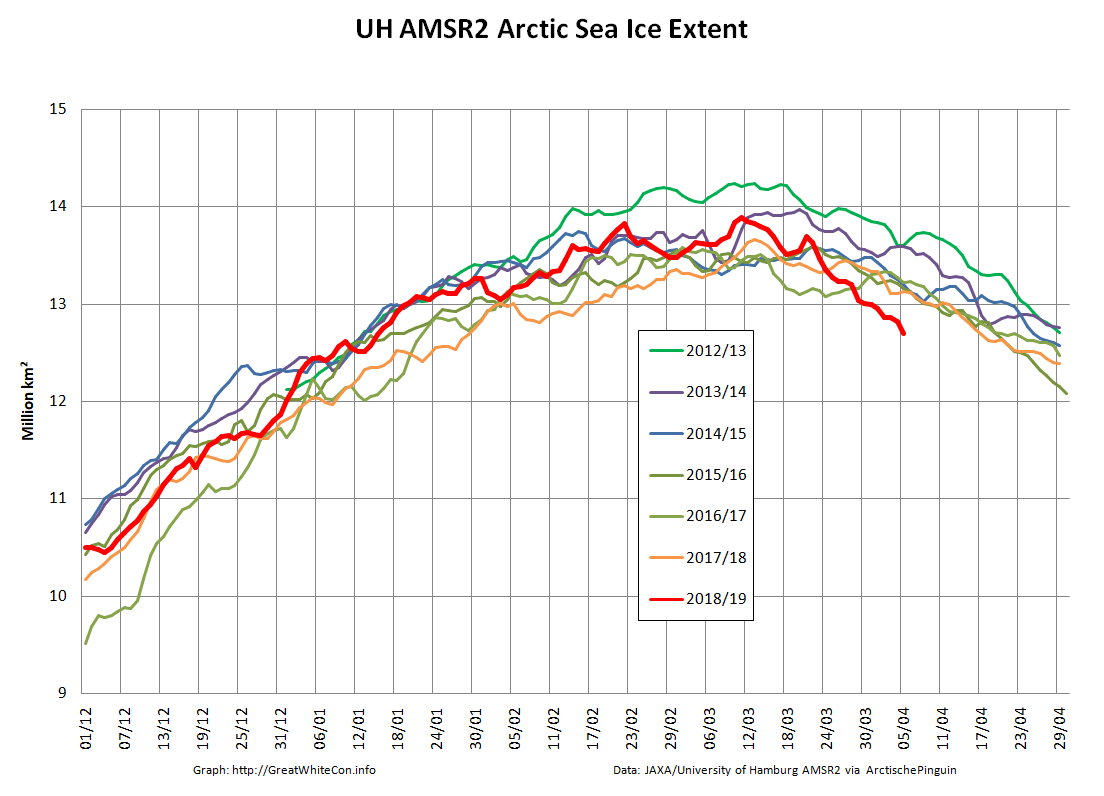
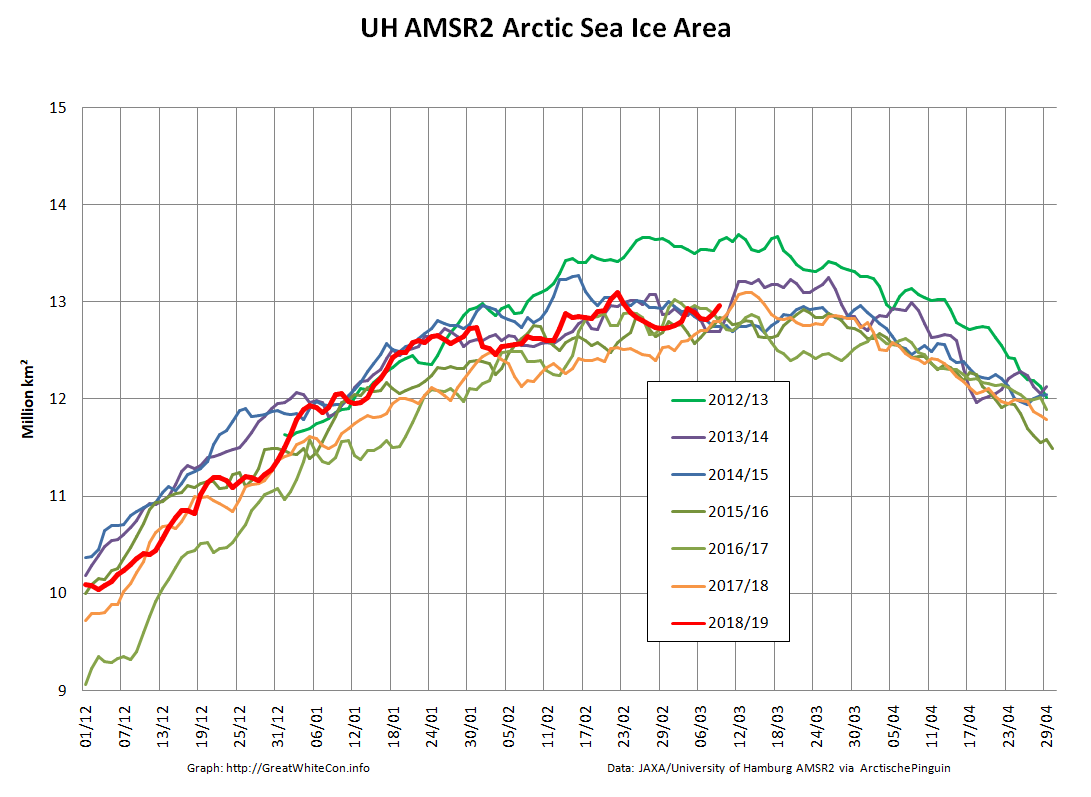
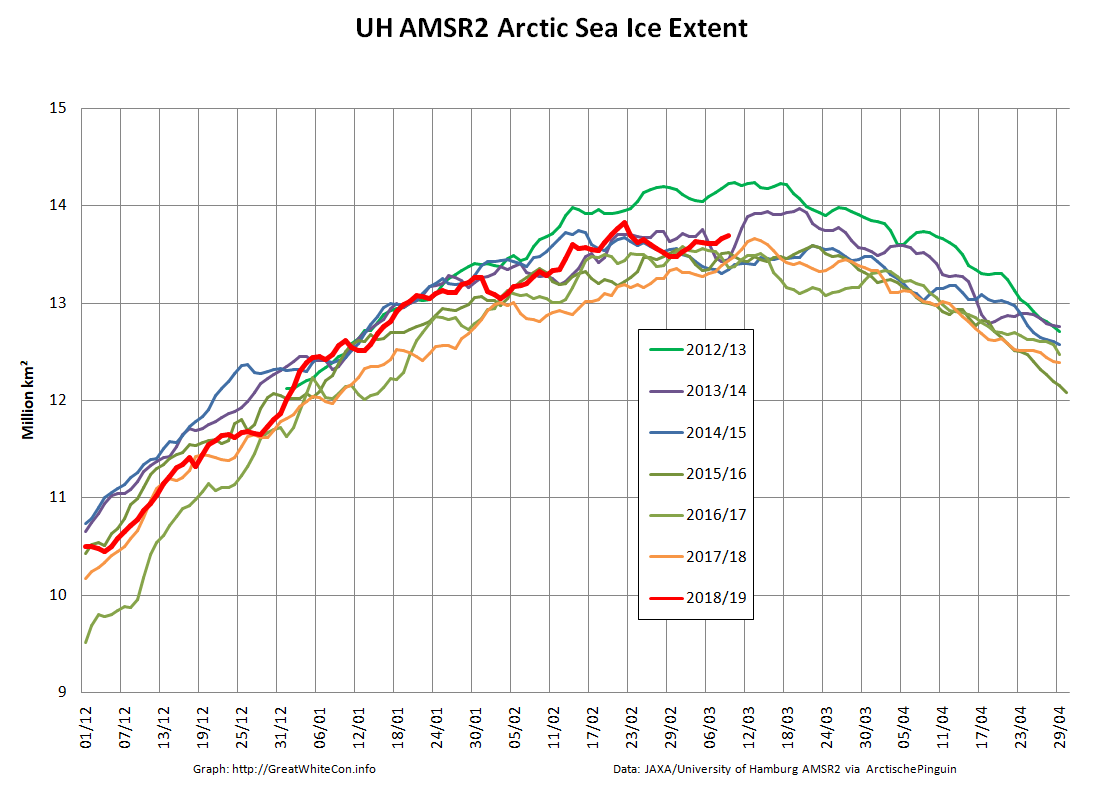
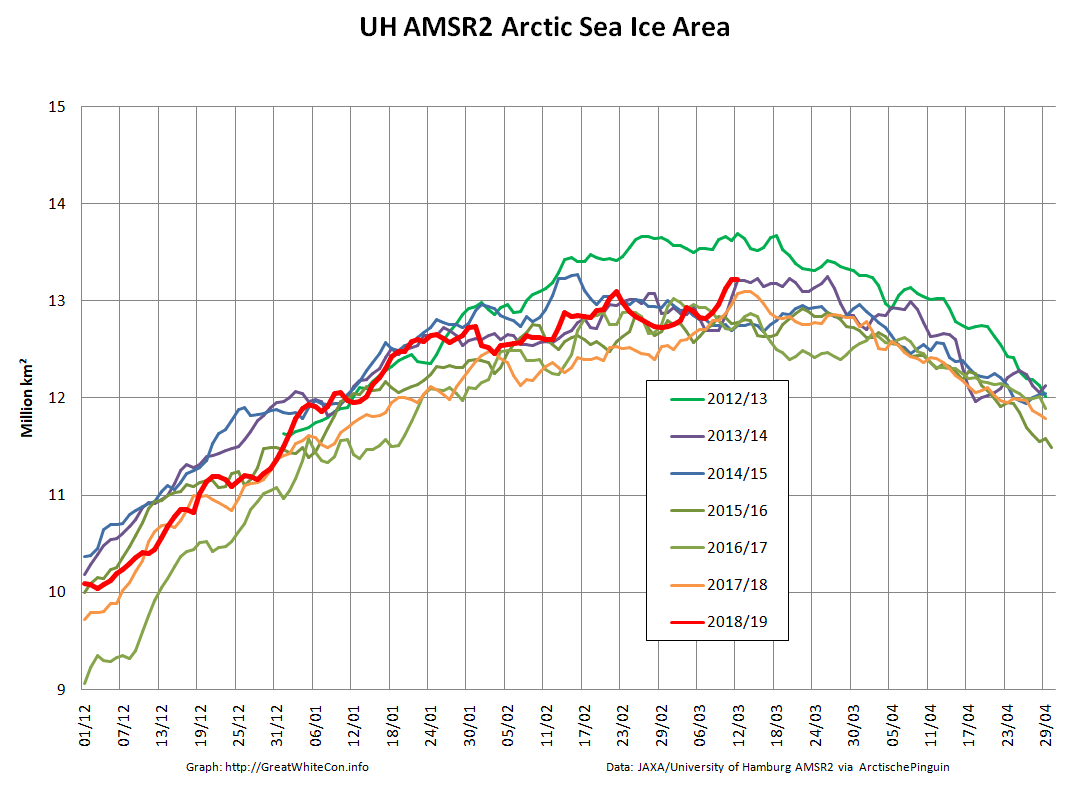
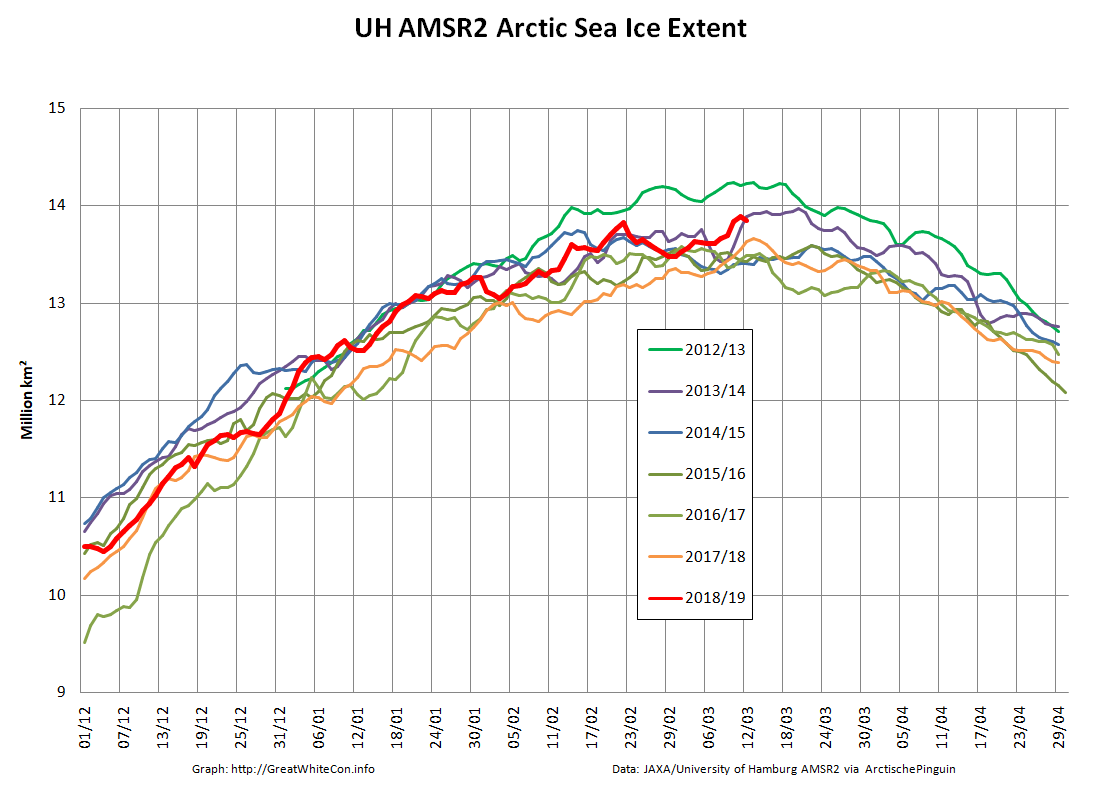
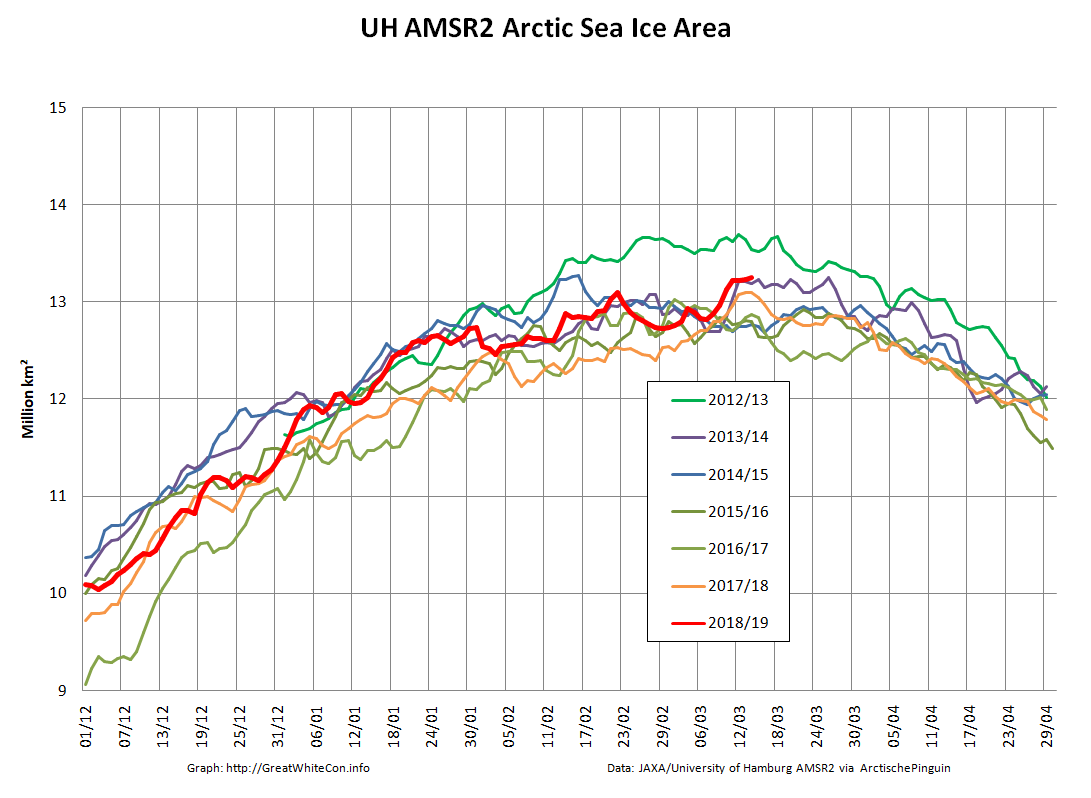
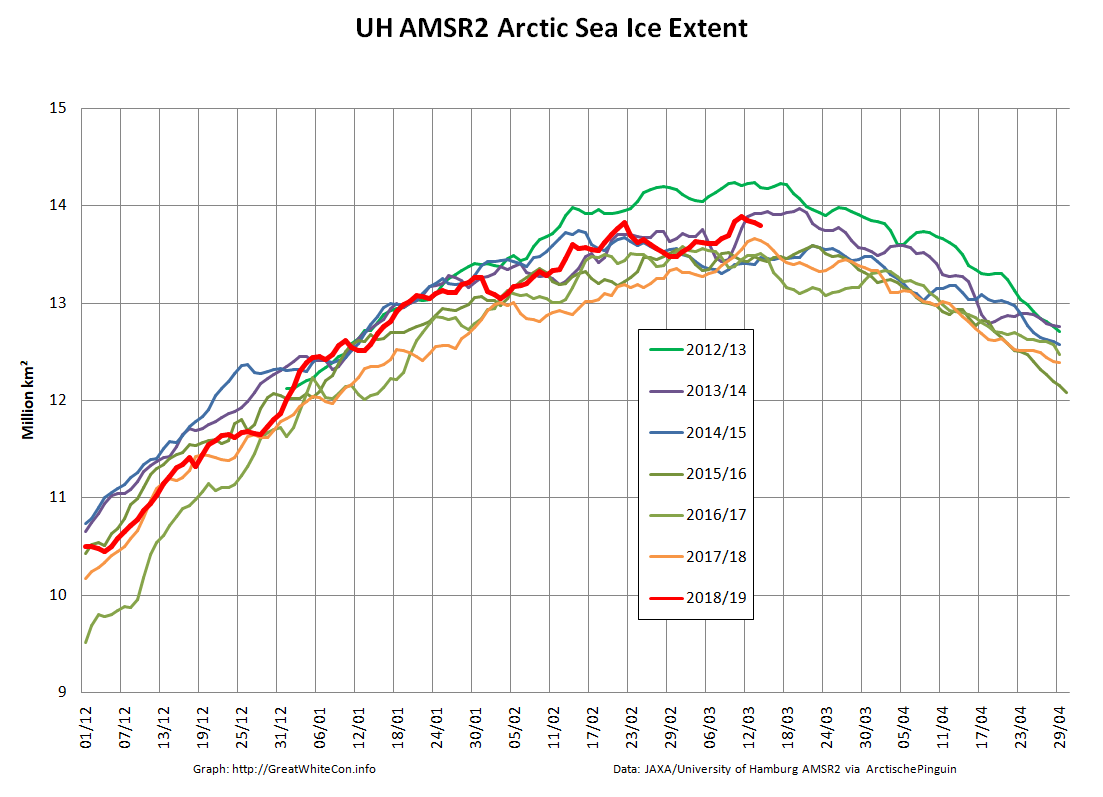
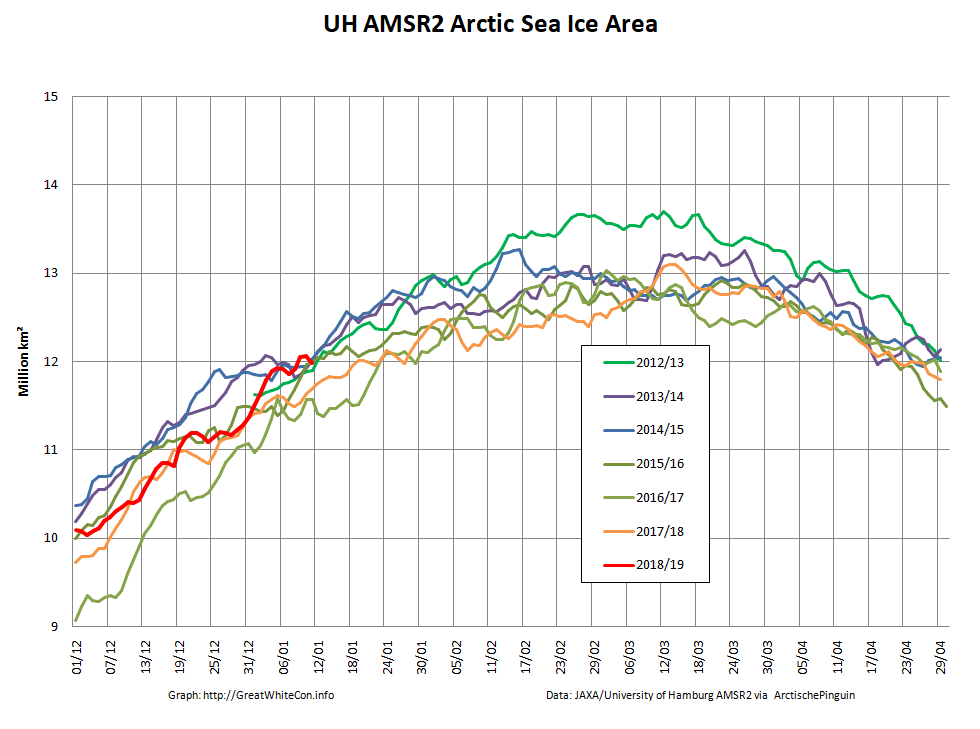
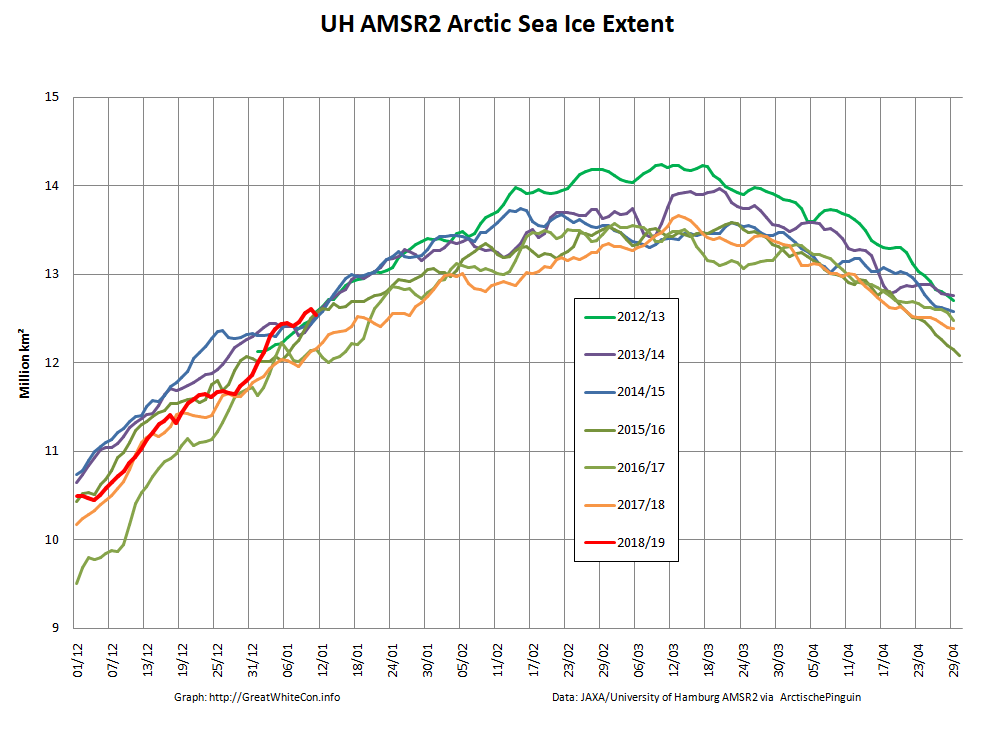
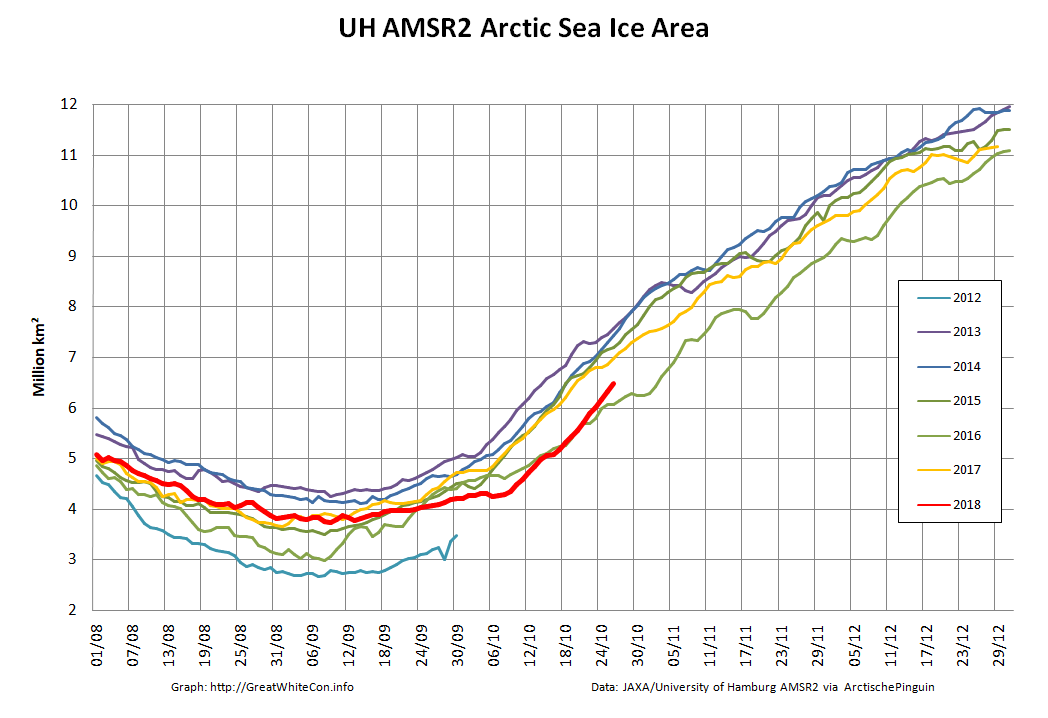
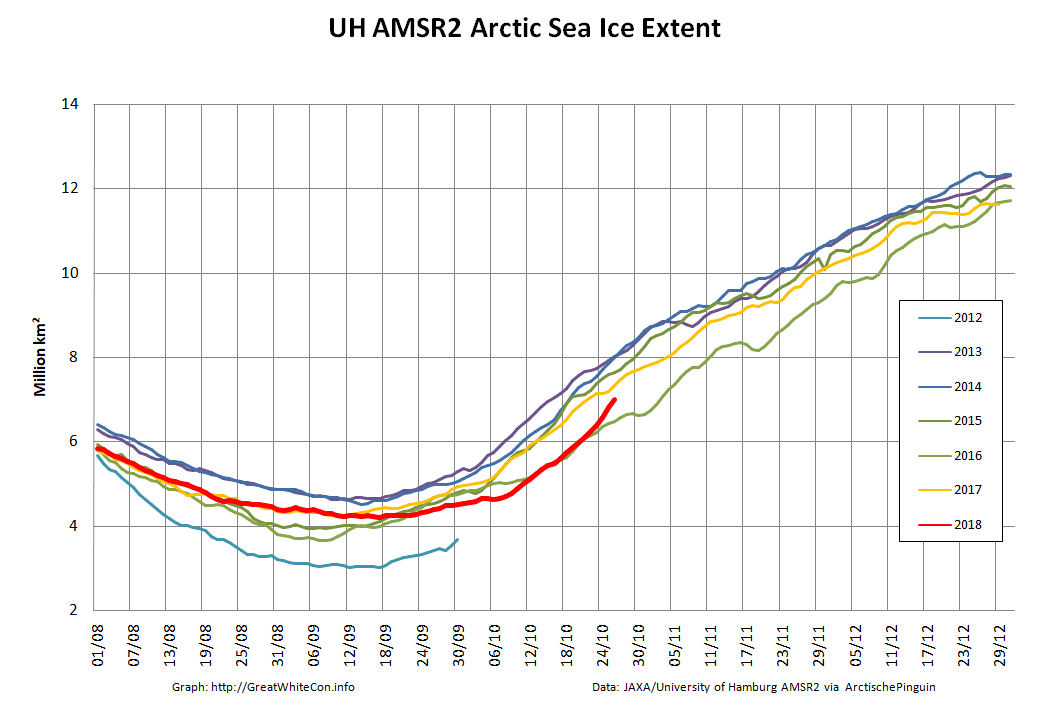
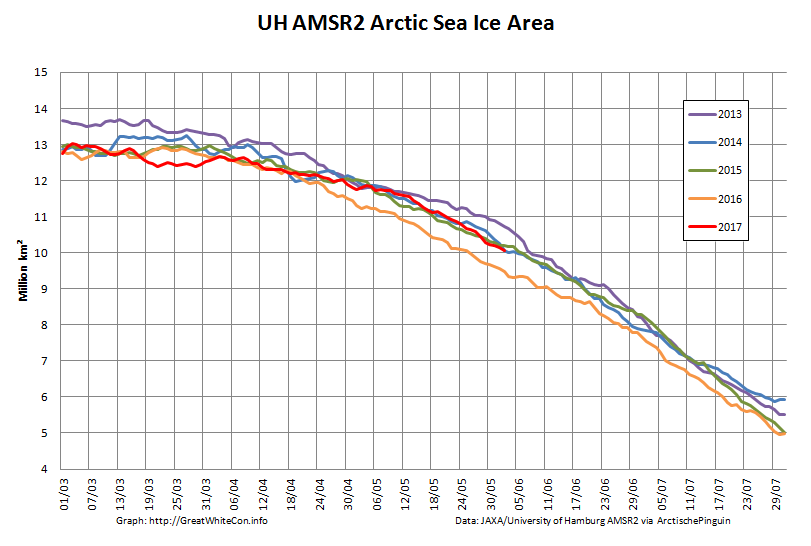
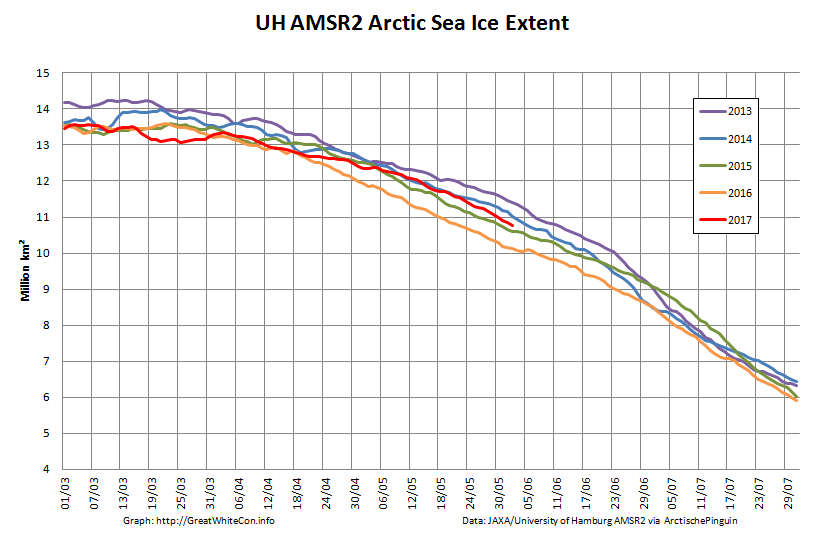
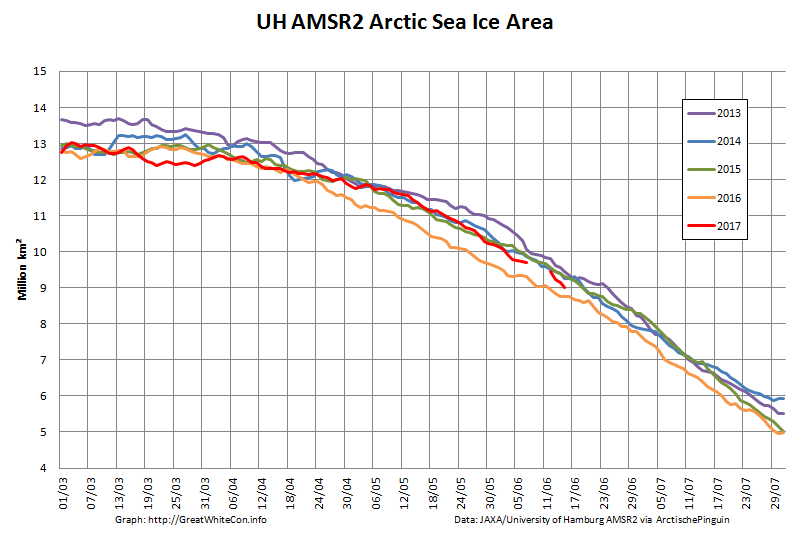
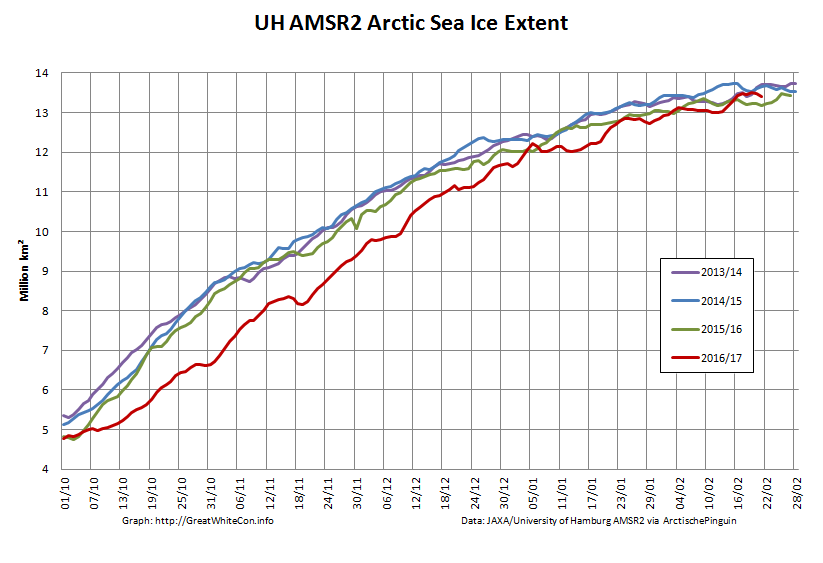
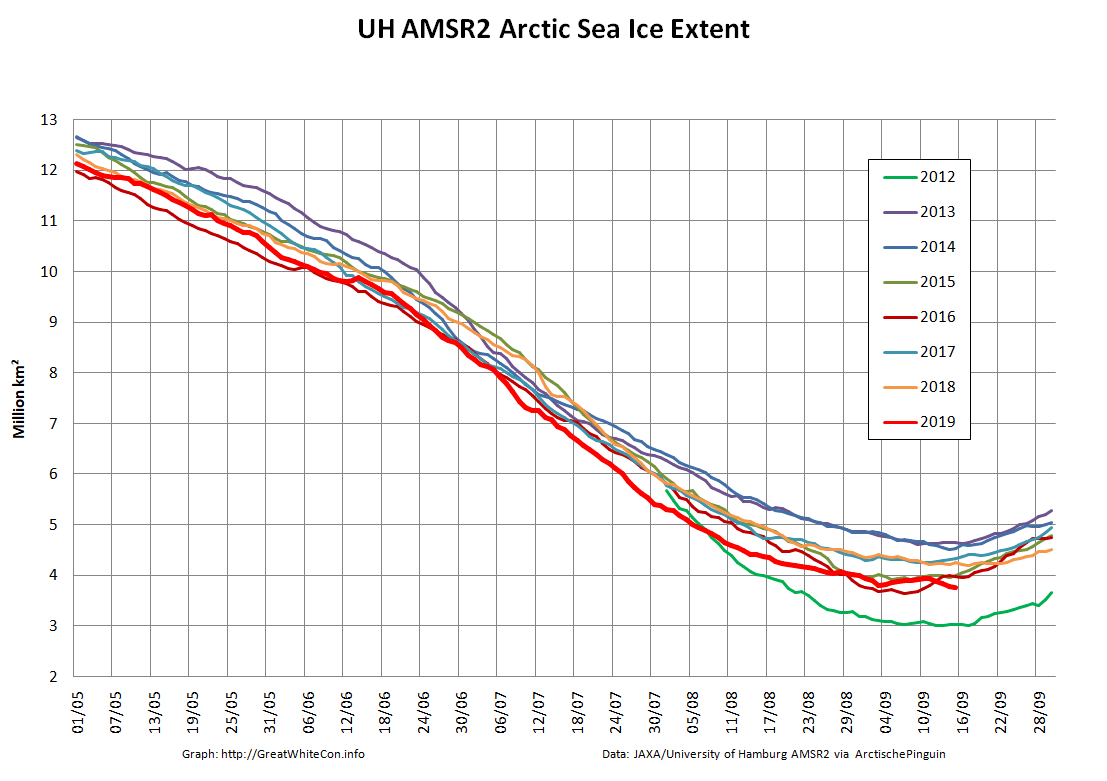
And what of our much beloved high resolution AMSR2 metrics derived by “Wipneus” from the University of Hamburg’s AMSR2 concentration data? Area certainly looks to be past the minimum for this year, whereas extent is still conceivably capable of another push lower:
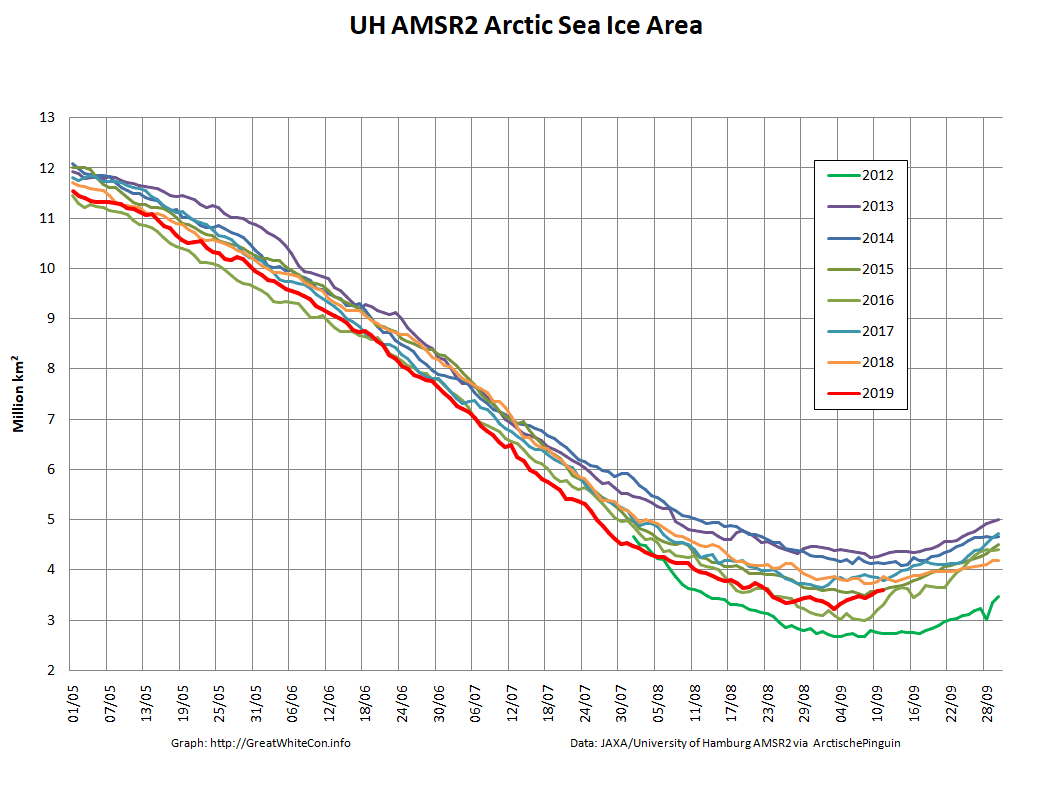

The provisional minimum extent for 2019 is 3.80 million km² on September 3rd.
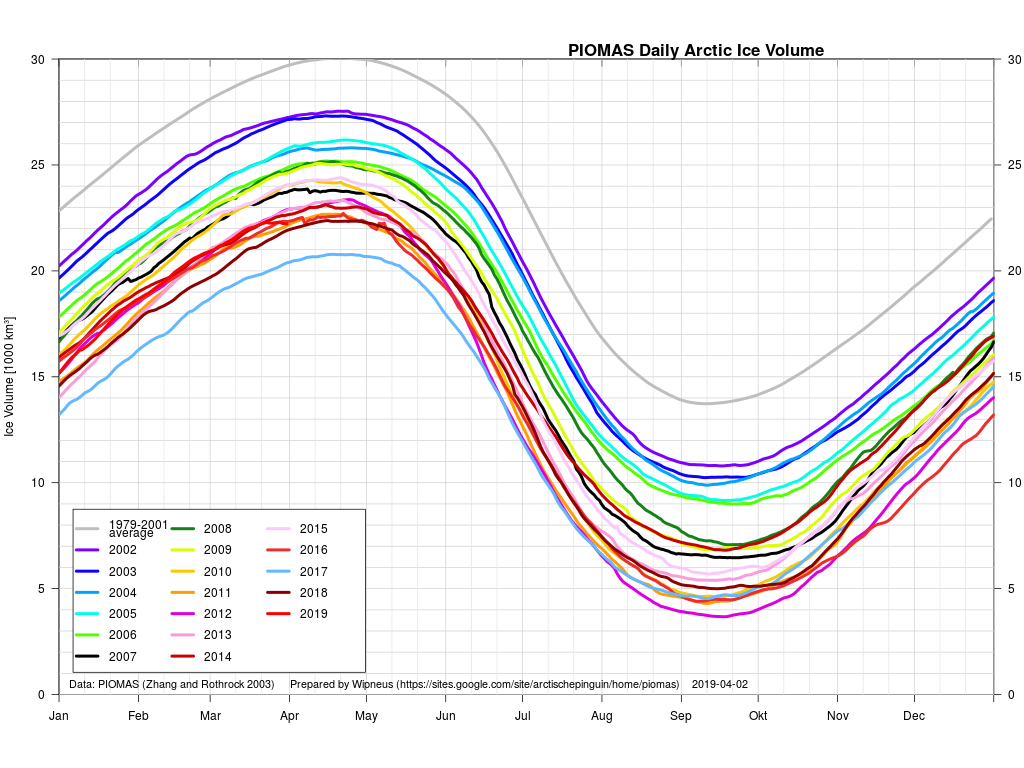
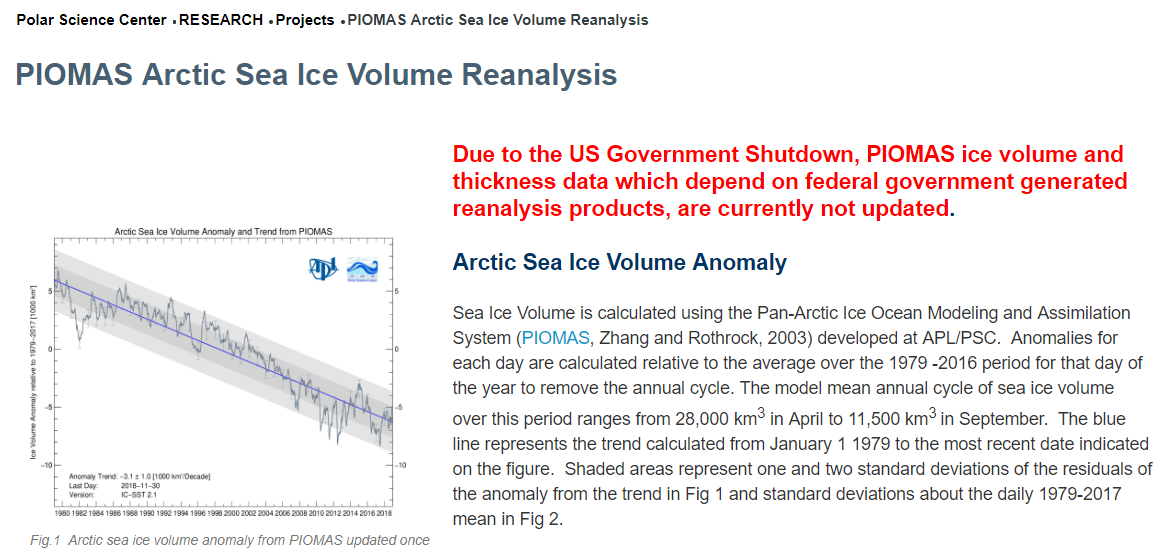
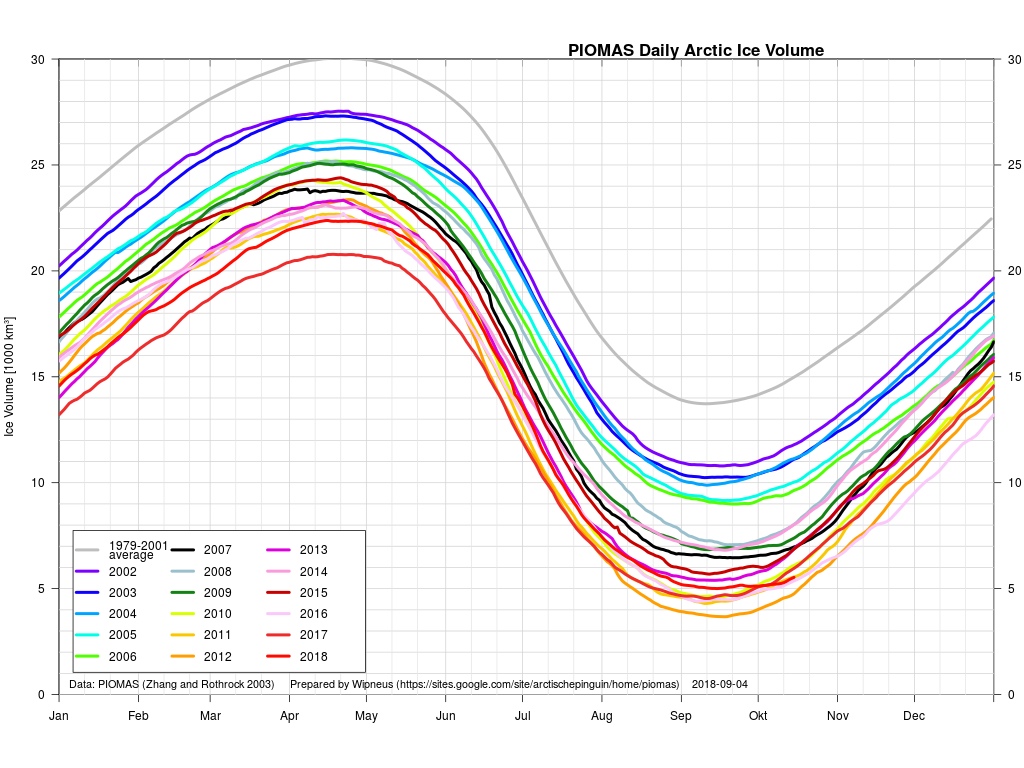
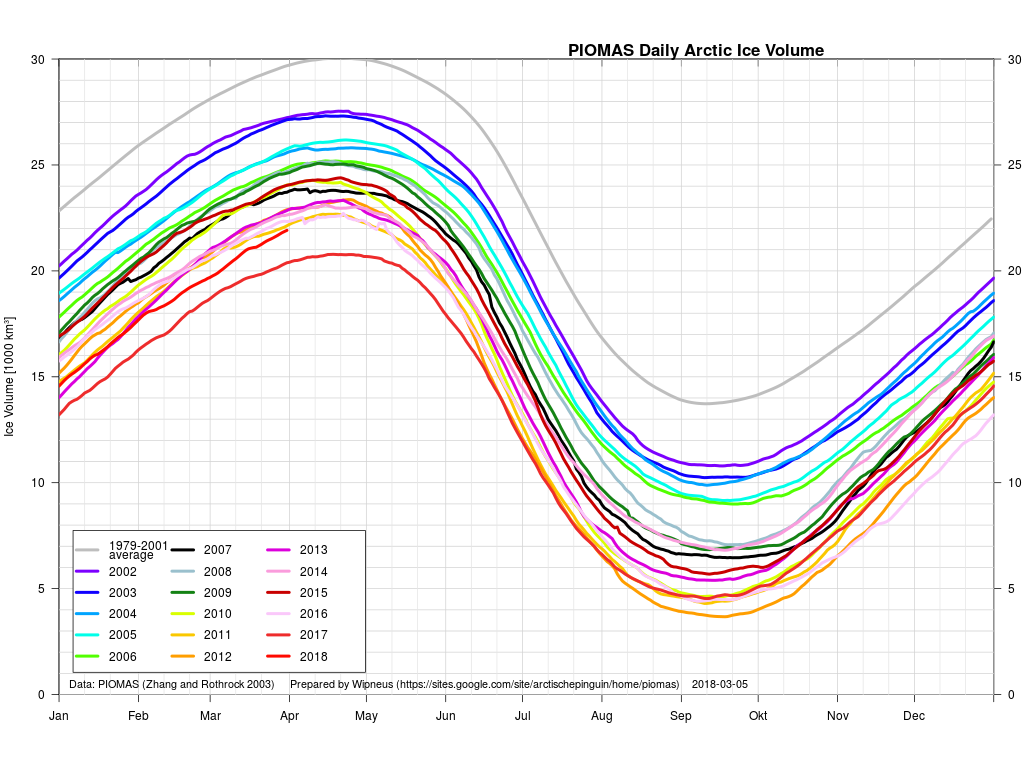
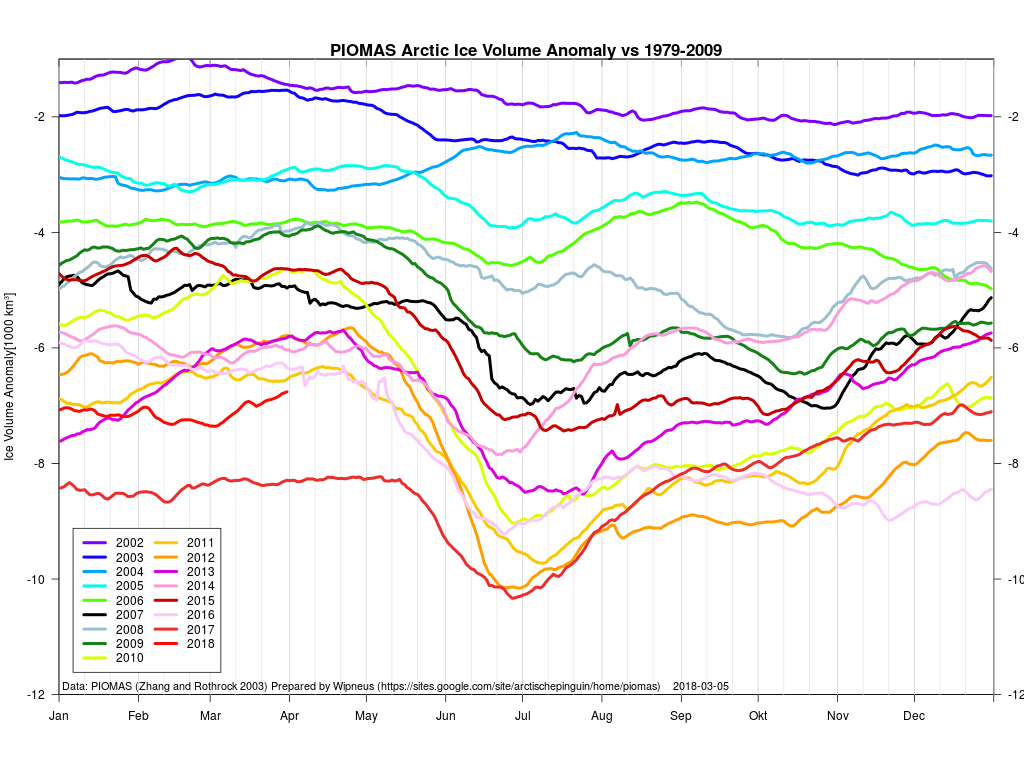
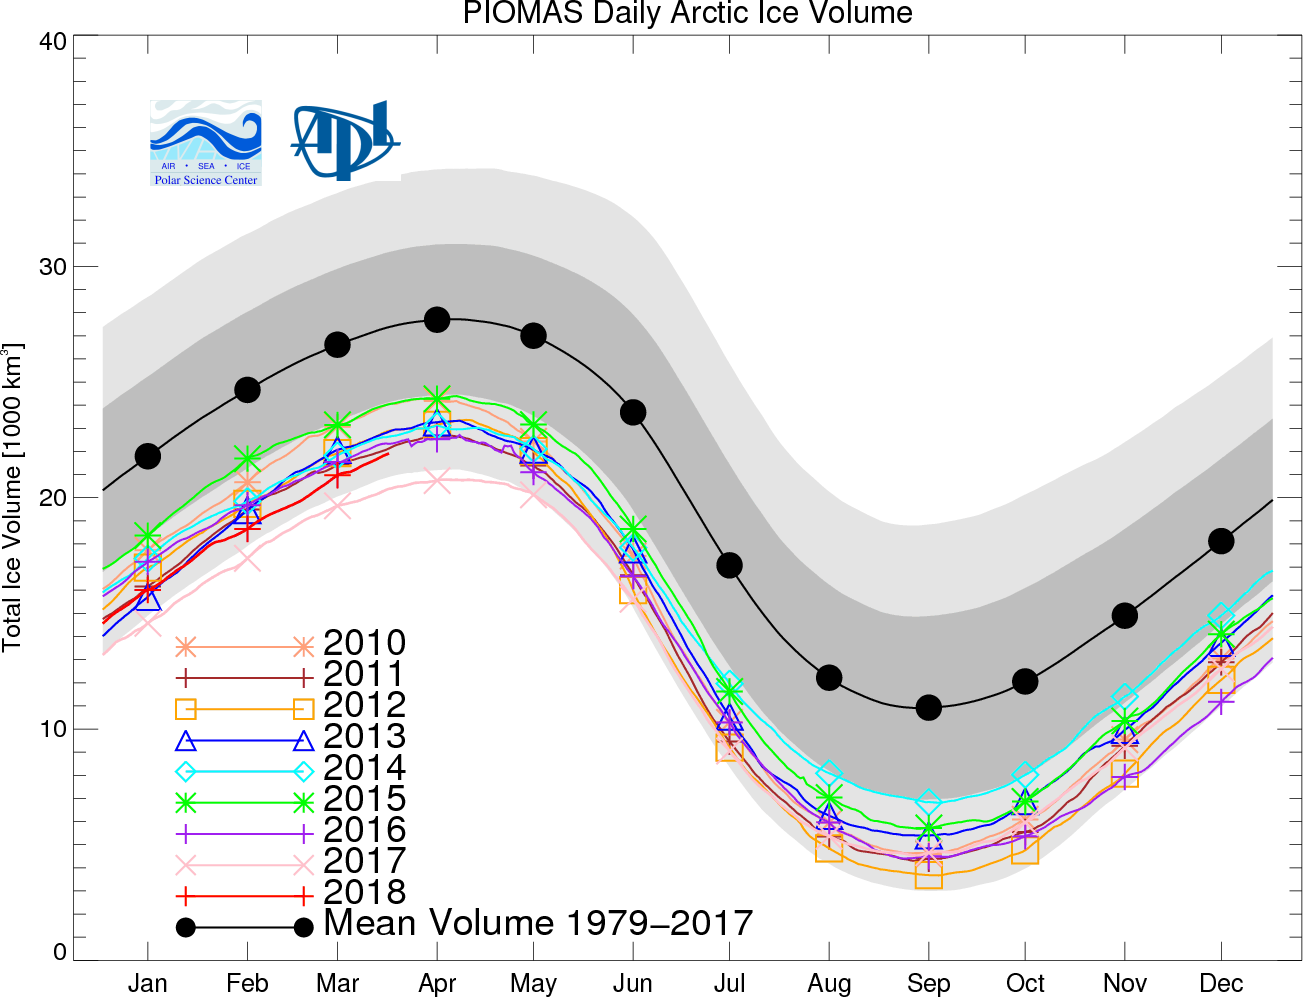
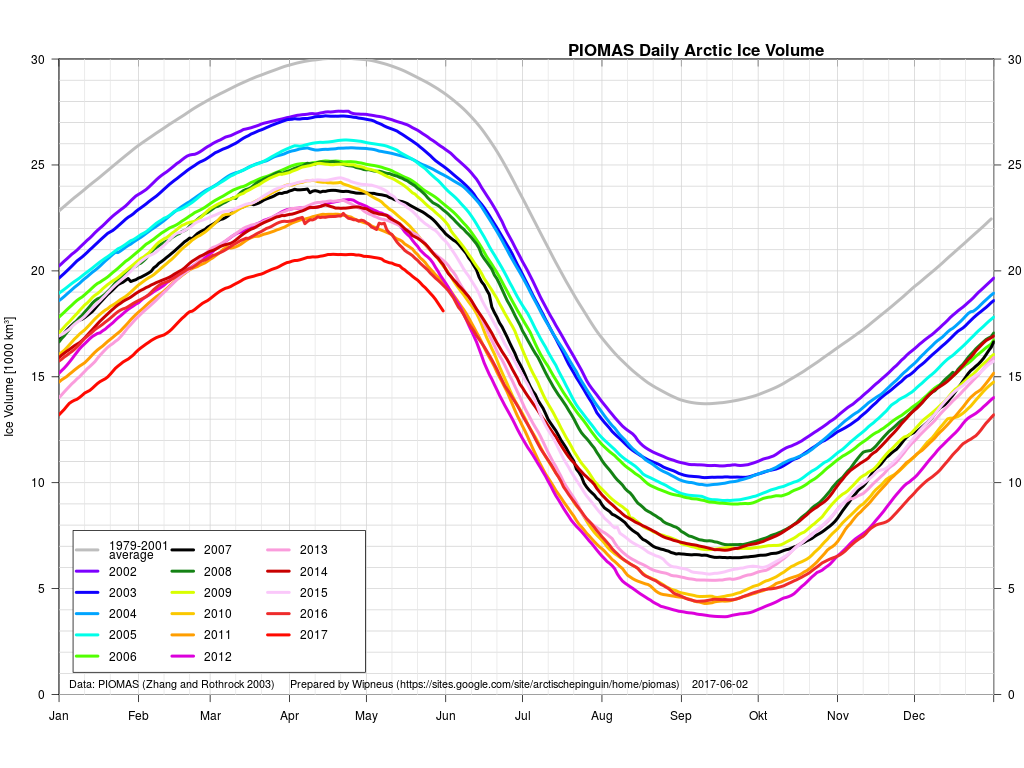
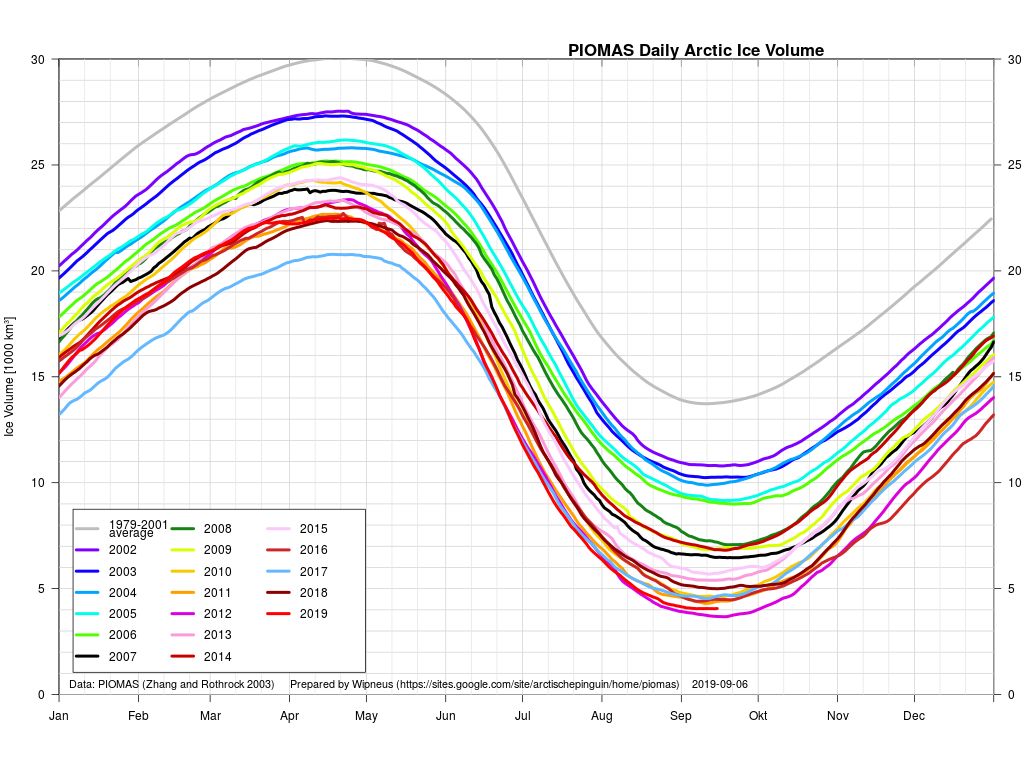
The minimum Arctic sea ice volume generally occurs slightly later than area or extent. The data certainly arrives later! Here’s the PIOMAS graph up to August 31st:

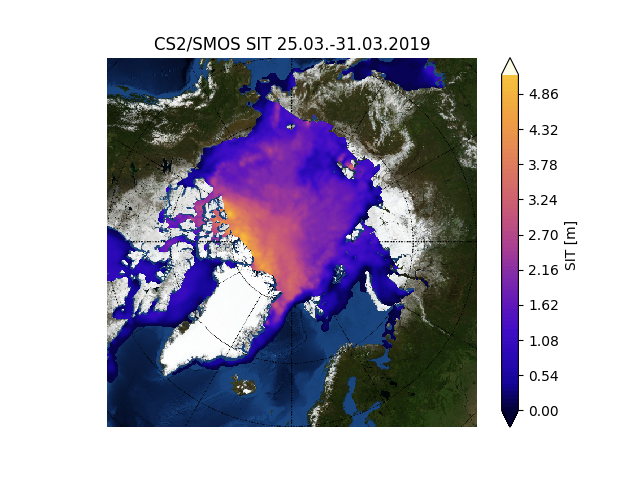
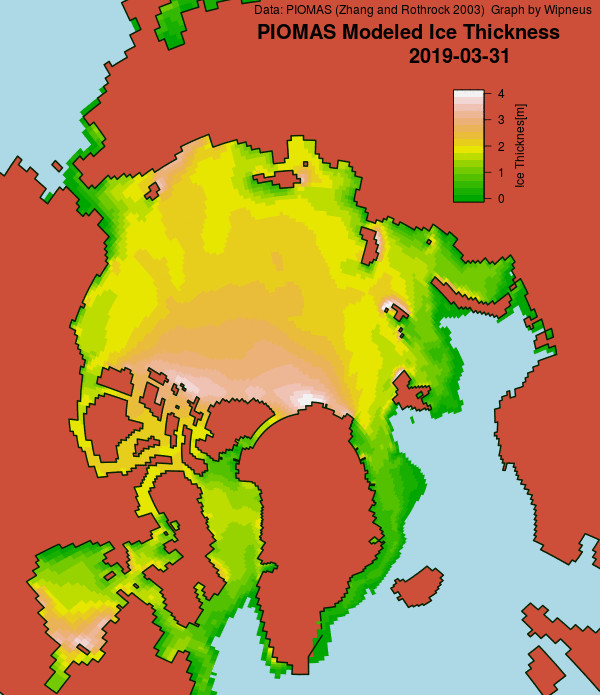
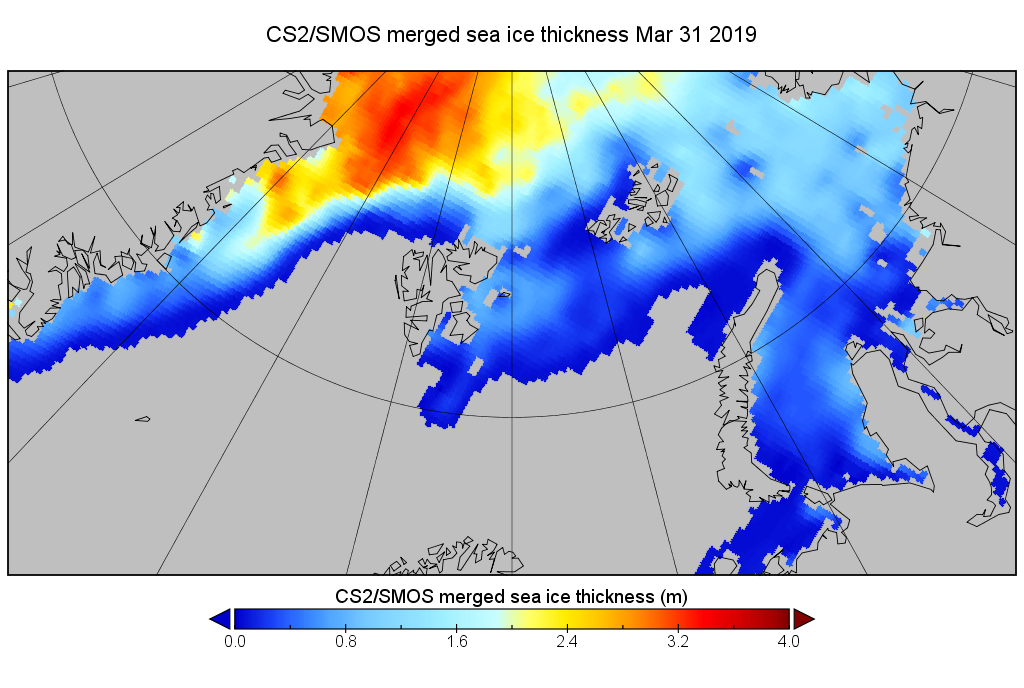
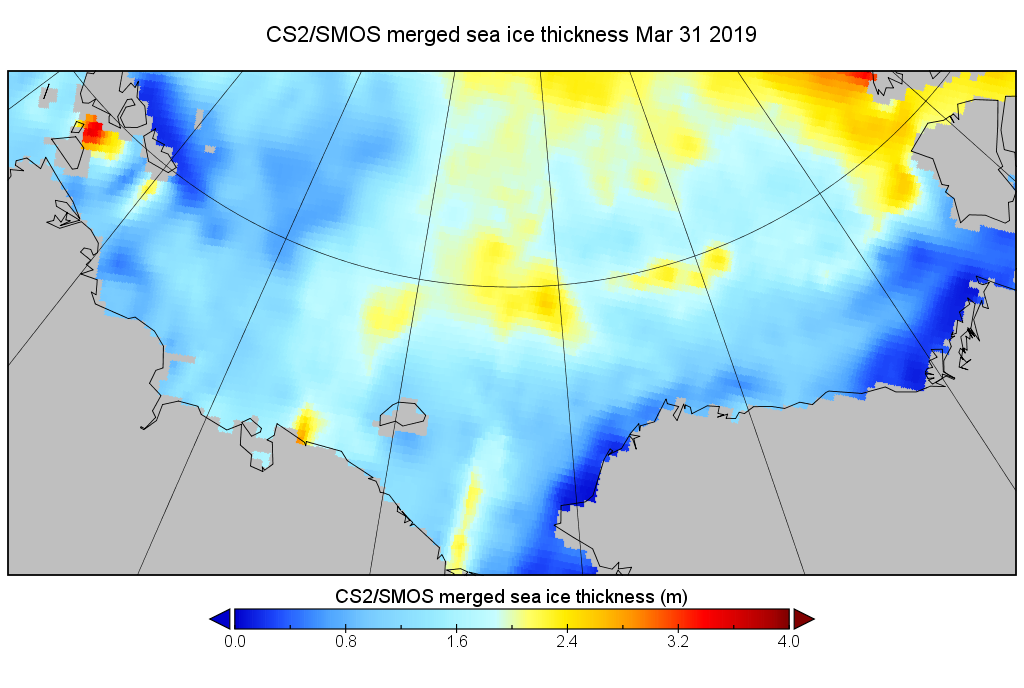
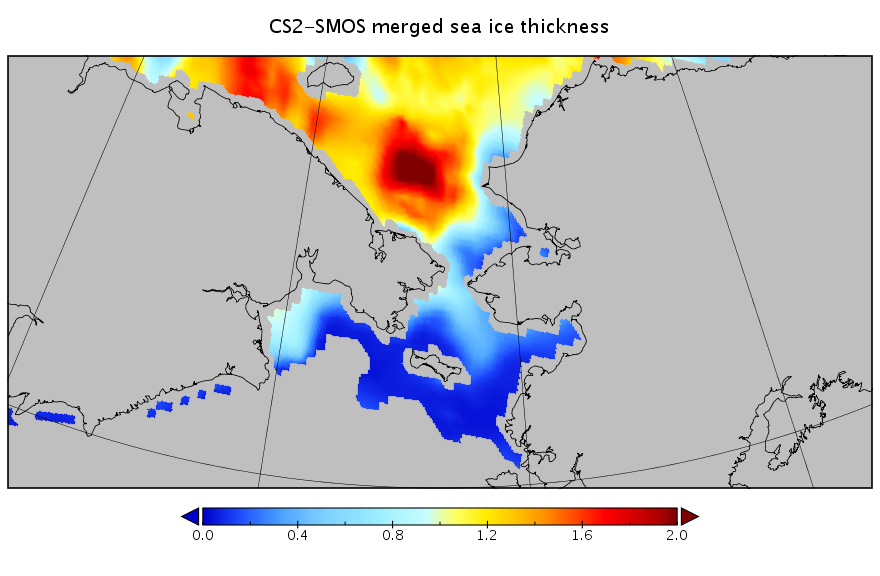
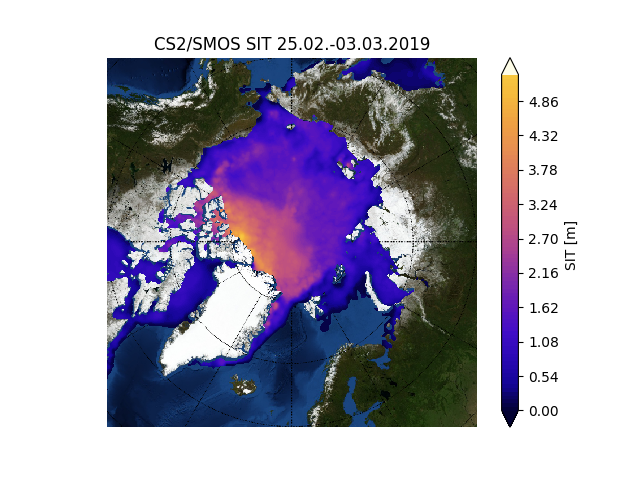
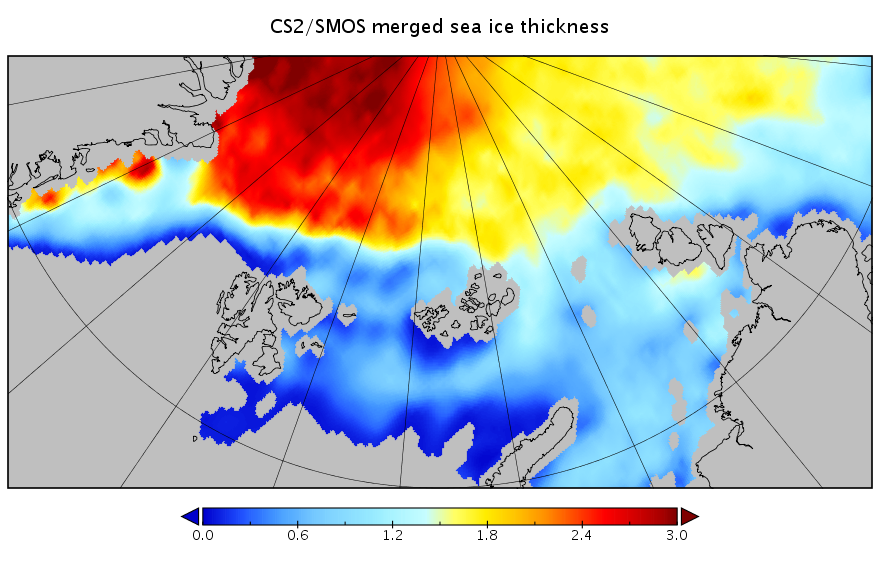
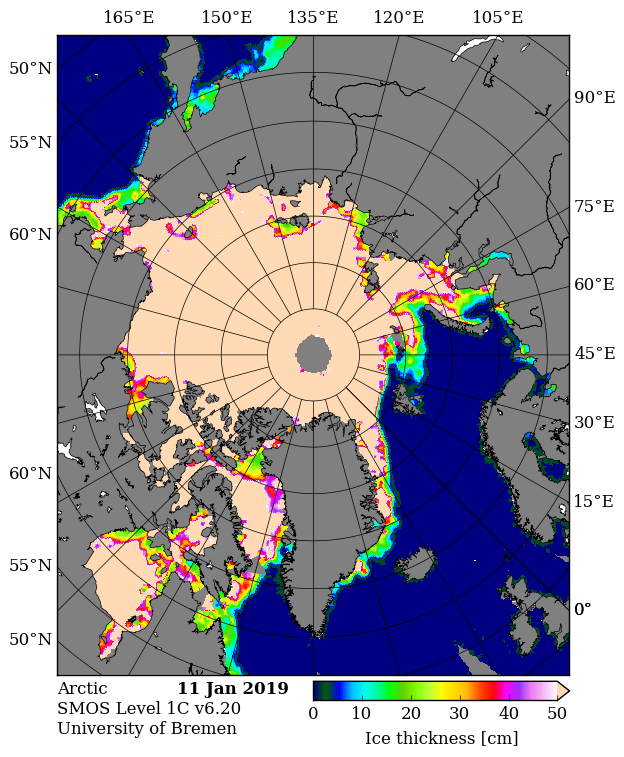
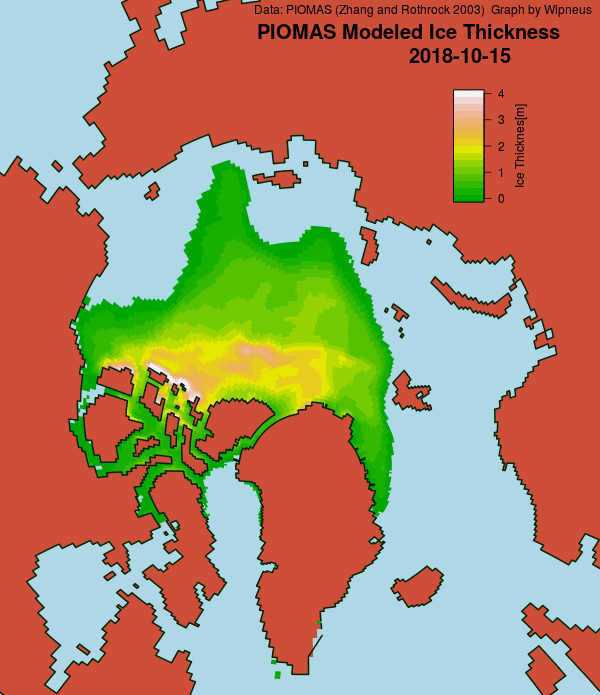
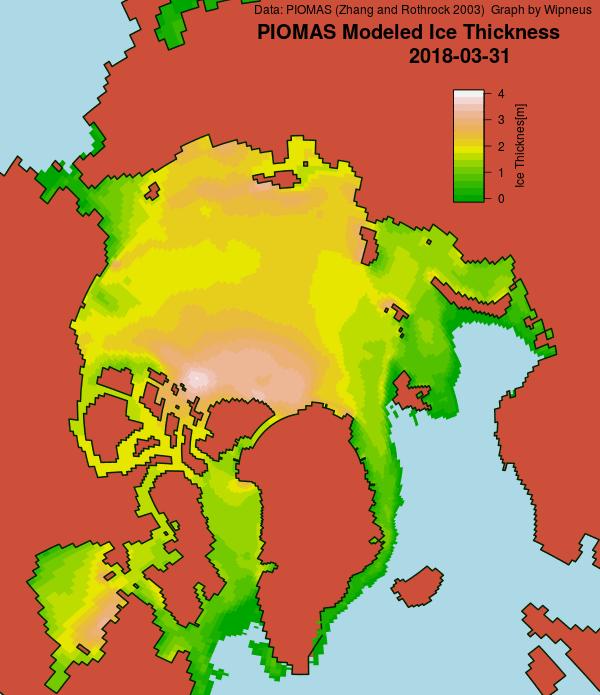
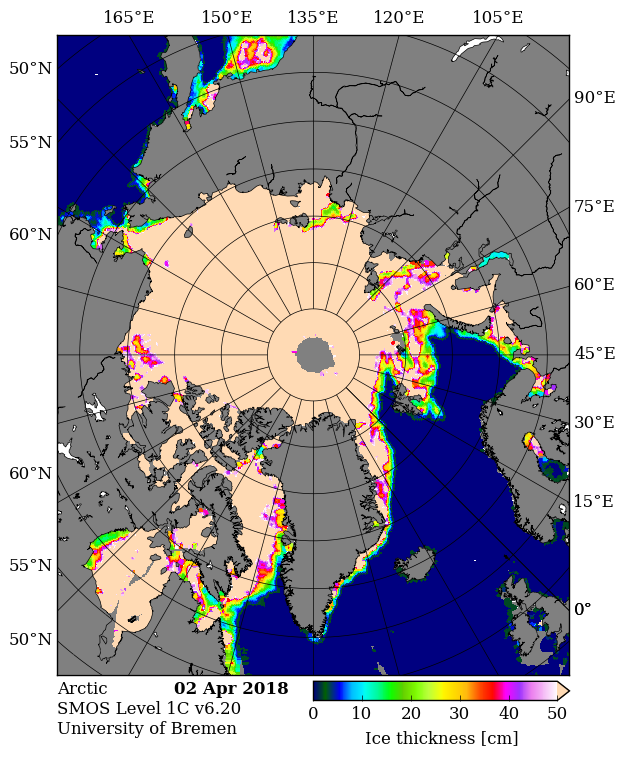
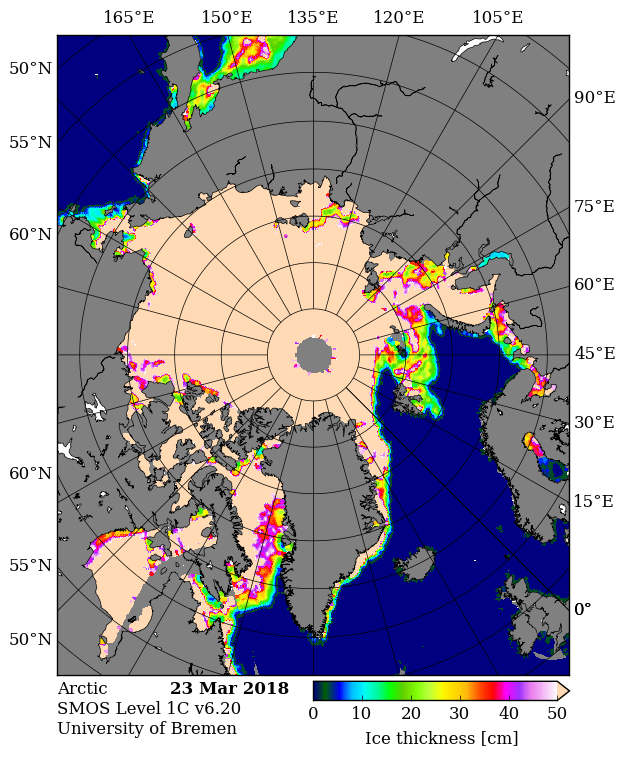
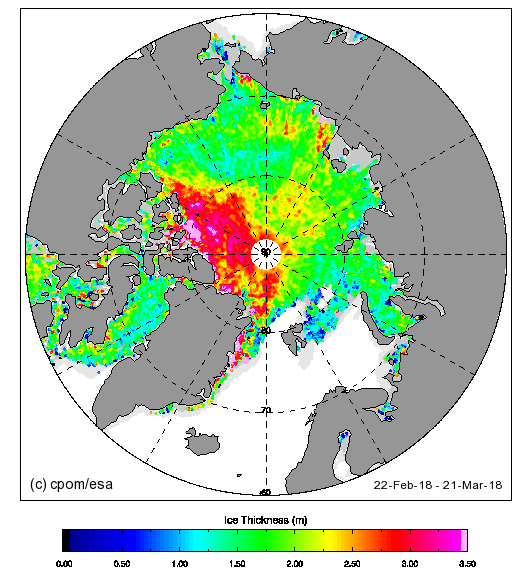
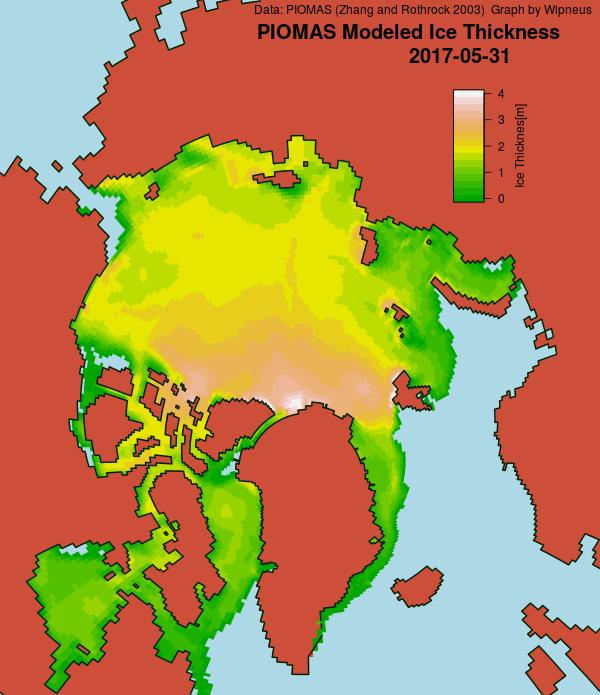
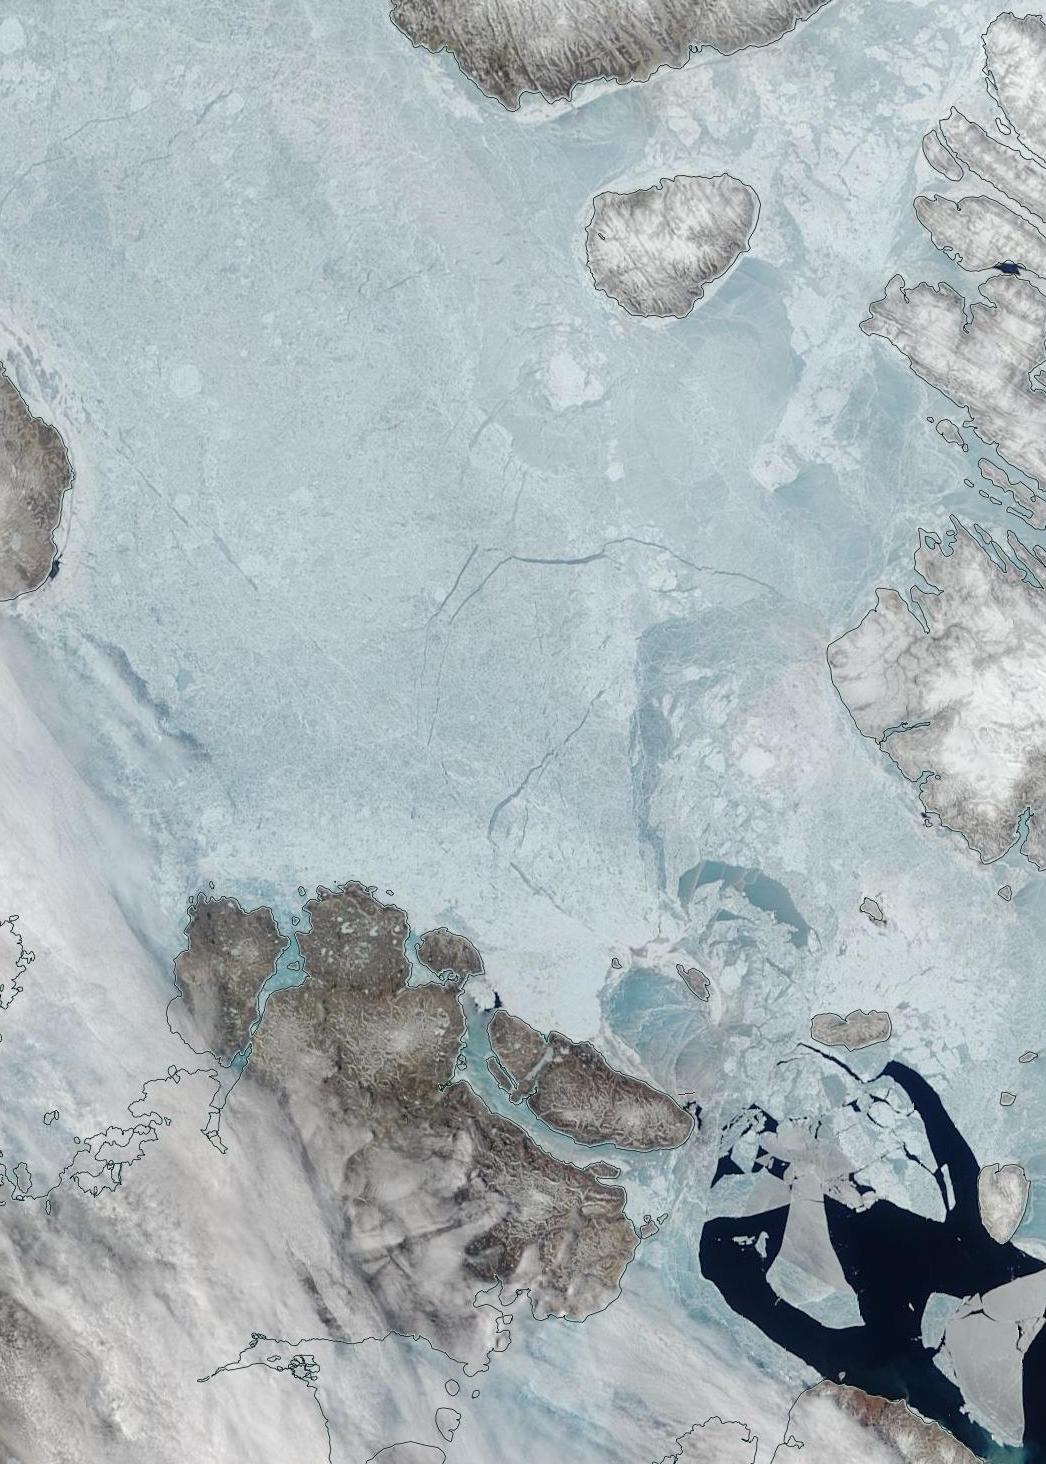
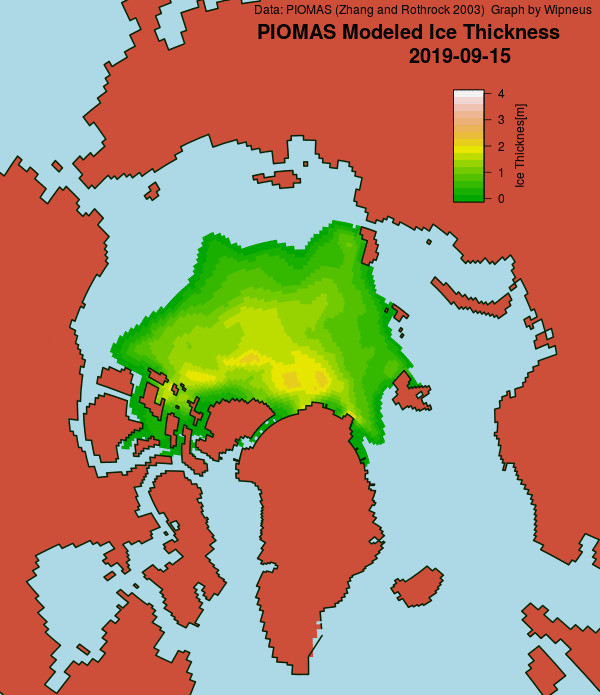
and here’s the associated thickness map:
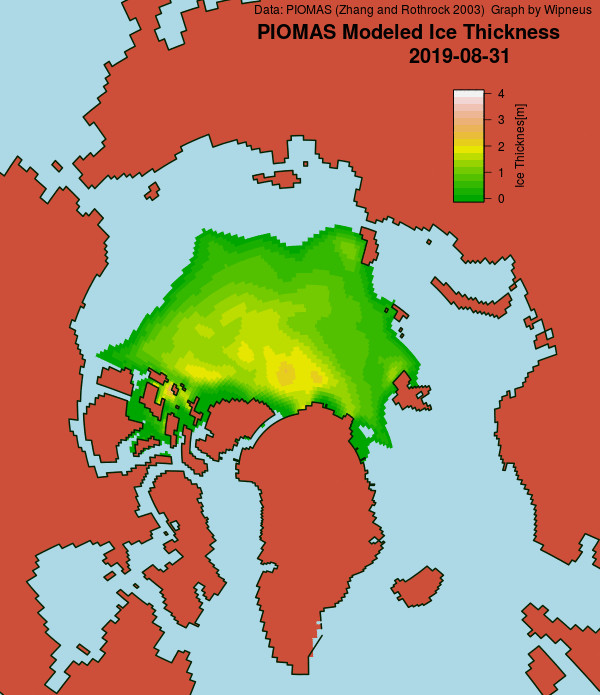
Note that Arctic wide modelled volume is only slightly higher than in 2012 at the same time of year, but there is a noticeably greater percentage gap in extent. That implies that average ice thickness across the Arctic is lower in 2019 than in 2012.
Note also that the thickest ice is no longer located along the north coasts of Greenland and the Canadian Arctic Archipelago. Here are the equivalent maps for previous years for comparison purposes:

Perhaps JAXA extent will head still lower over the next few days? Perhaps PIOMAS volume will sneak below 2012 before the peripheral refreeze begins?
JAXA Arctic sea ice extent has reached a new minimum of 4.09 million km².
NSIDC daily extent is currently 4.28 million km², still just above the September 4th minimum.
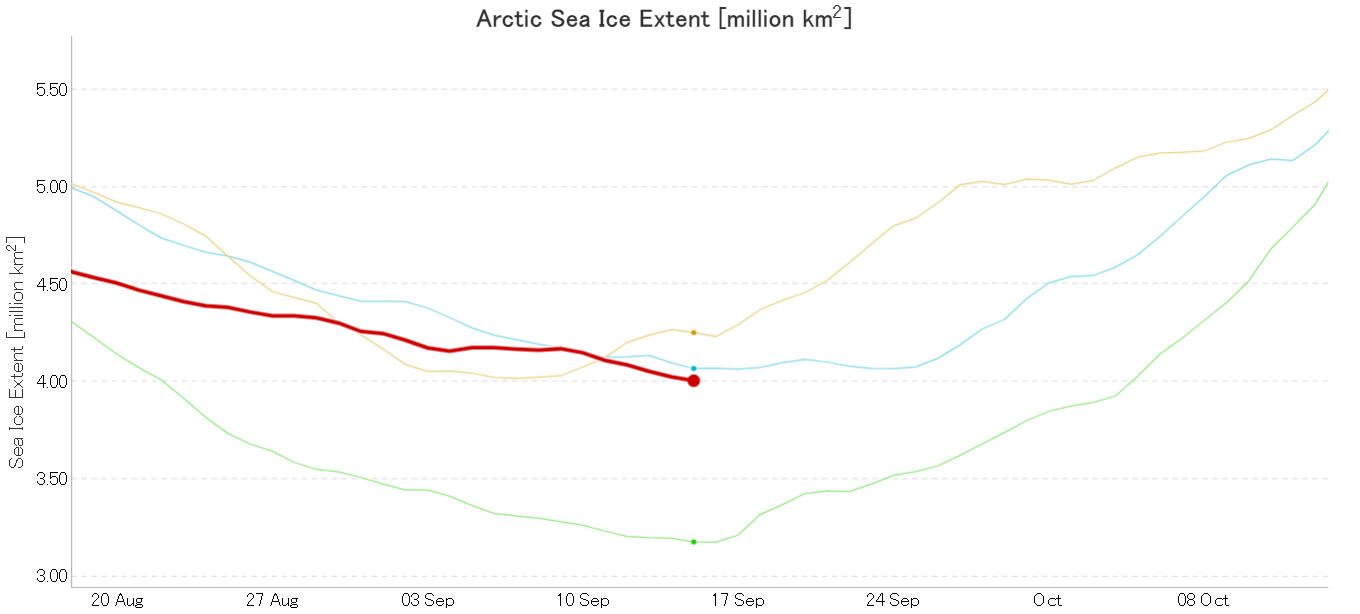
JAXA Arctic sea ice extent has reached a new minimum of 4.05 million km², which now puts it below the 2007 minimum that occurred somewhat later in September:
NSIDC 5 day averaged extent has also (by a whisker!) reached a new minimum for the year of 4.285 million km²:
The daily number fell to 4.21 million km².
I have somewhat belatedly discovered that in the build up to the forthcoming MOSAiC Expedition the Alfred Wegener Institute recently announced that:
The sea-ice extent in the Arctic is nearing its annual minimum at the end of the melt season in September. Only circa 3.9 million square kilometres of the Arctic Ocean are covered by sea ice any more, according to researchers from the Alfred Wegener Institute and the University of Bremen. This is only the second time that the annual minimum has dropped below four million square kilometres since satellite measurements began in 1979.

JAXA/ViSHOP extent has dropped below the 2016 minimum, and now measures 4.01 million km²:
Only 2012 left to beat!
Wipneus’ high resolution AMSR2 extent has also posted a new low for the year, but still has a little way to go before passing 2016:
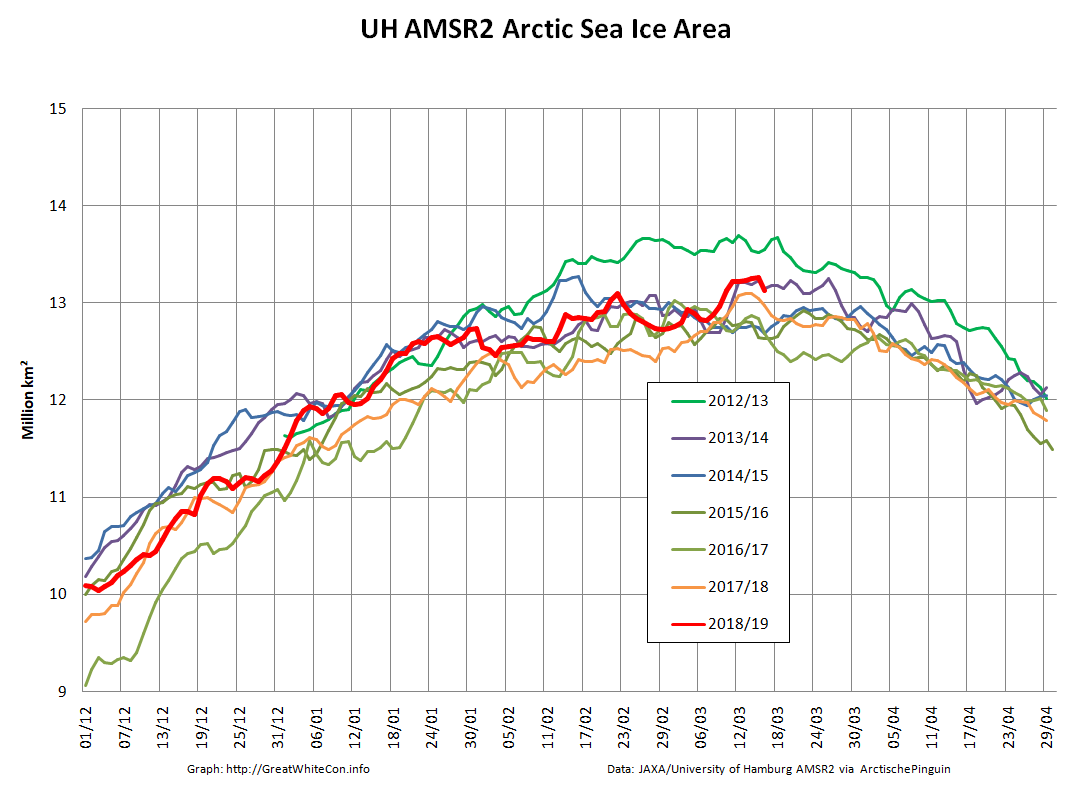
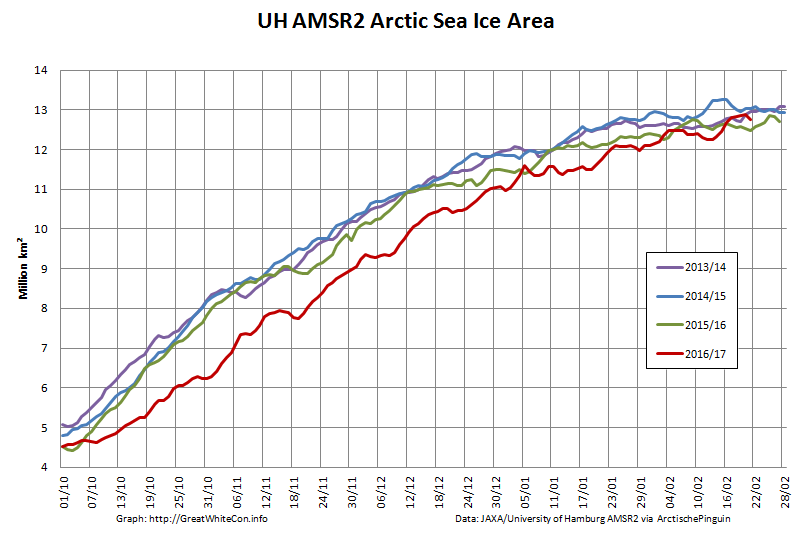
Area is also currently declining, but is still well away from a new minimum for 2019:

After some more modest declines JAXA/ViSHOP extent has just increased marginally from the previous day, and now measures 3.98 million km²:
That puts the (very!) tentative minimum for 2019 at 3.96 million km² on September 17th.
The mid month PIOMAS gridded thickness and volume numbers have been released:
As anticipated given recent extent values, the volume difference from 2012 has increased somewhat over the last two weeks.
The National Snow and Ice Data Center have called the 2019 minimum in their latest edition of Arctic Sea Ice News:
On September 18, 2019, sea ice extent dropped to 4.15 million square kilometers (1.60 million square miles), effectively tied for the second lowest minimum in the satellite record along with 2007 and 2016. This appears to be the lowest extent of the year. In response to the setting sun and falling temperatures, ice extent will begin increasing through autumn and winter. However, a shift in wind patterns or a period of late season melt could still push the ice extent lower.
To summarise the assorted minimum extent metrics for 2019:
University of Bremen – 3.77 million km² on September 18th, 2nd lowest behind 2012.
JAXA/ViSHOP – 3.96 million km² on September 17th, “Statistical tie” with 2016 for 2nd lowest.
NSIDC 1 day – 4.10 million km² on September 17th, “Statistical tie” with 2016 for 2nd lowest.
NSIDC 5 day – 4.15 million km² on September 18th, 2nd lowest behind 2012.
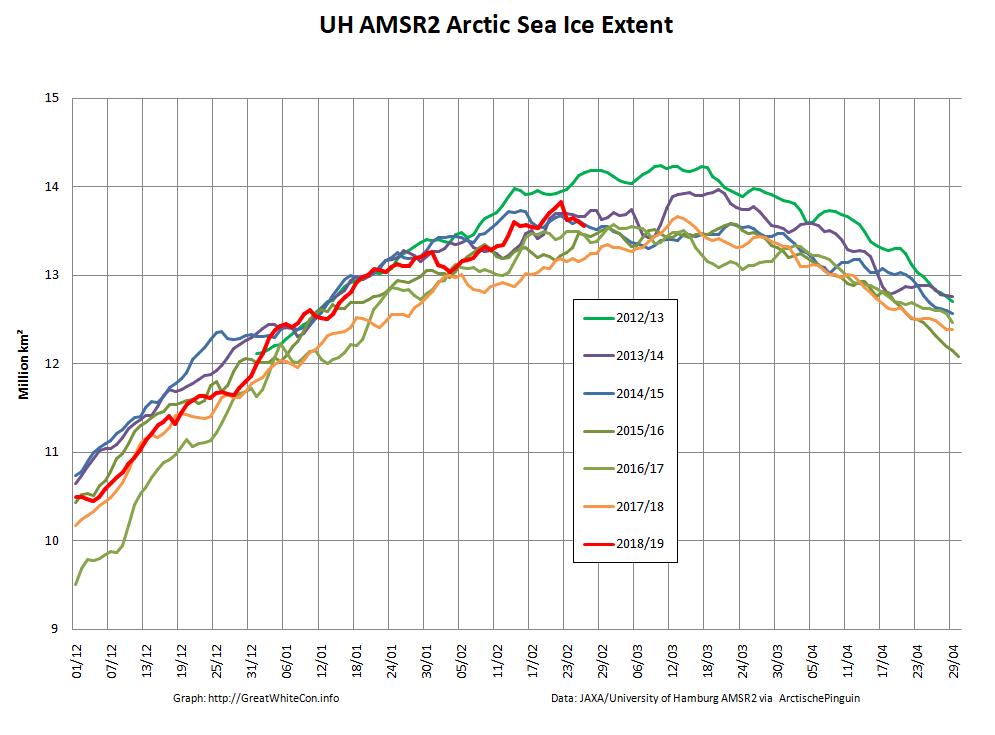
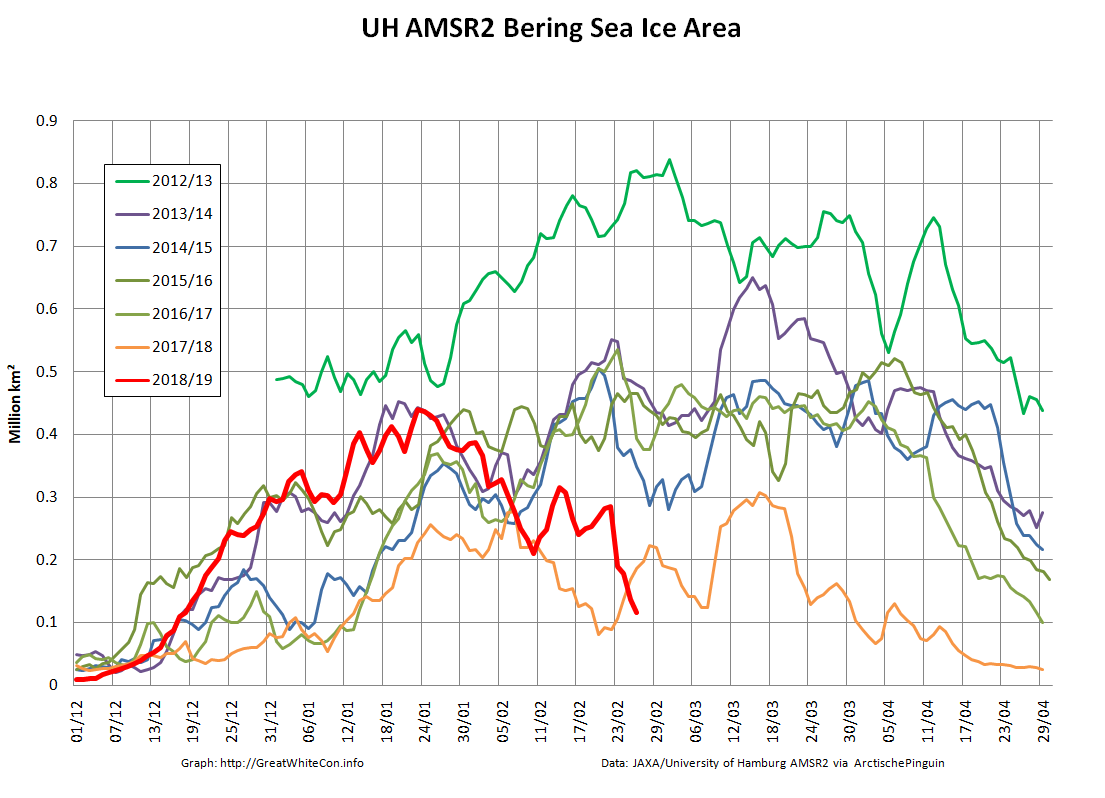
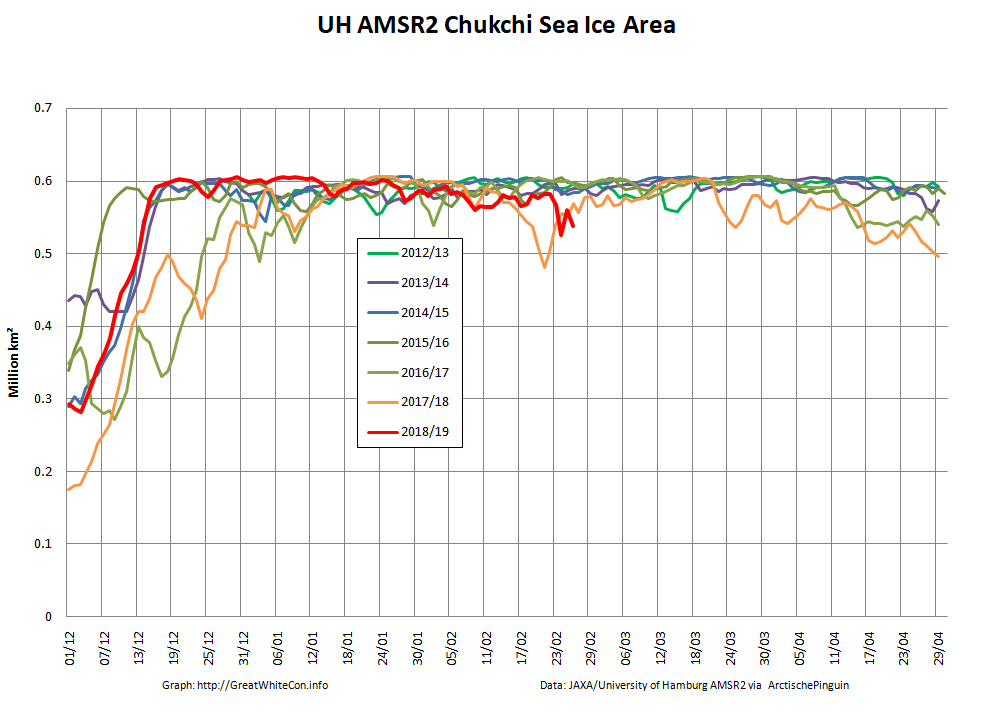
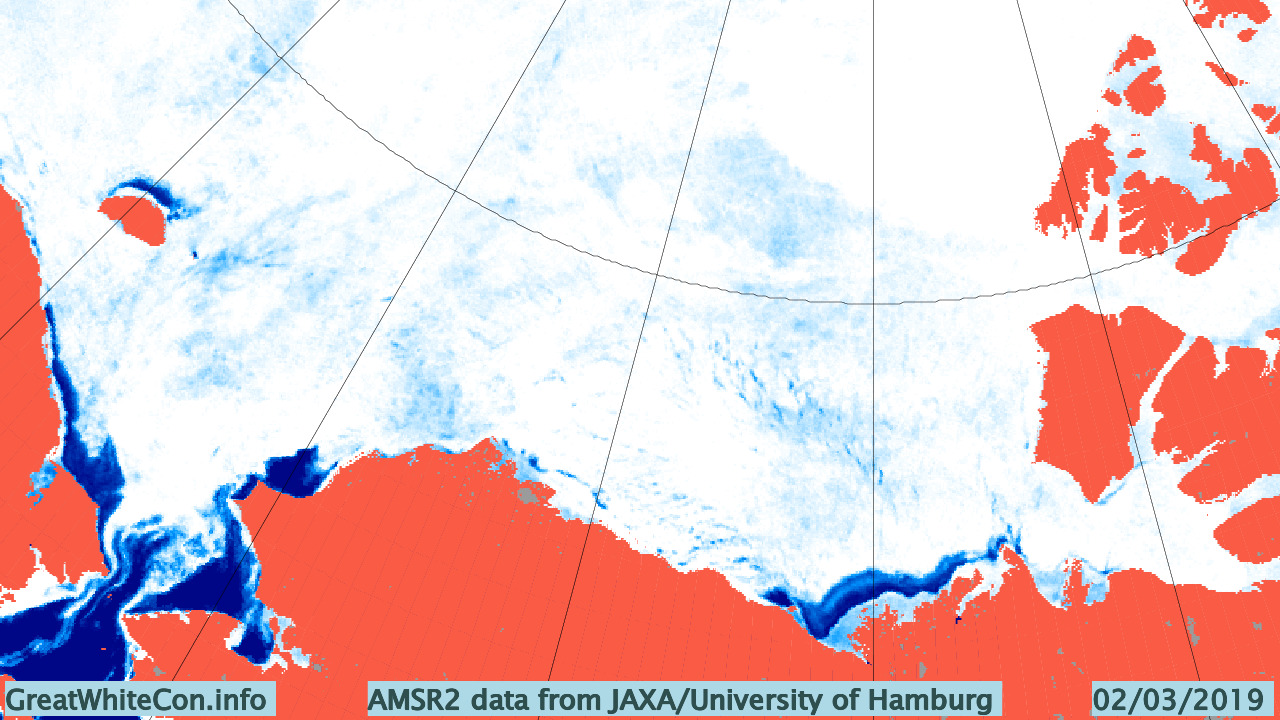
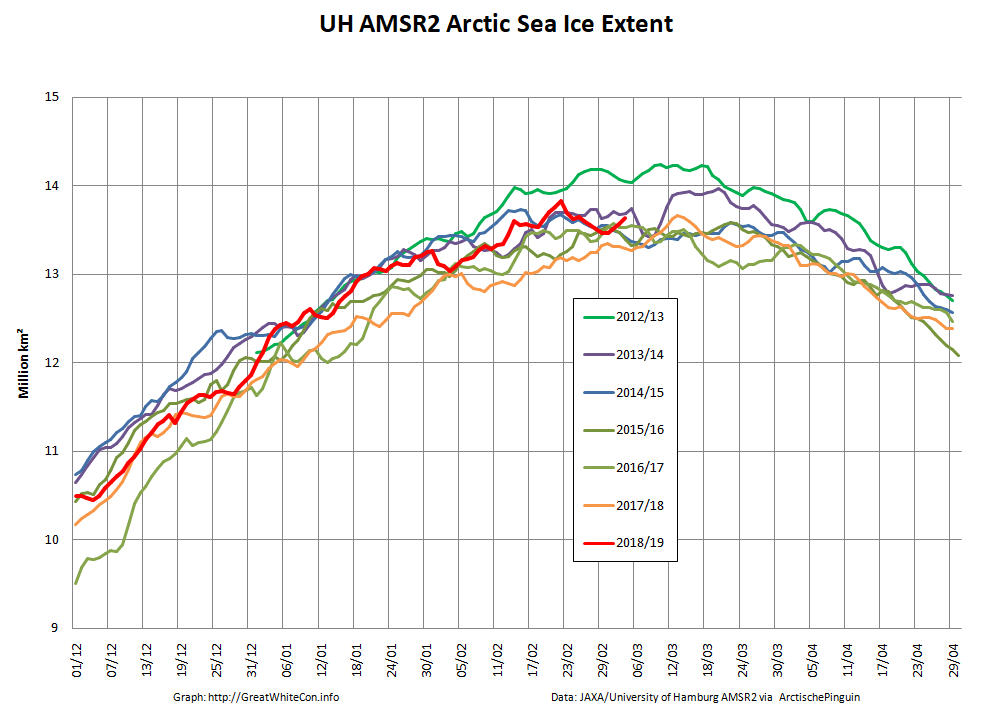
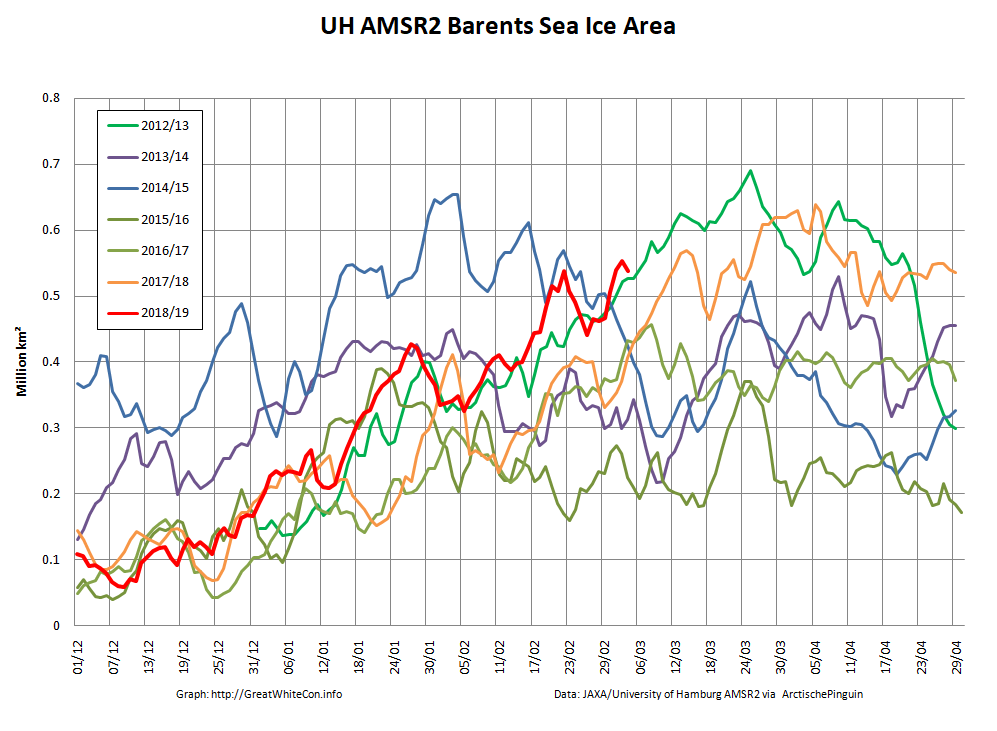
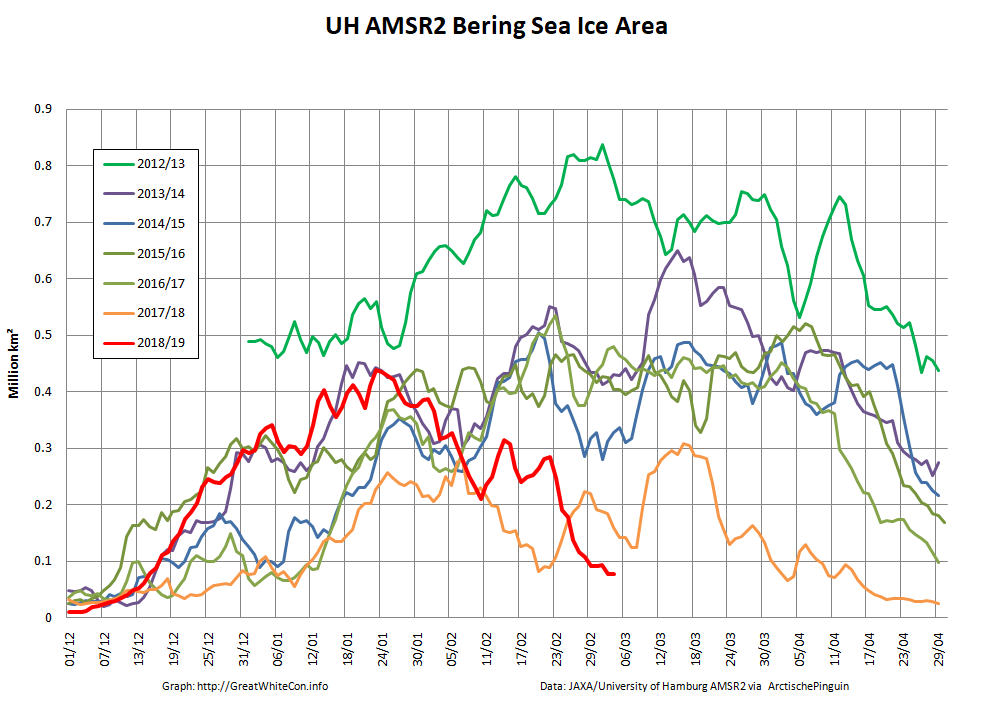
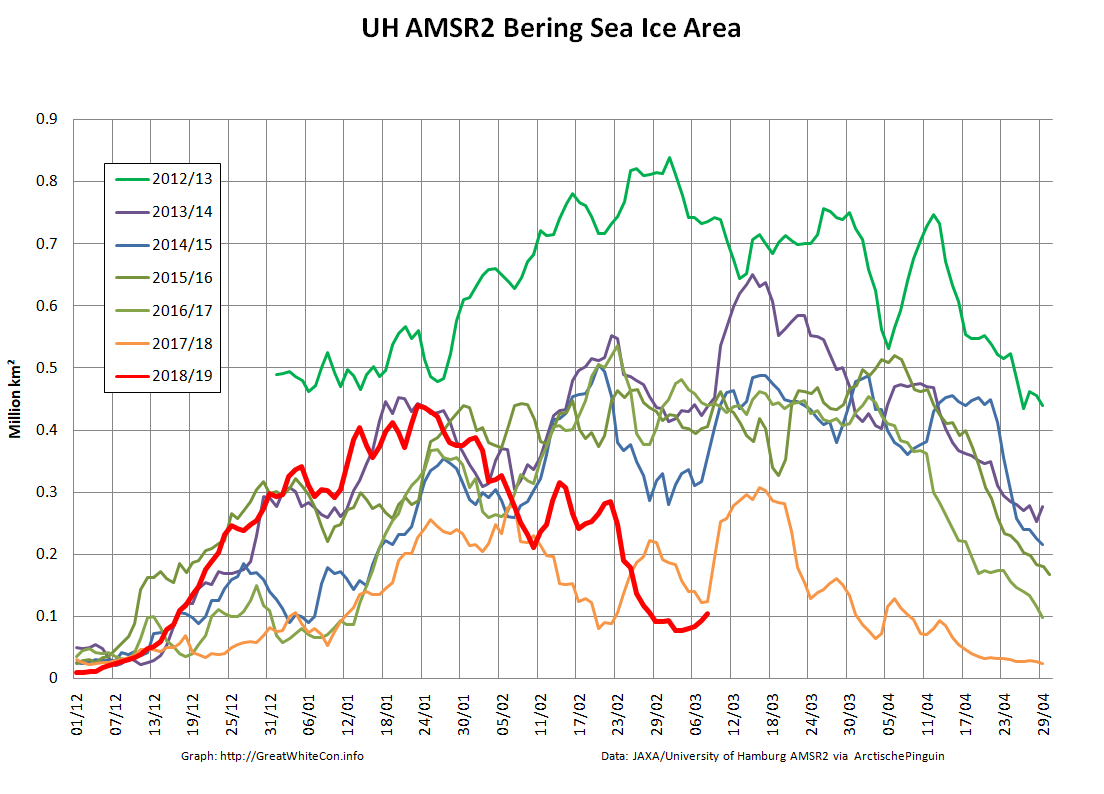
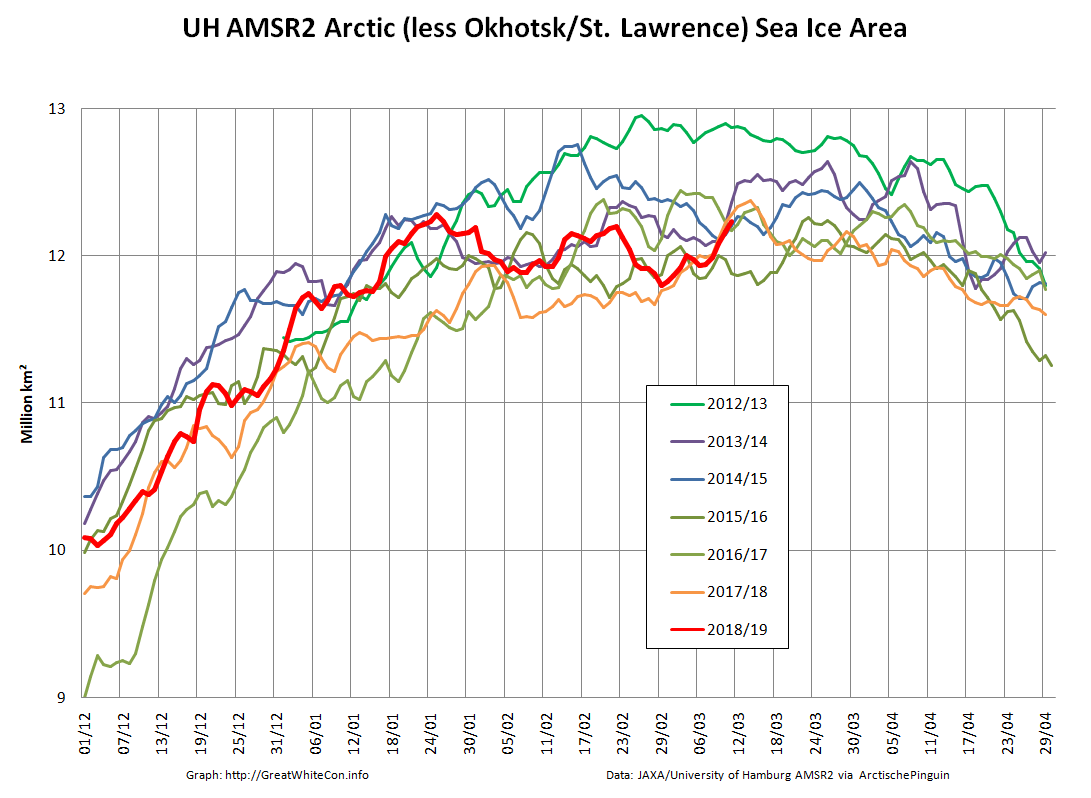
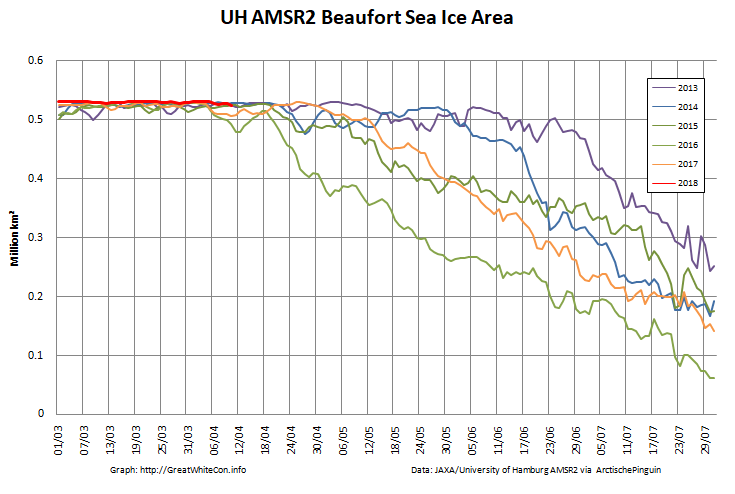
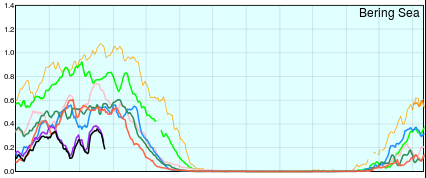
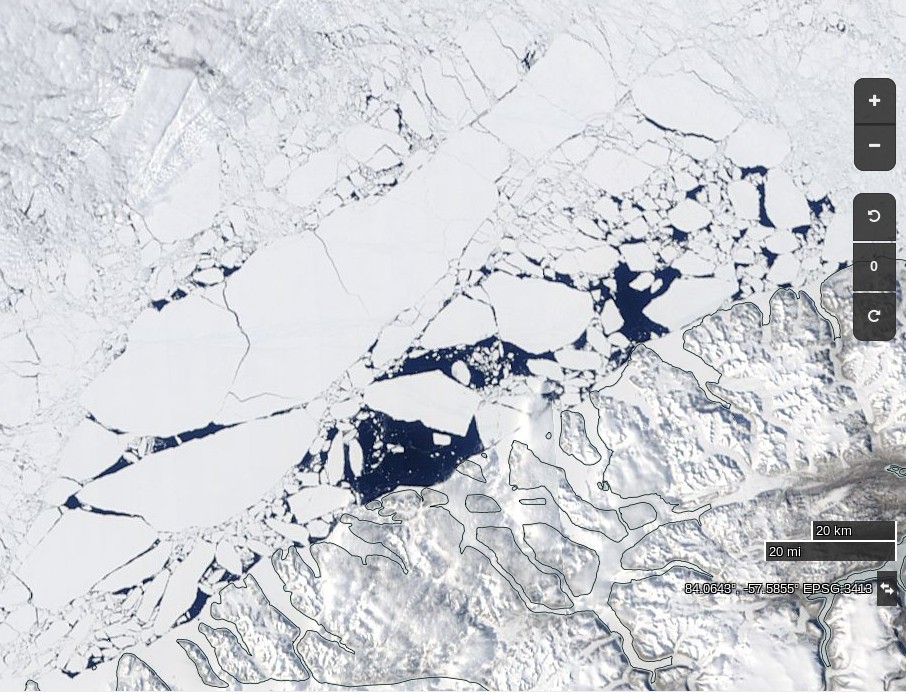
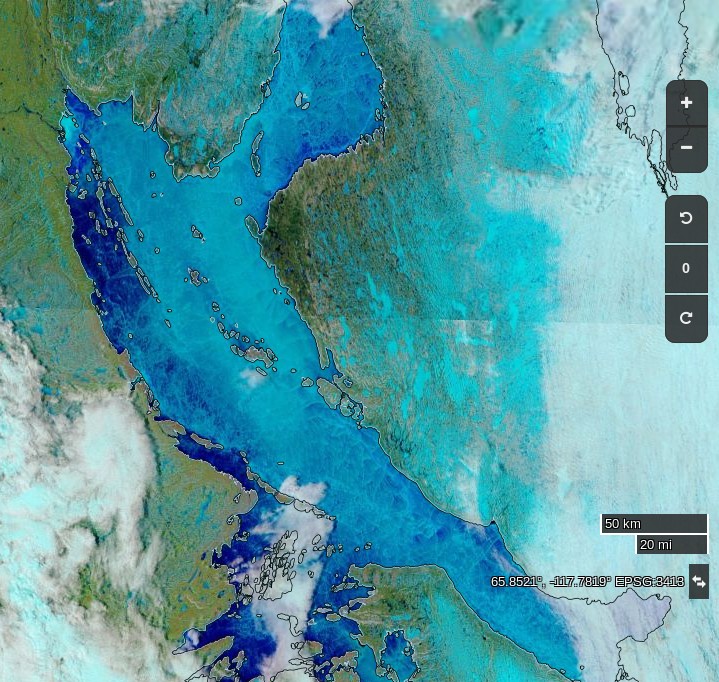
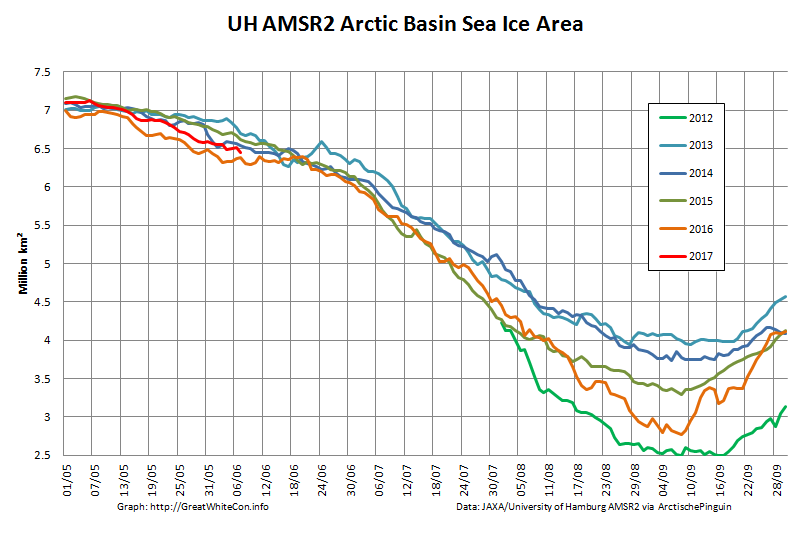
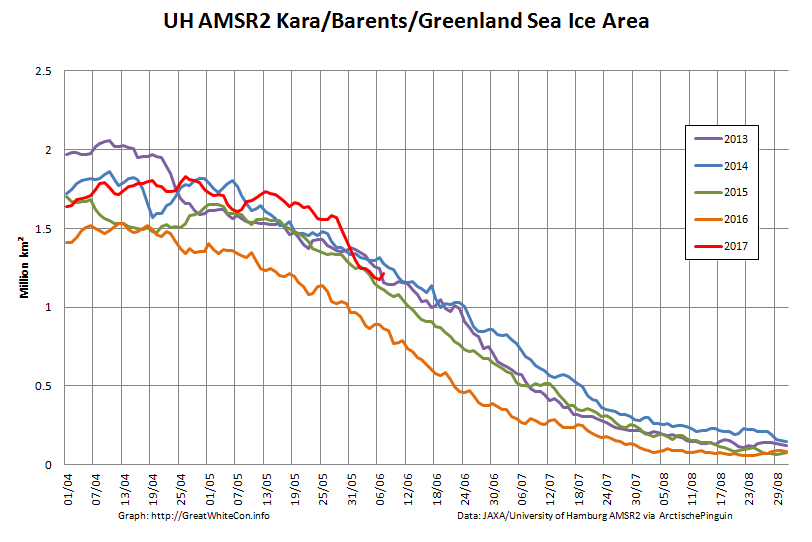
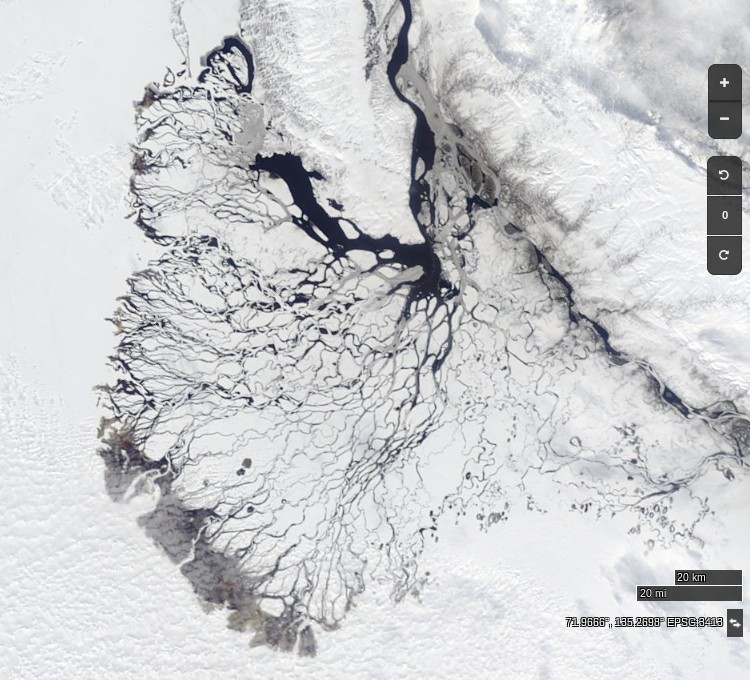
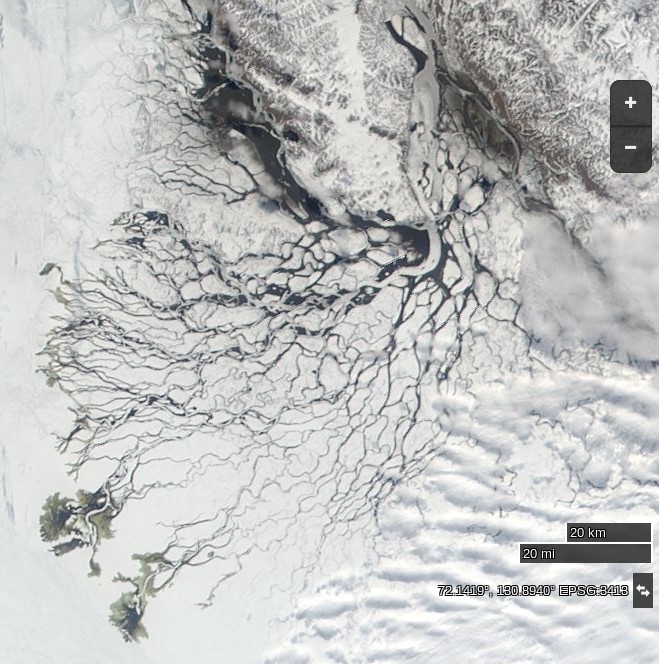
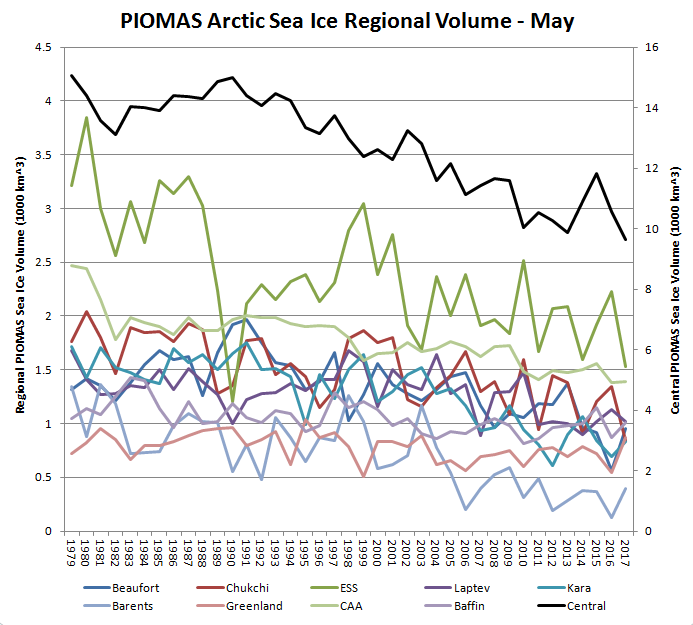
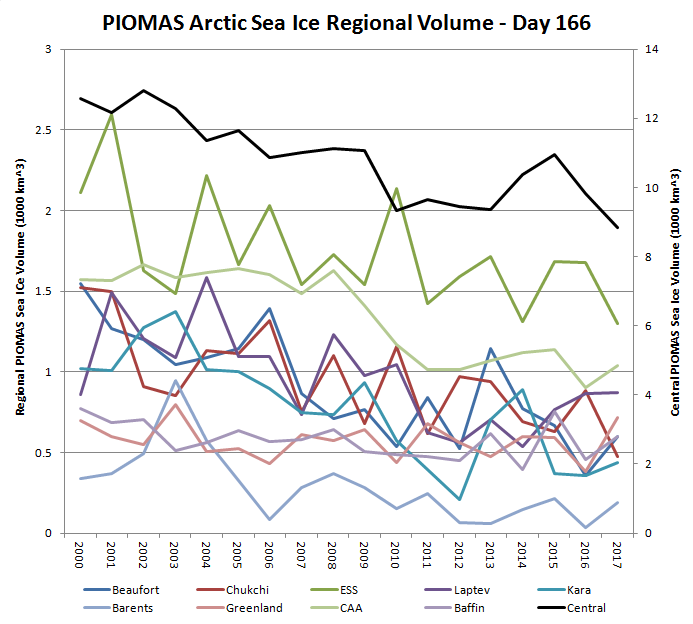
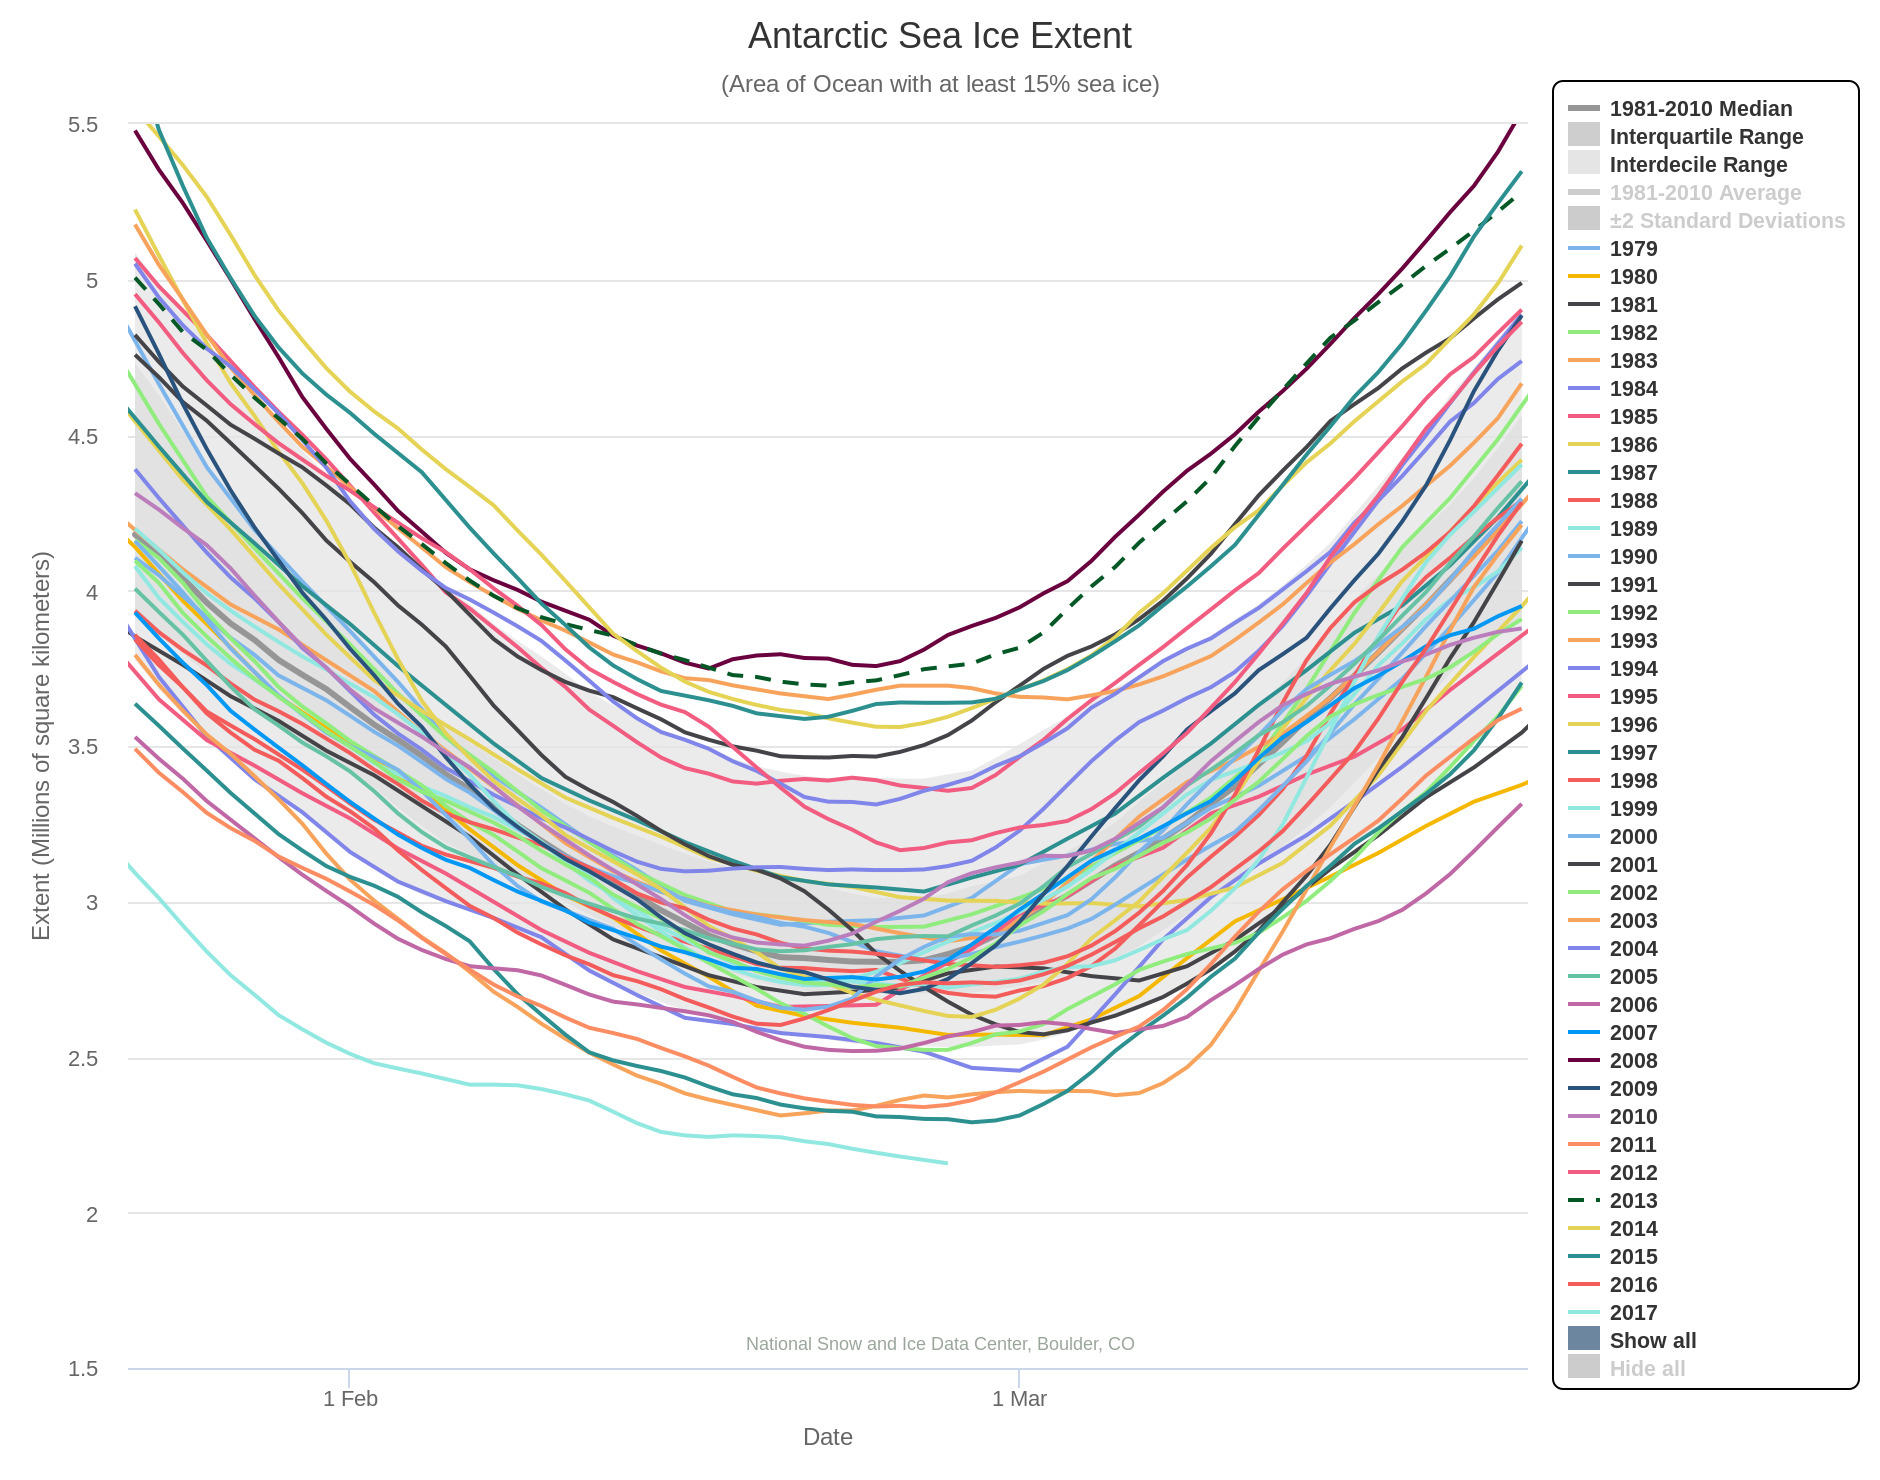
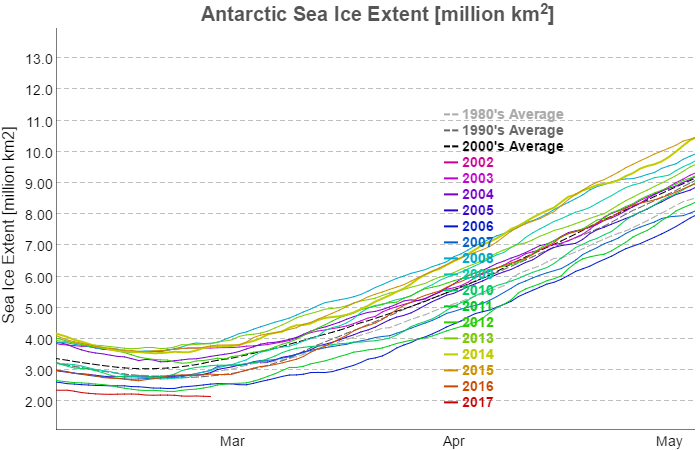
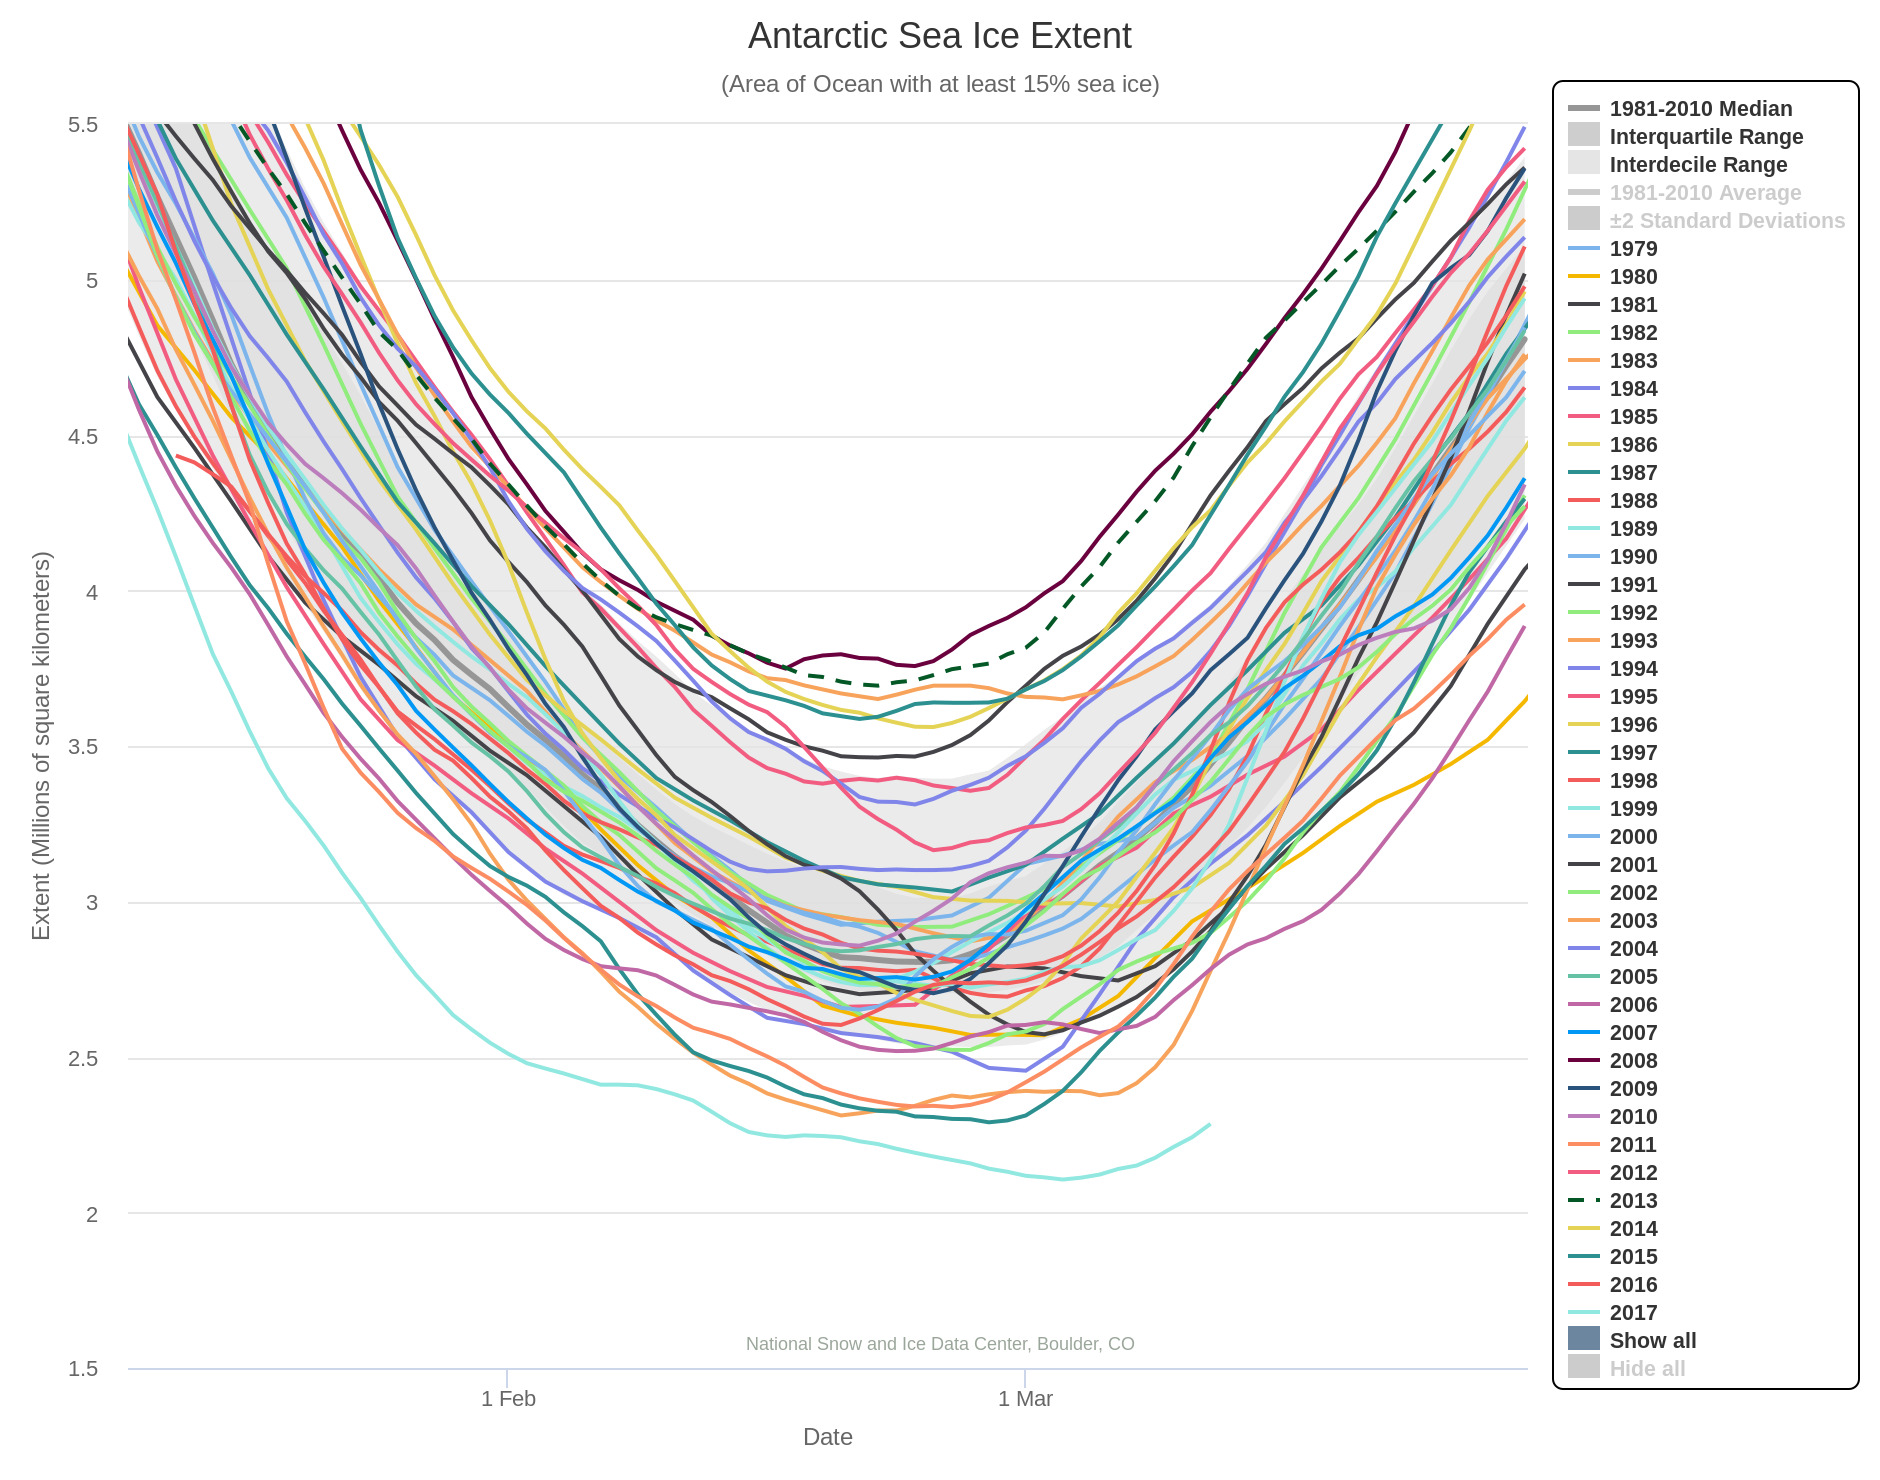
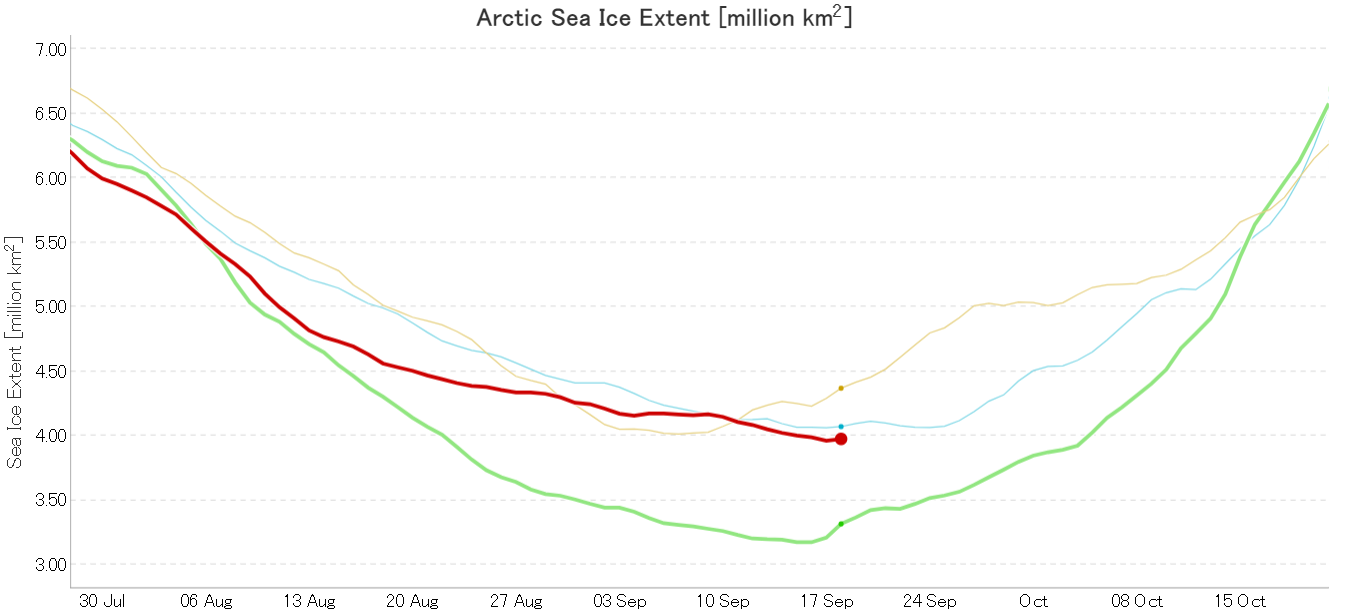
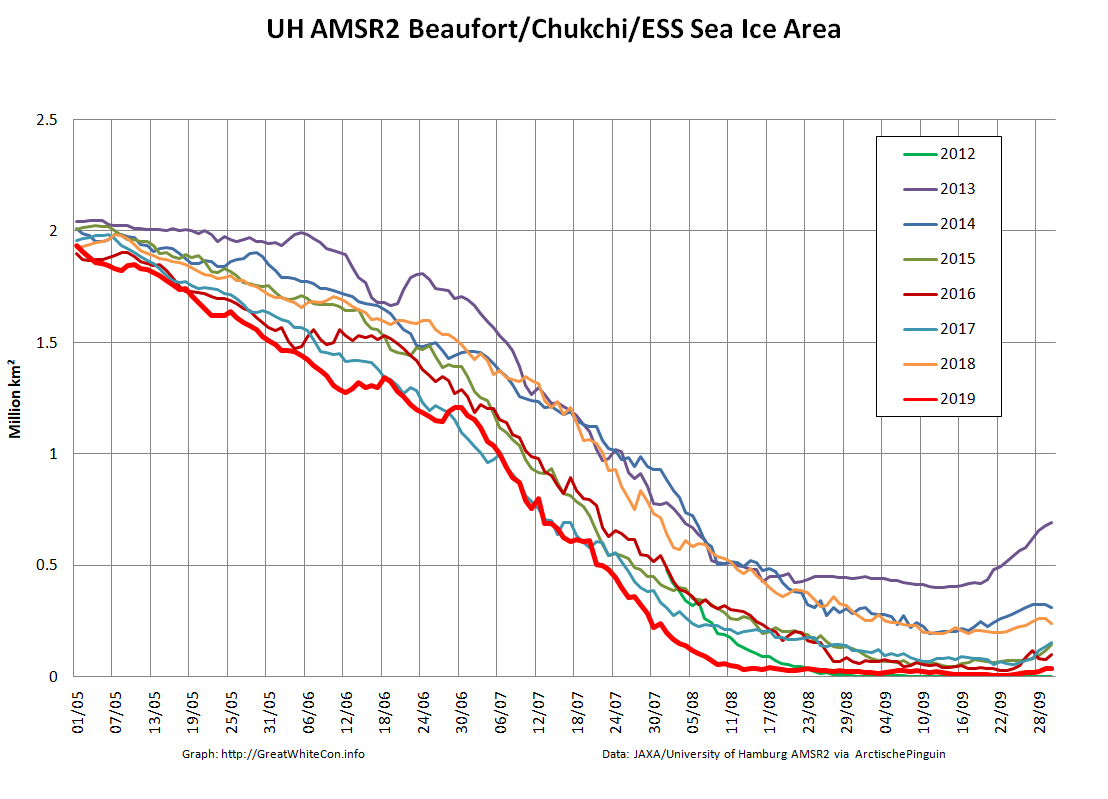
Two sides of the same coin? Sea ice area on the Pacific side of the Arctic has been at historic lows for most of the melting season:
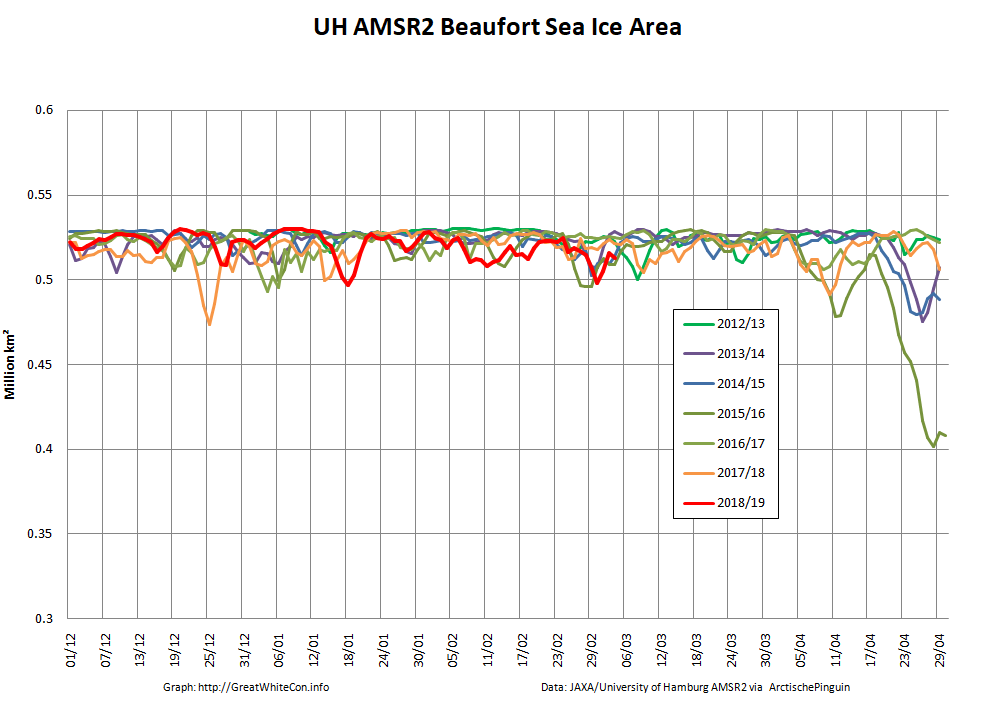
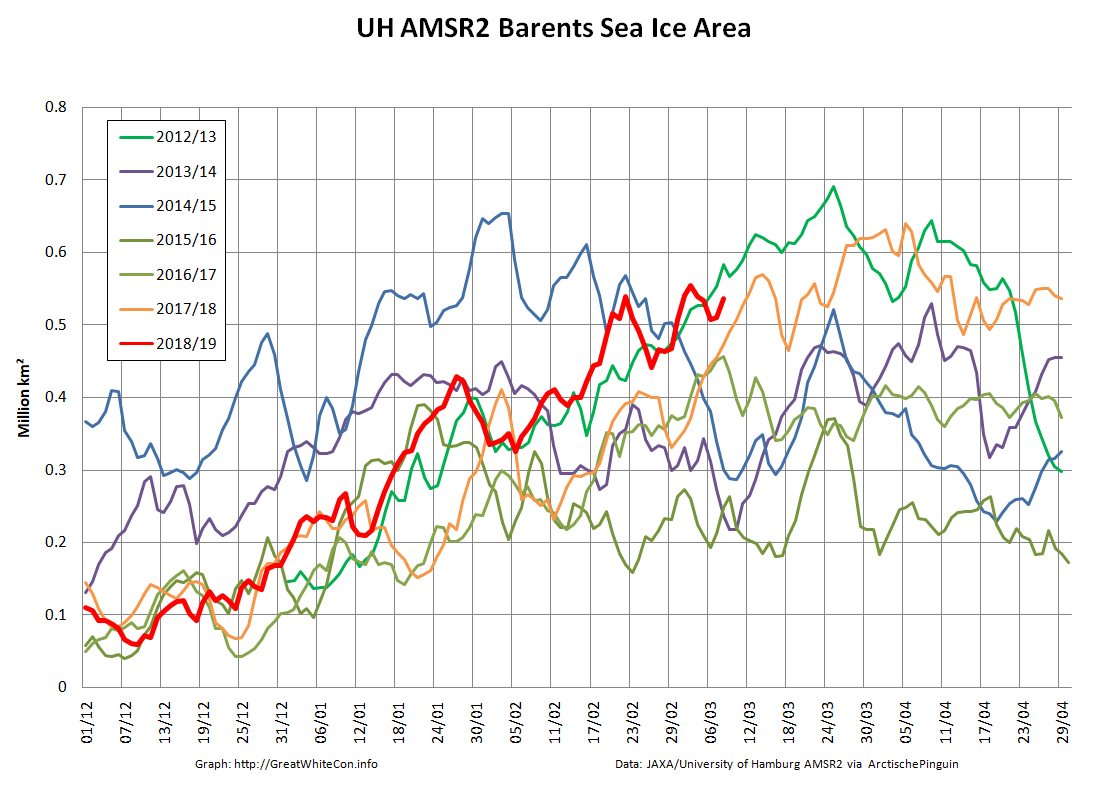
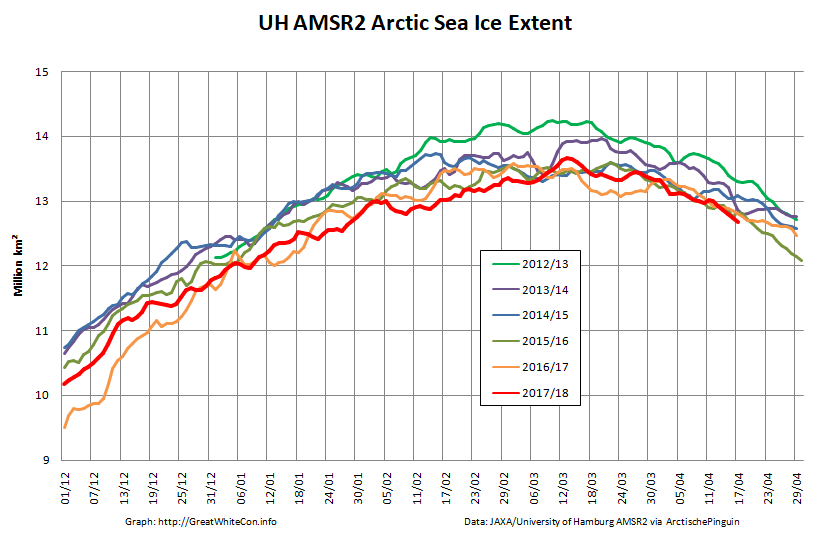
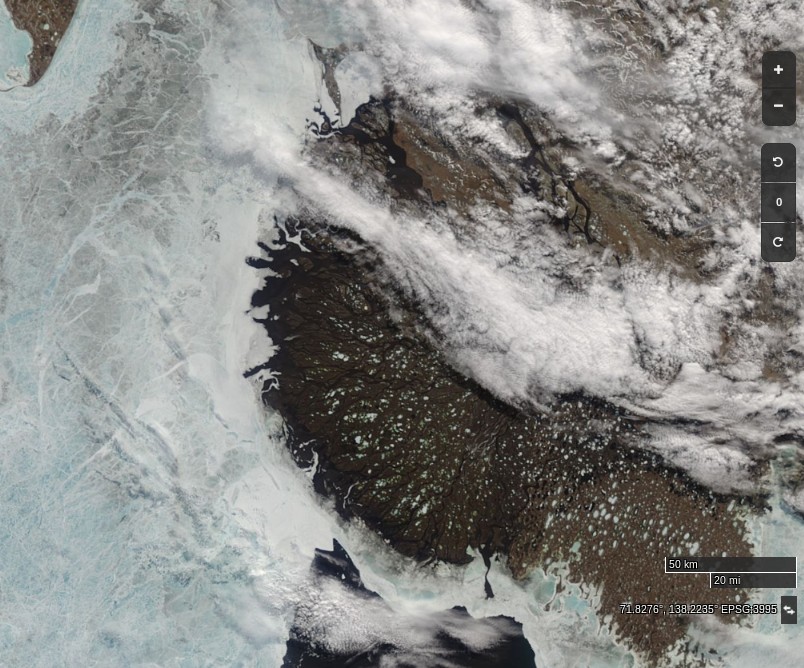
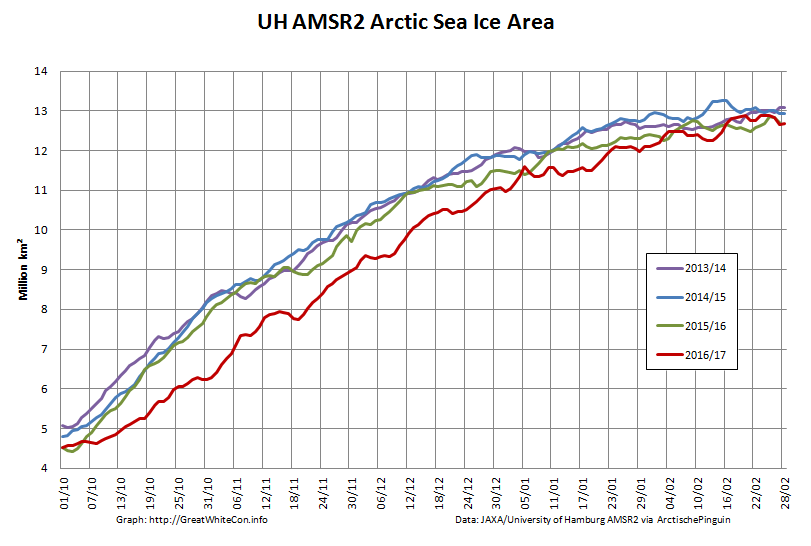
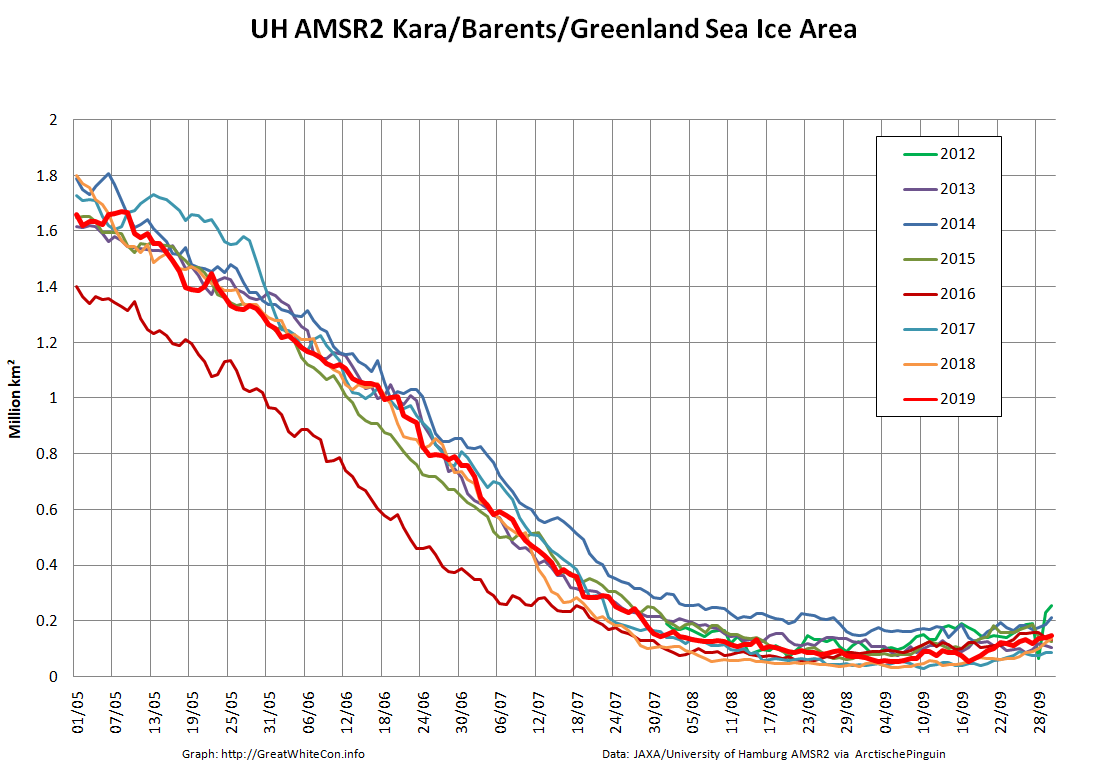
whereas on the Atlantic side:
[Edit – October 7th]
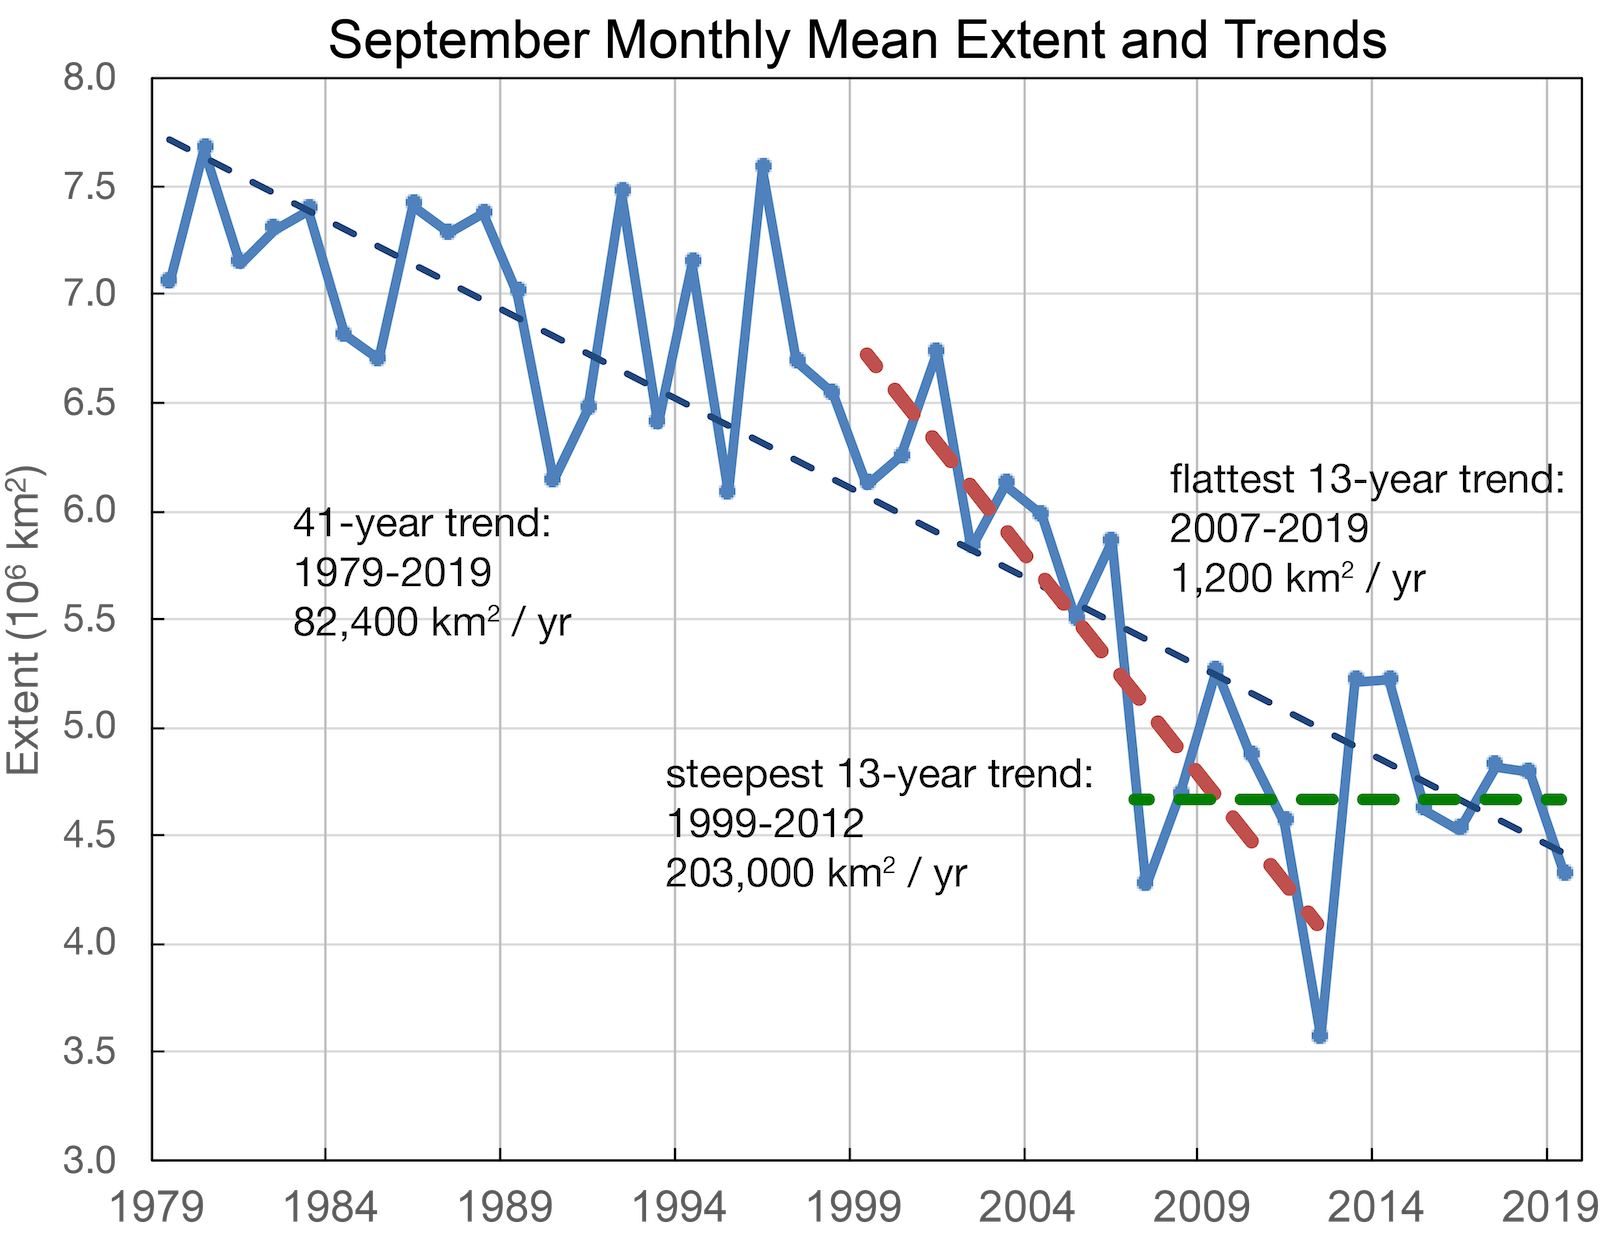
The September monthly numbers have arrived from the NSIDC, together with some intriguing annotations by Walt Meier:
Watch this space. Just in case!