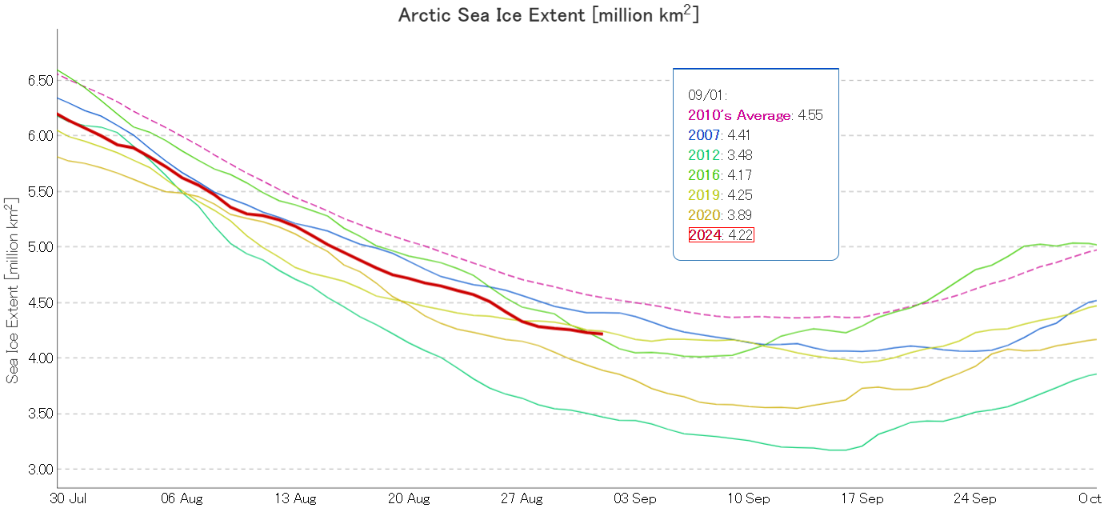
At the beginning of September JAXA/ViSHOP extent was 4th lowest for the date in the satellite era:
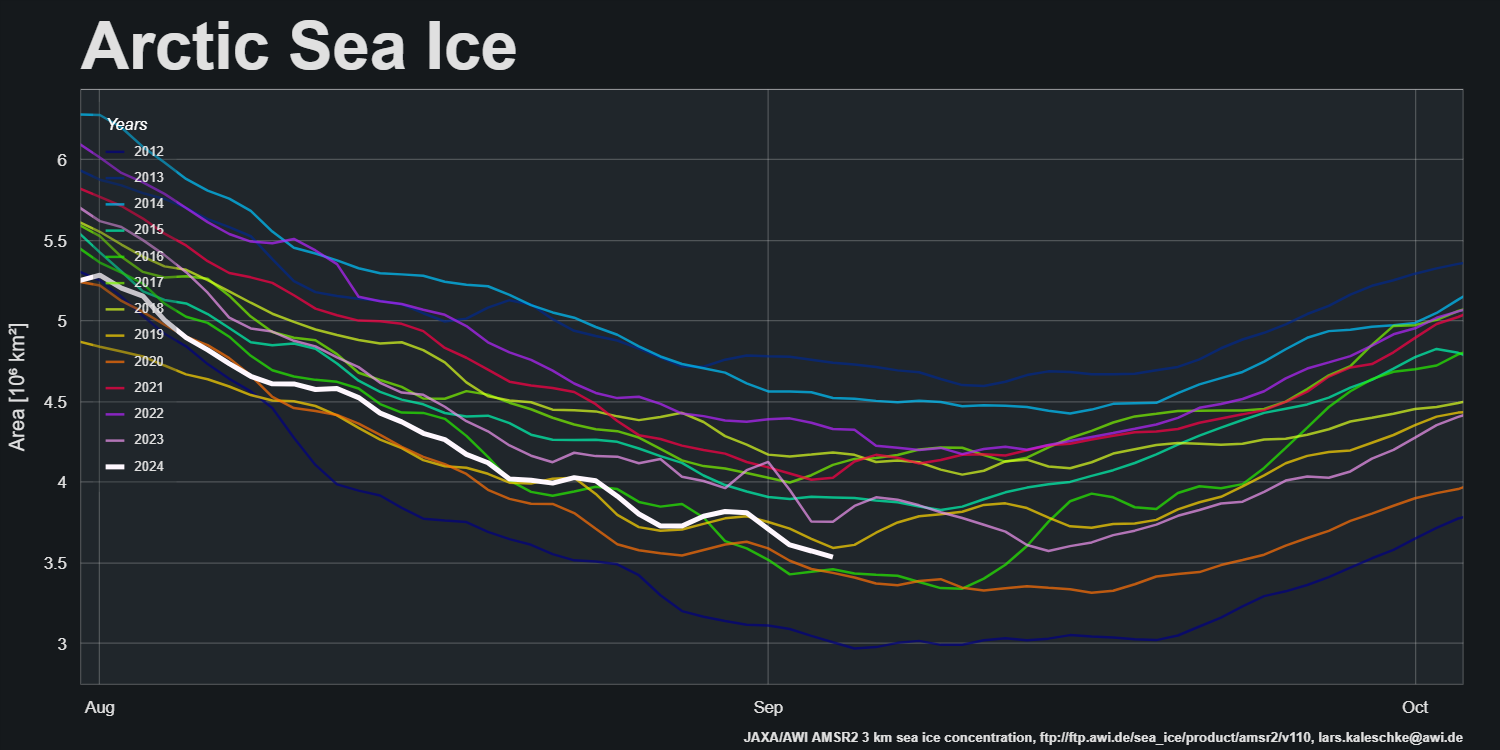
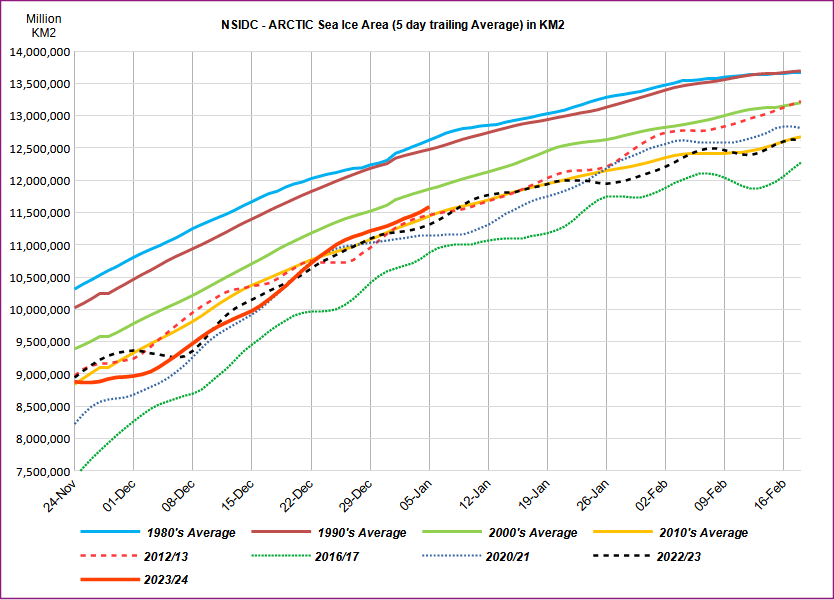
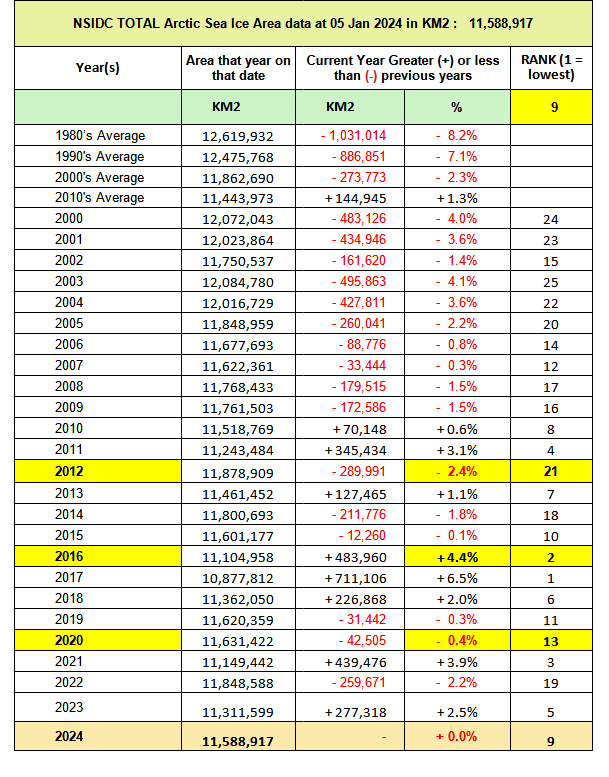
For much more detail on sea ice extent for the next few weeks please see the dedicated 2024 minimum thread. However, note that as extent has been flatlining sea ice area is still declining:
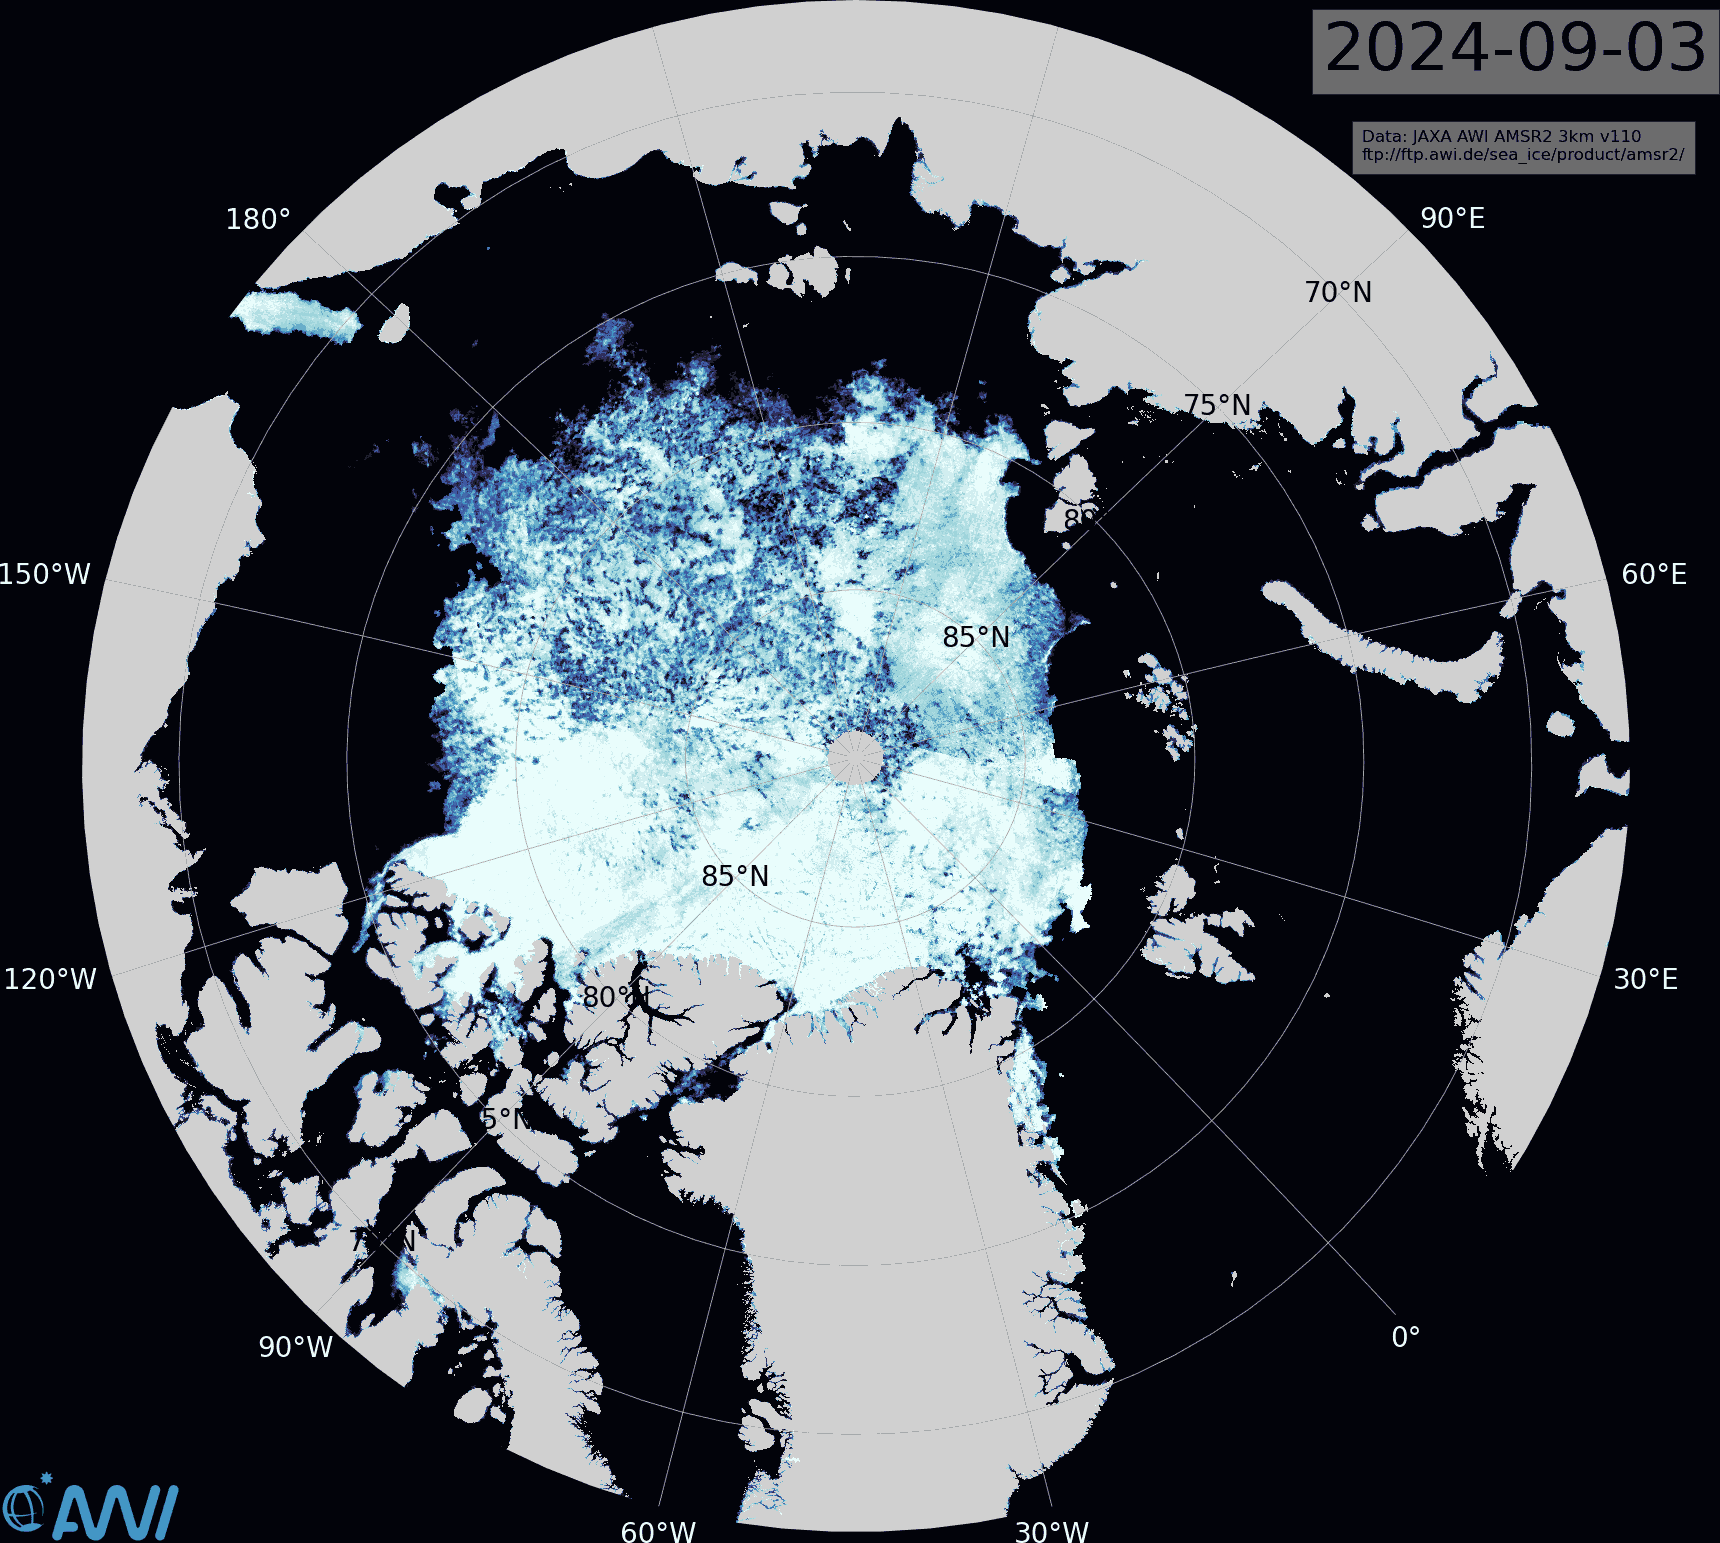
The latest AMSR2 sea ice concentration map from the Alfred Wegener Institute reveals that the area of thick ice in the Chukchi Sea has still not melted:
The most recent sea ice age map currently available dates from the beginning of August. Comparison with the concentration map shows that most of the remaining first year ice is highly fragmented, even close to the North Pole:
According to Michael Mann he coined the name “Atlantic Multi-decadal Oscillation”:
Two decades ago, in an interview with science journalist Richard Kerr for the journal Science, I coined the term the “Atlantic Multidecadal Oscillation” (the “AMO” for short) to describe an internal oscillation in the climate system resulting from interactions between North Atlantic ocean currents and wind patterns. These interactions were thought to lead to alternating decades-long intervals of warming and cooling centered in the extratropical North Atlantic that play out on 40-60 year timescales (hence the name). Think of the purported AMO as a much slower relative of the El Nino/Southern Oscillation (ENSO), with a longer timescale of oscillation (multidecadal rather than interannual) and centered in a different region (the North Atlantic rather than the tropical Pacific).
More recently Mann et al. claimed that in actual fact the AMO does not exist.
For several decades the existence of interdecadal and multidecadal internal climate oscillations has been asserted by numerous studies based on analyses of historical observations, paleoclimatic data and climate model simulations. Here we use a combination of observational data and state-of-the-art forced and control climate model simulations to demonstrate the absence of consistent evidence for decadal or longer-term internal oscillatory signals that are distinguishable from climatic noise. Only variability in the interannual range associated with the El Niño/Southern Oscillation is found to be distinguishable from the noise background.
More recently still I discovered the source of Matt’s optimistic, AMO based prediction of Arctic sea ice recovery. Here is the latest edition, courtesy of Roger “Tallbloke” Tattersall:
Whilst waiting for the all important thickness and volume data to arrive, we’ll start the new year in traditional fashion with a graph of JAXA extent:
The 2023 calendar year finished with this particular extent metric sitting at 15th lowest in the satellite era.
From Niall Dollard on the Arctic Sea Ice Forum comes evidence via the Sentinel 1A satellite that an arch formed in the Nares Strait between Greenland and Ellesmere Island in late December:
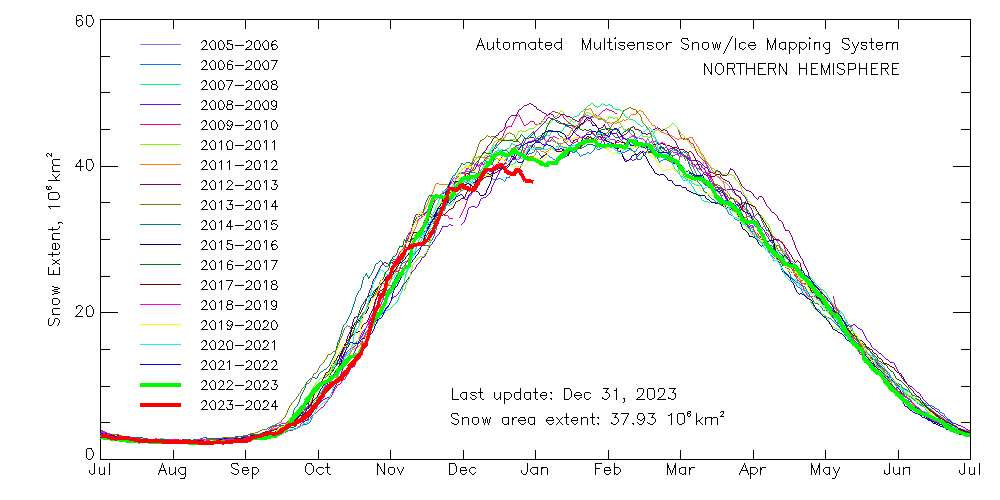
Please note the current record low NH snow extent. Matt predicts all that is about to change:
How sure? And in what way "totally different"?
Have you pointed out to Tony yet that the current daily snow cover data you cite utterly negates his recent assertion that "Autumn/Winter snow cover has been increasing for almost 60 years"?
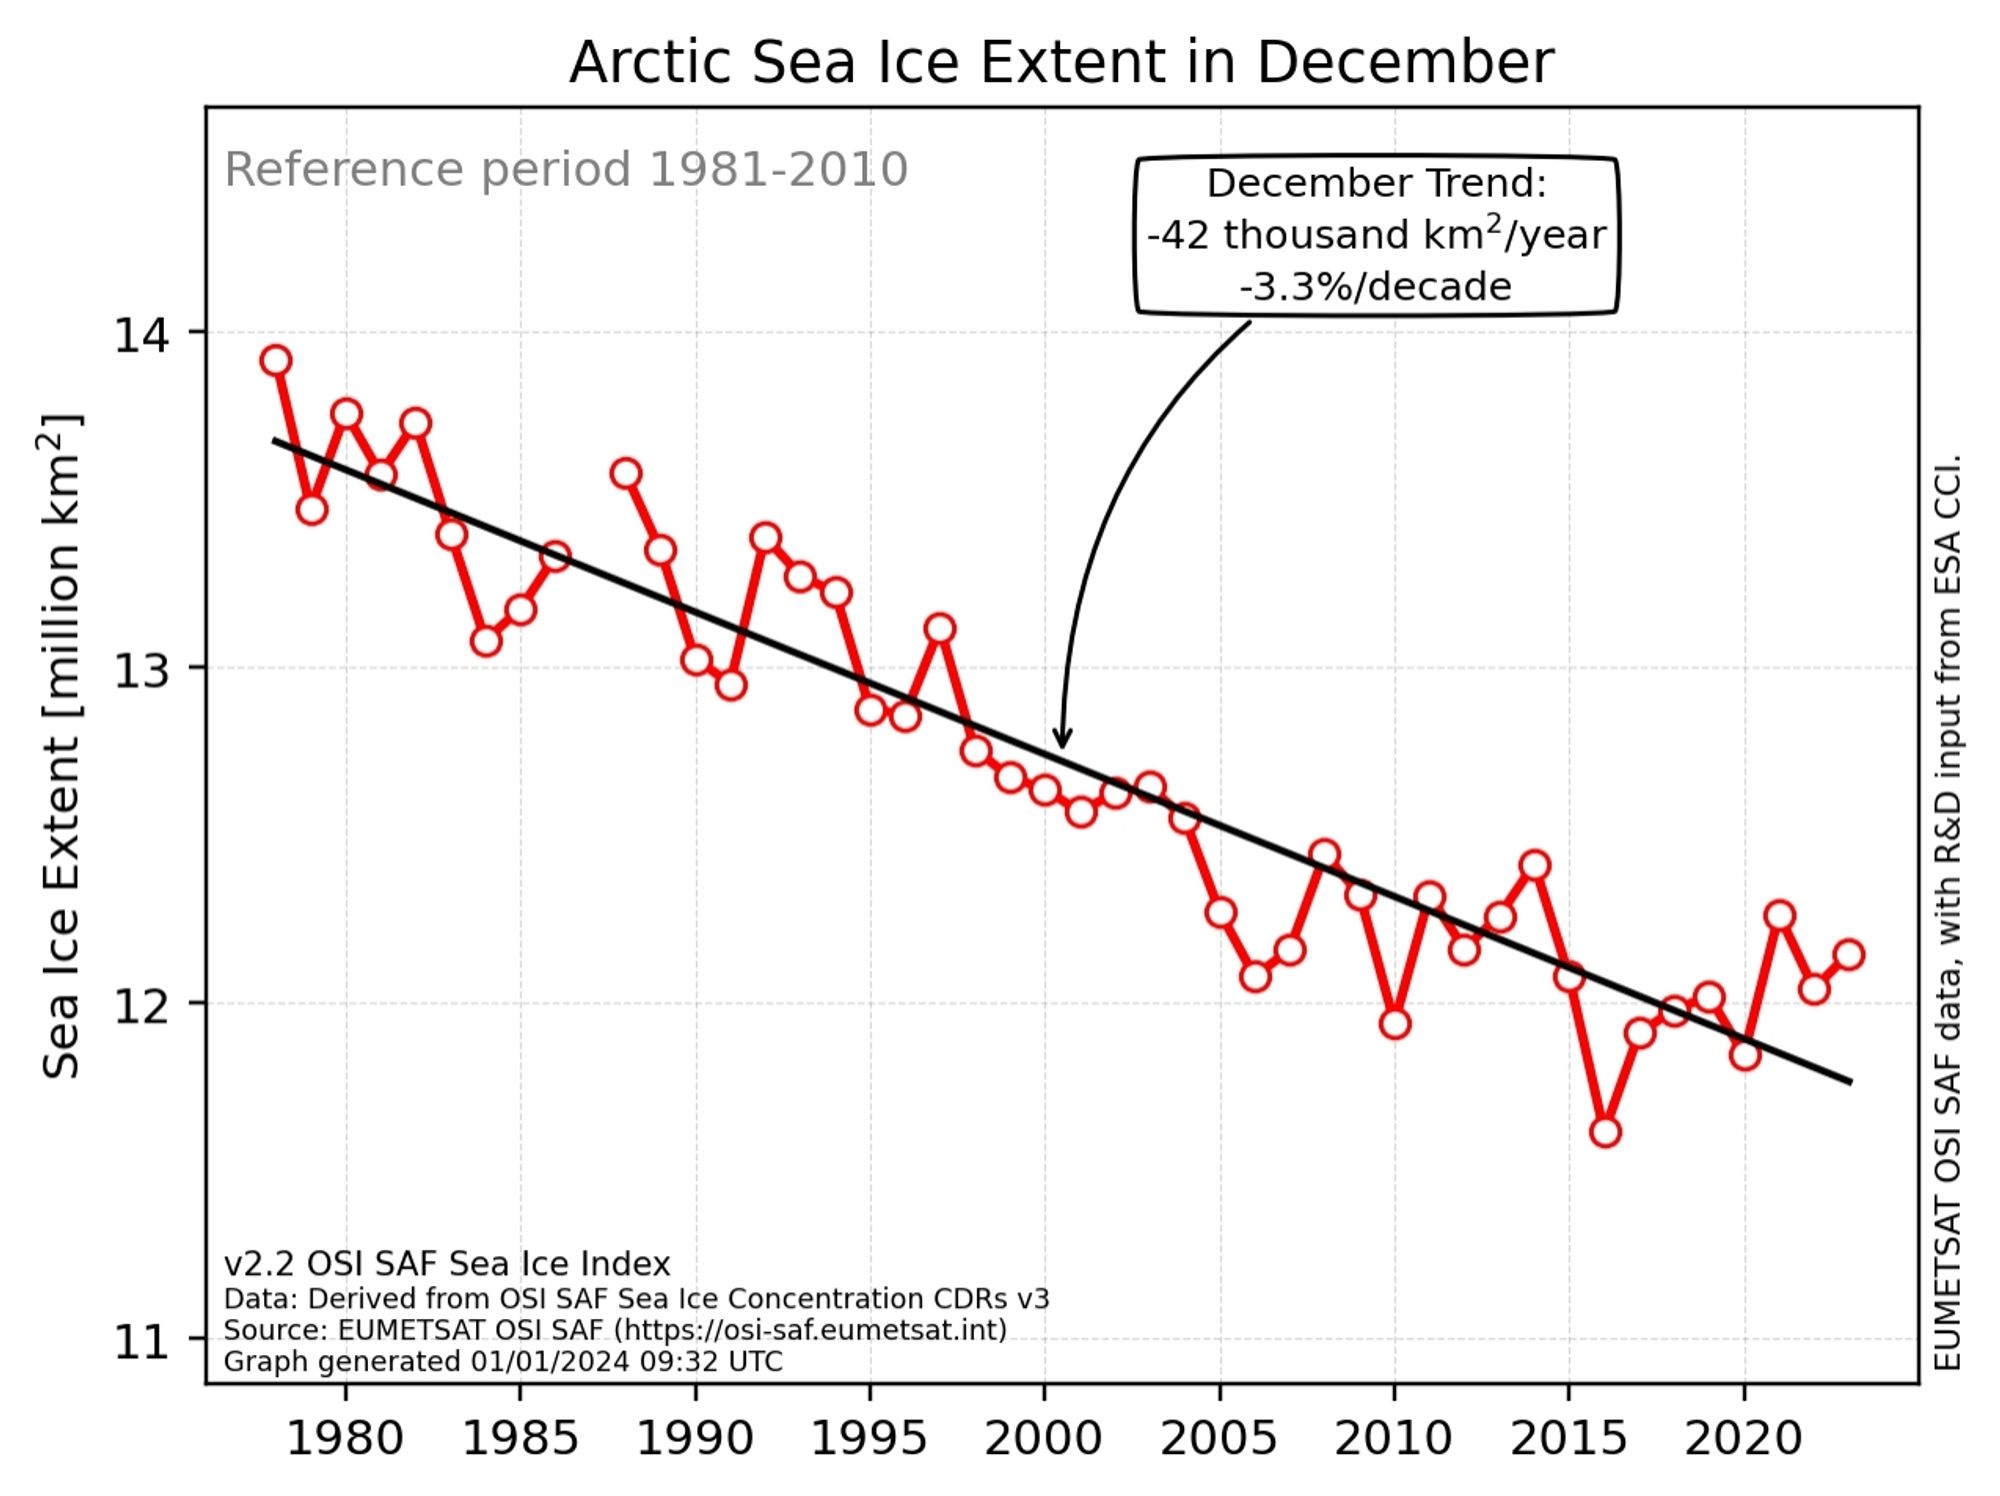
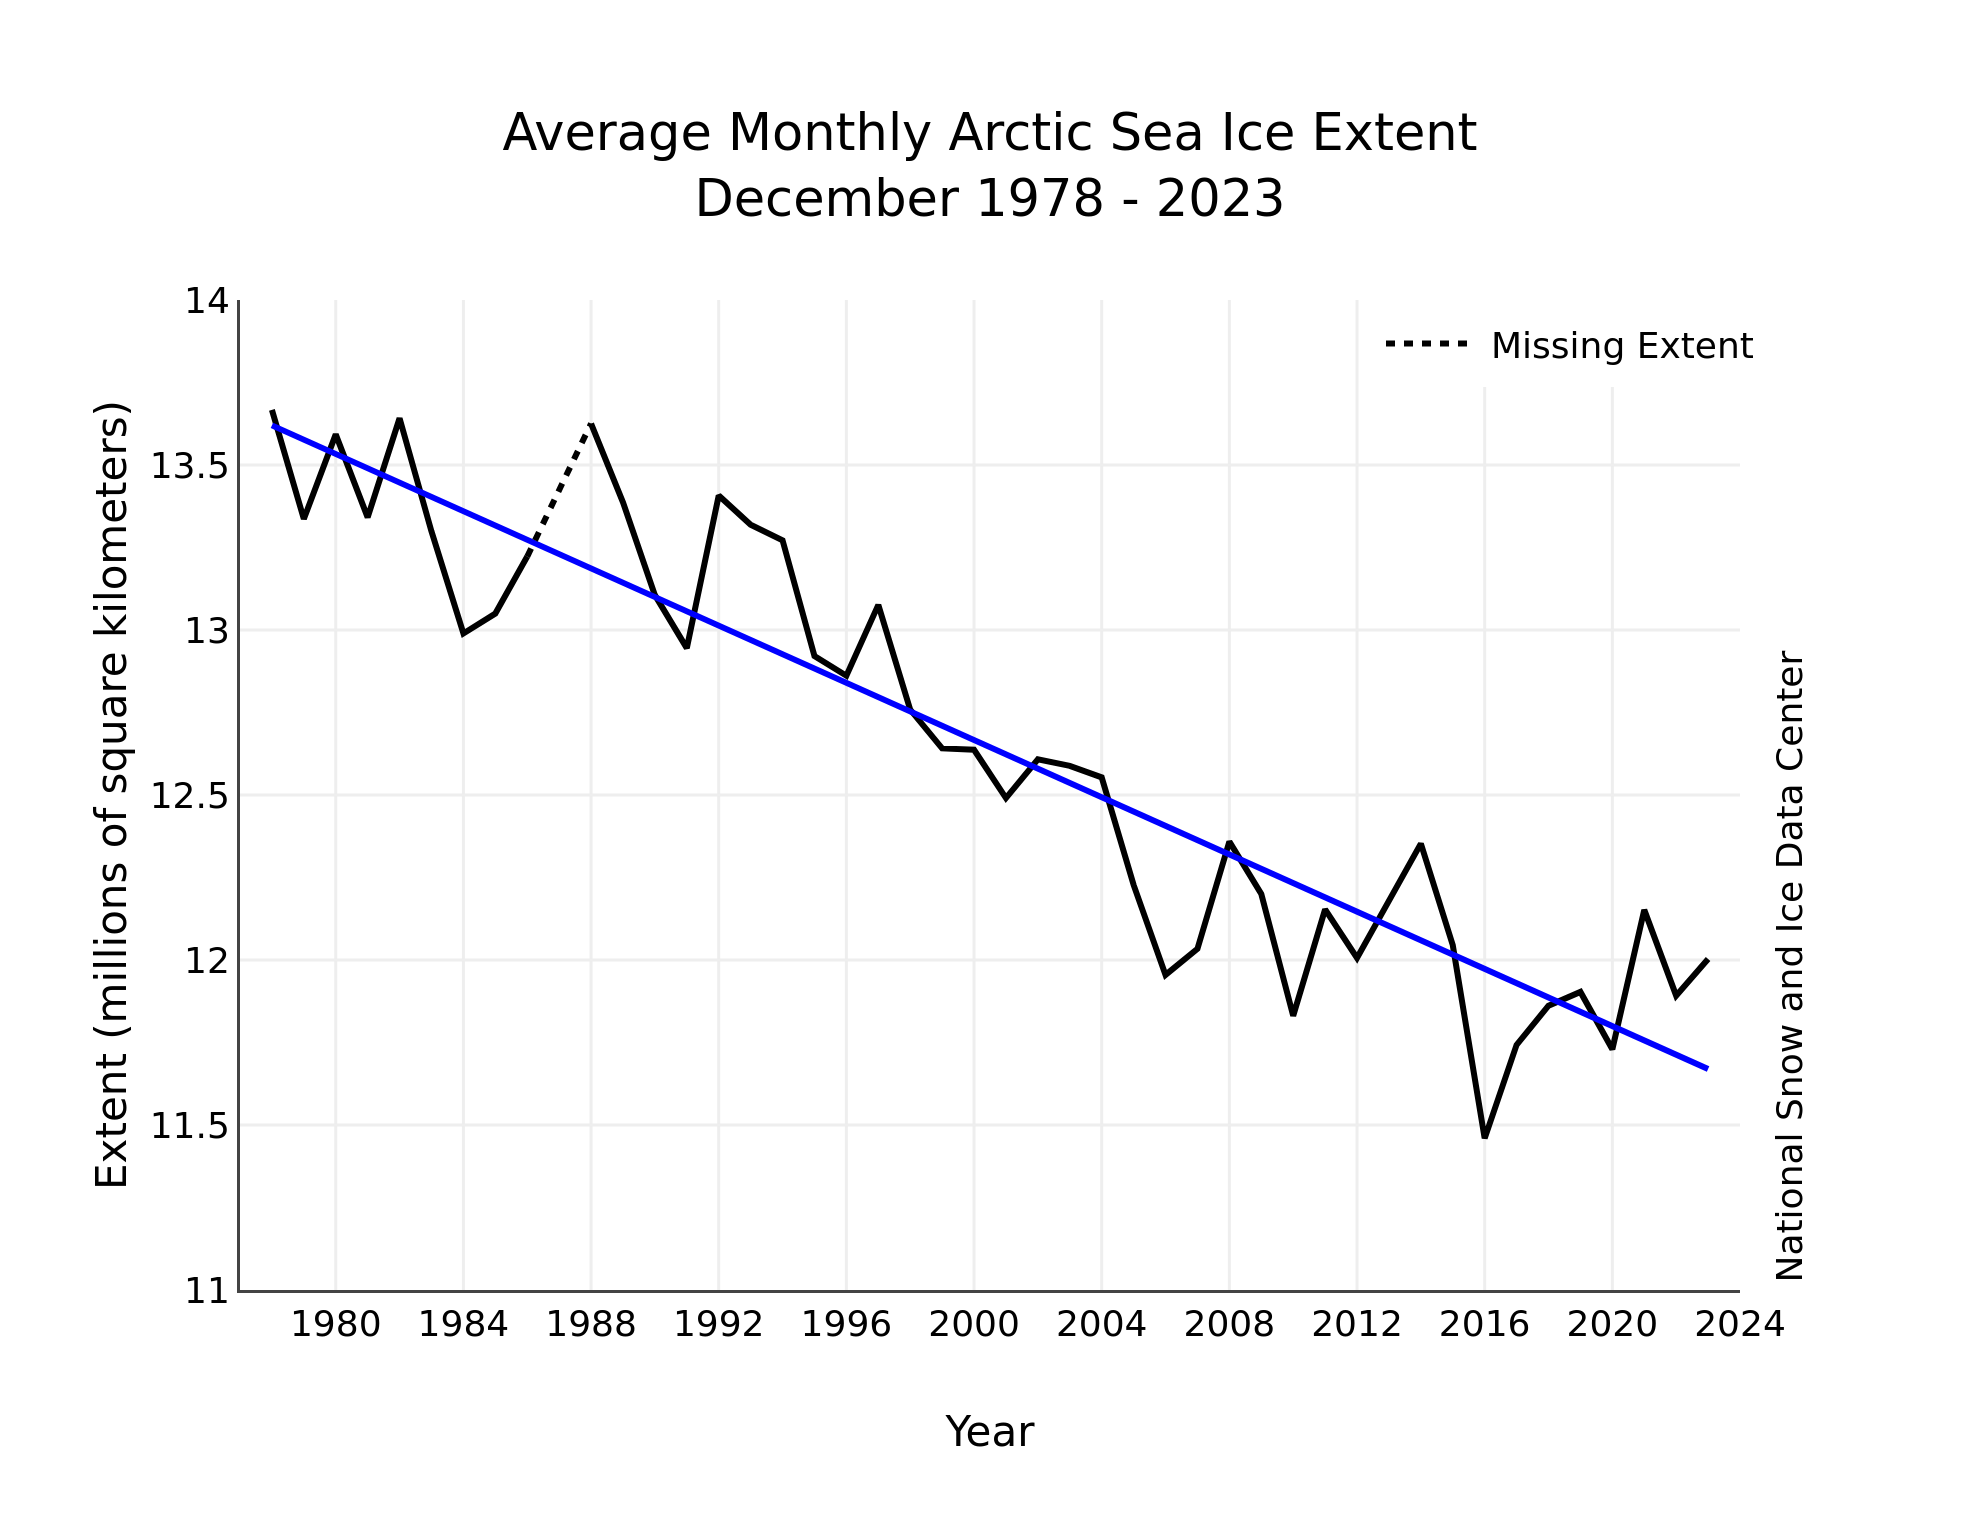
Hot off the Scandinavian virtual printing presses, here is the official December Arctic sea ice extent trend graph from the OSI SAF:
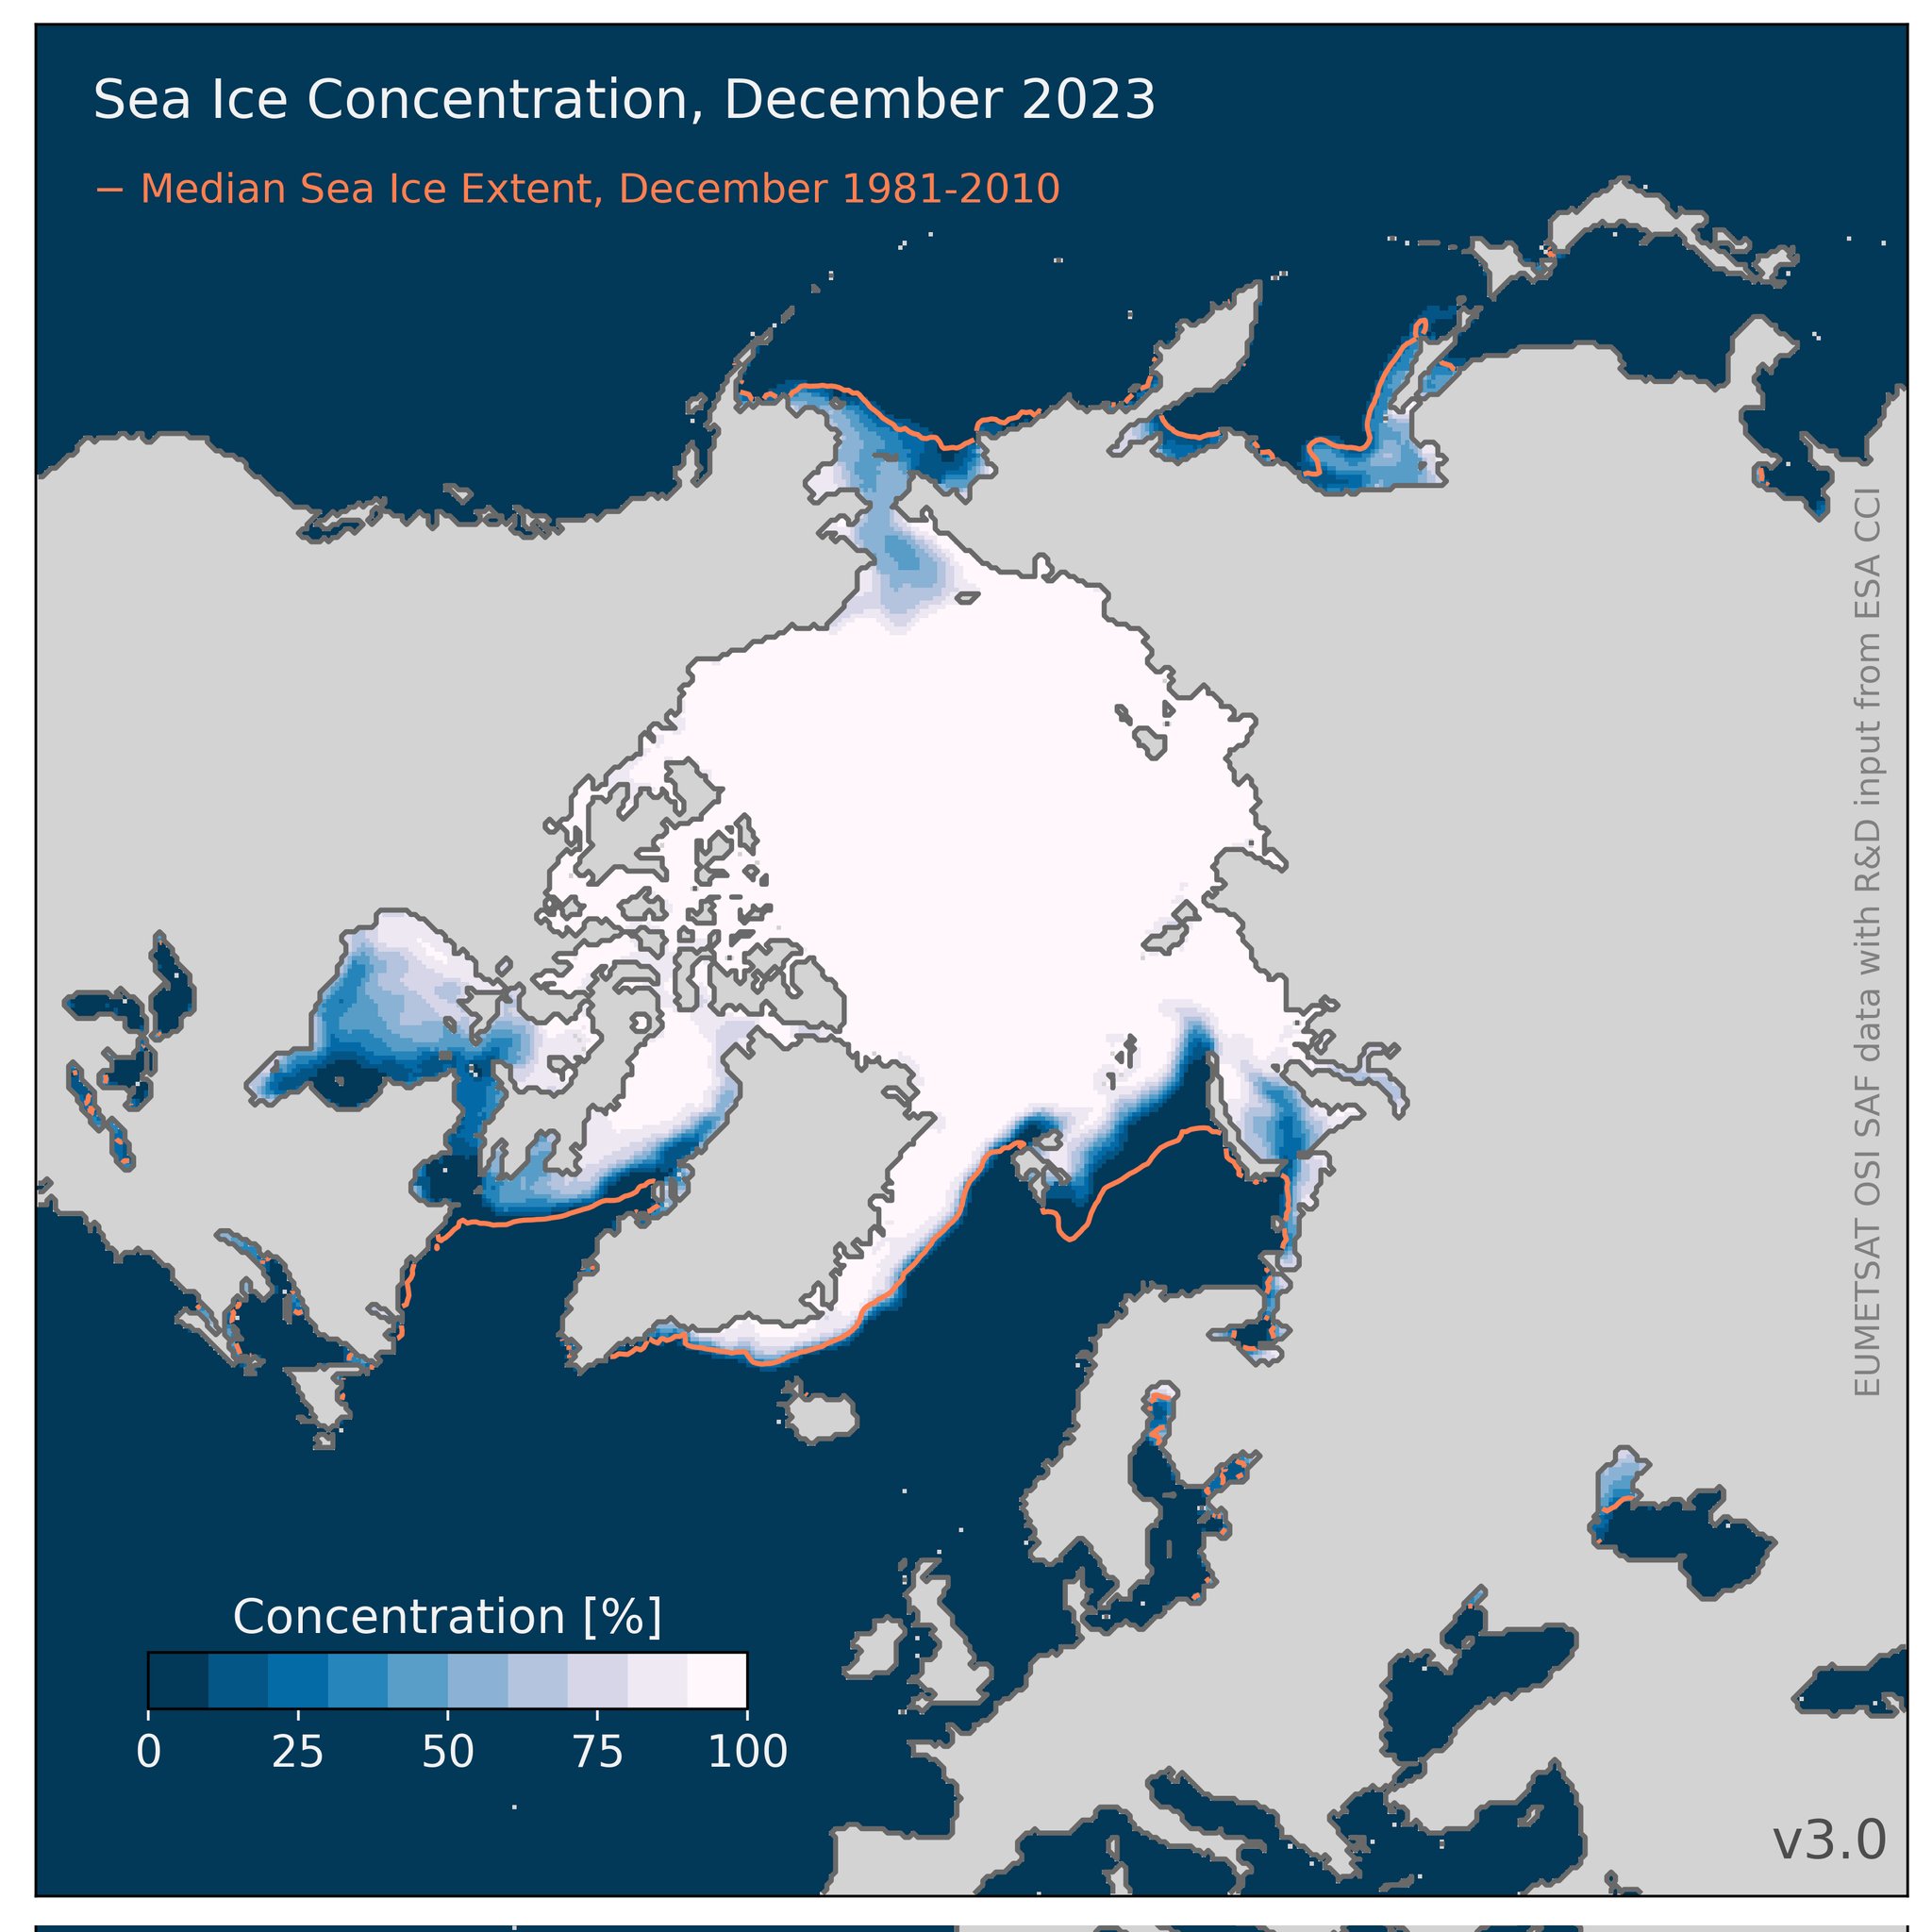
That’s “Steve”/Tony’s current metric du jour. When do you suppose he will bring it to the attention of his horde of regular readers? It’s accompanied by this matching concentration map:
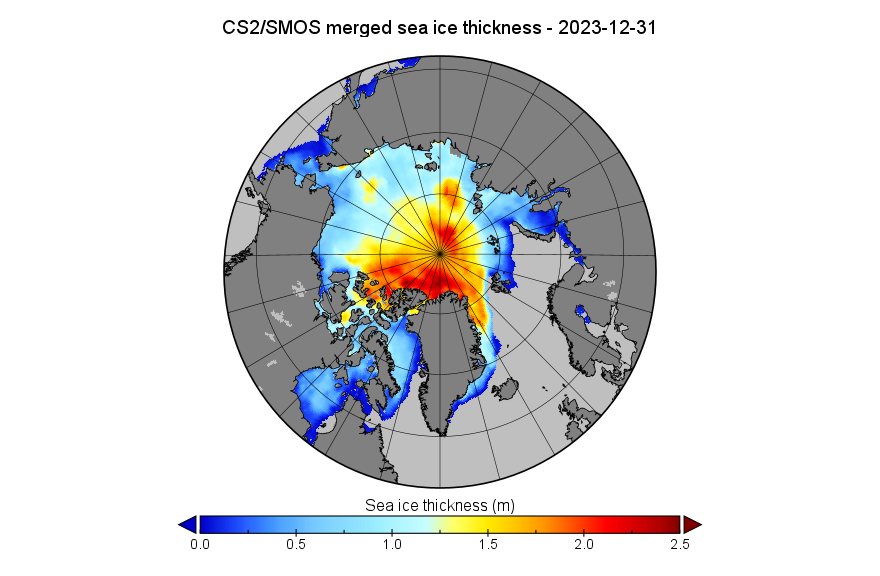
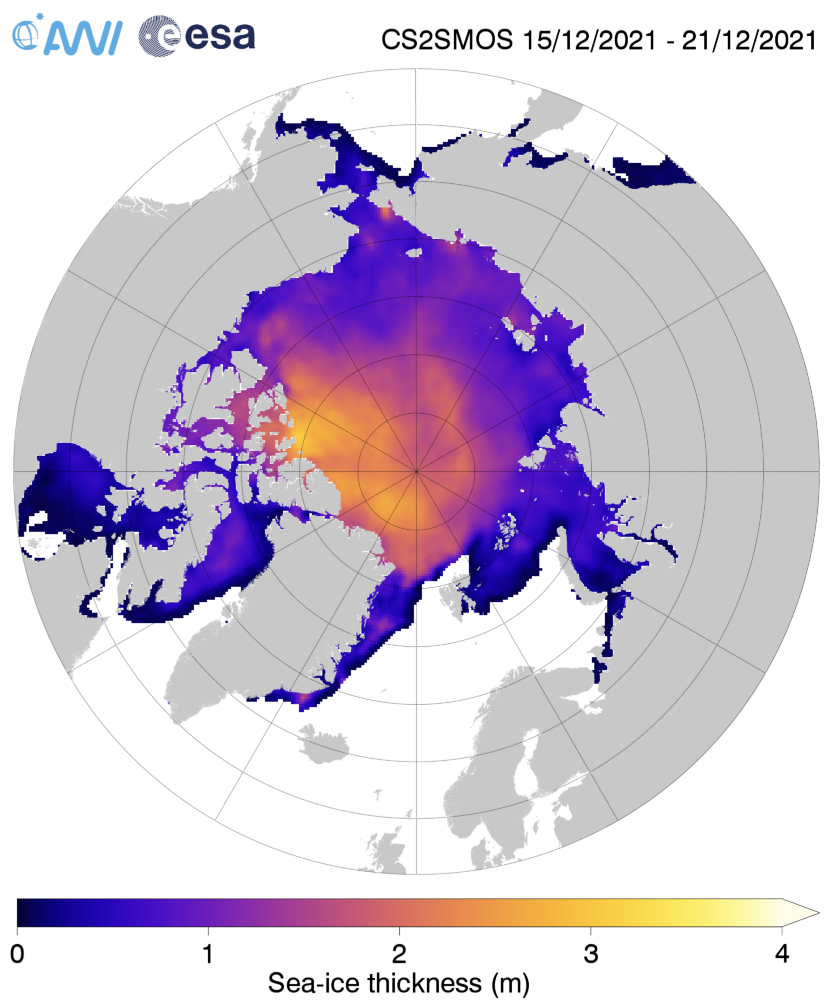
Here too is the CryoSat-2/SMOS thickness map for December 31st, in a different format to the one usually used here:
[Update – January 3rd]
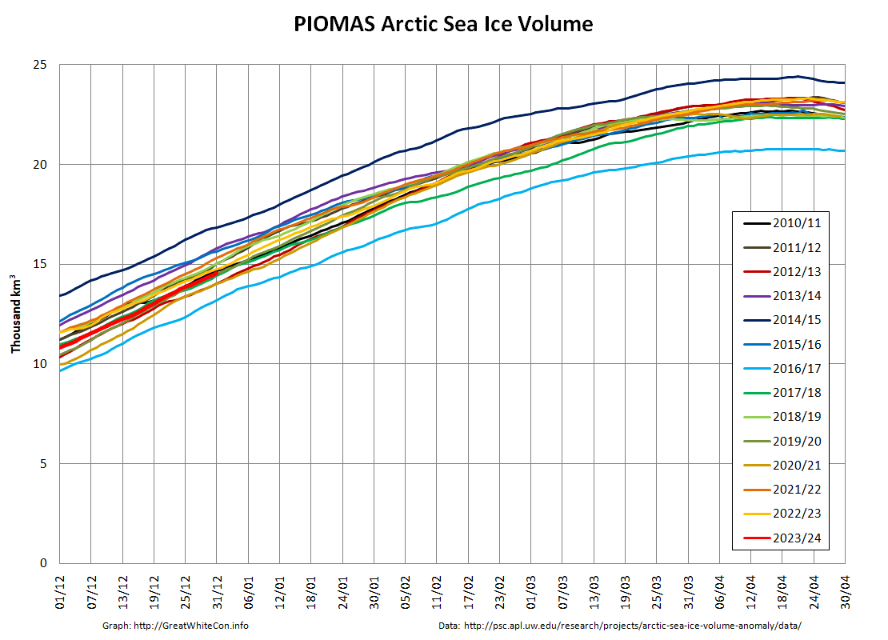
The December PIOMAS modelled gridded thickness data has been released. The calculated volume is 6th lowest in the satellite era:
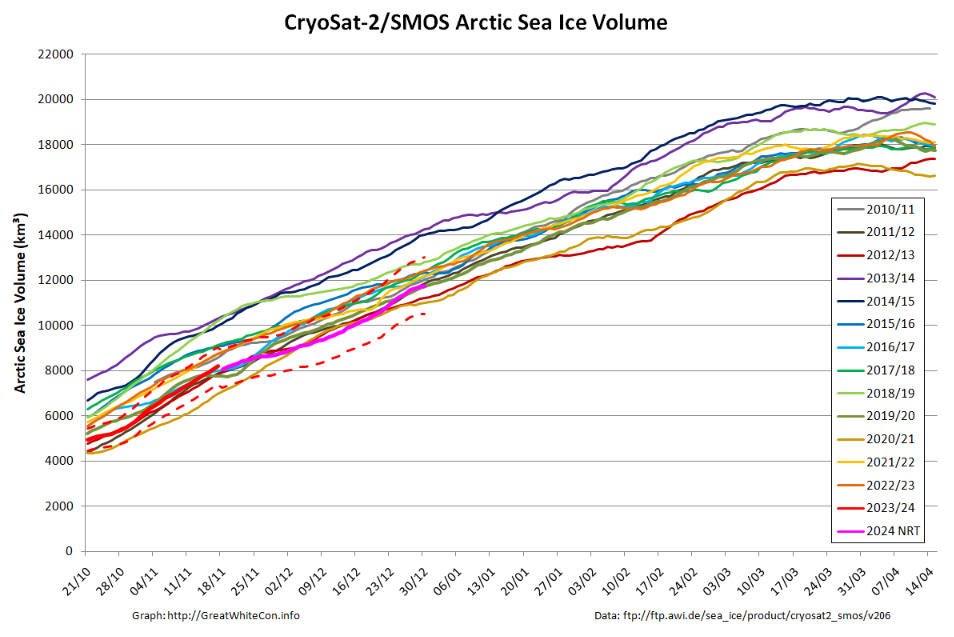
Here is the equivalent CS2/SMOS volume graph
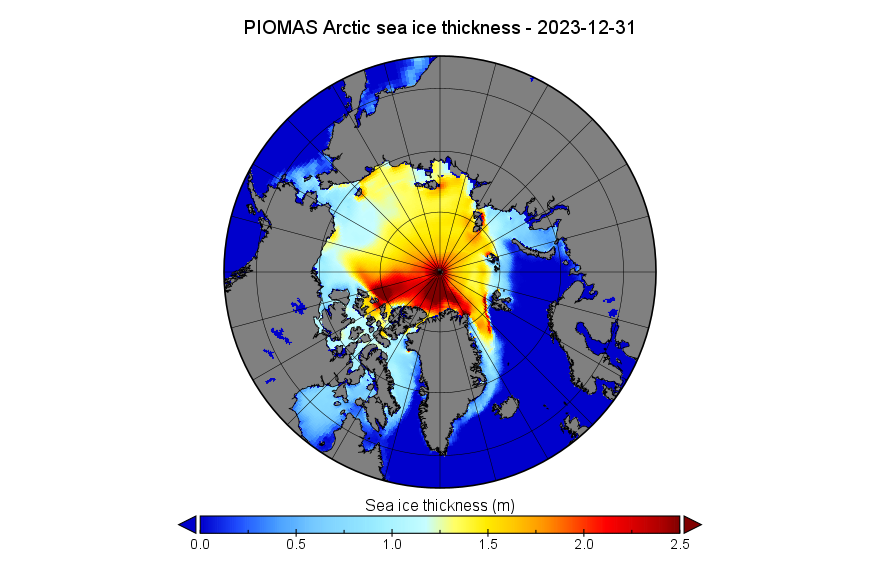
Here too is the PIOMAS thickness map for December 31st:
This uses the same Greenland down orientation and 2.5 meter maximum scale value as the CS2/SMOS map above.
The end of 2023 had above average sea ice growth, bringing the daily extent within the interdecile range, the range spanning 90 percent of past sea ice extents for the date. Rapid expansion of ice in the Chukchi and Bering Seas and across Hudson Bay was responsible.
Average Arctic sea ice extent for December 2023 was 12.00 million square kilometers, ninth lowest in the 45-year satellite record . Sea ice extent increased by an average of 87,400 square kilometers per day, markedly faster than the 1981 to 2010 average of 64,100 square kilometers per day.
After a delayed start to the freeze-up in Hudson Bay, sea ice formed quickly from west to east across the bay, leaving only a small area of open ocean near the Belcher Islands at month’s end. In the northern Atlantic, sea ice extent remained below average extent, as has been typical for the past decade.
For December overall, 2023 had the third highest monthly gain in the 45-year record at 2.71 million square kilometers, behind 2006 at 2.85 million square kilometers and 2016 at 2.78 million square kilometers.
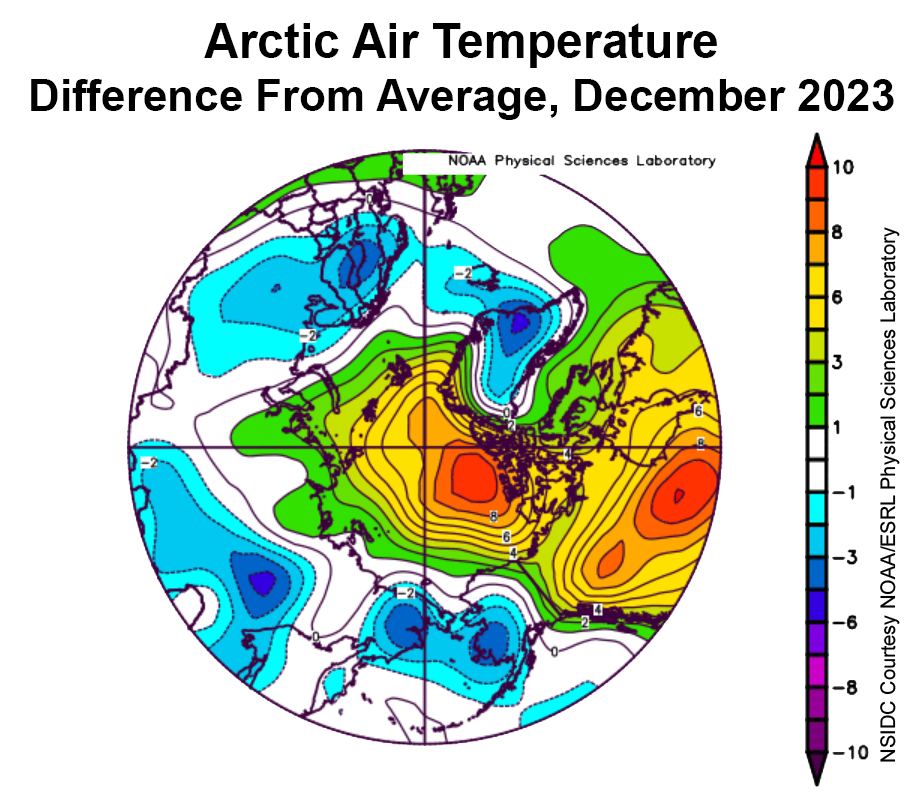
Moving on to the “Conditions in context” section:
Warm conditions prevailed over the central Arctic Ocean and Beaufort Sea regions, as well as over Hudson Bay and much of northern Canada, with air temperatures at the 925 millibar level (around 2,500 feet above sea level) 8 to 9 degrees Celsius above the 1991 to 2020 average. Elsewhere, relatively cool conditions prevailed, with air temperatures 2 to 4 degrees Celsius below average in southwestern Alaska, easternmost Russia, Scandinavia, and southeast Greenland. Cool conditions in the Bering and southern Chukchi Seas explain the rapid ice growth there. By contrast, the warm conditions over Hudson Bay, continuing since November, explain its delayed start of ice formation there.
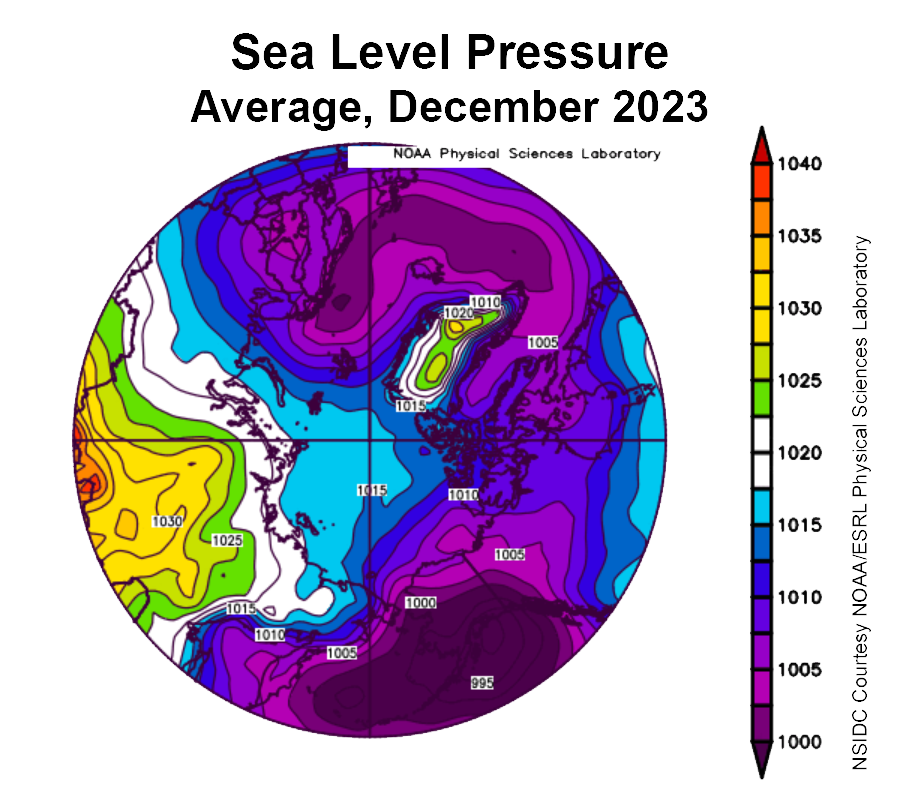
The atmospheric circulation pattern for December was marked by low sea level pressure over the Gulf of Alaska and northern Europe and high sea level pressure over central Russia. This pattern led to cold Arctic air flowing across the Chukchi Sea and into the Bering Sea as well as advection of relatively warm air across Canada into the Beaufort Sea:
Here’s a taste, but there’s much more at the dedicated article linked to above:
[Update – January 12th]
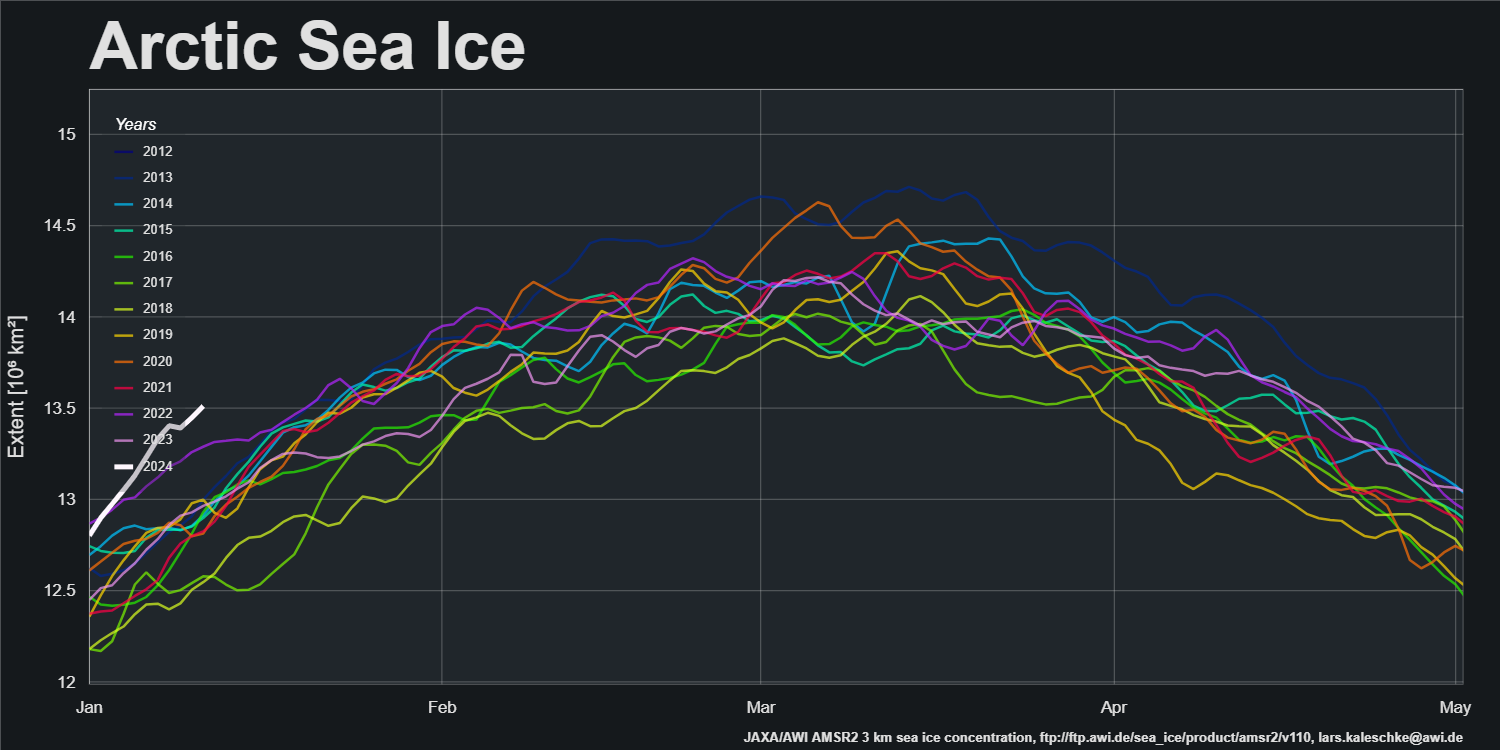
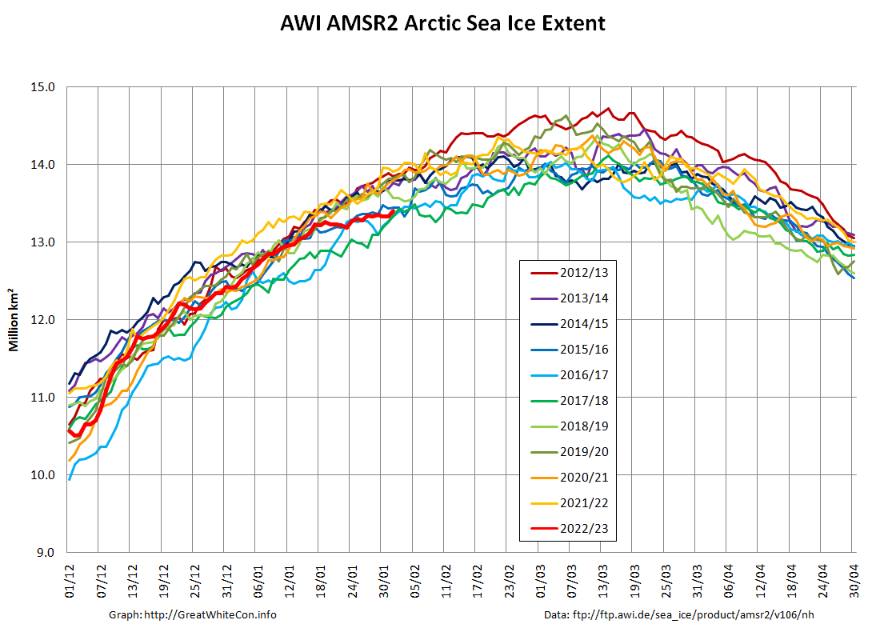
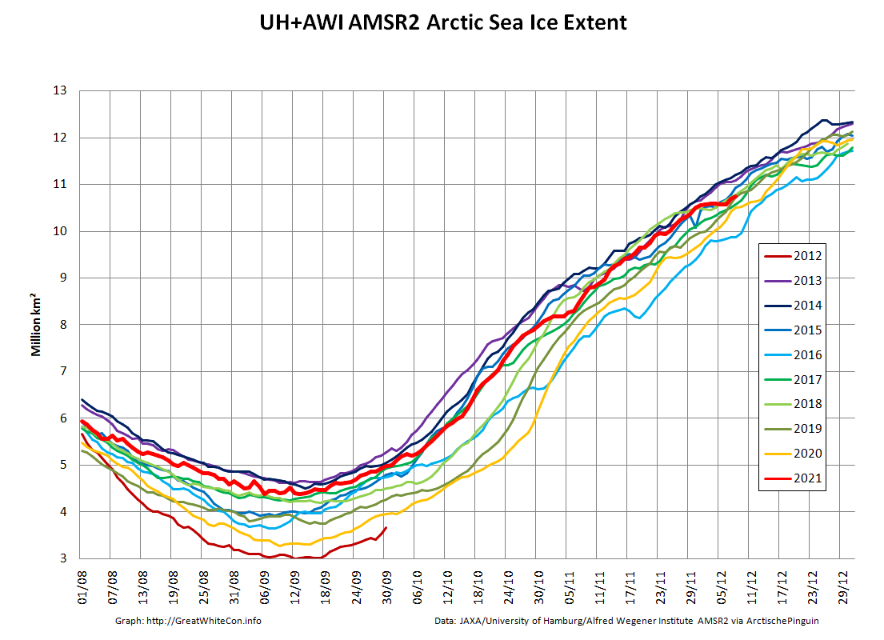
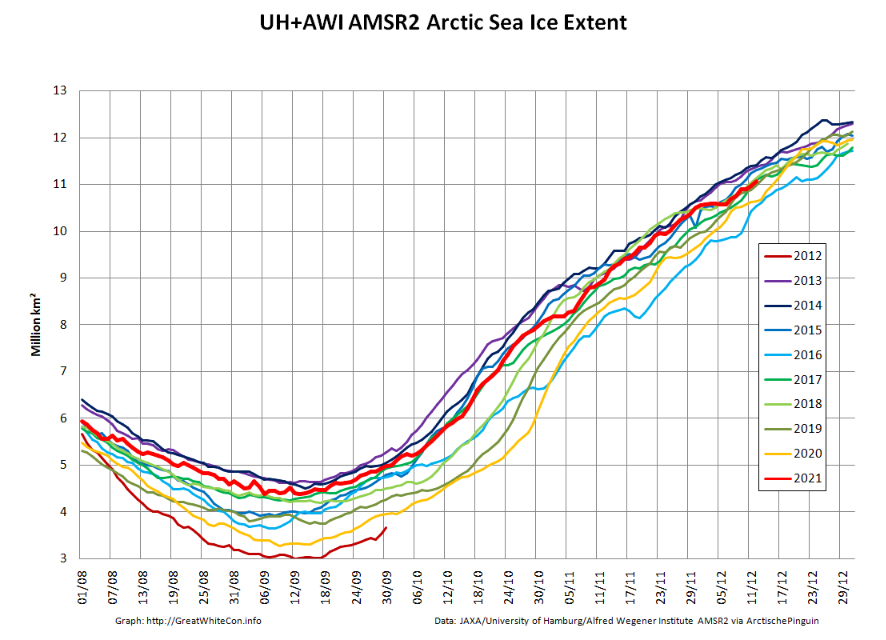
A change is as good as a rest, so here’s the AWI “high resolution” AMSR2 Arctic wide sea ice extent graph
It’s currently highest for the date in the AMSR2 era by a significant margin.
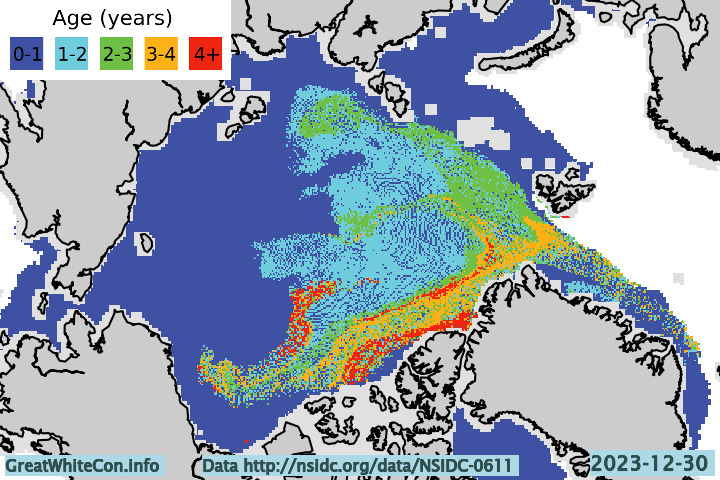
Here too is the ice age map for the end of 2023:
[Update – January 19th]
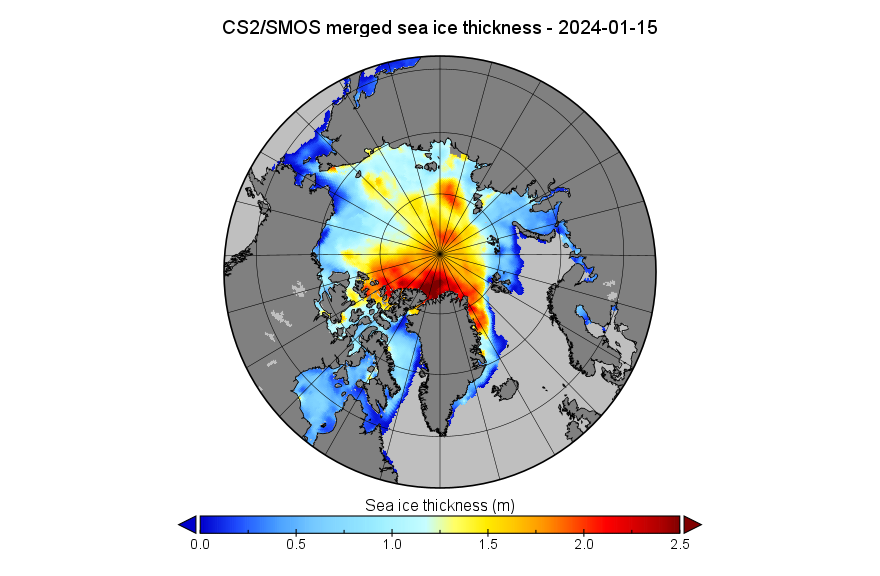
Something seems to have gone wrong with the processing of the mid-month PIOMAS gridded thickness data. For the moment we’ll have to make do with just the CryoSat-2/SMOS thickness map:
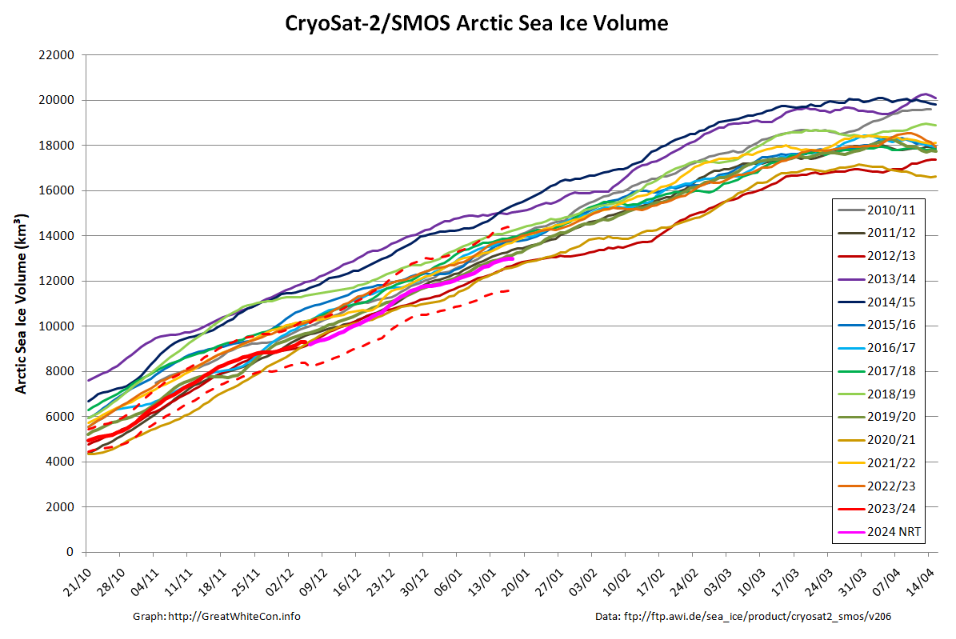
and volume graph:
With the perennial caveat of a probable upward revision when the reanalysed data is released, Arctic sea ice volume is still close to the bottom of the range during the CryoSat-2 era.
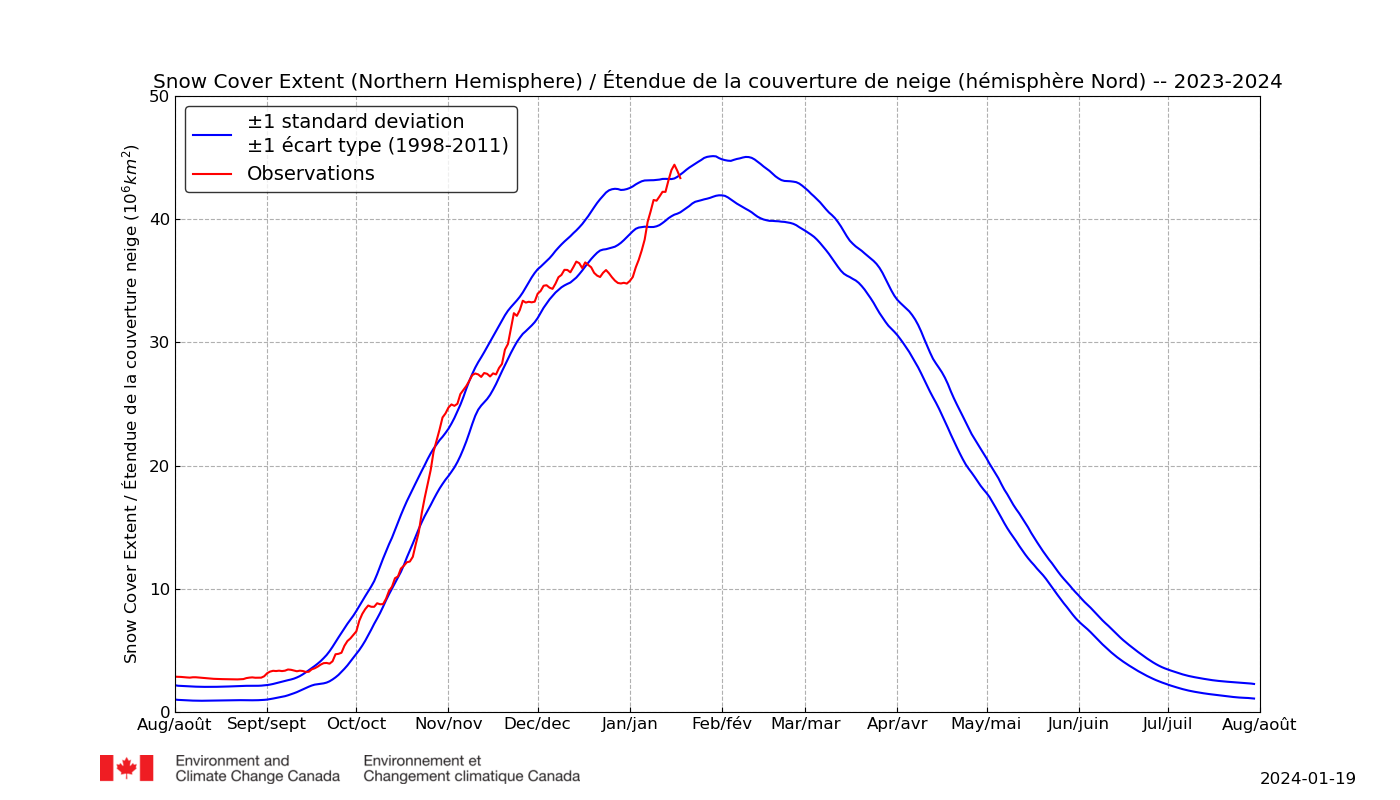
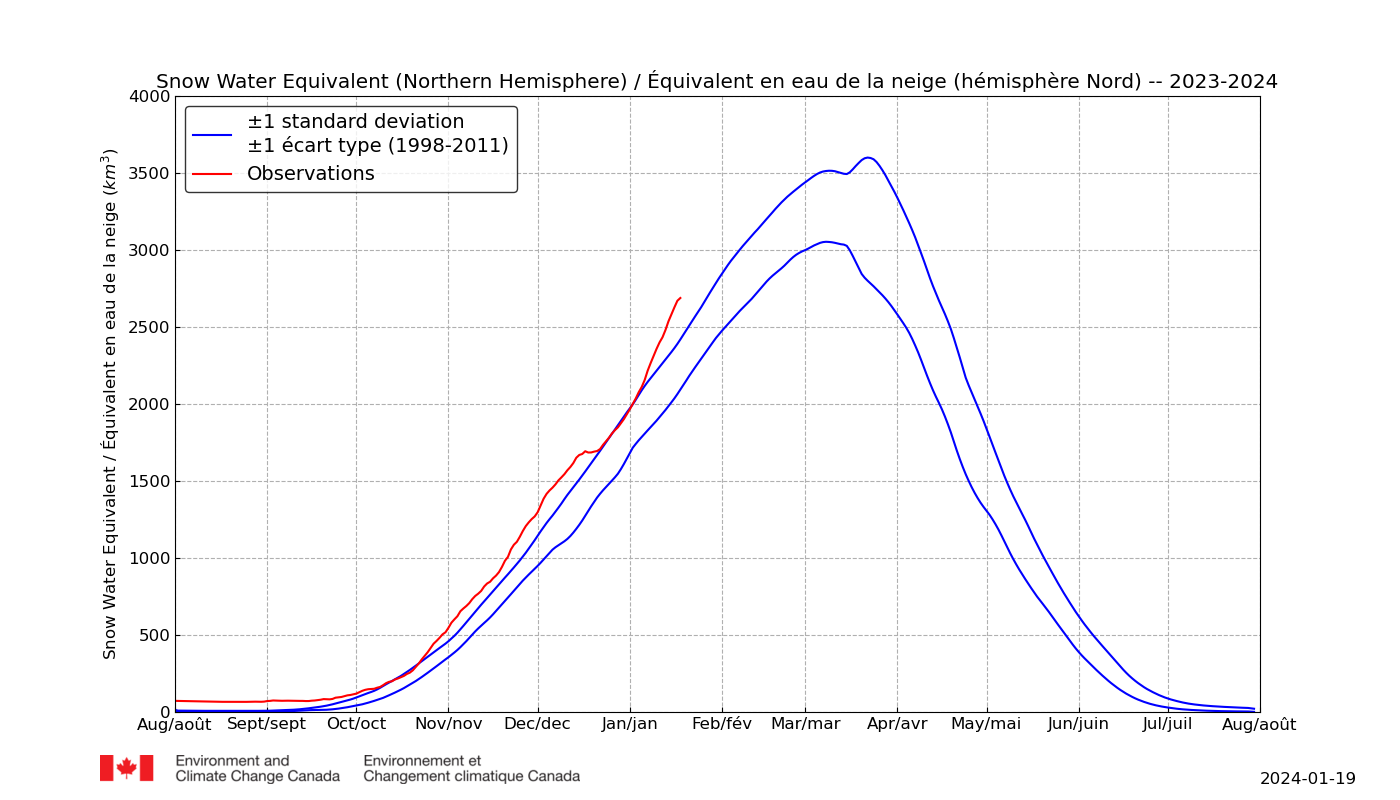
In addition especially for Matt, “Steve”/Tony and numerous others of a “skeptical” persuasion, here are the latest Environment & Climate Change Canada snow extent and snow water equivalent graphs for the northern hemisphere:
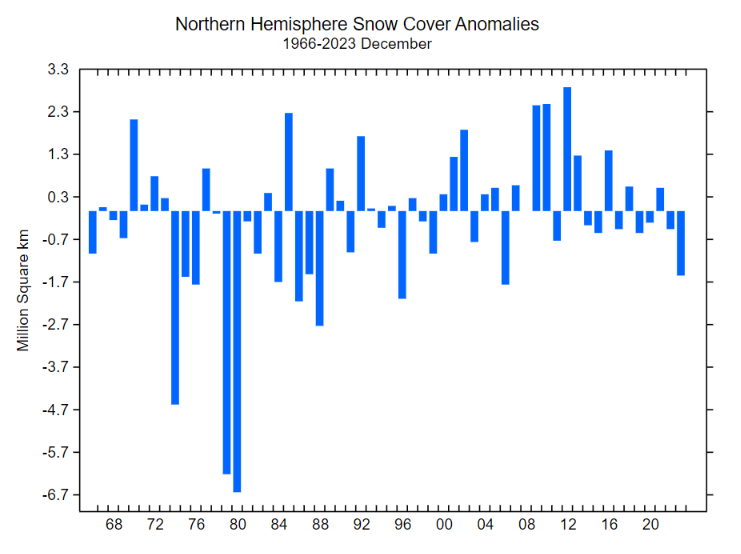
Last but certainly not least is the Rutgers Global Snow Lab northern hemisphere snow cover anomaly chart for December:
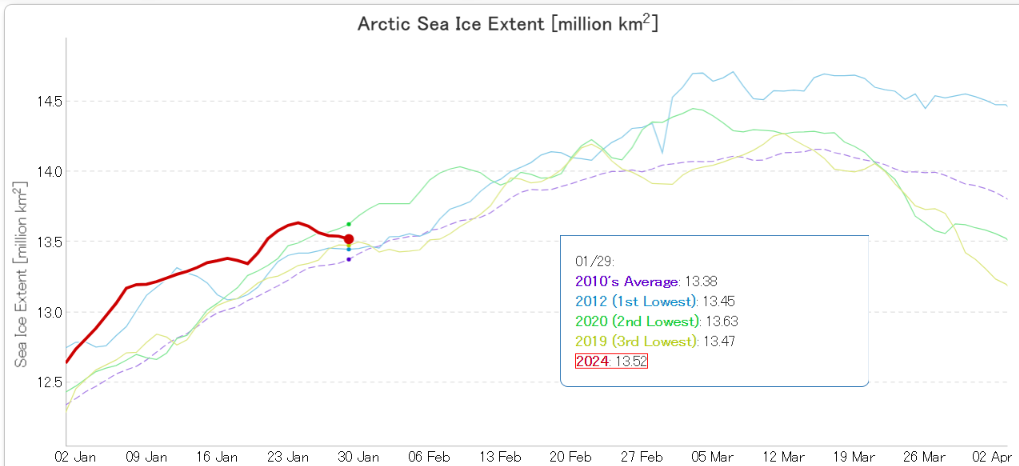
[Update – January 29th]
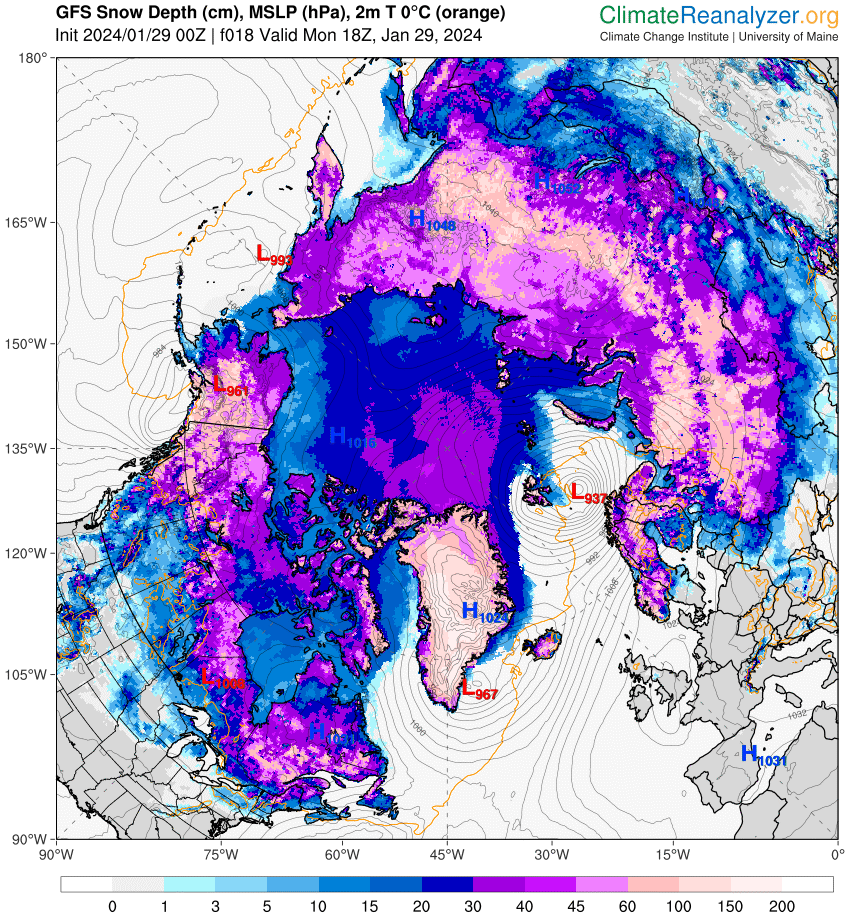
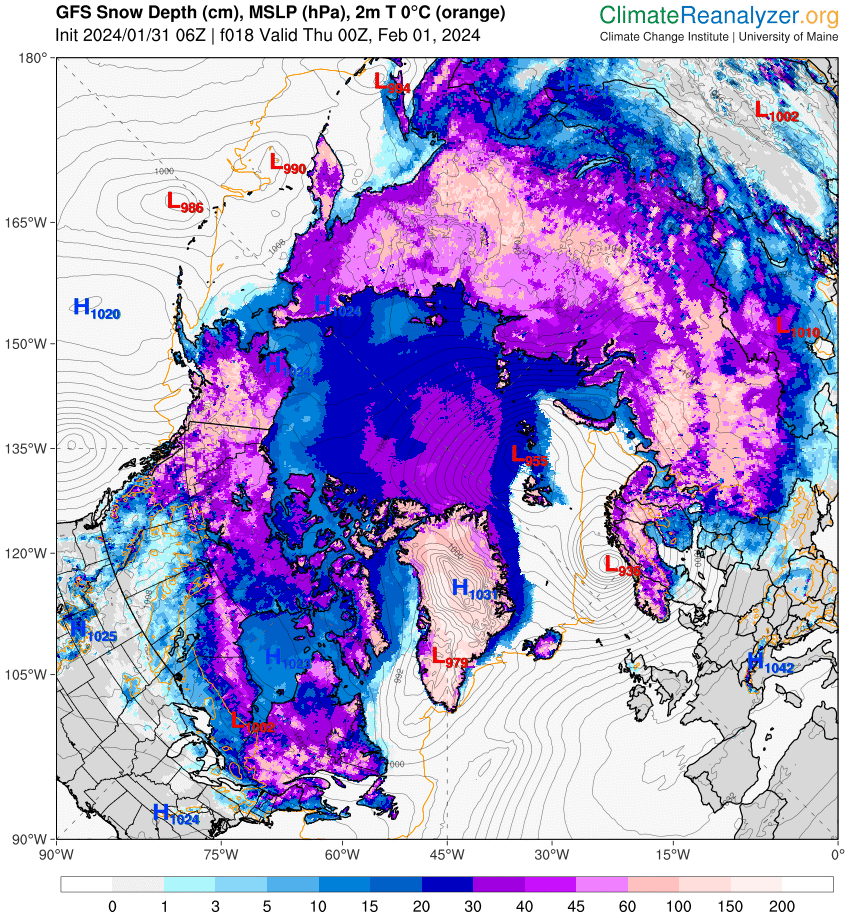
A winter cyclone is stirring up the far North Atlantic. It’s currently forecast to bottom out later today with a minimum MSLP of 937 hPa:
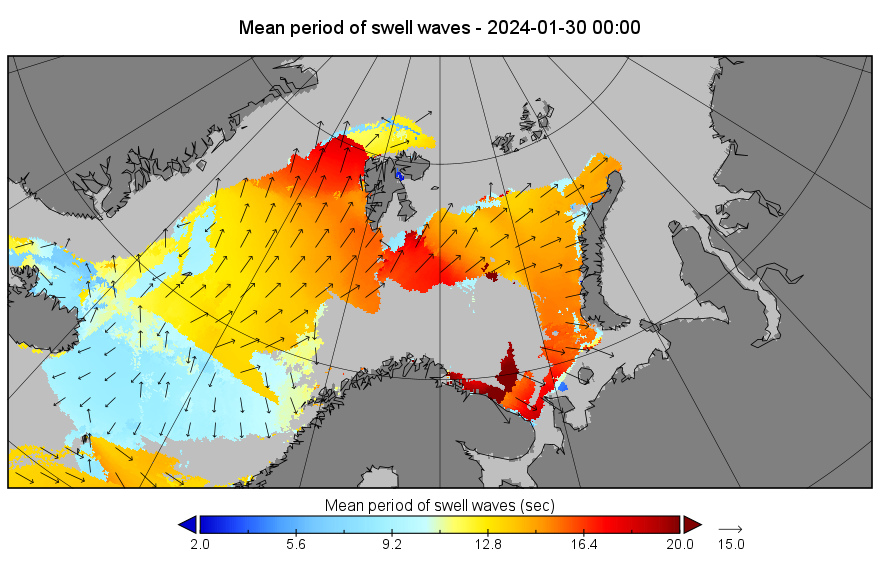
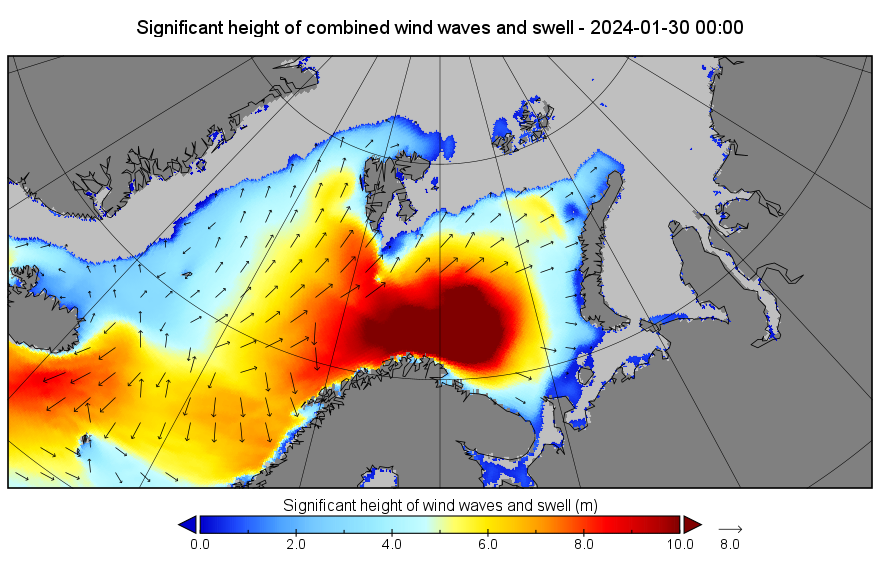
The storm has been creating a long period swell directed at the ice edge in the Barents Sea. By midnight that swell will be battering the ice in the Fram Strait too:
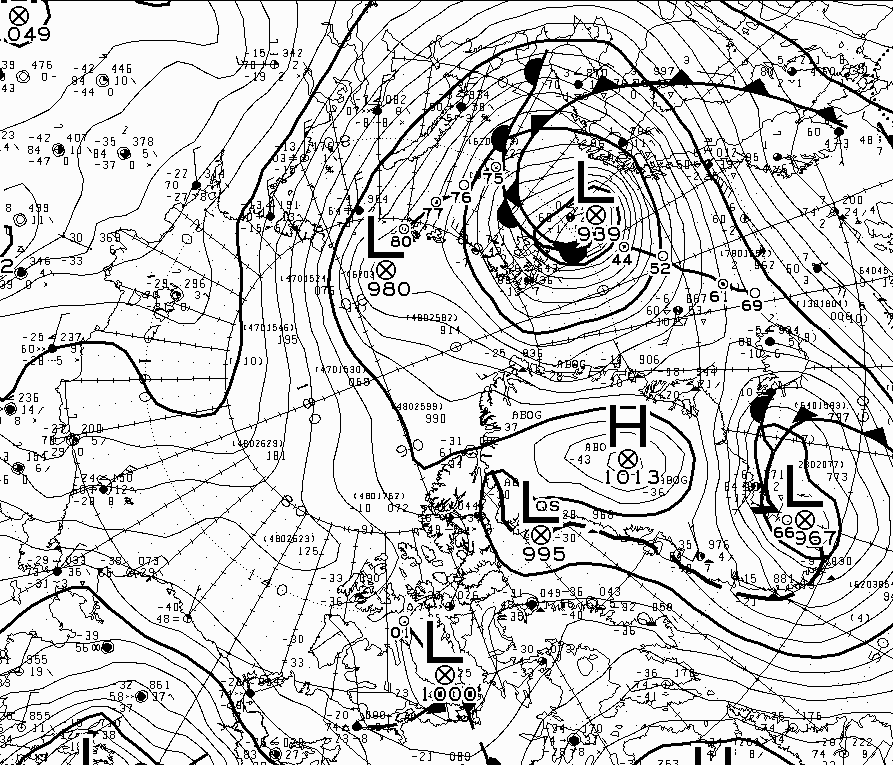
[Update – January 30th]
According to Environment Canada the cyclone bottomed out with an MSLP of 939 hPa at 12 PM UTC yesterday:
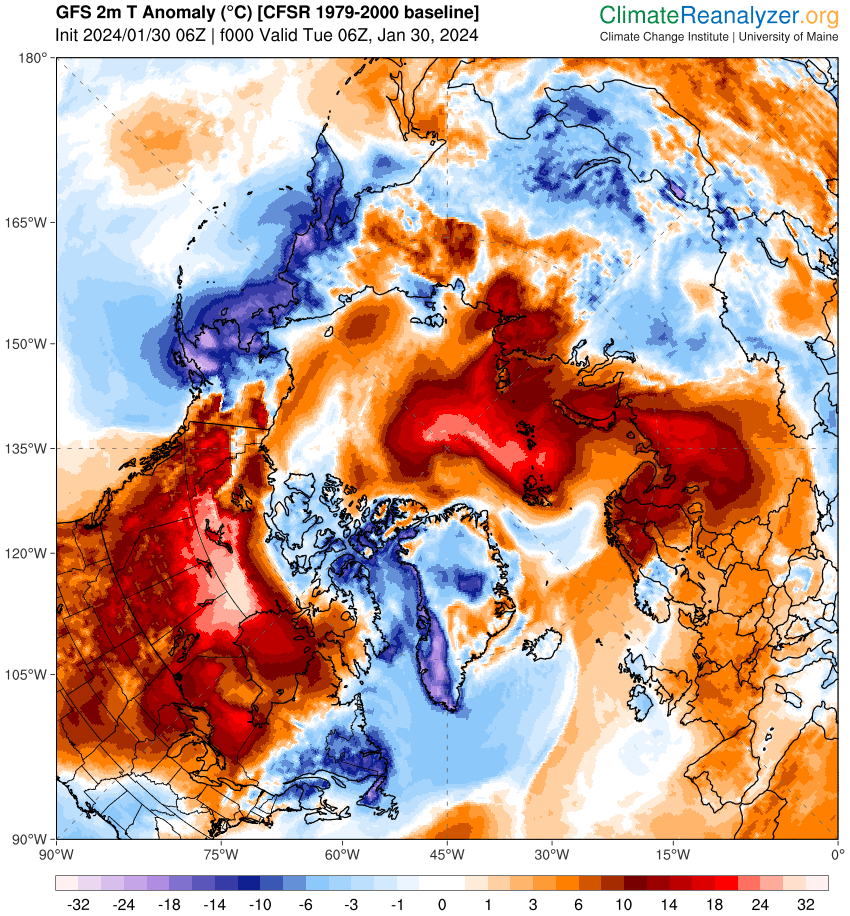
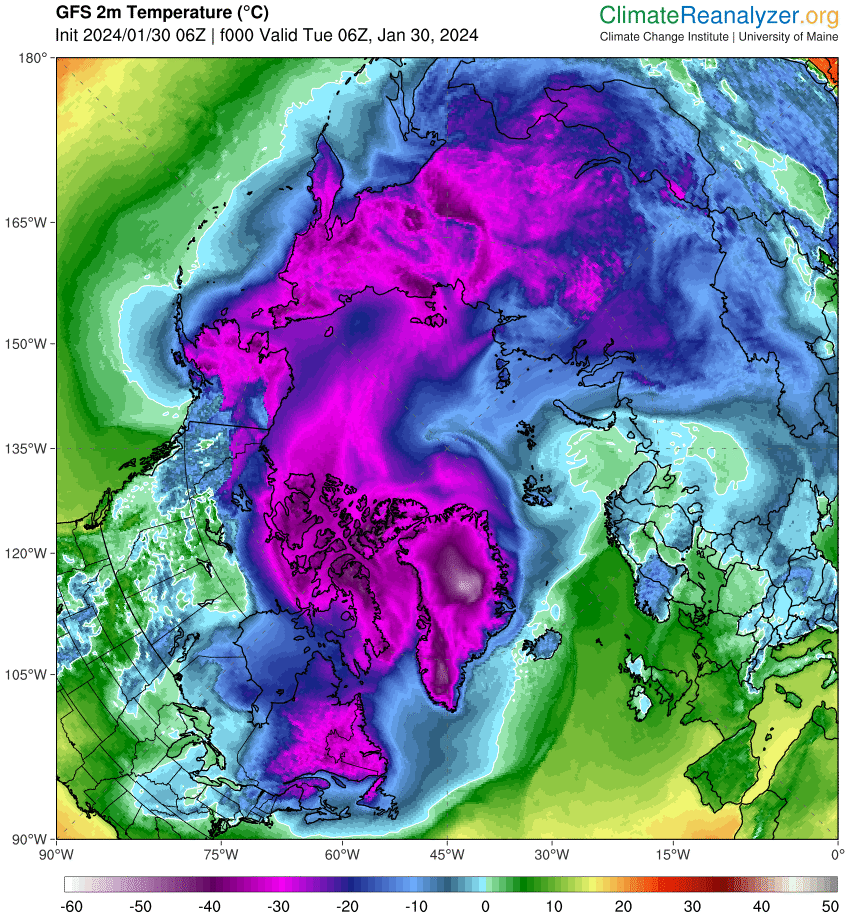
Associated with the storm is a pulse of abnormally warm air reaching to the North Pole and beyond:
Here’s how JAXA extent looks as the big swell arrives:
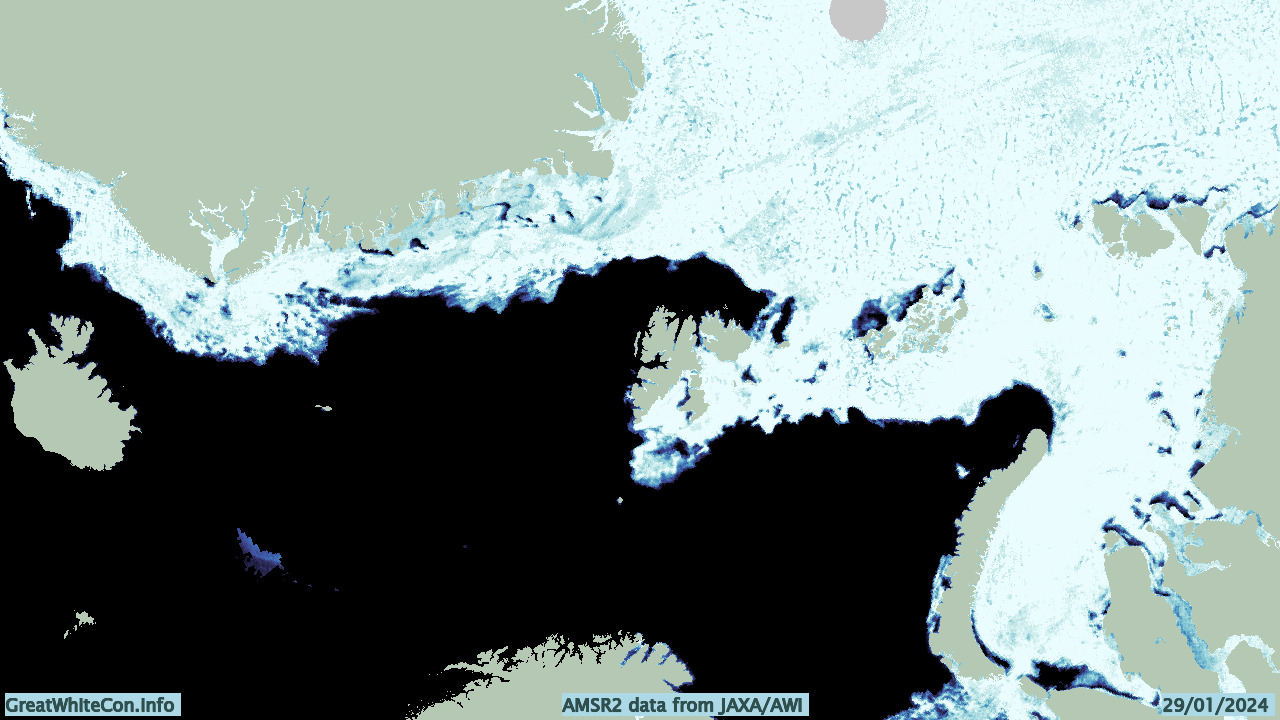
And here’s the lead enhanced AWI AMSR2 concentration map of the Atlantic periphery:
Let’s see how things change over the next few days.
[Update – January 31st]
Here’s a preliminary look at the effect of the recent Arctic cyclone and other “weather” on the sea ice in the Fram Strait and Barents & Kara Seas:
There is also another cyclone heading for the Barents Sea. This one is forecast to bottom out at 936 hPa at around midnight tonight near the Norwegian coast:
P.S. The cyclone mentioned just above has been named Storm Ingunn by the Norwegian Meteorological Institute:
👀 This swirl of cloud is #StormIngunn – an intense area of low pressure that's still rapidly deepening
😮 Wind gusts of over 120 mph have been reported in the Faroe Islands with the storm now moving towards Norway pic.twitter.com/TNuo52L7MW
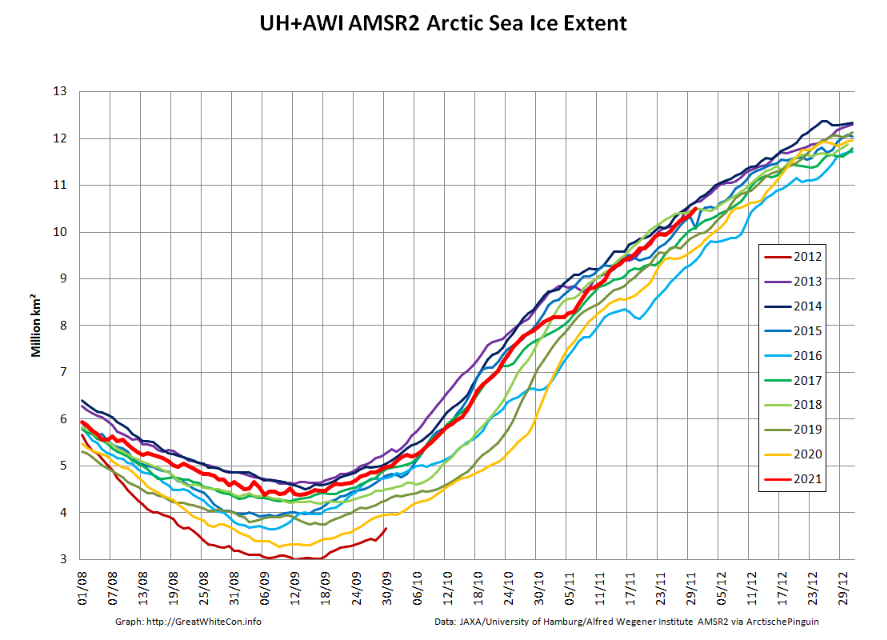
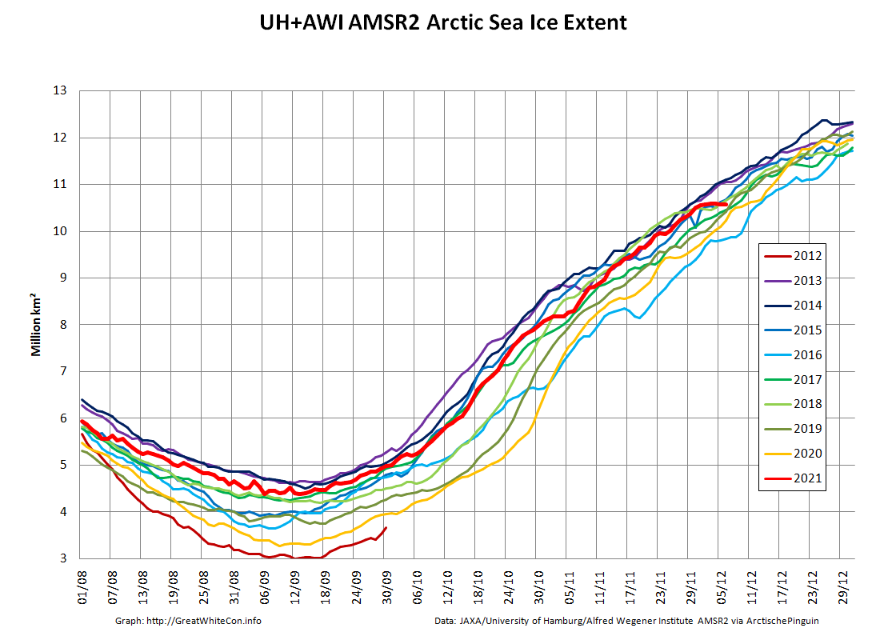
A new month has arrived, and during January several Arctic sea ice metrics have been drifting towards the bottom of their respective decadal ranges. To begin with here is AWI’s high resolution AMSR2 extent graph, which is currently very close to being lowest for the date in the AMSR2 record:
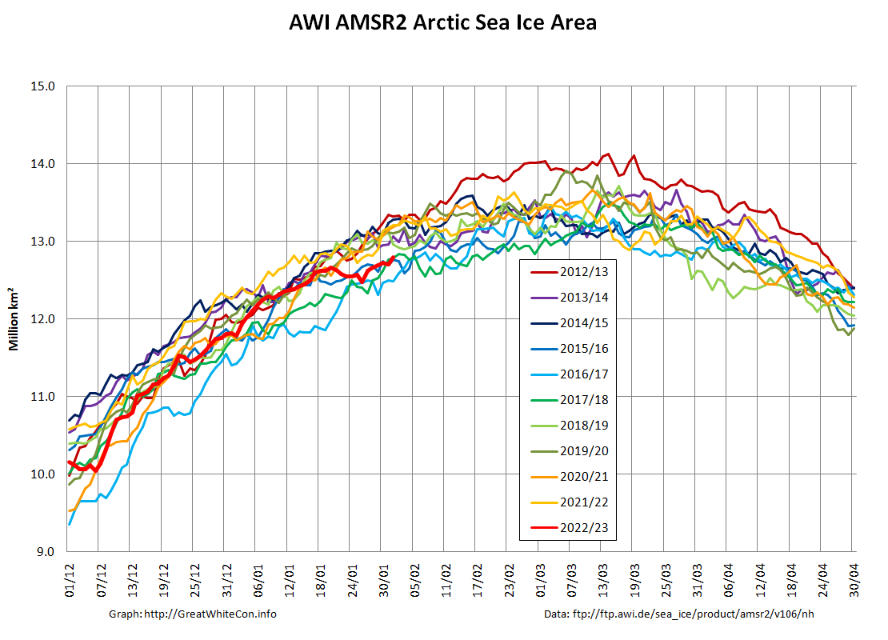
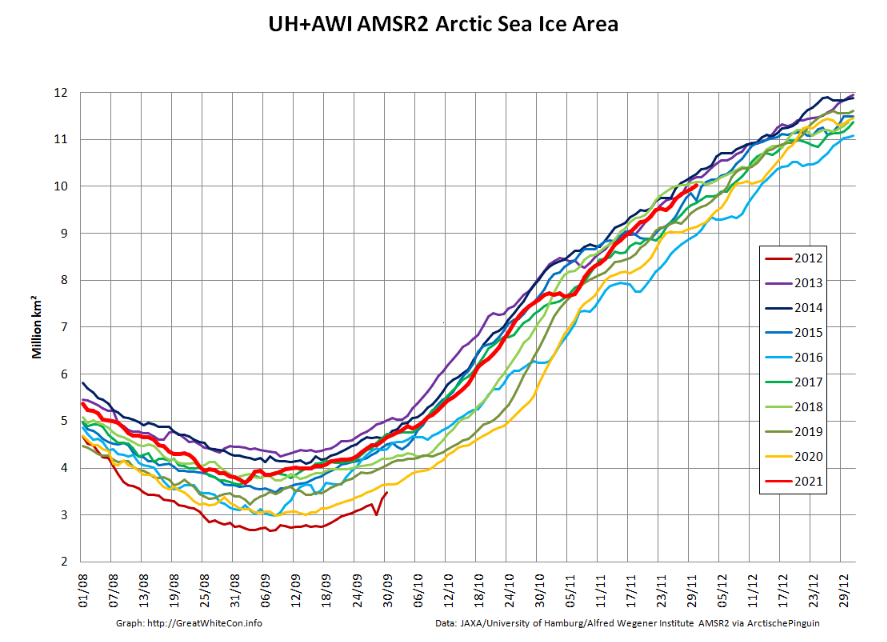
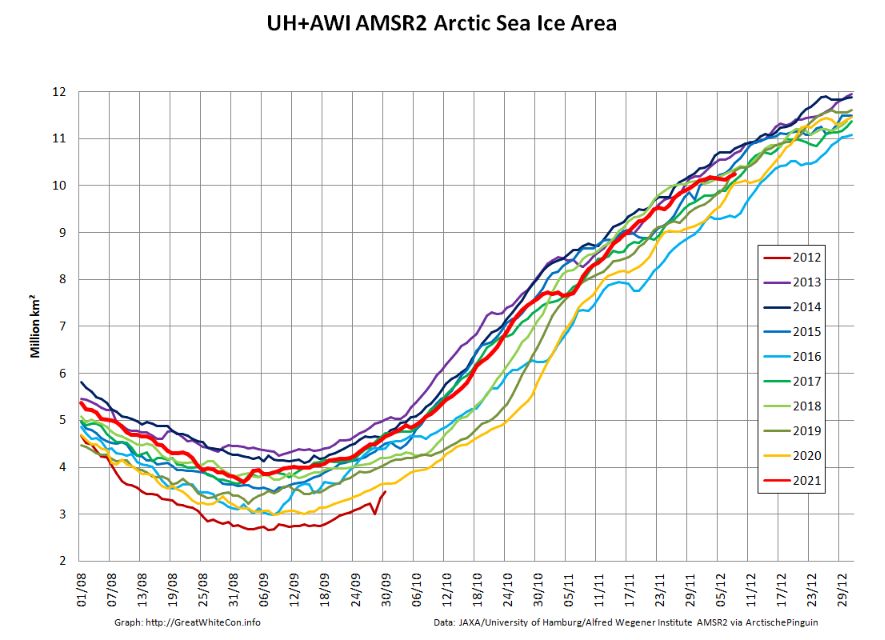
However that is less the case for area:
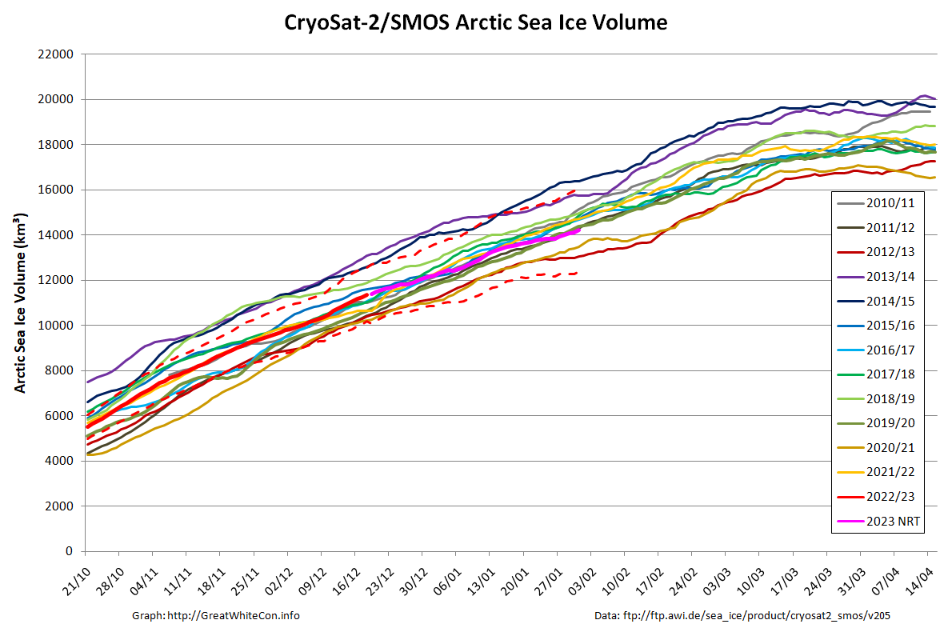
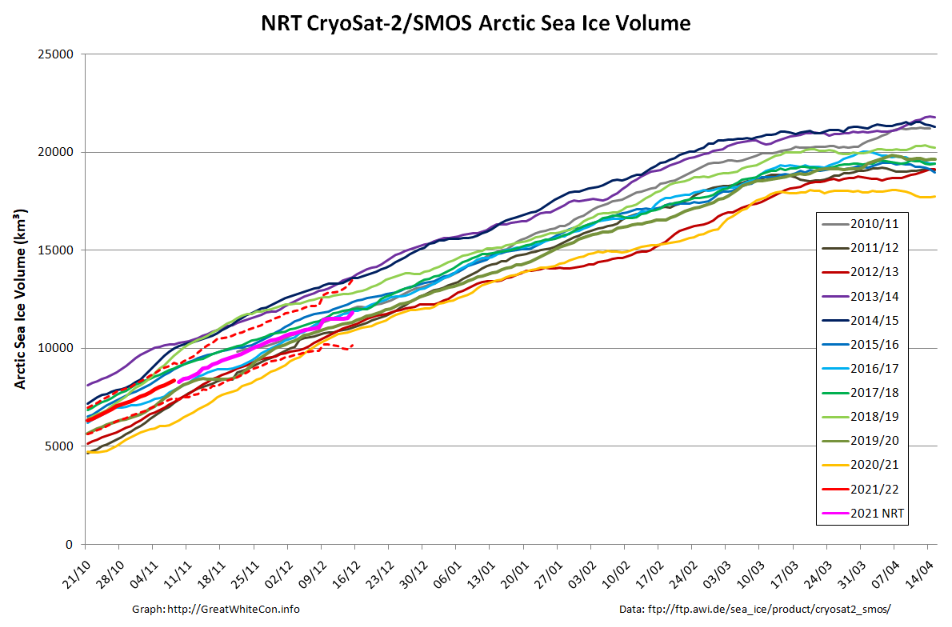
Taylor is keen to see the PIOMAS volume data for January, but whilst we wait for the latest Polar Science Center update here is the CryoSat-2/SMOS volume graph, which now includes a couple of month’s worth of reanalysed results as well as more recent near real time numbers:
Here too is the start of month CS2/SMOS thickness map:
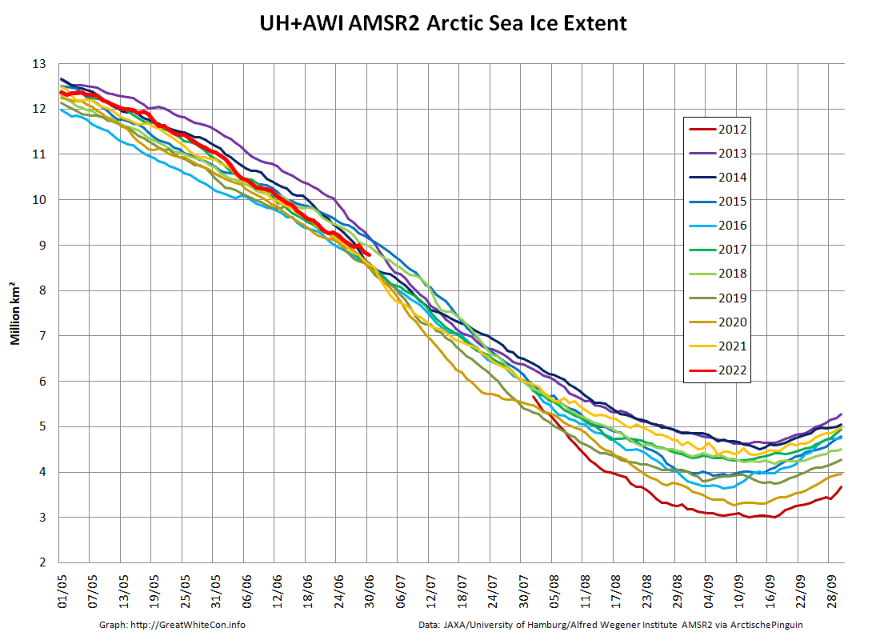
After a relatively rapid decline at the beginning of June Arctic sea extent is now very close to the 2010s average:
Both 2020 and 2021 began relatively rapid declines of their own at the beginning of July, so it will be interesting to see if 2022 follows suit.
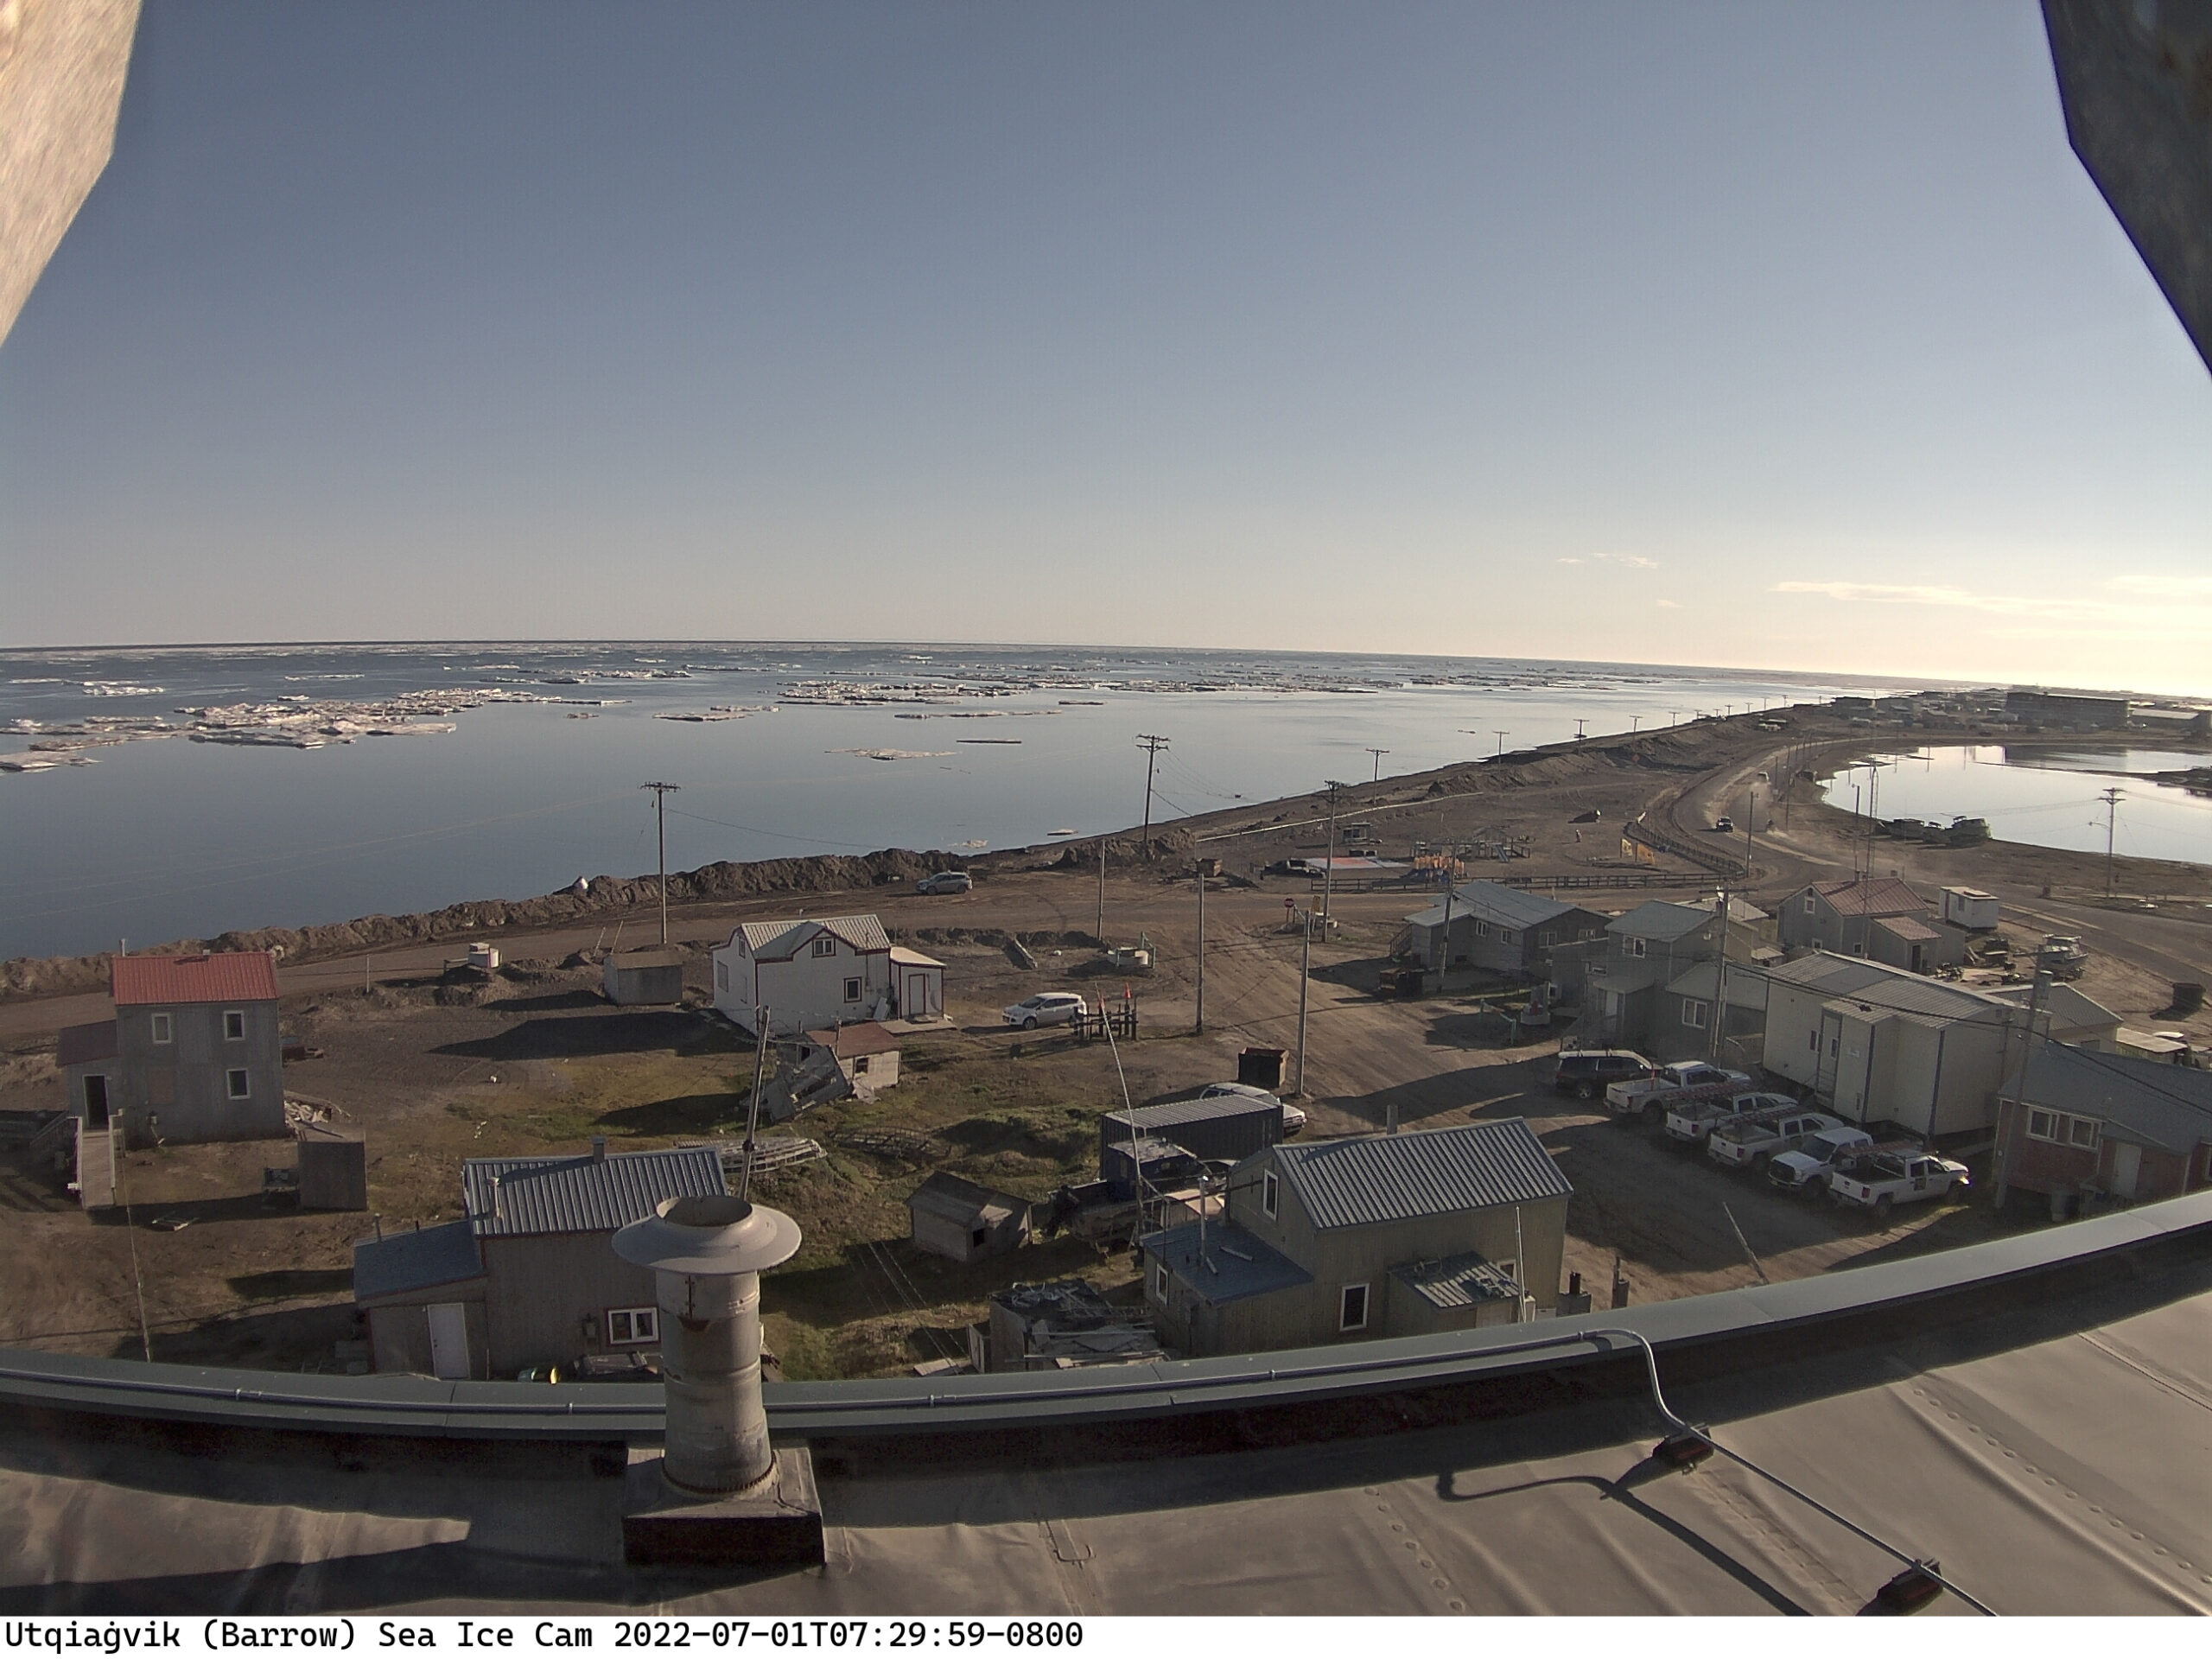
Most of the fast ice off Utqiaġvik has recently disappeared:
Meanwhile further out into the Chukchi Sea the sea ice looks to be in poor shape at the moment, with surface melting apparent across the entire region:
Christmas is coming. Santa’s secret summer swimming pool has frozen over. The time has come for a new monthly Arctic update.
The JAXA/ADS/ViSHOP web site is undergoing maintenance for a week, so let’s start the festive season with a look at high resolution AMSR2 area and extent:
After a brief hiatus in early November both metrics are once again tracking within, but near the upper bound of the last 10 years.
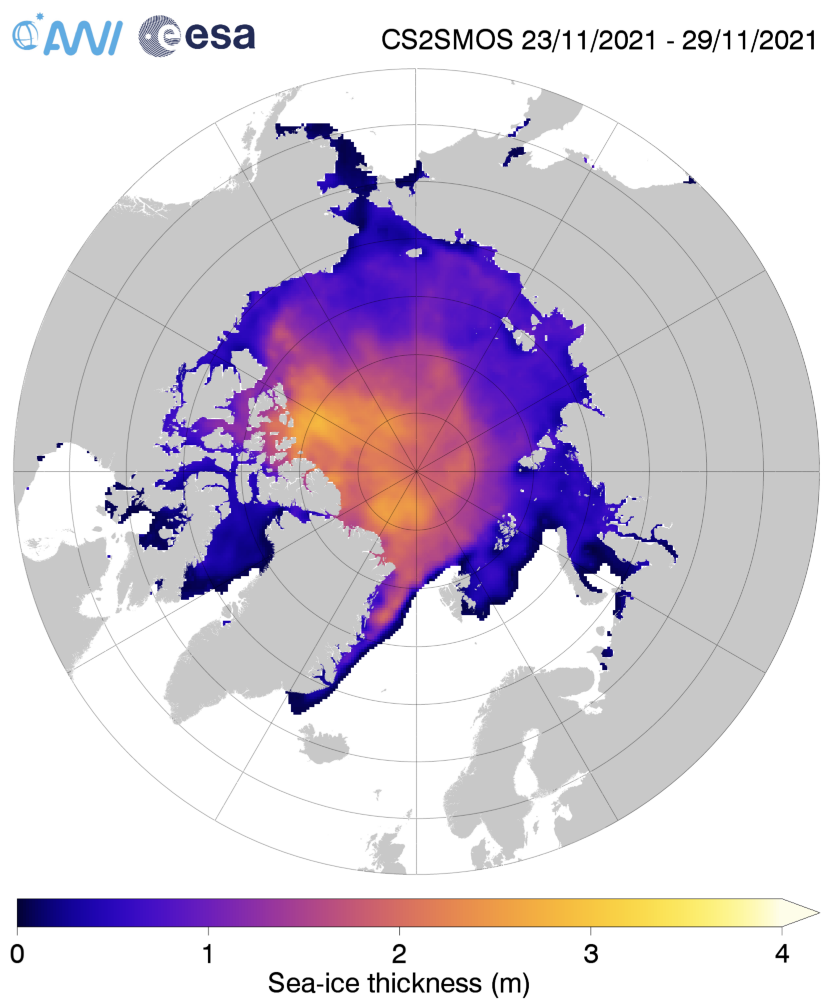
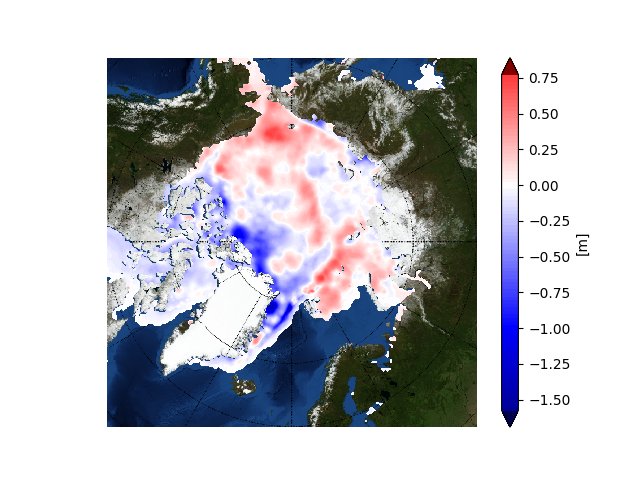
Next let’s take a look at the latest AWI CryoSat-2/SMOS thickness map:
together with the anomaly map from the Finnish Meteorological Institute:
Still thinner than usual in the so called “last ice area” north of Greenland and Ellesmere Island, and thicker than usual on the Siberian side of the Arctic, particularly in the Chukchi Sea.
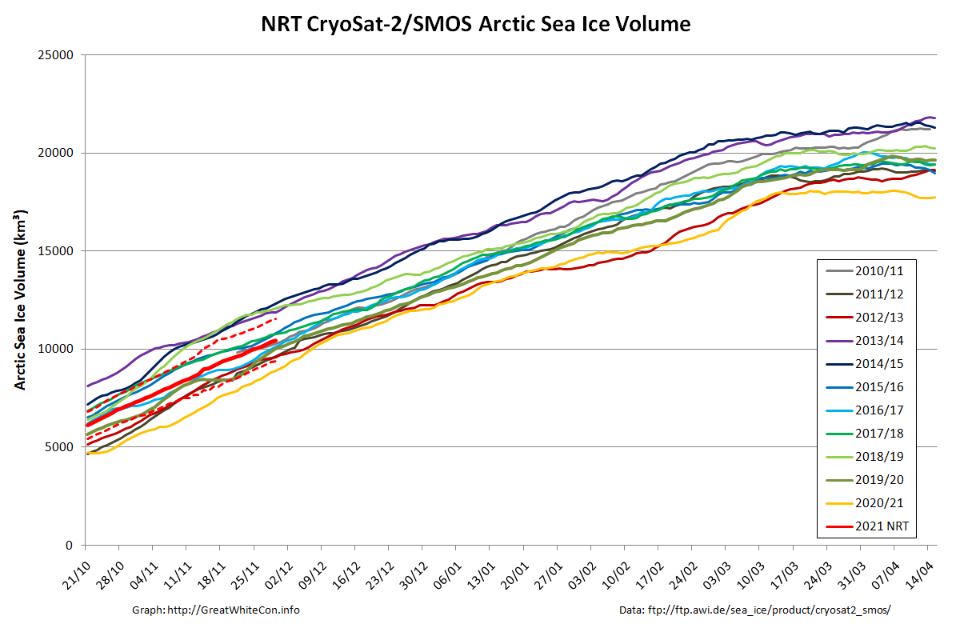
Finally, for the moment at least, here’s the latest CryoSat-2/SMOS volume graph:
Unlike the previous metrics, this particular one is close to the middle of the pack.
Sea ice extent increased at a faster than average pace through November and by the end of the month, extent was just within the interdecile range. Extent was above average in the Bering Sea, but Hudson Bay remained unusually ice free through the month.
The November 2021 monthly average extent was 9.77 million square kilometers (3.77 million square miles), which ranked tenth lowest in the satellite record. The 2021 extent was 930,000 million square kilometers (359,000 million square miles) below the 1981 to 2010 long-term average. Extent was higher than average in the Bering Sea, but is extremely low in Hudson Bay.
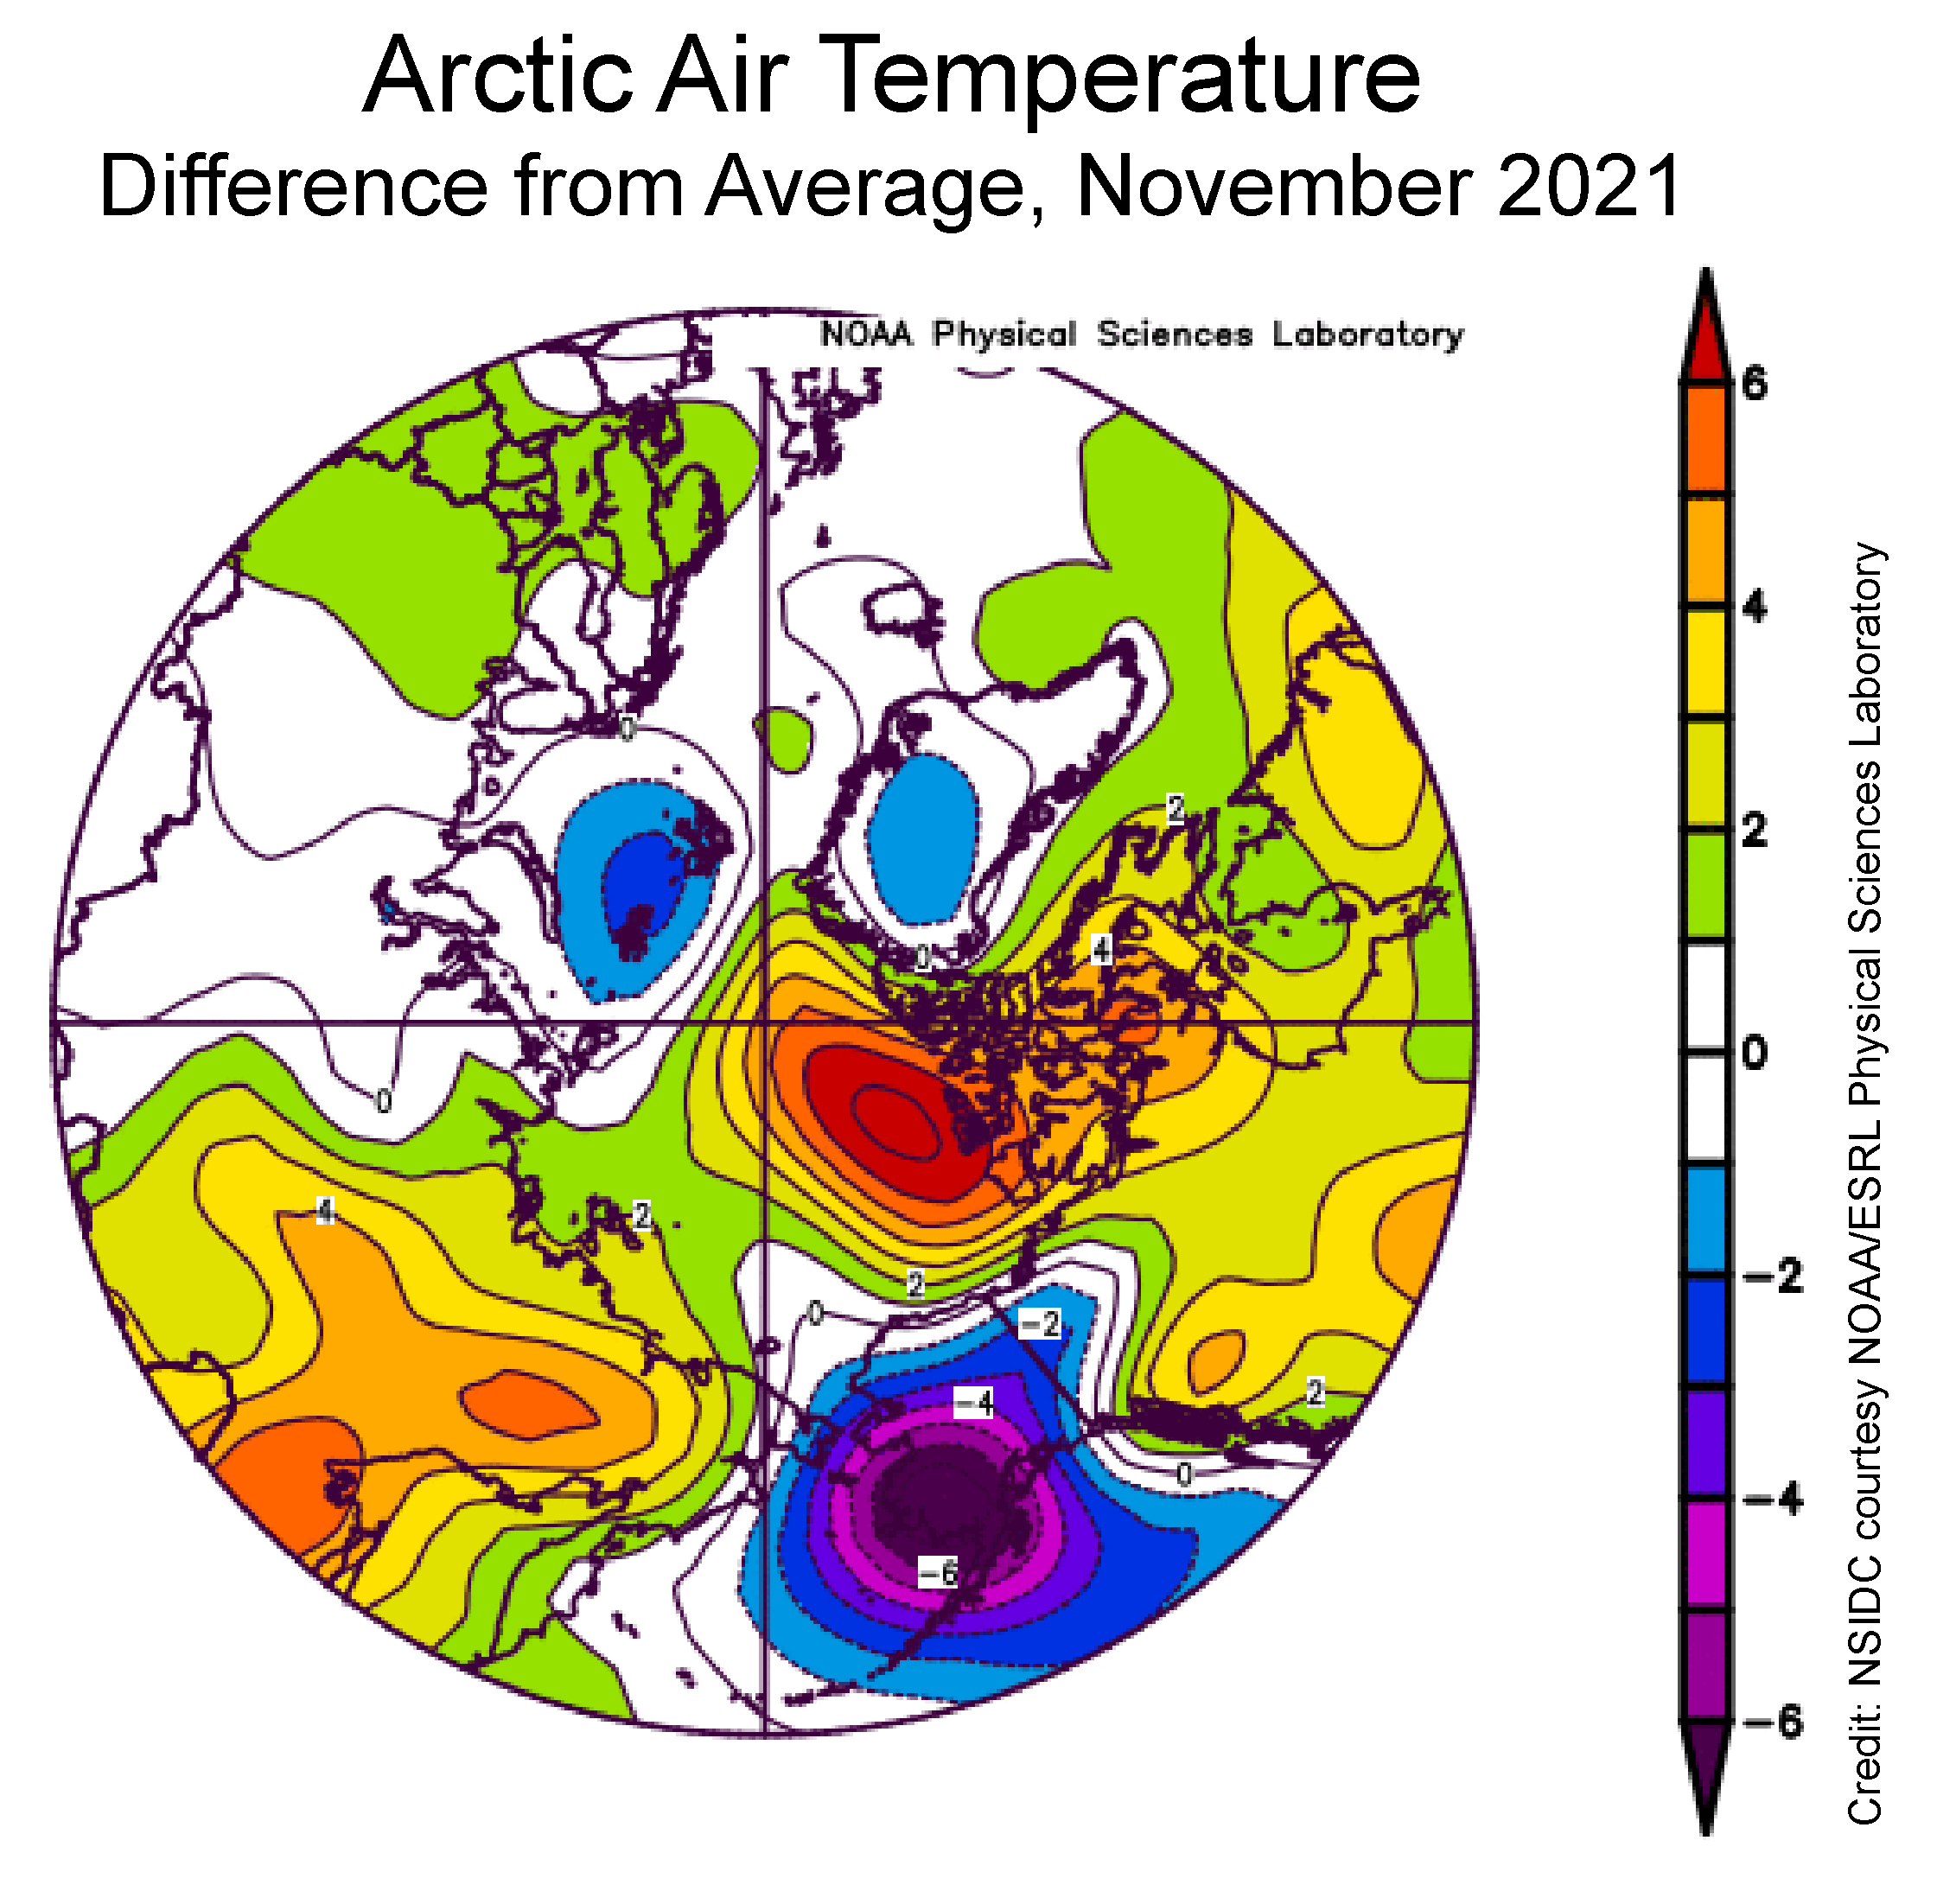
Air temperatures at the 925 millibar level (about 2,500 feet above the surface) were well above average north of the Canadian Archipelago, by as much as 6 degrees Celsius. Conversely, temperatures over southwest Alaska and the eastern sector of the Bering Sea were as much as 6 degrees Celsius below average:
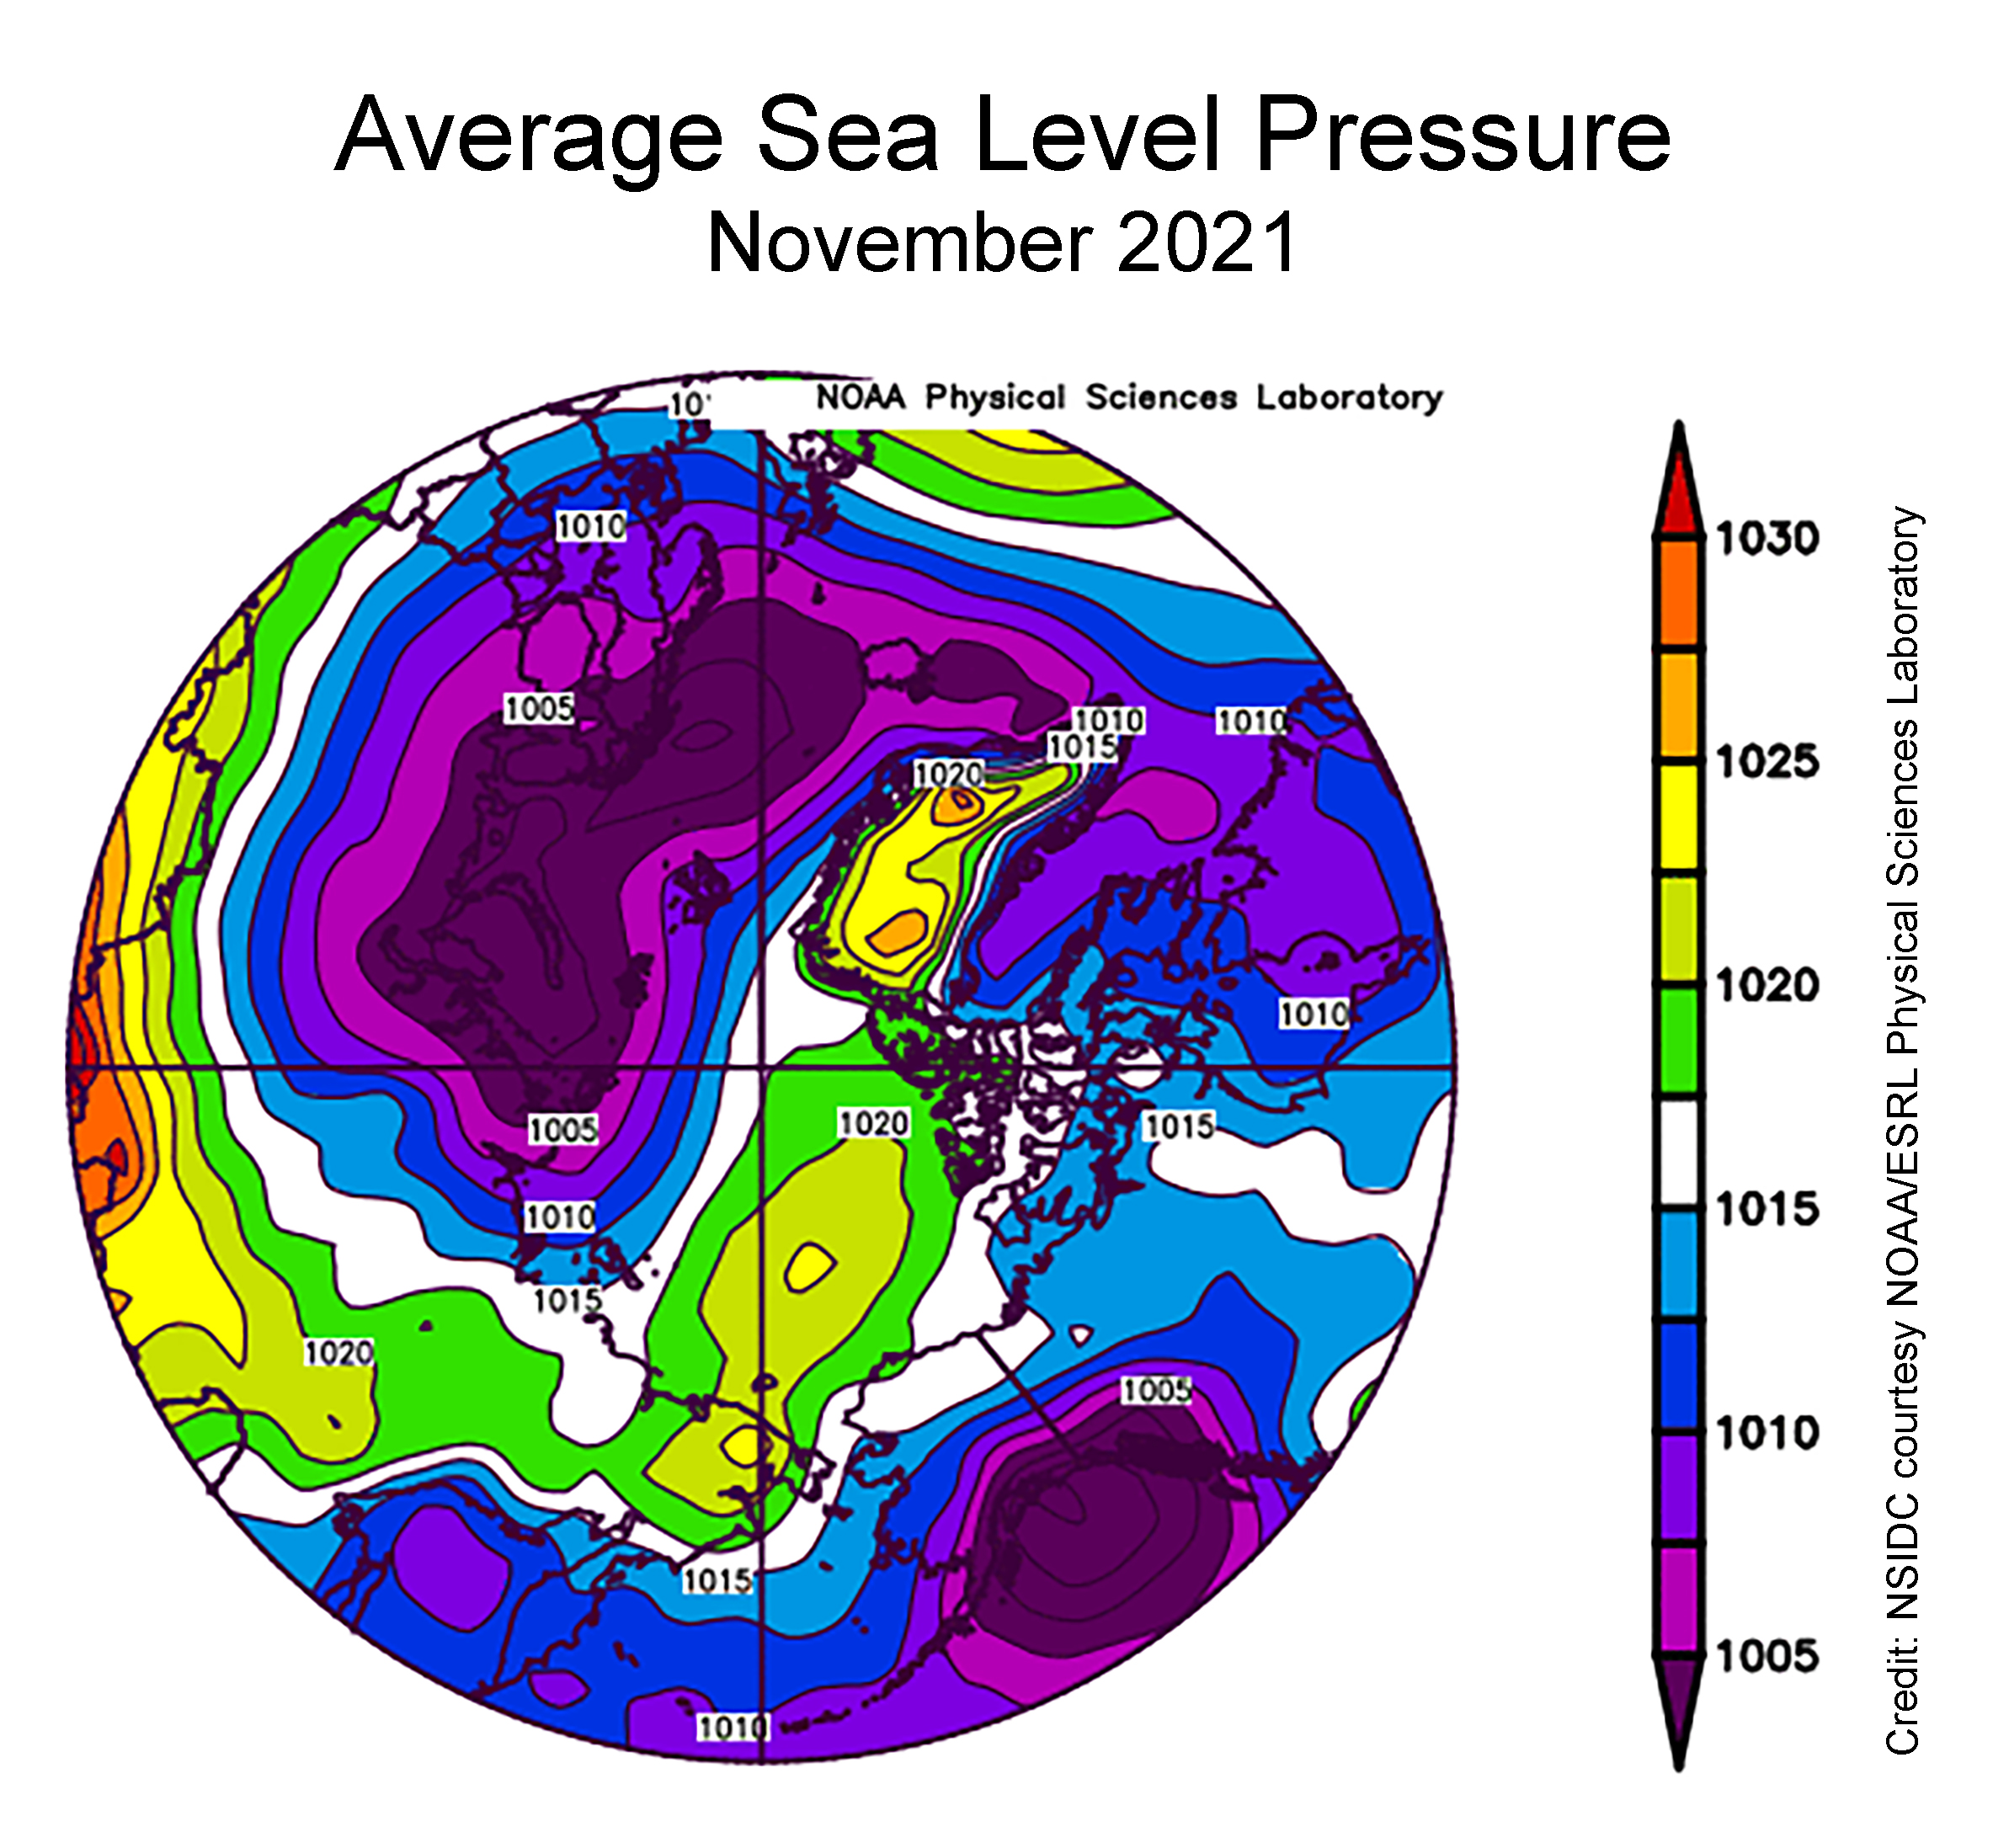
The sea level pressure pattern for November featured widespread low pressure over the Atlantic side of the Arctic and extending into the Barents and Kara Seas, paired with a moderately strong Beaufort Sea High. Strong low pressure over the Gulf of Alaska resulted in a circulation pattern in the eastern Bering Sea that brought cold air from the north. This pattern was favorable for sea ice growth, and can explain the above average ice extent in the region:
[Edit – December 7th]
Since the start of December high resolution AMSR2 extent has been flatlining:
Sea ice area has even declined slightly over the past few days:
Here too is an animation created by Uniquorn on the Arctic Sea Ice Forum using AWI ASMR2 data to reveal ice movement through the Nares Strait during December:
[Edit – December 9th]
The JAXA/ADS/ViSHOP web site is down again, so let’s take another look at high resolution AMSR2 area and extent:
It seems that the “brief hiatus” is over, and extent is now in a “statistical tie” with 2018/19 at 4th lowest for the date amongst recent year.
[Edit – December 13th]
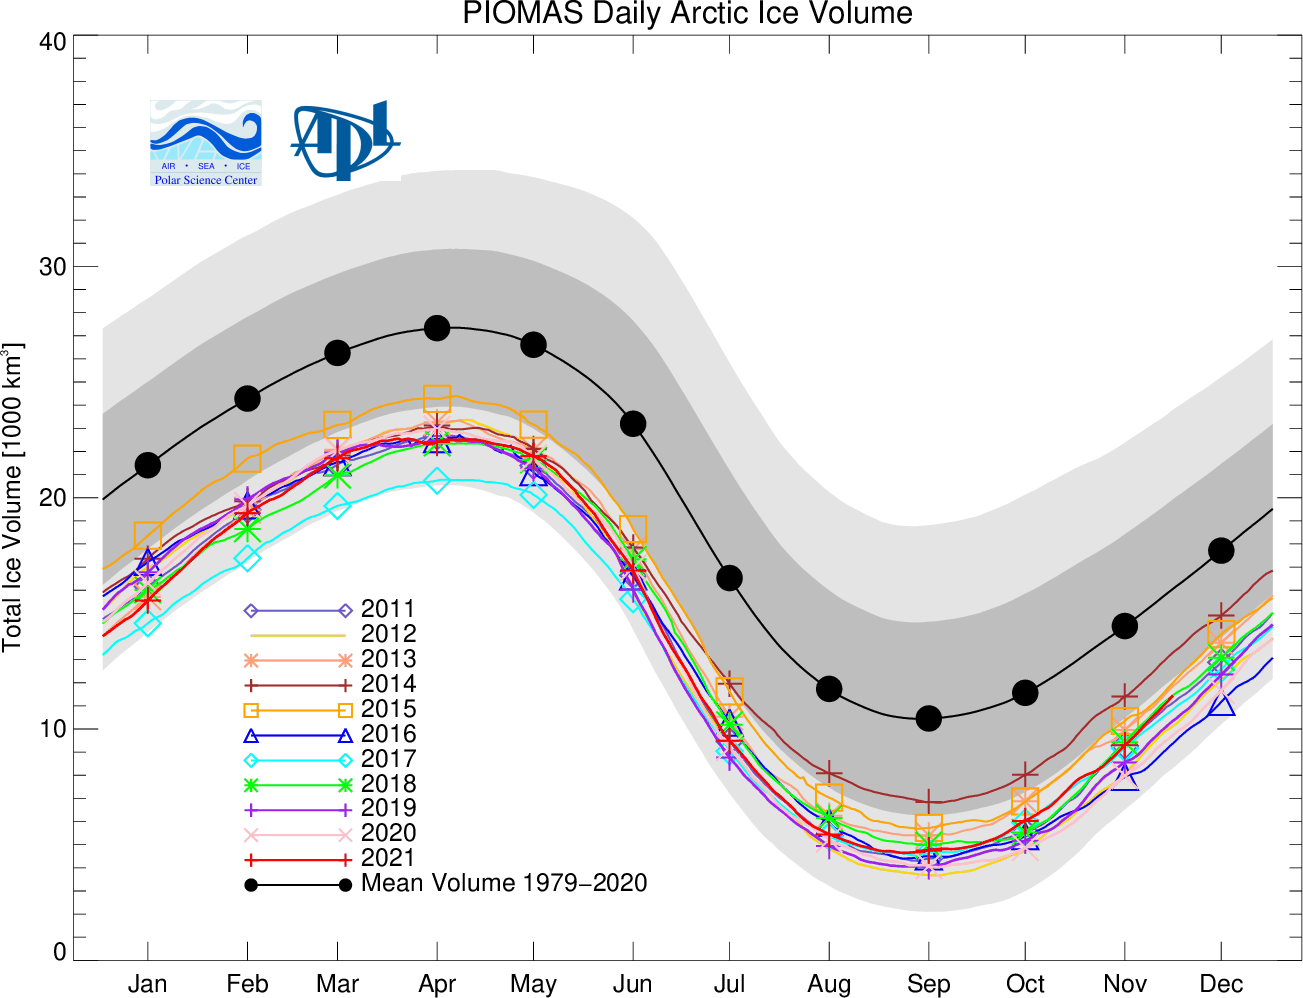
The PIOMAS Arctic sea ice volume data for November 2021 has been released:
Average Arctic sea ice volume in November 2021 was 7,830 km3. This value is the 7th lowest on record for November, about 1600 km3 above the record set in 2016. Monthly ice volume was 61% below the maximum in 1979 and 45% below the mean value for 1979-2020. Average November 2021 ice volume was about one sigma above the 1979-2020 trend line. October saw relative rapid ice growth for recent years bringing the mean ice thickness (above 15 cm thickness) above the recent low values:
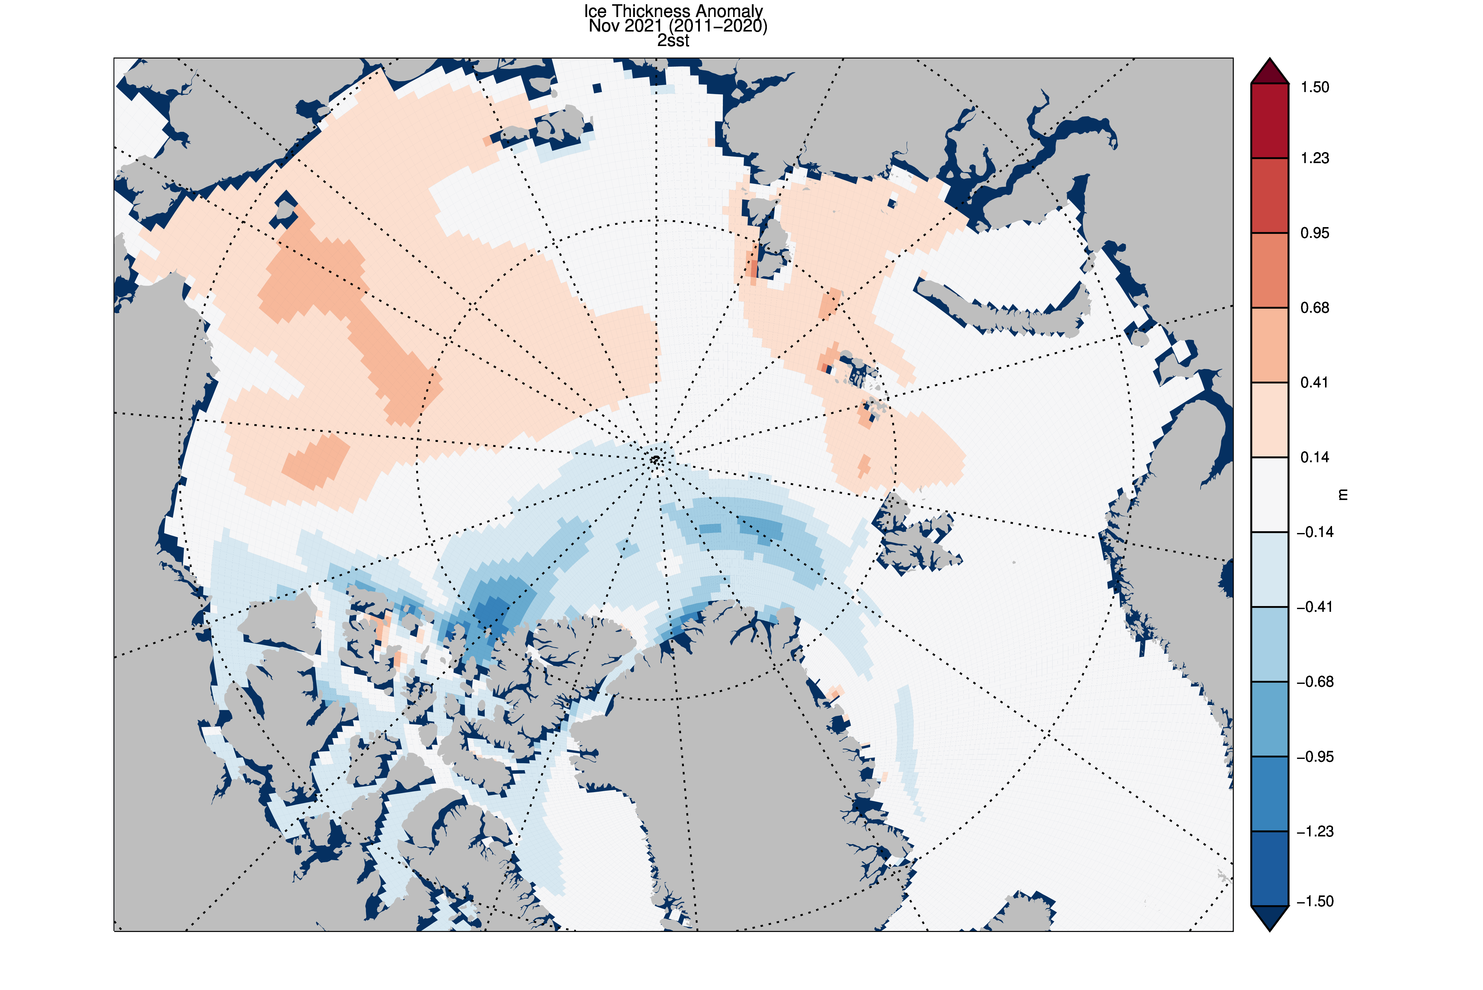
The ice thickness anomaly map for November 2021 relative to 2011-2020 continues to show anomalies divided into positive and a negative halves with areas of positive anomalies increasing since the two prior months. Negative anomalies stretching from North of Greenland and along the Canadian Archipelago across the Eastern Arctic into the Barents Sea. Areas North of Greenland again feature very low ice thickness as in prior years (see our recent paper). Positive anomalies are notable in the Beaufort and Chukchi seas due to advection of thicker older ice into the areas during the previous winter (See recent paper on this). The Alaskan summer has also been relatively cold contributing to unusually thick ice in this area:
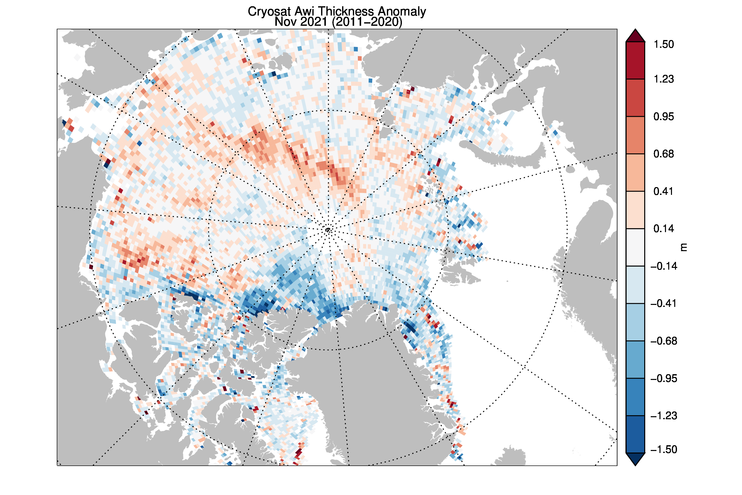
CryoSat-2 ice thickness shows a similar picture sea ice thickness anomalies but with the maxima slightly displaced which maybe due to temporal sampling of the composite:
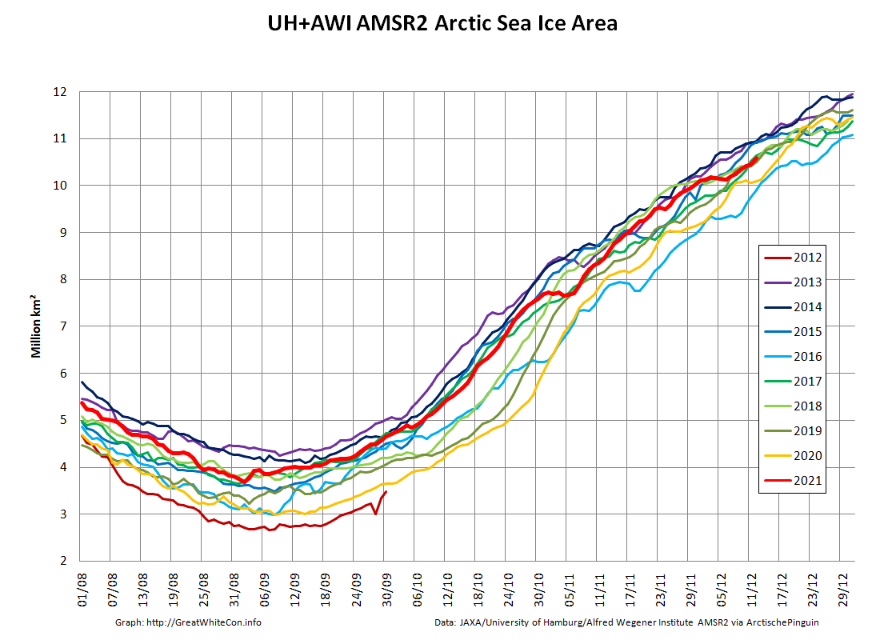
The JAXA web site is still down, so here’s another set of high resolution AMSR2 graphs:
[Edit – December 14th]
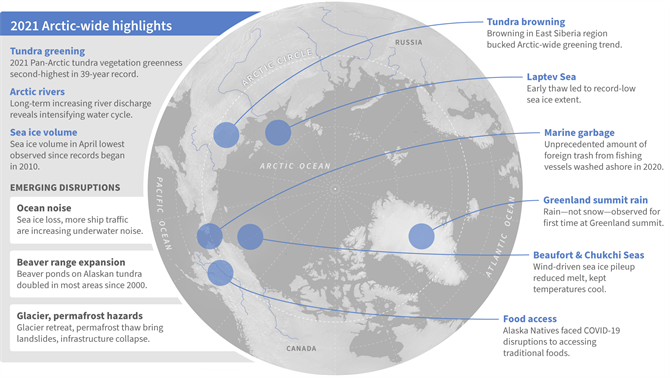
NOAA have just released their 2021 Arctic Report Card. Here’s the introductory video:
“Everybody knows [the Arctic] is a canary when it comes to climate change,” says Peter Jacobs, a climate scientist at NASA’s Goddard Space Flight Center, who presented the work on 13 December at a meeting of the American Geophysical Union. “Yet we’re misreporting it by a factor of two. Which is just bananas.”
Jacob’s co-authors include researchers who oversee several influential global temperature records, and they noted the faster Arctic warming as they prepared to release the global temperature average for 2020. NASA’s internal peer reviewer challenged the higher figure, suggesting the scientific literature didn’t support it. But the researchers have found the four times ratio holds in record sets from both NASA (3.9) and the United Kingdom’s Met Office (4.1), and they hope to soon include the Berkeley Earth record. (Their work also has company: In July, a team at the Finnish Meteorological Institute posted a preprint also arguing for the four times figure.)
The researchers found Arctic warming has been underestimated for a couple of reasons. One is climate scientists’ tendency to chop each hemisphere into thirds and label the area above 60°N as the “Arctic”—an area that would include, for example, most of Scandinavia. But the true definition of the Arctic is defined by Earth’s tilt. And, as has been known for centuries, the Arctic Circle is a line starting at 66.6°N. When researchers lump in the lower latitudes, “you’re diluting the amount of Arctic warming you’re getting,” Jacobs says. “That is not a trivial thing.”
The other difference is the choice of time periods over which the warming rate is calculated. Jacobs and his colleagues focused on the past 30 years, when a linear warming trend emerged for the Arctic. Analyses that look at longer term trends see less divergence between the Arctic and the world.
[Edit – December 23rd]
Here is the latest CryoSat-2/SMOS volume graph, now including some reanalysed data which seems to have come in slightly higher than the earlier “near real time” numbers:
Plus the AWI thickness map:
Further discussion of the divergence between volume and extent continues in the new New Year 2022 thread:
By way of a change we start this month’s look at all things Arctic with some sea ice statistical analysis. Anthony Watts’ Arctic porky pie production line has been speeding up recently, and I am not the only one who has noticed. As part of his takedown of the latest “skeptical” allegations against the United Kingdom Met Office Tamino has been looking at trends in Arctic sea ice extent over at his “Open Mind” blog:
First and foremost, the yearly minimum is only one day out of the year. We have sea ice extent data throughout the year, and what happens during the rest of the year counts. Instead of using the annual minimum, let’s use the annual average. To avoid losing the most recent data, I’ll compute the yearly average for October through the following September rather than the usual (but arbitrary) January through December. I’ll also omit October 1978 through September 1979 because that year is incomplete. I get this:
The annual averages show much less fluctuation than the annual minima, so we can estimate things like rates of change with greater precision. I find that there is statistical evidence that the rate changed over time. One model of such changes uses three straight-line segments with their changes chosen to best-fit the data, like this:
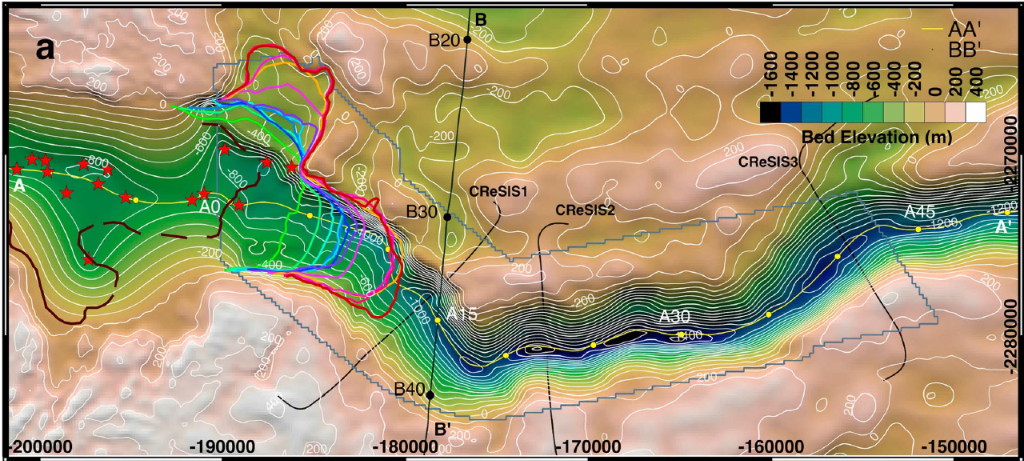
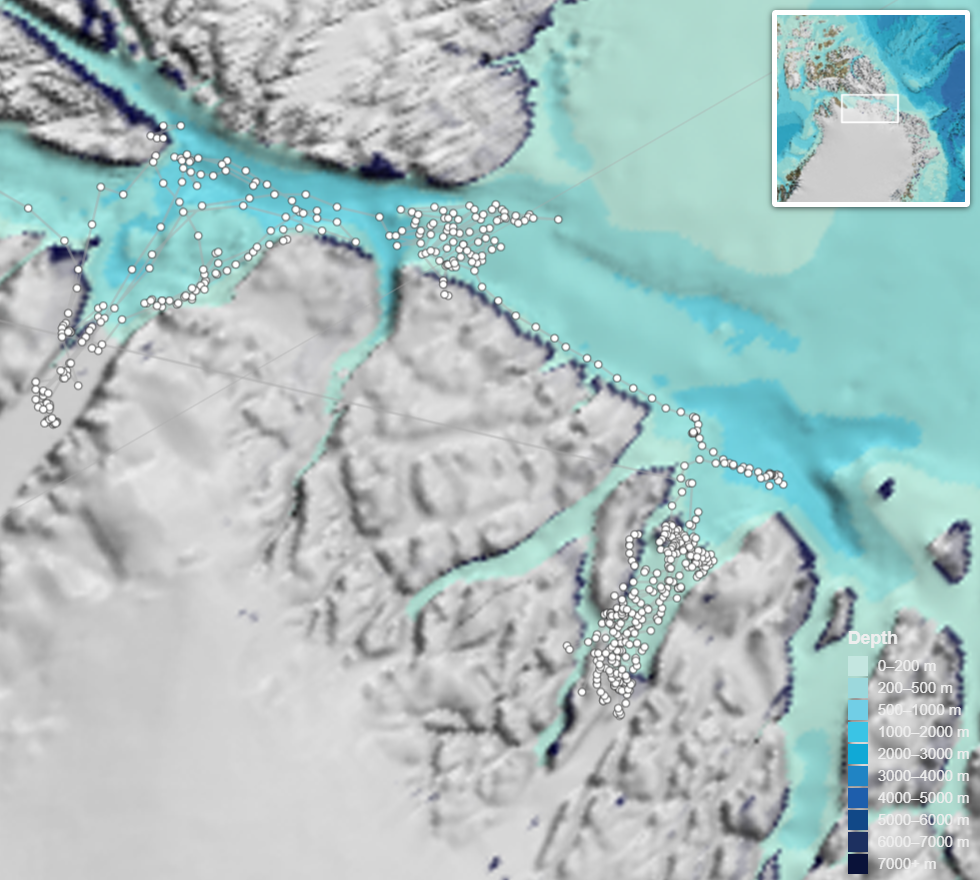
Jakobshavn Isbræ, West Greenland, which holds a 0.6 m sea level volume equivalent, has been speeding up and retreating since the late 1990s. Interpretation of its retreat has been hindered by difficulties in measuring its ice thickness with airborne radar depth sounders. Here we employ high-resolution, helicopter-borne gravity data from 2012 to reconstruct its bed elevation within 50 km of the ocean margin using a three-dimensional inversion constrained by fjord bathymetry data offshore and a mass conservation algorithm inland.
We find the glacier trough to be asymmetric and several 100 m deeper than estimated previously in the lower part. From 1996 to 2016, the grounding line migrated at 0.6 km/yr from 700 m to 1100 m depth. Upstream, the bed drops to 1600 m over 10 km then slowly climbs to 1200 m depth in 40 km.
Jakobshavn Isbræ will continue to retreat along a retrograde slope for decades to come.
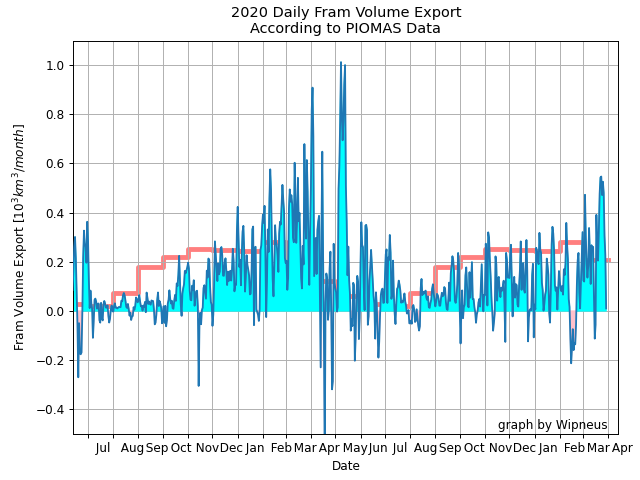
As part of his March PIOMAS gridded sea ice thickness update Wipneus also produced this graph of sea ice export from the central Arctic via the Fram Strait:
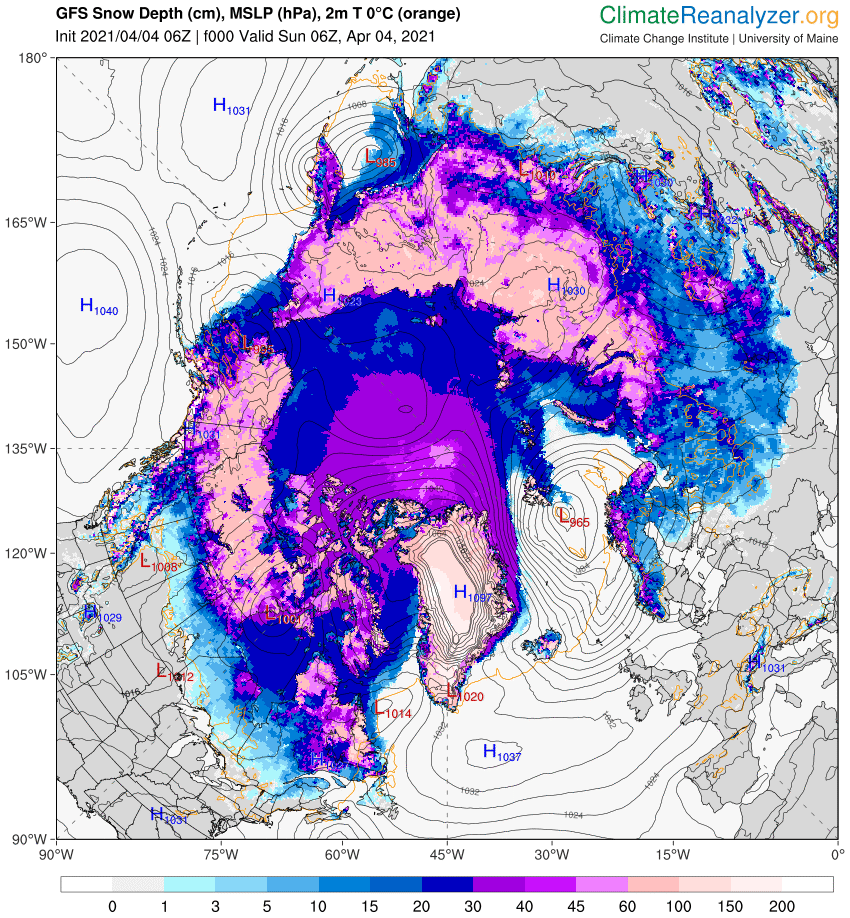
So far this winter export has been remarkably subdued, but that has now changed. A persistent dipole with high pressure over Greenland and low pressure over the Barents Sea is generating strong northerly winds in the Fram Strait, and even bringing some April snow showers to South West England:
Wondering why it's so #cold? We're still sat in Arctic air across the UK today
A change to milder #weather arrives tonight for Thursday and Friday, bringing temperatures much closer to average
Precisely how high the pressure has been over Greenland is the subject of much debate. See for example this discussion on the Arctic Sea Ice Forum about whether a new world high pressure record has just been set. Different weather forecasting models have come to very different conclusions about the mean sea level pressure of a high pressure area situated over the Greenland ice sheet, which reaches an altitude of over 3,000 metres. Here’s GFS for example, showing 1097 hPa at 06Z on April 4th:
whereas the Canadian Meteorological Centre synopsis for the same time shows a mere 1070 hPa:
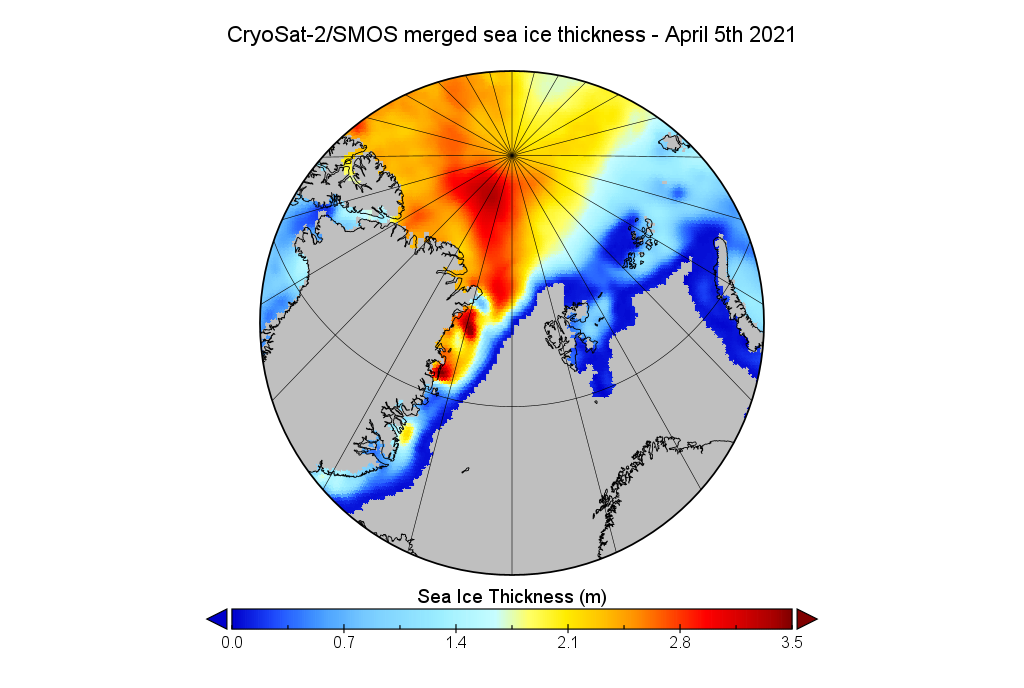
At least all the assorted models agree that the isobars are closely packed over the Fram Strait, and hence some of the thickest sea ice remaining in the Arctic is currently heading towards oblivion in the far north Atlantic Ocean:
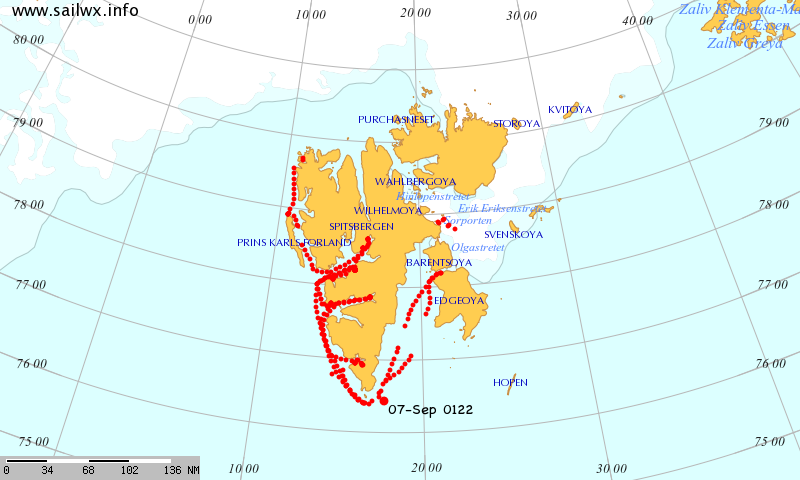
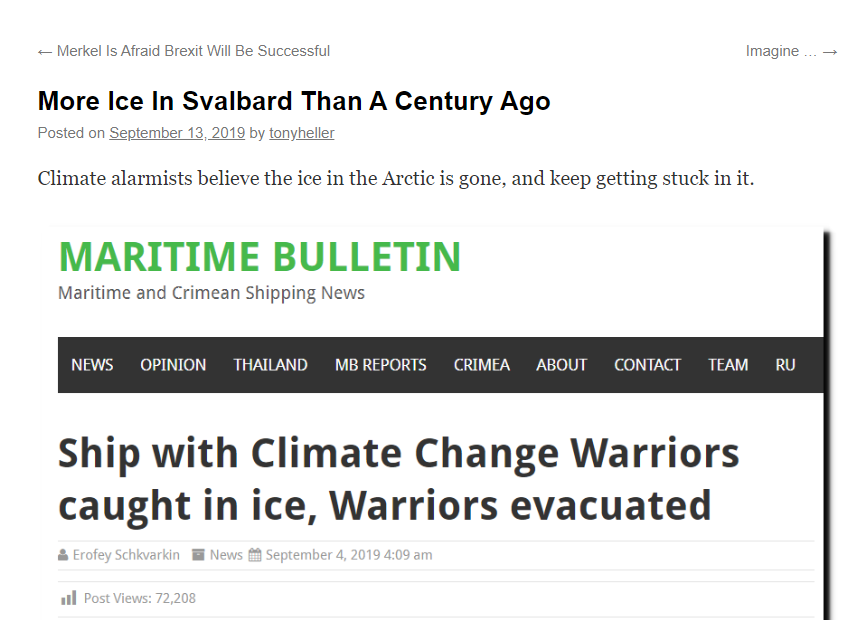
Arctic tours ship MS MALMO with 16 passengers on board got stuck in ice on Sep 3 off Longyearbyen, Svalbard Archipelago, halfway between Norway and North Pole. The ship is on Arctic tour with Climate Change documentary film team, and tourists, concerned with Climate Change and melting Arctic ice. All 16 Climate Change warriors were evacuated by helicopter in challenging conditions, all are safe. 7 crew remains on board, waiting for Coast Guard ship assistance.
Something is very wrong with Arctic ice, instead of melting as ordered by UN/IPCC, it captured the ship with Climate Change Warriors.
Not a lot of people know that despite all that purple prose Malmö has somehow managed to emerge unscathed from the clutches of the sea ice on the other side of Svalbard from Longyearbyen:
It will come as no surprise to our regular readers that the web site of our even older friend Anthony Watts has also published the self same story, also without the happy ending.
Whilst it is reasonable to assume that Paul and Anthony are not fluent in Norwegian, it seems they are also unfamiliar with Google. If they had performed the merest modicum of due diligence and employed the services of Google translate before pressing the “publish” button they would have discovered the coverage of the “massive false information” about the Malmö’s story in the Svalbard Post, published on September 5th:
Trygve Monsen and expedition leader Tore Toppe were among the 16 who were evacuated when MS Malmö got stuck in the ice on Tuesday. They respond strongly to what they call misinformation on the right-wing website document.no
Those who were on board MS Malmö have a completely different version of events.
“First, we are not Swedish. We are a group of middle aged Norwegians following the route of the Ahlmann expedition of 1931“, says Trygve Monsen. He himself has worked for the Norwegian press for a long time, particularly Aftenposten, where he has been both digital manager and correspondent in Berlin.
Together with Expedition Chief Tore Topp, Monsen arrived at the Svalbard Post on Thursday. He had tried to contact document.no many times before that, to correct the false information. They also say that they are not climate activists.
“No way. But when you are in the Arctic, and have been here many times over several years, you can’t help but notice what is happening to the environment up here”, says Topp. This is the seventh expedition he has led in the Arctic.
The evacuation of MS Malmö on Tuesday took place without significant drama. The boat was surprised by harsh ice conditions and eventually got stuck. The captain decided to ask for evacuation, for safety. The Governor came by helicopter and after a few minutes all the passengers were evacuated. The crew on the boat remained on board, and later got help from KV “Andenes” to get out of the sea ice.
In other old news the southern route through the Northwest Passage opened on August 15th this year, although with the assistance of the icebreaker CCGS Terry Fox the MS Bremen made it through a few days earlier:
[Edit – September 11th]
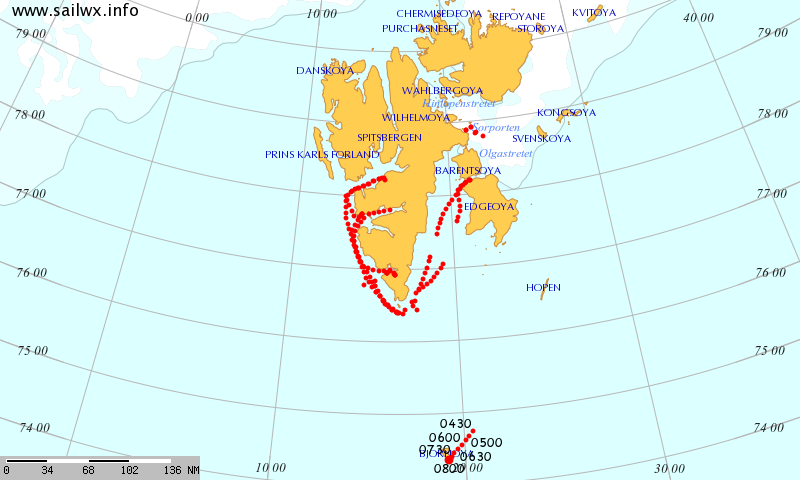
MS Malmö is now back in the range of an AIS receiver, whilst apparently en route back to Norway:
[Edit – September 12th]
I ventured onto Twitter this morning, where I discovered Matt Ridley regurgitating the same nonsense about MS Malmö, plus this news from the Norwegian Coastguard:
Kystvakten fikk melding om at MS Malmø trengte assistanse sør i Hinlopen-stredet. Da KV Andenes kom frem til området hadde MS Malmø klart å komme seg løs fra isen i åpen råk. Fartøyet ble eskortert ut av området og MS Malmø går nå for egen maskin tilbake til Longyearbyen. pic.twitter.com/ZFpa6fEmCN
Perhaps Paul, Anthony, Matt et al. would care to click @Jack’s helpfully provided “Translate Tweet” button?
I’ve also discovered that document.no eventually published a “correction” to their original story on September 9th. Perhaps Paul, Anthony, Matt et al. would care to follow suit?
Yet another greenie expedition to the Arctic to raise awareness of ‘global warming’ has been scuppered by unexpected large quantities of ice.
Furthermore James has brought my attention to the fact that my foolish numbering system is out of date. According to his reckoning MS Malmö is actually “Ship of Fools IV”. Mind you he’s also claiming that Northabout was “Ship of Fools II”, which is obviously another porkie pie of epic proportions.
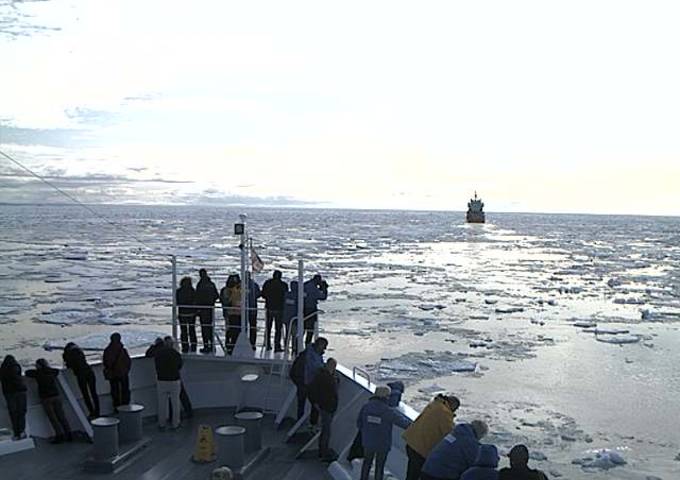
James also repeats the “stuck in ice off Longyearbyen” nonsense. For Donald, James, Paul, Anthony, Matt et al. here’s the current view of all the sea ice off Longyearbyen, via Joss Stone on Twitter:
Wow, this place is stunning. Feel very lucky to be here. Cant wait to share our experiences with you. Now, where can I get a cup of tea? #arcticpic.twitter.com/JpjbS48Ebj
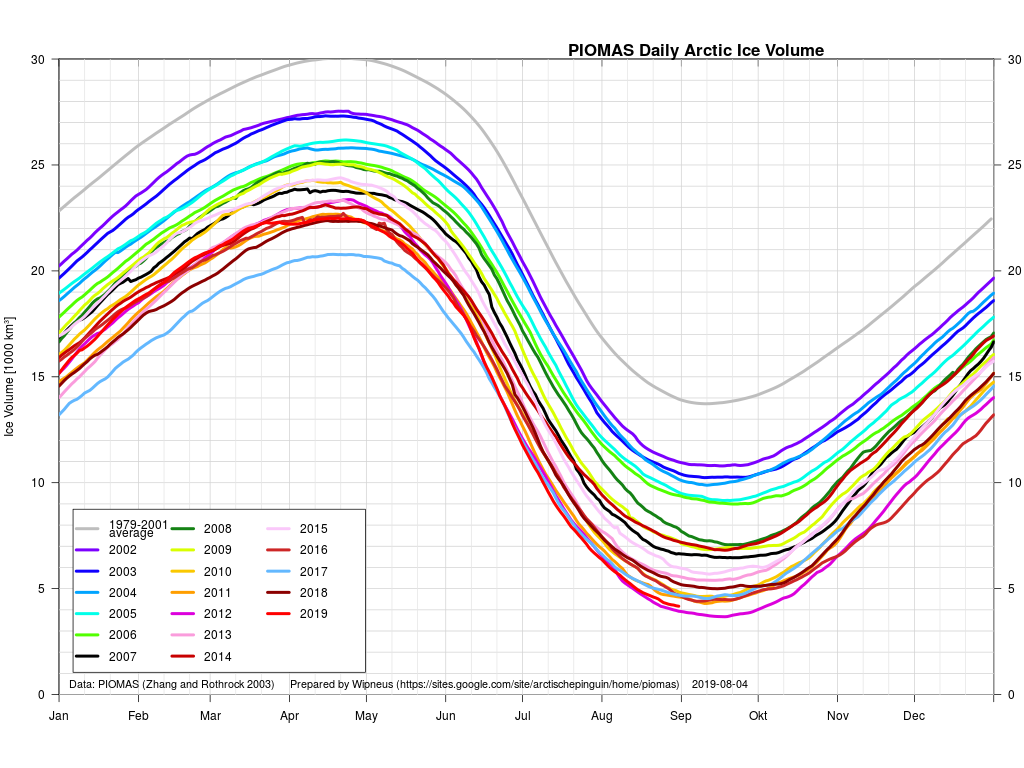
In actual fact there is of course currently less sea ice in the Arctic than in any previous year (in the satellite record) apart from 2012:
[Edit – September 13th]
Today on Twitter I’ve found myself in conversation about #MalmoGate with Ken. He doesn’t say an awful lot, but he appears to think that MS Malmö being “surprised by harsh ice conditions” is significant in some way:
What’s that supposed to prove Ken?
According to #WUWT “MS Malmo… got stuck in ice on Sep 3 off Longyearbyen”
The captain would have been very surprised to encounter such conditions, because that’s unadulterated ballcocks! #MalmoGate
One of the things that is actually significant about the 2019 melting season is quite the reverse of that. The Swedish icebreaker Oden spent a couple of weeks pootling around in the Sherard Osborn Fjord in North Greenland without getting “stuck in the vanishing Arctic ice”:
[Edit – September 14th]
What Ken, Paul Joseph, Donald, James, Paul, Anthony, Matt et al. evidently fail to comprehend is that the sea ice covering the Arctic Ocean doesn’t merely expand and contract with the seasons. It also moves. Just in case any of them do get around to doing a modicum of due diligence, take a good long look at this animation of Arctic sea ice age from the September 2015 minimum to the end of August this year:
[Edit – September 15th]
It has just come to my attention that our very old friend Tony Heller (the artist formally known as Steve Goddard) has somewhat belatedly jumped on the MalmoGate bandwagon:
This website uses cookies to improve your experience. We'll assume you're ok with this, but you can opt-out if you wish. Cookie settingsACCEPT
Privacy & Cookies Policy
Privacy Overview
This website uses cookies to improve your experience while you navigate through the website. Out of these, the cookies that are categorized as necessary are stored on your browser as they are essential for the working of basic functionalities of the website. We also use third-party cookies that help us analyze and understand how you use this website. These cookies will be stored in your browser only with your consent. You also have the option to opt-out of these cookies. But opting out of some of these cookies may affect your browsing experience.
Necessary cookies are absolutely essential for the website to function properly. This category only includes cookies that ensures basic functionalities and security features of the website. These cookies do not store any personal information.
Any cookies that may not be particularly necessary for the website to function and is used specifically to collect user personal data via analytics, ads, other embedded contents are termed as non-necessary cookies. It is mandatory to procure user consent prior to running these cookies on your website.